food analysis and quality control - · pdf file06.11.2011 · 6.2 food analysis and...
TRANSCRIPT

Food Analysis and
Quality Control
©Vedpal Yadav, Lecturer in Food Technology, Government Polytechnic, Mandi Adampur, Hisar, Haryana, India‐125052.
e‐mail‐ [email protected] Cell‐ +91‐9416589819

6.2 Food Analysis and Quality Control L T P 4 – 4
Rationale In the production of processed foods, one of the important aspects is to assure quality. This subject is introduced in the curriculum to impart knowledge and skills in the students related to various food quality parameters/systems, techniques of food analysis, food laws and standards Detailed Contents 1. Introduction (4 hrs)
1.1. Concept, objectives and need of quality, 1.2. Concept, objectives and need of quality control and 1.3. Concept, objectives and need of quality assurance
2. Principles and functions 2.1. Principles and functions of quality control, 2.2. Principles and functions of quality attributes
2.2.1. qualitative, 2.2.2. hidden and 2.2.3. sensory,
2.3. Plan and methods of quality control (10 hrs) 3. Sampling (6 hrs)
3.1. Definition of sampling, 3.2. purpose, 3.3. sampling techniques requirements and sampling procedures for
3.3.1. liquid, 3.3.2. powdered and 3.3.3. granular materials
4. Physicochemical and mechanical properties (10 hrs) 4.1. Colour, 4.2. gloss, 4.3. flavour, 4.4. consistency, 4.5. viscosity, 4.6. texture and their relationship with food quality
5. Sensory quality control (12 hrs) 5.1. Definition, 5.2. objectives, 5.3. panel selection and their training, 5.4. subjective and objective methods, 5.5. interpretation of sensory results in statistical quality control, 5.6. TQM and 5.7. TQC, 5.8. consumer preferences and acceptance
6. Food Laws and Regulations in India (8 hrs) 6.1. Objectives, requirements and benefits of food grades and standards
6.1.1. BIS, 6.1.2. AGMARK, 6.1.3. PFA, 6.1.4. FPO, 6.1.5. CAC (Codex Alimantarious Commission)
7. General Hygiene and Sanitation in food industry (4 hrs) 8. Concepts of
8.1. GMP, 8.2. HACCP (Hazard Analysis and Critical Control Point) and 8.3. ISO 9000 Series – Objectives and principles (6 hrs)
9. Layout of quality evaluation and control laboratories (4 hrs)

List of Practicals 1. Proximate analysis of marketed food products
1.1. Moisture 1.2. Ash 1.3. Crude Fat 1.4. Crude Protein 1.5. Crude Fibre 1.6. Carbohydrates
2. Detection of adulteration in food products viz. 2.1. milk, 2.2. ghee, 2.3. honey, 2.4. spices, 2.5. pulses, 2.6. oils, 2.7. sweets etc.
3. Detection of non‐permitted food additives in market food samples, 3.1. sweets and 3.2. savory products
4. Cut‐out analysis of canned food 5. Test of sensory evaluation
5.1. Hedonic scale 5.2. Duo‐trio test 5.3. Ranking difference 5.4. Triangle test
6. Detection of basic tastes and their threshold values 7. Consumer acceptability trial 8. Statistical analysis of sensory data 9. Laboratory preparation of food products and their sensory analysis 10. Determination of insecticides residue in given food sample 11. Visits to the quality control laboratories of the food industry, educational institutions and testing
centres Instructional Strategy This being one of the most important subjects, teacher should lay emphasis on developing basic understanding of various concepts and principles and procedures involved herein. Suitable tutorial exercises may be designed by the teachers, which require students visit to various industries. Students may also be exposed to various National and international standards. Visits to the relevant industry for demonstrating various operations involved in the food evaluation and quality control is a must. Experts from the industry may be invited to deliver lectures on the latest technology. Knowledge from pollution control and devices for the same may be provided to the students. Wherever relevant, students may be made aware about safety aspects. Recommended Books
1. Hand Book of Analysis of Fruits and Vegetables by S Ranganna (THM) 2. Food Analysis Theory and Practices by Pomranz and Meloan (AVI) 3. Quality Control for the Food Industry (Vol. I and II) by Kramer and Twigg (AVI) 4. Laboratory Methods of Sensory Evaluation by Larmond 5. Sensory Analysis by Piggot 6. Hand Book of Food Analysis by S.N. Mahindru 7. The Chemical Analysis of Food and Food Products by Jacobs 8. A First Course in Food Analysis by A.K. Sathe 9. Hand Book of Analysis and Quality Control for Fruit & Vegetable Products

Table of Contents 1. Introduction ........................................................................................................................................... 11
1.1. Concept, objectives and Need of .................................................................................................... 11 1.1.1. Quality .................................................................................................................................... 11 1.1.2. Quality Control........................................................................................................................ 11 1.1.3. Quality Assurance ................................................................................................................... 14
2. Principles and functions of ..................................................................................................................... 24 2.1. Quality Control,............................................................................................................................... 24 2.2. Principal and Functions of Quality Assurance ................................................................................ 24
2.2.1. What Is Quality Assurance – Goals, Functions, Benefits ........................................................ 25 2.2.2. What Makes Quality Control Important? ............................................................................... 26 2.2.3. Benefiting Businesses ............................................................................................................. 27 2.2.4. Quality Control: Monitoring the Testing Process ................................................................... 27 2.2.5. Quality Assessment ................................................................................................................ 28
2.3. Basic Methods of Quality Control ................................................................................................... 28 2.3.1. Organoleptic Evaluation ......................................................................................................... 29 2.3.2. Physical Test Methods ............................................................................................................ 31 2.3.3. Chemical analysis .................................................................................................................... 36 2.3.4. Microbiological Examination .................................................................................................. 38
3. Sampling ................................................................................................................................................. 41 3.1. Sampling Techniques ...................................................................................................................... 41 3.2. Sample ............................................................................................................................................ 41 3.3. Preparation of Samples .................................................................................................................. 41
3.3.1. Preparation of dry food samples ............................................................................................ 42 3.3.2. Preparation of moist solid foods ............................................................................................ 42 3.3.3. Preparation of semi‐solid/liquid foods ................................................................................... 42 3.3.4. Enzyme inactivation ................................................................................................................ 42
3.4. Types of Statistical Sampling .......................................................................................................... 43 3.4.1. Simple Random Sampling ....................................................................................................... 43 3.4.2. Stratified Random Sampling ................................................................................................... 43 3.4.3. Systematic Sampling ............................................................................................................... 43 3.4.4. Judgment Sampling ................................................................................................................ 43
3.5. Sampling Types by Process ............................................................................................................. 44 3.5.1. Manual Sampling .................................................................................................................... 45 3.5.2. Continuous Sampling .............................................................................................................. 45
3.6. Storage and Preservation of Samples ............................................................................................. 45 3.7. Sampling Errors ............................................................................................................................... 46
4. Physicochemical and Mechanical Properties of Food ........................................................................... 47 4.1. Sensory Vocabulary ........................................................................................................................ 47 4.2. Appearance Factors ........................................................................................................................ 48
4.2.1. Size and Shape ........................................................................................................................ 48 4.2.2. Color and Gloss ....................................................................................................................... 48 4.2.3. Measuring Texture .................................................................................................................. 50
4.3. Flavor Factors ................................................................................................................................. 53 4.3.1. Influence of Color and Texture on Flavor ............................................................................... 53
5. Evaluation of Food Quality by Sensory Evaluation ................................................................................ 53 5.1. Sensory Evaluation ......................................................................................................................... 53 5.2. Sensory Characteristics of Food ..................................................................................................... 53
5.2.1. Appearance ............................................................................................................................. 54 5.2.2. Colour ..................................................................................................................................... 54 5.2.3. Flavour .................................................................................................................................... 54 5.2.4. Odour ...................................................................................................................................... 54 5.2.5. Taste ....................................................................................................................................... 54

5.3. Conducting Sensory Tests ............................................................................................................... 55 5.3.1. Trained panel members .......................................................................................................... 55 5.3.2. Selection of panel of judges ................................................................................................... 56 5.3.3. Testing laboratory ................................................................................................................... 56 5.3.4. Preparation of samples ........................................................................................................... 57 5.3.5. Techniques of smelling and tasting ........................................................................................ 57 5.3.6. Testing time ............................................................................................................................ 57 5.3.7. Design of experiment ............................................................................................................. 57 5.3.8. Reasons for testing food quality ............................................................................................. 57 5.3.9. Evaluation Card ....................................................................................................................... 57
5.4. Types of Tests ................................................................................................................................. 58 5.4.1. Difference Tests ...................................................................................................................... 58 5.4.2. Rating Tests ............................................................................................................................. 59 5.4.3. Sensitivity Tests ...................................................................................................................... 63 5.4.4. Descriptive Flavour Profile Method ........................................................................................ 65
5.5. Limitations of sensory evaluation ................................................................................................... 66 5.6. Interpretation of Sensory Results in Statistical Quality Control ..................................................... 66
5.6.1. The quality and nature of sensory and consumer data .......................................................... 66 5.6.2. Experimental design issues ..................................................................................................... 68 5.6.3. Descriptive statistics ............................................................................................................... 68 5.6.4. Worked example of paired preference test‐ Analysis of paired preference test by binomial method. 68 5.6.5. Analysis of consumer survey data .......................................................................................... 69
6. Objective Evaluation .............................................................................................................................. 69 6.1. Advantages ..................................................................................................................................... 69 6.2. Disadvantages ................................................................................................................................. 69 6.3. Basic guidelines ............................................................................................................................... 69
6.3.1. Conduct all objective tests appropriate to the experiment for which equipment is available. 70 6.3.2. Obtain necessary testing devices. .......................................................................................... 70 6.3.3. Be meticulous about maintenance of objective equipment. ................................................. 70 6.3.4. Carefully define the samples to be used for objective testing. .............................................. 70 6.3.5. Establish operating conditions for objective testing. ............................................................. 70
6.4. Evaluation Methods ........................................................................................................................ 70 6.4.1. Chemical Methods .................................................................................................................. 70 6.4.2. Physico‐Chemical Methods .................................................................................................... 70 6.4.3. Microscopic Examination ........................................................................................................ 70 6.4.4. Physical Methods .................................................................................................................... 71 6.4.5. Instruments used for Liquids and Semisolids. ........................................................................ 72 6.4.6. Instruments used for solids .................................................................................................... 74 6.4.7. Fundamental Parameters ....................................................................................................... 75
7. Total Quality Management (TQM) ......................................................................................................... 79 7.1. TQM as a Foundation ..................................................................................................................... 79 7.2. Ten Steps to Total Quality Management (TQM) ............................................................................ 79 7.3. Principles of TQM ........................................................................................................................... 80 7.4. TQM involves .................................................................................................................................. 80 7.5. TQC and TQM ................................................................................................................................. 80
8. Food Laws and Standards ...................................................................................................................... 81 8.1. Prevention of Food Adulteration Act.............................................................................................. 81
8.1.1. Administrative hierarchy ........................................................................................................ 82 8.1.2. Powers of food inspectors ...................................................................................................... 82
8.2. Fruit Products Order ....................................................................................................................... 82 8.2.1. Guidelines for Setting Up of Unit Under Fruit Products Order ............................................... 83 8.2.2. Part 1(a) : Sanitary requirements of a factory of fruit products ............................................. 83 8.2.3. Part 1(B) : Qualifications of technical staff ............................................................................. 84 8.2.4. Minimum equipments & machinery for unit operation ......................................................... 84

8.3. Bureau of Indian Standards ............................................................................................................ 84 8.3.1. Introduction ............................................................................................................................ 84 8.3.2. Quality Standards ................................................................................................................... 85 8.3.3. Association with International Standards Bodies ................................................................... 86 8.3.4. Standard Formulation & Promotion ....................................................................................... 87 8.3.5. Laboratories ............................................................................................................................ 87 8.3.6. Product Certification Scheme ................................................................................................. 87 8.3.7. Scheme‐Foreign Manufacturers ............................................................................................. 87 8.3.8. Scheme for Indian Importers .................................................................................................. 87 8.3.9. Management System Certification ......................................................................................... 87 8.3.10. National Institute of Training for Standardization (NITS) ....................................................... 87 8.3.11. Grievance Cell ......................................................................................................................... 87 8.3.12. Rajiv Gandhi National Quality Award ..................................................................................... 87 8.3.13. Small Scale Industry Facilitation Cell ...................................................................................... 88 8.3.14. National Building Code of India, 2005 .................................................................................... 88
8.4. The AGMARK Standard ................................................................................................................... 88 8.5. Codex Alimentarius Commission (CAC) .......................................................................................... 88
9. General Principles of Food Hygiene by Codex Alimentarius Commission (CAC) ................................... 90 9.1. Section I ‐ Objectives ...................................................................................................................... 90
9.1.1. The Codex General Principles of Food Hygiene ...................................................................... 90 9.2. Section II ‐ Scope, Use and Definition ............................................................................................. 90
9.2.1. Scope ...................................................................................................................................... 91 9.2.2. Use .......................................................................................................................................... 91 9.2.3. 2.3 Definitions ......................................................................................................................... 92
9.3. Section III ‐ Primary Production ...................................................................................................... 92 9.3.1. Environmental Hygiene .......................................................................................................... 93 9.3.2. Hygienic Production of Food Sources ..................................................................................... 93 9.3.3. Handling, Storage and Transport ............................................................................................ 93 9.3.4. Cleaning, Maintenance and Personnel Hygiene At Primary Production ................................ 93
9.4. Section IV ‐ Establishment: Design and Facilities ........................................................................... 93 9.4.1. Location .................................................................................................................................. 94 9.4.2. Premises and Rooms............................................................................................................... 94 9.4.3. Equipment .............................................................................................................................. 95 9.4.4. Facilities .................................................................................................................................. 96
9.5. Section V ‐ Control of Operation .................................................................................................... 97 9.5.1. Control of Food Hazards ......................................................................................................... 97 9.5.2. Key Aspects of Hygiene Control Systems ............................................................................... 98 9.5.3. Incoming Material Requirements ........................................................................................... 99 9.5.4. Packaging ................................................................................................................................ 99 9.5.5. Water ...................................................................................................................................... 99 9.5.6. Management and Supervision .............................................................................................. 100 9.5.7. Documentation and Records ................................................................................................ 100 9.5.8. Recall Procedures ................................................................................................................. 100
9.6. Section VI ‐ Establishment: Maintenance and Sanitation ............................................................ 100 9.6.1. Maintenance and Cleaning ................................................................................................... 100 9.6.2. Cleaning Programmes ........................................................................................................... 101 9.6.3. Pest Control Systems ............................................................................................................ 101 9.6.4. Waste Management ............................................................................................................. 102 9.6.5. Monitoring Effectiveness ...................................................................................................... 102
9.7. Section VII ‐ Establishment: Personal Hygiene ............................................................................. 102 9.7.1. Health Status ........................................................................................................................ 102 9.7.2. Illness and Injuries ................................................................................................................ 103 9.7.3. Personal Cleanliness ............................................................................................................. 103 9.7.4. Personal Behaviour ............................................................................................................... 103 9.7.5. Visitors .................................................................................................................................. 103
9.8. Section VIII ‐ Transportation ......................................................................................................... 103

9.8.1. General ................................................................................................................................. 104 9.8.2. Requirements ....................................................................................................................... 104 9.8.3. Use and Maintenance ........................................................................................................... 104
9.9. Section IX ‐ Product Information and Consumer Awareness ....................................................... 104 9.9.1. Lot Identification ................................................................................................................... 105 9.9.2. Product Information ............................................................................................................. 105 9.9.3. Labelling ................................................................................................................................ 105 9.9.4. Consumer Education ............................................................................................................. 105
9.10. Section X ‐ Training ................................................................................................................... 105 9.10.1. Awareness and Responsibilities............................................................................................ 105 9.10.2. Training Programmes ........................................................................................................... 106 9.10.3. Instruction and Supervision .................................................................................................. 106 9.10.4. Refresher Training ................................................................................................................ 106
10. Hazard Analysis and Critical Control Point (HACCP) ......................................................................... 106 10.1. Introduction .............................................................................................................................. 106 10.2. Pre‐requisite programmes ........................................................................................................ 107
10.2.1. Good Agricultural Practices .................................................................................................. 107 10.2.2. Good Manufacturing Practices ............................................................................................. 107
10.3. Basic principles of HACCP ......................................................................................................... 108 10.4. Developing a HACCP plan ......................................................................................................... 109 10.5. Application of HACCP to mycotoxin control ............................................................................. 113 10.6. Conclusions ............................................................................................................................... 116 10.7. Appendix I: Definition of terms ................................................................................................ 116 10.8. Appendix II: Tasks involved in developing HACCP system ........................................................ 117 10.9. Appendix III: Example of Form ‐ Description and identified use of product ............................ 118 10.10. Appendix IV: An example of decision tree to identify CCPs ..................................................... 118 10.11. Appendix V: An Example of a HACCP Worksheet ..................................................................... 120
11. International Organization for Standardization (ISO) ....................................................................... 120 11.1. ISO's name ................................................................................................................................ 120 11.2. How it all started ...................................................................................................................... 121 11.3. Who makes up ISO? .................................................................................................................. 121 11.4. What are standards? ................................................................................................................ 121 11.5. Why is international standardization needed? ........................................................................ 121
11.5.1. Worldwide progress in trade liberalization .......................................................................... 122 11.5.2. Interpenetration of sectors .................................................................................................. 122 11.5.3. Worldwide communications systems ................................................................................... 122 11.5.4. Global standards for emerging technologies........................................................................ 122 11.5.5. Developing countries ............................................................................................................ 122
11.6. ISO 9000 and ISO 14000 ‐ in brief ............................................................................................. 123 11.7. Contents of ISO 9001 ................................................................................................................ 123 11.8. Summary of ISO 9001 ............................................................................................................... 124
11.8.1. ISO 22000 .............................................................................................................................. 124 12. Laboratory Designing ........................................................................................................................ 125
12.1. Key Considerations in Laboratory Design: An Analytical Approach ......................................... 125 12.2. Starting from Scratch ................................................................................................................ 126 12.3. Making Modifications ............................................................................................................... 127 12.4. Innovation, Automation Upgrade Labs .................................................................................... 128 12.5. Analytical Labs Facing Challenges ............................................................................................. 129
Index ............................................................................................................................................................. 131

TOC of Tables Table 1‐ Quality attributes for tomatoes ........................................................................................................ 12 Table 2‐ Quality Attributes ............................................................................................................................. 13 Table 3‐ Places where foods were mishandled in such a way that Food borne diseases outbreaks resulted ........................................................................................................................................................................ 14 Table 4‐ An Ingredient Specification Document ............................................................................................. 16 Table 5‐ A Food Product Formula Document ................................................................................................. 17 Table 6‐ Food Product Standards Format ....................................................................................................... 18 Table 7‐ Definitions Pertaining to Quality ...................................................................................................... 24 Table 8‐ Glossary of Sampling Terms.............................................................................................................. 44 Table 9‐ Colours' Specifications ...................................................................................................................... 50 Table 10‐ Sensory and consumer data: relative differences in nature. ......................................................... 67 Table 11‐ Glossary of Food Texture Testing Terminology .............................................................................. 75 Table 12‐ Instruments Used in Texture Analysis ............................................................................................ 76 Table 13‐ Instruments in Food Analysis .......................................................................................................... 77 Table 14‐ Category‐wise area requirement, annual production limit and licence fee for one terms or part thereof (Ref. Clause 5(2) and part I(B) of the Second Schedule of Fruit Products Order, 1955 .................... 83 Table 15‐ Minimum equipments & machinery for unit operation ................................................................. 84

Table of Pictures
Picture 1‐ Electrical thermometer with digital display and two sensors for measuring air temperature (left) and the temperature of meat, liquids, etc. (right). ........................................................................................ 32 Picture 2‐ Electronic psychrometer (hygrometer) and sensor (right) for direct measurement of the relative air humidity..................................................................................................................................................... 34 Picture 3‐ Mechanical instrument to prove airtight closure of cans. ............................................................. 36 Picture 4‐ Portable electric pH‐meter with sensor (glass electrode). The glass electrode is protected by a removable cover of flexible synthetic material in order to avoid breakage and keep the diaphragm of the sensor humid. ................................................................................................................................................. 38 Picture 5‐ Trigger and sterile cellotape for microbiological sampling of the meat surface. .......................... 39 Picture 6‐ Culture medium with various fields after incubation of different samples taken using the technique shown in Picture 5. ........................................................................................................................ 39 Picture 7‐ Sampling microbial contamination on a defined surface area marked by sterile template with sterile swabs. .................................................................................................................................................. 40 Picture 8‐ Transfer of the sample taken with swab on to the surface of the culture medium. ..................... 40 Picture 9‐ Bacterial colonies grown from one cell each on the culture medium after the incubation period. ........................................................................................................................................................................ 40 Picture 10‐ Universal Texture Analyser .......................................................................................................... 51 Picture 11‐Specimen Evaluation Card of Paired Comparision Test ................................................................ 58 Picture 12‐ Specimen Evaluation Card of Duo‐ Trio Test ............................................................................... 59 Picture 13‐ Specimen Evaluation Card of Triangle Test .................................................................................. 59 Picture 14‐ Specimen Evaluation Card of Ranking Test .................................................................................. 60 Picture 15‐ Specimen Evaluation Card of Single Sample (Monadic) Test ....................................................... 60 Picture 16‐ Specimen Evaluation Card of Two Sample Difference Test ......................................................... 61 Picture 17‐ Specimen Evaluation Card of Multiple Sample Difference Test .................................................. 61 Picture 18‐ Specimen Evaluation Card of Hedonic Rating Test ...................................................................... 62 Picture 19‐ Specimen Evaluation Card of Numerical Scoring Test ................................................................. 63 Picture 20‐ Specimen Evaluation Card of Composite Scoring Test ................................................................ 63 Picture 21‐ Specimen Evaluation Card of Sensitivity Threshold Test ............................................................. 64 Picture 22‐ Specimen Evaluation Card of Descriptive Flavour Profile ............................................................ 65 Picture 23‐ Application of Sensory Test to Food Industry Problems .............................................................. 65 Picture 24‐ Number of Panel Members and Samples Required for Sensory Tests ........................................ 66 Picture 25‐ Types of Resistance to Force ........................................................................................................ 74 Picture 26‐ An example of decision tree to identify CCPs ............................................................................ 119

Table of Figures Figure 1‐ Basic Principal of a Penetrometer ................................................................................................... 13 Figure 2‐ Quality in Food Business.................................................................................................................. 15 Figure 3‐ Manufacturing Procedure for Use by Production and Quality Control Personnel ......................... 19 Figure 4‐ Critical Control Points from a Fresh Cucumber Process .................................................................. 20 Figure 5‐ Sensory and Consumer Data ........................................................................................................... 67 Figure 6‐ Commonly Used Standards in Food Industry .................................................................................. 85 Figure 7‐ Typical Sample Flow for Analysis ................................................................................................... 127 Figure 8‐ Sample Outlay Plans for Food Laboratory ..................................................................................... 129

©Vedpal Yadav, Lecturer in Food Technology, Government Polytechnic, Mandi Adampur, Hisar, Haryana, India‐125052. e‐mail‐ [email protected] +91‐9416589819 Page 11 of 134
1. Introduction
1.1. Concept, objectives and Need of
1.1.1. Quality
It is the combination of attributes or characteristics of a product that have significance in determining the degree of acceptability of the product to a user (USDA Marketing Workshop Report, 1951).
Quality can be defined as a measure of purity, strength, flavor, color, size, workmanship, and condition, and or any other distinctive attribute or characteristic of the product (Gould and Gould, 1988).
Quality must be defined in terms of some standard/specification, or it means very little.
Quality = finest product available. Conformance to design/expectations.
Quality is the degree of excellence and uniformity of a food as measured by various factors/attributes/ characteristics against a standard.
People go through a process of inspection to assure that the "Quality" of what they are purchasing meets their definition of quality (measures up to their standards). Quality monitoring is imperative in present times. This cardinal principle is universally accepted because it enables the producer and or seller to realize appropriate price of his produce or merchandise as the case be. The buyer or consumer gets the satisfaction for having paid the correct competitive price for the similar quality. Any produce released for sale must conform to statutory standards. Counting the number of commodities brought under these statutory controls is difficult if not impossible. Consequently there is an absolute need of food analysts at operative and supervisory‐level, food manufacturers and their processing technologists, advocates and judges handling court cases about quality disputes, students of analytical chemistry and food technology. Their need is not only a precise and concise methodology but also detailed information about the scope of the tests. Legal standards of the factors under test, differences of results due to factors human as well as operational and interpretation of result. Countries where food is abundant, people choose foods based on a number of factors which can in sum be thought of as "quality." Quality has been defined as degree of excellence and includes such things as taste, appearance, and nutritional content. We might also say that quality is the composite of characteristics that have significance and make for acceptability. Acceptability, however, can be highly subjective. Quality and price need not go together, but food manufacturers know that they generally can get a higher price for or can sell a larger quantity of products with superior quality. often "value" is thought of as a composite of cost and quality. More expensive foods can be a good value if their quality is very high. When we select foods and when we eat, we use all of our physical senses, including sight, touch, smell, taste, and even hearing. The snap of a potato chip, the crackle of a breakfast cereal, and crunch of celery are textural characteristics, but we also hear them. Food quality detectable by our senses can be divided into three main categories: appearance factors, textural factors, and flavor factors.
1.1.2. Quality Control
Quality control is a process employed to ensure a certain level of quality in a product or service. It may include whatever actions a business deems necessary to provide for the control and verification of certain characteristics of a product or service. The basic goal of quality control is to ensure that the products, services, or processes provided meet specific requirements and are dependable, satisfactory, and fiscally sound. Essentially, quality control involves the examination of a product, service, or process for certain minimum levels of quality. The goal of a quality control team is to identify products or services that do not meet a company’s specified standards of quality. If a problem is identified, the job of a quality control team or professional may involve stopping production temporarily. Depending on the particular service or product, as well as the type of problem identified, production or implementation may not cease entirely. Quality control can cover not just products, services, and processes, but also people. Employees are an important part of any company. If a company has employees that don’t have adequate skills or training, have trouble understanding directions, or are misinformed, quality may be severely diminished. When

©Vedpal Yadav, Lecturer in Food Technology, Government Polytechnic, Mandi Adampur, Hisar, Haryana, India‐125052. e‐mail‐ [email protected] +91‐9416589819 Page 12 of 134
quality control is considered in terms of human beings, it concerns correctable issues. However, it should not be confused with human resource issues. Often, quality control is confused with quality assurance. Though the two are very similar, there are some basic differences. Quality control is concerned with the product, while quality assurance is process–oriented. Even with such a clear‐cut difference defined, identifying the differences between the two can be hard. Basically, quality control involves evaluating a product, activity, process, or service. By contrast, quality assurance is designed to make sure processes are sufficient to meet objectives. Simply put, quality assurance ensures a product or service is manufactured, implemented, created, or produced in the right way; while quality control evaluates whether or not the end result is satisfactory.
1.1.2.1. Quality Control in Food Processing Businesses
1.1.2.1.1. Introduction
Quality control (QC) is not an optional extra in food processing; neither is it something that is only done by large manufacturers. It is an essential component of any food processing business. The purposes of quality control are: To protect the customers from dangers (eg contaminated foods) and ensure that they get the weight and quality of food that they pay for. To protect the business from cheating by suppliers, damage to equipment (eg stones in raw materials) and false accusations by middlemen, customers or suppliers. To be sure that food laws operating in a country are complied with. Quality control need not be time consuming or expensive and the results of quality control tests should help save money in the long run. In general, the quality control procedures used should be as simple as possible and only give the required amount of information (too little information means the test has not done its job, too much information and management decisions may be delayed or confused). Quality control is used to predict and control the quality of processed foods. It is no use producing a food, testing it to find the quality and then trying to find a buyer for that particular batch of food. Quality control is used to predict the quality of the processed food and then control the process so that the expected quality is achieved for every batch. This means that quality specifications must be written and agreed with suppliers or sellers and control points must be identified in the process.
1.1.2.1.2. Quality specifications
The quality of foods or ingredients can be measured in different ways but one popular method is to describe 'quality attributes', see Table 1. A specification can then be written and agreed with the supplier or seller, which lists the quality attributes that are required in a food. An example of a quality specification for tomatoes intended for processing into a paste or leather is shown in Table 1‐ Quality attributes for tomatoes.
Table 1‐ Quality attributes for tomatoes
Attribute Accept Reject
Colour Orange/red More than 10% green
Size Any ‐
Shape Any ‐
Damage ‐ splitting ‐ insect ‐ mould
Less than 5% Less than 5% None
More than 5% More than 5% Any evidence of mould
Hardness Soft to oversoft More than 10% hard
A number of points arise from such a specification: • A representative sample of the food must be tested to make sure the whole batch meets the specification (for small batches it might be possible to examine every item). The size of sample needed for testing can be calculated, but this is fairly complex and usually unnecessary for a small‐scale business. • The percentage of substandard items which cause a batch to fail the test can be increased or decreased depending on how reliable the supplier is or how important the particular attribute is to the seller/manufacturer.

©Vedpal Yadav, Lecturer in Food Technology, Government Polytechnic, Mandi Adampur, Hisar, Haryana, India‐125052. e‐mail‐ [email protected] +91‐9416589819 Page 13 of 134
• Some attributes may need to be tested using equipment to avoid arguments over interpretation. In Figure 1 the hardness could be tested with a simple 'penetrometer' to define what is 'hard' and what is 'soft'.
Figure 1‐ Basic Principal of a Penetrometer
The size and shape of the tomatoes is not important because they are to be crushed to a pulp. In other examples (eg fruit for bottling) the size might be important. The ripeness and flavour of the tomatoes (assessed by colour and hardness) and damage caused by poor storage and handling are very important and the specification concentrates on these. Each specification takes account of the intended use of the products and the likely important faults that could be expected.
Table 2‐ Quality Attributes
Quality Attribute Example
Quantitative 6
Hidden
Harmful Substances Aflatoxin in groundnuts
Microbiological Number of bacteria in a food
Nutritive value Vitamin content of a food
Additives Artificial flavours, thickeners, etc.
Sensory
Colour Ripeness of fruit
Size, shape (appearance) Size of chopped food, particle size of flour
Thickness or texture Juice consistency, toughness of meat
Taste Saltiness, sweetness, sourness and bitterness
Flavour Characteristic flavour of tomato
1.1.2.1.3. Control points
In every food process there are particular stages which affect the quality of the final product (eg the amount of heating given to pasteurised juices affects the colour, flavour and storage life or in sausage the amount and type of grinding affects the texture of the meat). These stages are identified as control points and quality control checks are made at these points to control the process.

©Vedpal Yadav, Lecturer in Food Technology, Government Polytechnic, Mandi Adampur, Hisar, Haryana, India‐125052. e‐mail‐ [email protected] +91‐9416589819 Page 14 of 134
Manufacturers therefore need to identify the control points in their process (using outside technical assistance if necessary) and set up a specification for the operators to use. For example, in jam making the amount of pectin, fruit and sugar should be carefully controlled and weighing of ingredients is a control point (weights of each ingredient specified and each carefully weighed out). Likewise the acidity of the jam, the sugar content after boiling and the temperature of filling are each control points. The mix should be checked for correct acidity, the sugar content checked during boiling using a thermometer or refractometer and the temperature checked before filling using a thermometer. Checks at the control points can therefore be used to control the process and ensure that each batch of product has a similar quality.
1.1.3. Quality Assurance
Food manufacturers usually have two stated levels of quality for products marketed. One deals with a product's quality established as company policy to meet consumer needs and the other deals with product quality in terms of meeting governmental regulations and laws. Branded products marketed by a company are matters requiring the most careful attention by company management. It is a general rule that company policy relating to branded product quality is more rigid than that required to meet governmental regulations. Company policy statements generally include a statement demanding that all products marketed meet the laws and regulations of all federal, state and local governments. The Need: The epidemiology of food‐borne hazards has been summarized by the U.S. Centre for Disease Control Their analysis of where foods are mishandled is given in the table below. While the percentage of cases traced to food processing plants is low (6%), one factory can create widespread difficulty compared to a home or a restaurant. The outbreaks traced to foods from food processing plants are because of inadequate refrigeration as well as preparing foods in advance resulting in re‐infection after the final heat processing, inadequate heat processing and holding foods at temperatures that favor bacterial growth.
Table 3‐ Places where foods were mishandled in such a way that Food borne diseases outbreaks resulted
Place Number Percentage
Food service establishment 589 37
Homes 230 14
Food processing plants 104 6
Unknown or unspecified 692 43
Total 1615 100
Processed foods that received no heat treatment were often made up of contaminated raw ingredients. The source of contamination with salmonellae was raw ingredients. In the few cases of contamination with trichinellae (increasingly rare in the United States), the incoming pork was infested. Heat process failures were common. Processes such as smoking, often failed to kill salmonellae or trichinellae that were on or in the product. Clostridium botulinum cells multiplied and produced neurotoxins in canned or vacuum‐packed foods after their spores survived improper heat processing. Post‐processing contamination with salmonellae or trichinellae by crosscontamination from raw products to heat processed food by equipment or workers during subsequent handling was another significant source. The frequency with which certain food processing plants have produced foods that have been incriminated in food‐borne disease outbreaks and the factors that led to contamination, survival or multiplication of pathogens . Incoming raw materials (usually foods of animal origin) are revealed as hazards in the processing of meat, poultry, eggs, baked goods containing eggs, milk, fish salads and confections.
1.1.3.1. A Model Program for the Food Industry
The dictionary defines quality as an important character, a degree of excellence or a necessary attribute. A group of activities designed to assure a standard of excellence is called Quality Control. Quality or excellence in our food supply should be an important concern to all food processors. Safety and wholesomeness are the most important attributes of food quality. The lack of quality as it relates to safety and wholesomeness can result in personal injury, sick‐ness or death. Food‐borne illness is an example of sickness or even death when unsafe foods are produced and eaten.

©Vedpal Yadav, Lecturer in Food Technology, Government Polytechnic, Mandi Adampur, Hisar, Haryana, India‐125052. e‐mail‐ [email protected] +91‐9416589819 Page 15 of 134
Certain foods or food products are defined by regulations or policies called standards of identity. These standards of identity are definitions for a specific food product to avoid confusion or mislabeling of similar processed foods. Milk is a good example. The standard for skim milk is less than 1/2 percent fat, while the standard for whole milk is at least 3‐1/4 percent fat. Quality defined by regulations, policies or standards is controlled by federal and state agencies. Failure to meet the degree of excellence defined by the regulations, policies or standards of identity is illegal. The government‐controlled attributes of food are another important measure of food quality. Therefore, the first category of food quality is critical attributes and includes factors that affect safety, wholesomeness or legality. Besides the critical attribute of safety, other properties of the food product should be used to define overall quality. These other attributes are defined by industry, the processor or consumer demand. An example of this is the particle size of flour, the shape of a frankfurter or sausage or the color and flavor of salad dressing. Two other categories that classify or describe additional quality characteristics of food products are called major and minor attributes. A major attribute is determined to be necessary for the food but not essential from a safety and legal standpoint. A major attribute could be fat content of hamburger meat or the portion weight of green peas in a frozen prepared dinner. A minor attribute is wanted but not absolutely essential to the product or not easily determined. For instance, the desirable flavor properties of foods are highly subjective (dependent upon people), not easily measured and should be a minor attribute. However, flavor defects that can reduce sales should be classified in the major category.
Figure 2‐ Quality in Food Business.
The critical, major and minor attributes usually describe the key chemical, physical, and microbiological properties of a food. The manufacturing process and many known or unknown factors will affect the finished product. Therefore, a control program is the tool for the food processor to use to assure that quality targets are met. Finally, to develop a quality control program, you must define expected food quality provide a system of quality measurement, allow a means for action not reaction, help to minimize costly errors, and reduce the risk of food safety and wholesomeness defects. What is needed for a quality control program? The first step is a strong commitment from management. Quality control must have the same priority as the profit and loss statement for the business. Quality doesn't cost, it pays. Beyond commitment, management must instill quality aware‐ness throughout the organizational structure. A successful quality program needs people. It is important that the food operation personnel function as a team and openly communicate to identify problems, issues or opportunities. Once key elements of a quality control program are in place (management commitment, quality awareness, a team effort and open communication), develop and use additional tools. The basic tools of quality control are:
Ingredient Specifications
Approved Supplier List
Product Formulas
Product Standards (Specifications)
Manufacturing Procedures
Critical Control Point Identification/Sampling Program
In‐Process Analysis, Records and Reporting Packaging Specifications
Label Specifications
Cleaning and Sanitizing Program
Good Manufacturing Practices (GMP) Requirements
Recall Program
©Vedpal Yadav, Lecturer in Food Technology, Government Polytechnic, Mandi Adampur, Hisar, Haryana, India‐125052. e‐mail‐ [email protected] +91‐9416589819 Page 16 of 134
Warehousing, Shipping and Receiving Program
Laboratory Analysis
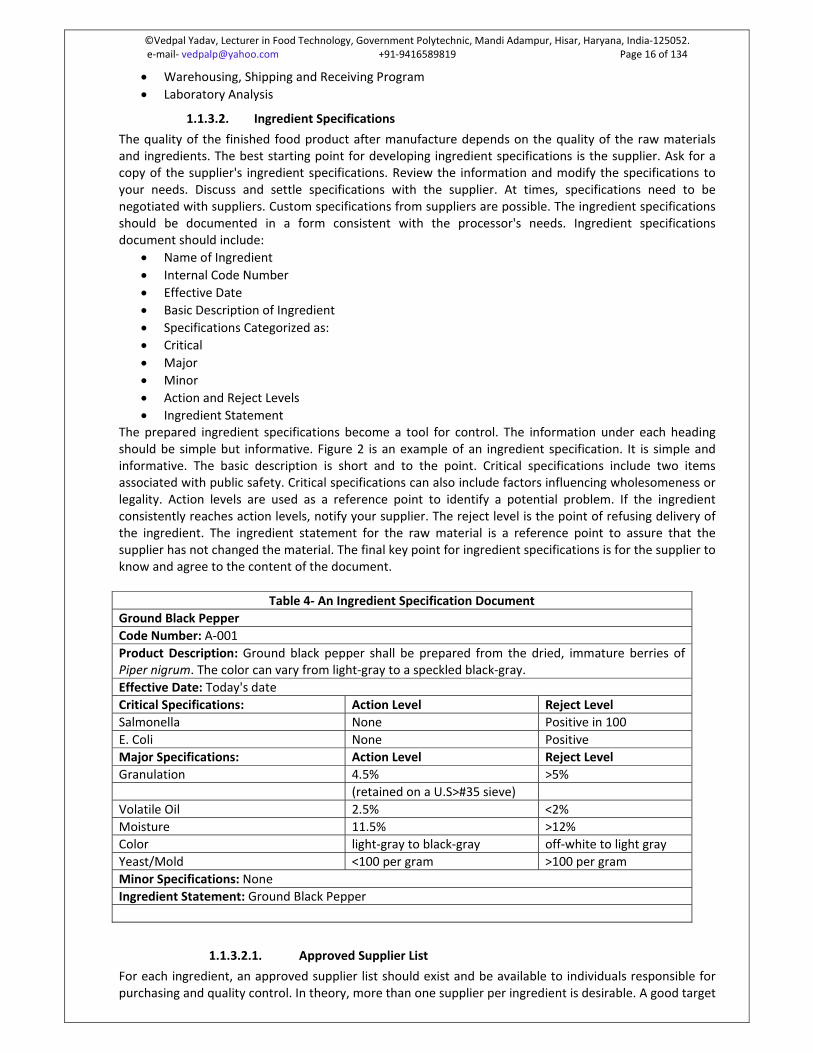
1.1.3.2. Ingredient Specifications
The quality of the finished food product after manufacture depends on the quality of the raw materials and ingredients. The best starting point for developing ingredient specifications is the supplier. Ask for a copy of the supplier's ingredient specifications. Review the information and modify the specifications to your needs. Discuss and settle specifications with the supplier. At times, specifications need to be negotiated with suppliers. Custom specifications from suppliers are possible. The ingredient specifications should be documented in a form consistent with the processor's needs. Ingredient specifications document should include:
Name of Ingredient
Internal Code Number
Effective Date
Basic Description of Ingredient
Specifications Categorized as:
Critical
Major
Minor
Action and Reject Levels
Ingredient Statement The prepared ingredient specifications become a tool for control. The information under each heading should be simple but informative. Figure 2 is an example of an ingredient specification. It is simple and informative. The basic description is short and to the point. Critical specifications include two items associated with public safety. Critical specifications can also include factors influencing wholesomeness or legality. Action levels are used as a reference point to identify a potential problem. If the ingredient consistently reaches action levels, notify your supplier. The reject level is the point of refusing delivery of the ingredient. The ingredient statement for the raw material is a reference point to assure that the supplier has not changed the material. The final key point for ingredient specifications is for the supplier to know and agree to the content of the document.
Table 4‐ An Ingredient Specification Document
Ground Black Pepper
Code Number: A‐001
Product Description: Ground black pepper shall be prepared from the dried, immature berries of Piper nigrum. The color can vary from light‐gray to a speckled black‐gray.
Effective Date: Today's date
Critical Specifications: Action Level Reject Level
Salmonella None Positive in 100
E. Coli None Positive
Major Specifications: Action Level Reject Level
Granulation 4.5% >5%
(retained on a U.S>#35 sieve)
Volatile Oil 2.5% <2%
Moisture 11.5% >12%
Color light‐gray to black‐gray off‐white to light gray
Yeast/Mold <100 per gram >100 per gram
Minor Specifications: None
Ingredient Statement: Ground Black Pepper
1.1.3.2.1. Approved Supplier List
For each ingredient, an approved supplier list should exist and be available to individuals responsible for purchasing and quality control. In theory, more than one supplier per ingredient is desirable. A good target

©Vedpal Yadav, Lecturer in Food Technology, Government Polytechnic, Mandi Adampur, Hisar, Haryana, India‐125052. e‐mail‐ [email protected] +91‐9416589819 Page 17 of 134
is three suppliers per ingredient. A supplier is an ingredient manufacturer, a broker or a distributor. When necessary, identify both the manufacturer and distributor on the approved supplier list. Approve all sources of supply only after careful evaluation and review of their performance in the product. For approving alternate ingredient sources two key questions are:
Does the ingredient meet the existing or needed specifications?
Does the new ingredient provide the same or desired finished product? At times, only one acceptable supply source may be available because of special requirements. In this case, alternate sources should be listed for emergency purposes. The emergency source of the ingredient should be one that has been tested and best approaches all specifications. The approved supplier list should contain the following information:
Ingredient Name and Internal Code
Supplier Name, Address, Key Contact and Phone Number
Trade Name of Ingredient
Supplier Code Number
1.1.3.2.2. Product Formulation/Recipe
Proprietary formulas are important. For each food product, written documentation of the formula or recipe should exist and be available for use by selected individuals. The formulas should be used daily as a means to assure consistency between batches, lots and even days of production. Manufacturing personnel need to know the recipe to assure that the product is formulated correctly. For highly confidential formulas, the production worker does not need all the details. A simplified recipe can be provided to assure that the secret stays a secret. The individual formula sheets can have a variety of formats. Key aspects of any formula document are:
Name of the product.
Internal code number.
Effective date.
Listing of the ingredients.
Listing of the ingredient code.
Percentage formula.
Batch formula.
Batch yield.
Ingredient statement. Additional information that can be part of a formula document are packaging, lot size, regulatory constraints, net weight, package count per batch, etc. Be flexible with the format since the formula may purposefully be modified and the kind of information needed may change. If nothing else, the batch size may change due to business growth or decline. Figure 3 is an example of a formula sheet.
Table 5‐ A Food Product Formula Document
Chili Without Beans
Code Number: B‐001
Effective Date: Today's Date
Ingredients Code % Formula Batch Formula (lbs.)
Beef, 75% lean A‐002 40.00 240.0
Tomato Paste, 32% T. S. A‐003 11.74 70.4
Water A‐004 40.00 240.0
Spice Premix C‐001 3.93 23.6
Corn Starch A‐005 4.33 26.0
100.0 600.0
Spice Premix C‐100
Chili Powder A‐006 31.75 7 lb. 8 oz.
Salt A‐007 21.17 5 lb.
HVP A‐008 19.05 4 lb. 8 oz.
Sugar A‐009 12.70 3 lb.
Cumin, grounded A‐010 6.35 1 lb. 8 oz.

©Vedpal Yadav, Lecturer in Food Technology, Government Polytechnic, Mandi Adampur, Hisar, Haryana, India‐125052. e‐mail‐ [email protected] +91‐9416589819 Page 18 of 134
Onion powder A‐011 5.85 1 lb. 6 oz.
Oregano, grounded A‐012 2.37 9 oz.
Garlic Powder A‐013 0.76 3 oz.
100.00 23 lbs. 10 oz.
Batch yield: 600 lbs.
Finished Product Yield: 595 lbs.
Ingredient Statement: Beef, Water, Tomato Paste, Corn Starch, Chili Powder, Salt, Hydrolyzed Vegetable Protein, Sugar, Spice, Onion Powder, Garlic Powder.
1.1.3.2.3. Product Standards
A key tool to assure quality in a finished processed food is the product standard document. Product standards define the food by physical, chemical and microbiological characteristics. Appearance, aroma, flavor and texture can and should also be considered for product standards. Physical characteristics include size, shape, dimensions, weight, volume, count per package or container, presence of fines, or any other special features which define the particular food. Moisture, fat, protein, ash, fiber and carbohydrates are the basic chemical characteristics. Additional chemical criterion such as salt, sodium, cholesterol, etc., are used to chemically define food products. Chemical standards are necessary when using nutritional labeling or making label claims for low sodium, higher fiber or other nutritional facts. Microbiological standards will be dependent upon the specific food item. First consider food poisoning organisms when developing product standards for a quality control program. Food safety is the responsibility of the processor If the food product will support the growth of a potential food poisoning organism, identify the particular organism in the critical standards category as opposed to a major or minor standard. Some typical food poisoning organisms are Salmonella, Clostridium botulinum, Staphylococcus aureus and Clostridium perfringens. Other microbiological standards such as a standard plate count (SPC), yeast or mold may be appropriate for classification as major or minor standards. For many products, especially those subjected to cooking or other thermal processes, use Coliforms and E. coli analyses to show and control post process contamination of cooked foods. Consider microorganisms that can cause food spoilage in a particular food product when establishing product standards. Yeast and mold counts are essential to control programs involving food items with low or restricted moisture levels like flour or cereals. A simple standard plate count is always a good general indicator for tracking bacterial quality and should be considered at least a minor criterion. The sensory properties of a food product are keys to the consumer acceptance. Flavor, texture, aroma and appearance are criterion that should be defined to assure that the product meets design expectations. Qualitative measures of sensory properties can be costly due to requirements for sophisticated equipment. Qualitative testing using taste panels, is an alternative to quantitative measurements. Make a sensory evaluation for flavor, odor and texture a part of a quality control program. Establish a reject level for each product standard along with acceptable methodology. Base minimum reject levels upon regulatory requirements and practical production experience. If a method of measurement is nonexistent, then the standard is nonexistent. The last element to product standards is a simple statement of ingredients as it will appear on the label.
Table 6‐ Food Product Standards Format
Gravy and Beef Tips
Code Number: B‐002
Effective Date: Today's Date
Product Code: 1743
Critical Standards Standard Method
Meat Content minimum of 35% meat (fresh basis)
Process Date
Salmonella negative in 100g #100
C. perfringens <10/g #101
Staphylococcus (coagulase positive)
<10/g #102
Major Standards

©Vedpal Yadav, Lecturer in Food Technology, Government Polytechnic, Mandi Adampur, Hisar, Haryana, India‐125052. e‐mail‐ [email protected] +91‐9416589819 Page 19 of 134
Meat chunks size 3/8" to 5/8" chunks #200
Gravy color (#3, 4 or 5) Color Chart
Coliforms <10/g #103
E. coli <10/g #104
Minor Standards
Gravy Texture a smooth consistency & free oflumps
#300
Product Flavor a mild meaty flavor & aroma #301
Standard Plate Count <25,000/g #105
Ingredient Statement: Water, beef, flour, tomato paste, corn starch, salt, HVP, spices, sugar.
Figure 3‐ Manufacturing Procedure for Use by Production and Quality Control Personnel
1.1.3.3. Manufacturing Procedures
For each product, document the method of fabrication or processing procedures to ease duplication from lot to lot, shift to shift and day to day. A simple way to approach this is a clear and concise "cookbook"

©Vedpal Yadav, Lecturer in Food Technology, Government Polytechnic, Mandi Adampur, Hisar, Haryana, India‐125052. e‐mail‐ [email protected] +91‐9416589819 Page 20 of 134
approach. Key steps in the process which can impact upon yield, quality or production efficiency should be highlighted. Examples of key process steps might be "mix for 3 minutes before adding spices" or "cook to a minimum internal temperature of 145 degrees F." Several key points to consider when identifying important processing operations are time, temperature, equipment required, order of addition for ingredients and weight.
Figure 4‐ Critical Control Points from a Fresh Cucumber Process
Manufacturing procedures also should include special instructions to the line worker or quality control personnel. An example instruction could be, "cross check" the net weight of five packages every hour. Figure 5 shows a simple manufacturing procedure to be used by production and quality control personnel. Once prepared, make manufacturing procedures or portions of the procedures available to production employees. Use the codument as an employee training tool. Even with the best procedures, employees will find a "better" way to manufacture the product. Be open minded. If the new way is better, use it; if not, explain why. The key is for the employee to follow instructions.
1.1.3.4. In‐Process Records
It is important to know what is happening with the product and process during manufacturing. In‐process record keeping is a way of obtaining the information. Both quality control and production personnel should participate in maintaining a daily manufacturing log. The specific product weight, temperature, size and shape, ingredient usage, product yield, scrap or waste, material balance and rework are examples of measurements made during the manufacturing process. Base the kinds of in‐process measurements used in each operation upon what is called Critical Control Points. A critical control point is a step in the process or in product formulation where small differences, changes or mistakes can cause the finished product to be a health hazard, illegal or costly to the business. Critical control points are identifiable (Figure 6). Some critical control points are defined by regulation when public health or product identity are of concern. Cooking temperatures, pasteurization time and temperature or allowable levels of ingredients are processing variables oftentimes defined by regulation. Critical control points may be self‐imposed because of desired label statements on the part of the processor. Net weight is one example while nutritional labeling is another. The cost of a product can be increased by simple employee mistakes. In this case, critical control points in processing simply relate to those processing steps that influence yield or inferior product.

©Vedpal Yadav, Lecturer in Food Technology, Government Polytechnic, Mandi Adampur, Hisar, Haryana, India‐125052. e‐mail‐ [email protected] +91‐9416589819 Page 21 of 134
In‐process record keeping can be a manual or automatic operation and in some cases both. Employee participation in record keeping provides an opportunity for pride in workmanship. In‐process records also are a means of making adjustments to the product or process and preventing substandard product. Turn in all in‐process records to supervisory management for review at the end of a shift or working day. The supervisory review allows an opportunity to identify problem areas and to make changes to prevent reoccurrence. In some food processing operations, like a poultry or red meat facility, these records are available to the on‐site USDA inspector.
1.1.3.5. Packaging and Labeling
A quality control program should include packaging and labeling. One of the first items that influence the consumer is the appearance of the package and the label. Two basic packages are typically necessary for food products. The primary package encloses the food and has direct contact with the product. A film, jar, bottle, carton or box are some of the common primary packages. The secondary package is used to assemble multiple packaged food items for shipment. The shipper or secondary package provides protection, reduces handling of each individual bottle or carton and is necessary for efficient movement of goods to the consumer. Some packaged foods, particularly microwaveable products, have three package components: the pouch, the carton and the shipping case. Poor packaging or labeling can create negative impressions relative to product quality. This is true for both simple and complex packages or labels. Packaging serves to protect the food product and allows shipment of multiple units. Items for packaging consideration are:
A statement from the supplier that the packaging is made of FDA and/or USDA approved materials. The package composition should be listed on the statement.
Dimensions of carton, jar, bottle or box.
Strength of the container and suitability for stacking, freezing or microwaving.
Strength of seals or fit of the lid. For heat sealed packages, the temperature requirements for sealing are critical.
Ability to restrict or allow air flow, moisture or light. Permeability, thickness, flexibility and temperature resistance are specific criteria in this category.
Graphics (illustration, picture or visual designs).
Label format and legal requirements. Packaging must be selected or designed based upon the particular food item. Fresh fruits and vegetables require packaging that provides protection while allowing air flow for proper cooling and respiration. Dairy products require packaging to inhibit light penetration and excessive oxygen because of the potential for flavor defects due to oxidation, rancidity or the absorption of foreign flavor. A final example, the tea bag must provide permeability to moisture. Package graphics, by words or pictures, define the contents and serve as point of purchase information. The law requires product name, ingredient statement and manufacturing or distribution location to be on the package. Government regulations list many requirements for packaging and even extend to specifying the size or type or printing. Pictures or other graphics are optional and serve to inform the consumer. Overall graphics must represent the contents of the container so mislabeling or misbranding does not occur. Some typical package and label defects are smears, scuffs, color variations, broken seals leaks, short fill and product infestation or spoil age. The defects can be found in both single unit packs and multi‐packs (shippers). It is to a food processor's advantage to develop packaging and label specifications along the same format as ingredient specifications. Materials of construction are particularly important where direct contact with the food is involved. Certain chemicals or foreign materials from packaging materials can contaminate the food product. The packaging material must meet FDA and/or USDA requirements. Use a reputable packaging supplier. The manufacturer of the package is the main source for package specifications. Local distributors can obtain the needed information from the manufacturer. Dimensions of the package, both inner and outer, are defined to prevent problems such as under or over‐fill, shifting within the package, spillage or breakage of the container. Lack of control can be costly for product loss, giveaway or lost sales. The strength of the container and the seals or the fit of the lid are important considerations. Failure with regard to these items can result in crushing, breakage or spillage. Most important is the potential for physical or microbiological contamination when a poor seal of improperly fitting cap is a package defect.
©Vedpal Yadav, Lecturer in Food Technology, Government Polytechnic, Mandi Adampur, Hisar, Haryana, India‐125052. e‐mail‐ [email protected] +91‐9416589819 Page 22 of 134
1.1.3.6. Good Manufacturing Practices and Sanitation
Federal regulations define specific procedures to minimize the contamination of food products by people in manufacturing, processing packaging and warehousing facilities. The regulations are called Good Manufacturing Procedures (GMPs). GMPs are an integral part of quality control. It is the respons‐ibility of food business management and ownership to know, practice, communicate and ensure that GMPs are carried out by employees. An overview of GMPs is as follows: Individuals with communicable diseases cannot work in areas where food contam‐ination is possible. This includes individuals with boils, sores or infected wounds. Food handlers must follow good personal hygiene practices.
Wear protective clothing.
Clean and sanitize hands and gloves.
No jewelry.
Use gloves (non‐absorbent) when the job requires hand covering.
Use effective hair restraints and covering.
Eat, drink or smoke only in designated areas. Train employees effectively in hygiene, sanitation and pest control. Along with GMPs, a cleaning and sanitizing program is essential. Cleaning and sanitizing should address three basic areas:
1. Exterior facility and grounds. 2. Internal facility including floors, walls, ceilings and ventilation system. 3. Equipment and all food contact areas.
A cleaning and sanitizing program prevents the build up of dirt and debris, maintains equipment in good repair, prevents growth and contamination from microorganisms and prevents the entry and harboring of insects and other pests. The quality program should: outline specific activities to be performed, any corrective measures, and schedules for cleaning and sanitizing, identify approved cleaning compounds, sanitizers and baits and define a standard. Keep and maintain proper records.
1.1.3.7. Warehousing
Warehousing involves three activities (receiving, storage and shipping) that are included in a quality control program. The receiving operation is the foundation for processing finished food products of a designated quality. Guidelines for incoming shipments are: Be sure the storage space is clean and consistent with the first‐in‐first‐out rotation principle. FIFO or first‐in‐first‐out rotation is the removal of inventory from storage in a systematic way where earlier stock items are used first. This can be accomplished by date coding the inventory according to the date of receipt. Before unloading, inspect the condition of the carrier. Measure temperature, observe and note foul odors, spills, and insects. For refrigerated and frozen products, temperature is critical. Observe the condition of the containers for damage which could be a source of contamination. Collect random samples from the shipment and analyze or evaluate the samples in relation to specifications. After unloading, inspect the condition of the carriers and notice the condition of the floors and walls. Take note of any dirt, filth or residues and evidence of previous spills. Do not accept food, ingredient or packaging shipments combined with chemicals or poisonous substances. If the shipment does not meet specifications, be prepared to reject all or part of the load. Minimize dock time. Move refrigerated or frozen items directly into storage. Date code all incoming shipments directly on the container or pallet load for stock rotation. Improper storage can adversely impact upon the quality of materials, ingredients and finished product. Storage in an orderly manner under proper conditions of temperature and humidity is essential to quality. Certain supplies or ingredients may require segregation. Rotate the inventory. If not properly managed items may ruin in storage areas. Shipping is the final step in which a food business can have direct control on product quality. Ship items on a first‐in‐first‐out basis and use the same guide‐lines in shipping that you followed in receiving.
1.1.3.8. Laboratory Analysis
The establishment of specifications and standards is meaningless without laboratory analysis or an evaluation program. Laboratory analysis is the phase in which a quality control program is implemented

©Vedpal Yadav, Lecturer in Food Technology, Government Polytechnic, Mandi Adampur, Hisar, Haryana, India‐125052. e‐mail‐ [email protected] +91‐9416589819 Page 23 of 134
after product is produced. A sampling plan, along with an analysis frequency (time schedule defining how often analyses are made), is absolutely necessary. Compile the methods of analysis used in the laboratory in a special working notebook. Micro‐biological, chemical and physical analyses of food are available in the book, official Methods of Analysis, published by the Association of official Analytical Chemists. For some analyses, very simple methods are used in the laboratory. By example, for fruits or vegetables, color measurements and physical defects are sometimes determined by comparing the product to a chart. Other methods like a protein or fat analysis are more complicated and require specialized equipment. Microbiological methods performed on product whether it is poultry, red meat, dairy, vegetable or seafood also requires special instruments and equip‐ment. Incubators and an autoclave are necessary in microbiological analyses. An incubator is used to control temperature conditions and allow bacteria to grow so groups of bacteria (colonies) can be counted. An autoclave is like a steam cooker. This piece of equipment is used to sterilize laboratory glassware and destroy bacteria, yeast or mold after an analysis. Destruction of the microorganisms is important so safe disposal is possible. Perform all laboratory analyses in a room away from the processing area. At times, a small food plant may not have a separate area. Therefore, there are three ways to obtain laboratory analysis results:
1. In‐house lab. 2. Outside independent lab. 3. Combination of in‐house and independent lab.
Appoint a qualified individual to conduct analyses, report the results and manage the job of quality control. Have laboratory tests results recorded and compared to the specifications or standards. Deviations from standards should be communicated so that additional action can be taken if necessary. Many methods exist for the laboratory analysis of food. Examples of some methods are:
Standard plate count, a microbiological method used to count the numbers of bacteria contained in a product.
Yeast and mold count, a microbiological method used to count the number of yeast and mold in food.
A chemical method (pH) which determines if a food is acidic, neutral or basic.
Moisture, a chemical method to determine total water.
Protein, a chemical method to determine the protein.
Fat, a chemical method to determine total fat.
1.1.3.9. Recall Plan
Product recall is having to bring back product from the distribution system. Every food business is susceptible to potential product recall. The public image of businesses can be destroyed during a recall if a well‐organized plan is not implemented.
1.1.3.9.1. Why would a product be recalled?
Products are recovered from distribution as a result of voluntary action by a business firm or involuntary action due to Food and Drug Administrative (FDA) action. The basic reasons for recall are best described by the FDA recall classifications: CLASS 1 ‐ As a result of a situation where there is reasonable probability that the use or exposure to a defective product will cause a serious public health hazard including death. CLASS II ‐ As a result of a situation where the use of or exposure to a defective product may cause a temporary adverse health hazard or where serious adverse public health hazard (death) is remote. CLASS III ‐ As a result of a situation where use of or exposure to a defective product will not cause a public health hazard. An example of Class I product recall would be contamination with a toxic substance (chemical or microbiological); A Class II product recall is where product is contaminated with food infection microorganisms, while a Class III example is where product does not meet a standard of identity. Because of recall potential, a food business firm must be prepared for the worst situation. A recall plan should be developed and communicated to appropriate individuals within the firm before an emergency arises. The plan should include:
An effective product coding system. Coding should be simple, yet broad enough to minimize financial loss. Date of manufacture, date code plus shift code, lot code or various combinations are possible.
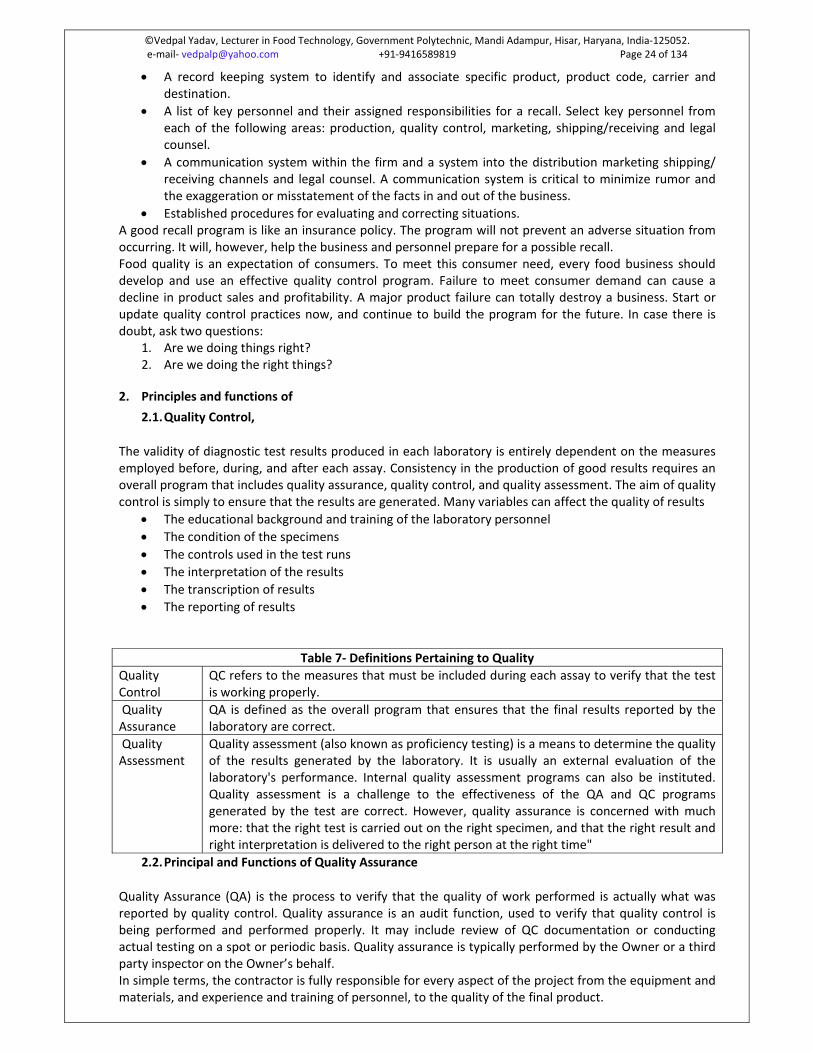
©Vedpal Yadav, Lecturer in Food Technology, Government Polytechnic, Mandi Adampur, Hisar, Haryana, India‐125052. e‐mail‐ [email protected] +91‐9416589819 Page 24 of 134
A record keeping system to identify and associate specific product, product code, carrier and destination.
A list of key personnel and their assigned responsibilities for a recall. Select key personnel from each of the following areas: production, quality control, marketing, shipping/receiving and legal counsel.
A communication system within the firm and a system into the distribution marketing shipping/ receiving channels and legal counsel. A communication system is critical to minimize rumor and the exaggeration or misstatement of the facts in and out of the business.
Established procedures for evaluating and correcting situations. A good recall program is like an insurance policy. The program will not prevent an adverse situation from occurring. It will, however, help the business and personnel prepare for a possible recall. Food quality is an expectation of consumers. To meet this consumer need, every food business should develop and use an effective quality control program. Failure to meet consumer demand can cause a decline in product sales and profitability. A major product failure can totally destroy a business. Start or update quality control practices now, and continue to build the program for the future. In case there is doubt, ask two questions:
1. Are we doing things right? 2. Are we doing the right things?
2. Principles and functions of
2.1. Quality Control,
The validity of diagnostic test results produced in each laboratory is entirely dependent on the measures employed before, during, and after each assay. Consistency in the production of good results requires an overall program that includes quality assurance, quality control, and quality assessment. The aim of quality control is simply to ensure that the results are generated. Many variables can affect the quality of results
The educational background and training of the laboratory personnel
The condition of the specimens
The controls used in the test runs
The interpretation of the results
The transcription of results
The reporting of results
2.2. Principal and Functions of Quality Assurance
Quality Assurance (QA) is the process to verify that the quality of work performed is actually what was reported by quality control. Quality assurance is an audit function, used to verify that quality control is being performed and performed properly. It may include review of QC documentation or conducting actual testing on a spot or periodic basis. Quality assurance is typically performed by the Owner or a third party inspector on the Owner’s behalf. In simple terms, the contractor is fully responsible for every aspect of the project from the equipment and materials, and experience and training of personnel, to the quality of the final product.
Table 7‐ Definitions Pertaining to Quality
Quality Control
QC refers to the measures that must be included during each assay to verify that the test is working properly.
Quality Assurance
QA is defined as the overall program that ensures that the final results reported by the laboratory are correct.
Quality Assessment
Quality assessment (also known as proficiency testing) is a means to determine the quality of the results generated by the laboratory. It is usually an external evaluation of the laboratory's performance. Internal quality assessment programs can also be instituted. Quality assessment is a challenge to the effectiveness of the QA and QC programs generated by the test are correct. However, quality assurance is concerned with much more: that the right test is carried out on the right specimen, and that the right result and right interpretation is delivered to the right person at the right time"

©Vedpal Yadav, Lecturer in Food Technology, Government Polytechnic, Mandi Adampur, Hisar, Haryana, India‐125052. e‐mail‐ [email protected] +91‐9416589819 Page 25 of 134
Quality control by the contractor is meant to provide in‐process verification that the cleaning and painting is being performing as designed to provide a quality final product. Quality assurance by the Owner is meant to verify that the quality control implemented by the contractor meets the requirements of the specification, to further assure that a quality final product will result. QC is a full‐time requirement and has responsibilities for every aspect. QA can be full or part time or performed at specific stages to verify the adequacy of the contractor’s QC. When the Owner does not perform QA or provides limited QA inspection, half of the total quality management process is lost. Both QC and QA are necessary components to verifying specification compliance and quality workmanship, but the presence of the Owner (or third party inspector) performing QA on a project does not relieve the contractor of the responsibility of performing QC. QC is more than the performance and documentation of inspections. The quality control process includes procedures for verifying that specifications, product information, and revisions are communicated to the job site; verification that the equipment and standards employed to perform QC are functional, correct and traceable; and procedures for documenting and resolving deviations, non‐conformance and corrective actions.
2.2.1. What Is Quality Assurance – Goals, Functions, Benefits
Before venturing into the goals and functions of quality control, it is important to answer the question – what is quality assurance? To put it simply, assurance of quality encompasses a series of planned steps necessary to provide businesses with confirmation of expected quality from their products or services. Today, most top‐notch companies employ the services of quality guarantee professionals to ensure that their company continues to maintain high standards for all their products and services. Quality is popularly defined as getting things right the very first time. This definition aptly describes the goal of quality guarantee too ‐ helping companies avoid any flawed products during the manufacturing or development phases and launching products of the finest quality. To fully answer the question what is quality assurance, it is important to add that quality control processes are not confined to any one department of a business. It plays a vital role throughout the phases of designing, development, manufacture, installation and servicing. Quality monitoring and assurance thus helps maintain consistent quality while generating considerable savings in cost and time.
2.2.1.1. EnerSys‐ An example of a Company
2.2.1.2. Quality Objectives
To strive for the upgradation of the technology to meet customer requirements in ever changing market
To upgrade the technology knowledge of all STPI personnel through continuous improvement training
To provide state‐of‐art data communication services as per acceptable international standards
To provide comprehensive service including project approvals, import attestation, software export certification etc., in a time bound manner
Achieving customer satisfaction through the combined efforts of planning the infrastructure and executing the projects through dedicated workforce
2.2.1.3. Customer Focus
Customers are the center of EnerSys's focus. They set the standards for performance, reliability, and service. Our Customers define the quality we are expected to deliver.
2.2.1.4. Leadership
Our goal at EnerSys is to effectively interview and hire qualified candidates into our organization and then empower them to make measurable impacts on our company's performance. Our corporate culture also believes in identifying key employees and providing to them pathways for advancement through the use of succession planning. When we do look to the outside to help build our team, our extensive interview process allows us to identify a candidates key strengths, that enables us to properly position them within our company to best utilize their education, past experience, and critical thinking abilities. At EnerSys, Quality is the responsibility of every employee. Every employee must be involved, motivated, and knowledgeable for us to remain successful.

©Vedpal Yadav, Lecturer in Food Technology, Government Polytechnic, Mandi Adampur, Hisar, Haryana, India‐125052. e‐mail‐ [email protected] +91‐9416589819 Page 26 of 134
2.2.1.5. System Approach to Management
By acknowledging that our business is comprised of a group of interrelated processes, we shall identify, understand and ultimately manage them in a systematic manner that will improve our company's results and drive us to meet all our objectives.
2.2.1.6. Involvement of People
Our associates are the experts in their relative areas, by relying on them to make data driven decisions, we not only empower our employees, but enable the corporation to benefit from their respective talents. Creating a work environment when associates are valued and contribute to the team is a vital factor to our success.
2.2.1.7. Process Approach
EnerSys is committed to managing our business as process. With this knowledge, we can focus on each step and its interaction with those downstream of it, in other words utilize the input/output model. Taking this process approach enables us to ensure that nothing is overlooked and that there is seamless execution of all activities.
2.2.1.8. Mutually Beneficial Supplier Relationships
We at EnerSys strongly believe that our suppliers are the experts in their respective fields and therefore, are best qualified to identify areas for improvement. Our close working relationships with our suppliers are crucial to the long‐term success of our organization. When evaluating potential suppliers, we not only look at the quality of the products or service provided in terms of First Pass Yield and On‐Time‐Delivery, we extend the evaluation to include competitive position, price, value analysis, technical competence and support, lead times, and customer focus. By involving our suppliers at all stages of and setting clear expectations for quality, cost and delivery, we can work to provide setting
2.2.1.9. Factual Approach to Decision Making
Data is the basis for any decision made within EnerSys, period. Without considering critical information we cannot ensure effectives choices will be made to achieve the organizations objectives
2.2.1.10. Continual Improvement
In order for any company to succeed in today's competitive marketplace, they must continue to look for areas of improvement. Through comprehensive audits (internal, external, customer, and supplier) we continually strive to identify areas when improvement may be needed. Our documented corrective and preventive action system have proven to be an effective tool in driving continuous improvement throughout all areas of EnerSys.
2.2.1.11. Areas for Quality Objectives
Continual Reduction in – cycle time of processes, time for responses to customers, rejection, downtime of the plant.
Continual Improvement in – Quality of Identification of customer requirements, quality of specs for purchased products, relations with suppliers for inventory control and just in time procurement, yields, on time delivery, designs of processes and products.
Our Environmental Objectives and targets in some of the following areas,
Areas for Environmental Objectives and Targets :
Continual reduction in – Pollution levels, resource consumption, use of hazardous and non‐biodegradable materials, wastages.
Continual improvement in – house keeping, safety levels and are committed to review them periodically.
This policy statement is displayed at various places in our organisation for the benefit of all stakeholders. Through training programs and practice, our people are made to understand the meaning of this policy statement.
2.2.2. What Makes Quality Control Important?
As market dynamics keep changing constantly, it is important to pay attention to the key business processes that are necessary to keep a company running profitably. If a company plans to implement a

©Vedpal Yadav, Lecturer in Food Technology, Government Polytechnic, Mandi Adampur, Hisar, Haryana, India‐125052. e‐mail‐ [email protected] +91‐9416589819 Page 27 of 134
self‐designed quality improvement program, there are many things to watch out for other than just what is quality assurance . Most often, such quality improvement programs only aim to generate more income instead of focusing on improving processes related to generating this income. This is exactly why it is a good idea to assign quality professionals to take care of all quality‐related issues in a company. Being experts in all departments, these professionals will be able to offer valuable advice on improving standards of quality. Perhaps the most important outcome of employing a quality checking and assurance company is that it guarantees to keep the company well ahead in the competition. Continuous reviewing and modifying of business operations form the primary functions of this vital segment of what is quality control. The quality monitoring experts then implement incremental changes to boost ongoing quality enhancement programs. Easy to implement and measure, these incremental changes involve devising methods to reduce production or operating costs and improving time efficiency of every single process.
2.2.3. Benefiting Businesses
An ongoing quality enhancement process is a crucial component to improve business operations and staff morale for almost every business. Businesses that continuously strive to improve their standards of quality and customer service obviously gain a competitive edge. Today, most successful businesses feature excellent quality control systems that are regularly reviewed for useful tips on improving business. In fact, even budding businesses new to what is quality assurance are increasingly opting to incorporate quality guarantee policies to remain competitive. Utilizing the services of a quality monitoring company can improve the quality of core business processes in the long run. Even if the staff of the company is not directly involved in the quality enhancement programs, they will soon begin to notice the positive changes happening around them. From these efforts to enhance quality, the staff understands that the management is genuinely interested in improving business operations and doing everything possible to achieve their goal. This spurs the staff to work harder, perform better and thus increase sales and revenue. QA includes such factors as:
Reporting results in a timely manner
Being sure that the results are reported to the appropriate individual
Making sure that the laboratory is functioning in the most efficient way
Including a continuing education program for laboratory workers
Evaluation of laboratory personnel to identify areas for improvement
Using the most reliable tests
Reviewing transcriptional measures
Verifying final reports
2.2.4. Quality Control: Monitoring the Testing Process
As mentioned previously, QC refers to those measures that must be included during each assay in order to verify that the test is working properly. The following items are essential elements of quality control that must be performed during every assay: Each run must include one full set of controls The controls for each test run must yield results within the limits of the manufacturer's criteria for acceptability and validity of the run. All test kits must be used before the expiration date to ensure valid results Physical parameters of the test such as incubation time and temperature must be followed to ensure proper performance Ordinarily, each test kit has a set of positive and negative control that is to be included in each test run. These controls are considered to be internal controls, while any other controls included in the run are referred to as external controls. Internal controls are essential for QC measures for each run and are intended for use only with the lot number of the corresponding test kit. External controls can be included on a run to monitor consistent performance, lot to lot variation between kits, and to serve as an indicator of assay performance on samples that are borderline reactors. External controls, or otherwise known as internal quality control (IQC) specimens are used in internal quality control programs, whereby IQC samples are included in serological assays. The IQC samples are then evaluated against Westgard rules, whereby the IQC values are plotted in a Shewhart type chart (this may be in terms of arbitrary units or IQC o.d./Cut‐off o.d.). Westgard rules define specific performance limits and are designed to detect both random and systematic errors. of the six commonly used Westgard rules, three are warning rules and the other three are mandatory rules. The latter, if broken should result in the rejection of the test run.

©Vedpal Yadav, Lecturer in Food Technology, Government Polytechnic, Mandi Adampur, Hisar, Haryana, India‐125052. e‐mail‐ [email protected] +91‐9416589819 Page 28 of 134
2.2.4.1. Warning Rules
1. The control value exceeds the mean by 2 s.d. (p<.005) 2. Two consecutive values exceed the target value on the same side of the mean by 2 s.d. This may
indicate the presence of systematic errors. 3. Four consecutive control values exceed the same limit. This again indicates the possible presence
of systematic errors and may indicate the need to perform instrument maintenance or equipment calibration.
2.2.4.2. Mandatory rules
1. The control value exceeds the target value by 3.s.d. (p<0.01:99.7% of values should lie within 3 s.d.) This indicates that the assay run is out of control
2. Where the IQC sample is tested in duplicate, the difference in SD between the duplicates should not exceed 4 SD
3. 10 consecutive values are on the same side of the mean or target value. This detects systematic errors. This may happen when a new test batch or introduced or changes in the calibration of equipment.
2.2.5. Quality Assessment
Quality assessment is a means to determine the quality of results. It is usually an external evaluation of a laboratory's performance that relies on incorporating proficiency panels of well‐characterized sera into the testing routine. External quality assessment (EQA) is now recognized as an essential component of quality assurance and is the only means to give the laboratory manager an independent means of ensuring that his routine quality control is adequate and effective. It is highly desirable for the laboratory itself to have an internal quality assessment program, whereby anonymous clinical samples are submitted to the laboratory. An internal quality assessment scheme can be used to monitor the quality of the work more frequently and accurately than EQA schemes, since EQA samples are usually received infrequently and they are usually treated differently from the routine specimens. Experience at laboratories that have an internal quality assessment scheme has generally been that internal schemes are much better at identifying quality problems in the laboratory than external schemes.
2.3. Basic Methods of Quality Control
The different criteria need different methods of quality control, such as:
organoleptic evaluation
physical test methods
chemical analysis
microbiological examination
According to the accuracy needed, the control method applied can be simple or more complicated and different auxiliary technical devices must be used.
In order to inform consumers and meat processors about the quality of meat and meat products, simple and fast control methods are best suited in many cases, although exact details on residues, toxins and special food components can only be obtained through specialized laboratories.
Basic methods for quality control must involve little or no equipment and obviously sensory evaluation will be most important. Some physical tests, however, can easily be performed using simple instruments such as thermometers, manometers, scales, etc.
By contrast, chemical and microbiological tests are more complicated. These methods not only require standard equipment but also skilled and experienced personnel to do the tests and to interpret the results.
The quality of meat and meat products is defined by the following criteria:

©Vedpal Yadav, Lecturer in Food Technology, Government Polytechnic, Mandi Adampur, Hisar, Haryana, India‐125052. e‐mail‐ [email protected] +91‐9416589819 Page 29 of 134
Palatability (typical texture and consistency, juiciness, good flavour);
Proportion of lean meat to fat;
Freshness and adequate conservability of the products;
Absence of harmful micro‐organisms or substances; and
Appropriate (preferably minimal) use of additives and meat extenders.
The following mainly refers to the basic methods of quality control used in connection with the handling and processing of meat. These control methods can easily be applied for meat products processed with simple meat preservation techniques.
2.3.1. Organoleptic Evaluation
Organoleptic evaluation consists in describing the attributes of food, in this special case of meat and meat products that can be perceived by the sense organs. The attributes to be evaluated are appearance, colour, texture and consistency, smell and taste.
2.3.1.1. Appearance
The way meat looks, either as a carcass or as boneless meat cuts, has an important impact on its objective or subjective evaluation. Grading is an objective evaluation method in this context. Traditional methods of carcass grading after slaughter involve the aspect of beef or pork sides, poultry carcasses, etc. Skilled graders are able to classify different carcasses by checking the size, the volume of muscular tissue, fat layers, etc. Although in modern grading procedures more and more technical equipment has been incorporated, visual methods are still in use. They can be of special value in most developing countries where no extremely sophisticated methods are needed.
The way the consumers or the processors check the appearance of meat is subjective. Differences will be registered in the relation of lean meat and fat including the degree of marbling or in the relation of bones and lean meat. Furthermore, unfavourable influences can be detected such as unclean meat surfaces, surfaces too wet or too dry, or unattractive blood splashes on muscle tissue.
Processed meat, on the other hand, can roughly be evaluated by its appearance according to the different raw materials of which the product is composed and where the use of some components is exaggerated (for instance too many particles of visible fat or connective tissue, etc.). Special product treatments (for instance chilling, freezing, cooking, curing, smoking, drying) or the kind and quality of portioning and packaging (casings, plastic bags, and cans) will be recognized by evaluating the appearance.
2.3.1.2. Colour
Under normal circumstances the colour of meat is in the range of red and may differ from dark red, bright red to slightly red; but also pink, grey and brown colors may occur. In many cases the colour indicates the type and stage of the treatment to which the meat has been subjected, as well as the stage of freshness.
In judging meat colour, some experience is needed to be able to distinguish between the colour which is typical for a specific treatment or which is typical for specific freshness. Furthermore, meat deriving from different species of animals may have rather different colors, as can easily be seen when comparing beef, pork and poultry meat.
The natural colour of fresh meat, except poultry meat, is dark red, caused by the muscle pigment, myoglobin. Fresh meat surfaces which have been in contact with the air for only a short period turn into a bright red colour because of the influence of the oxygen in the air. Oxygen is easily aggregated to the myoglobin and drastically changes the colour of the meat surfaces exposed to it. On the other hand, in the absence of oxygen, for example in meat cuts packaged in impermeable plastic bags, meat surfaces remain or become dark red again. The same conditions generally prevail in the interior of meat cuts which are not

©Vedpal Yadav, Lecturer in Food Technology, Government Polytechnic, Mandi Adampur, Hisar, Haryana, India‐125052. e‐mail‐ [email protected] +91‐9416589819 Page 30 of 134
reached by oxygen. Changes from dark red to bright red are therefore typical and are normal reactions of fresh meat.
Meat which is in the process of losing its freshness, however, no longer shows a bright red colour, even when intensively exposed to the air, because of the partial destruction of the red meat pigment which results in a grey, brown or greenish colour. Once these conditions occur the consumer has to decide, after carefully checking the appearance, together with testing smell and taste, whether the meat has to be discarded as a whole or whether use can be made of some parts which so far have not been altered.
Remarkable changes in the meat colour occur when fresh meat has been boiled or cooked. It loses its red colour almost entirely and turns to grey or brown. The reason for this is the destruction of the myoglobin through heat treatment. On the other hand, it has long been known that after pickling (curing) fresh meat with curing ingredients (nitrite), the meat colour remains red during longer storage periods, after ripening, drying and even after intensive heat treatment. Obviously the original meat colour has not been conserved, but a chemical reaction has taken place during the curing process transforming the unstable pigment of the fresh meat into a stable red pigment. This is the typical colour shown in sausages of all types, raw and cooked hams, corned beef, etc.
It should also be noted that cured products have a longer shelf‐life than fresh meat because of the conserving effect of the curing salt. However, cured products will also deteriorate under unfavorable conditions, cooked cured products sooner than raw cured products. Cured products with a decreasing keeping quality can be recognized when the red colour becomes pale or changes to grey or green.
2.3.1.3. Texture and consistency (tenderness and juiciness)
Meat prepared for the consumer should be tender and juicy. Meat tenderness depends on the animal species from which the meat originates. Lamb, pork and poultry meat are sufficiently tender after slaughter, but beef requires a certain period of maturation to achieve optimal eating quality.
Texture and consistency, including juiciness, are an important criterion, still neglected by many consumers, for the eating quality of meat. often consumers do not know that the eating quality of meat can be upgraded by ripening, especially in the case of beef and similar meats. There is also a great deal of consumer negligence in how to prepare meat. It should be cooked to become sufficiently tender, but cooking should not be too intense otherwise the meat becomes dry, hard and with no juiciness.
The simple way to check the consistency of foods is by chewing. Although this test seems easy, in practice it is rather complicated. Taste panelists need experience, particularly when the different samples have to be ranked, for example which sample is the toughest, the second toughest or the tenderest.
The texture is of less importance in meat products, such as cured or canned products, sausages, etc., because they are either made of comminuted meat and/or meat which has undergone heat treatment or long maturation periods and will therefore generally be tender. On the other hand, inadequate processing methods (too intensive cooking, curing, comminuting) may cause losses in the desired consistency and juiciness, and the best way to check this is by chewing.
2.3.1.4. Smell and taste (aroma and flavour)
These characteristics are related to each other to a certain extent because they have to be evaluated together for the reliable determination of a product's flavour. The smell of fresh meat should be slightly acidic, increasing in relation to the duration of the ripening period because of the formation of acids such as lactic acid. On the other hand, meat in decomposition generates an increasingly unpleasant odor owing to substances originating from the bacterial degradation of the meat proteins, such as sulphur compounds, mercaptan, etc.

©Vedpal Yadav, Lecturer in Food Technology, Government Polytechnic, Mandi Adampur, Hisar, Haryana, India‐125052. e‐mail‐ [email protected] +91‐9416589819 Page 31 of 134
The freshness of meat is generally indicated by its smell together with its appearance and colour. Sorting out deteriorated meat is mandatory from the point of view of the product's palatability. It is also important because of the fact that high bacterial contamination of meat in decomposition could be accompanied by food‐poisoning bacteria (pathogens), which have a deleterious impact on consumers' health. On the other hand, the best fresh meat can also be heavily contaminated with food‐poisoning bacteria because these micro‐organisms do not cause organoleptic alterations by destruction of meat proteins. Food poisoning can therefore only be avoided by proper hygienic meat handling. The flavour of fresh meat can also be checked by putting small samples (approx. 10 pieces of 1 cm3 each) in preheated water of 80°C for about five minutes (boiling test). The odor of the cooking broth and the taste of the warm meat samples will indicate whether the meat was fresh or in deterioration or subject to undesired influences, for instance rancidity of the meat fat, and a typical meat flavour due to the feed and the sex (boar taint) of the animal or treatment with veterinary drugs shortly before slaughter.
When processing the meat, the smell and taste of the meat products can differ a great deal owing to heat treatment and the use of salt, spices and food additives. Every meat product has its typical smell and taste, and the test person should know about it. Changes in these qualities indicate the use of improper raw materials or a deterioration of the meat product during storage.
Experience is required to become acquainted with the typical flavour (smell and taste) of foods. Only four basic taste components‐‐sweet, sour, bitter and salty‐‐will be perceived by the taste buds. These receptors are small papillae located in certain areas of the tongue. However, the overall flavour consists of smell and taste produced by the meat components and influenced and covered by spices and those compounds produced by ripening or heat treatment. Flavour test panelists should be aware of these special cases. Panelists should not smoke or eat spicy meals before starting the test and should rinse their mouth frequently with warm water during the test.
Sensory evaluation plays an important role in the examination of meat and meat products. Not only does scientific sensory evaluation with skilled panelists using special test programmes and point systems give reliable results, but useful results can also be obtained in a simple way at the consumer level. For the average consumer sensory evaluation is the only way to decide whether or not he or she should buy or eat a certain product.
In developing countries consumers do not receive sufficient information and training on this point, although it is often the only means available for quality control. Sensory evaluation is easy to understand and to perform. What is needed is a basic knowledge of the composition of foods and their typical texture, colour and flavour.
2.3.2. Physical Test Methods
Physical test methods focus either on the actual condition of meat and meat products, or on the conditions around the product, for example in storage rooms, packages, etc. Equipment will be needed for all these tests which is easily applicable and resistant to utilization under the conditions of practical meat handling and processing.
2.3.2.1. Temperature
Storage of meat and meat products requires low temperatures to make sure that the growth of micro‐organisms will be retarded (chilling between‐1 to +4°C) or inhibited (freezing preferably in the range of ‐18 to ‐30°C).
Cooking of meat requires high temperatures (starting from a temperature of about 55°C needed for denaturation, but generally higher temperatures are applied, up to 100°C).
Canning of meat requires temperatures above 100°C, and for sterilized products where all micro‐organisms are inactivated, at least 121°C.

©Vedpal Yadav, Lecturer in Food Technology, Government Polytechnic, Mandi Adampur, Hisar, Haryana, India‐125052. e‐mail‐ [email protected] +91‐9416589819 Page 32 of 134
These examples demonstrate the importance of different temperatures for different purposes and the necessity of exact temperature measurements using thermometers or temperature recorders.
Glass thermometers should not be used in direct contact with meat because they may break, leaving undesired fragments in the meat, but they are useful when permanently fixed to walls of chillers or production rooms or to cooking equipment or autoclaves for easy checking of the relevant temperatures.
Mechanical bimetal‐thermometers, utilizing the extension or contraction of a bimetal spiral under various temperatures, are not very accurate and not sufficiently shock‐resistant for practical work in meat industries. Nevertheless, they are widely used and can serve for rough estimates.
Electrical thermometers (Picture 1), consisting of a sensor and a battery‐powered electronic instrument, are well suited for meat industries. The sensor functions as a semiconductor. Under different temperatures, differences in the electric conductibility of the sensor are produced. The temperature which the sensor takes up by contact to the surrounding media (water, air, meat, etc.) produces a certain voltage in the electric system. This voltage is registered and displayed as a digital reading of the actual temperature on the instrument.
Picture 1‐ Electrical thermometer with digital display and two sensors for measuring air temperature (left) and the temperature of meat, liquids, etc. (right).
Advantages of modern electronic thermometers are:
no glass or other parts that can easily break;
the sensor can be easily pushed deep into the meat, as well as into frozen meat, and is also heat‐resistant under sterilization temperatures;
display of the correct temperature within seconds;
no frequent calibration necessary;
a wide range of temperatures can be covered using one instrument (the temperature range of the instruments recommended for use in meat industries should be between +140°C and ‐40°C); and
accurate temperature measurement, also in decimals.

©Vedpal Yadav, Lecturer in Food Technology, Government Polytechnic, Mandi Adampur, Hisar, Haryana, India‐125052. e‐mail‐ [email protected] +91‐9416589819 Page 33 of 134
2.3.2.2. Humidity
In some special field of meat processing and storage, air humidity is of importance.
In cutting rooms the humidity of the air should be below the level which would cause vapour condensation on the surfaces of the meat being deboned and cut. Vapour condensation may enhance bacterial growth.
Storage chillers for fresh meat require a balanced air humidity that does not cause wet surfaces on the meat with resulting accelerated bacterial growth, but on the other hand keeps evaporation losses low. The relative humidity recommended for this special purpose lies in the range of 70 percent.
Chambers for the maturation of raw hams or dry sausages of the salami type require controlled air humidity, starting from 90–95 percent and after a certain period finalizing the process at 70–75 percent relative humidity. This procedure is important for the balanced drying and ripening of the products. Suitable instruments (hygrometers) for the exact measurement of relative humidity are therefore needed.
In simple but less accurate hygrometers a hair or special synthetic fibre is connected with a pointer and, according to the contraction of the hair or fibre under dry conditions and its extension under wet conditions, the pointer indicates the actual relative humidity on an appropriate scale.
A more accurate way for humidity control is the psychrometric system. These instruments use a dry and a wet sensor to define the ambient temperature. The temperature indicated by the wet sensor will always be lower, in this case, because of evaporative cooling. The drier the air, the more intensive evaporative cooling will be. Using both temperature values (dry and wet temperature), the value of the relative humidity is determined in practical work using a table for easy calculation.
A modernized psychrometric system which uses electronic devices is available. In this case the humid sensor has not actually to be kept wet, but consists of hygroscopic material with altering electrical resistance. The relative humidity calculated from the temperatures delivered by the sensors by means of a micro‐processor is directly displayed on the instrument (Fig. 34).
2.3.2.3. Water activity (aw)
Water activity is the free water available for microbial growth in a food product. Free water is that part of the water content that can be eliminated from the product in the form of water vapour. Hence, the term “water activity” is defined as the ratio of the water vapour pressure measured in the product and the pressure of a saturated water vapour atmosphere at the same temperature. This physical definition is used in connection with a number of meat products whose keeping quality depends on their water content. Micro‐organisms need a certain degree of moisture to be able to grow on foods. The minimum moisture content necessary for microbial growth varies with the single species of micro‐organisms and can be expressed in terms of minimum water activity required.
The lowest aw‐values permitting growth of spoilage organisms are:
normal bacteria 0.91
normal yeasts 0.88
normal moulds 0.80
halophilic (NaCl‐tolerant) bacteria 0.77.
The keeping quality of dried meats and meat products without refrigeration depends on their water activity. Dried meat such as biltong, charque, etc. reaches a sufficiently low water activity to be shelf‐stable. However, water activity should decrease as fast as possible as slow drying could cause deterioration in a prolonged phase of the process with a still high water activity. The situation is more complicated in the case of products which cannot be dried too intensively such as dry sausages or raw

©Vedpal Yadav, Lecturer in Food Technology, Government Polytechnic, Mandi Adampur, Hisar, Haryana, India‐125052. e‐mail‐ [email protected] +91‐9416589819 Page 34 of 134
hams. The water activity of these products is relatively low but would still allow the growth of some undesired micro‐organisms. Under these circumstances an appropriate shelf‐life has to be ensured by the combination of several inhibiting factors, i.e. water activity, content of salt and curing ingredients and the acidity of the product.
Information on the water activity of certain products can be important for further handling, packaging and storage. Simple methods for the determination of water activity are therefore useful.
Picture 2‐ Electronic psychrometer (hygrometer) and sensor (right) for direct measurement of the
relative air humidity.
As water activity refers only to the water available for microbial growth in a product, the chemical analysis of the total moisture content is of limited value since it would also include the water bound by the proteins. The proper way to determine water activity is to measure the humidity of the remaining air in a hermetically closed small cabinet which is to a certain extent filled with the product sample. After a short time a hygroscopic equilibrium between the sample and the surrounding air will be reached. Thus, the humidity determined in the air is equivalent to the humidity available in the product and water activity can be calculated.
For the measurement of air humidity under these conditions, the same principles apply as previously described. Simple devices utilize the extension or contraction of hairs or synthetic fibers, and more sophisticated and more expensive systems use electronic devices.
The sample is placed in the bottom part of the tin and then the lid of the tin that contains the device to measure the humidity is hermetically screwed on. After two hours, hygroscopic equilibrium is reached in the can and the reading of the instrument corresponds to the actual water activity of the product, provided the test has been carried out at a temperature of exactly 25°C. If this temperature cannot be maintained, corrective calculations will be necessary.
Some examples for values of water activity (aw) of different products are shown:
Fresh Raw Meat 0.99–0.98
Cooked Ham 0.98–0.96
Frankfurter‐Type Sausages 0.98–0.93
Liver Sausage 0.97–0.95
Raw Cured Ham 0.96–0.80
Dry Sausage (Salami Type) 0.96–0.70

©Vedpal Yadav, Lecturer in Food Technology, Government Polytechnic, Mandi Adampur, Hisar, Haryana, India‐125052. e‐mail‐ [email protected] +91‐9416589819 Page 35 of 134
Dry Meat 0.75–0.50
A certain number of micro‐organisms are inhibited at aw 0.95, but other species are still able to grow. At aw 0.92 all bacteria groups are inhibited, but the growth of moulds and yeasts is still possible.
2.3.2.4. Airtight closure of cans
For shelf‐stable canned meat products two aspects are important from the microbiological standpoint. During sterilization, micro‐organisms and their spores have to be inactivated and the can must be hermetically sealed to avoid further contamination of the product after sterilization.
Invisible small perforations of the tinplate or small defects after the closure of the lid will inevitably lead to a recontamination by penetrating bacteria and after a short time spoilage of the canned product will occur. Cans should therefore be checked from time to time for these defects.
A simple method is available for this purpose. Using an air‐pump with a special device to penetrate the tinplate, the air is pumped into a closed but empty can (Fig. 35). The internal pressure built up in the can can be controlled by a manometer connected with the air pump. When dipping the inflated can into water it can easily be seen whether the can is hermetically sealed and if not where the cause for the permeability is, either in the prefabricated body (side wall and bottom) of the can or in the area of the lid seam. In the latter case the function of the can‐closing equipment in the processing plant has to be thoroughly checked.
2.3.2.5. Weight differences
The high water content of meat (approx. 70 percent) and meat products (which varies from 70 percent to 10 percent) causes weight differences owing to evaporation losses or drip losses that occur during handling, processing or storage.
Unpackaged meat and meat products are especially subject to considerable evaporation losses. During chilling of warm carcasses evaporation losses of 1 to 2 percent cannot be avoided but further evaporation losses of chilled or frozen meat should not occur when suitable storage conditions (not too dry) or suitable packaging (plastic bags, containers, boxes) are employed. However, some drip losses of packaged meat cannot be avoided.
During meat processing weight losses of meat by cooking, frying or other heat treatment can be registered and reach high values (up to 30 to 35 percent). These losses are unavoidable.
On the other hand, some meat products require weight losses by evaporation to reach their specific keeping quality, for example raw hams, dry sausages or dried meat. In this case, water activity as previously described plays an important role.
Information on weight losses in meat handling and processing is important from the economic and technological point of view. Weight losses can easily be determined using scales of different types, such as suspension scales for carcasses or batches of products and horizontal scales for packages or portions.
2.3.2.6. Salt concentration in brines
In addition to dry curing methods (dry salt and curing ingredients on the meat), brines are also used for pickling and curing the meat. Brines contain salt and in most cases also sugar and nitrite dissolved in water. With this curing process, meat is either immersed into a brine or the brine is injected into the meat with special devices. In both cases salt is a limiting factor for the sensory quality of the products; in other words salt is needed but should not exceed 2.5 to 3 percent in cooked cured products and 4.5 to 5 percent in raw cured and dried products.

©Vedpal Yadav, Lecturer in Food Technology, Government Polytechnic, Mandi Adampur, Hisar, Haryana, India‐125052. e‐mail‐ [email protected] +91‐9416589819 Page 36 of 134
To comply with these requirements, simple methods for testing salt concentration in brines are necessary. For this purpose salimeters have proved to be a useful piece of equipment. Salimeters are densimeters, the graduation showing salt concentrations. Salimeters are dipped into the brine and according to a lower or higher salt content they sink deeper or less deep into the brine. The reading of the salimeters at surface level indicates the salt concentration of the brine. The various technologies of meat curing use brines with NaCI‐concentrations in the range of 8 to 22 percent.
Picture 3‐ Mechanical instrument to prove airtight closure of cans.
2.3.2.7. Other Physical Test Methods
The physical test methods which have been described can easily be performed since the use of the technical equipment necessary is not too complicated. Other physical test methods exist too, for example, light intensity measurement, colour measurement or texture and consistency measurements of meat and meat products. These tests require rather complicated and expensive instruments and skilled technical personnel. For routine work, criteria such as light, colour, texture and consistency can be evaluated in a satisfactory way by using the corresponding sensory test methods.
2.3.3. Chemical analysis
Chemical characteristics of foods are related to the product itself and refer primarily to the content of specific substances, which are important from the point of view of keeping quality, flavour, nutritional value, etc., or which may also represent harmful residues.
The test methods necessary are generally complicated and need sophisticated equipment. However, there are also some simple and quick methods for chemical testing with sufficient accuracy which can be applied in the daily routine work such as pH‐measurement, moisture/fat/protein determination and various screening methods utilizing test paper strips.
2.3.3.1. pH‐measurement
The pH‐value or acidity of meat is important in relation to the meat's microbiological and keeping quality. In the live animal the pH‐value of the muscular tissue is about 7.0 to 7.1. Very soon after slaughter a drop in the pH‐value is observed and after several hours (24 hours or less) the pH‐value reaches its lowest level
©Vedpal Yadav, Lecturer in Food Technology, Government Polytechnic, Mandi Adampur, Hisar, Haryana, India‐125052. e‐mail‐ [email protected] +91‐9416589819 Page 37 of 134
of about 5.6 to 5.8. The increasing acidity is because of the post‐mortem formation of lactic acid from glycogen, a sugar‐like substance stored in the live animal's muscles for energy supply.
In meat lactic acid causes a decrease in pH‐value which is favorable for keeping quality (low pH inhibits bacterial growth) and for flavour (acidity is one of the components of meat flavour). However, the pH of meat is not uniform either in different carcasses or in different muscles of one carcass. Physiological oscillations do not greatly harm meat quality but abnormal reactions in meat are of great economic, hygienic and technological impact.
There are two types of abnormal reaction with regard to the pH in meat. First the pH‐value may drop too fast and second it may not reach the normal low level several hours after slaughter, but remain in the range of 7.
Both abnormalities can easily be detected by pH‐measurement in the meat. A too fast pH‐value decrease is evident, when one hour after slaughter low pH‐values in the range of 5.6 to 5.8 are already reached. This phenomenon occurs only in pigs and the meat remains pale, soft and exudative (PSE). Because of its paleness and wetness (low water‐holding capacity), this meat should not be used for ham and sausage manufacture (gives dry, tasteless products).
An insufficient decrease of the pH‐value, which occurs both in pork and beef, is of hygienic significance because of the lack of building up a certain degree of acidity and suppressing microbiological growth. This meat also remains close to pH‐value 7 after several hours, and is dark, firm and dry (DFD). It should not be used for meat and meat products which have to be stored over a longer period, such as vacuum‐packed meat cuts, dry sausages of the salami‐type or cured raw hams. However, it is well suited for cooked meat products because of its extremely good water‐holding capacity.
It can be seen from this that the pH‐measurement is of particular importance for the selection of the raw material for meat processing purposes. Hence, portable electric pH‐meters are widely distributed and utilized in the meat industry (Fig. 36).
The pH is measured on meat surfaces or in the meat itself, in the latter case by pushing the sensor into the muscle or by means of an incision using a knife. The sensor consists of a glass electrode filled with an electrolyte (solution of KC1) and a sensitive glass membrane attached at the top.
Through the membrane the difference in the hydrogen‐ion concentration, which corresponds to the acidity of the meat, is detected and digitally displayed on the attached instrument.
pH‐measurement on meat can easily be performed but the following points must be considered:
the electrode sensor must be completely filled with the electrolyte; the instrument must be adjusted daily (calibrated) using two buffer solutions with pH‐values 4 and 7; after each measurement the electrode must be cleaned using distilled water; before each measurement the temperature of the meat, meat product, etc. must be checked and the instrument adjusted accordingly.
2.3.3.2. Moisture/fat/protein determination
Information about the moisture, fat and protein content is essential for the evaluation of the quality of different meats and meat products. Determination methods have changed a great deal in this field in recent years. Revolutionary techniques were introduced using X‐rays, infra‐red radiation or microwaves in automatic equipment for quick analyses of moisture, fat and protein. These modern methods are time‐saving, the results are delivered within minutes or seconds and high numbers of samples can be tested. However, the equipment is expensive and therefore not suitable for small industries. For routine controls, where not necessarily highly accurate but reliable results on moisture, fat, protein and anorganic components (ash) are needed, cheaper and less complicated methods can be applied. A specially designed laboratory scale, together with some other devices, is required. After homogenizing and weighing the

©Vedpal Yadav, Lecturer in Food Technology, Government Polytechnic, Mandi Adampur, Hisar, Haryana, India‐125052. e‐mail‐ [email protected] +91‐9416589819 Page 38 of 134
sample, it is fast dried using an infrared beam (or a microwave oven if available). The weight difference is equivalent to the product's water (moisture) content. The fat is then dissolved using a fat‐extracting liquid and removed together with the liquid. The solvent is evaporated. The weight of the residue represents the fat content of the sample. Finally, the sample is charred in a muffle furnace and the weight of the residue is the ash content. Since the sum of the percentages of moisture, fat, ash and protein must be 100, and since the percentage of moisture, fat and ash is known, the protein content in percent is calculated as follows: 100% minus the percent of moisture, fat and ash. This method is not precise, but it is fast, provides useful results about the composition of meat and meat products and can be applied without high costs.
Picture 4‐ Portable electric pH‐meter with sensor (glass electrode). The glass electrode is protected by a removable cover of flexible synthetic material in order to avoid breakage and keep the diaphragm of
the sensor humid.
For chemical evaluations a number of screening methods are also available using different test papers. The results are indicated by changes of the colour of certain areas on the paper strips. These test papers are used for pH‐measurement, screening of the nitrite content and even for the screening of some harmful residues such as antibiotics. pH‐measurements on meat with test strips are negatively influenced by the meat pigment making the colour determination often difficult and the pH‐determination not very accurate.
2.3.4. Microbiological Examination
These control methods cannot be carried out without laboratory equipment, because they require sample preparation under sterile conditions, incubation of the samples under constant temperatures and sufficient microbiological knowledge on the part of the personnel involved to interpret the results. However, the application of microbiological methods is the only way to obtain information about the hygienic status of places, equipment and foods. It is true that unclean conditions will always indicate high microbiological contamination and one could argue that a thorough cleaning‐up rather than a further microbiological analysis would be needed in those cases. But there could also be the need of detecting the source of permanent contamination (for example through the water, movement of personnel, raw material delivered, etc.) or of food poisoning bacteria. Under these circumstances microbiological examinations can often be very helpful and solve immediate problems.
Some methods suitable for routine work should be mentioned.

©Vedpal Yadav, Lecturer in Food Technology, Government Polytechnic, Mandi Adampur, Hisar, Haryana, India‐125052. e‐mail‐ [email protected] +91‐9416589819 Page 39 of 134
2.3.4.1. Trigger methods
Microbiological culture media in special small moulds are lightly pressed against walls, equipment (knives, machines), meat surfaces or hands of personnel. The micro‐organisms adherent to these objects are absorbed by the surface of the culture media, and after adequate incubation (one to two days at 30 to 37°C), microbial colonies can be identified and counted on the media. Each one of the colonies grown during incubation corresponds to one micro‐organism which was on the object tested.
Instead of culture media a special sterile strip of cellotape together with a trigger can be used for taking samples from surfaces (Fig. 37). After that the cellotape is laid on a culture media for incubation. This procedure allows the utilization of one culture medium for the incubation of different samples at the same time (Fig. 38). However, there is one disadvantage with the trigger system. In the case of high bacterial contamination of the surfaces, tested bacterial colonies will grow very densely together and can no longer be counted.
2.3.4.2. Swab method
Surface contamination related to a certain area can be sampled using a sterile swab. After rubbing the swab gently along the surface to be tested (Fig. 39), it is suspended on the surface of a culture media. In contrast with the trigger method, bacterial contamination can be spread over the whole surface (Fig. 40) which is important in the case of high contamination. Thus the samples can always be evaluated since the single colonies are not grown together (Fig. 41). However, the method lacks some accuracy since bacteria may remain in the swab.
Picture 5‐ Trigger and sterile cellotape for microbiological sampling of the meat surface.
Picture 6‐ Culture medium with various fields after incubation of different samples taken using the
technique shown in Picture 5.

©Vedpal Yadav, Lecturer in Food Technology, Government Polytechnic, Mandi Adampur, Hisar, Haryana, India‐125052. e‐mail‐ [email protected] +91‐9416589819 Page 40 of 134
Picture 7‐ Sampling microbial contamination on a defined surface area marked by sterile template with
sterile swabs.
Picture 8‐ Transfer of the sample taken with swab on to the surface of the culture medium.
Picture 9‐ Bacterial colonies grown from one cell each on the culture medium after the incubation
period.

©Vedpal Yadav, Lecturer in Food Technology, Government Polytechnic, Mandi Adampur, Hisar, Haryana, India‐125052. e‐mail‐ [email protected] +91‐9416589819 Page 41 of 134
3. Sampling
3.1. Sampling Techniques
The value of the result of a chemical analysis on a well prepared laboratory sample will depend on how representative the sample is of the lot, batch, package or consignment of the particular food from which it was taken and on kind of chemical information required. Foodstuffs are relatively heterogeneous materials, so sampling and any subsequent separation are the greatest source of error in food analysis. The problem may be minimized by selecting either randomly or according to a plan, several samples from the lot. In sampling foods and food products, sufficient material must be taken to compensate for the variability involved. The number of individual samples to be selected may be calculated from the following expression: n = C√N , Where, n = number of individuals to be selected C = is a factor which represents the degree of accuracy desired in the sample, and N = lot size. Where the extent of variability is not known, it is advisable to select at least ten times the amount to be taken as a sample for analysis. The sample selected should be representative, and reflect all the homogeneous parts of the heterogeneous population. Generally, the errors in sampling are due to
Lack of randomness in selection.
Change in composition of product during sampling
Non‐homogeneity of food.
3.2. Sample
The Analytical Commission of Terminology of IUPAC (International Union of Pure and Applied Chemists) has proposed the definition of sample as "A portion of material taken from the consignment and selected in such a way that it possesses the essential characteristics of the bulk." An ideal sample should be identical in all its intrinsic properties with the bulk of the material from which it is taken. The sample should be large enough for all intended determination. Homogenous samples of 250 g are generally sufficient. The size of the sample varies from product or material to material and type of analysis e.g. samples of spices are often limited to 100 g and of fruits or vegetables increased to 1000g. The sample should be packed and stored in such a way that no significant change occur from the moment of sampling until the analysis is complete.
3.3. Preparation of Samples
In order to obtain precise analytical results, the laboratory sample must be made as homogeneous as possible so that, within the limits of analytical method used, the replicate analyses agree as closely as possible. The purpose of sample preparation is to mix thoroughly a large sample in the laboratory. This apparently homogenous sample must be then reduced in size and amount for subsequent analysis. The problems encountered by the analysts in the preparation of samples for analysis include
1. Preparing representative small samples from large samples, 2. Loss of plant material, 3. Removal of extraneous material from plants without removal of plant constituents, 4. Enzymatic changes before and during analysis, 5. Compositional changes during grinding, vi metal contamination during grinding, 6. Changes in unstable components, and
Special preparation problems in analysis of oilseed materials.

©Vedpal Yadav, Lecturer in Food Technology, Government Polytechnic, Mandi Adampur, Hisar, Haryana, India‐125052. e‐mail‐ [email protected] +91‐9416589819 Page 42 of 134
The sample to be prepared should be first homogenised and the method of homogenization will depend on the type of food being analyzed. A number of very ety1cient electrical mechanical devices are available to reduce the size of food particles and to mix food products thoroughly. Mincers, graters, blenders and homogenizers (for dry, moist and wet foods) and various types of powder mills or grinders are essential equipment in a food laboratory. Both the nature of food material and the analysis to be performed must be considered in the selection of instrument for grinding.
3.3.1. Preparation of dry food samples
Dry foods needs to be ground to at least coarse powder by means of a mechanical grinder and then mix thoroughly with a spoon or spatula. Bulk samples of dry or powdery foods can be reduced in size by the process known as quartering. For this spread the material on the large sheet of glazed paper, glass or clean surface of laminated bench or table. Draw a cross over the heaped material. Remove the diagonally opposite segments. Remix the remaining segments and draw a cross over the heap. Again remove two opposite segment and mix the remaining. Repeat the processed until about 250 g remains. If needed, again grind the granular, material. For grinding of dry materials, mechanical methods range from the simple pestle and mortar to elaborate and effective devices for grinding. For fine grinding of dry materials, power‐driven hammer mills are widely used. Hammer mills are used to grind such materials as cereals, oil meals and most foods, which are reasonably dry and do not contain excessively high amounts of oil or fat. Grinding of oil seeds or oil rich samples present special problems. Dried fruits should be passed through chopper three times and mixed thoroughly. If needed, initially, grinding can be done by coarse cutting blade. Sonic and supersonic vibrations are also used for dispersion of foods. During sampling, it is important to keep the chemical, physical and enzymatic degradation of lipids to a minimum.
3.3.2. Preparation of moist solid foods
Moist solid foods such as meat products are best homogenised by chopping rather than mincing. Cheese and chocolates are best grated followed by hand mixing of the, rated material. For disintegrations of moist materials various fine‐slicing devices are available. Some moist materials are disintegrated best by bowl cutters (leafy vegetables, fleshy tubers and roots) or meat mincers (fruits, roots and meat products). Chilled ball mills can be used to grind frozen materials without preliminary grinding. Grinding of frozen foods reduces undesirable chemical changes. The commercially available tissue grinders are also used for small sample of soft material. For preparation of sample of fresh fruits and vegetables, first of all it is essential to remove adhering soil or sand by washing or wiping with damp cloth. Excessive washing should be avoided to prevent leaching of soluble solids. Then, separate the fresh tissues into core, outer and inner tissue depending on the objectives of analysis. For large size fruits and vegetable cut these in four/eight equal portions containing inner to outer portion of fruits or vegetables. Remove the pits from the flesh of stone fruits and then comminute the prepared material in the blender. For canned fruits and vegetables if analysis is to be made on the composite sample, mix and comminute the entire contents. But, if analyses are to be made on solid and liquid portions separately, drain the contents on a sieve and comminute the solid matter or collect the liquid as required for analysis.
3.3.3. Preparation of semi‐solid/liquid foods
Fluid foods are best emulsified by top or bottom driven blenders. Fruit juice beverages containing insoluble matter, should be blended using high‐speed blender to get uniform sample. Pureed products such as tomato puree, ketchup, fruit pulps and strained fruits and vegetables should be thoroughly shaken before sampling. Gentle warming and mixing easily prepare oils and fats. Butter and margarine may be re‐emulsified by shaking by hand in a glass jar after warming to 35"C to melt the fat.
3.3.4. Enzyme inactivation
Enzyme naturally present may cause undesirable changes during preparation of samples for analysis. Generally, if total contents of a specified compound are determined i. e. minerals, carbohydrates, nitrogen, enzyme inactivation is not essential. But, if sugars, free and bound forms of lipids, groups of

©Vedpal Yadav, Lecturer in Food Technology, Government Polytechnic, Mandi Adampur, Hisar, Haryana, India‐125052. e‐mail‐ [email protected] +91‐9416589819 Page 43 of 134
protein are to be determined, the tissues must be killed in such a way that potentially troublesome enzymes are immediately and completely inactivated. To preserve the original state of components in living tissues, several methods of enzyme inactivation can be used. The treatment required for enzyme inactivation varies widely with the food size, consistency, composition, and the enzyme present and intended analytical determinations. Enzymes may be inactivated with steam or boiling alcohol. Fungal amylases are generally heat labile and can be inactivated at relatively low temperatures; some bacterial amylases are highly heat resistant. Extraction of chlorogenic acid from seed or dry tissues requires heating to 90‐ 1 00"C for 1 hr to inactivate polyphenolases. Some enzymes can be inactivated by inorganic compounds that cause irreversibly enzyme poisoning, by a shift in pH, or by salting out. The most common method of inactivating enzyme include treatment with 80% methanol or ethanol, ice‐cold 5‐ 10% perchloric or ti‐chloroacetic acid or a mixture of methanol‐chloroform‐ 2M formic acid (12 : 5 : 3 by volume).
3.4. Types of Statistical Sampling
The validity of the conclusions drawn from the analysis of a food depends, among other things, on the methods used in obtaining and preserving the sample. Sampling and any subsequent separations may be the greatest sources of error in food analyses. An ideal sample should be identical in all of its intrinsic properties with the bulk of the material from which it is taken. In practice, a sample is satisfactory if the properties under investigation correspond to those of the bulk material within the limits set by the nature of the test. According to Kratochvil and Taylor (1981), the major steps in sampling are
Identification of the population from which the sample is to be obtained,
Selection and obtaining of gross samples of the population, and
Reduction of each gross sample to a laboratory‐size sample suitable for analysis. It has been shown that if the analytical uncertainty is less than one‐ third of the sampling uncertainty, additional reduction of the analytical un‐certainty is of little significance. Statistical sampling approaches were reviewed by Springer and McClure (1988). Four types of sampling methods were considered:
3.4.1. Simple Random Sampling
For populations, in which all elements have an equal and independent chance of being included in a sample,
3.4.2. Stratified Random Sampling
By separating the population elements into overlapping groups (strata) and selecting a simple random sample from each strata,
3.4.3. Systematic Sampling
Drawing a I in K sample from a list of units, and
3.4.4. Judgment Sampling
Drawing samples based on the judgment an experience of the investigator. The advantages and disadvantages of the four types were discussed. The special problems encountered in sampling and sample preparation for detection and quantitation of natural toxicants in foods and feeds were reviewed by Park and Pohland (1989). Factors affecting the ability of a plan to obtain a sample that accurately represents the concentrations of natural toxins (i.e., mycotoxins and seafood toxins) are:
Nature of the analyte,
Distribution of the analyte throughout the lot,
Physical characteristics of the product,
Accessibility of the product to random representative sampling,
Sampling procedure, and
Size of sample. Sampling plans are composed of three components:
1. Sampling,

©Vedpal Yadav, Lecturer in Food Technology, Government Polytechnic, Mandi Adampur, Hisar, Haryana, India‐125052. e‐mail‐ [email protected] +91‐9416589819 Page 44 of 134
2. Sample preparation, and 3. Analysis.
Normally, sampling contributes the largest relative error whereas analysis comprises the least. Automatic, continuous stream samplers provide the most representative samples for commodities such as nuts, cottonseed, and cereal grains. Good sample preparation equipment is available for these commodities; the use of this equipment to obtain a representative test sample was described.
Table 8‐ Glossary of Sampling Terms
Term Definition
Sample A portion of a population or lot; may consist of an individual or groups of individuals.
Sub sample A portion taken from a sample; a laboratory sample may be a sub sample of a gross sample; similarly, a test portion may be a sub sample of a laboratory sample.
Gross sample Also called bulk sample, lot sample; one or more increments of material taken from a larger quantity (lot) of material for assay or record purposes.
Composite sample A sample composed of two or more increments.
Laboratory sample A sample, intended for testing or analysis, prepared from a gross sample or otherwise obtained; the laboratory sample must retain the composition of the gross sample; often reduction in particle size is necessary in the course of reducing the quantity.
Test portion Also called specimen, test specimen, test unit, aliquot; that quantity of a material of proper size for measurement of the property of interest; test portions may be taken from the gross sample directly, but often preliminary operations, such as mixing or further reduction in particle size, are necessary.
Segment A specifically demarked portion of a lot, either actual or hypothetical.
Strata Segments of a lot that may vary with respect to the property understudy.
Population A generic term denoting any finite or infinite things, objects, or events in the broadest concept; an aggregate determined by some property that distinguishes things that do and do not belong.
Lot A quantity of bulk material of similar composition whose properties are under study.
Increment An individual portion of material collected by a single operation of a sampling device, from parts of a lot separated in time or space; increments may be either tested individually or combined (composited) and tested as a unit.
Individual Conceivable constituent part of the population.
Bulk sampling Sampling of a material that does not consist of discrete, identifiable, constant units, but rather of arbitrary, irregular units.
Homogeneity The degree to which a property or substance is randomly distributed throughout a material; homogeneity depends on the size of the units under consideration; thus a mixture of two minerals may be inhomogeneous at the molecular or atomic level, but homogeneous at the particulate level.
Reduction The process of preparing one or more sub samples from a sample.
3.5. Sampling Types by Process
Samples for analysis should be large enough for all intended determinations. Homogeneous samples of 250 g (or ml) are generally sufficient. Samples of spices are often limited to 100 g, and those of fruits and vegetables increased to 1000 g. Samples should be packed and stored in such a way that no significant changes occur from the moment of sampling until the analysis is completed. The container should be identified clearly. official and legal samples must be sealed in such a. way that they cannot be opened without breaking the seal. The quality control laboratory analyzes various types of samples (Pearson 1958). Raw materials m analyzed to determine whether the delivery approximates previous deliveries or if the material from a

©Vedpal Yadav, Lecturer in Food Technology, Government Polytechnic, Mandi Adampur, Hisar, Haryana, India‐125052. e‐mail‐ [email protected] +91‐9416589819 Page 45 of 134
new supplier is up to the buying sample. Process control samples are generally analyzed by rapid in‐plant tests (e.g., refractometer, hydrometer) as a guide to processing adjustments needed to produce an acceptable and uniform product. Periodic checks of finished products show whether the food meets legal requirements, is acceptable to the consumer, and has reasonable shelf life. Suppliers of raw materials prior to delivery submit buying samples. Customers submit most complaint samples. In a competitive market, information about products being sold by other manufacturers‐ is of interest to management. The composition of competitors' samples is also valuable in developing new products. According to Kramer and Twigg (1970), factors that determine selection of a sampling procedure include
Purpose of inspection‐acceptance or rejection, evaluation of average quality, and determination of uniformity;
Nature of lot‐size, division into sublots, and loading or stacking;
Nature of test material‐its homogeneity, unit size, previous history, and cost;
Nature of test procedures‐significance, destructive or non‐ destructive assay procedures, and time and cost of analyses.
3.5.1. Manual Sampling
Samples are frequently taken manually. Apparently homogeneous materials such‐as single‐phase liquids or well‐mixed powders should be mixed thoroughly immediately before sampling. Rotating and shaking in a closed container that has a volume at least twice that of the sample can mix small quantities of powders or solutions. Mixing may also be accomplished by pouring the material several times from one container to another laboratory samples of powders or ground materials may be obtained by quartering of thoroughly mixed samples, discarding two opposite quarters, remixing the remaining material, and repeating the process until the sample is reduced to a desired size. Sample dividers that mechanically mix and divide powdered or granular materials may be purchased from several apparatus supply houses. Probes and triers generally sample granular or powdered solids. Liquids require thorough mixing before sampling. Partly or completely frozen, crystallized, or solidified fluids must be liquefied completely and mixed. If such mixing is practically unattainable, samples must be taken at various heights. Milk must be thoroughly mixed because the fat rises to the top and the composition changes on standing. On the other hand, excessive mixing of cream is inadvisable. Butter and hard cheese samples are generally taken with a stainless steel borer; soft cheeses are sampled, by cutting out a representative segment. The greatest difficulty arises in sampling large fruits and vegetables. often selection of a large number of individual units, to compensate for variation, is required.
3.5.2. Continuous Sampling
In continuous quality control operations, mechanical samplers have replaced manual samplers. There are three basic types of mechanical samplers (Johnson 1963). The riffle cutter is composed of equally spaced dividers designed to remove continuously a small fraction of the stream. Usually, a riffle divides the stream equally and the sample is passed through the same riffle or successive riffles for further proportional reduction of the sample to a quantity convenient for analysis. This device is commonly used in laboratories in cutting and quartering a larger sample. The circular (or Vezin) sampler can be used for intermittent or continuous sampling and is suitable for both wet and dry materials. The cutter appears as a truncated wedge of a circle that passes through the falling stream once each revolution. Size of the segment or cutter opening determines the size of the sample. The sample is large (5‐10% of the entire stream) and a secondary sampling is generally required. If the feed stream is relatively homogeneous, the sampler can be converted to an intermittent type engaged by a magnetic brake and timer. The most popular and least expensive sampling unit is the straight‐ line sampler, which can be operated either intermittently or continuously. In this type of sampler, the cutter moves in a straight line and at uniform speed across the entire stream.
3.6. Storage and Preservation of Samples
Prepared samples may undergo changes in composition through evaporation or absorption of moisture or by the action of enzymes or microorganisms. The components that are likely to change e.g. ascorbic acid

©Vedpal Yadav, Lecturer in Food Technology, Government Polytechnic, Mandi Adampur, Hisar, Haryana, India‐125052. e‐mail‐ [email protected] +91‐9416589819 Page 46 of 134
should be analysed immediately after preparation in fresh material. Products which are likely to undergo microbial spoilage may be preserved by using) preservatives or by freezing or by drying. Sample containing moisture can be dried as rapid and at as low a temperature possible. Spreading the sample over a wide area can facilitate drying. Generally, drying at 60"C under vacuum is recommended. If the sample contain no heat ‐sensitive or volatile compounds, heating for several minutes at 70 to 80"C may be advisable. Such heating also inactivates most enzymes. During drying, certain components are destroyed (enzymes, vitamins), other are almost invariably modified (proteins and lipids) and some flavour components are volatilized. If drying is not done carefully, ceramelization and sugar inversion in acid foods are likely to occur. Some plant materials can be stored at ‐20 to ‐30º C provided they can be cooled to low temperature within 1 h. Freezing of samples in air and moisture proof containers by rapid freezing and storage at less than ‐6.7º C prevents microbial activity but not the enzyme activity which continues to occur at temperature down to ‐40º C, although it a slower rate. Plant acid phosphatases function at ‐28º C in frozen state, so, issues or extracts for studies of phosphate metabolism can be stored in the cold after drying. Most foods are preserved best by freeze‐drying. Fresh foods, in which enzymes have not been inactivated prior to freezing, are especially susceptible enzymatic attack during and after thawing. Storage of dried products at 0 to 10º C minimizes deterioration. To minimize oxidative changes, preservation at low temperatures under nitrogen is recommended for most foods. Storage n hermetically closed containers reduce compositional changes of relatively dry foods at about 40º C. Sample rich in lipids must be chilled rapidly prior to extraction or frozen quickly for storage. Dry fat samples should be stored under nitrogen or dissolved in petroleum ether. Storage in ethyl ether is undesirable because it tends to form oxidative peroxides. Dilution with petroleum ether and flushing in a stream of pure nitrogen is a good practice for temporary protection. Addition of antioxidants (0.1‐ 0.05% of Propyl gallate or santoquin) is effective provided it does not interfere with the analytical determinations. Polyunsaturated fatty acid‐, are less damaged when stored in frozen (‐20º C) intact tissues than after they are extracted from the tissues. While taking samples stored at low temperature for analysis, either entire container should be warmed to room temperature or a portion transferred quickly to a clean, dry stoppered container to avoid change in moisture content. To reduce or eliminate microbial attack, preservatives such as sorbic acid, sodium benzoate, sodium salicylate, tyrosin, formaldehyde, mercuric chloride, toluene, or thymol are used. Selection of preservatives, however, will depend upon the nature of food, expected contamination, storage period and analysis to be performed. All prepared food samples should be rapidly transferred to dry glass or plastic containers with well‐fitted lid, clearly labeled and stored at a suitable low temperature.
3.7. Sampling Errors
Sampling errors are caused by several factors. Lack of randomness in sample selection may result from either instrumental limitations or deficiencies and from human bias. Manual methods of sampling powdered or granular materials are subject to numerous errors. Baker et al. (1967) studied the factors that bias sampling by triers. These factors include:
Particle shape‐round particles flow into the sampler compartments more readily than angular particles of similar size;
Surface adhesiveness‐an uncoated hygroscopic material flows into the sampler Compartment more readily than nonhygroseopic materials of similar shape and of either larger or smaller size; and
Differential downward movement of particles (on the basis of size) when disturbed during sampling.
Changes in composition may occur during or after sampling. Typical changes include gain or loss of water, loss of volatiles, physical inclusion of gases, reaction with container material or foreign matter in container, and damage to fruits or vegetables by mechanical injury leading to enhanced enzymatic or chemical changes. The main problem arises, however, from the nonhomogeneity of many foods. Both macroheterogeneity (among various units of a lot) and macroheterogeneity (within various parts of a unit) are common. The latter is especially important in determinations of vitamins and other minor components. For example,

©Vedpal Yadav, Lecturer in Food Technology, Government Polytechnic, Mandi Adampur, Hisar, Haryana, India‐125052. e‐mail‐ [email protected] +91‐9416589819 Page 47 of 134
nicotinic acid and thiamine are concentrated in the aleurone and scutellum tissues of the wheat kernel; epidermis cells of grapes are rich in anthocyanin pigments; and essential oils in citrus fruits are mainly in cells of the flavedo layer. But major components also are distributed unevenly. Proteins, lipids, minerals, and crude fiber are higher in the outer layers than in the endosperm of cereal grains; variations in water, sugars, and organic acids are found in various tissues of fruits and vegetables; and the uneven distribution of fat in meat makes it imperative to express some analytical values on a fat‐free basis. Most of these difficulties are overcome by fine grinding and mixing of large samples. In some instances, however, attempts to homogenize a food sample are wrought with difficulties; in others, apparently homogeneous preparations have a tendency to segregate or stratify. Failure to recognize and appraise the variations in a sample may limit or even invalidate conclusions from analytical data. To summarize, the aim of sampling is to secure a portion of the material that satisfactorily represents the whole. The more heterogeneous the material, the greater the difficulties and required efforts to obtain a truly representative sample.
4. Physicochemical and Mechanical Properties of Food
Appearance factors include such things as size, shape, wholeness, and different forms of damage, gloss, transparency, color, and consistency. For example, apple juice is sold both as cloudy and clear juice. Each has a different appearance and is often thought of as a somewhat different product. Textural factors include hand feel and mouthfeel of firmness, softness, juiciness, chewiness, grittiness. The texture of a food is often a major determinant of how little or well we like a food. For example, many people do not like cooked liver because of its texture. Texture of foods can be measured with sophisticated mechanical testing machines. Flavor factors include both sensations perceived by the tongue which include sweet, salty, sour, and bitter, and aromas perceived by the nose. The former are often referred to as "flavors" and the latter "aromas," although these terms are often used interchangeably. Flavor and aroma are often subjective, difficult to measure accurately, and difficult to get a group of people to agree. A part of food science called sensory science is dedicated to finding ways to use humans to accurately describe the flavors and other sensory properties of foods. There are hundreds of descriptive terms that have been invented to describe flavor, depending on the type of food. Expert tea tasters have a language all of their own, which has been passed down to members of their guild from generation to generation. This is true of wine tasters as well.
4.1. Sensory Vocabulary
Sensory evaluation involves using one or more tests to determine different characteristics of food such as appearance, odour, taste and texture. A wide range of vocabulary is used to describe sensory characteristics of food products. Taste: The tongue can detect four basic tastes: sweet, sour, salt and bitter. Tastes may be described by association with a particular food, e.g. meaty, minty or fruity. The intensity can also be recorded. Texture: Texture may be assessed through touch. When food is placed in the mouth, the surface of the tongue and other sensitive skin reacts to the feel of the surface of the food. Different sensations are felt as the food is chewed. Aroma: The nose detects volatile aroma released from food. An odour may be described in association with a particular food, e.g. herby, cheesy, fishy. The intensity can also be recorded. Appearance: A product's size, shape, colour and surface texture cam be described, e.g. large, small, oblong, square, pink, yellow, rough.
Odour Taste Appearance Texture
©Vedpal Yadav, Lecturer in Food Technology, Government Polytechnic, Mandi Adampur, Hisar, Haryana, India‐125052. e‐mail‐ [email protected] +91‐9416589819 Page 48 of 134
Floral Rotten Perfumed Acrid Musty Fragrant Scented Pungent
Sweet Cool Bitter Zesty Warm Hot Tangy Sour Sharp Rich Salty
Heavy Flat Fizzy Crystalline Wet Cuboid Fragile Dull
Brittle Rubbery Short Gritty Clammy Close Stodgy Bubbly Sandy Tacky Tender Waxy Open Soft
Odour and taste work together to produce a flavour. These words may be used to describe either odour or taste of food products. Bland Rancid Tart Acidic Strong Citrus Mild Spicy Tainted Weak Savoury
These words may be used to describe either appearance or texture of food products. Firm Flaky Crisp Fluffy Dry Crumbly Lumpy Smooth Hard Mushy Sticky
4.2. Appearance Factors
In addition to size, shape, and wholeness, pattern (e.g., the way olives are laid out in ajar or sardines in a can) can be an important appearance factor. Wholeness refers to degree of whole and broken pieces; the price of canned pineapple goes down from the whole rings, to chunks, to bits. Appearance also encompasses the positive and negative aspects of properly molded blue‐veined cheeses, and the defect of moldy bread, as well as the quality attribute of ground vanilla bean specks in vanilla ice cream, and the defect of specks and sediment from extraneous matter. Although some ice cream manufacturers have added ground vanilla bean as a mark of highest quality, others have concluded that as often as not a less‐sophisticated consumer misinterprets these specks and rejects the product.
4.2.1. Size and Shape
Size and shape are easily measured and are important factors. Fruits and vegetables can be graded for size by the openings they will pass through. The simple devices were the forerunners of current high‐speed automatic separating and grading machines, although they are still used to some extent in field grading and in laboratory work. Size also can be approximated by weight after rough grading, for example, determining the weight of a dozen eggs. Shape may have more than visual importance, and the grades of certain types of such curiosities can become quite pickles include the degree of curvature important, especially in the design of machines to replace hand operations. When an engineer attempts to design a machine for automatically filling pickles into jars at high speeds, it must be recognized that all pickles are not shaped the same, and a machine that will dispense round objects like olives or cherries can be totally inadequate. Mechanized kitchen, restaurant, and vending systems for rapid mass feeding have become commonplace. Some of the most difficult engineering problems encountered in such facilities were in designing equipment that would dispense odd‐shaped food pieces into moving dishes.
4.2.2. Color and Gloss
Food color not only helps to determine quality, it can tell us many things. Color is commonly an index of ripeness or spoilage. Potatoes darken in color as they are fried and we judge the endpoint of frying by color. The bleaching of dried tomato powder on storage can be indicative of too high an oxygen level in the headspace of the package, whereas the darkening of dried tomato can reflect too high a final moisture

©Vedpal Yadav, Lecturer in Food Technology, Government Polytechnic, Mandi Adampur, Hisar, Haryana, India‐125052. e‐mail‐ [email protected] +91‐9416589819 Page 49 of 134
level in the powder. The color of a food foam or batter varies with its density and can indicate a change in mixing efficiency. The surface color of chocolate is a clue to its storage history. These and many other types of color changes can be accurately measured in the laboratory and in the plant‐all influence or reflect food quality. If the food is a transparent liquid such as wine, beer, or grape juice, or if a colored extract can be obtained from the food, then various types of calorimeters or spectrophotometers can be used for color measurement. With these instruments, a tube of the liquid is placed in a slot and light of selected wavelength is passed through the tube. This light will be differentially absorbed depending on the color of the liquid and the intensity of this color. Two liquids of exactly the same color and intensity will transmit equal fractions of the light directed through them. If one of the liquids is a juice and the other is the same juice somewhat diluted with water, the latter sample will transmit a greater fraction of the incoming light and this will cause a proportionately greater response on the instrument. Such an instrument can also measure the clarity or cloudiness of a liquid depending on the amount of light the liquid lets pass. There are several other methods for measuring, the color of liquids. If the food is liquid or a solid, we can measure its color by comparing the reflected color to defined colored tiles or chips. The quality control inspector changes tiles until the closest color match is made and then defines the color of the food as being identical to the matching tile or falling between the two nearest tiles. Working with tomato products, one would need to have only a few green and red disks to cover the usual range of tomato color. The grade standards for tomatoes have been based on such a method. Color measurement can be further quantified. Light reflected from a colored object can be divided into three components, which have been termed value, hue, and chroma. Value refers to the lightness or darkness of the color or the amount of white versus black; hue to the predominant wavelength reflected, which determines what the perceived color is (red, green, yellow, blue, etc); and chroma refers to the intensity strength of the color. The color of an object can be precisely defined in terms of numerical values of these three components. Another three‐dimensional coordinate scale for describing color utilizes the attributes of lightness‐darkness, yellowness‐blueness, and redness‐ greenness. These dimensions of color, used in tri‐stimulus colorimetry, can be quantified by instruments such as the Hunter lab Color and Color Difference Meter. Food samples having the same three numbers have the same color. These numbers, as well as numbers representing value, hue, and chroma, vary with color in a systematic fashion that can be graphed to produce a chromaticity diagram. The color chemist and quality controller can relate these numbers to color and through changes in the numbers can follow gross or minute changes in products that may occur during ripening, processing, or storage. In similar fashion a quality controller can define the color of a product and relate this information to distant plants to be matched at any future date. This is particularly useful where the food color is so unstable as to make the forwarding of a standard sample unfeasible. As with color, there are light‐measuring instruments that quantitatively define the shine, or gloss, of a food surface. Gloss is important to the attractiveness of gelatin desserts, buttered vegetables, and the like. The theory of color, the method of determining the relationship of color does not address the actual factors influence the appearance of the food itself. Of the sensory attributes of food, those related to appearance are the most susceptible to objective measurement. There are two separate types of categories of appearance:
1. Color attributes related to the wavelength distribution of light. 2. Geometric attributes related to the special distribution.
Of these two, color is by far the most important so far as foods go. The most frequent use of food color measurements is as objective indices of food quality. The initial concept that must be stressed is that color specification of a material is simply the specification of a point of three‐dimensional space. This three‐dimensional space, whether visual or mathematical, has become known as a color solid. On of the earliest and most successful attempt to develop a visual color solid was that of A.H. Munsell in the early 1900's. The color theory is that light is made of red, blue, and green. There are a variety of standards in color work which one must become familiar. In addition to those standards which we in foods are most familiar, there are the many found that pertain to other areas where color is important. There are almost as many colorants and color components as there are chemical compounds; however, they can be classified into major categories.

©Vedpal Yadav, Lecturer in Food Technology, Government Polytechnic, Mandi Adampur, Hisar, Haryana, India‐125052. e‐mail‐ [email protected] +91‐9416589819 Page 50 of 134
Browns and blackish colors can be either enzymatic or nonenzymatic reactions. The major nonenzymatic reaction of greatest interest to scientists, based on rate of publication is the Maillard Reaction, which is the dominant browning reaction. There are other less explained reactions, such as the blackening in potatoes or the browning in orange juice Natural Colorants offer an advantage in that they can be added to foods without taking into consideration certification by the FDA.
Table 9‐ Colours' Specifications
Red When Red Dye No. 1 was removed for potential carcinogenic influence. Red beets and the betalains have been explored as a possible substitute. The beet flavor in the extract has been a problem. Unfortunately, during processing in acid foods (less than pH 7) the combination of heat and acid turns the red color into a straw color. The wine grape skins serve as a source for red color. Although they are anthocyanins, they are unstable in storage, susceptible to pH changes and difficult to characterize chemically as processing may polymerize or degrade them. Paprika powders and paprika oleoresins contain carotenoid pigments which serve as colorants; however, their disadvantage is that they have a distinctive peppery flavor. Although natural, less acceptable are two red colorants from insects. Cochineal, when purified forms carmine, comes from the female insect which grow on a cactus and roots of some trees. Carmine has an anthrquione structure. Cathazanthin is another natural carotenoid which can be synthesized. Monascus, a mold on cereals, is a colorant used in the China, Japan, Taiwan.
Yellow Carotenoids may contribute an yellow color. Although these are available naturally from plants such as carrots, algae, and palm oil, they can be synthesized. Selected ones which has been synthesized are beta‐carotene, apo‐8‐carotenal and ethyl apocarotenoate. Annatto plant is a, relatively, water soluble carotenoid from the annatto plant. Although very expensive, saffron is a yellow colorant used as a spice due to its color and delicate flavor. It comes from the stigmas of the crocus plant. Turmeric, from the rhizomes of the curcuma plant, is a yellow colorant. It is often used with cauliflower in pickles. Carthamin from the Carthemus plant is used for yellow color.
Green Natural green colors come from chlorophyll and its derivatives. Copper chlorophyllis gives a particularly brillant green color due to the replacement of the Mg with Cu
Blue The anthocyanins such as are in blueberries offers a potential to serve as a colorant. Blue phycobilins are blue‐green pigment protein complexes from algae.
Brown Caramel is the primary "natural" colorant for foods and beverages. This comes from a degradation of carbohydrates in acid or alkali with a catalysts. Extractants from the Maillard reaction are also serving as a brown color. A number of other sources of brown colorants are from the cocoa bean (pods, shells, stems) and fermented tea. These are a complex mixture of flavonoids, phenolics, tannins, leucoanthocyanins, etc.
4.2.3. Measuring Texture
Food texture can be reduced to measurements of resistance to force. If food is squeezed so that it remains as one piece, this is compression‐as with the squeezing of bread. If a force is applied so that one part of the food slides past another, it is shearing‐as in the chewing of gum. A force that goes through the food so as to divide it causes cutting‐as in cutting an apple. A force applied away from the material results in tearing or pulling apart, which is a measure of the food's tensile strength‐as in pulling apart a muffin. When we chew a steak, what we call toughness or tenderness is really the yielding of the meat to a composite of all of these different kinds of forces. There are instruments to measure each kind of force, many with appropriate descriptive names but none exactly duplicate what occurs in the mouth. Many specialized test instruments have been devised to measure some attribute of texture. For example, a succulometer uses compression to squeeze juice out of food as a measure of succulence. A Tenderometer applies compression and shear to measure the tenderness of peas. A universal testing machine fitted with the appropriate devices can measure firmness and crispness and other textural

©Vedpal Yadav, Lecturer in Food Technology, Government Polytechnic, Mandi Adampur, Hisar, Haryana, India‐125052. e‐mail‐ [email protected] +91‐9416589819 Page 51 of 134
parameters. This and similar instruments frequently are connected to a moving recording chart. The time‐force curve traced on the chart gives a graphic representation of the Theological properties of the food item. When an apple half is tested, the tracing would show an initial high degree of force required to break the skin, and then a change in force as the compressing‐shearing element enters and passes through the apple pulp. Various forms of penetrometer are in use. These generally measure the force required to move a plunger a fixed distance through a food material. A particular penetrometer used to measure gel strength is the Bloom Gelometer. In this device, lead shot is automatically dropped into a cup attached to the plunger.
Picture 10‐ Universal Texture Analyser
The plunger positioned above the gel surface moves a fixed distance through the gel until it makes contact with a switch that cuts off the flow of lead shot. The weight of shot in grams, which 1% proportional to the firmness of the gel, is reported as degrees Bloom. This is one way of measuring the "strength" of gelatin and the consistency of gelatin desserts. Another kind of penetrometer, also referred to as a tenderometer, utilizes a multiple needle probe that is pressed into the rib eye muscle of raw beef. The force needed is sensed by a transducer and displayed on a meter. The carefully engineered needle probe was designed to give readings that correlate with the tenderness of the meat after cooking, while at the same time not altering the raw meat for further use. Several of the above methods for measuring texture alter the food sample being tested, so that it cannot be returned to a production batch. Since there are correlations between color and texture in some instances, there are applications where color may be used as an indication of acceptable texture. Under controlled conditions automatic color measurement may then be used as a nondestructive measure of texture; this is done in the evaluation of the ripeness of certain fruits and vegetables moving along conveyor belts. Another nondestructive indication of texture is obtained by the experienced cheese maker who thumps the outside of a cheese, and listens to the sound. This gives a rough indication of the degree of eye formation during ripening of Swiss cheese. One of the newer methods of nondestructive texture measurement makes use of sonic energy, which is absorbed to different extents depending on the firmness of an object.
4.2.3.1. Texture Changes
The texture of foods, like shape and color, does not remain constant. Water changes play a major role. Foods also can change texture on ageing. Texture of fresh fruit and vegetables becomes soggy as the cell walls break down and the cells lose water. This is referred to as loss of turgor. As more water is lost from the fruit, it becomes dried out, tough, and chewy. This is desirable in the case of dried apricots, prunes, and raisins. Bread‐and cake in the course of becoming stale lose some water and this is a quality defect. Steaming the bread refreshes it somewhat by softening the texture. Crackers, cookies, and pretzels must be protected against moisture pickup that would soften texture. Quite apart from changes in the texture of unprocessed foods, there are the textural aspects of processed foods. For example, lipids are softeners and lubricants that the baker blends into a cake formula to tenderize cake. Starch and numerous gums are thickeners; they increase viscosity. Protein in solution can be a thickener, but if the solution is heated and the protein coagulates, it can form a rigid structure as in the case of cooked egg white or coagulated gluten in baked bread. Sugar affects

©Vedpal Yadav, Lecturer in Food Technology, Government Polytechnic, Mandi Adampur, Hisar, Haryana, India‐125052. e‐mail‐ [email protected] +91‐9416589819 Page 52 of 134
texture differently depending on its concentration. In dilute solution it adds body and mouthfeel to soft drinks. In concentrated solution it adds thickening and chewiness. In still higher concentrations it crystallizes and adds brittleness as in hard candies. The food manufacturer not only can blend food constituents into an endless number of mixtures but may use countless approved ingredients and chemicals to help modify texture.
4.2.3.2. Consistency
Although consistency may be considered a textural quality attribute, in many instances we can see consistency and so it also is another factor in food appearance. Chocolate syrup may be thin‐bodied or thick and viscous; a tomato sauce can be thick or thin. Consistency of such foods is measured by their viscosity, higher viscosity products being of higher consistency and lower viscosity being lower consistency. The simplest method to determine consistency is to measure the time it takes for the food to ruff through a small hole of a known diameter; or one can measure the time it takes for more viscous foods to flow down an inclined plane using the Bostwick Consistometer. This device might be used for ketchup, honey, or sugar syrup. These devices are called viscometers. There are several other types of viscometers using such principles as the resistance of the food to a failing weight such as a ball, and the time it takes the ball to travel a defined distance; and resistance to the rotation of a spindle, which can be measured by the power requirements of the motor or the amount of twist on a wire suspending the spindle.
4.2.3.3. Texture Theory and Discussion
Texture is a mechanical behavior of foods measured by sensory (physiological/psychological) or physical (rheology) means. Rheology is the study of the science of deformation of matter. There are four main reasons for studying rheology.
1. Study allows insight into structure. 2. Used in raw material and process control in industry. 3. Applications to machine design. 4. Relevance to acceptability by the consumer
However irregardless of the reason for study texture, it is difficult to classify and sharply understand because of the enormous range of materials and food materials behave differently under different conditions. Part of the problem is that to study the texture of foods one needs to have reference or standard materials. If one has a good reference material it should be structureless (there are no atoms), isotropic (same properties in all directions), and imaginary (does not exist in reality). If one really wanted to understand texture and the relationships of stress‐strain and deformation, they should deal with representative models. Some of these are as follows:
Hooke solid (ideal solid)
Kelvin‐Voigt model (visco‐elastic solid)
Bingham model (ideal plastic)
Maxwell model (visco‐elastic liquid)
Newtonian fluid (ideal liquid) Texture testing in foods is based upon the action of stress and strain. Many of the methods are based upon compression, shearing, shear‐pressure, cutting or tensile strength. These are reviewed in the following figure which defines the ideal reference materials in terms of shear and stress.
4.2.3.4. Fundamental Testing
Fundamental rheological test results are returned in terms of kilograms, meters, and seconds. Whatever the method used, the same result is obtained within the experimental error. Unfortunately food is exceedingly complicated rheologically and fundamental testing is often laborious and time consuming and does not give simple answers. An empirical method may provide very useful information even if the results cannot be compared for different methods of test.
4.2.3.5. Empirical Testing
Empirical tests are those tests which have been found to practically correlate with textural quality. They correlate with textural qualities. They may include puncture, shear, and extrusion tests.

©Vedpal Yadav, Lecturer in Food Technology, Government Polytechnic, Mandi Adampur, Hisar, Haryana, India‐125052. e‐mail‐ [email protected] +91‐9416589819 Page 53 of 134
4.2.3.6. Apparent Testing
Many of the tests used in evaluating foods are dependent upon the conditions and the method of handing the ingredients and food. Following are some areas that are of interest.
4.2.3.7. Viscosity
Viscosity is simply defined as being resistance to flow. However, the real question is the type of flow how does stress and strain impact it? Viscosity exists as both Newtonian and Non Newtonian fluids.
4.3. Flavor Factors
Flavor is a combination of both taste and smells and is largely subjective and therefore hard to measure. This frequently leads to differences of opinion between judges of quality. This difference of opinion is to be expected since people differ in their sensitivity to detect different tastes and odors, and even where they can detect them, people differ in their preference. In some cultures, strong smelling fish is desirable, whereas in others such fish would be unacceptable. The flavor of a given food is determined by both the mixture of salt, sour, bitter, and sweet tastes and by the endless number of compounds which give foods characteristic aromas. Thus, the flavor of a food is quite complex and has not been completely described for most foods. Adding to this complexity is the fact that the same food is often perceived differently by different individuals. This difference is due to cultural and biological differences between people.
4.3.1. Influence of Color and Texture on Flavor
Judgments about flavor often are influenced by color and texture. For example, we associate such flavors as cherry, raspberry, and strawberry with the color red. Actually, the natural flavor essences and the chemicals they contain are colorless. But in nature they occur in foods of typical color and so we associate orange flavor with the orange color, cherry with red, lime with green, chicken flavor with yellow, and beef flavor with brown. If gelatin‐type desserts Care prepared without color, inexperienced tasters will find it hard to distinguish lime from cherry. If we color the lime‐flavored item red and the cherry‐flavored item green, then the challenge becomes still greater. Butter and margarine may be colored by the addition of a dye. Many consumers will agree that of two samples, the yellow one has the stronger butter flavor, but this may not actually be the case. This is the reason "blind" testing is often employed in flavor evaluation, colored lighting being the means of masking out an influencing color. Texture can be equally misleading. When one of two identical samples of gravy is thickened with a tasteless starch or gum, many will judge the thicker sample to have the richer flavor. This can be entirely psychological. However, the line between psychological and physiological reactions is not always easy to draw. Our taste buds respond in a complex fashion not yet fully understood. Many chemicals can affect taste response to other compounds. It is entirely possible for texturizing substances to influence taste and flavor in a fashion that is not imaginary. If a thickener affects the solubility or volatility of a flavor compound, its indirect influence on the nose or tongue could be very real.
5. Evaluation of Food Quality by Sensory Evaluation
Quality is the ultimate criterion of the desirability of any food product. Food quality can be evaluated by sensory and objective methods.
5.1. Sensory Evaluation
When the quality of a food product is assessed by means of human sensory organs, the evaluation is said to be sensory or subjective or organoleptic. Every time food is eaten a judgement is made. Sensory quality is a combination of different senses of perception coming into play in choosing and eating a food. Appearance, flavour and mouthfeel decide the acceptance of the food. The effective characteristic is not the property of the food, but the subject's reaction to the sensory qualities of foods. This reaction is highly conditioned by a variety of psychological and social factors and in the final analysis, plays a vital role in the acceptance and preference of foods.
5.2. Sensory Characteristics of Food

©Vedpal Yadav, Lecturer in Food Technology, Government Polytechnic, Mandi Adampur, Hisar, Haryana, India‐125052. e‐mail‐ [email protected] +91‐9416589819 Page 54 of 134
5.2.1. Appearance
Surface characteristics of food products contribute to the appearance. Scrambled egg with a very dry surface is not acceptable. Fudge with a glossy surface is rated high. Interior appearance can also be evaluated. Lumps in a pudding or gravy which are not desirable can be judged by the eye. Sight plays a role in the assessment of the lightness of foods like the bread, cakes and idli. Keep this perception of the size, shape of the foods and of such characteristics as transparency, opaqueness, turbidity, dullness and gloss is mediated by the organs of sight. Quality of fish can be ascertained by the brightness of the eyes of fish. Quality of sweet limes can be found out by appearance. If the skin is thin it is juicier. Infestation with insects can be found out in brinjal by the appearance of black spots on it. Completeness of cooking can be judged by appearance in products like meat and rice.
5.2.2. Colour
In addition to giving pleasure, the colour of food is associated with other at‐ tributes. Ripeness of fruits like banana, tomato, mango, guava, papaya and plum can be assessed by the colour. Colour is used as an index to the quality of a number of foods. The strength of coffee and tea is judged in part by the colour of the beverages. The colour of roast beef is used as an index to doneness. Toast, dosa, and chapathi which are too brown are likely to be rejected in anticipation of scorched bitter taste.
5.2.3. Flavour
The flavour of food has three components‐odour, taste and a composite of sensations known as mouth feel.
5.2.4. Odour
The odour of food contributes immeasurably to the pleasure of eating. A substance which produces odour must be volatile and the molecules of the substance must come in contact with receptors in the epithelium of the olfactory organ. It is estimated that the olfactory sense of man has the capacity to distinguish 16 million odours. Aroma is able to penetrate even beyond the visual range when comparatively volatile compounds are abundant as is true in boiling sambar. The volatility of aromas is related to the temperature of the food. High temperatures tend to volatilise aromatic compounds, making them quite ap‐ parent for judging; cool or cold temperatures inhibit volatilisation.
5.2.5. Taste
We value food for its taste. Taste sensation which the taste buds register are categorised as sweet, salt, sour or bitter. Taste buds in the different areas of the tongue are not equally sensitive to all taste stimuli and at least some taste cells respond to more than one stimulus. Taste buds near the tip of the tongue are more sensitive to sweet and salt. Those on the sides to sour and those near the back to bitter. The sensation known as sour is associated with hydrogen ions supplied by acids like vinegar and by those found in fruits and vegetables. Salt taste is due to ions of salt. Sodium chloride is said to be the only one with a pure salt sensation. Substances which elicit the sweet sensation are primarily organic compounds like alcohols, certain amino acids, and aldehydes. Glycerol tastes mildly sweet. Sugars are the main source of sweetness in food. Not all sugars are equally sweet. Fructose gives the most intense sweet sensation followed by sucrose, glucose, maltose, galactose and lactose. Sweetness appears to be associated with the hydroxyl radicals on the sugar molecules. The concentration required for identification is known as the "threshold" for that particular substance. Individuals differ in their sensitivity to the four taste sensations and the threshold for each of the primary tastes is usually not at the same level in any one individual. The pleasant sensations in eating come more from odour than from taste.
5.2.5.1. Taste interaction
Foods contain mixture of substances which elicit all four taste sensations. Salt in sub threshold concentration reduces the tartness of acid. Some threshold concentrations of salt also increase the

©Vedpal Yadav, Lecturer in Food Technology, Government Polytechnic, Mandi Adampur, Hisar, Haryana, India‐125052. e‐mail‐ [email protected] +91‐9416589819 Page 55 of 134
apparent sweet‐ ness of sucrose. The addition of salt to lime juice, sherbet, lassi, and to fruits like apple or guava improve the taste. Conversely acids in sub threshold concentration intensify the saltiness of sodium chloride so it is easy to over salt tart foods. Sugar in sub threshold concentration reduces the saltiness of sodium chloride so a pinch of sugar may improve vegetable soup that has been over salted. Sugar also reduces the sourness of acids and the bitterness of coffee.
5.2.5.2. Mouth feel
Texture and consistency and hotness or burning sensation of pepper can be felt in the mouth.
5.2.5.3. Temperature
Hot and cold sensations contribute to the composite flavour of a food like coffee, soup or ice cream. Taste sensations are less intense as the temperature of food is lowered below 20°C and raised above 30°C. Thus really hot coffee is not as bitter as that which has cooled in the cup, iced coffee is not as bitter as that which is warm but not really hot. Melted ice cream tastes unpleasantly sweet although in the frozen state it is acceptable.
5.2.5.4. Texture
Texture in ice cream depends upon the size of the crystals. How they feel on the tongue is characterized as coarse or fine. Coarse textured crystalline products are said to be grainy. The brittleness of food is another aspect of texture. Tissues in a raw vegetable and fruit are brittle or crunchy. The cells offer moderate resistance to fraction by the pressure of the teeth e.g. crispness of apple and raw carrots. Tenderness in fruits and vegetables depends on how easily the cells separate. In meats ease of separation of the lean (without fat) tissue determines the tenderness. Tenderness in pastry is assessed by the ease with which the crisp crust breaks.
5.2.5.5. Astringency
It is dry puckery sensation believed to be due to precipitation of the proteins in the saliva and in the mucous membrane lining of the mouth which deprives them of their lubricating character. Astringent substances may also constrict the ducts leading from the salivary glands to the mouth. Unripe fruits like cashew fruit, wood apple, blue berry and gooseberry are astringent.
5.2.5.6. Consistency
Ice creams may be too hard or too soft which can be found out by mouth feel. Gravies, sauces and syrups range in consistency from thick to thin. Temperature may affect the consistency of food e.g. ghee, butter, cheese and ice creams. The consistency of soft custard besides being thick or thin may be smooth or curdled. Cream soups may be smooth or lumpy. Gels may be rubbery or fragile (easily breakable). Particles of cooked cereal can be pasty or separate in grains.
5.2.5.7. Psychological factors
In addition to colour, odour, taste and mouth feet certain psychological factors contribute to the acceptability of foods. Food is accepted when there is pleasant association.
5.3. Conducting Sensory Tests
Sensory tests are well integrated with the over all plan of development of the product.
5.3.1. Trained panel members
The sensory qualities, particularly the flavour attributes are essentially to be measured subjectively. From early times this judging has been the preserve of experts who used to evaluate tea, coffee and wine. With the development of sensory evaluation techniques on scientific lines, the experts are being replaced by panels whose sensitivity and consistency have been established by training and repeated tests. The panel members analyse food products through properly planned experiments and their judgements are quantified by appropriate statistical analysis.

©Vedpal Yadav, Lecturer in Food Technology, Government Polytechnic, Mandi Adampur, Hisar, Haryana, India‐125052. e‐mail‐ [email protected] +91‐9416589819 Page 56 of 134
5.3.2. Selection of panel of judges
Actually one extremely discriminating pains taking and unbiased individual would suffice for tasting. Further one individual may not be able to discriminate different aspects of food quality. Hence a panel of judges may be used. Members of the panel should be carefully selected and trained to find out difference in specific quality characteristics between different stimuli and also direction and intensity of difference. The requirements for an ideal panel member are as follows. (i) He should be able to discriminate easily between samples and should be able to distinguish
appreciable differences in taste and smell. (ii) He should have good health. If he is suffering from cold his sensitivity may be affected. A sick patient
cannot judge the food correctly. He should not be habituated to chewing pan or supari. (iii) He should be experienced in the particular field. (iv) He should have high personal integrity. He should not be prejudiced. He should be able to evaluate
objectively. (v) Willingness to spend time for the sensory evaluation work is required. (vi) He should have interest in sensory analysis of samples and intellectual curiosity. (vii) He should have ability to concentrate and derive proper conclusion. (viii) He should be available and willing to submit to periodic test to get consistent results. Candidates possessing these qualities must be indexed with details of age, sex, specific likes and dislikes availability. There are different types of panels:
5.3.2.1. Trained panel
Laboratory panels must then be carefully trained for specific products or purposes. These tests aim at finding differences in specific quality characteristics between different stimuli and also direction and/or intensity of the difference. Periodically the panel is given refresher training and tests. The number of members in the trained panel should be small varying from 5 to 10.
5.3.2.2. Discriminative, communicative or send trained panels
These panels are constituted of technical people and their families, who are normally familiar with the qualities of different types of food. They are capable, with few preliminary test runs, of following instructions for tests given, discriminating differences and communicating their reactions. Such panels of 25‐30 are used to find the acceptability or preference of final experimental products prior to large scale consumer trials.
5.3.2.3. Consumer panels
Such panels are made up of untrained people chosen at random to represent a cross‐section of the population for which the product is intended. The greater the number the greater the dependability of the result. A group of not less than 100 is considered the minimum.
5.3.3. Testing laboratory
Testing laboratory consists of three separate units.
5.3.3.1. Reception room
where the panel members meet the person in charge of the laboratory and get acquainted with the type of the samples to be tested.
5.3.3.2. Sample preparation room
which is clean and well equipped for the preparation and serving of samples.
5.3.3.3. Test booths
are where the actual sensory evaluation of the samples are carried out by the panel members.
The entire testing laboratory should be air‐conditioned, free from noise and extraneous odours.
Whenever samples with difference in colours are tested, colour lights should be used to mask the colour of the samples.
Stainless steel, glass and dishes and cups and plain serving china are the most convenient as utensils.
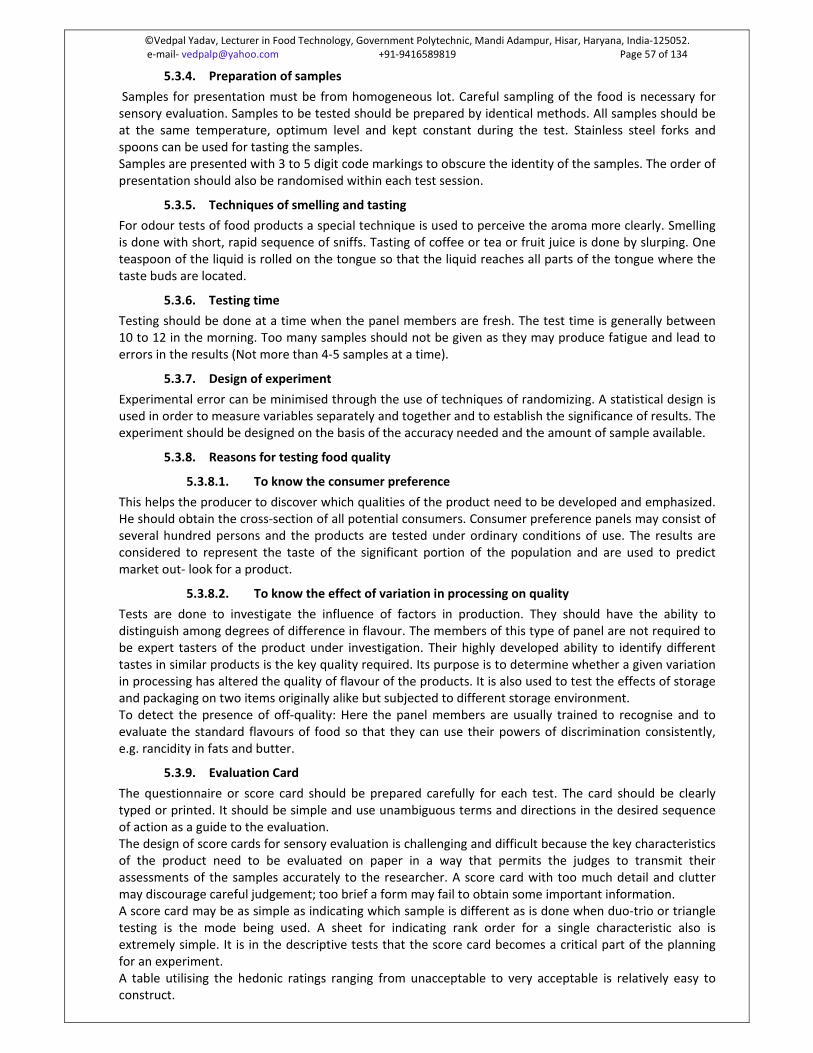
©Vedpal Yadav, Lecturer in Food Technology, Government Polytechnic, Mandi Adampur, Hisar, Haryana, India‐125052. e‐mail‐ [email protected] +91‐9416589819 Page 57 of 134
5.3.4. Preparation of samples
Samples for presentation must be from homogeneous lot. Careful sampling of the food is necessary for sensory evaluation. Samples to be tested should be prepared by identical methods. All samples should be at the same temperature, optimum level and kept constant during the test. Stainless steel forks and spoons can be used for tasting the samples. Samples are presented with 3 to 5 digit code markings to obscure the identity of the samples. The order of presentation should also be randomised within each test session.
5.3.5. Techniques of smelling and tasting
For odour tests of food products a special technique is used to perceive the aroma more clearly. Smelling is done with short, rapid sequence of sniffs. Tasting of coffee or tea or fruit juice is done by slurping. One teaspoon of the liquid is rolled on the tongue so that the liquid reaches all parts of the tongue where the taste buds are located.
5.3.6. Testing time
Testing should be done at a time when the panel members are fresh. The test time is generally between 10 to 12 in the morning. Too many samples should not be given as they may produce fatigue and lead to errors in the results (Not more than 4‐5 samples at a time).
5.3.7. Design of experiment
Experimental error can be minimised through the use of techniques of randomizing. A statistical design is used in order to measure variables separately and together and to establish the significance of results. The experiment should be designed on the basis of the accuracy needed and the amount of sample available.
5.3.8. Reasons for testing food quality
5.3.8.1. To know the consumer preference
This helps the producer to discover which qualities of the product need to be developed and emphasized. He should obtain the cross‐section of all potential consumers. Consumer preference panels may consist of several hundred persons and the products are tested under ordinary conditions of use. The results are considered to represent the taste of the significant portion of the population and are used to predict market out‐ look for a product.
5.3.8.2. To know the effect of variation in processing on quality
Tests are done to investigate the influence of factors in production. They should have the ability to distinguish among degrees of difference in flavour. The members of this type of panel are not required to be expert tasters of the product under investigation. Their highly developed ability to identify different tastes in similar products is the key quality required. Its purpose is to determine whether a given variation in processing has altered the quality of flavour of the products. It is also used to test the effects of storage and packaging on two items originally alike but subjected to different storage environment. To detect the presence of off‐quality: Here the panel members are usually trained to recognise and to evaluate the standard flavours of food so that they can use their powers of discrimination consistently, e.g. rancidity in fats and butter.
5.3.9. Evaluation Card
The questionnaire or score card should be prepared carefully for each test. The card should be clearly typed or printed. It should be simple and use unambiguous terms and directions in the desired sequence of action as a guide to the evaluation. The design of score cards for sensory evaluation is challenging and difficult because the key characteristics of the product need to be evaluated on paper in a way that permits the judges to transmit their assessments of the samples accurately to the researcher. A score card with too much detail and clutter may discourage careful judgement; too brief a form may fail to obtain some important information. A score card may be as simple as indicating which sample is different as is done when duo‐trio or triangle testing is the mode being used. A sheet for indicating rank order for a single characteristic also is extremely simple. It is in the descriptive tests that the score card becomes a critical part of the planning for an experiment. A table utilising the hedonic ratings ranging from unacceptable to very acceptable is relatively easy to construct.

©Vedpal Yadav, Lecturer in Food Technology, Government Polytechnic, Mandi Adampur, Hisar, Haryana, India‐125052. e‐mail‐ [email protected] +91‐9416589819 Page 58 of 134
No single score card fits all experiments. Instead, the score card needs to be developed for the specific experiment. All score cards should contain the date and name of the judge.
5.4. Types of Tests
Different sensory tests are employed for food evaluation. The tests are grouped into four types. (i) Difference tests. (ii) Rating tests. (iii) Sensitivity tests. (iv) Descriptive tests.
The selection of a particular test method will depend on the defined objective of the test, accuracy desired and personnel available for conducting the evaluation.
5.4.1. Difference Tests
5.4.1.1. Paired Comparison Test
(i) The panel members receive several pairs of samples. These may be different or the same samples in each pair. Samples are always given in code numbers.
(ii) Different samples are given in each pair which differ in the intensity of one characteristic e.g. sweetness, bitterness or rancidity. In each pair the sample with more or less intense taste will have to be picked out.
Picture 11‐Specimen Evaluation Card of Paired Comparision Test
5.4.1.2. Duo‐Trio Test
This test employs three samples, two identical and one different. The panel is first given one of the pair of identical samples as known reference sample and then the other two successively in random order, and asked to match one of these with the first. A positive answer is required even if it is a guess. The chance probability of placing the samples in a certain order is one‐half. Trained or untrained panelists can be used.

©Vedpal Yadav, Lecturer in Food Technology, Government Polytechnic, Mandi Adampur, Hisar, Haryana, India‐125052. e‐mail‐ [email protected] +91‐9416589819 Page 59 of 134
Picture 12‐ Specimen Evaluation Card of Duo‐ Trio Test
5.4.1.3. Triangle Test
This test employs three samples, two identical and one different, presented simultaneously to the panel. The judge is asked to determine which of the three the odd sample is. A positive answer is required even if it is a guess. Since all three samples are unknown, the chance probability of placing the sample in a certain order is one‐third. Two samples A and B can be presented in two combinations AAB and BBA and for replication in six different arrangements‐AAB, ABA, BAA, BAB, ABB and BBA. Note: With experience it is possible to study another dimension, the degree of difference in this test.
Picture 13‐ Specimen Evaluation Card of Triangle Test
5.4.2. Rating Tests
These tests give more quantitative data than difference tests and can be used for the analysis of more than two samples at the same time.
5.4.2.1. Ranking Test
This test is used to determine how several samples differ on the basis of a single characteristic. A control need not be identified. Panelists are presented all samples simultaneously (including a standard or control if used) with code numbers and are asked to rank all samples according to the intensity of the specified
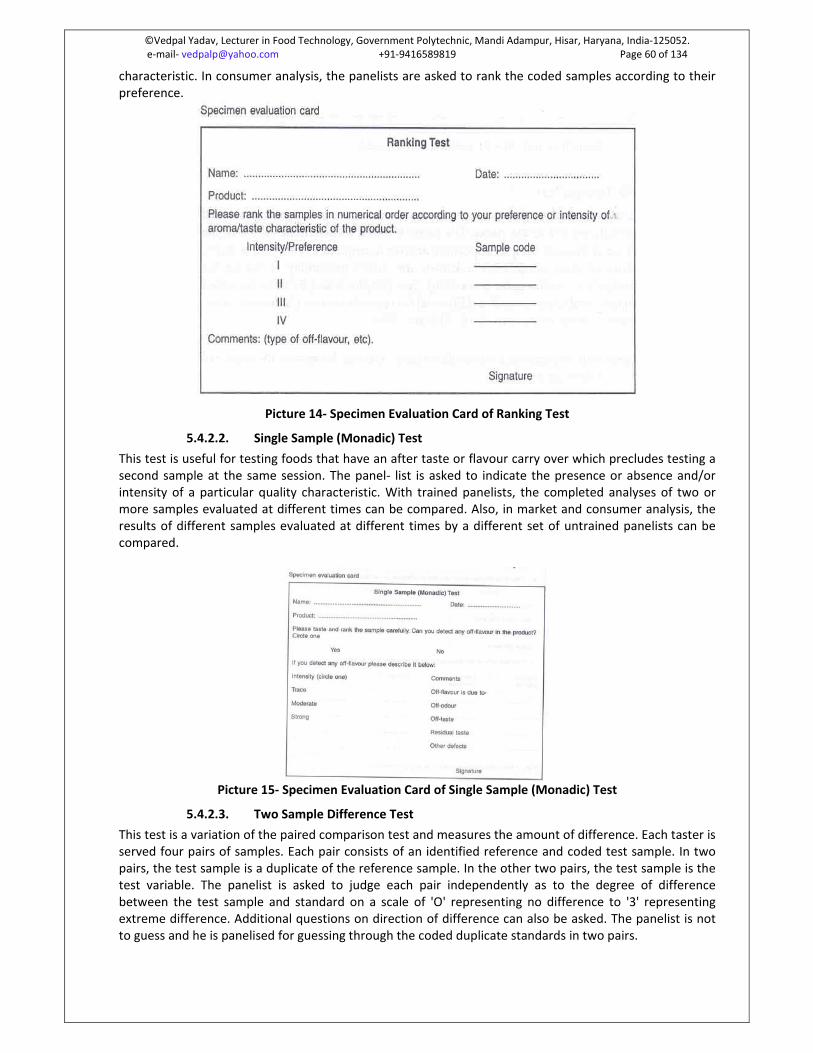
©Vedpal Yadav, Lecturer in Food Technology, Government Polytechnic, Mandi Adampur, Hisar, Haryana, India‐125052. e‐mail‐ [email protected] +91‐9416589819 Page 60 of 134
characteristic. In consumer analysis, the panelists are asked to rank the coded samples according to their preference.
Picture 14‐ Specimen Evaluation Card of Ranking Test
5.4.2.2. Single Sample (Monadic) Test
This test is useful for testing foods that have an after taste or flavour carry over which precludes testing a second sample at the same session. The panel‐ list is asked to indicate the presence or absence and/or intensity of a particular quality characteristic. With trained panelists, the completed analyses of two or more samples evaluated at different times can be compared. Also, in market and consumer analysis, the results of different samples evaluated at different times by a different set of untrained panelists can be compared.
Picture 15‐ Specimen Evaluation Card of Single Sample (Monadic) Test
5.4.2.3. Two Sample Difference Test
This test is a variation of the paired comparison test and measures the amount of difference. Each taster is served four pairs of samples. Each pair consists of an identified reference and coded test sample. In two pairs, the test sample is a duplicate of the reference sample. In the other two pairs, the test sample is the test variable. The panelist is asked to judge each pair independently as to the degree of difference between the test sample and standard on a scale of 'O' representing no difference to '3' representing extreme difference. Additional questions on direction of difference can also be asked. The panelist is not to guess and he is panelised for guessing through the coded duplicate standards in two pairs.
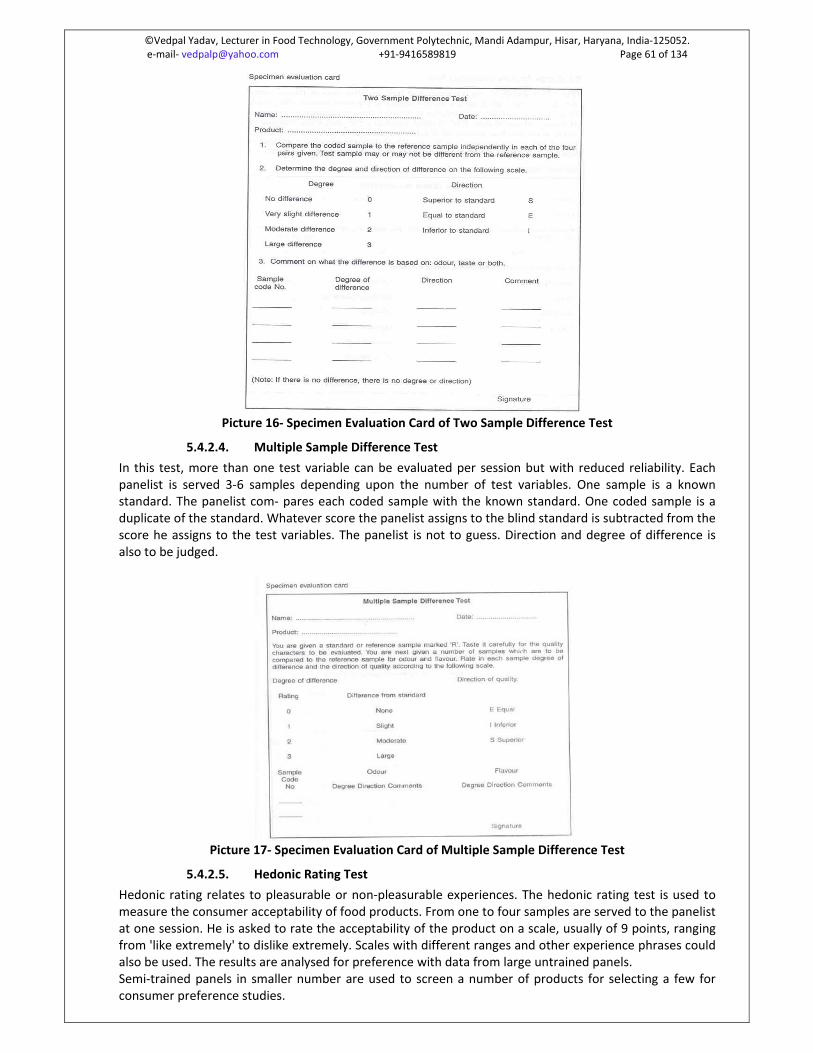
©Vedpal Yadav, Lecturer in Food Technology, Government Polytechnic, Mandi Adampur, Hisar, Haryana, India‐125052. e‐mail‐ [email protected] +91‐9416589819 Page 61 of 134
Picture 16‐ Specimen Evaluation Card of Two Sample Difference Test
5.4.2.4. Multiple Sample Difference Test
In this test, more than one test variable can be evaluated per session but with reduced reliability. Each panelist is served 3‐6 samples depending upon the number of test variables. One sample is a known standard. The panelist com‐ pares each coded sample with the known standard. One coded sample is a duplicate of the standard. Whatever score the panelist assigns to the blind standard is subtracted from the score he assigns to the test variables. The panelist is not to guess. Direction and degree of difference is also to be judged.
Picture 17‐ Specimen Evaluation Card of Multiple Sample Difference Test
5.4.2.5. Hedonic Rating Test
Hedonic rating relates to pleasurable or non‐pleasurable experiences. The hedonic rating test is used to measure the consumer acceptability of food products. From one to four samples are served to the panelist at one session. He is asked to rate the acceptability of the product on a scale, usually of 9 points, ranging from 'like extremely' to dislike extremely. Scales with different ranges and other experience phrases could also be used. The results are analysed for preference with data from large untrained panels. Semi‐trained panels in smaller number are used to screen a number of products for selecting a few for consumer preference studies.
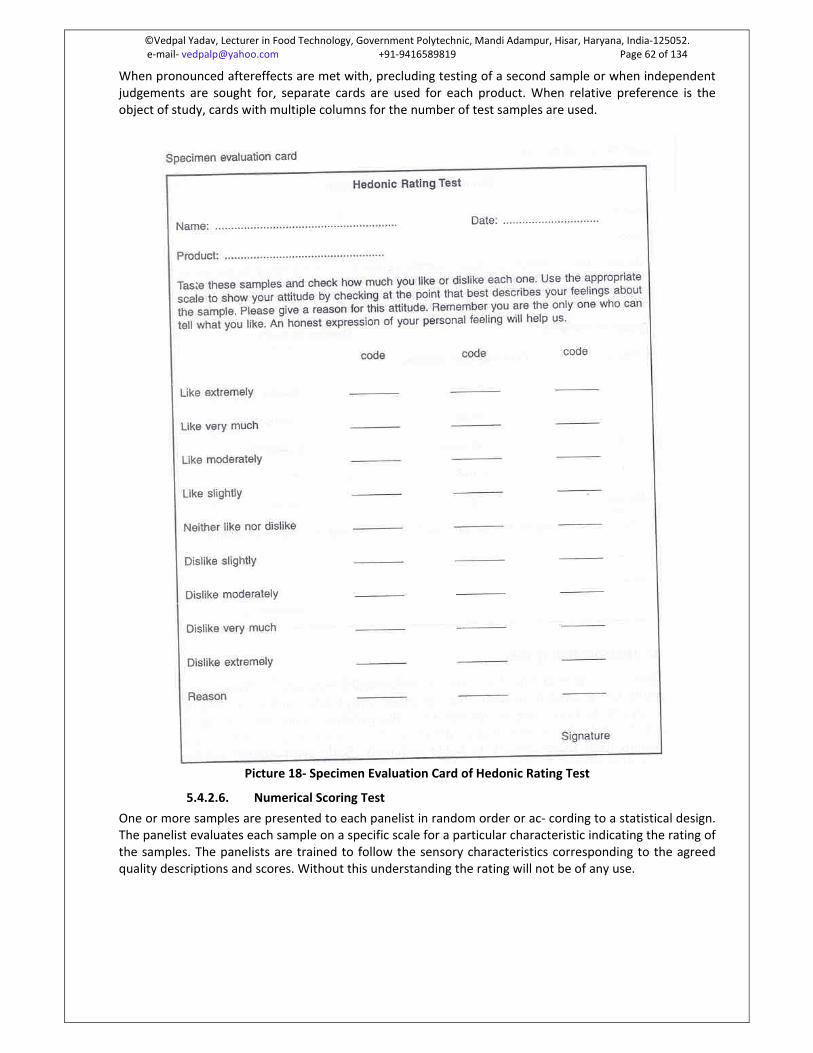
©Vedpal Yadav, Lecturer in Food Technology, Government Polytechnic, Mandi Adampur, Hisar, Haryana, India‐125052. e‐mail‐ [email protected] +91‐9416589819 Page 62 of 134
When pronounced aftereffects are met with, precluding testing of a second sample or when independent judgements are sought for, separate cards are used for each product. When relative preference is the object of study, cards with multiple columns for the number of test samples are used.
Picture 18‐ Specimen Evaluation Card of Hedonic Rating Test
5.4.2.6. Numerical Scoring Test
One or more samples are presented to each panelist in random order or ac‐ cording to a statistical design. The panelist evaluates each sample on a specific scale for a particular characteristic indicating the rating of the samples. The panelists are trained to follow the sensory characteristics corresponding to the agreed quality descriptions and scores. Without this understanding the rating will not be of any use.

©Vedpal Yadav, Lecturer in Food Technology, Government Polytechnic, Mandi Adampur, Hisar, Haryana, India‐125052. e‐mail‐ [email protected] +91‐9416589819 Page 63 of 134
Picture 19‐ Specimen Evaluation Card of Numerical Scoring Test
5.4.2.7. Composite Scoring Test
The rating scale is defined so that specific characteristic of a product are rated separately. The definition of the rating scale is weighed so that the most important characteristics will account for a large part of the total score. The resulting scores are compounded for any one panelist to arrive at a composite score. This method is helpful in grading products and comparison of quality attributes by indicating which characteristic is at fault in a poor product. It gives more information than the straight numerical method. The panelists are trained to evaluate the dimensions of the individual quality characteristic critically, and in the use of the weighed scale.
Picture 20‐ Specimen Evaluation Card of Composite Scoring Test
5.4.3. Sensitivity Tests
Sensitivity tests are done to assess the ability of individual to detect different tastes, odours and feel the presence of specific factors like astringency or hotness (pepper). These tests are used to select and train panel members for evaluating the quality of products containing spices, salt and sugar, e.g. tomato ketchup or sauce. For this purpose threshold tests for the recognition of basic tastes (sweet, sour, bitter and acid) are employed for selecting the panel members.
5.4.3.1. Sensitivity‐Threshold Test
Sensitivity tests to measure the ability of an individual to smell, taste or feel specific characteristics in food or beverages or pure substances are used frequently in selecting for evaluations in product research and development. Also, they are used to establish intensity of sensory response of a food or food components. Threshold is defined as a statistically determined point on the stimulus scale at which a transition in a series of sensations or judgements occurs. There are mainly three types of threshold as described below:

©Vedpal Yadav, Lecturer in Food Technology, Government Polytechnic, Mandi Adampur, Hisar, Haryana, India‐125052. e‐mail‐ [email protected] +91‐9416589819 Page 64 of 134
(a) Stimulus detection threshold is that magnitude of stimulus at which a transition occurs from no sensation to sensation.
(b) Recognition identification threshold is the minimum concentration at which a stimulus is correctly identified.
(c) Terminal saturation threshold is the magnitude of a stimulus above which there is no increase in the perceived intensity of the stimulus.
The recognition threshold tests with basic tastes or odours are most frequently employed for panel selection and with materials such as spices for assessing the intensity of odour or flavour as the main threshold value by a trained panel. The threshold value is given as a mere number which is the denominator of the dilution where the odour or flavour is recognized. These tests are also used where a minimum detectable difference of an additive or of an off‐flavour are to be established.
Picture 21‐ Specimen Evaluation Card of Sensitivity Threshold Test
5.4.3.2. Dilution Test
Dilution tests are designated to establish the smallest amount of an unknown material, developed as a substitute for a standard product that can be detected when it is mixed with the standard product, e.g., margarine in butter, dried whole milk in fresh milk, synthetic orange flavour ingredients with natural flavour and so on. The quality of the test material is represented by the dilution number which is the percent of the test material in the mixture of the standard product such that there exists a just identifiable difference in odour and taste between them. The bigger the dilution number the better is the quality of the test material.

©Vedpal Yadav, Lecturer in Food Technology, Government Polytechnic, Mandi Adampur, Hisar, Haryana, India‐125052. e‐mail‐ [email protected] +91‐9416589819 Page 65 of 134
5.4.4. Descriptive Flavour Profile Method
This is both qualitative and quantitative description method for flavour analysis in products containing different tastes and odour. For tomato ketchup the flavour profile analysis is given.
Picture 22‐ Specimen Evaluation Card of Descriptive Flavour Profile
Picture 23‐ Application of Sensory Test to Food Industry Problems

©Vedpal Yadav, Lecturer in Food Technology, Government Polytechnic, Mandi Adampur, Hisar, Haryana, India‐125052. e‐mail‐ [email protected] +91‐9416589819 Page 66 of 134
Picture 24‐ Number of Panel Members and Samples Required for Sensory Tests
5.5. Limitations of sensory evaluation
1. The result may be highly variable. 2. People with colds or other health problems temporarily lose their maximum effectiveness. 3. Emotional burdens may influence an individual's ability.
5.6. Interpretation of Sensory Results in Statistical Quality Control
5.6.1. The quality and nature of sensory and consumer data
These data are generated by groups of people who are consumers, food company staff or others recruited to participate in food trials for varying lengths of time. Such participants are viewed in different ways depending on the application; if they are assessing food samples then they can be referred to as judges, assessors or panellists. The data from this type of source will provide sensory data by various sensory evaluation tests. Within this type there is another division: data generated by selected, trained panellists are viewed as trained panel sensory data and that from consumers (untrained or lay respondents) as consumer sensory data. Separating the data sources in this way is by no means clear‐cut as many

©Vedpal Yadav, Lecturer in Food Technology, Government Polytechnic, Mandi Adampur, Hisar, Haryana, India‐125052. e‐mail‐ [email protected] +91‐9416589819 Page 67 of 134
practitioners use consumer panels for tests which others limit to trained panel work; some sensory tests (such as difference tests) are commonly used by both forms of panel. Additionally, when time permits, training consumers can also be incorporated in some experiments. There are a wide variety of statistical applications to sensory data, with identification of product preference and differences being common objectives. The second main data form is that originating from consumers in surveys where views and perceptions on food issues, concepts, etc., are recorded and these are referred to as consumer survey data (Figure 5). Here, the participants can be viewed as respondents for general questionnaire trials or as subjectswhen differing conditions are administered to groups, e.g. half of the subjects receive brand details of products in the questionnaire, and the other half do not. Measurement systems based on human participants in the above formats result in data that is ‘noisy’ in terms of error,when compared with instrumental data. People are prone to a large number of physiological and psychological influences, which affect their performance in such exercises. These are described in detail in sensory texts (e.g. Stone and Sidel 1993), but they also affect performance of consumers in surveys. Although both forms of data are subject to relatively large error due to their origin, the extent of effects tends to be higher for consumer sources. Additionally, consumer data (sensory and survey) have much more variability due to individual characteristics in terms of likes and dislikes, opinions, beliefs, etc. Trained panel sensory data suffer less from error due to the training and constant monitoring procedures that are employed. Methods of evaluation of error sources are an important application to these latter data. Accepting the divisions above, there are three types of data that are relatively distinct in a number of ways (Table 10‐ Sensory and consumer data: relative differences in nature.Table 10). Trained panel data have a lower subjectivity as their nature approaches objectivity like an instrument, due to training and use of standards, etc. Again, this separation based on error level is not sacrosanct – some research points towards little difference – and consumer data should not be viewed as ‘inferior’ in this respect.
Figure 5‐ Sensory and Consumer Data
Table 10‐ Sensory and consumer data: relative differences in nature.
Sources Subjective nature Error level Analysis methods
Trained panel sensory Low Low Parametric
Consumer sensory High High Parametric, non‐parametric
Consumer survey High High Non‐parametric, parametric

©Vedpal Yadav, Lecturer in Food Technology, Government Polytechnic, Mandi Adampur, Hisar, Haryana, India‐125052. e‐mail‐ [email protected] +91‐9416589819 Page 68 of 134
5.6.2. Experimental design issues
Given the large number of possible sources of unwanted variation in such data (sensory and consumer), scientists must use experimental design to combat them. For experimentation with food units, all procedures in presentation of the samples must be controlled, in terms of unit size, shape, container, etc. The extent of this does depend on the characteristics of individual foods. The use of specially designed sensory booths is a feature of such control. These ensure minimisation of distraction and provide a calm environment for the assessment. More advanced versions include positive pressure conditions (to prevent ingress of foreign odours) and computer control of test instructions and data collection to obviate the errors that can occur during manual data collection. When participants assess all samples, related tests are used with the randomised complete block (RCB) being common. For consumer sensory trials, it is not usual for repeat sessions to be held, but for trained panels this is the norm. In the latter case, additional blocking can be used for repeat sessions.
5.6.3. Descriptive statistics
Once data are collected, they are in the form of a recorded list or a computer file. Organisation and analysis require that the data are entered or loaded into an analysis package. For the majority of examples in this book, Excel is used followed by Minitab and reference is made to Megastat for Excel. In all cases, data are entered as a column of numbers or categories (nominal data). A label or heading is assigned to identify the data and if necessary non‐numerical data can be coded as numbers for the purposes of analysis (NB: this does not change the level of measurement). Data are blocked in one or more columns and the sample size (n) is given. The name of the statistic is listed on the left and the formula is entered in the next cell to the right. The nature of the function used is displayed in the adjoining cell. Use of the Toolpak and some functions require variation from this, but data will always be identified and some guidance given. In some examples, statistics required in later calculations in the same table are identified by an abbreviated name for use in later formulae. Excel calculations produce values with many decimal points. In most circumstances, these are excessive considering the preciseness with which the original datawere measured. Additionally, readability is reduced. Thus, the majority of values are adjusted to display two decimal places, but any permanent rounding should not be done until the final result is obtained. Data layout for Minitab is similar and this is followed by selection of the particular graph, statistic or analysis method from a menu. Sample sizes are chosen to fit the circumstances wherever possible but some are limited for reasons of space (typically ten data values). The first stages of analysis are often those that summarise the data. Under this heading comes descriptive statistics, which are methods used to summarise the characteristics of a sample, e.g. the average value, but which also includes displays with graphs and tables. Excel charts are produced by selecting the column(s) of data and then choosing the Chart Wizard.
5.6.4. Worked example of paired preference test‐ Analysis of paired preference test by binomial method.
Initial prototypes (A and B) of a new product were examined by a small panel of consumers for preference. A paired preference test was used. Twenty‐seven participants completed the test and 20 out of the 27 chose the A product sample. Does this indicate preference of A over B? Paired preference test Objective: To establish whether two products differ in terms of preference Question: ‘Is there a significant difference between A and B in terms of preference?’ Experiment design: Paired design – 27 consumers presented with two subsamples of two products A and B, in balanced presentation order, coded with random three‐digit numbers Result: Sample Number preferring
A 20 B 7
Thus, there are 27 trials and 20 agreements Statistical hypotheses: H0 ProportionA = ProportionB (numbers preferring A = numbers preferring B) H1 ProportionA ≠ ProportionB (numbers preferring A or B are not equal; twotail)

©Vedpal Yadav, Lecturer in Food Technology, Government Polytechnic, Mandi Adampur, Hisar, Haryana, India‐125052. e‐mail‐ [email protected] +91‐9416589819 Page 69 of 134
Significant level α : 5% (0.05) Selection of test: Level of measurement is nominal; discrete data (counts); number of groups = 2, independent. Therefore non‐parametric test for two group proportions – binomial test. Calculation (Excel): Probability (two‐tail) due to chance: = (1−BINOMDIST (number of agreements−1, number of trials, 0.5, True)) × 2 = (1−BINOMDIST (19, 27, 0.5, True)) × 2 p = 0.0096 × 2 = 0.0192 (p < 0.05) Conclusion: H0 is rejected and H1 is accepted – there is a difference in preference: product sample A is preferred over B.
5.6.5. Analysis of consumer survey data
Questionnaires for testing of consumer food habits, views and opinions can include a wide variety of levels of measurement and scale forms. A few of the many possibilities, and data of interest in research, are listed below:
Types, forms, brands of food commodities and food products consumed
Frequency of consumption
Views, opinions, attitudes, beliefs on food issues, concepts, etc.
Food‐purchasing habits and intentions
Tests of food knowledge and awareness
Rating of factors important in food choice
Reasons for likes and dislikes
Demographic questions of importance in food habits
6. Objective Evaluation
Methods of evaluating food quality that depend on some measure other than the human senses are often called objective methods of evaluation.
6.1. Advantages
• Confidence can be gained as they are reproducible. • The results would be accurate. Human sensitivity is not involved. Minute differences can be noticed by doing objective tests. • They are less subjected to errors when compared to sensory methods. • These methods provide permanent record. So that comparison can be made over a period of time. • They are not affected by factors other than the one being measured. • Emotional burdens and individual ability can be overcome.
6.2. Disadvantages
• It is time consuming. • It is expensive. • Technical knowledge is required. • Instruments may not be available sometimes. • Some aspects of food cannot be evaluated by objective methods e.g., flavour. Usually both sensory and objective methods are done. Objective evaluation supplement or reinforce the data obtained subjectively through sensory evaluation.
6.3. Basic guidelines

©Vedpal Yadav, Lecturer in Food Technology, Government Polytechnic, Mandi Adampur, Hisar, Haryana, India‐125052. e‐mail‐ [email protected] +91‐9416589819 Page 70 of 134
6.3.1. Conduct all objective tests appropriate to the experiment for which equipment is available.
For example, checking the pH of mixtures prior to and after heating. This information often is valuable in explaining results. Flow properties of batters or certain other mixtures prior to heat treatment can be measured and that information used in interpreting and explaining results.
6.3.2. Obtain necessary testing devices.
In the preliminary testing phase of an experiment, analyse all steps in the preparation of the product and study the final product to determine whether there are specific characteristics that might be tested objectively if additional testing equipment could be procured or developed for the experiment.
6.3.3. Be meticulous about maintenance of objective equipment.
Before using any equipment, the good researcher will check to be certain the machine is operating correctly in all aspects.
6.3.4. Carefully define the samples to be used for objective testing.
A template of the item being tested often is an essential tool in obtaining comparable samples for objective tests. The dimensions of pastry or cookie samples being tested for tenderness on the Shortometer must be identical. To obtain these samples, the thickness of the mixture prior to baking must be controlled precisely.
6.3.5. Establish operating conditions for objective testing.
For example, the temperature of a starch paste being utihsed for a linespread test must be specific and controlled so that the effect of temperature on viscosity of starch pastes is not an uncontrolled variable in the measurement. Samples to be controlled in size, storage and temperature. Each experiment needs to be designated to eliminate uncontrolled variables in objective testing.
6.4. Evaluation Methods
6.4.1. Chemical Methods
Chemicals are estimated in food spoilage like peroxides in fats. Adulterants in food e.g., presence of starch in milk, metanil yellow in turmeric powder and loss of nutrients during cooking can be estimated.
6.4.2. Physico‐Chemical Methods
(a) Measurement of hydrogen ion concentration can be found by the use of pH meter. It utilizes a glass indicating electrode and a reference electrode to complete the electrical circuit.
(b) Sugar concentration can be found by refractometer. It is used to determine the concentration of a sugar solution. Light is refracted as it passes through sugar solution, with the specific values being calibrated in degrees, Brix, an indication of the percent of sucrose in the solution. Brix or Balling hydrometer gives directly the percentage of sugar by weight in the syrup. It is always necessary to make a temperature correction since the hydrometers are usually calibrated at 20°C. Each instrument used by canners usually covers a range of only 10°Brix, e.g. 10‐20, 20‐30, 30‐40, 40‐50, 50‐60 Brix respectively and are graduated in 1 / 10th divisions. Brix is defined as percent sucrose measured by a Brix hydrometer. Since continued use of hydrometers in hot syrups affects their accuracy, they should be checked frequently by more accurate instruments.
(c) Polariscope is used for quantitative analysis of sugar.
6.4.3. Microscopic Examination
Some properties of foods depend on their structure and valuable information can be obtained by microscopic examination. Some examples are given below.
1. Type of organisms present in fermented products like idli batter. 2. Examination of starch cells under the microscope for identification. 3. Spoilage of the food can be found out by observing the organisms under the microscope. 4. Size of crystals in sugar is related to smoothness of the product. 5. Number and size of the air cells in batters and foams.
©Vedpal Yadav, Lecturer in Food Technology, Government Polytechnic, Mandi Adampur, Hisar, Haryana, India‐125052. e‐mail‐ [email protected] +91‐9416589819 Page 71 of 134
6.4.4. Physical Methods
6.4.4.1. Weight
Weight of a food indicates the quality like in case of apple or egg.
6.4.4.2. Volume
Liquid volumes can be measured by using measuring cups. Solid food volume can be found by displacement method. In this method the volume can be calculated by subtracting the volume of seeds held by a container with a baked product from that of volume of seeds without the baked product. Usually mustard seeds are used.
6.4.4.3. Specific volume
The determination of specific volume of any product should be done with care and average of replicates is to be taken since experimental errors are likely to be large. Measurement of bulk volume in a porous and spongy product like idli is difficult. The volume may be measured by displacement with solvents like kerosene. The idli is given a momentary dip in molten wax to seal off the pores. Increase in volume is taken as the measure of its bulk volume. Specific volume = Bulk volume
Wt. of the substance
6.4.4.4. Index to volume
It can be found by measuring the area of a slice of food with a planimeter. It is important to use a slice that is representative of the product such as a centre slice. Index to volume is a measurement made by first tracing detailed outline of a cross section of the food. This tracing can be done with a sharply pointed pencil or a pen or by making a clear ink blot of the cross section. The ink blot is made simply by pressing the cross section of the sample lightly onto an inked stamp pad and then making the imprint of the inked sample on paper. A planimeter can also be used to trace the entire outline of the sample, being careful to follow all indentations and protrusions so that the final measure recorded on the planimeter represents the circumference of the slice.
6.4.4.5. Specific gravity
It is a measure of the relative density of a substance in relation to that of water. The measurement is obtained by weighing a given volume of the sample and then dividing that weight by the same volume of water. This technique is used for comparing the lightness of products physically unsuited to the volume measurements e.g., egg white foams. Potatoes with low specific gravity (waxy type potatoes) have cooking characteristics different from those of potatoes with a comparatively higher specific gravity.
6.4.4.6. Moisture
Press fluids: Initial weight of the sample is noted. After the appropriate pressure has been applied for a controlled length of time, the sample is again weighed. The difference between the two weights represents the amount of juice contained in the original sample e.g. juiciness of meats, poultry and fish. Drying: The weight of the original sample is determined and then the food is dried until the weight remains constant.
6.4.4.7. Wettability
Baked products can be tested for moisture level by conducting a test for wettability. For this test, the sample is weighed before being placed for 5 seconds in a dish of water. Immediately at the end of the lapsed time, the sample is removed from the water and weighed again to determine the weight gain. High moisture retention is synonymous with good wettability, a sign that a cake probably will be considered to be appropriately moist when judged subjectively.
6.4.4.8. Cell structure
Cell structure of baked products is an important characteristic to measure the uniformity, size and thickness of cell wars. Photocopies of cross‐sectional slices give this valuable information. This techniques gives third dimensional view into the cells on the cut surface of the sample and gives the actual size clearly.

©Vedpal Yadav, Lecturer in Food Technology, Government Polytechnic, Mandi Adampur, Hisar, Haryana, India‐125052. e‐mail‐ [email protected] +91‐9416589819 Page 72 of 134
Size of the grain: This can be found by using photography or ink prints with stamp pad or sand retention e.g. idli. Retention of sand is more if the grains are coarse. Cut the idii into 2 pieces and take one piece and press it on the stamp pad and take an impression on the paper. Ink prints may be less clear but satisfactory for some purposes.
Photography: This may be colour or black and white. They may not rep‐ resent the sample size so a marked ruler should be kept adjacent.
6.4.4.9. Colour Measurement
Colour is the first quality attribute a consumer perceives in food. Change of colour is generally accompanied by flavour changes.
Colour Dictionaries. The dictionary of Maerz and Paul is most commonly used. The dictionary consists of 56 charts. Seven main groups of hues are presented in order of their spectra. For each group there are 8 plates. In place of colour dictionary, colour reproduced on secondary standards such as painted test panels, rings, discs or plastic models may be used. A mask of neutral grey having two openings is used. The size of each opening should be equal to the size of the individual colour patch in the sheet. An opening should be placed over the sample and the other over different patches on the chart until a match is achieved and the colour is noted.
Disc colorimeter. Here the discs have radial slits so that a number of them may be slipped together with varying portions of each showing. The discs are spun on a spindle at about 2700 rpm so that the colours merge into a single hue without flickering. The test sample is placed adjacent to the spinning disc under controlled illumination and both are viewed simultaneously.
Coloured chips: A simple method is to match the colour of the food with the colour chips or colour glass, chart or colour tiles. This method is not very satisfactory as it is difficult to match the food with one small block of colour or the chart. The data are difficult to tabulate and analyse also.
Spectrophotometer: Visual matching of colours is subject to shortcomings of human observers. To overcome this spectrophotometer can be used. In this, tube with the liquid is placed in a slot and light of selected wavelength is passes through the tube. This light will be differentially absorbed depending upon the colour of the liquid and the intensity of the colour. Two liquids of exactly the same colour and intensity will transmit equal fractions of the light directed through them. If one of the liquid is a juice and the other is the juice diluted with water, the latter sample will transmit a greater fraction of the incoming light and this will cause a proportionately greater deflection of the sensing needle on the instrument. Such an instrument can also measure the clarity, cloudiness of a liquid depending on the amount of light the liquid allows to pass.
6.4.4.10. Texture Evaluation
Various instruments are used to measure the texture of liquids, semi solids and solids. Rheology is defined as the science of deformation and flow of matter. It has three aspects‐‐elasticity, viscous flow and plastic flow. The science of rheology deals with the measurement of various mechanical properties of foods. A study of Theological properties of foods is important, for two reasons.
(i) To determine the flow properties of liquid food stuffs. (ii) To ascertain the mechanical behaviour of solid foods when consumed and during processing.
6.4.5. Instruments used for Liquids and Semisolids.
The resistance or internal friction to the flow of liquids is normally known as viscosity. Viscosity or consistency is an important factor in influencing the quality of a large number of food products. The more important among these are cream style com, salad creams, tomato products, jellies, jams, mayonnaise, syrups, and fruit pulps where the acceptability largely depends on their having proper consistency or viscosity. Measurement of this factor for the raw material or the product at various stages of manufacture serves as an aid in checking or predicting the consistency of the final product. Further, such quality control measurements also serve as indicators in calculating the amount of an ingredient (thickening agent, etc.) that should be added in a particular food product. Duration and amount of heat applied in a process may also be suitably regulated to some extent by viscosity measurements as heat penetration and consistency are closely interrelated.

©Vedpal Yadav, Lecturer in Food Technology, Government Polytechnic, Mandi Adampur, Hisar, Haryana, India‐125052. e‐mail‐ [email protected] +91‐9416589819 Page 73 of 134
6.4.5.1. Percent Sag
The depth of a sample such as jelly is measured in its container by using a probe. The product then is unmoulded onto a flat plate. The greater the percent sag, the more lender is the gel. Percent Sag = (depth in container ‐ depth in plate) x 100 depth in container
6.4.5.2. Stromer viscometer
It is used to measure the viscosity or consistency of certain food products and to give an index of the resistance of the sample to flow. The number of seconds required for the rotor to make 100 revolutions has been used to measure the consistency of some food samples.
6.4.5.3. Brookfield Synchrolectric Viscometer
This is based on measurement of resistance to rotation of a spindle immersed in the test material. This can be used successfully in measuring the consistency of custards, pie fillings, tomato products, cream style corn, mayonnaise, salad dressings and dairy products.
6.4.5.4. Bostwick Consistometer
This is used for measuring the consistency of tomato ketchup and sauce. Bostwick consistometer consists of a channel (2 x l2") with sides which art high. It has triggered gate on one side. A centimeter scale is etched on floor of the channel. The use of this instrument is based on the theory that length of flow is proportional to consistency.
6.4.5.5. Efflux‐Tube Viscometer
It measures the time necessary for a quantity of fluid to pass through an orifice or capillary under standard pressure e.g. tomato puree.
6.4.5.6. Adams Consistometer
While this consistometer was designed primarily for measuring consistency of cream style com, there are possibilities of using it in measuring the consistency of other products like tomato puree, apple sauce and fruit pulps. The Adams consistometer has been designed and constructed to accommodate a greater mass and measure the unrestrained flow in au directions means of concentric circles. It consists of a large metal disc upon which i engraved 20 concentric circles, increasing 0.2,5 inches in radius. A steel truncated cone, which can be lifted vertically, fits tightly against the disc so C the circumference of the cone coincides with the inner most circles. Fill the cone with the sample to the level. Then raise the cone quickly and after 30 seconds, measure the consistency of the cream style corn by cording the extent of flow of the product at four equidistant points as indicated on the calibrated disc. Average the four values thus determined to obtain an average consistency value for the product. A simpler version of this principle is used in Line spread test.
6.4.5.7. Penetrometer
A penetrometer also may be used to measure tenderness of some foods. This device consists of a plunger equipped with a needle or a cone that is allowed to penetrate the sample by gravitational force for a selected period of time. The larger the reading the longer the distance the more tender is the product. Gels and many baked products are particularly well suited to tenderness measurements using the penetrometer. The Bloom gelometer is a special type of penetrometer in which lead shot drops into a cup which forces a plunder into the sample. When sufficient weight has been added to the cup to move the plunger a set distance, the test is completed and the amount of shot required is determined as the measure of the test.
6.4.5.8. Brabender Farinograph
This is used to measure the plasticity of wheat dough for preparing bread products. It is designed to study the physical properties of the dough by re‐ cording the force required to turn the mixer plates through the dough. The force required increases as the solution develops during mixing and later decreases as solution is slowly broken down by over mixing.

©Vedpal Yadav, Lecturer in Food Technology, Government Polytechnic, Mandi Adampur, Hisar, Haryana, India‐125052. e‐mail‐ [email protected] +91‐9416589819 Page 74 of 134
6.4.6. Instruments used for solids
Food texture can be reduced to measurements of resistance to force.
If we squeeze food so that it remains as one piece is called compression e.g. bread.
If we apply a force so that one part of the food slides past another it is shearing e.g. chewing gum.
If the force goes through the food so as to divide it as we call it cutting e.g. cutting an apple.
If the force is applied away from the material, the food pulls apart by which we measure tensile strength e.g. chapathi.
6.4.6.1. Magness‐Taylor Pressure tester (compression)
It consists of a plunger of variable diameter which is pressed into the fruit to a given depth. The sprint attached to the plunger contracts and measures the compression force e.g. peas (suitability of peas for the harvest or to find out the correct stage of ripening of a food).
6.4.6.2. Succulometer (compression)
This instrument is used to measure the maturity of corn and storage quality of apples as determined by the volume of juice extracted under controlled conditions of pressure and time.
6.4.6.3. Tenderometer (compression and shearing)
This is an example of an instrument based on shearing force in which compression is preceded by shearing action e.g. suitability of peas for preservation.
Picture 25‐ Types of Resistance to Force
6.4.6.4. Fibrometer
This is based on the cutting principle and used to differentiate mature stocks from the tender stocks e.g. green beans.

©Vedpal Yadav, Lecturer in Food Technology, Government Polytechnic, Mandi Adampur, Hisar, Haryana, India‐125052. e‐mail‐ [email protected] +91‐9416589819 Page 75 of 134
6.4.6.5. Shortometer
This device consists of a platform containing two parallel, dull blades on which the sample rests. A third blade is actuated by a motor to press down on the sample until the sample snaps. The force required to break the sample is the measure of the tenderness of the product.
6.4.6.6. Christal Texturometer (cutting)
This is designed with series of rods which are pushed into the meat sample. The harder the meat more force is required to Penetrate.
6.4.6.7. Volodkevich bite tenderometer (cutting and shearing)
This attempts to imitate the action of teeth on food. It records the force of biting on a piece of food which results in deformation and this determines the total energy utilised for this deformation e.g. meat and meat products.
Grinding and extensibility: The power used by a household food grinder is measured. Increased tough‐ ness would increase the current consumption of the grinder. Extensibility has proved to be inversely related to tenderness.
6.4.6.8. Kramer shear press
This is a multipurpose instrument with same power unit and with different test cell assemblies. This instrument is widely used.
6.4.7. Fundamental Parameters
Table 11‐ Glossary of Food Texture Testing Terminology
Parameter Sensorial Definition Instrumental Definition Units
Parameters as Denoted within Original Szczesniak et al (1963) and Bourne (1978) TPA Work
Primary 5 basic parameters utilized in determining the manner in which a food handles and behaves in the mouth.
Hardness Force required compressing a food between the molars. Defined as force necessary to attain given deformation.
Peak force of the first compression cycle. Max force may occur when sample breaks, or it may occur later in the cycle as the sample is flattened and deformed to a high given deformation.
Newtons (N)
Springiness Rate at which a deformed material goes back to its undeformed condition after the deforming force is removed
Height that the food recovers during the time that elapses between the end of the first bite and the start of the second bite.
Meters (m)
Adhesiveness The work necessary to overcome the attractive forces between the surface of the food and the surface of other materials with which the food comes into contact (e.g. tongue, teeth, palate). Work required to pull food away from a surface.
The negative area for the first bite, representing the work necessary to pull the compressing plunger away from the sample. Positioning of probe must ensure break is formed on retraction.
Joules(J)
Cohesiveness The strength of internal bonds making up the body of the product (greater the value the greater the cohesiveness)
The ratio of positive force during the second to that of the first compression cycle (downward strokes only)
Ratio Dimensionless
Viscosity Force required to draw a liquid from a spoon over the tongue
Rate of flow per unit force

©Vedpal Yadav, Lecturer in Food Technology, Government Polytechnic, Mandi Adampur, Hisar, Haryana, India‐125052. e‐mail‐ [email protected] +91‐9416589819 Page 76 of 134
Table 11‐ Glossary of Food Texture Testing Terminology
Parameter Sensorial Definition Instrumental Definition Units
Secondary 3 additional parameters included to make characterization as meaningful as possible to individuals accustomed to popular terminology, whilst retaining rheological principles.
Fracturability (Brittleness)
Force at which a material fractures. Related to the primary parameters of hardness and cohesiveness, where brittle materials have low cohesiveness. Not all foods fracture and thus value may relate to hardness if only single peak is present. Brittle foods are never adhesive.
The first significant break in the first compression cycle. Taken as first peak force prior to force dropping by at least 5%.
Newtons(N)
Gumminess Energy required disintegrating a SEMI‐SOLID food product to a state ready for swallowing. Related to foods with low hardness levels.
Calculated parameter: Product of Hardness x Cohesiveness Semi‐solid products undergo permanent deformation and have no springiness.
Newtons (N)
Chewiness Energy required chewing a SOLID food product to a state where it is ready for swallowing. Attribute is difficult to quantify precisely due to complexities of mastication e.g. saliva at body temp. with a variety of force actions (shear, compression, grinding, tearing and penetration).
Calculated Parameter: Product of Gumminess x Springiness (essentially primary parameters of Hardness x Cohesiveness x Springiness)
Joules (J)
Table 12‐ Instruments Used in Texture Analysis
Texture Parameter
Type of TextureMeasuring Device
Instrument
Firmness Penetrometer Magness‐Taylor Fruit Pressure tester, Christel Texturometer, Maturometer, modified Cherry‐burrell Meter Instron
Resistance to compression
Compressimeter Baker Compressimeter
Tenderness Shearing devices Christel Texturometer, Allo‐Kramer Shear Press, Lee‐Kramer Shear Press, Warner‐Bratzler Shear Press, Pabst Texture Tester, Dassow's Shear‐jaw Device, Texture Analyzer
Cutting firmness Cutting device Asparagus Fiberometer, Cherry Burrell Curd, Tension Meter
Texture close to mastication (firmness, hardness, cohesiveness, crispness, springiness)
Masticometer Volodkevich bits Tenderometer, Denture Tenderometer, MIT Denture Tenderometer, General Foods Texturometer, Allo‐Kramer Shear Press
Hardness, crispness Shortometer
Extrusion Extrusion FIRA/NIRD Extruder
Resistance to flow Viscosity, capillary Ostwald Viscometer, Cannon‐Fenske Viscometer, Lamb Capillary Viscometer, Continuous Puree Consistometer
Resistance to flow Viscosity, rotational MacMichael ViscometerBrookfield ViscometerVibratory ViscometerZahn Viscometer

©Vedpal Yadav, Lecturer in Food Technology, Government Polytechnic, Mandi Adampur, Hisar, Haryana, India‐125052. e‐mail‐ [email protected] +91‐9416589819 Page 77 of 134
Table 12‐ Instruments Used in Texture Analysis
Texture Parameter
Type of TextureMeasuring Device
Instrument
Resistance to flow Viscosity, other Haake Rotovisko Viscometer, Hoeppler Viscometer, Brabender Visco/Amylograph, Parten‐Magberg Falling Number, Stromer Viscometer
Consistency of semi‐solid
Consistometer Adams Consistometer, Bostwick Consistometer, Brabender Amylograph, Kramer Shear Press, Rotovisco Rheometer
Elasticity Extension, elasticity Brabender Extensograph, Chopin Alveograph, Simon "Research" Extensometer, Mixograph, Brabender Farinograph, Resistograph, Rheograph
Gel strength Empirical methods Bloom Gelometer, Boucher Electronic Jelly Tester, F.I.R.A. Jelly Tester, Exchange Ridgelimeter
Gel strength Fundamental tests Weissenberg Rheogoniometer, Air Turbine Viscometer, Parallel Plate Viscoclastometer, "u" tube, Freely oscillating float, Velocity of propagation of transverse waves, Tin‐walled aluminum tube immersed in gel oscillated electromagnetically, Chainomatic balance relaxometer, Oscillating Concentric Cylinder
Gel strength Multipurpose units Instron Universal Testing Machine, Food Technology's Texture Test, System (Kramer Shear Press), General Foods Texturometer
Table 13‐ Instruments in Food Analysis
Image Information/Resources
These are a number of many temperature measuring devices. Since so much of food quality is influenced by temperature it is important to select one of these devices to quantitate the history.
The thermocouple is essentially two different metals joined at one end and hooked up to some voltage detector at the other. This particular thermocouple is made of copper and constantan. It is hooked to a temperature recorder which converts the voltage into temperature.
There are a number of different types of thermometers. This is a griddle thermometer.

©Vedpal Yadav, Lecturer in Food Technology, Government Polytechnic, Mandi Adampur, Hisar, Haryana, India‐125052. e‐mail‐ [email protected] +91‐9416589819 Page 78 of 134
Table 13‐ Instruments in Food Analysis
Image Information/Resources
This is the line source set‐up which allowed the gathering of data to calculate the thermal conductivity and thermal diffusivity. Essentially, it consists of a wire of known resistance and length where one can send a voltage down. This voltage will cause a temperature change in the sample around the wire. Also, within a set distance there is a thermocouple to measure the temperature change. Through the fantastic process of computerization and the expertise of mechanical engineering, thermal properties can be calculated from this data.
The pycnometer is a little known device to measure specific gravity of foam products. The advantage is that one can put the sample into the small container, screw on the lid, wipe off the extra sample that comes out the top and weigh the totality. This can be compared to the previous weight of water.
Specific gravity of fruits and vegetables, such as potatoes, can be determined by using solutions of various salt concentrations.
Measuring of distance can be done with Vernier calipers.
Certainly, a ruler is an effective crude method of evaluating length, width or other distance parameters.
This visopan allows for projection on a screen of microscopic slides/materials/and such.

©Vedpal Yadav, Lecturer in Food Technology, Government Polytechnic, Mandi Adampur, Hisar, Haryana, India‐125052. e‐mail‐ [email protected] +91‐9416589819 Page 79 of 134
Table 13‐ Instruments in Food Analysis
Image Information/Resources
History, quality control and experimental control can be assisted with by the weighing of ingredients. In this particular picture, the cake batter is being weighed as it is placed in the pan.
7. Total Quality Management (TQM)
Total Quality Management (TQM), a buzzword phrase of the 1980's, has been killed and resurrected on a number of occasions. The concept and principles, though simple seem to be creeping back into existence by "bits and pieces" through the evolution of the ISO9001 Management Quality System standard.
Companies who have implemented TQM include Ford Motor Company, Phillips Semiconductor, SGL Carbon, Motorola and Toyota Motor Company.
The latest changes coming up for the ISO 9001:2000 standard’s "Process Model" seem to complete the embodiment. TQM is the concept that quality can be managed and that it is a process. The following information is provided to give an understanding of the key elements of this process.
Total Quality Management (TQM) involves
Total = Quality involves everyone and all activities in the company.
Quality = Conformance to Requirements (Meeting Customer Requirements).
Management = Quality can and must be managed.
TQM = A process for managing quality; it must be a continuous way of life; a philosophy of perpetual improvement in everything we do.
7.1. TQM as a Foundation
TQM is the foundation for activities which include;
Meeting Customer Requirements
Reducing Development Cycle Times
Just In Time/Demand Flow Manufacturing
Improvement Teams
Reducing Product and Service Costs
Improving Administrative Systems Training
7.2. Ten Steps to Total Quality Management (TQM)
Pursue New Strategic Thinking
Know your Customers
Set True Customer Requirements
Concentrate on Prevention, Not Correction
Reduce Chronic Waste

©Vedpal Yadav, Lecturer in Food Technology, Government Polytechnic, Mandi Adampur, Hisar, Haryana, India‐125052. e‐mail‐ [email protected] +91‐9416589819 Page 80 of 134
Pursue a Continuous Improvement Strategy
Use Structured Methodology for Process Improvement
Reduce Variation
Use a Balanced Approach
Apply to All Functions
7.3. Principles of TQM
Quality can and must be managed.
Everyone has a customer and is a supplier.
Processes, not people are the problem.
Every employee is responsible for quality.
Problems must be prevented, not just fixed.
Quality must be measured.
Quality improvements must be continuous.
The quality standard is defect free.
Goals are based on requirements, not negotiated.
Life cycle costs, not front end costs.
Management must be involved and lead.
Plan and organize for quality improvement.
Processes must be Managed and Improved
7.4. TQM involves
Defining the process
Measuring process performance (metrics)
Reviewing process performance
Identifying process shortcomings
Analyzing process problems
Making a process change
Measuring the effects of the process change
Communicating both ways between supervisor and user
7.5. TQC and TQM
Total Quality Control (TQC) is not a new concept. The orginal book entitled 'Total Quality Control' was written by Armand Feigenbaum, in 1951, where he noted the universal importance of quality to customers: "Quality is the basic customer decision factor for an explosively growing number of products and services today‐‐whether the buyer is a housewife, an industrial corporation, a government agency, a department store chain or a military defense program." As a result, he proposed that quality be move out of the factory floor, where it mostly lived then, and into the rest of the company. In his words (and his italics): "Quality is in its essence a way of managing the organization." It was thus an extension of Quality Control (QC) to the totality of the whole company. The term TQC was not, however, a term that sat well with American management, so some kind soul converted it into TQM, or Total Quality Management. BS.4778:Part 2(1991) described it as: 'A management philosophy embracing all activities through which the needs and expectations of the customer and the community and th4 objectives of the organization are satisfied in the most efficient and cost effective way by maximizing the potential of all employees in a continuing drive for improvement.' TQM was well accepted and became a very popular worldwide fad. However, as with most fads, the basics were sound but the implementation in the majority of companies was fundamentally flawed. So, for many firms, the round of blaming took its usual course, with most fingers pointed on the fad and any handy consultants or internal people who had nailed their colors too high on the mast.

©Vedpal Yadav, Lecturer in Food Technology, Government Polytechnic, Mandi Adampur, Hisar, Haryana, India‐125052. e‐mail‐ [email protected] +91‐9416589819 Page 81 of 134
This, of course, is excellent news for companies who are serious about quality. Whilst the benefits of a temporary quality focus fade into the cost‐cutting dust, the real players will reap the real rewards. System for optimizing production based on ideas developed by Japanese industries from the 1950s on.The system, which blends Western and Eastern ideas, began with the concept of quality circles, in which groups of 10–20 workers were given responsibility for the quality of the products they produced. It gradually evolved into various techniques involving both workers and managers to maximize productivity and quality, including close monitoring of staff and excellent customer service. The concept of kaizen, the notion that improvement must involve all members of a company, is central to TQC
8. Food Laws and Standards
Effective means of food quality can be achieved by legislative measures, certification schemes and public participation and involvement in the programme. The Government of India is fully aware to the possibilities of food being adulterated. It has therefore, empowered several agencies and promulgated a number of acts and orders to contract this menace. Agencies and institutions have also been created to lay down standards for the quality of foods. The manner in which the food is processed and packaged is also covered by a number of regulations.
8.1. Prevention of Food Adulteration Act
One of the early acts to be promulgated in this connection was the Prevention of Food Adulteration Act of 1954, which has been in force since June 1, 1955. The objective of this act was to ensure that food articles sold to the customers are pure and wholesome. It also intended to prevent fraud or deception and encourages fair trade practices. The act was amended in 1964 and again in 1976 in the light of experience gained, to plug loopholes of escape in the Act and to insure stringent punishment for those indulging in this nefarious practice. The act prohibits the manufacture, sale and distribution of not only adulterated foods but also foods contaminated with microorganisms and toxicants and misbranded foods. P.F.A. specifies microbial standards for pasteurised milk, milk powder, skimmed milk powder, infant milk food, tomato sauce, jam, malted milk food and aflatoxin for ground nut. A central food laboratory established under the Act is located at Calcutta for the purpose of reporting on suspected food products. The Central Food Technological Research Institute, Mysore, has also been recognised as another laboratory for the testing of adulterated foods for the Southern Regions. A central committee for food standards has been constituted under the Act and has been charged with the function of advising the Central Government on matters relating to the Food standards. Provisions have been made in the Act for the appointment of Food Inspectors by the state Governments and their powers have been defined. The State Government will set up food testing laboratory and will appoint Public Analysts with adequate staff to re‐ port on suspected foods. According to the Prevention of Food Adulteration Act, an article of food shall be deemed to be adulterated.
If the article sold by a vendor is not of the nature, substance or quality demanded by the purchaser and is to his prejudice, or is not of the nature, substance of quality which it purports or is represented to be.
If the article contains any other substance which affects, or if the article is so processed as to affect injuriously the nature, substance or quality there of.
If any inferior or cheaper substance has been substituted wholly or in part for the article, so as to affect injuriously the nature, as substance or quality there of.
If any constituent of the article has been wholly or in part abstracted so as to affect injuriously the nature, substance or quality there of.
If the article had been prepared, packed or kept under unsanitary conditions whereby it has become contaminated or injurious to health.

©Vedpal Yadav, Lecturer in Food Technology, Government Polytechnic, Mandi Adampur, Hisar, Haryana, India‐125052. e‐mail‐ [email protected] +91‐9416589819 Page 82 of 134
If the article consists wholly or in part of any filthy, putrid, disgusting, rotten, decomposed or diseased animal or vegetable substance or is insect‐infested or otherwise unfit for human consumption.
If the article is obtained from a diseased animal.
If the article contains any poisonous and ingredient which renders its contents injurious to health.
If the container of the article is composed, whether wholly or in part of any poisonous or deleterious substance which renders its contents injurious to health.
If any colouring matter other than that prescribed in respect there of and in amounts not within the prescribed limits of variability is present in the article.
If the article contains any prohibited preservative or permitted preservative in excess of the prescribed limits.
If the quality or purity of the article falls below the prescribed standard or its constituents are present in quantities which are in excess of the prescribed limits of variability.
8.1.1. Administrative hierarchy
The Food Health Authority is appointed at state level who is the Director of Public Health and Preventive Medicine. He is responsible for the good quality and standards of foods available to the consumers. Under FHA there is a Local Health Authority appointed in, each city in every state. The Food Inspector is appointed by the Central or State Government by notification in official gazette. The Food Inspector undergoes a three months training in food inspection and sampling.
8.1.2. Powers of food inspectors
1. To take sample of any food article from (a) Any person selling such article. (b) Any person who is in the course of delivering or preparing to deliver such article to a
purchaser or consignee. (c) A consignee after delivering of any such article to him.
2. To send such sample for analysis to the Public Analyst (PA) of local area When the Food Inspector wants to lift suspected food the shop keeper must first be told. There should be a witness present when the Food Inspect( lifts the sample. 150g of the sample is necessary to be sent for analysis. 600g of sample is collected usually and sent to Ripon Buildings, Corporation of Madras, or Kings’ Institute, Guindy, Madras or Central Food Laboratory, Calcutta or Central Food Technological Research Institute, Mysore. There is certain procedure to collect the sample and seat it in a bottle. The sealed boil has a label on it in which the code number of the Inspector, address of t shop and date and time of collection are written.
When individuals doubt adulteration in food stuffs they have to inform the Food Health Authority. Samples can be sent for analysis only after getting order from Food Health Authority. If persons are found guilty of selling such adulterated food, the persons involved can be convicted. Severity of sentence would depend on the gravity of the offence. For example, a vendor found adulterating the food with ingredients injurious to health would to liable for a much heavier sentence than a vendor involved in only mixing an inferior ingredient not injurious to health.
8.2. Fruit Products Order
The Government of India promulgated a Fruit Products order in 1946. In 1955, the order was revised. The Fruit Products order (FPO) lays down statutory minimum standards in respect of the quality of various fruits and vegetable products and processing facilities. Packaging fruits and vegetables of a standard below the minimum prescribed standards is an offence punishable by law. Periodic inspection by government inspectors in registered establishments is carried out to ensure conformity of standards by processors. This order is operated by the Food and Nutrition Board of the Ministry of Food Processing Industries. Manufacture of labelling of fruit and vegetable products can be carried out only after a valid licence is issued by the licensing officer after himself satisfying with regard to the quality of product, sanitation, personnel, machinery and equipment, work area as required in the order. Licensee is empowered to put the FPO standard mark on the product.
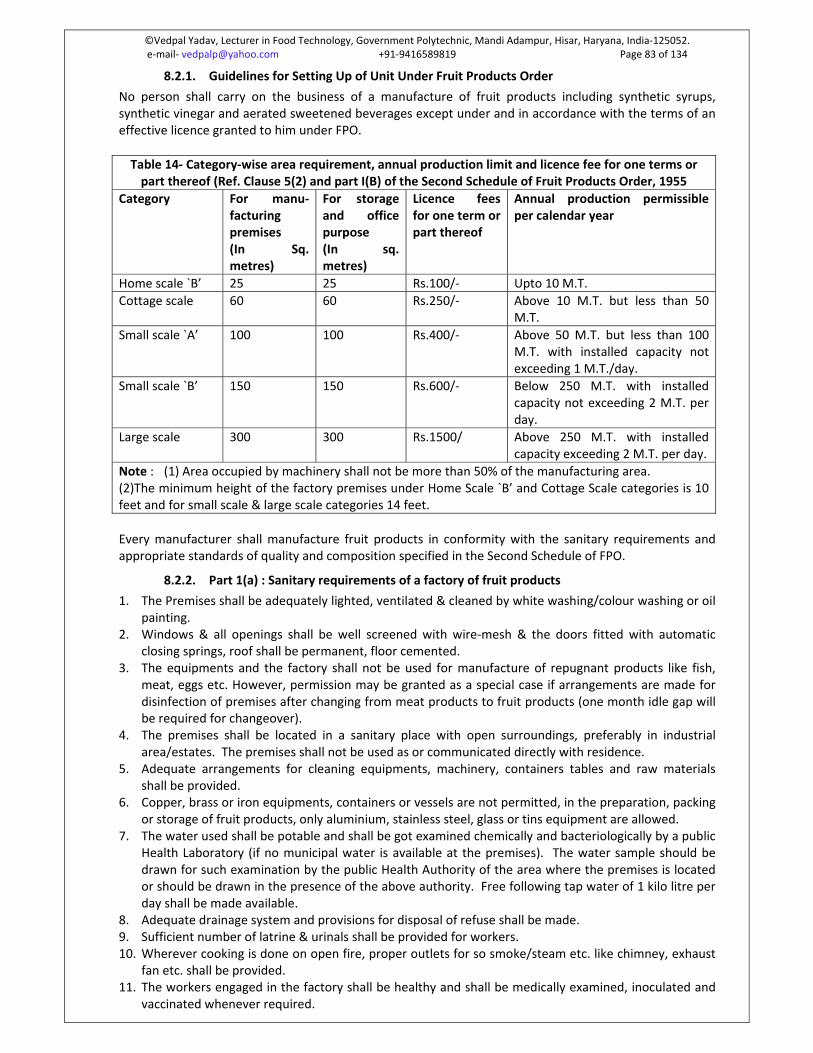
©Vedpal Yadav, Lecturer in Food Technology, Government Polytechnic, Mandi Adampur, Hisar, Haryana, India‐125052. e‐mail‐ [email protected] +91‐9416589819 Page 83 of 134
8.2.1. Guidelines for Setting Up of Unit Under Fruit Products Order
No person shall carry on the business of a manufacture of fruit products including synthetic syrups, synthetic vinegar and aerated sweetened beverages except under and in accordance with the terms of an effective licence granted to him under FPO.
Table 14‐ Category‐wise area requirement, annual production limit and licence fee for one terms or part thereof (Ref. Clause 5(2) and part I(B) of the Second Schedule of Fruit Products Order, 1955
Category For manu‐facturing premises (In Sq. metres)
For storage and office purpose (In sq. metres)
Licence fees for one term or part thereof
Annual production permissible per calendar year
Home scale `B’ 25 25 Rs.100/‐ Upto 10 M.T.
Cottage scale 60 60 Rs.250/‐ Above 10 M.T. but less than 50 M.T.
Small scale `A’ 100 100 Rs.400/‐ Above 50 M.T. but less than 100 M.T. with installed capacity not exceeding 1 M.T./day.
Small scale `B’ 150 150 Rs.600/‐ Below 250 M.T. with installed capacity not exceeding 2 M.T. per day.
Large scale 300 300 Rs.1500/ Above 250 M.T. with installed capacity exceeding 2 M.T. per day.
Note : (1) Area occupied by machinery shall not be more than 50% of the manufacturing area. (2)The minimum height of the factory premises under Home Scale `B’ and Cottage Scale categories is 10 feet and for small scale & large scale categories 14 feet.
Every manufacturer shall manufacture fruit products in conformity with the sanitary requirements and appropriate standards of quality and composition specified in the Second Schedule of FPO.
8.2.2. Part 1(a) : Sanitary requirements of a factory of fruit products
1. The Premises shall be adequately lighted, ventilated & cleaned by white washing/colour washing or oil painting.
2. Windows & all openings shall be well screened with wire‐mesh & the doors fitted with automatic closing springs, roof shall be permanent, floor cemented.
3. The equipments and the factory shall not be used for manufacture of repugnant products like fish, meat, eggs etc. However, permission may be granted as a special case if arrangements are made for disinfection of premises after changing from meat products to fruit products (one month idle gap will be required for changeover).
4. The premises shall be located in a sanitary place with open surroundings, preferably in industrial area/estates. The premises shall not be used as or communicated directly with residence.
5. Adequate arrangements for cleaning equipments, machinery, containers tables and raw materials shall be provided.
6. Copper, brass or iron equipments, containers or vessels are not permitted, in the preparation, packing or storage of fruit products, only aluminium, stainless steel, glass or tins equipment are allowed.
7. The water used shall be potable and shall be got examined chemically and bacteriologically by a public Health Laboratory (if no municipal water is available at the premises). The water sample should be drawn for such examination by the public Health Authority of the area where the premises is located or should be drawn in the presence of the above authority. Free following tap water of 1 kilo litre per day shall be made available.
8. Adequate drainage system and provisions for disposal of refuse shall be made. 9. Sufficient number of latrine & urinals shall be provided for workers. 10. Wherever cooking is done on open fire, proper outlets for so smoke/steam etc. like chimney, exhaust
fan etc. shall be provided. 11. The workers engaged in the factory shall be healthy and shall be medically examined, inoculated and
vaccinated whenever required.

©Vedpal Yadav, Lecturer in Food Technology, Government Polytechnic, Mandi Adampur, Hisar, Haryana, India‐125052. e‐mail‐ [email protected] +91‐9416589819 Page 84 of 134
12. The workers shall be provided with aprons, head‐wars gloves etc. and shall be personally neat and tidy.
8.2.3. Part 1(B) : Qualifications of technical staff
Production shall be supervised by a person possessing one of the following qualifications: Small scale : (1)B.Sc. with Chemistry/Agriculture as one of the subjects.
(2)A Diploma or a certificate in fruit preservation or a course of at least 3 months duration from a recognized institution.
Large scale : (1)B.Sc.(Tech.) with Food Technology/Chemical Engineering with at least one year experience in fruit preservation factory. (2)B.Sc. with CFTRI Diploma or Diploma of Kalamassery (Kerala Government) Polytechnic. (3)B.Sc. with Chemistry/Agriculture with three years experience in fruit preservation factory.
8.2.4. Minimum equipments & machinery for unit operation
Table 15‐ Minimum equipments & machinery for unit operation
1. Washing of raw materials 1) Rectangular tanks with false bottom of not less than 20 gallons capacity
2. Washing of bottles 1) Tanks having not less than 40 gallons capacity.2) Bottle washing machine, brushes (*machine, rack,
trolley). 3) Buckets (* Sterlising tanks).
3. Preparation of Fruit/Veg. 1) 2‐1/2 Ft. high table with aluminium/ steel top having area not less than 20 Sq. ft.
2) Not less than 12 trays. 3) Stainless steel knives. 4) Equipment for blanching
4. Juicing, pulping & Mising 1) Juice extractor of basket press (* pulping machine/hydraulic press).
2) Steet sieve. 3) Vessels of not less than 100 litres capacity.
5. Processing 1) Furnace/Gas stoves (* Boiler) 2) Vessels/Steam jacket kettle. 3) Ladle. 4) Thermometer, hydrometer (Refractometer) 5) Sensitive balance for weighing chemicals, colour etc.
6. Fermentation 1) Barrels/Carboys/Earthen jars.
7. Filling & sealing 1) Mugs/Funnels (* Filling machine). 2) Crown cork machine/R.O. sealing machine. 3) Weighing balance.
8. Exhausting, Processing for cans & bottles.
1) Tanks with crates/Exhaust Box. 2) Double Seamer/Semi‐automatic can sealer. 3) Cooling tanks with crates/cranes. 4) Pressure cooker/retorts/sterilising equipments. 5) Incubator/pressure can tester. 6) * Pasteuriser.
9. Carbonation or aeration 1) Power driver aerated machine or semi‐automatic aerating and sealing machine.
Note ‐ * Required for Small Scale and Large Scale units only.
8.3. Bureau of Indian Standards
8.3.1. Introduction
Food is the basic need of all living organisms and hence, its quality is of top priority. Food processing involves number of unit operations for material handling and there are always chances that the food may be contaminated or adulterated. The food is said to be contaminated if food is injurious to health and

©Vedpal Yadav, Lecturer in Food Technology, Government Polytechnic, Mandi Adampur, Hisar, Haryana, India‐125052. e‐mail‐ [email protected] +91‐9416589819 Page 85 of 134
contain filthy, putrid rotten odour of insect pests etc. and hazards may occur. However, a food is said to be adulterated if it contains any other substance which affects the nature and quality product or substance is substituted with cheaper substance. So, it is essential to set the minimum limits of the desirable characteristics required and the maximum limits of the undesirable components that the food should contain. This helps to set common standards for commodities and to prevent confusion among the consumers.
8.3.1.1. Why Food Standards?
Food Standards are for the following reasons:
The contamination of food can affect a large number of populations at a time and hazards may occur. So standards are needed to prevent the transmission of the diseases.
Consumer must get the product for which he has paid and to limit the sale of unsatisfactory products.
The processors may add any prohibited preservative or permitted preservative in excess of the prescribed limits. So standards are needed to check such malpractices.
To set common standards for commodities and prevents confusion among consumers.
To simplify the marketing of food.
Standards are made to set the limits of the preservatives / additives / method of applications for production of the quality product to sell it nationally or internationally.
Standards are made to prevent adulterations of food products.
8.3.1.2. Why Food Laws?
Food Laws are for the following reasons:
To maintain the quality of the food produced in the country.
To prevent exploitation of the consumers by the sellers.
To safeguard the health of the consumers.
To establish criteria for quality of the food products.
8.3.2. Quality Standards
Quality standards in relation to any food article of food mean the standards notified by the Food Authority. Governmental or Private bodies that establish standards may be the subject of a certification programme. Food quality standards are the body of rules directly concerning foodstuffs, whether they take the form of official, semiofficial or factory form, and whatever the aspect treated, from food ingredients to retail marketing. So, number or agencies and organization are involved at national and international level to make the standards implement and regulate them. The four standards which are commonly used as shown below:
Figure 6‐ Commonly Used Standards in Food Industry
8.3.2.1. Legal Standards
These are established by federal, central, state or municipal agencies and are generally mandatory. These are set up by the law or through regulation. They generally concerned with freedom from adulteration by insects, mould, yeasts and pesticides.
8.3.2.2. Company or Voluntary Standards
These are established by various segments of the food industry. These standards generally represent consumer image and become symbol of product quality. These are used by private firms or supermarkets.
Quality Standards
Legal Standards
Company or Voluntary Standards
Industry Standards
Consumer or Grade Standards

©Vedpal Yadav, Lecturer in Food Technology, Government Polytechnic, Mandi Adampur, Hisar, Haryana, India‐125052. e‐mail‐ [email protected] +91‐9416589819 Page 86 of 134
8.3.2.3. Industry Standards
These standards are established by an organizational group to maintain the quality of the given commodity. These standards become effective by pressure where other legal standards are not involved.
8.3.2.4. Consumer or Grade Standards
These standards represent consumer's requirements of the product and generally based on the experience of the industry for consumers. Out of these, the legal standards are most important. The government empowered agencies promulgated a number of acts and orders to minimise the menace. Several agencies and institutions have also been created to lay down standards for the quality of foods. The manner in which the food is processed and packaged is also covered by a number of regulations. Several types of standards apply for evaluation, testing and monitoring dietary supplements. The food standards and their regulations are used as yardsticks for assurance of the food safety and consumer health. These standards encourage the safety and quality of the products by manufacturer, making sure that the food product meets the desired standards. Different countries have different standards based on the type of product being manufactured, environmental and cultural practices, raw material etc. So, in India, food manufacturer follow Indian standard to sell their products in the domestic markets and international standard to export the products out of country. The Bureau of Indian Standards (BIS) is the national Standards Body of India working under the aegis of Ministry of Consumer Affairs, Food & Public Distribution, Government of India. It is established by the Bureau of Indian Standards Act, 1986 which came into effect on 23 December 1986. The Minister in charge of the Ministry or Department having administrative control of the BIS is ex‐officio President (Emaad Amin) of the BIS. The organization was formerly the Indian Standards Institution (ISI), set up under the Resolution of the then Department of Industries and Supplies No. 1 Std.(4)/45, dated 3 September 1946. The ISI was registered under the Societies Registration Act, 1860. As a corporate body, it has 25 members drawn from Central or State Governments, industry, scientific and research institutions, and consumer organizations. Its headquarters are in New Delhi, with regional offices in Kolkata, Chennai, Mumbai, Chandigarh and Delhi, and 20 branch offices. It also works as WTO‐TBT enquiry point for India. The Bureau of Indian Standards operates a Certification Mark Scheme under the BIS Act, 1986. ‐Standards covering more than 450 different food products have been published. Standards are laid for vegetable and fruit products, spices and condiments, animal products and processed foods. Once these standards are accepted, manufacturers whose products conform to these standards are allowed to use BIS label on each unit of their product. The products are checked for quality by the BIS in their own network of testing laboratories at Delhi, Bombay, Calcutta, Madras, Chandigarh and Patna or in a number of public and private laboratories recognised by them. The certification scheme is basically voluntary in character but for a number of items affecting, it has been made compulsory by the Government of India through various statutory measures such as E.C. Act or PFA rules. Some of the items which require compulsory BIS certification under PFA are:
Food colours and food colour preparation
Natural food colours
Food additives
Infant milk food
Infant formula
Milk cereal based weaning food
Milk powder
Condensed milk
8.3.3. Association with International Standards Bodies
BIS is a founder member of International Organisation for Standardization (ISO) It represents India in ISO,the International Electrotechnical Commission (IEC), the International Telecommunication Union (ITU) and the World Standards Service Network (WSSN)

©Vedpal Yadav, Lecturer in Food Technology, Government Polytechnic, Mandi Adampur, Hisar, Haryana, India‐125052. e‐mail‐ [email protected] +91‐9416589819 Page 87 of 134
8.3.4. Standard Formulation & Promotion
One of the major functions of the Bureau is the formulation, recognition and promotion of the Indian Standards. As on 31 March 2008, 18446 Standards formulated by BIS, are in force. These cover important segments of economy, which help the industry in upgrading the quality of their products and services. BIS has identified 14 sectors which are important to Indian Industry. For formulation of Indian Standard, it has separate Division Council to oversee and supervise the work. The Standards are regularly reviewed and formulated in line with the technological development to maintain harmony with the International Standards.
8.3.5. Laboratories
To support the activities of product certification, BIS has a chain of 8 laboratories. These laboratories have established testing facilities for products of chemical, food, electrical and mechanical disciplines. Approximately, 25000 samples are being tested in the BIS laboratories every year. In certain cases where it is economically not feasible to develop test facilities in BIS laboratories and also for other reasons like overloading of samples, equipment being out of order, the services of outside approved laboratories are also being availed. Except for the two labs, all the other labs are NABL (National Accreditation Board for Testing and Calibration Laboratiories) accredited. It operates a laboratory recognition scheme also.
8.3.6. Product Certification Scheme
Product Certifications are to be obtained voluntarily. For, some of the products like Milk powder, Drinking Water, LPG Cylinders, Thermometers etc., certification is mandatory. Because these products are concerned with health and safety.
8.3.7. Scheme‐Foreign Manufacturers
All foreign manufacturers of products who intend to export to India are required to obtain a BIS product certification license. Towards this, BIS launched its Product Certification Scheme for overseas manufacturers in the year 1999. Under the provisions of this scheme, foreign manufacturers can seek certification from BIS for marking their product(s) with BIS Standard Mark. If or otherwise, the foreign manufacturer has not signed an MoU with BIS, it has to set up a liaison office in India with the permission of Reserve Bank of India. Otherwise, an authorized representative or agent needs to be appointed by the foreign firm.
8.3.8. Scheme for Indian Importers
Indian importers who intend to get Certification Mark may apply for the license. However, the assessment visit is paid to the original product manufacturer.
8.3.9. Management System Certification
Quality Management System Certification Scheme IS/ISO 9001 Environmental Management System Certification Scheme IS/ISO 14001 Occupational Health and Safety Management System Certification Scheme IS 18001 Hazard Analysis and Critical Control Scheme IS/ISO 22000 Service Quality Management System Certification Scheme IS 15700
8.3.10. National Institute of Training for Standardization (NITS)
It is a training institute of BIS which is set up in 1995. It is functioning from Noida, Uttar Pradesh, India. The primary activities of NITS are:‐
In‐House and Open Training Programme for Industry International Training Programme for Developing Countries (commonwealth countries) Training Programme to its employees.
8.3.11. Grievance Cell
If any customer reports about the degraded quality of any certified product at Grievance Cell, BIS HQs, BIS gives redressal to the customer.
8.3.12. Rajiv Gandhi National Quality Award
It was instituted in 1991 to award the pioneers of Industry in quality products & services every year.

©Vedpal Yadav, Lecturer in Food Technology, Government Polytechnic, Mandi Adampur, Hisar, Haryana, India‐125052. e‐mail‐ [email protected] +91‐9416589819 Page 88 of 134
8.3.13. Small Scale Industry Facilitation Cell
SSI Facilitation Cell became operational since 26 May 1997. The aim of the Cell is to assist the small scale entrepreneurs who are backbone of the Indian industry. It has an incentive scheme to promote such units to get certified with ISI Mark.
8.3.14. National Building Code of India, 2005
It is a comprehensive building code for regulating the building construction activities across the country which came with the contribution of around 400 experts. The code was first published in 1970 at the instance of the Planning Commission of India.
8.4. The AGMARK Standard
The word AGMARK is a derived from Agricultural Marketing. The AGMARK standard was set up by the Directorate of Marketing and Inspection of the Government of India by introducing an Agricultural produce Act in 1937. The word 'AGMARK' seal ensures quality and purity. A sample AGMARK seal is given below:
Agmark Besan Sl. No. B‐162002 Grade‐Standard
Place of Packing.............................. Date of Packing................................. Net Weight..........................................
This Label is the Property of the Government of India. A lot of care is taken in laying down the AGMARK grade and in affixing the AGMARK quality label. The quality of a product is determined with reference to the size, variety, weight, colour, moisture, fat content and other factors are taken into account. The act defines quality of cereals, spices, oil seeds, oil, butter, ghee, legumes and eggs and provides for the categorization of commodities into various grades depending on the degree of purity in each case. The grades incorporated are grades 1, 2, 3 and 4 or special, good, fair and ordinary. The standards also specify the types of packaging to be used for different products. The physical and chemical characteristics of products are kept in mind while formulating the AGMARK specifications. The Directorate of Marketing and Inspection of Central Government has 21 laboratories and 50 sub offices spread all over the country. The Central AGMARK Laboratory at Nagpur, continuously carries out research and development work in this field. The “Certificate of Authorization” is granted only to those in the trade having adequate experience and standing in the market. The staff of the Directorate of Marketing and Inspection or of the State Government is generally present at the time of selection of goods, their processing, grading and packing before applying the appropriate AGMARK labels. Grading of commodities like ghee, butter, vegetable oils, atta, spices and honey is voluntary. On the other hand, grading of commodities like tobacco, walnuts, spices, basmati rice, essential oils, onions, potatoes are meant for export is compulsory under AGMARK. AGMARK ensures the quality of pro‐ duce to the importers. The process of grading and administering the programme entails some cost hence graded products are priced slightly more. Considering the quality that is assured that little extra cost is worth paying. Grading of agricultural commodities has three main purposes. Firstly, it protects the producer from exploitation. By knowing the quality and grade of his produce, he is in better bargaining position against the trader. Secondly, it serves as a means of describing the quality of commodities to be purchased or sold by the buyers and sellers all over the country and abroad. This establishes a common trade language and avoids the need for physical checking and handling at many points. Thirdly, it protects the consumer by ensuring the quality of products he purchases.
8.5. Codex Alimentarius Commission (CAC)
FAO/WHO Food standards programme is called CODEX ALIMENTARIUS. The codex Alimentarius which means “Food Law” or “Food code” in Latin is a combined set of standards, codes or practices and other model regulations available for countries to use and apply to food in international trade.

©Vedpal Yadav, Lecturer in Food Technology, Government Polytechnic, Mandi Adampur, Hisar, Haryana, India‐125052. e‐mail‐ [email protected] +91‐9416589819 Page 89 of 134
The Codex Alimentarius collects international standards, practices, processes, guidelines, and recommendations related to food, food production, and food safety. In 1963, the Food and Agriculture Organization and the World Health Organization—two United Nations agencies—established the Codex Alimentarius Commission with the goal of establishing a set of standards and practices for the international food commodities trade that would protect consumers. The World Trade Organization has since recognized the Codex as the relevant authoritative work when resolving international disputes pertaining to food safety and consumer health. The Codex is inspired in name and aim by the Codex Alimentarius Austriacus (CAA), a collection of standards and product descriptions pertaining to food used by the Austro‐Hungarian Empire, and later Austria. Work on the CAA began in 1891, with portions of it circulating informally in the next two decades until it was collected in three volumes and published between 1910 and 1917. Although the CAA was produced principally by universities and the food industry itself, and primarily established the identity and proper treatment of various foods, it was relied on by the court system as an authoritative reference. In 1975, it was finally formally incorporated into the body of Austrian law, by which time its spiritual descendent, the Codex Alimentarius, had been formulated. During the early years of the European Economic Community, leading up to the European Union, the idea of a pan‐European Codex Alimentarius had been explored and eventually helped lead to the UN‐sponsored Codex. The Codex is published in English, French, Spanish, Chinese, and Arabic and is updated periodically to keep up with changes in the world and new safety‐related information. officially, it is meant to cover all foods, but in the course of its development it has come to focus principally on food that is sold to the consumer (flour and bread and dry pasta, for instance, rather than unprocessed wheat). Specific standards and practices documents are produced for meat products (including processed or cured meats and the handling of frozen meat products); fish and other seafood products; milk and dairy products; vegetables, fruits, fruit juices, and processed products composed thereof; cereals and dried legumes and products derived therefrom; fats and products derived therefrom; and special miscellaneous products that do not fit a broad category but require special mention (such as bottled water; sugar, honey, and other sweeteners; chocolate—an important food commodity; baby food; and baby formula). Furthermore, in addition to those “vertical” topics, documents cover “horizontal” topics that are not limited to one type of food: food labeling (including nutrition information, health benefit claims, ingredients, and the language used in ingredients, such as what is meant by “artificial coloring” or “natural flavors”), food additives (including not only flavorings and food coloring but also acidity regulators, anticaking agents, antifoaming agents, antioxidants, bulking agents, emulsifiers, humectants, stabilizers, thickeners, and, of course, preservatives), the prevention of and appropriate response to food contaminants (including specific guidelines for radionuclides, aflatoxins, and mycotoxins), maximum residue limits for pesticides, food hygiene (specific practices designed to limit the risk in the handling, preparation, and packaging of food), and biotechnology‐derived foods such as DNA‐modified crops. The Codex is formulated as a reference document, not a code of law, and the commission is not empowered to enforce these standards on any nation or entity within that nation. However, just as the CAA was used as an authoritative source by the Austro‐Hungarian courts, so too has the modern Codex been recognized by the World Trade Organization, which is, in fact, empowered to enforce standards on entities engaged in international trade. Though this recognition does not preclude the authority of other information sources, the Codex has been criticized for essentially having the force of law without—so the critics would argue—being composed by a commission run as rigorously as a legislative body would be—one that is not influenced by the legislators or electorate of the countries its standards affect. Furthermore, many—particularly alternative health enthusiasts—find issue with the Codex's handling of vitamins, minerals, and other health supplements. There is no international consensus on the handling of nonpharmaceutical health supplements, whether vitamin C pills or herbal supplements that claim to prevent or treat cancer. In some countries, the relevant factor is whether any health claims are made by the seller or on the label; in others, this is not important. In some countries, such products are treated as over‐the‐counter drugs; in others, they are not. A recent question in U.S. law is whether food items traditionally sold for consumption—as opposed to vitamin pills that have no nontherapeutic purpose—can be advertised with reference to their health benefits, and in such cases, what claims may be made before the product is classified as a drug. (Cheerios cereal crossed what is by general estimation a vague line when its boxes were labeled with new language claiming “in six weeks, Cheerios can reduce bad cholesterol by an average of 4 percent,” which the FDA deemed was a pharmaceutical claim made by a nonpharmaceutical product.) U.S. alternative health enthusiasts fear that when international bodies have

©Vedpal Yadav, Lecturer in Food Technology, Government Polytechnic, Mandi Adampur, Hisar, Haryana, India‐125052. e‐mail‐ [email protected] +91‐9416589819 Page 90 of 134
jurisdiction over such matters, their rights to dietary supplements (as outlined in the 1994 Dietary Supplement Health and Education Act) are abridged. often, allegations are made that the commission is unduly influenced—or even “in the pocket of”—the pharmaceuticals industry, and that it is therefore motivated to discount the efficacy of—and even to criminalize—any remedies or treatments other than those of that industry. The duel objectives of the codex Alimentarius commission are to protect the health of consumers and facilitate and international trade. Codex commodity standards cover such foods as fruit juices, cereals, meat products etc. General standards cover areas applicable to most foods such as labelling additives, contaminants, methods of analysis. It covers aspects such as food hygiene and technological practices. They are used by processors to ensure that foods are microbiologically safe and are fit for human consumption e.g., codex code of hygienic practice of law‐acid canned foods. Maximum Residue Limits (MRLS) have been set for pesticides. Specifications for “food grade quality” of additives form an important part of codex work. World consumers day is celebrated every year on 15th March
9. General Principles of Food Hygiene by Codex Alimentarius Commission (CAC)
People have the right to expect the food they eat to be safe and suitable for consumption. Foodborne illness and foodborne injury are at best unpleasant; at worst, they can be fatal. But there are also other consequences. Outbreaks of foodborne illness can damage trade and tourism, and lead to loss of earnings, unemployment and litigation. Food spoilage is wasteful, costly and can adversely affect trade and consumer confidence.
International food trade, and foreign travel, are increasing, bringing important social and economic benefits. But this also makes the spread of illness around the world easier. Eating habits too, have undergone major change in many countries over the last two decades and new food production, preparation and distribution techniques have developed to reflect this. Effective hygiene control, therefore, is vital to avoid the adverse human health and economic consequences of foodborne illness, foodborne injury, and food spoilage. Everyone, including farmers and growers, manufacturers and processors, food handlers and consumers, has a responsibility to assure that food is safe and suitable for consumption.
These General Principles lay a firm foundation for ensuring food hygiene and should be used in conjunction with each specific code of hygienic practice, where appropriate, and the guidelines on microbiological criteria. The document follows the food chain from primary production through to final consumption, highlighting the key hygiene controls at each stage. It recommends a HACCP‐based approach wherever possible to enhance food safety as described in Hazard Analysis and Critical Control Point (HACCP) System and Guidelines for its Application (Annex).
The controls described in this General Principles document are internationally recognized as essential to ensure the safety and suitability of food for consumption. The General Principles are commended to Governments, industry (including individual primary producers, manufacturers, processors, food service operators and retailers) and consumers alike.
9.1. Section I ‐ Objectives
9.1.1. The Codex General Principles of Food Hygiene
identify the essential principles of food hygiene applicable throughout the food chain (including primary production through to the final consumer), to achieve the goal of ensuring that food is safe and suitable for human consumption; recommend a HACCP‐based approach as a means to enhance food safety; indicate how to implement those principles; and provide a guidance for specific codes which may be needed for ‐ sectors of the food chain; processes; or commodities; to amplify the hygiene requirements specific to those areas.
9.2. Section II ‐ Scope, Use and Definition

©Vedpal Yadav, Lecturer in Food Technology, Government Polytechnic, Mandi Adampur, Hisar, Haryana, India‐125052. e‐mail‐ [email protected] +91‐9416589819 Page 91 of 134
9.2.1. Scope
9.2.1.1. The Food Chain
This document follows the food chain from primary production to the final consumer, setting out the necessary hygiene conditions for producing food which is safe and suitable for consumption. The document provides a base‐line structure for other, more specific, codes applicable to particular sectors. Such specific codes and guidelines should be read in conjunction with this document and Hazard Analysis and Critical Control Point (HACCP) System and Guidelines for its Application (Annex).
9.2.1.2. Roles of Governments, Industry, and Consumers
Governments can consider the contents of this document and decide how best they should encourage the implementation of these general principles to:
protect consumers adequately from illness or injury caused by food; policies need to consider the vulnerability of the population, or of different groups within the population;
provide assurance that food is suitable for human consumption;
maintain confidence in internationally traded food; and
provide health education programmes which effectively communicate the principles of food hygiene to industry and consumers.
Industry should apply the hygienic practices set out in this document to:
provide food which is safe and suitable for consumption;
ensure that consumers have clear and easily‐understood information, by way of labelling and other appropriate means, to enable them to protect their food from contamination and growth/survival of foodborne pathogens by storing, handling and preparing it correctly; and
maintain confidence in internationally traded food.
Consumers should recognize their role by following relevant instructions and applying appropriate food hygiene measures.
9.2.2. Use
Each section in this document states both the objectives to be achieved and the rationale behind those objectives in terms of the safety and suitability of food.
Section III covers primary production and associated procedures. Although hygiene practices may differ considerably for the various food commodities and specific codes should be applied where appropriate, some general guidance is given in this section. Sections IV to X set down the general hygiene principles which apply throughout the food chain to the point of sale. Section IX also covers consumer information, recognizing the important role played by consumers in maintaining the safety and suitability of food.
There will inevitably be situations where some of the specific requirements contained in this document are not applicable. The fundamental question in every case is “what is necessary and appropriate on the grounds of the safety and suitability of food for consumption?”
The text indicates where such questions are likely to arise by using the phrases “where necessary” and “where appropriate”. In practice, this means that, although the requirement is generally appropriate and reasonable, there will nevertheless be some situations where it is neither necessary nor appropriate on the grounds of food safety and suitability. In deciding whether a requirement is necessary or appropriate, an assessment of the risk should be made, preferably within the framework of the HACCP approach. This approach allows the requirements in this document to be flexibly and sensibly applied with a proper regard for the overall objectives of producing food which is safe and suitable for consumption. In so doing

©Vedpal Yadav, Lecturer in Food Technology, Government Polytechnic, Mandi Adampur, Hisar, Haryana, India‐125052. e‐mail‐ [email protected] +91‐9416589819 Page 92 of 134
it takes into account the wide diversity of activities and varying degrees of risk involved in producing food. Additional guidance is available in specific food codes.
9.2.3. 2.3 Definitions
For the purpose of this Code, the following expressions have the meaning stated:
Cleaning ‐ the removal of soil, food residue, dirt, grease or other objectionable matter.
Contaminant ‐ any biological or chemical agent, foreign matter, or other substances not intentionally added to food which may compromise food safety or suitability.
Contamination ‐ the introduction or occurrence of a contaminant in food or food environment.
Disinfection ‐ the reduction, by means of chemical agents and/or physical methods, of the number of micro‐organisms in the environment, to a level that does not compromise food safety or suitability.
Establishment ‐ any building or area in which food is handled and the surroundings under the control of the same management.
Food hygiene ‐ all conditions and measures necessary to ensure the safety and suitability of food at all stages of the food chain.
Hazard ‐ a biological, chemical or physical agent in, or condition of, food with the potential to cause an adverse health effect.
HACCP ‐ a system which identifies, evaluates, and controls hazards which are significant for food safety.
Food handler ‐ any person who directly handles packaged or unpackaged food, food equipment and utensils, or food contact surfaces and is therefore expected to comply with food hygiene requirements
Food safety ‐ assurance that food will not cause harm to the consumer when it is prepared and/or eaten according to its intended use.
Food suitability ‐ assurance that food is acceptable for human consumption according to its intended use.
Primary production ‐ those steps in the food chain up to and including, for example, harvesting, slaughter, milking, fishing.
9.3. Section III ‐ Primary Production
Objectives:
Primary production should be managed in a way that ensures that food is safe and suitable for its intended use. Where necessary, this will include:
avoiding the use of areas where the environment poses a threat to the safety of food; controlling contaminants, pests and diseases of animals and plants in such a way as not to pose a threat to food safety; adopting practices and measures to ensure food is produced under appropriately hygienic conditions.
Rationale:
To reduce the likelihood of introducing a hazard which may adversely affect the safety of food, or its

©Vedpal Yadav, Lecturer in Food Technology, Government Polytechnic, Mandi Adampur, Hisar, Haryana, India‐125052. e‐mail‐ [email protected] +91‐9416589819 Page 93 of 134
suitability for consumption, at later stages of the food chain.
9.3.1. Environmental Hygiene
Potential sources of contamination from the environment should be considered. In particular, primary food production should not be carried on in areas where the presence of potentially harmful substances would lead to an unacceptable level of such substances in food.
9.3.2. Hygienic Production of Food Sources
The potential effects of primary production activities on the safety and suitability of food should be considered at all times. In particular, this includes identifying any specific points in such activities where a high probability of contamination may exist and taking specific measures to minimize that probability. The HACCP‐based approach may assist in the taking of such measures ‐ see Hazard Analysis and Critical Control (HACCP) Point System and Guidelines for its Application (Annex, page 33).
Producers should as far as practicable implement measures to:
control contamination from air, soil, water, feedstuffs, fertilizers (including natural fertilizers), pesticides, veterinary drugs or any other agent used in primary production;
control plant and animal health so that it does not pose a threat to human health through food consumption, or adversely affect the suitability of the product; and
protect food sources from faecal and other contamination.
In particular, care should be taken to manage wastes, and store harmful substances appropriately. On‐farm programmes which achieve specific food safety goals are becoming an important part of primary production and should be encouraged.
9.3.3. Handling, Storage and Transport
Procedures should be in place to:
sort food and food ingredients to segregate material which is evidently unfit for human consumption;
dispose of any rejected material in a hygienic manner; and
Protect food and food ingredients from contamination by pests, or by chemical, physical or microbiological contaminants or other objectionable substances during handling, storage and transport.
Care should be taken to prevent, so far as reasonably practicable, deterioration and spoilage through appropriate measures which may include controlling temperature, humidity, and/or other controls.
9.3.4. Cleaning, Maintenance and Personnel Hygiene At Primary Production
Appropriate facilities and procedures should be in place to ensure that:
any necessary cleaning and maintenance is carried out effectively; and
an appropriate degree of personal hygiene is maintained.
9.4. Section IV ‐ Establishment: Design and Facilities
Objectives:
Depending on the nature of the operations, and the risks associated with them, premises, equipment and

©Vedpal Yadav, Lecturer in Food Technology, Government Polytechnic, Mandi Adampur, Hisar, Haryana, India‐125052. e‐mail‐ [email protected] +91‐9416589819 Page 94 of 134
facilities should be located, designed and constructed to ensure that:
contamination is minimized; design and layout permit appropriate maintenance, cleaning and disinfections and minimize air‐borne contamination; surfaces and materials, in particular those in contact with food, are non‐toxic in intended use and, where necessary, suitably durable, and easy to maintain and clean; where appropriate, suitable facilities are available for temperature, humidity and other controls; and there is effective protection against pest access and harbourage.
Rationale:
Attention to good hygienic design and construction, appropriate location, and the provision of adequate facilities, is necessary to enable hazards to be effectively controlled.
9.4.1. Location
9.4.1.1. Establishments
Potential sources of contamination need to be considered when deciding where to locate food establishments, as well as the effectiveness of any reasonable measures that might be taken to protect food. Establishments should not be located anywhere where, after considering such protective measures, it is clear that there will remain a threat to food safety or suitability. In particular, establishments should normally be located away from:
environmentally polluted areas and industrial activities which pose a serious threat of contaminating food; areas subject to flooding unless sufficient safeguards are provided; areas prone to infestations of pests; areas where wastes, either solid or liquid, cannot be removed effectively.
9.4.1.2. Equipment
Equipment should be located so that it:
permits adequate maintenance and cleaning; functions in accordance with its intended use; and facilitates good hygiene practices, including monitoring.
9.4.2. Premises and Rooms
9.4.2.1. Design and Layout
Where appropriate, the internal design and layout of food establishments should permit good food hygiene practices, including protection against cross‐contamination between and during operations by foodstuffs.
9.4.2.2. Internal Structures and Fittings
Structures within food establishments should be soundly built of durable materials and be easy to maintain, clean and where appropriate, able to be disinfected. In particular the following specific conditions should be satisfied where necessary to protect the safety and suitability of food:
the surfaces of walls, partitions and floors should be made of impervious materials with no toxic effect in intended use;
walls and partitions should have a smooth surface up to a height appropriate to the operation;
floors should be constructed to allow adequate drainage and cleaning;
ceilings and overhead fixtures should be constructed and finished to minimize the build up of dirt and condensation, and the shedding of particles;

©Vedpal Yadav, Lecturer in Food Technology, Government Polytechnic, Mandi Adampur, Hisar, Haryana, India‐125052. e‐mail‐ [email protected] +91‐9416589819 Page 95 of 134
windows should be easy to clean, be constructed to minimize the build up of dirt and where necessary, be fitted with removable and cleanable insect‐proof screens. Where necessary, windows should be fixed;
doors should have smooth, non‐absorbent surfaces, and be easy to clean and, where necessary, disinfect;
working surfaces that come into direct contact with food should be in sound condition, durable and easy to clean, maintain and disinfect. They should be made of smooth, non‐absorbent materials, and inert to the food, to detergents and disinfectants under normal operating conditions.
9.4.2.3. Temporary/Mobile Premises and Vending Machines
Premises and structures covered here include market stalls, mobile sales and street vending vehicles, temporary premises in which food is handled such as tents and marquees.
Such premises and structures should be sited, designed and constructed to avoid, as far as reasonably practicable, contaminating food and harbouring pests.
In applying these specific conditions and requirements, any food hygiene hazards associated with such facilities should be adequately controlled to ensure the safety and suitability of food.
9.4.3. Equipment
9.4.3.1. General
Equipment and containers (other than once‐only use containers and packaging) coming into contact with food, should be designed and constructed to ensure that, where necessary, they can be adequately cleaned, disinfected and maintained to avoid the contamination of food. Equipment and containers should be made of materials with no toxic effect in intended use. Where necessary, equipment should be durable and movable or capable of being disassembled to allow for maintenance, cleaning, disinfection, monitoring and, for example, to facilitate inspection for pests.
9.4.3.2. Food Control and Monitoring Equipment
In addition to the general requirements in paragraph 4.3.1, equipment used to cook, heat treat, cool, store or freeze food should be designed to achieve the required food temperatures as rapidly as necessary in the interests of food safety and suitability, and maintain them effectively. Such equipment should also be designed to allow temperatures to be monitored and controlled. Where necessary, such equipment should have effective means of controlling and monitoring humidity, air‐flow and any other characteristic likely to have a detrimental effect on the safety or suitability of food. These requirements are intended to ensure that:
harmful or undesirable micro‐organisms or their toxins are eliminated or reduced to safe levels or their survival and growth are effectively controlled;
where appropriate, critical limits established in HACCP‐based plans can be monitored; and
temperatures and other conditions necessary to food safety and suitability can be rapidly achieved and maintained.
9.4.3.3. Containers For Waste and Inedible Substances
Containers for waste, by‐products and inedible or dangerous substances, should be specifically identifiable, suitably constructed and, where appropriate, made of impervious material. Containers used to hold dangerous substances should be identified and, where appropriate, be lockable to prevent malicious or accidental contamination of food.

©Vedpal Yadav, Lecturer in Food Technology, Government Polytechnic, Mandi Adampur, Hisar, Haryana, India‐125052. e‐mail‐ [email protected] +91‐9416589819 Page 96 of 134
9.4.4. Facilities
9.4.4.1. Water Supply
An adequate supply of potable water with appropriate facilities for its storage, distribution and temperature control, should be available whenever necessary to ensure the safety and suitability of food.
Potable water should be as specified in the latest edition of WHO Guidelines for Drinking Water Quality, or water of a higher standard. Non‐potable water (for use in, for example, fire control, steam production, refrigeration and other similar purposes where it would not contaminate food), shall have a separate system. Non‐potable water systems shall be identified and shall not connect with, or allow reflux into, potable water systems.
9.4.4.2. Drainage and Waste Disposal
Adequate drainage and waste disposal systems and facilities should be provided. They should be designed and constructed so that the risk of contaminating food or the potable water supply is avoided.
9.4.4.3. Cleaning
Adequate facilities, suitably designated, should be provided for cleaning food, utensils and equipment. Such facilities should have an adequate supply of hot and cold potable water where appropriate.
9.4.4.4. Personnel Hygiene Facilities and Toilets
Personnel hygiene facilities should be available to ensure that an appropriate degree of personal hygiene can be maintained and to avoid contaminating food. Where appropriate, facilities should include:
adequate means of hygienically washing and drying hands, including wash basins and a supply of hot and cold (or suitably temperature controlled) water;
lavatories of appropriate hygienic design; and
adequate changing facilities for personnel.
Such facilities should be suitably located and designated.
9.4.4.5. Temperature Control
Depending on the nature of the food operations undertaken, adequate facilities should be available for heating, cooling, cooking, refrigerating and freezing food, for storing refrigerated or frozen foods, monitoring food temperatures, and when necessary, controlling ambient temperatures to ensure the safety and suitability of food.
9.4.4.6. Air Quality and Ventilation
Adequate means of natural or mechanical ventilation should be provided, in particular to:
minimize air‐borne contamination of food, for example, from aerosols and condensation droplets;
control ambient temperatures;
control odours which might affect the suitability of food; and
control humidity, where necessary, to ensure the safety and suitability of food.
Ventilation systems should be designed and constructed so that air does not flow from contaminated areas to clean areas and, where necessary, they can be adequately maintained and cleaned.
©Vedpal Yadav, Lecturer in Food Technology, Government Polytechnic, Mandi Adampur, Hisar, Haryana, India‐125052. e‐mail‐ [email protected] +91‐9416589819 Page 97 of 134
9.4.4.7. Lighting
Adequate natural or artificial lighting should be provided to enable the undertaking to operate in a hygienic manner. Where necessary, lighting should not be such that the resulting colour is misleading. The intensity should be adequate to the nature of the operation. Lighting fixtures should, where appropriate, be protected to ensure that food is not contaminated by breakages.
9.4.4.8. Storage
Where necessary, adequate facilities for the storage of food, ingredients and non‐food chemicals (e.g. cleaning materials, lubricants, fuels) should be provided.
Where appropriate, food storage facilities should be designed and constructed to:
permit adequate maintenance and cleaning;
avoid pest access and harbourage;
enable food to be effectively protected from contamination during storage; and
where necessary, provide an environment which minimizes the deterioration of food (e.g. by temperature and humidity control).
The type of storage facilities required will depend on the nature of the food. Where necessary, separate, secure storage facilities for cleaning materials and hazardous substances should be provided.
9.5. Section V ‐ Control of Operation
Objective:
To produce food which is safe and suitable for human consumption by:
formulating design requirements with respect to raw materials, composition, processing, distribution, and consumer use to be met in the manufacture and handling of specific food items; and designing, implementing, monitoring and reviewing effective control systems.
Rationale:
To reduce the risk of unsafe food by taking preventive measures to assure the safety and suitability of food at an appropriate stage in the operation by controlling food hazards.
9.5.1. Control of Food Hazards
Food business operators should control food hazards through the use of systems such as HACCP. They should:
identify any steps in their operations which are critical to the safety of food;
implement effective control procedures at those steps;
monitor control procedures to ensure their continuing effectiveness; and
review control procedures periodically, and whenever the operations change.
These systems should be applied throughout the food chain to control food hygiene throughout the shelf‐life of the product through proper product and process design.
Control procedures may be simple, such as checking stock rotation calibrating equipment, or correctly loading refrigerated display units. In some cases a system based on expert advice, and involving

©Vedpal Yadav, Lecturer in Food Technology, Government Polytechnic, Mandi Adampur, Hisar, Haryana, India‐125052. e‐mail‐ [email protected] +91‐9416589819 Page 98 of 134
documentation, may be appropriate. A model of such a food safety system is described in Hazard Analysis and Critical Control (HACCP) System and Guidelines for its Application (Annex).
9.5.2. Key Aspects of Hygiene Control Systems
9.5.2.1. Time and Temperature Control
Inadequate food temperature control is one of the most common causes of foodborne illness or food spoilage. Such controls include time and temperature of cooking, cooling, processing and storage. Systems should be in place to ensure that temperature is controlled effectively where it is critical to the safety and suitability of food.
Temperature control systems should take into account:
the nature of the food, e.g. its water activity, pH, and likely initial level and types of micro‐organisms;
the intended shelf‐life of the product;
the method of packaging and processing; and
how the product is intended to be used, e.g. further cooking/processing or ready‐to‐eat.
Such systems should also specify tolerable limits for time and temperature variations.
Temperature recording devices should be checked at regular intervals and tested for accuracy.
9.5.2.2. Specific Process Steps
Other steps which contribute to food hygiene may include, for example:
chilling
thermal processing
irradiation
drying
chemical preservation
vacuum or modified atmospheric packaging
9.5.2.3. Microbiological and Other Specifications
Management systems described in paragraph 5.1 offer an effective way of ensuring the safety and suitability of food. Where microbiological, chemical or physical specifications are used in any food control system, such specifications should be based on sound scientific principles and state, where appropriate, monitoring procedures, analytical methods and action limits.
9.5.2.4. Microbiological Cross‐Contamination
Pathogens can be transferred from one food to another, either by direct contact or by food handlers, contact surfaces or the air. Raw, unprocessed food should be effectively separated, either physically or by time, from ready‐to‐eat foods, with effective intermediate cleaning and where appropriate disinfection.
Access to processing areas may need to be restricted or controlled. Where risks are particularly high, access to processing areas should be only via a changing facility. Personnel may need to be required to put on clean protective clothing including footwear and wash their hands before entering.
Surfaces, utensils, equipment, fixtures and fittings should be thoroughly cleaned and where necessary disinfected after raw food, particularly meat and poultry, has been handled or processed.

©Vedpal Yadav, Lecturer in Food Technology, Government Polytechnic, Mandi Adampur, Hisar, Haryana, India‐125052. e‐mail‐ [email protected] +91‐9416589819 Page 99 of 134
9.5.2.5. Physical and Chemical Contamination
Systems should be in place to prevent contamination of foods by foreign bodies such as glass or metal shards from machinery, dust, harmful fumes and unwanted chemicals. In manufacturing and processing, suitable detection or screening devices should be used where necessary.
9.5.3. Incoming Material Requirements
No raw material or ingredient should be accepted by an establishment if it is known to contain parasites, undesirable micro‐organisms, pesticides, veterinary drugs or toxic, decomposed or extraneous substances which would not be reduced to an acceptable level by normal sorting and/or processing. Where appropriate, specifications for raw materials should be identified and applied.
Raw materials or ingredients should, where appropriate, be inspected and sorted before processing. Where necessary, laboratory tests should be made to establish fitness for use. Only sound, suitable raw materials or ingredients should be used.
Stocks of raw materials and ingredients should be subject to effective stock rotation.
9.5.4. Packaging
Packaging design and materials should provide adequate protection for products to minimize contamination, prevent damage, and accommodate proper labelling. Packaging materials or gases where used must be non‐toxic and not pose a threat to the safety and suitability of food under the specified conditions of storage and use. Where appropriate, reusable packaging should be suitably durable, easy to clean and, where necessary, disinfect.
9.5.5. Water
9.5.5.1. In Contact With Food
Only potable water, should be used in food handling and processing, with the following exceptions:
for steam production, fire control and other similar purposes not connected with food; and
in certain food processes, e.g. chilling, and in food handling areas, provided this does not constitute a hazard to the safety and suitability of food (e.g. the use of clean sea water).
Water recirculated for reuse should be treated and maintained in such a condition that no risk to the safety and suitability of food results from its use. The treatment process should be effectively monitored. Recirculated water which has received no further treatment and water recovered from processing of food by evaporation or drying may be used, provided its use does not constitute a risk to the safety and suitability of food.
9.5.5.2. As An Ingredient
Potable water should be used wherever necessary to avoid food contamination.
9.5.5.3. Ice and Steam
Ice should be made from water that complies with section 4.4.1. Ice and steam should be produced, handled and stored to protect them from contamination.
Steam used in direct contact with food or food contact surfaces should not constitute a threat to the safety and suitability of food.

©Vedpal Yadav, Lecturer in Food Technology, Government Polytechnic, Mandi Adampur, Hisar, Haryana, India‐125052. e‐mail‐ [email protected] +91‐9416589819 Page 100 of 134
9.5.6. Management and Supervision
The type of control and supervision needed will depend on the size of the business, the nature of its activities and the types of food involved. Managers and supervisors should have enough knowledge of food hygiene principles and practices to be able to judge potential risks, take appropriate preventive and corrective action, and ensure that effective monitoring and supervision takes place.
9.5.7. Documentation and Records
Where necessary, appropriate records of processing, production and distribution should be kept and retained for a period that exceeds the shelf‐life of the product. Documentation can enhance the credibility and effectiveness of the food safety control system.
9.5.8. Recall Procedures
Managers should ensure effective procedures are in place to deal with any food safety hazard and to enable the complete, rapid recall of any implicated lot of the finished food from the market. Where a product has been withdrawn because of an immediate health hazard, other products which are produced under similar conditions, and which may present a similar hazard to public health, should be evaluated for safety and may need to be withdrawn. The need for public warnings should be considered.
Recalled products should be held under supervision until they are destroyed, used for purposes other than human consumption, determined to be safe for human consumption, or reprocessed in a manner to ensure their safety.
9.6. Section VI ‐ Establishment: Maintenance and Sanitation
Objective:
To establish effective systems to:
ensure adequate and appropriate maintenance and cleaning; control pests; manage waste; and monitor effectiveness of maintenance and sanitation procedures.
Rationale:
To facilitate the continuing effective control of food hazards, pests, and other agents likely to contaminate food.
9.6.1. Maintenance and Cleaning
9.6.1.1. General
Establishments and equipment should be kept in an appropriate state of repair and condition to:
facilitate all sanitation procedures;
function as intended, particularly at critical steps (see paragraph 5.1);
prevent contamination of food, e.g. from metal shards, flaking plaster, debris and chemicals.
Cleaning should remove food residues and dirt which may be a source of contamination. The necessary cleaning methods and materials will depend on the nature of the food business. Disinfection may be necessary after cleaning.

©Vedpal Yadav, Lecturer in Food Technology, Government Polytechnic, Mandi Adampur, Hisar, Haryana, India‐125052. e‐mail‐ [email protected] +91‐9416589819 Page 101 of 134
Cleaning chemicals should be handled and used carefully and in accordance with manufacturers’ instructions and stored, where necessary, separated from food, in clearly identified containers to avoid the risk of contaminating food.
9.6.1.2. Cleaning Procedures and Methods
Cleaning can be carried out by the separate or the combined use of physical methods, such as heat, scrubbing, turbulent flow, vacuum cleaning or other methods that avoid the use of water, and chemical methods using detergents, alkalis or acids.
Cleaning procedures will involve, where appropriate:
removing gross debris from surfaces;
applying a detergent solution to loosen soil and bacterial film and hold them in solution or suspension;
rinsing with water which complies with section 4, to remove loosened soil and residues of detergent;
dry cleaning or other appropriate methods for removing and collecting residues and debris; and
where necessary, disinfection with subsequent rinsing unless the manufacturers’ instructions indicate on a scientific basis that rinsing is not required.
9.6.2. Cleaning Programmes
Cleaning and disinfection programmes should ensure that all parts of the establishment are appropriately clean, and should include the cleaning of cleaning equipment.
Cleaning and disinfection programmes should be continually and effectively monitored for their suitability and effectiveness and where necessary, documented.
Where written cleaning programmes are used, they should specify:
areas, items of equipment and utensils to be cleaned;
responsibility for particular tasks;
method and frequency of cleaning; and
monitoring arrangements.
Where appropriate, programmes should be drawn up in consultation with relevant specialist expert advisors.
9.6.3. Pest Control Systems
9.6.3.1. General
Pests pose a major threat to the safety and suitability of food. Pest infestations can occur where there are breeding sites and a supply of food. Good hygiene practices should be employed to avoid creating an environment conducive to pests. Good sanitation, inspection of incoming materials and good monitoring can minimize the likelihood of infestation and thereby limit the need for pesticides. [Insert reference to FAO document dealing with Integrated Pest Management].
9.6.3.2. Preventing Access
Buildings should be kept in good repair and condition to prevent pest access and to eliminate potential breeding sites. Holes, drains and other places where pests are likely to gain access should be kept sealed. Wire mesh screens, for example on open windows, doors and ventilators, will reduce the problem of pest entry. Animals should, wherever possible, be excluded from the grounds of factories and food processing plants.

©Vedpal Yadav, Lecturer in Food Technology, Government Polytechnic, Mandi Adampur, Hisar, Haryana, India‐125052. e‐mail‐ [email protected] +91‐9416589819 Page 102 of 134
9.6.3.3. Harbourage and Infestation
The availability of food and water encourages pest harbourage and infestation. Potential food sources should be stored in pest‐proof containers and/or stacked above the ground and away from walls. Areas both inside and outside food premises should be kept clean. Where appropriate, refuse should be stored in covered, pest‐proof containers.
9.6.3.4. Monitoring and Detection
Establishments and surrounding areas should be regularly examined for evidence of infestation.
9.6.3.5. Eradication
Pest infestations should be dealt with immediately and without adversely affecting food safety or suitability. Treatment with chemical, physical or biological agents should be carried out without posing a threat to the safety or suitability of food.
9.6.4. Waste Management
Suitable provision must be made for the removal and storage of waste. Waste must not be allowed to accumulate in food handling, food storage, and other working areas and the adjoining environment except so far as is unavoidable for the proper functioning of the business.
Waste stores must be kept appropriately clean.
9.6.5. Monitoring Effectiveness
Sanitation systems should be monitored for effectiveness, periodically verified by means such as audit pre‐operational inspections or, where appropriate, microbiological sampling of environment and food contact surfaces and regularly reviewed and adapted to reflect changed circumstances.
9.7. Section VII ‐ Establishment: Personal Hygiene
Objectives:
To ensure that those who come directly or indirectly into contact with food are not likely to contaminate food by:
maintaining an appropriate degree of personal cleanliness; behaving and operating in an appropriate manner.
Rationale:
People who do not maintain an appropriate degree of personal cleanliness, who have certain illnesses or conditions or who behave inappropriately, can contaminate food and transmit illness to consumers.
9.7.1. Health Status
People known, or suspected, to be suffering from, or to be a carrier of a disease or illness likely to be transmitted through food, should not be allowed to enter any food handling area if there is a likelihood of their contaminating food. Any person so affected should immediately report illness or symptoms of illness to the management.
Medical examination of a food handler should be carried out if clinically or epidemiologically indicated.

©Vedpal Yadav, Lecturer in Food Technology, Government Polytechnic, Mandi Adampur, Hisar, Haryana, India‐125052. e‐mail‐ [email protected] +91‐9416589819 Page 103 of 134
9.7.2. Illness and Injuries
Conditions which should be reported to management so that any need for medical examination and/or possible exclusion from food handling can be considered, include:
jaundice
diarrhoea
vomiting
fever
sore throat with fever
visibly infected skin lesions (boils, cuts, etc.)
discharges from the ear, eye or nose
9.7.3. Personal Cleanliness
Food handlers should maintain a high degree of personal cleanliness and, where appropriate, wear suitable protective clothing, head covering, and footwear. Cuts and wounds, where personnel are permitted to continue working, should be covered by suitable waterproof dressings.
Personnel should always wash their hands when personal cleanliness may affect food safety, for example:
at the start of food handling activities;
immediately after using the toilet; and
after handling raw food or any contaminated material, where this could result in contamination of other food items; they should avoid handling ready‐to‐eat food, where appropriate.
9.7.4. Personal Behaviour
People engaged in food handling activities should refrain from behaviour which could result in contamination of food, for example:
smoking;
spitting;
chewing or eating;
sneezing or coughing over unprotected food.
Personal effects such as jewellery, watches, pins or other items should not be worn or brought into food handling areas if they pose a threat to the safety and suitability of food.
9.7.5. Visitors
Visitors to food manufacturing, processing or handling areas should, where appropriate, wear protective clothing and adhere to the other personal hygiene provisions in this section.
9.8. Section VIII ‐ Transportation
Objectives:
Measures should be taken where necessary to:
protect food from potential sources of contamination; protect food from damage likely to render the food unsuitable for consumption; and provide an environment which effectively controls the growth of pathogenic or spoilage micro‐organisms and the production of toxins in food.

©Vedpal Yadav, Lecturer in Food Technology, Government Polytechnic, Mandi Adampur, Hisar, Haryana, India‐125052. e‐mail‐ [email protected] +91‐9416589819 Page 104 of 134
Rationale:
Food may become contaminated, or may not reach its destination in a suitable condition for consumption, unless effective control measures are taken during transport, even where adequate hygiene control measures have been taken earlier in the food chain.
9.8.1. General
Food must be adequately protected during transport. The type of conveyances or containers required depends on the nature of the food and the conditions under which it has to be transported.
9.8.2. Requirements
Where necessary, conveyances and bulk containers should be designed and constructed so that they:
do not contaminate foods or packaging;
can be effectively cleaned and, where necessary, disinfected;
permit effective separation of different foods or foods from non‐food items where necessary during transport;
provide effective protection from contamination, including dust and fumes;
can effectively maintain the temperature, humidity, atmosphere and other conditions necessary to protect food from harmful or undesirable microbial growth and deterioration likely to render it unsuitable for consumption; and
allow any necessary temperature, humidity and other conditions to be checked.
9.8.3. Use and Maintenance
Conveyances and containers for transporting food should be kept in an appropriate state of cleanliness, repair and condition. Where the same conveyance or container is used for transporting different foods, or non‐foods, effective cleaning and, where necessary, disinfection should take place between loads.
Where appropriate, particularly in bulk transport, containers and conveyances should be designated and marked for food use only and be used only for that purpose.
9.9. Section IX ‐ Product Information and Consumer Awareness
Objectives:
Products should bear appropriate information to ensure that:
adequate and accessible information is available to the next person in the food chain to enable them to handle, store, process, prepare and display the product safely and correctly; the lot or batch can be easily identified and recalled if necessary.
Consumers should have enough knowledge of food hygiene to enable them to:
understand the importance of product information; make informed choices appropriate to the individual; and prevent contamination and growth or survival of foodborne pathogens by storing, preparing and using it correctly.
Information for industry or trade users should be clearly distinguishable from consumer information, particularly on food labels.

©Vedpal Yadav, Lecturer in Food Technology, Government Polytechnic, Mandi Adampur, Hisar, Haryana, India‐125052. e‐mail‐ [email protected] +91‐9416589819 Page 105 of 134
Rationale:
Insufficient product information, and/or inadequate knowledge of general food hygiene, can lead to products being mishandled at later stages in the food chain. Such mishandling can result in illness, or products becoming unsuitable for consumption, even where adequate hygiene control measures have been taken earlier in the food chain.
9.9.1. Lot Identification
Lot identification is essential in product recall and also helps effective stock rotation. Each container of food should be permanently marked to identify the producer and the lot. Codex General Standard for the Labelling of Prepackaged Foods (CODEX STAN 1‐1985) applies.
9.9.2. Product Information
All food products should be accompanied by or bear adequate information to enable the next person in the food chain to handle, display, store and prepare and use the product safely and correctly.
9.9.3. Labelling
Prepackaged foods should be labelled with clear instructions to enable the next person in the food chain to handle, display, store and use the product safely. Codex General Standard for the Labelling of Prepackaged Foods (CODEX STAN 1‐1985) applies.
9.9.4. Consumer Education
Health education programmes should cover general food hygiene. Such programmes should enable consumers to understand the importance of any product information and to follow any instructions accompanying products, and make informed choices. In particular consumers should be informed of the relationship between time/temperature control and foodborne illness.
9.10. Section X ‐ Training
Objective:
Those engaged in food operations who come directly or indirectly into contact with food should be trained, and/or instructed in food hygiene to a level appropriate to the operations they are to perform.
Rationale:
Training is fundamentally important to any food hygiene system.
Inadequate hygiene training, and/or instruction and supervision of all people involved in food related activities pose a potential threat to the safety of food and its suitability for consumption.
9.10.1. Awareness and Responsibilities
Food hygiene training is fundamentally important. All personnel should be aware of their role and responsibility in protecting food from contamination or deterioration. Food handlers should have the necessary knowledge and skills to enable them to handle food hygienically. Those who handle strong cleaning chemicals or other potentially hazardous chemicals should be instructed in safe handling techniques.

©Vedpal Yadav, Lecturer in Food Technology, Government Polytechnic, Mandi Adampur, Hisar, Haryana, India‐125052. e‐mail‐ [email protected] +91‐9416589819 Page 106 of 134
9.10.2. Training Programmes
Factors to take into account in assessing the level of training required include:
the nature of the food, in particular its ability to sustain growth of pathogenic or spoilage micro‐organisms; the manner in which the food is handled and packed, including the probability of contamination; the extent and nature of processing or further preparation before final consumption; the conditions under which the food will be stored; and the expected length of time before consumption.
9.10.3. Instruction and Supervision
Periodic assessments of the effectiveness of training and instruction programmes should be made, as well as routine supervision and checks to ensure that procedures are being carried out effectively.
Managers and supervisors of food processes should have the necessary knowledge of food hygiene principles and practices to be able to judge potential risks and take the necessary action to remedy deficiencies.
9.10.4. Refresher Training
Training programmes should be routinely reviewed and updated where necessary. Systems should be in place to ensure that food handlers remain aware of all procedures necessary to maintain the safety and suitability of food.
10. Hazard Analysis and Critical Control Point (HACCP)
"An ounce of prevention is worth a pound of cure"
10.1. Introduction
HACCP was originally developed as a microbiological safety system in the early days of the US manned space programme in order to guarantee the safety of astronauts' food. Up until that time most food safety systems were based on end product testing and could not fully assure safe products as 100% testing was impossible. A pro‐active, process‐focused system was needed and the HACCP concept was born.
The original system was designed by the Pillsbury Company working alongside NASA and the US army laboratories at Natick. It was based on the engineering system Failure, Mode and Effect Analysis (FMEA) which looked at what could potentially go wrong at each stage in the operation along with possible causes and the likely effect, before applying effective control mechanisms.
HACCP is a system that identifies, evaluates and controls hazards which are significant for food safety. It is a structured, systematic approach for the control of food safety throughout the commodity system, from the plough to the plate. It requires a good understanding of the relationship between cause and effect in order to be more pro‐active and it is a key element in Total Quality Management (TQM). HACCP builds on the foundations of well‐established quality management systems such as Good Manufacturing Practice (GMP), Good Hygienic Practice (GHP), Good Agricultural Practice (GAP), and Good Storage Practice (GSP). The HACCP concept has been successfully applied in the control of quality as well as safety in low‐acid canned foods in the USA, and many food companies in Europe and the USA have adopted the approach. Increasingly, regulatory bodies have recognised the usefulness of this tool and its 'principles' have has been incorporated into legislative requirements by both the EU (in the General Hygiene regulations for managing food safety (93/43/EEC)), and the United States Federal Department of Agriculture (CPR ‐ 123). The National Advisory Committee on Microbiological Criteria for Foods (NACMCF) provided guidelines on HACCP including generic plans and decision trees in 1992, and the Codex Alimentarius Commission

©Vedpal Yadav, Lecturer in Food Technology, Government Polytechnic, Mandi Adampur, Hisar, Haryana, India‐125052. e‐mail‐ [email protected] +91‐9416589819 Page 107 of 134
adopted the HACCP system at its twentieth session in 1993. HACCP systems can be incorporated into other quality assurance systems such as the ISO 9000 series (Figure 7).
Although conceived as a food safety system for both the agricultural and processing systems, it is in the latter that HACCP has found most application hitherto. This is primarily because it is much easier to apply a HACCP system in a factory where there is a single management or 'owner', and where it is possible to completely prevent a food safety hazard, or eliminate, or reduce it to an acceptable level. In the commodity system there are often many disparate 'owners' of the commodity as it passes from the farm to the consumer, and complete control may be unobtainable. This Manual aims to address this subject, basing the approach as closely as possible on the Codex Code of General Principles on Food Hygiene (1997), which emphasises the importance of GMP/GAP/GHP as sound foundations to incorporate the HACCP approach and develop a user friendly Food Safety Management System.
10.2. Pre‐requisite programmes
Pre‐requisite programmes such as GAP, GMP and GHP must be working effectively within a commodity system before HACCP is applied. If these pre‐requisite programmes are not functioning effectively then the introduction of HACCP will be complicated, resulting in a cumbersome, over‐documented system.
10.2.1. Good Agricultural Practices
10.2.1.1. Primary Production
Primary food production should be managed to ensure that food is safe and wholesome for the consumer. Production will start on the farm, in the sea or lake or even within a forest. It is essential that certain ground rules are followed. Land used for crop or horticulture production should be fit for purpose and should not have previously been contaminated with heavy metals, industrial chemicals or environmental waste. Such hazards will be transferred into the food chain rendering the commodity unfit for human consumption. Farmers should control production so that contamination of the crop, proliferation of pests, and diseases of animals and plants, do not compromise food safety. Good Agricultural Practices (GAP), including Good Hygienic Practices (GHP) where appropriate, should be adopted to make sure that the harvested commodity will not present a food hazard to the consumer.
Good Storage Practices (GSP) should be followed when the commodity is stored on the farm. As well as being covered in Food Hygiene Basic Texts (CODEX) there are also four ISO procedures that cover the storage of cereal s and pulses (ISO 6322 series). GSP should also be followed for storage throughout the commodity system.
10.2.2. Good Manufacturing Practices
10.2.2.1. Establishment Design and Facilities
The structure and location of a processing plant needs to be considered in relation to the nature of operations and risks associated with them.
Food premises should be designed to minimise possibilities of contamination of commodity or product.
Design and layout should permit maintenance, cleaning and disinfection of the site to minimise airborne contamination.
All surfaces that come into contact with food should be non‐toxic, as well as being easy to maintain and clean in order to prevent any additional contamination.
Suitable facilities should exist for temperature and humidity control, when required.
Effective measures should exist to prevent access by pests

©Vedpal Yadav, Lecturer in Food Technology, Government Polytechnic, Mandi Adampur, Hisar, Haryana, India‐125052. e‐mail‐ [email protected] +91‐9416589819 Page 108 of 134
10.2.2.2. Control of Operation
Effective control measures should be in place to reduce the risk of contamination of the commodity or food supply such that it is safe and fit for purpose:
Adequate time, temperature or humidity controls
Food grade packaging
Potable water supplies
Maintenance of equipment
Maintenance and Sanitation
Procedures and work instructions should exist to demonstrate an adequate level of maintenance of an establishment as well as efficient practices for cleaning, waste management, and pest control. Overall, these operations will support the ongoing control of potential food hazards that may contaminate food.
10.2.2.3. Personnel Hygiene
Measures need to be in place to ensure that food handlers do not contaminate food. This objective can be attained by maintaining an appropriate level of personal cleanliness and following guidelines for personal hygiene.
10.2.2.4. Transportation
The method of transportation should be such that measures are taken to prevent any contamination or deterioration of the commodity. Commodities or product that need to be transported in certain environments should be appropriately controlled, e.g. chilled, frozen, or stored under specific humidity levels.
Containers and conveyors used for transporting food need to be maintained in good condition and be easy to clean.
Containers used for bulk transfer should be designated and marked specifically for food use only.
10.2.2.5. Training
All food handlers should be trained in personal hygiene, as well as in the specific operation with which they are working, to a level commensurate with their duties. Food handlers should also be supervised by trained supervisors.
An ongoing training programme for food handlers is paramount to the success of a Food Safety Management System
10.2.2.6. Product Information and Consumer Awareness
The end product should be accompanied by adequate information to ensure that personnel at the next stage in the food chain will handle, store, process, prepare and display the product safely. Since the consumer may be responsible for performing the ultimate control measure, the cooking of raw meat or fish, they should have all the relevant information required to carry out this step effectively.
All batches of food should be easily identified, by a batch or lot number, to allow traceability of the commodity if required.
10.3. Basic principles of HACCP
©Vedpal Yadav, Lecturer in Food Technology, Government Polytechnic, Mandi Adampur, Hisar, Haryana, India‐125052. e‐mail‐ [email protected] +91‐9416589819 Page 109 of 134
There are seven discrete activities that are necessary to establish, implement and maintain a HACCP plan, and these are referred to as the 'seven principles' in the Codex Guideline (1997).
The seven principles are[1]:
1) Principle 1‐ Conduct a hazard analysis.
Identify hazards and assess the risks associated with them at each step in the commodity system. Describe possible control measures.
2) Principle 2‐ Determine the Critical Control Points (CCPs)
A critical control point is a step at which control can be applied and is essential to prevent or eliminate a food safety hazard, or reduce it to an acceptable level. The determination of a CCP can be facilitated by the application of a decision tree, such as the one given in Appendix IV.
3) Principle 3‐ Establish critical limits.
Each control measure associated with a CCP must have an associated critical limit which separates the acceptable from the unacceptable control parameter.
4) Principle 4‐ Establish a monitoring system
Monitoring is the scheduled measurement or observation at a CCP to assess whether the step is under control, i.e. within the critical limit(s) specified in Principle 3.
5) Principle 5‐ Establish a procedure for corrective action, when monitoring at a CCP indicates a deviation from an established critical limit.
6) Principle 6‐ Establish procedures for verification to confirm the effectiveness of the HACCP plan.
Such procedures include auditing of the HACCP plan to review deviations and product dispositions, and random sampling and checking to validate the whole plan.
7) Principle 7‐ Establish documentation concerning all procedures and records appropriate to these principles and their application
[1] please refer to Appendix 1 for a definition of the terms used in this section
10.4. Developing a HACCP plan
There are twelve tasks required to develop a HACCP plan and these are designed to ensure that the seven principles are applied correctly. Principle 1, which is to conduct a hazard analysis, requires that the first five tasks have all been addressed in a logical and honest manner so that all real hazards associated with the commodity have been identified. The twelve tasks are discussed briefly below, and listed in Appendix II.
1. Task 1 ‐ Establish a HACCP team
To fully understand the commodity system and be able to identify all likely hazards and CCPs, it is important that the HACCP team is made up of people from a wide range of disciplines. The team should include:
A team leader to convene the group and to direct the work of the team ensuring that the concept is properly applied. This person must be familiar with the technique, be a good listener and allow all participants to contribute.
©Vedpal Yadav, Lecturer in Food Technology, Government Polytechnic, Mandi Adampur, Hisar, Haryana, India‐125052. e‐mail‐ [email protected] +91‐9416589819 Page 110 of 134
A specialist with a detailed knowledge of the commodity system is required. This specialist will have a major role in the production of the commodity flow diagrams.
Several specialists, each with an understanding of particular hazards and associated risks, e.g. a microbiologist, a chemist, a mycotoxicologist, a toxicologist, a QC manager, a process engineer.
People, such as packaging specialists, raw material buyers, distribution staff or production staff, farmers, brokers, who are involved with the process, and have working knowledge of it, may be brought into the team temporarily in order to provide relevant expertise.
The team's progress and results of the analysis should be recorded by a technical secretary.
If any changes are made to composition or operational procedures, it will be necessary to re‐assess the HACCP plan in the light of the changes.
The first activity of the HACCP team is to identify the scope of the study. For example, will the whole commodity system be covered, or only selected components? This will make the task more manageable and specialists can be added to the team as and when they are required.
2. Task 2 ‐ Describe the product
To start a hazard analysis, a full description of the product, including customer specification, should be prepared using a form such as that given in Appendix III. This should include information relevant to safety, e.g. mycotoxin regulation/target level, composition, physical/chemical properties of the raw materials and the final product, the amount of water available for microbial growth (aw), the amount of acid or alkali in the product (pH). Also information regarding how the product is to be packaged, stored and transported should also be considered together with facts regarding its' shelf life and recommended storage temperatures. Where appropriate, labelling information and an example of the label should be included. This information will help the HACCP team to identify 'real' hazards associated with the process.
3. Task 3 ‐ Identify the product's intended use
How the product is intended to be used is an important consideration. Information on whether the product will be consumed directly, or be cooked, or be further processed, will all have a bearing on the hazard analysis, see task 6). The nature of the target group for the product may also be relevant, particularly if it includes susceptible groups such as infants, the elderly, and the malnourished. The likelihood of misuse of a product should also be considered, such as the use of pet food as a human food, either by accident or design. This information can be recorded on the same form as the product description, see Appendix III.
4. Task 4 ‐ Draw up the commodity flow diagram
The first function of the team is to draw up a detailed commodity flow diagram (CFD) of the commodity system, or that part of it which is relevant. The expertise of the commodity specialist is important at this stage. Commodity systems will differ in detail in different parts of the world, and even within one country there may be a number of variants. Secondary processing will need to be detailed for each factory, using generic flows only as a guide. Examples of commodity flow diagrams are included in the case studies presented in Chapter 3.
5. Task 5 ‐ On site confirmation of flow diagram
Upon completion of the CFD, members of the team should visit the commodity system (e.g. farm, store or manufacturing area) to compare the information present on the CFD with what actually happens in practice. This is known as "walking the line", a step by step practice to check that all information regarding materials, practices, controls etc. have been taken into consideration by the team during the preparation

©Vedpal Yadav, Lecturer in Food Technology, Government Polytechnic, Mandi Adampur, Hisar, Haryana, India‐125052. e‐mail‐ [email protected] +91‐9416589819 Page 111 of 134
of the CFD. Information such as time of harvest, drying procedures, storage conditions, the marketing chain, socio‐economic factors, grading systems and any incentive for improved quality or safety, and processing systems, should be collected and included in the CFD as appropriate. The site for which the HACCP plan is being designed should be visited as many times as possible to ensure that all relevant information has been collected.
6. Task 6 ‐ Identify and analyse hazard(s) ‐ (Principle 1)
Effective hazard identification and hazard analysis are the keys to a successful HACCP Plan. All real or potential hazards that may occur in each ingredient and at each stage of the commodity system should be considered. Food safety hazards for HACCP programmes have been classified into three types of hazards:
Biological: typically foodborne bacterial pathogens such as Salmonella, Listeria and E. coli, also viruses, algae, parasites and fungi.
Chemical: There are three principle types of chemical toxins found in foods: naturally occurring chemicals, e.g. cyanides in some root crops, and allergenic compounds in peanuts; toxins produced by micro‐organisms, e.g. mycotoxins, and algal toxins; and chemicals added to the commodity by man to control an identified problem, e.g. fungicides or insecticides.
Physical: contaminants such as broken glass, metal fragments, insects or stones.
The probability that a hazard will occur is called a risk. The risk may take a value from zero to one depending on the degree of certainty that the hazard will be absent or that it will be present. After hazard identification, a hazard analysis must be conducted to understand the relative health risk to man or animal posed by the hazard. It is a way of organizing and analyzing the available scientific information on the nature and size of the health risk associated with the hazard. The risk may have to be assessed subjectively and simply classified as low, medium, or high. Only those hazards considered by the HACCP team to present an unacceptable risk of being present are taken forward to Stage 7, Principle 2.
Once a food safety hazard has been identified, then appropriate control measures should be considered. These are any action or activity that can be used to control the identified hazard, such that it is prevented, eliminated, or reduced to an acceptable level. The control measure may also include training of personnel for a particular operation, covered by GAP, GMP, and GHP.
7. Task 7 ‐ Determine the critical control points (CCPs) ‐ (Principle 2).
Each step in the commodity flow diagram, within the scope of the HACCP study, should be taken in turn and the relevance of each identified hazard should be considered. It is also important to remember the stated scope of the HACCP analysis at this stage. The team must determine whether the hazard can occur at this step, and if so whether control measures exist. If the hazard can be controlled adequately, and is not best controlled at another step, and is essential for food safety, then this step is a CCP for the specified hazard. A decision tree can be used to determine CCPs, and an example of the Codex decision tree is included in Appendix IV. However, the HACCP team's judgment, expertise and knowledge of the process are the major factors in establishing CCPs.
If a step is identified where a food safety hazard exists, but no adequate control measures can be put in place either at this step or subsequently, then the product is unsafe for human consumption. Production should cease until control measures are available and a CCP can be introduced.
8. Task 8 ‐ Establish critical limits for each CCP ‐ (Principle 3)
Critical limits must be specified and validated for each CCP. Criteria often used include measurements of temperature, time, moisture level, pH, water activity, and sensory parameters such as visual appearance. In the case of mycotoxins for example, they may include the moisture content or the temperature of the

©Vedpal Yadav, Lecturer in Food Technology, Government Polytechnic, Mandi Adampur, Hisar, Haryana, India‐125052. e‐mail‐ [email protected] +91‐9416589819 Page 112 of 134
commodity. All critical limits, and the associated permissible tolerances, must be documented in the HACCP Plan Worksheet, and included as specifications in operating procedures and work instructions.
9. Task 9 ‐ Establish a monitoring procedure ‐ (Principle 4)
Monitoring is the mechanism for confirming that critical limits at each CCP are being met. The method chosen for monitoring must be sensitive and produce a rapid result so that trained operatives are able to detect any loss of control of the step. This is imperative so that corrective action can be taken as quickly as possible so that loss of product will be avoided or minimised.
Monitoring can be carried out by observation or by measurement, on samples taken in accordance with a statistically based sampling plan. Monitoring by visual observation is basic but gives rapid results, and can therefore be acted upon quickly. The most common measurements taken are time, temperature and moisture content.
10. Task 10 ‐ Establish corrective action ‐ (Principle 5)
If monitoring indicates that critical limits are not being met, thus demonstrating that the process is out of control, corrective action must be taken immediately. The corrective action should take into account the worst case scenario, but must also be based on the assessment of hazards, risk and severity, and on the final use of the product. Operatives responsible for monitoring CCPs should be familiar with and have received comprehensive training in how to effect a corrective action.
Corrective actions must ensure that the CCP has been brought back under control. They must also include appropriate disposition of any affected commodity or product. Whenever possible an alarm system should be introduced which will activate when monitoring indicates that the critical limit is being approached. Corrective action can then be applied to pre‐empt a deviation and prevent the need for any product disposition.
11. Task 11 ‐ Verify the HACCP plan ‐ (Principle 6)
Once the HACCP plan has been drawn up, and all of the CCPs have been validated, then the complete plan must be verified. Once the HACCP plan is in routine operation, it must be verified and reviewed at regular intervals. This should be a task of the person charged with the responsibility for that particular component of the commodity system The appropriateness of CCPs and control measures can thus be determined, and the extent and effectiveness of monitoring can be verified. Microbiological and/or alternative chemical tests can be used to confirm that the plan is in control and the product is meeting customer specifications. A formal internal auditing plan of the system will also demonstrate an ongoing commitment to keep the HACCP plan up to date, as well as representing an essential verification activity.
Ways in which the system can be verified include:
collecting samples for analysis by a method different from the monitoring procedure
asking questions of staff, especially CCP monitors
observing operations at CCPs
formal audit by independent person
It is important to remember that the HACCP system is set up for a particular formulation of product handled and processed in a given way.
12. Task 12 ‐ Keep record ‐ (Principle 7)
Record keeping is an essential part of the HACCP process. It demonstrates that the correct procedures have been followed from the start to the end of the process, offering product traceability. It provides a record of compliance with the critical limits set, and can be used to identify problem areas. Furthermore,

©Vedpal Yadav, Lecturer in Food Technology, Government Polytechnic, Mandi Adampur, Hisar, Haryana, India‐125052. e‐mail‐ [email protected] +91‐9416589819 Page 113 of 134
the documentation can be used by a company as evidence of 'Due Diligence Defense' as required, for instance, by the Food Safety Act 1990 (HMSO), in the UK.
Records that should be kept include: all processes and procedures linked to GMP, GHP, and CCP monitoring, deviations, and corrective actions.
Documents should also include those that recorded the original HACCP study, e.g. hazard identification and selection of critical limits, but the bulk of the documentation will be records concerned with the monitoring of CCPs and corrective actions taken. Record keeping can be carried out in a number of ways, ranging from simple check‐lists, to records and control charts. Manual and computer records are equally acceptable, but a documentation method should be designed that is appropriate for the size and nature of the enterprise.
10.5. Application of HACCP to mycotoxin control
Once tasks 1 to 5 have been completed the following will be in place: a HACCP team, a Description and Intended Use table, and a verified Commodity Flow Diagram. This will provide information on a specific commodity from a unique source, and this information is required to complete the hazard analysis.
Task 6 ‐ Mycotoxin hazard analysis and identification of possible control measures
Hazard Analysis
a) Identification of mycotoxin hazard
For a given commodity system in a particular location, the HACCP team need to first consider which, if any, of the mycotoxins known to constitute a food safety hazard are likely to be present.
Over 300 mycotoxins are known, but only a relatively few of these are widely accepted as presenting a significant food or animal feed safety risk. These hazardous mycotoxins are listed in Tables 1 and 2 in Chapter 1. of these only the following mycotoxins have regulatory limits set by one or more countries: the aflatoxins (including aflatoxin M1), ochratoxin A, zearalenone, patulin, ergot alkaloids, and deoxynivalenol. Guideline limits exist for fumonisin B1 and regulatory limits are likely to be set in the near future. The regulatory limits are taken as the target levels and should be included in the Product Description table. Mycotoxin limits can also be set by the customer in specific contracts and it is possible that these may include mycotoxins not subject to regulatory limits.
The risk of a particular mycotoxin hazard should be estimated using well established data on the relative susceptibilities of commodities to given mycotoxins and the climatic conditions required for the mycotoxins to be produced. The EU has identified the following animal feed ingredients, and their products, as being highly susceptible to aflatoxin contamination: maize, groundnut cake, cottonseed cake, babassu, palm kernel cake and copra cake. The EU has also identified the following foodstuffs as highly susceptible to aflatoxin contamination: dried figs and other dried fruit, groundnuts, pistachios and other edible nuts and cereals. These commodities are specified in the respective EC regulations (1525/98 amending regulation 194/97). Maize grown in temperate climates would be less likely to be contaminated with aflatoxin, but could be contaminated with trichothecene mycotoxins or fumonisin B1. Although published mycotoxin survey data exists for many commodities, it is important that surveillance studies are performed if mycotoxin data is lacking for a particular commodity, or for production in a particular climatic zone.
b) Identification of steps in the Commodity Flow Diagram (CFD) where mycotoxin contamination is most likely to occur
Once the mycotoxin hazard(s) has been identified, each step in the CFD must be considered in turn and the likelihood of mycotoxin contamination occurring must be assessed. Usually published scientific data

©Vedpal Yadav, Lecturer in Food Technology, Government Polytechnic, Mandi Adampur, Hisar, Haryana, India‐125052. e‐mail‐ [email protected] +91‐9416589819 Page 114 of 134
will be available to act as a guide, but it may be necessary to commission a study to determine, or confirm that the correct steps have been identified. The situation may change from year to year, and season to season, so there will need to be an element of mycotoxin surveillance in the HACCP plan.
An important fact to establish is whether pre‐harvest contamination with mycotoxins is likely or whether contamination occurs primarily post‐harvest. Mycotoxins produced by Fusarium spp, such as fumonisin B1 are invariably produced pre‐harvest, but climatic conditions effect the degree of blight and the resultant level of mycotoxin contamination. Aflatoxins can be produced both pre‐harvest and post‐harvest and climatic conditions can have a significant bearing: drought stress favours pre‐harvest contamination, whereas post‐harvest handling during the rainy season favours post‐harvest aflatoxin contamination.
It is rarely possible to be certain that pre‐harvest mycotoxin levels are below regulatory or target levels in the commodity system, so post‐harvest mycotoxin control measures can often only prevent or reduce ADDITIONAL contamination, rather than prevent the hazard completely. Consequently it is often necessary to introduce a segregation step to remove any batches containing an unacceptable level of mycotoxin.
c) Possible Mycotoxin Control Measures
The most effective mycotoxin control measures is to dry the commodity such that the water activity (aw) is too low to support mould growth and/or prevent mycotoxin production. To prevent the growth of most moulds the aw needs to be £ 0.70, which translates to a moisture content of approximately 14% for maize and 7.0% for groundnuts at 20°C (the corresponding moisture content decreases as the temperature increases). Each toxigenic mould has its own minimum water activity for growth and mycotoxin production and these translate into moisture contents for each commodity. These moisture contents are termed 'safe' and would be the critical limit for the control measure.
It is important to specify a target 'safe' moisture content with a maximum as well as an average value, e.g. 14% no part exceeding 15%. If only an average value is specified it may conceal a large range of moisture contents within the batch and the commodity would not be safe from mould growth and mycotoxin contamination. A drying process is required which dries evenly and the critical limits must be set bearing this in mind. Validation of such a CCP must involve moisture determination of multiple samples.
If the commodity is at an 'unsafe' moisture content for longer than 48 hours, then mould can grow and mycotoxins be produced. Hence limiting the time that the commodity spends in the 'unsafe' moisture content window to less than 48 hours is a control measure. This explains why timely sun‐drying can sometimes be safer than delayed mechanical drying. Two days on a drying floor with occasional turning can often achieve the target 'safe' moisture content, whereas a back‐log at the mechanical drier can result in the critical limit of 48 hours not being met.
Once produced, it is not usually possible to remove mycotoxins, other than by physical separation (grading) techniques. To apply this type of control measure, representative samples of batches of commodity are collected and tested for selected mycotoxins. Only those batches containing less than the critical limit of mycotoxin, as specified in official regulations, are accepted. For some commodities, such as blanched groundnuts, colour sorters may be effective in rejecting individual high‐aflatoxin nuts and accumulating low‐aflatoxin nuts, and may be classified as a control measure.
There are a few examples where effective chemical detoxification is possible, such as ammoniation of certain animal feed ingredients and refining of vegetable oils. These are control measures that would also be suitable for application at a critical control point for aflatoxin, but only for the specified commodities.
It is essential that GAP, GSP, and GMP pre‐requisites are in place, and simply ensuring that this is the case can significantly reduce the risk of the mycotoxin hazard. Examples of procedures which fall within the scope of these pre‐requisites include: irrigation, insect control, use of resistant varieties, and use of pallets in store.

©Vedpal Yadav, Lecturer in Food Technology, Government Polytechnic, Mandi Adampur, Hisar, Haryana, India‐125052. e‐mail‐ [email protected] +91‐9416589819 Page 115 of 134
Task 7 ‐ Determine Critical Control Points (CCPs)
Determination of CCPs can be achieved using a well designed decision tree, if necessary, to supplement the knowledge and experience of the HACCP team (see Appendix IV). Each step in the CFD is considered in turn, and the questions answered in sequence. It should be noted that it is necessary to be able to answer Yes to Question 1 (Do preventative control measures exist?) before a CCP can be established. The Codex 1997 definition of a control measure is any action and activity that can be used to prevent or eliminate a food safety hazard, or reduce it to an acceptable level.
There are commodity systems, such as the production of apple juice (Case study 5), where control measures are possible at a number of steps, and each is capable of achieving a known percentage reduction in the level of mycotoxin. It is possible, therefore, to calculate the acceptable level of patulin at each step and perform validation. If the risk of the acceptable level of mycotoxin being exceeded is considered to be sufficiently low, then the HACCP team may determine each of the steps as CCPs.
Task 8 ‐ Establish critical limits for each CCP
When the control measure is segregation based on mycotoxin analysis, then the critical limit will often be set at the acceptable level, which in turn will be set at, or below, the regulatory mycotoxin limit. Acceptable levels, and any associated critical limits, can sometimes be set higher than a regulatory limit, provided that a subsequent step can guarantee to attain the acceptable level of hazard in the final product.
For control measures that involve drying to a 'safe' moisture content, the parameter that will be measured, and for which critical limits will be set, will usually be parameters such as the temperature of the drier and the dwell time, e.g. for a continuous flow drier the critical limit for temperature could be 80 +/‐ 2°C and the critical limit for dwell time could be 20 +/‐ 1 minute.
Critical limits for chemical detoxification could be the temperature and pressure of the reaction vessel and the dwell time.
Task 9 ‐ Establish a monitoring system for each CCP
The monitoring system must be a scheduled measurement, usually of a basic parameter such as temperature or time, to detect any deviation from the critical limits.
When segregation of acceptable and unacceptable batches is required in the agricultural system, for example at a secondary trader, then rapid testing procedures are needed to test incoming batches.
A number of semi‐quantitative immunoaffinity rapid test kits are available which work to a stated target level, eg 5 or 20 µk/kg of the appropriate mycotoxin. Here the critical limit would normally be the presence or absence of a coloured derivative. More traditional mini‐column and TLC dilution to extinction techniques can still be useful for segregation of batches at the factory gate, and for these the presence or absence of a blue fluorescent band or spot is the critical limit.
Task 10 ‐ Establish a corrective action
There are two sorts of corrective action. The first is action to regain control. For instance if a critical limit for a moisture content is not attained, then the corrective action could be to check the specification of the drier and effect repairs, or perhaps to increase the temperature setting or the dwell time. The second type of corrective action is to isolate the product produced whilst the CCP was out of control and amend the product disposition, by either discarding or down‐grading it, or re‐processing it if this is appropriate.
Task 11 ‐ Establish verification procedures

©Vedpal Yadav, Lecturer in Food Technology, Government Polytechnic, Mandi Adampur, Hisar, Haryana, India‐125052. e‐mail‐ [email protected] +91‐9416589819 Page 116 of 134
At regular, specified, intervals the complete HACCP plan should be verified by checking that the levels of mycotoxin in the final product are within acceptable levels. If this is found not to be the case, then immediately trouble‐shooting should be carried out to identify the step at which the hazard has become out of control. Critical limits may need to be amended, or a new control measure may need to be validated and introduced. Similarly, if a review of deviations and product dispositions indicated an unacceptable degree of control at a particular CCP, then revisions will need to be made.
Task 12 ‐ Establish documentation and record keeping
Standard HACCP documentation and record keeping is appropriate, but the complexity of the records should reflect the sophistication of the step in the commodity system.
10.6. Conclusions
1. HACCP is a powerful tool with application to the control of mycotoxins in the commodity system. 2. Undertaking a HACCP study focuses the thinking of everyone involved with the product on the details
of the process, and promotes a greater awareness of safety issues. 3. Implementation of a HACCP system is not an end in itself. The ongoing maintenance of the HACCP
plan is where the benefit really lies.
10.7. Appendix I: Definition of terms
Based on Codex Alimentarius: HACCP System and Guidelines for its Application; Annex to CAC/RCP‐1 (1969), Rev.3 (1997)
Control (verb): To take all necessary actions to ensure and maintain compliance with criteria established in the HACCP plan.
Control (noun): The state wherein correct procedures are being followed and criteria are being met.
Control measure: Any action and activity that can be used to prevent or eliminate a food safety hazard or reduce it to an acceptable level.
Corrective action: Any action to be taken when the results of monitoring at the CCP indicate a loss of control.
Critical Control Point (CCP): A step at which control can be applied and is essential to prevent or eliminate a food safety hazard or reduce it to an acceptable level.
Critical limit: A criterion which separates acceptability from unacceptability, when monitoring a critical control point.
Deviation: Failure to meet a critical limit.
Flow diagram: A systematic representation of the sequence of steps or operations used in the production or manufacture of a particular food item.
HACCP: A system that identifies, evaluates, and controls hazards which are significant for food safety.
HACCP plan: A document prepared in accordance with the principles of HACCP to ensure control of hazards which are significant for food safety in the segment of the food chain under consideration.
Hazard: A biological, chemical or physical agent in, or condition of, food with the potential to cause an adverse health effect.

©Vedpal Yadav, Lecturer in Food Technology, Government Polytechnic, Mandi Adampur, Hisar, Haryana, India‐125052. e‐mail‐ [email protected] +91‐9416589819 Page 117 of 134
Hazard analysis: The process of collecting and evaluating information on hazards and conditions leading to their presence to decide which are significant for food safety and therefore should be addressed in the HACCP plan.
Monitor: The act of conducting a planned sequence of observations or measurements of control parameters to assess whether a CCP is under control.
Step: A point, procedure, operation or stage in the food chain including raw materials, from primary production to final consumption.
Validation: Obtaining evidence that the elements of the HACCP plan are effective.
Verification: The application of methods, procedures, tests and other evaluations, in addition to monitoring to determine compliance with the HACCP plan.
∙ Additional definitions to consider.
Acceptable level: The level of a safety hazard which is considered to present an acceptable, low risk to the consumer. The acceptable level of the final product, sometimes referred to as a target level, should be stated in the product description and would normally be set at, or below, any regulatory limits. An acceptable level for a hazard at an intermediate step in the commodity flow diagram can be set higher than that of the final product, provided that the acceptable level in the final product will be achieved.
Commodity system: The complete system, including: all pre‐ and post‐ harvest activities such as growing, harvesting, drying, storage, processing, marketing, and preparation for home consumption.
Commodity flow diagram: A flow diagram which details and numbers each step in the commodity system.
Decision tree: A series of questions linked diagrammatically to be answered with Yes or No. The answers determine which path is followed and which decision this leads to.
Primary trader: The first trader in the marketing chain who typically buys small quantities of commodity direct from farmers and accumulates these for dispatch to a secondary trader. The primary trader will often carry out partial drying and temporary storage.
Product disposition: How the product is to be utilised. If a deviation occurs at a CCP, then part of the corrective action will be to amend the product disposition.
Real hazard: A hazard which has been identified as having a significant risk of being present.
Risk: May take a value from zero to one depending on the degree of certainty that the hazard will be absent or that it will be present
Safe moisture content: the moisture content at or below which toxigenic moulds cannot grow. Relates to a minimum water activity for mould growth and toxin production.
Secondary trader: A trader who typically buys commodity from a primary trader and (further) dries and stores it.
Target level: The acceptable level of a hazard in the final product, such as the regulatory level of mycotoxin in a product description.
10.8. Appendix II: Tasks involved in developing HACCP system
(Based on Codex 1997)

©Vedpal Yadav, Lecturer in Food Technology, Government Polytechnic, Mandi Adampur, Hisar, Haryana, India‐125052. e‐mail‐ [email protected] +91‐9416589819 Page 118 of 134
Task 1. Assemble an HACCP team
Task 2. Describe product
Task 3. Define essential characteristics of the product and intended use
Task 4. Construct a Commodity Flow Diagram
Task 5. On‐site Confirmation of Flow Diagram
Task 6. List all Potential Hazards
Conduct a Hazard Analysis
Identify Control Measures
Task 7. Determine CCPs
Task 8. Establish Critical Limit for each CCP
Task 9. Establish a Monitoring System for each CCP
Task 10. Establish Corrective Action
for deviations that may occur
Task 11. Establish Verification procedures
Task 12. Establish Documentation and Record Keeping
10.9. Appendix III: Example of Form ‐ Description and identified use of product
Name of product
Full description of product including structure/variety, processing parameters, additive concentrations, storage instructions, pH/Aw/moisture levels, and any mycotoxin target levels (regulatory or to customer specification).
Customer specification
Conditions of storage and distribution
Shelf Life
Packaging
Instructions on the label
Target Consumer
Recommendation for further processing required before consumption
Intended use, e.g. will the end product be cooked before consumption?
10.10. Appendix IV: An example of decision tree to identify CCPs
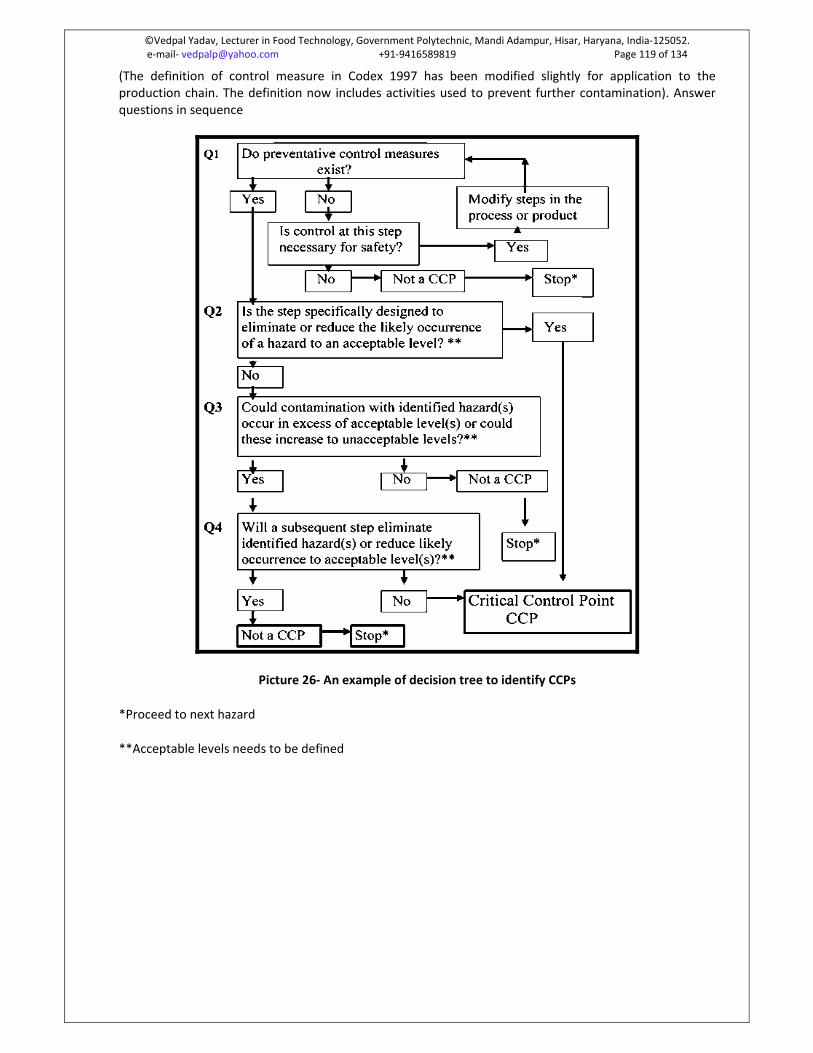
©Vedpal Yadav, Lecturer in Food Technology, Government Polytechnic, Mandi Adampur, Hisar, Haryana, India‐125052. e‐mail‐ [email protected] +91‐9416589819 Page 119 of 134
(The definition of control measure in Codex 1997 has been modified slightly for application to the production chain. The definition now includes activities used to prevent further contamination). Answer questions in sequence
Picture 26‐ An example of decision tree to identify CCPs
*Proceed to next hazard
**Acceptable levels needs to be defined

©Vedpal Yadav, Lecturer in Food Technology, Government Polytechnic, Mandi Adampur, Hisar, Haryana, India‐125052. e‐mail‐ [email protected] +91‐9416589819 Page 120 of 134
10.11. Appendix V: An Example of a HACCP Worksheet
1.
Describe Product
2.
Commodity Flow Diagram
3.
HACCP Analysis Plan
Step Hazard(s) Control Measures
Control Critical Limits
Monitoring Procedure
Corrective Actions
Records
4.
Verification
11. International Organization for Standardization (ISO)
The International Organization for Standardization (ISO) is a worldwide federation of national standards bodies from some 140 countries, one from each country. ISO is a non‐governmental organization established in 1947. The mission of ISO is to promote the development of standardization and related activities in the world with a view to facilitating the international exchange of goods and services, and to developing cooperation in the spheres of intellectual, scientific, technological and economic activity. ISO's work results in international agreements which are published as International Standards.
11.1. ISO's name
Many people will have noticed a seeming lack of correspondence between the official title when used in full, International Organization for Standardization, and the short form, ISO. Shouldn't the acronym be "IOS"? Yes, if it were an acronym – which it is not. In fact, "ISO" is a word, derived from the Greek isos, meaning "equal", which is the root of the prefix "iso‐" that occurs in a host of terms, such as "isometric" (of equal measure or dimensions) and "isonomy" (equality of laws, or of people before the law).

©Vedpal Yadav, Lecturer in Food Technology, Government Polytechnic, Mandi Adampur, Hisar, Haryana, India‐125052. e‐mail‐ [email protected] +91‐9416589819 Page 121 of 134
From "equal" to "standard", the line of thinking that led to the choice of "ISO" as the name of the organization is easy to follow. In addition, the name ISO is used around the world to denote the organization, thus avoiding the plethora of acronyms resulting from the translation of "International Organization for Standardization" into the different national languages of members, e.g. IOS in English, OIN in French (from Organisation internationale de normalisation). Whatever the country, the short form of the Organization's name is always ISO.
11.2. How it all started
International standardization began in the electrotechnical field: the International Electrotechnical Commission (IEC) was created in 1906. Pioneering work in other fields was carried out by the International Federation of the National Standardizing Associations (ISA), which was set up in 1926. The emphasis within ISA was laid heavily on mechanical engineering. ISA's activities ceased in 1942, owing to the Second World War. Following a meeting in London in 1946, delegates from 25 countries decided to create a new international organization "the object of which would be to facilitate the international coordination and unification of industrial standards". The new organization, ISO, began to function officially on 23 February 1947. The first ISO standard was published in 1951 with the title, "Standard reference temperature for industrial length measurement".
11.3. Who makes up ISO?
ISO is made up of its members who are divided into three categories: A member body of ISO is the national body "most representative of standardization in its country". Thus, only one body in each country may be admitted to membership of ISO. A member body takes the responsibility for:
informing potentially interested parties in their country of relevant international standardization opportunities and initiatives;
ensuring that a concerted view of the country's interests is presented during international negotiations leading to standards agreements;
providing their country's share of financial support for the central operations of ISO, through payment of membership dues.
Member bodies are entitled to participate and exercise full voting rights on any technical committee and policy committee of ISO. A correspondent member is usually an organization in a country which does not yet have a fully developed national standards activity. Correspondent members do not take an active part in the technical and policy development work, but are entitled to be kept fully informed about the work of interest to them. ISO has also established a third category, subscriber membership, for countries with very small economies. Subscriber members pay reduced membership fees that nevertheless allow them to maintain contact with international standardization.
11.4. What are standards?
Standards are documented agreements containing technical specifications or other precise criteria to be used consistently as rules, guidelines, or definitions of characteristics, to ensure that materials, products, processes and services are fit for their purpose.
For example, the format of the credit cards, phone cards, and "smart" cards that have become commonplace is derived from an ISO International Standard. Adhering to the standard, which defines such features as an optimal thickness (0,76 mm), means that the cards can be used worldwide.
International Standards thus contribute to making life simpler, and to increasing the reliability and effectiveness of the goods and services we use.
11.5. Why is international standardization needed?

©Vedpal Yadav, Lecturer in Food Technology, Government Polytechnic, Mandi Adampur, Hisar, Haryana, India‐125052. e‐mail‐ [email protected] +91‐9416589819 Page 122 of 134
The existence of non‐harmonized standards for similar technologies in different countries or regions can contribute to so‐called "technical barriers to trade". Export‐minded industries have long sensed the need to agree on world standards to help rationalize the international trading process. This was the origin of the establishment of ISO.
International standardization is well‐established for many technologies in such diverse fields as information processing and communications, textiles, packaging, distribution of goods, energy production and utilization, shipbuilding, banking and financial services. It will continue to grow in importance for all sectors of industrial activity for the foreseeable future.
The main reasons are:
11.5.1. Worldwide progress in trade liberalization
Today's free‐market economies increasingly encourage diverse sources of supply and provide opportunities for expanding markets. On the technology side, fair competition needs to be based on identifiable, clearly defined common references that are recognized from one country to the next, and from one region to the other. An industry‐wide standard, internationally recognized, developed by consensus among trading partners, serves as the language of trade.
11.5.2. Interpenetration of sectors
No industry in today's world can truly claim to be completely independent of components, products, rules of application, etc., that have been developed in other sectors. Bolts are used in aviation and for agricultural machinery; welding plays a role in mechanical and nuclear engineering and electronic data processing has penetrated all industries. Environmentally friendly products and processes, and recyclable or biodegradable packaging are pervasive concerns.
11.5.3. Worldwide communications systems
The computer industry offers a good example of technology that needs quickly and progressively to be standardized at a global level. Full compatibility among open systems fosters healthy competition among producers, and offers real options to users since it is a powerful catalyst for innovation, improved productivity and cost‐cutting.
11.5.4. Global standards for emerging technologies
Standardization programmes in completely new fields are now being developed. Such fields include advanced materials, the environment, life sciences, urbanization and construction. In the very early stages of new technology development, applications can be imagined but functional prototypes do not exist. Here, the need for standardization is in defining terminology and accumulating databases of quantitative information.
11.5.5. Developing countries
Development agencies are increasingly recognizing that a standardization infrastructure is a basic condition for the success of economic policies aimed at achieving sustainable development. Creating such an infrastructure in developing countries is essential for improving productivity, market competitiveness, and export capability.
Industry‐wide standardization is a condition existing within a particular industrial sector when the large majority of products or services conform to the same standards. It results from consensus agreements reached between all economic players in that industrial sector ‐ suppliers, users, and often governments. They agree on specifications and criteria to be applied consistently in the choice and classification of materials, the manufacture of products, and the provision of services. The aim is to facilitate trade, exchange and technology transfer through:
enhanced product quality and reliability at a reasonable price;
improved health, safety and environmental protection, and reduction of waste;
greater compatibility and interoperability of goods and services;
simplification for improved usability;

©Vedpal Yadav, Lecturer in Food Technology, Government Polytechnic, Mandi Adampur, Hisar, Haryana, India‐125052. e‐mail‐ [email protected] +91‐9416589819 Page 123 of 134
reduction in the number of models, and thus reduction in costs;
increased distribution efficiency, and ease of maintenance.
Users have more confidence in products and services that conform to International Standards. Assurance of conformity can be provided by manufacturers' declarations, or by audits carried out by independent bodies.
11.6. ISO 9000 and ISO 14000 ‐ in brief
The ISO 9000 and ISO 14000 families are among ISO's most widely known standards ever. ISO 9000 and ISO 14000 standards are implemented by some 760 900 organizations in 154 countries. ISO 9000 has become an international reference for quality management requirements in business‐to‐business dealings, and ISO 14000 is well on the way to achieving as much, if not more, in enabling organizations to meet their environmental challenges.
The ISO 9000 family is primarily concerned with "quality management". This means what the organization does to fulfil:
the customer's quality requirements, and
applicable regulatory requirements, while aiming to
enhance customer satisfaction, and
achieve continual improvement of its performance in pursuit of these objectives.
The ISO 14000 family is primarily concerned with "environmental management". This means what the organization does to:
minimize harmful effects on the environment caused by its activities, and to
achieve continual improvement of its environmental performance.
The vast majority of ISO standards are highly specific to a particular product, material, or process. However, the standards that have earned the ISO 9000 and ISO 14000 families a worldwide reputation are known as "generic management system standards".
"Generic" means that the same standards can be applied:
to any organization, large or small, whatever its product
including whether its "product" is actually a service,
in any sector of activity, and
whether it is a business enterprise, a public administration, or a government department.
"Generic" also signifies that no matter what the organization's scope of activity, if it wants to establish a quality management system or an environmental management system, then such a system has a number of essential features for which the relevant standards of the ISO 9000 or ISO 14000 families provide the requirements.
"Management system" refers to the organization's structure for managing its processes ‐ or activities ‐ that transform inputs of resources into a product or service which meet the organization's objectives, such as satisfying the customer's quality requirements, complying to regulations, or meeting environmental objectives.
11.7. Contents of ISO 9001
ISO 9001:2008 Quality management systems — Requirements is a document of approximately 30 pages which is available from the national standards organization in each country. Outline contents are as follows:.

©Vedpal Yadav, Lecturer in Food Technology, Government Polytechnic, Mandi Adampur, Hisar, Haryana, India‐125052. e‐mail‐ [email protected] +91‐9416589819 Page 124 of 134
Page iv: Foreword Pages v to vii: Section 0 Intro Pages 1 to 14: Requirements Section 1: Scope Section 2: Normative Reference Section 3: Terms and definitions (specific to ISO 9001, not specified in ISO 9000) Section 4: Quality Management System Section 5: Management Responsibility Section 6: Resource Management Section 7: Product Realization Section 8: Measurement, analysis and improvement
The standard specifies six compulsory documents: 1) Control of Documents (4.2.3) 2) Control of Records (4.2.4) 3) Internal Audits (8.2.2) 4) Control of Nonconforming Product / Service (8.3) 5) Corrective Action (8.5.2) 6) Preventive Action (8.5.3)
In addition to these, ISO 9001:2008 requires a Quality Policy and Quality Manual (which may or may not include the above documents).
11.8. Summary of ISO 9001
The quality policy is a formal statement from management, closely linked to the business and marketing plan and to customer needs. The quality policy is understood and followed at all levels and by all employees. Each employee needs measurable objectives to work towards. Decisions about the quality system are made based on recorded data and the system is regularly audited and evaluated for conformance and effectiveness. Records should show how and where raw materials and products were processed, to allow products and problems to be traced to the source. You need to determine customer requirements and create systems for communicating with customers about product information, inquiries, contracts, orders, feedback and complaints. When developing new products, you need to plan the stages of development, with appropriate testing at each stage. You need to test and document whether the product meets design requirements, regulatory requirements and user needs. You need to regularly review performance through internal audits and meetings. Determine whether the quality system is working and what improvements can be made. Deal with past problems and potential problems. Keep records of these activities and the resulting decisions, and monitor their effectiveness (note: you need a documented procedure for internal audits). You need documented procedures for dealing with actual and potential nonconformances (problems involving suppliers or customers, or internal problems). Make sure no one uses bad product, determine what to do with bad product, deal with the root cause of the problem seeking and keep records to use as a tool to improve the system.
11.8.1. ISO 22000
ISO 22000 is a standard developed by the International Organization for Standardization dealing with food safety. This is a general derivative of ISO 9000.
11.8.1.1. ISO 22000 standard
The ISO 22000 international standard specifies the requirements for a food safety management system that involves the following elements: interactive communication system management prerequisite programs HACCP principles

©Vedpal Yadav, Lecturer in Food Technology, Government Polytechnic, Mandi Adampur, Hisar, Haryana, India‐125052. e‐mail‐ [email protected] +91‐9416589819 Page 125 of 134
Critical reviews of the above elements have been conducted by many scientists. Communication along the food chain is essential to ensure that all relevant food safety hazards are identified and adequately controlled at each step within the food chain. This implies communication between organizations both upstream and downstream in the food chain. Communication with customers and supplies about identified hazards and control measures will assist in clarifying customer and supplier requirements. Recognition of the organization's role and position within the food chain is essential to ensure effective interactive communication throughout the chain in order to deliver safe food products to the final consumer. The most effective food safety systems are established, operated and updated within the framework of a structured management system and incorporated into the overall management activities of the organization. This provides maximum benefit for the organization and interested parties. ISO 22000 has been aligned with ISO 9001 in order to enhance the compatibility of the two standards. ISO 22000 can be applied independently of other management system standards or integrated with existing management system requirements. ISO 22000 integrates the principles of the Hazard Analysis and Critical Control Point (HACCP) system and application steps developed by the Codex Alimentarius Commission. By means of auditable requirements, it combines the HACCP plan with prerequisite programmes. Hazard analysis is the key to an effective food safety management system, since conducting a hazard analysis assists in organizing the knowledge required to establish an effective combination of control measures. ISO 22000 requires that all hazards that may be reasonably expected to occur in the food chain, including hazards that may be associated with the type of process and facilities used, are identified and assessed. Thus it provides the means to determine and document why certain identified hazards need to be controlled by a particular organization and why others need not. During hazard analysis, the organization determines the strategy to be used to ensure hazard control by combining the prerequisite programmes and the HACCP plan. ISO is developing additional standards that are related to ISO 22000. These standards will be known as the ISO 22000 family of standards. At the present time, the following standards will make up the ISO 22000 family of standards: ISO 22000 ‐ Food safety management systems ‐ Requirements for any organization in the food
chain. ISO 22001 ‐ Guidelines on the application of ISO 9001:2000 for the food and drink industry
(replaces: ISO 15161:2001). ISO 22002‐ Prerequisite programmes on food safety—Part 1: Food manufacturing ISO 22003 ‐ Food safety management systems for bodies providing audit and certification of food
safety management systems. ISO 22004 ‐ Food safety management systems ‐ Guidance on the application of ISO 22000:2005. ISO 22005 ‐ Traceability in the feed and food chain ‐ General principles and basic requirements for
system design and implementation. ISO 22006 ‐ Quality management systems ‐ Guidance on the application of ISO 9002:2000 for crop
production. ISO 22000 is also used in the Food Safety Systems Certification (FSSC) Scheme FS22000. FS22000 is
a Global Food Safety Initiative (GFSI) approved scheme.
12. Laboratory Designing
12.1. Key Considerations in Laboratory Design: An Analytical Approach
There are several integrated factors that affect the quality of the analytical testing process for food and dietary supplement products and ingredients. From a scientific perspective, the expertise of the laboratory staff and quality of the instrumentation are certainly of primary importance. From a regulatory viewpoint, adherence to mandates such as Good Laboratory Practices (GLPs) are key to compliance and the acceptability of the data. We also must not forget management expectations for a return on investment and customer demands that place a premium on efficiency and quick turnaround times without compromising the accuracy and integrity of the data. Although tools such as electronic delivery of data are invaluable in attaining these goals, what is sometimes overlooked is that all of these factors are significantly impacted by the physical design of the laboratory and the processes it promotes. Regardless

©Vedpal Yadav, Lecturer in Food Technology, Government Polytechnic, Mandi Adampur, Hisar, Haryana, India‐125052. e‐mail‐ [email protected] +91‐9416589819 Page 126 of 134
of whether you are designing a new laboratory or modifying an existing facility, the interaction of all these factors and their impact on what is “critical to success” must be considered.
12.2. Starting from Scratch
With purpose‐built laboratory space you have the luxury of starting with a blank slate and can take full advantage of engineering the space to achieve the ideal relationships between staff, equipment and space. This exercise starts with the development of a high‐level sample flow process map (Figure 1), identifying the primary steps in the testing pathway of a typical sample. Staff input is an invaluable factor in laboratory design. Although standard operating procedures (SOPs) define the testing process, the nuances used by experienced scientists and technicians to facilitate accurate and efficient assays should be captured and taken into consideration in the planning process. Another valuable exercise is the use of time of motion studies to help determine the distance traveled by analysts as a sample progresses through the testing process. This will allow an evaluation of the needed coordination between functional areas (e.g., sample preparation, vitamin chemistry) and their location’s potential effect on the efficiency and accuracy of the testing process. With this information in hand, a basic concept of the floor design based on the actual sample flow and data collection procedures can be developed.
After establishing the basic flow, a number of other factors and relationships must be evaluated, including sample volume, staffing numbers and myriad support systems issues. Capacity is based not only on historical numbers, but considerations for future expansions and modifications based upon projected business plans and customer expectations for growth. The development of capacity models is used to determine not only space, but number of instruments, storage requirements, and mechanical support issues such as glassware washing, fume hoods, network connections and piping of gas for instrumentation.
Several tools can aid in the brainstorming and development of ideas. Certainly the development of a more detailed functional process map that further breaks down the basic flow chart into more specific steps and phases should be generated at some point. The level of minutia included in the diagram is highly dependent on the size and complexity of the operation and the knowledge base of those involved in the planning. For example, a breakdown of vitamin analysis into extraction, separation and quantification may be sufficient for some projects, whereas more specific assay information could be appropriate for other situations.
By using rudimentary CAD floor plans, a “puzzle approach” involving model activity blocks sized to capacity scale (Figure 2) can be employed to better visualize workflow. Although this may be reminiscent of children’s building blocks and appear to be a simplistic approach, this tool can be very valuable in the brainstorming stage to explore many possibilities for test sample flow and staff accessibility. In addition, if the laboratory is a stand‐alone facility, space for administrative offices, technology hubs and platforms, and even a cafeteria must be included.
Throughout this process, representatives of the design firm must be involved to provide increasingly detailed versions of floor plans. This will encourage the discussion about features that could potentially increase the efficiency of the system. An open/generic concept is best and most adaptable for future modifications. In addition open technician areas within a reasonable proximity to work area facilitate staff interaction and open communication.

©Vedpal Yadav, Lecturer in Food Technology, Government Polytechnic, Mandi Adampur, Hisar, Haryana, India‐125052. e‐mail‐ [email protected] +91‐9416589819 Page 127 of 134
Figure 7‐ Typical Sample Flow for Analysis
12.3. Making Modifications
Although sample flow is still a vital consideration, physical and budgetary impediments might limit the flexibility to completely modify laboratory space. Redesigning existing facilities is more than purchasing new furniture and requires a step back to get the view from 50,000 feet. When looking at modifying and updating operations, you must evaluate the entire system including staff, equipment, procedures and space to identify factors that are critical to success. These are the components of the process that make the operation successful. Like the purpose‐built process, a good place to start is to generate a process map that identifies all the steps in the sample handling and testing process. However, in modifying existing space, the prioritization of the issues that are identified as critical to success is essential.

©Vedpal Yadav, Lecturer in Food Technology, Government Polytechnic, Mandi Adampur, Hisar, Haryana, India‐125052. e‐mail‐ [email protected] +91‐9416589819 Page 128 of 134
Factors that are critical to success include:
importance to quality; error‐free data; error‐free reports; proper documentation; validated data acquisition systems; impact on delivery; on time reports; real‐time data acquisition; centralized databases; influence on cost; and operations within budget.
Identify one or two of the critical success factors upon which to set the direction of the renovation.For example, in a laboratory setting, the most critical factors may not be cost and pricing, but be identified as error‐free, accurate data. A further breakdown shows that well‐trained and motivated staff is the key component in attaining this goal. Although education and experience are certainly a primary factor in maintaining an expert staff, other less obvious factors such as quiet work areas, easy access to computers, and proximity to supervisory and senior scientific staff are essential for success. At a lower level, access to samples and support areas such as sample preparation must also be a consideration. Regardless of the factors identified as most critical for success, design and re‐engineer the operation based on priorities and customer expectations.
12.4. Innovation, Automation Upgrade Labs
Electronic data systems have revolutionized the scientific laboratory. Tracking of samples, data collection, review and reporting are now all done using automated systems. Computer systems must be a key component of planning. Data ports for network access should be spread liberally to provide links to the laboratory information management system (LIMS) as well as to data collection and storage systems. Wherever possible, common terminals should be used. With today’s powerful systems, multiple instruments can be controlled from a common workstation that can reduce the number of acquisition devices and simplifies the back‐up process. Workstations housed in non‐laboratory areas can preserve precious space and increase efficiency and worker satisfaction.
There are several solutions to conserving space and promoting accuracy. The use of racking systems and dedicated instrument rooms allows a reduction of the clutter on lab counters and frees up bench space for more efficient wet chemistry assays and extraction processes. Wherever possible, dedicated equipment should be employed for both scientific and economic reasons. One of the primary causes of assay variability is the setup of the instrumentation. By designating space for specific assays, problems associated with instrument setup can be drastically reduced. In addition, moving an instrument is time consuming and affects not only the bottom line but schedules as well.
Look for centralization of chemicals, glassware washing facilities and storage to reduce costs. Innovative approaches such as the use of off‐shifting can dilute fixed costs and ease technician congestion. Adequate and comfortable space for staff is essential for employee morale and to facilitate effective supervisory span‐of‐control. Other staffing considerations include the number of supervisory personnel and corresponding office space. Many organizations have found that a headcount of seven to 11 employees per manager is ideal. However this is dependent on the amount of technical or non‐supervisory obligations.
Certainly there are a plethora of other financial and business exercises involved in the due diligence process and construction of an analytical facility. However, taking the time to thoroughly understand and evaluate sample volume and flow allows the modeling of different alternatives and ensures functional areas are balanced to “best fit.” In order to increase efficiency and accuracy of testing programs, scientific

©Vedpal Yadav, Lecturer in Food Technology, Government Polytechnic, Mandi Adampur, Hisar, Haryana, India‐125052. e‐mail‐ [email protected] +91‐9416589819 Page 129 of 134
methods are continually evolving. It is important that laboratory design and sample flow are similarly dynamic and play an integral role in maintaining accuracy as well as promoting efficiency in the laboratory.
Randall Smith and Richard Crowley are with Covance Laboratories, a full‐service analytical laboratory serving the dietary supplement and functional food industries. For more information, visit www.covance.com/analytical.
Figure 8‐ Sample Outlay Plans for Food Laboratory
12.5. Analytical Labs Facing Challenges
The work done by an analytical laboratory provides the foundation for regulatory and legal compliance on nutritional and microbial requirements, as well as the basis for marketing and health claims. Emerging issues of food safety and product credibility pose many challenges to the analytical chemist and quality‐control staff responsible for ensuring accuracy and reliability of data.
To learn more about meeting consumer demands and regulatory requirements in today’s marketplace, more than 80 professionals from the scientific and business sides of food and dietary supplement companies attended a special regulatory and scientific symposium sponsored by Covance Laboratories and the University of Wisconsin Food Research Institute, Madison.
Sessions covered such topics as new analytical methods for antioxidant activity, lutein and contaminants; performance evaluation of testing methodology; and implementation of Six‐Sigma to ensure quality in a business. In addition, speakers addressed issues concerning proposed GMPs (good manufacturing practices) for dietary supplements and the impact of Codex on the supplement industry.
In response to questions on Codex and differing international regulations, Jim Roza, vice president of business development, technology and sciences with SourceOne Global Partners, said: “One advantage Codex will have for companies that produce products and sell them overseas, it kind of levels the playing field. ... We can adhere to one standard and gain access to all these countries. It has been beneficial in that respect.”

©Vedpal Yadav, Lecturer in Food Technology, Government Polytechnic, Mandi Adampur, Hisar, Haryana, India‐125052. e‐mail‐ [email protected] +91‐9416589819 Page 130 of 134
Panelists further addressed marketplace drivers for laboratory needs in the future. David Morrison, vice president of scientific and regulatory affairs at The Vitamin Shoppe, spoke about the need to build consumer confidence in a product’s quality and efficacy through testing and establishing the science base behind ingredients. He added that effective strategies for assuring quality to consumers include company brands and branded ingredients.
Roza also identified market drivers for functional foods as ease of compliance and convenience for consumers who might need to take many tablets or capsules of a supplement to get the same amount in a serving of a food; existing and new health claims that herald the good science behind the product; and the value‐added aspects—flavormasking, increased bioavailability and improved flavor.
Putting the work of laboratories in perspective, Darryl Sullivan, Covance’s senior manager, food and drug analysis, said there are many similarities in the testing needs of supplements and functional foods. He added that today’s consumers are more informed and good companies need to inform them on product safety and the quality testing that supports it. He concluded: “The scientific community, I think, has a huge responsibility in this effort moving forward. It is incumbent on us to make sure that we have good science and that we have very, very good methodology to conduct these tests with.”

©Vedpal Yadav, Lecturer in Food Technology, Government Polytechnic, Mandi Adampur, Hisar, Haryana, India‐125052. e‐mail‐ [email protected] +91‐9416589819 Page 131 of 134
Index
Acceptable level ............................................... 121 Adams Consistometer ................................. 76, 80 Adhesiveness ..................................................... 78 Administrative hierarchy ................................... 85 Air Quality and Ventilation .............................. 100 Airtight closure of cans ...................................... 37 Apparent Testing ............................................... 55 Appearance ............................................ 31, 50, 56 Appearance Factors ........................................... 50 Approved Supplier List ....................................... 18 Areas for Quality Objectives .............................. 28 Aroma ................................................................ 50 Association with International Standards Bodies
....................................................................... 90 Astringency ........................................................ 57 Automation ...................................................... 133 Awareness and Responsibilities ...................... 109 Basic Methods of Quality Control ...................... 30 Basic principles of HACCP ................................ 112 Benefiting Businesses ........................................ 29 Blue .................................................................... 53 Bostwick Consistometer .................................... 76 Brabender Farinograph ............................... 76, 80 Brittleness .......................................................... 79 Brookfield Synchrolectric Viscometer ............... 76 Brown ................................................................ 53 Bulk sampling ..................................................... 47 Bureau of Indian Standards ......................... 88, 89 Cell structure ..................................................... 74 Chemical analysis ............................................... 38 Chemical Methods ............................................. 73 Chewiness .......................................................... 79 Christal Texturometer (cutting) ......................... 78 Cleaning ............................... 95, 97, 100, 104, 105 Cleaning Procedures and Methods ................. 105 Cleaning Programmes ...................................... 105 Codex Alimentarius Commission (CAC) ....... 92, 93 cohesiveness ...................................................... 80 Cohesiveness ..................................................... 78 Color and Gloss .................................................. 51 Colour .......................................................... 31, 56 Colour Dictionaries ............................................ 75 Colour Measurement......................................... 75 Coloured chips ................................................... 75 Colours' Specifications ....................................... 52 Commodity flow diagram ................................ 121 Commodity system .......................................... 121 Company or Voluntary Standards ..................... 89 Composite sample ............................................. 46 Composite Scoring Test ..................................... 66 Compressimeter ................................................ 79 Conducting Sensory Tests .................................. 58 Consistency .................................................. 54, 58 Consistency of semi‐solid .................................. 80 Consumer Education ....................................... 109
Consumer or Grade Standards .......................... 89 Consumer panels ............................................... 59 Containers For Waste and Inedible Substances 99 Contaminant ...................................................... 95 Contamination ................................................... 95 Contents of ISO 9001 ....................................... 129 Continual Improvement .................................... 28 Continuous Sampling ......................................... 48 Control1, 26, 83, 84, 91, 94, 96, 101, 112, 113, 118, 119, 120, 122, 125, 129, 130
Control measure .............................................. 120 Control of Food Hazards .................................. 101 Control of Operation ............................... 101, 112 Control points .................................................... 14 Corrective action ..................................... 116, 120 crispness ............................................................ 80 Critical Control Point (CCP) .............................. 120 Critical Control Points from a Fresh Cucumber Process ........................................................... 22
Critical limit ...................................................... 121 Customer Focus ................................................. 27 Cutting firmness ................................................. 79 decision tree .................... 113, 115, 119, 123, 124 Decision tree .................................................... 121 Definitions Pertaining to Quality ....................... 26 Description and identified use of product ....... 123 Descriptive Flavour Profile Method ................... 68 Descriptive statistics .......................................... 71 Design and Layout ............................................. 98 Design of experiment ........................................ 59 Deviation .......................................................... 121 Difference Tests ................................................. 60 Dilution Test ....................................................... 67 Disc colorimeter ................................................. 75 Discriminative, communicative or send trained panels ............................................................. 58
Disinfection ................................................ 95, 104 Documentation and Records ........................... 104 Drainage and Waste Disposal .......................... 100 Drying ................................................................. 74 Duo‐Trio Test ..................................................... 61 Efflux‐Tube Viscometer ..................................... 76 Elasticity ............................................................. 80 Empirical Testing ................................................ 55 Environmental Hygiene ..................................... 96 environmental management ........................... 128 Enzyme inactivation ........................................... 45 Equipment ....................................... 33, 87, 98, 99 Eradication ....................................................... 106 Establishment ...................... 95, 97, 104, 106, 111 Establishment Design and Facilities ................. 111 Establishments ................................... 98, 104, 106 Evaluation Card .................................................. 60 Evaluation Methods ........................................... 73

©Vedpal Yadav, Lecturer in Food Technology, Government Polytechnic, Mandi Adampur, Hisar, Haryana, India‐125052. e‐mail‐ [email protected] +91‐9416589819 Page 132 of 134
Evaluation of Food Quality by Sensory Evaluation ....................................................................... 56
Experimental design issues ................................ 71 Extrusion ............................................................ 80 Facilities ............................................... 97, 99, 100 Factual Approach to Decision Making ............... 28 Fibrometer ......................................................... 77 firmness ............................................................. 80 Firmness ............................................................. 79 Flavor Factors .................................................... 55 Flavour ............................................................... 56 Flow diagram ................................................... 121 Food Control and Monitoring Equipment ......... 99 Food handler ...................................................... 96 Food hygiene ............................................. 95, 109 Food Laws .......................................................... 88 Food Laws and Standards .................................. 84 Food Product Formula Document ..................... 18 Food Product Standards Format ....................... 19 Food safety ........................................ 96, 115, 130 Food Standards .................................................. 88 Food suitability .................................................. 96 Food Texture Testing Terminology .................... 78 Fracturability ...................................................... 79 Fruit Products Order .......................................... 86 Fundamental Parameters .................................. 78 Fundamental Testing ......................................... 55 Gel strength ....................................................... 80 Good Agricultural Practices ............................. 111 Good Manufacturing Practices ........................ 111 Good Manufacturing Practices and Sanitation .. 23 Green ................................................................. 52 Grievance Cell .................................................... 91 Gross sample ..................................................... 46 Guidelines for Setting Up of Unit Under Fruit Products Order .............................................. 86
Gumminess ........................................................ 79 HACCP94, 95, 96, 99, 101, 110, 111, 113, 114, 115, 116, 117, 118, 119, 120, 121, 122, 125, 130
HACCP plan113, 114, 115, 116, 118, 120, 121, 130
HACCP Worksheet ........................................... 125 Handling, Storage and Transport ....................... 97 Harbourage and Infestation ............................ 106 hardness ............................................................ 80 Hardness ...................................................... 78, 80 Hazard .... 91, 94, 96, 101, 117, 121, 122, 125, 130 Hazard analysis ........................................ 121, 130 Hazard Analysis and Critical Control Point (HACCP) .......................................... 94, 110, 130
Health Status ................................................... 106 Hedonic Rating Test ........................................... 64 Homogeneity ..................................................... 47 Humidity ............................................................ 35 Hygienic Production of Food Sources ................ 96
Ice and Steam .................................................. 103 identify60, 71, 94, 101, 109, 113, 114, 117, 120, 123, 124, 132
Illness and Injuries ........................................... 107 implement ............................. 89, 94, 96, 101, 113 Incoming Material Requirements .................... 102 Increment .......................................................... 46 Index to volume ................................................. 74 Individual ........................................................... 47 Industry Standards ............................................. 89 Influence of Color and Texture on Flavor .......... 55 Ingredient Specification Document ................... 17 Ingredient Specifications ................................... 17 Innovation ........................................................ 133 In‐Process Records ............................................. 22 Instruction and Supervision ............................. 110 Instruments in Food Analysis ............................. 80 Instruments Used in Texture Analysis ............... 79 Internal Structures and Fittings ......................... 98 International Organization for Standardization (ISO) ............................................................. 125
Involvement of People ....................................... 28 ISO 14000 ......................................................... 128 ISO 22000 ........................................... 91, 129, 130 ISO 22000 standard ......................................... 130 ISO 9000 ........................................... 111, 128, 129 Judgment Sampling ........................................... 46 Key Aspects of Hygiene Control Systems ........ 101 Kramer shear press ............................................ 78 Labelling ........................................................... 109 Laboratories ....................................................... 90 Laboratory Analysis ........................................... 24 Laboratory Designing ....................................... 130 Laboratory sample ............................................. 46 Leadership ......................................................... 27 Legal Standards .................................................. 89 Lighting ............................................................ 100 Limitations of sensory evaluation ...................... 69 Location ............................................................. 98 Lot ...................................................................... 46 Lot Identification .............................................. 109 Magness‐Taylor Pressure tester (compression) 77 Maintenance and Cleaning .............................. 104 Maintenance and Sanitation ................... 104, 112 Management and Supervision ......................... 103 Management system ....................................... 128 Management System Certification .............. 90, 91 Mandatory rules ................................................ 30 Manual Sampling ............................................... 47 Manufacturing Procedure for Use by Production and Quality Control Personnel ...................... 21
Manufacturing Procedures ................................ 21 Measuring Texture ............................................. 53 Microbiological and Other Specifications ........ 102 Microbiological Cross‐Contamination ............. 102 Microbiological Examination ............................. 41

©Vedpal Yadav, Lecturer in Food Technology, Government Polytechnic, Mandi Adampur, Hisar, Haryana, India‐125052. e‐mail‐ [email protected] +91‐9416589819 Page 133 of 134
Microscopic Examination .................................. 73 Moisture ............................................................ 74 Moisture/fat/protein determination ................. 40 monitor ............................................ 101, 104, 129 Monitor ............................................................ 121 Monitoring and Detection ............................... 106 Monitoring Effectiveness ................................. 106 Mouth feel ......................................................... 57 Multiple Sample Difference Test ....................... 63 Mutually Beneficial Supplier Relationships ....... 28 mycotoxin hazard ............................ 117, 118, 119 National Building Code of India, 2005 ............... 91 National Institute of Training for Standardization (NITS) ............................................................. 91
Numerical Scoring Test ...................................... 65 Objective Evaluation .......................................... 72 Odour ................................................................. 56 Organoleptic Evaluation .................................... 31 Other Physical Test Methods ............................. 38 Packaging ........................................... 86, 103, 123 Packaging and Labeling ...................................... 23 Paired Comparison Test ..................................... 60 Penetrometer ........................................ 14, 76, 79 Percent Sag ........................................................ 76 Personal Behaviour .......................................... 107 Personal Cleanliness ........................................ 107 Personal Hygiene ............................................. 106 Personnel Hygiene ..................................... 97, 112 Personnel Hygiene Facilities and Toilets ......... 100 Pest Control Systems ....................................... 105 pH‐measurement ............................................... 39 Photography ...................................................... 75 Physical and Chemical Contamination ............ 102 Physical Methods ............................................... 74 Physical Test Methods ....................................... 33 Physicochemical and Mechanical Properties of Food ............................................................... 49
Physico‐Chemical Methods ............................... 73 Population ......................................................... 46 Possible Mycotoxin Control Measures ............ 118 Powers of food inspectors ................................. 85 Premises and Rooms ......................................... 98 Preparation of dry food samples ....................... 44 Preparation of moist solid foods ....................... 44 Preparation of samples ...................................... 59 Preparation of Samples ..................................... 44 Preparation of semi‐solid/liquid foods .............. 45 Press fluids ......................................................... 74 Preventing Access ............................................ 105 Prevention of Food Adulteration Act .......... 84, 85 Primary Production .............................. 96, 97, 111 Primary trader ................................................. 122 Principal and Functions of Quality Assurance ... 26 Process Approach .............................................. 28 Product Certification Scheme ............................ 90 Product disposition .......................................... 122
Product Formulation/Recipe ............................. 18 Product Information ........................ 108, 109, 112 Product Information and Consumer Awareness
............................................................. 108, 112 Product Standards ............................................. 19 Psychological factors ......................................... 58 Quality ............................................................... 12 Quality Assessment ..................................... 26, 30 Quality Assurance ........................................ 15, 26 Quality Attributes .............................................. 14 Quality Control ............................................ 12, 26 Quality Control in Food Processing Businesses . 13 Quality Control: Monitoring the Testing Process
....................................................................... 29 Quality Objectives .............................................. 27 Quality specifications ......................................... 13 Quality Standards .............................................. 88 Rajiv Gandhi National Quality Award ................ 91 Ranking Test ....................................................... 62 Rating Tests ........................................................ 62 Real hazard ...................................................... 122 Reasons for testing food quality ........................ 59 Recall Plan .......................................................... 25 Recall Procedures ............................................ 104 Reception room ................................................. 59 Red ..................................................................... 52 Reduction ........................................................... 47 Refresher Training ........................................... 110 Resistance to compression ................................ 79 Resistance to flow .............................................. 80 review .............................. 101, 113, 120, 129, 133 Risk ................................................................... 122 Safe moisture content ..................................... 122 Salt concentration in brines ............................... 38 Sample ......................................................... 43, 46 Sample preparation room ................................. 59 Sampling ............................................................ 43 Sampling Errors .................................................. 49 Sampling Techniques ......................................... 43 Sampling Types by Process ................................ 47 Scheme for Indian Importers ............................. 90 Scheme‐Foreign Manufacturers ........................ 90 Secondary trader ............................................. 122 Segment ............................................................. 46 Selection of panel of judges .............................. 58 Sensitivity Tests ................................................. 66 Sensitivity‐Threshold Test .................................. 66 Sensory and consumer data .............................. 70 Sensory Characteristics of Food ........................ 56 Sensory Evaluation ............................................ 56 Sensory Vocabulary ........................................... 50 Shortometer .......................................... 73, 78, 80 Simple Random Sampling .................................. 45 Single Sample (Monadic) Test ........................... 62 Size and Shape ................................................... 51 Size of the grain ................................................. 75

©Vedpal Yadav, Lecturer in Food Technology, Government Polytechnic, Mandi Adampur, Hisar, Haryana, India‐125052. e‐mail‐ [email protected] +91‐9416589819 Page 134 of 134
Small Scale Industry Facilitation Cell ................. 91 Smell and taste (aroma and flavour) ................. 33 Specific gravity ................................................... 74 Specific Process Steps ...................................... 102 Specific volume .................................................. 74 Spectrophotometer ........................................... 75 springiness ......................................................... 80 Springiness ......................................................... 78 Standard Formulation & Promotion .................. 90 Step .......................................................... 121, 125 Storage ........................... 34, 35, 48, 100, 110, 111 Storage and Preservation of Samples ................ 48 Strata ................................................................. 46 Stratified Random Sampling .............................. 45 Stromer viscometer ........................................... 76 Sub sample ........................................................ 46 Succulometer ..................................................... 77 Swab method ..................................................... 41 System Approach to Management .................... 28 Systematic Sampling .......................................... 46 Target level ...................................................... 122 Tasks involved in developing HACCP system ... 122 Taste ............................................................ 50, 57 Taste interaction ................................................ 57 Techniques of smelling and tasting ................... 59 Temperature ................................................ 34, 57 Temperature Control ....................................... 100 Temporary/Mobile Premises and Vending Machines ....................................................... 98
Tenderness ........................................................ 79 Tenderometer ........................................ 53, 77, 80 Test booths ........................................................ 59 Test portion ....................................................... 46 Testing laboratory ............................................. 59 Testing time ....................................................... 59 Texture ................................................... 50, 54, 57 Texture and consistency (tenderness and juiciness) ........................................................ 32
Texture Changes ................................................ 54 Texture close to mastication ............................. 80 Texture Evaluation ............................................. 75 The AGMARK Standard ...................................... 91
The Codex General Principles of Food Hygiene . 94 Time and Temperature Control ....................... 101 To know the consumer preference ................... 59 To know the effect of variation in processing on quality ............................................................ 60
TQC .............................................................. 83, 84 TQC and TQM .................................................... 83 TQM ............................................... 82, 83, 84, 110 Trained panel ..................................................... 58 Trained panel members ..................................... 58 Training ................................ 83, 91, 109, 110, 112 Training Programmes ...................................... 110 Transportation ......................................... 107, 112 Triangle Test ...................................................... 62 Trigger methods ................................................ 41 Two Sample Difference Test .............................. 63 Types of Statistical Sampling ............................. 45 Types of Tests .................................................... 60 Universal Texture Analyser ................................ 53 Validation ................................................. 118, 121 Verification ...................................... 121, 123, 125 Viscosity ....................................................... 55, 78 Visitors ............................................................. 107 Volodkevich bite tenderometer (cutting and shearing) ........................................................ 78
Volume ............................................................... 74 Warehousing ...................................................... 24 Warning Rules .................................................... 30 Waste Management ........................................ 106 Water ..................... 18, 19, 20, 35, 54, 90, 99, 103 Water activity (aw) ............................................. 35 Water Supply ..................................................... 99 Weight ............................................................... 74 Weight differences ............................................ 37 Wettability ......................................................... 74 What Is Quality Assurance – Goals, Functions, Benefits .......................................................... 27
What Makes Quality Control Important? .......... 29 Why would a product be recalled? .................... 25 Worldwide communications systems .............. 127 Yellow ................................................................ 52