coulour measurements bycomputer vision for food quality control a review
TRANSCRIPT

Trends in Food Science & Technology 29 (2013) 5e20
Review
* Corresponding author.
0924-2244/$ - see front matter � 2012 Elsevier Ltd. All rights reserved.http://dx.doi.org/10.1016/j.tifs.2012.08.004
Colour
measurements by
computer vision for
food quality
control e A review
Di Wu and Da-Wen Sun*
Food Refrigeration and Computerised Food
Technology (FRCFT), School of BiosystemsEngineering, University College Dublin, National
University of Ireland, Agriculture & Food Science
Centre, Belfield, Dublin 4, Ireland
(Tel.: D353 1 7167342; fax: D353 1 7167493;
e-mail: [email protected]; URLs: http://www.ucd.ie/
refrig, http://www.ucd.ie/sun)
Colour is the first quality attribute of food evaluated by con-
sumers, and is therefore an important component of food qual-
ity relevant to market acceptance. Rapid and objective
measurement of food colour is required in quality control for
the commercial grading of products. Computer vision is
a promising technique currently investigated for food colour
measurement, especially with the ability of providing a de-
tailed characterization of colour uniformity at pixel-based
level. This paper reviews the fundamentals and applications
of computer vision for food colour measurement. Introduction
of colour space and traditional colour measurements is also
given. At last, advantages and disadvantages of computer vi-
sion for colour measurement are analyzed and its future trends
are proposed.
IntroductionColour is a mental perceptual response to the visible spec-trum of light (distribution of light power versus wave-length) reflected or emitted from an object. Such responsesignal is interacted in the eye with the retina, and is then
transmitted to the brain by the optical nerve, which makeshuman assign colours to this signal. Therefore, colour is notan intrinsic property of the object, since if the light sourceis changed, the colour of the object also changes(Melendez-Martinez, Vicario, & Heredia, 2005). The per-ception of colour is a very complex phenomenon that de-pends on the composition of the object in its illuminationenvironment, the characteristics of the perceiving eye andbrain, and the angles of illumination and viewing.
In foods, the appearance is a primary criterion in makingpurchasing decisions (Kays, 1991). Appearance is utilizedthroughout the productionestorageemarketingeutilizationchain as the primary means of judging the quality of indi-vidual units of product (Kays, 1999). The appearance ofunities of products is evaluated by considering their size,shape, form, colour, freshness condition and finally the ab-sence of visual defects (Costa et al., 2011). Especially, col-our is an important sensorial attribute to provide the basicquality information for human perception, and has close as-sociation with quality factors such as freshness, maturity,variety and desirability, and food safety, and therefore isan important grading factor for most food products(McCaig, 2002). Colour is used as an indicator of qualityin many applications (Blasco, Aleixos, & Molto, 2003;Cubero, Aleixos, Molto, Gomez-Sanchis, & Blasco, 2011;Quevedo, Aguilera, & Pedreschi, 2010; Rocha & Morais,2003). Upon the first visual assessment of product quality,colour is critical (Kays, 1999). Consumer first judge a foodfrom its colour and then from other attributes such as tasteand aroma. The colour of food products affects the con-sumer acceptability of food products, and therefore shouldbe “right”, when consumers are purchasing foods. Theresearch on the objective assessment of food colours is anexpanding field. Some researches show that colours haverelationship with human responses (Iqbal, Valous,Mendoza, Sun, & Allen, 2010; Pallottino et al., 2010).With increased requirements for quality by consumers,the food industry has paid numerous efforts to measureand control the colour of their products. Therefore, it is crit-ical to develop effective colour inspection systems to mea-sure the colour information of food product rapidly andobjectively during processing operations and storageperiods. For a modern food plant, as its food throughputis increasing as well as the quality tolerance is tightening,the employment of automatic methods for colour measure-ment and control is quite necessary.
6 D. Wu, D.-W. Sun / Trends in Food Science & Technology 29 (2013) 5e20
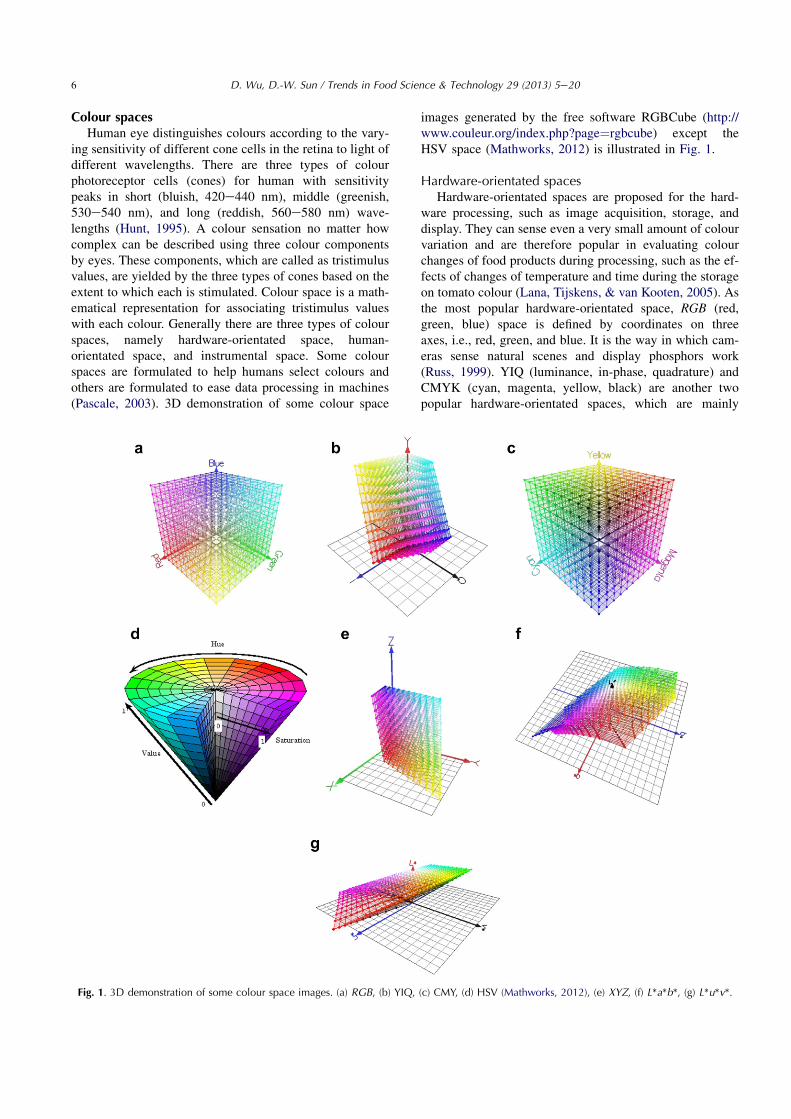
Colour spacesHuman eye distinguishes colours according to the vary-
ing sensitivity of different cone cells in the retina to light ofdifferent wavelengths. There are three types of colourphotoreceptor cells (cones) for human with sensitivitypeaks in short (bluish, 420e440 nm), middle (greenish,530e540 nm), and long (reddish, 560e580 nm) wave-lengths (Hunt, 1995). A colour sensation no matter howcomplex can be described using three colour componentsby eyes. These components, which are called as tristimulusvalues, are yielded by the three types of cones based on theextent to which each is stimulated. Colour space is a math-ematical representation for associating tristimulus valueswith each colour. Generally there are three types of colourspaces, namely hardware-orientated space, human-orientated space, and instrumental space. Some colourspaces are formulated to help humans select colours andothers are formulated to ease data processing in machines(Pascale, 2003). 3D demonstration of some colour space
Fig. 1. 3D demonstration of some colour space images. (a) RGB, (b) YIQ,
images generated by the free software RGBCube (http://www.couleur.org/index.php?page¼rgbcube) except theHSV space (Mathworks, 2012) is illustrated in Fig. 1.
Hardware-orientated spacesHardware-orientated spaces are proposed for the hard-
ware processing, such as image acquisition, storage, anddisplay. They can sense even a very small amount of colourvariation and are therefore popular in evaluating colourchanges of food products during processing, such as the ef-fects of changes of temperature and time during the storageon tomato colour (Lana, Tijskens, & van Kooten, 2005). Asthe most popular hardware-orientated space, RGB (red,green, blue) space is defined by coordinates on threeaxes, i.e., red, green, and blue. It is the way in which cam-eras sense natural scenes and display phosphors work(Russ, 1999). YIQ (luminance, in-phase, quadrature) andCMYK (cyan, magenta, yellow, black) are another twopopular hardware-orientated spaces, which are mainly
(c) CMY, (d) HSV (Mathworks, 2012), (e) XYZ, (f) L*a*b*, (g) L*u*v*.

7D. Wu, D.-W. Sun / Trends in Food Science & Technology 29 (2013) 5e20
used for television transmission and in printing and copyingoutput, respectively, and hence are not used for colour mea-surement in the food industry.
Human-orientated spacesHuman-orientated spaces are corresponding to the con-
cepts of tint, shade, and tone, which are defined by an artistbased on the intuitive colour characteristics. In general,human-orientated spaces are hue-saturation (HS) basedspaces, such as HSI (hue, saturation, intensity), HSV(hue, saturation, value), HSL (hue, saturation, lightness),and HSB (hue, saturation, brightness). Hue is defined asthe attribute of a visual sensation according to which anarea appears to be similar to one of the perceived colours:red, yellow, green, and blue, or to a combination of two ofthem. Saturation is defined as the colourfulness of an areajudged in proportion to its brightness. On the other hand,brightness is defined as the attribute of a visual sensationaccording to which an area appears to emit and lightnessis defined as the brightness of an area judged relative tothe brightness of a similarly illuminated area that appearsto be white or highly transmitting (Fairchild, 2005). Differ-ent from RGB space which uses the cuboidal coordinate todefine colour, the colour in HS based spaces is defined us-ing the cylindrical coordinates (Fig. 1d). Because HS basedspaces are developed based on the concept of visual percep-tion in human eyes, their colour measurements are user-friendly and have a better relationship to the visual signif-icance of food surfaces. This has been clarified by a studyin which HSV space had a better performance than RGBspace in the evaluation of acceptance of pizza toppings(Du & Sun, 2005). However, human-orientated spaces, aswith human vision, are not sensitive to a small variationin colour, and therefore are not suitable for evaluatingchanges of product colour during processing.
Instrumental spacesInstrumental spaces are used for colour instruments.
Many of instrumental spaces are standardized by theCommission Internationale d’Eclairage (CIE) under a seriesof standard conditions (illuminants, observers, and method-ology spectra) (Rossel, Minasny, Roudier, & McBratney,2006). Not like hardware-orientated spaces which have dif-ferent coordinates for the same colour for various outputmedia, colour coordinates from an instrumental space arethe same on all output media. CIE XYZ colour space isan early mathematically defined colour space created byCIE in 1931 based on the physiological perception of light.In XYZ space, a set of three colour-matching functions, col-lectively called the Standard Observer, are related to thered, green and blue cones in the eye (The Science ofColor, 1973). XYZ colour space was proposed to solvethe problem that it is not possible to stimulate one typeof cone only and no component is used to describe the per-ceived brightness (Hunt, 1998). In this space, Y means thelightness, while X and Z are two primary virtual
components which look like red and blue sensitive curveof cones. However, XYZ does not represent colour gradationin a uniform matter. For this reason, two colour spaces, CIE1976 (L*a*b*) or called CIELAB and CIE 1976 (L*u*v*)or called CIELUV, which are the non-linear transformationof XYZ, were brought out and are adopted in many colourmeasuring instruments. In the colour measurement offood, L*a*b* colour space is the most used one due tothe uniform distribution of colours, and because it is per-ceptually uniform, i.e., the Euclidean distance betweentwo different colours corresponds approximately to the col-our difference perceived by the human eye (Leon, Mery,Pedreschi, & Leon, 2006).
Colour measurementsColour is an important object measurement for image
understanding and object description, which can be usedfor quality evaluation and inspection of food products.The colour measurements can be conducted by visual(human) inspection, traditional instruments like colourime-ter, or computer vision.
Visual measurementsQualitative visual assessment is carried out for many
operations in existing food colour inspection systems bytrained inspectors in well-illuminated rooms and sometimeswith the aid of colour atlases or dictionaries (Melendez-Martinez et al., 2005). As a result of visual measurement,a particular description of colour is obtained using a certainvocabulary (Melendez-Martinez et al., 2005). Althoughhuman inspection is quite robust even in the presence ofchanges in illumination, colour perception is subjective,variable, laborious, and tedious, has poor colour memoryof subjects, depends upon lighting and numerous other fac-tors, and is not suitable for routine large-scale colour mea-surement (Hutchings, 1999; Leon et al., 2006; McCaig,2002).
Traditional instrumental measurementsTraditional instruments, such as colourimeters and spec-
trophotometers, have been used extensively in the food in-dustry for colour measurement (Balaban & Odabasi, 2006).Under specified illumination environment, these instru-ments provide a quantitative measurement by simulatingthe manner in which the average human eye sees the colourof an object (McCaig, 2002).
Colourimeters, such as Minolta chromameter; HunterLab colourimeter, and Dr. Lange colourimeters, are usedto measure the colour of primary radiation sources thatemit light and secondary radiation sources that reflect ortransmit external light (Leon et al., 2006; Melendez-Martinez et al., 2005). Therefore, tristimulus values areoptically, not mathematically, obtained. Its measurementis rapid and simple. The calibration of colourimeters isachieved using standard tiles at the beginning of the opera-tion (Oliveira & Balaban, 2006).

8 D. Wu, D.-W. Sun / Trends in Food Science & Technology 29 (2013) 5e20
Spectrophotometers with extended spectral range whichincludes the visible region (VNIR instruments) are alsowidely used for colour measurement throughout the foodand agricultural industries (McCaig, 2002). Spectropho-tometers output the spectral distribution of transmittanceor reflectance of the sample. The X, Y, Z values are calcu-lated, depending on the illuminant, the measurement geom-etry and the observer (Hutchings, 1994).
Spectroradiometers are used for the measurement ofradiometric quantities as a function of wavelength(Melendez-Martinez et al., 2005). Tristimulus values ofboth spectrophotometers and spectroradiometers are math-ematically obtained in accordance with the CIE definitions.Spectroradiometers have the same components as a spectro-photometer. The difference is that spectroradiometers usean external light source. Nowadays, spectroradiometershave also been widely used for the quality prediction ofmany food and agricultural products (Wu et al., 2009;Wu, He, & Feng, 2008; Wu, He, Nie, Cao, & Bao, 2010).
However, although simple colour measurements can beachieved, there are potential disadvantages in using tradi-tional instrumental measurements (Balaban & Odabasi,2006). One problem is that traditional instrumental mea-surements can only measure the surface of sample that isuniform and rather small. The sampling location and thenumber of readings for obtaining an accurate average col-our are important for traditional instrumental measurements(Oliveira & Balaban, 2006). When the surface of samplehas nonhomogeneous colours, the measurement should berepeated to cover the whole surface, and even so, it is stillhard to obtain the distribution map of colour. In addition,such measurement is quite unrepresentative, making theglobal analysis of the food’s surface a difficult task.Another problem is the size and shape of the sample. Ifthe size of sample is too small to fill the sample window,e.g., a grain of rice or the shape of measured area is notround, e.g., shrimp, their colour measurements may be in-accurate if traditional instrumental measurement is made.Moreover, in order to obtain a detailed characterization ofa food sample and thereby more precisely evaluate its qual-ity, it is required to acquire the colour value of each pixelwithin sample surface for further generating the distributionmap of colour (Leon et al., 2006). Such requirement is notpossibly achieved by using traditional instrumental mea-surements. This in turn has increased the need for develop-ing automatic pixel-based colour measurement process inthe food industry to replace traditional methods of humanevaluation and instrumental measurements for rapid andnon-invasive measurement of colour distribution withinfood products.
Computer vision measurementsComputer vision is the science that develops theoretical
and algorithmic basis to automatically extract and analyzeuseful information about an object or scene from anobserved image, image set or image sequence
(Gunasekaran, 1996; Sun, 2000; Sun, & Brosnan 2003;Zheng, Sun, & Zheng, 2006a, b; Du, & Sun, 2006). Asan inspection and evaluation technique through electroni-cally perceiving and evaluating an image, computer visionhas the advantages of being rapid, consistent, objective,non-invasive, and economic. In computer vision, colour iselementary information stored in pixels in a digital image.Computer vision extracts quantitative colour informationfrom digital images by using image processing and analy-sis, resulting in the achievement of rapid and non-contactcolour measurement. In recent years, computer vision hasbeen investigated for objectively measuring the colourand other quality attributes of foods (Brosnan & Sun,2004; Cubero et al., 2011; Du & Sun, 2004; Jackman,Sun, & Allen, 2011). A significant difference between com-puter vision and conventional colourimetry is the amount ofprovided spatial information. High-spatial resolution en-ables computer vision to analyze each pixel of the entiresurface, calculate the average and standard deviation of col-our, isolate and specify appearance, measure the nonuni-form shapes and colours, select a region of interestsflexibly, inspect more than one object at the same time,generate the distribution map of colour, and provide a per-manent record by keeping the picture (Balaban & Odabasi,2006; Leon et al., 2006).
A digital image is acquired by incident light in the vis-ible spectrum falling on a partially reflective surface withthe scattered photons being gathered up in the cameralens, converted to electrical signals either by vacuum tubeor by CCD (charge-coupled device), and saved in harddisk for further image display and image analysis. A digitalmonochrome image is a two-dimensional (2-D) light-intensity function of I(x, y). The intensity I, generallyknown as the grey level, at spatial coordinates (x, y) hasproportional relationship with the radiant energy receivedby the sensor or detector in a small area around the point(x, y) (Gunasekaran, 1996). The interval of grey levelfrom low to high is called a grey scale, which is numeri-cally represented by a value between 0 (pure black) andL (white) in common practice (Gunasekaran, 1996). Imageacquisition and image analysis are two critical steps for theapplication of computer vision. Image acquisition requiresscrupulous design of image capturing system and carefuloperation to obtain digital images with high quality. Imageanalysis includes numerous algorithms and methods avail-able for classification and measurement (Krutz, Gibson,Cassens, & Zhang, 2000). The automatic colour measure-ment using computer vision has the advantages of superiorspeed, consistency, accuracy, and cost-effectiveness, andtherefore cannot only optimize quality inspection but alsohelp in reducing human inconsistency and subjectiveness.
Computer vision systemThe hardware configuration of a computer vision system
generally consists of an illumination device, a solid-state

Fig. 2. Schematic diagram of a typical computer vision system.
Fig. 3. Two possible lighting geometries: (a) the ring illuminator; (b) thediffuse illuminator.
9D. Wu, D.-W. Sun / Trends in Food Science & Technology 29 (2013) 5e20
CCD array camera, a frame-grabber, a personal computer,and a high-resolution colour monitor (Fig. 2).
IlluminationAs an important prerequisite of image acquisition, illu-
mination can greatly affect the quality of captured image.Different illuminants may yield different stimuli using thesame camera. A well-designed illumination system can im-prove the accuracy, reduce the time and complexity of thesubsequent image processing steps, lead to success of im-age analysis, and decrease the cost of an image processingsystem (Du & Sun, 2004; Gunasekaran, 1996). Fluorescentand incandescent bulbs are two widely used illuminants,even though there are also some other useful light sources,such as light-emitting diodes (LEDs) and electrolumines-cent sources. Because fluorescent light provides a more uni-form dispersion of light from the emitting surface and hasmore efficient inherence to produce more intense illumina-tion at specific wavelengths, it is widely used for manycomputer vision practitioners (Abdullah, 2008). Besidesthe type of illuminant, the position of an illuminant isalso important. There are two commonly used geometriesfor the illuminators, namely the ring illuminator and thediffuse illuminator (Fig. 3). The ring illuminator has a sim-ple geometry and is widely used for general purpose, espe-cially for the samples with flat surfaces. On the other hand,the diffuse illuminator is well suited for the imaging appli-cation of food products with sphere shape, because it pro-vides virtually 180� of diffuse illumination.
CameraThe camera is used to convert photons to electrical
signals. CCD and CMOS (complementary metaleoxideesemiconductor) are two major types of camera,which are both solid-state imaging devices. Due to usinga lens for imaging, pixel of central part of an image aremuch more sensitive than peripheral part in CCD andCMOS. CCD camera consists of hundreds of thousands
of photodiodes (known as pixels) that are made of light sen-sitive materials and used to read out light energy falling onit as an electronic charges. The charges are proportional tothe light intensity and stored in the capacitor. The CCD op-erates in two modes, passive and active. The first modetransfers the charges to a bus line when received the selectsignal. In the latter one, charges are transferred to a bus lineafter being amplified to compensate the limited fill factor ofthe photodiode. After shifting out of the detector, the elec-trical charges are digitalized to generate the images.Depending on various applications, CCD cameras have dif-ferent architectures. The interline and frame-transfer aretwo popularly used architectures associated with moderndigital cameras. Both interline and frame-transfer architec-tures are competent for acquiring motion images. The inter-line CCD uses an additional horizontal shift register tocollect and pass on the charge read out from a stack of ver-tical linear scanners, which comprises photodiodes anda corresponding vertical shift register. The downside tothe interline CCD is that the opaque strips on the imagingarea decreases the effective quantum efficiency. Theframe-transfer design is consisted of integration and storageframes. The integration frame acquires an image and trans-fers the charge to the storage frame, so that the image canbe read out slowly from the storage region while the nextlight signal can be integrated in the integration frame for
10 D. Wu, D.-W. Sun / Trends in Food Science & Technology 29 (2013) 5e20
capturing a new image. The disadvantage of this architec-ture is its higher cost due to the requirement of doubledcell area and more complex control electronics.
Although CCD is the current dominant detector for im-age acquisition, it is anticipated that the CCD technologywill be superseded by CMOS technology in the consumerelectronics market in the near future. The CMOS imagesensor includes both photodetector and read out amplifierin each pixel (called active pixel), which is the major differ-ence between CCD and CMOS (Litwiller, 2005). There-fore, CMOS sensor is referred to as an ‘Active PixelSensor’ compared with the ‘Passive Pixel Sensor’ type con-tained in CCD arrays (Kazlauciunas, 2001). After usingphotodiode to convert incident photon to electron, CMOSconverts the integrated charge to a voltage signal insideeach active pixel immediately by using a set of optically in-sensitive transistors adjacent to the photodiode. The voltagesignals are then read out over the wires. CMOS camera cantransfer signal very fast because it has the wires inside,compared to the vertical and horizontal registers used bythe CCD to shift the charges. Therefore, CMOS is espe-cially suitable for the requirement of high speed imagingfor online industrial inspection. Moreover, the CMOS canaccess to each particular pixel by an XeY address owingto the addressability of the wires arranged in rows and col-umns. So that the CMOS can extract a region of interestfrom the image. Besides the characteristics of high speedand random addressing, the CMOS has other advantageslike low cost, low power consumption, single power supply,and small size for system integration, which makes themprevail in the consumer electronics market (e.g., low-endcamcorders and cell phones) (Qin, 2010). In addition, inCCD technology, signals from one pixel can be affectedby another in the same row which is termed ‘blooming’and a poor pixel within a particular row can interferewith signals from other rows (Kazlauciunas, 2001).However, CMOS is immune to the blooming, becauseeach pixel in CMOS array is independent of other pixelsnearby. The main limit of current CMOS sensor is thatthey have higher noise and higher dark current than theCCDs, giving rise to the low dynamic range and the sensi-tivity (Qin, 2010).
Bayer sensor and three-CCD devices (3CCD) are twomain types of colour image sensors that are differed bythe way of colour separation. Bayer sensor over the CCDis commonly used for capturing digital colour images. Ituses a colour filter array that comprises many squares.Each squire has four pixels with one red filter, one blue fil-ter, and two green filters, because human eye is more sen-sitive to the green of the visible spectrum and less sensitiveto the red and blue. The missing colour can be interpolatedusing a demosaicing algorithm. The shortcoming of Bayersensor is the colour resolution is lower than the luminanceresolution, although luminance information is measured atevery pixel. Better colour separation can be achieved by3CCD that has three discrete image sensors and a dichroic
beam splitter prism that splits the light into red, green andblue components. Each sensor in 3CCD responds to one ofthe three colour. 3CCD has higher quantum efficiency/lightsensitivity resulting in enhanced resolution and lower noise,because 3CCD captures most of the light entering the aper-ture, while only one-third of the light is detected by a Bayermask.
Frame-grabberBesides illumination and camera, frame grabber is an-
other hardware that should be considered for image acqui-sition. When only analogue cameras were available, framegrabbers provided the functions of digitization, synchroni-zation, data formatting, local storage, and data transferfrom the camera to the computer to generate a bitmapimage. A typical frame-grabber card used for analoguecameras consists of signal-conditioning elements, an A/Dconverter, a look-up table, an image buffer and a PCI businterface. Nowadays, digital cameras are generally usedin higher-end applications. These cameras do not needframe grabber for digitization. Frame grabber is also notnecessary to transfer data from camera to the host com-puter. Alternatively, cameras are available with Camera-Link, USB, Ethernet and IEEE 1394 (“FireWire”)interfaces that simplify connection to a PC. Nevertheless,frame grabbers are still alive well, but they are differentthan what they used to be. Their role today has becomemuch broader rather than just image capture and data trans-fer. Modern frame grabbers now include many of the spe-cial features, such as acquisition control (trigger inputsand strobe outputs), I/O control, tagging incoming imageswith unique time stamps, formatting data from multitapcameras into seamless image data, image correction andprocessing such as Bayer inversion filters, image authenti-cation and filtering, and communications related to perfor-mance monitoring.
Colour space transformationsThere are three aspects that determine colour, namely
the type of emission source that irradiates an object, thephysical properties of the object itself (which reflectsthe radiation consequently detected by the sensor), andthe in-between medium (e.g., air or water) (Menesattiet al., 2012). In general, a computer vision system capturesthe colour of each pixel within the image of the object us-ing three colour sensors (or one sensor with three alternat-ing filters) per pixel (Forsyth & Ponce, 2003; Segnini,Dejmek, & Oste, 1999a). RGB model is the most oftenused colour model, in which each sensor captures the inten-sity of the light in the red (R), green (G) or blue (B) spec-trum, respectively (Leon et al., 2006). However, the RGBmodel is device-dependent and not identical to the intensi-ties of the CIE system (Mendoza & Aguilera, 2004).Another problem of RGB model is that it is not a perceptu-ally uniform space. The differences between colours (i.e.,Euclidean distances) in RGB space do not correspond to

11D. Wu, D.-W. Sun / Trends in Food Science & Technology 29 (2013) 5e20
colour differences as perceived by humans (Paschos, 2001).Standard RGB (sRGB; red, green, blue) and L*a*b* arecommonly applied in quantifying standard colour of food(Menesatti et al., 2012). sRGB is a device independent col-our model whose tristimulus values (sR, sG, sB) reproducethe same colour on different devices, and represent linearcombinations of the CIE XYZ. Therefore, It is used to definethe mapping between RGB (no-linear signals) from a com-puter vision system and a device-independent system suchas CIE XYZ (Mendoza, Dejmek, & Aguilera, 2006). sRGBis calculated based on D65 illumination conditions, RGBvalues measured by computer vision, and a power functionwith a gamma value of 2.4. The camera sensors (e.g., CCDor CMOS) generate outputs signals and the rendering isdevice-dependent, since the display device specificationshave different ranges of colour. In order to overcome thisproblem, sRGB values are often transformed to other colourspaces such L*a*b* (Menesatti et al., 2012). Moreover,even the result of such transformation is device-dependent(Ford & Roberts, 1998). In many researches, a linear trans-form that defines a mapping between RGB signals froma computer vision camera and a device independent systemsuch as L*a*b* and L*u*v* was determined to ensure thecorrect colour reproduction (Mendoza & Aguilera, 2004;Paschos, 2001; Segnini et al., 1999a). However, such trans-form that converts RGB into L*a*b* units does not considercalibration process, but only uses an absolute model withknown parameters. Because the RGB colour measurementdepends on external factors (sensitivity of the sensors ofthe camera, illumination, etc.), most cameras (even of thesame type) do not exhibit consistent responses (Ilie &Welch, 2005). The parameters in the absolute model varyfrom one case to another. Therefore, the conversion fromRGB to L*a*b* cannot be done directly using a standardformula (Leon et al., 2006). For this reason, Leon et al.(2006) present a methodology to transform device depen-dent RGB colour units into device-independent L*a*b* col-our units. Five models, namely direct, gamma, linear,quadratic and neural network, were used to carry out thetransformation of RGB to L*a*b* to make the values deliv-ered by the model are as similar as possible to those deliv-ered by a colourimeter over homogenous surfaces. The bestresults with small errors (close to 1%) were achieved withthe quadratic and neural network model. However, althoughthe methodology presented is general, i.e., it can be used inevery computer vision system, it should be noticed that theresults obtained after the calibration for one system (e.g.,system A) cannot be used for another system (e.g., systemB). A new calibration procedure needs to be conducted fora new computer vision system (Leon et al., 2006).
Colour calibration methodsThe quality of digital image is principally defined by its
reproducibility and accuracy (Prasad & Roy, 2003).Without reproducibility and accuracy of images, any at-tempt to measure colour or geometric properties is of little
use (Van Poucke, Haeghen, Vissers, Meert, & Jorens,2010). In general, a computer vision camera employs a sin-gle array of light-sensitive elements on a CCD chip, witha filter array that allows some elements to see red (R),some green (G) and some blue (B). ‘White balance’ is con-ducted to measure relative intensities manually or automat-ically (Mendoza et al., 2006). A digital colour image is thengenerated by combining three intensity images (R, G, andB) in the range 0e255. As being device-dependent, RGBsignals produced by different cameras are different forthe same scene. These signals will also change over timeas they are dependent on the camera settings and scenes(Van Poucke et al., 2010). Therefore, measurements of col-our and colour differences cannot be conducted on RGB im-ages directly. On the other hand, different light sourcespresent different emission spectra dominated by diversewavelengths that affect those reflected by the object underanalysis (Costa et al., 2009). Therefore, in order to mini-mize the effects of illuminants and camera settings, colourcalibration prior to photo/image interpretation is required infood processing to quantitatively compare samples’ colourduring workflow with many devices (Menesatti et al.,2012). sRGB is a device-independent colour space thathas relationship with the CIE colourimetric colour spaces.Most of the variability introduced by the camera and illumi-nation conditions could be eliminated by finding the rela-tionship between the varying and unknown camera RGBand the sRGB colour space (Van Poucke et al., 2010). Dif-ferent calibration algorithms defining the relationship be-tween the input RGB colour space of the camera and thesRGB colour space have been published using variousmethods (Van Poucke et al., 2010). Several software areavailable to perform colour calibration using a colour pro-file assignable to the image that deals with different devices(e.g., ProfileMaker, Monaco Profiler, EZcolour, i1Extremeand many others), but they are often too imprecise for sci-entific purposes. Therefore, polynomial algorithms, multi-variate statistics, neural networks, and their combinationsare proposed for the colour calibration (Menesatti et al.,2012). Mendoza et al. (2006) transferred RGB into sRGBaccording to IEC 61966-2-1 (1999) for the colour measure-ments of agricultural foods. Costa et al. (2009) comparedthree calibration systems, namely partial least squares(PLS), second order polynomial interpolation (POLY2),and ProfileMaker Pro 5.0 software (PROM) under eight dif-ferent light conditions. Results show that PLS and POLY2achieved better calibration with respect to the conventionalsoftware (PROM). Van Poucke et al. (2010) used three 1Dlook-up tables and polynomial modelling to ensure repro-ducible colour content of digital images. A ‘referencechart’ called the MacBeth Colour Checker Chart Mini[MBCCC] (GretagMacBeth AG, Regensdorf, Switzerland)was used in the colour target-based calibration by trans-forming the input RGB colour space into the sRGB colourspace. Gurbuz, Kawakita, and Ando (2010) proposed a col-our calibration method for multi-camera systems by
12 D. Wu, D.-W. Sun / Trends in Food Science & Technology 29 (2013) 5e20
utilizing a set of robustly detected stereo correspondencesbetween camera pairs, resulting in a 3 � 4 coefficient ma-trix multiplier that can be used for colour calibration. Costaet al. (2012) calibrated digital images of whole giltheadseabream using a PLS approach with a standard colourchart. Recently, Menesatti et al. (2012) applied the “3DThin-Plate Spline” warping approach to calibrate coloursin sRGB space. The performance of this method was com-pared with other two common approaches,namely commercial calibration system (ProfileMaker) andpartial least square analysis under two different camerasand four different light conditions. Compared to the com-mercial methods (ProfileMaker) and the multivariate PLSapproach, the Thin-Plate Spline approach significantlydiminished both, distances from the reference and theinter-distances setup experiment, and was the most robustagainst lighting conditions and sensor typology(Menesatti et al., 2012).
Colour constancy and illumination estimationColour constancy is the phenomenon by which per-
ceived object colour tends to stay constant under changesin illumination (Ling & Hurlbert, 2008). Colour constancyis not a property of objects; it is a perceptual phenomenon,the result of mechanisms in the eye and brain (Hurlbert,2007). Colour constancy is important for object recogni-tion, scene understanding, image reproduction as well asdigital photography (Li, Xu, & Feng, 2009). There are threefactors affecting the image recorded by a camera, namelythe physical content of the scene, the illumination incidenton the scene, and the characteristics of the camera(Barnard, Cardei, & Funt, 2002). An object can appear dif-ferent colour under changing colour. The objective of com-putational colour constancy is to find a nontrivial illuminantinvariant description of a scene from an image taken underunknown lighting conditions, either by directly mappingthe image to a standardized illuminant invariant representa-tion, or by determining a description of the illuminantwhich can be used for subsequent colour correction of theimage (Barnard, Cardei et al., 2002). The procedure ofcomputational colour constancy includes two steps: esti-mating illumination parameters and using these parametersto get the objects’ colour under a known canonical lightsource (Li et al., 2009). The first step, illumination estima-tion, is important in colour constancy computation (Liet al., 2009). So far, a number of leading colour constancyalgorithms were proposed that focus on the illumination es-timation (Li et al., 2009). These algorithms can be gener-ally divided into two major groups: unsupervisedapproaches and supervised ones. The algorithms falling inthe first category include Max RGB, grey world algorithm,Shades of grey (SoG), and Grey surface identification(GSI). The other colour constancy category includes thosetraining-based solutions, such as Bayesian colour con-stancy, Neural Network method, support vector regression.Recently, Shi, Xiong, and Funt (2011) proposed a method
called thin-plate spline interpolation to estimate the colourof the incident illumination. The resulted illumination-estimation can be used to provide colour constancy underchanging illumination conditions and automatic white bal-ancing for digital cameras (Shi et al., 2011). A review ofthese algorithms and their comparison can be found else-where (Barnard, Cardei et al., 2002; Barnard, Martin,Coath, & Funt, 2002).
ApplicationsNowadays, computer vision has found extraordinary in-
terests as a key inspection method for non-destructive andrapid colour measurement of food and food products. Ifimplemented in processing lines, computer vision systemswill provide precise inspection and increase throughput inthe production and packaging process. Table 1 summarizesapplications of using computer vision for food colourevaluation.
Meat and fishBeef
Freshness is an important factor for consumers to buymeat (Maguire, 1994). ‘Red’ and ‘bright red’ lean is asso-ciated by consumers with fresh beef, while brownish colouris considered to be an indicator of state or spoiled beef(Larrain, Schaefer, & Reed, 2008). Colourimeters havebeen intensively studied for determining colour differencesof fresh meat using various CIE colour expressions, such aslightness (L*), redness (a*), yellowness (b*), hue angle,and chroma (Larrain et al., 2008). However, these workshave limitation of scanning a small surface area. Computervision is considered as a promising method for predictingcolour of meat (Mancini & Hunt, 2005; Tan, 2004). Backin the eighties of the last century, computer vision hasbeen used to detect colour changes during cooking ofbeef ribeye steaks (Unklesbay, Unklesbay, & Keller,1986). The mean and standard deviation of the red, greenand blue colours were found to be sufficient to differentiatebetween 8 of 10 classes of steak doneness. Later, Gerrard,Gao, and Tan (1996) determined muscle colour of beefribeye steaks using computer vision. Means of red andgreen (mR and mG) were significant (Coefficient of Determi-nation (R2) ¼ 0.86) for the prediction of colour scoreswhich were determined using USDA lean colour guide.In order to improve the results, Tan, Gao, and Gerrard(1999) used fuzzy logic and artificial neural network tech-niques to analyze the colour scores and a 100% classifica-tion rate was achieved. In another work, Larrain et al.(2008) applied computer vision to estimate CIE colour co-ordinates of beef as compared to a colourimeter. In theirwork, CIE L*, a*, and b* were measured using a colourim-eter (Minolta Chromameter CR-300, Osaka, Japan) witha 1 cm aperture, illuminant C and a 2� viewing angle.RGB values obtained from computer vision were trans-formed to CIE L*a*b* colour spaces using the following

Table 1. Summary of computer vision applications for food colour evaluation.
Category Application Accuracy References
Beef Detection of colour changes duringcooking
Unklesbay et al., 1986
Prediction of colour scores R2 ¼ 0.86 Gerrard et al., 1996Prediction of sensory colour responses 100% Tan et al., 1999Estimation of CIE colour coordinates ascompared to a colourimeter
R2 ¼ 0.58 for L*R2 ¼ 0.96 for a*R2 ¼ 0.56 for b*R2 ¼ 0.94 for hue angleR2 ¼ 0.93 for chroma
Larrain et al., 2008
Prediction of official colour scores 86.8% using MLR94.7% using SVM
Sun et al., 2011
Pork Evaluation of fresh pork loin colour R ¼ 0.52 using MLRR ¼ 0.75 using NN
Lu et al., 2000
Prediction of colour scores 86% Tan et al., 2000Prediction of the sensory visual quality O’Sullivan et al., 2003
Fish Detection of colour change Oliveira & Balaban, 2006Colour measurement as compared toa colourimeter
Yagiz et al., 2009
Prediction of colour score assigned bya sensory panel
R ¼ 0.95 Quevedo et al., 2010
Prediction of colour score as compared tothe Roche cards and a colourimeter
Similar to Roche SalmoFanlinear ruler
Misimi et al., 2007
Orange Juice Colour evaluation R ¼ 0.96 for hueR ¼ 0.069 for chromaR ¼ 0.92 for lightness
Fernandez-Vazquez et al., 2011
Wine Measurement of colour appearance R2 ¼ 0.84 for lightness compared tovisual estimatesR2 ¼ 0.89 for colourfulness comparedto visual estimatesR2 ¼ 0.98 for hue compared to visualestimatesR2 ¼ 0.99 for lightness compared tospectroradiometerR2 ¼ 0.90 for colourfulness comparedto spectroradiometerR2 ¼ 0.99 for hue compared tospectroradiometer
Martin et al., 2007
Beer Determination of colour as compared tothe colourimetry
Sun et al., 2004
Potato chip Colour measurement as compared to twocolourimeters
Scanlon et al., 1994
Colour measurement as compared by thesensory assessors
Segnini et al., 1999a
Colour measurement as compared by thesensory assessors
R > 0.79 between L* and most of thesensory colour attributes
Segnini et al., 1999b
Colour measurement as compared by thesensory assessors
R ¼ 0.9711 using linear model forsmooth potato chipsR ¼ 0.9790 using quadratic model forsmooth potato chipsR ¼ 0.7869 using linear model forsmooth potato chipsR ¼ 0.8245 using quadratic model forsmooth potato chips
Pedreschi et al., 2011
Development of an computer visionsystem to measure the colour of potatochips
Pedreschi et al., 2006
Wheat Measurement of the colour of the seedcoat as compared to thespectrophotometer
High linear correlations ( p < 0.05) Zapotoczny & Majewska, 2010
Banana Measurement of the colour as comparedto a colourimeter
R2 ¼ 0.80 for L*R2 ¼ 0.97 for a*R2 ¼ 0.61 for b*
Mendoza & Aguilera, 2004
MLR: Multiple linear regression.SVM: Support vector machine.R: Correlation coefficient.R2: Coefficient of determination.
13D. Wu, D.-W. Sun / Trends in Food Science & Technology 29 (2013) 5e20

14 D. Wu, D.-W. Sun / Trends in Food Science & Technology 29 (2013) 5e20
steps. RGB was first converted to XYZD65 using the matrixtransform (Pascale, 2003):
24XD65
YD65
ZD65
35¼
240:4125 0:3576 0:18040:2127 0:7152 0:07220:0193 0:1192 0:9503
35�
24RGB
35 ð1Þ
The obtained XYZD65 was then converted to XYZC usingthe Bradford matrix transform (Pascale, 2003):
24XC
YC
ZC
35¼
241:0095 0:007 0:01280:0123 0:9847 0:00330:0038 �0:0072 1:0892
35�
24XD65
YD65
ZD65
35 ð2Þ
Finally, XYZC was converted into CIEC L*a*b* using thefollowing equations (Konica Minolta, 1998):
L� ¼ 116� ðY=YnÞ1=3�16
a� ¼ 500�hðX=XnÞ1=3�ðY=YnÞ1=3
i
b� ¼ 200�hðY=YnÞ1=3�ðZ=ZnÞ1=3
i ð3Þ
where Xn, Yn, and Zn are the values for X, Y, and Z for theilluminant used, in this case 0.973, 1.000, and 1.161 respec-tively. Also, (X/Xn)
1/3 was replaced by [7.787 � (X/Xn) þ 16/116] if X/Xn was below 0.008856; (Y/Yn)
1/3 wasreplaced by [7.787 � (Y/Yn) þ 16/116] if Y/Yn wasbelow 0.008856; and (Z/Zn)
1/3 was replaced by[7.787 � (Z/Zn) þ 16/116] if Z/Zn was below 0.008856(Konica Minolta, 1998). When L*a*b* were transformed,hue angle and chroma were calculated from a* and b*values. Regressions of colourimeter on computer visionfor a*, hue angle and chroma had R2 values of 0.96,0.94, and 0.93, while there were only 0.58 and 0.56 of R2
for L* and b*. Recently, Sun, Chen, Berg, and Magolski(2011) analyzed 21 colour features obtained from imagesof fresh lean beef for predicting official beef colour scores.Multiple linear regression (MLR) had the correct percent-age of 86.8% of beef colour muscle scores and better per-formance of 94.7% was achieved using support vectormachine (SVM), showing that computer vision techniquecan provide an effective tool for predicting colour scoresof beef muscle.
PorkIn addition to beef colour, fresh pork colour was also
evaluated by using computer vision (Tan, 2004). Earlywork was carried out by Lu, Tan, Shatadal, and Gerrard(2000), who applied computer vision to evaluate freshpork loin colour. Colour image features analyzed in thisstudy included mean (mR, mG and mB) and standard devia-tion (sR, sG and sB) of red, green, and blue bands of thesegmented muscle area. Both MLR and neural network(NN) models were established to determine the colourscores based on the images features as inputs. The correla-tion coefficient between the predicted and the sensory col-our scores was 0.52 in MLR model, with 84.1% of the 44pork loin samples having prediction errors lower than 0.6,
which was considered negligible from a practical view-point. For the NN model, 93.2% of the samples had predic-tion errors of 0.6 or lower, with the correlation coefficientof 0.75. Results showed that a computer vision system isan efficient tool for measuring sensory colour of freshpork. Later, Tan, Morgan, Ludas, Forrest, and Gerrard(2000) used computer vision to predict colour scores offresh loin chops, which were visually assessed by an un-trained panel in three separated studies. After trainingpork images classified by the panel, the computer visionsystem was capable of classifying pork loin chops up to86% agreement with visually assessed colour scores. In an-other study, the effectiveness of computer vision and col-ourimeter was compared in predicting the sensory visualquality of pork meat patties (M. longissimus dorsi) as deter-mined by a trained and an untrained sensory panel(O’Sullivan et al., 2003). Compared to the colourimeter,computer vision had a higher correction with the sensoryterms determined by both trained and untrained sensorypanelists. This was due to the fact that the entire surfaceof sample was measured by computer vision and thereforecomputer vision took a more representative measurementcompared to the colourimeter.
FishConsumers commonly purchase fish based on visual ap-
pearance (colour). Gormley (1992) found that consumersassociate colour of fish products with the freshness ofa product having better flavour and higher quality. Colourcharts, such as SalmonFan� card (Hoffmann-La RocheBasel, Switzerland), are generally used for colour assess-ment in the fish industry (Quevedo et al., 2010). However,such measurement is laborious, tedious, subjective, andtime-consuming. Quevedo et al. (2010) developed a com-puter vision method to assign colour score in salmon filletaccording to SalmonFan� card. The computer vision sys-tem was calibrated in order to obtain L*a*b* from RGB us-ing 30 colour charts and 20 SalmonFan cards. Calibrationerrors for L*a*b* were 2.7%, 1%, and 1.7%, respectively,with a general error range of 1.83%. On the basis of thecalibrated transformation matrix, a high correlation coeffi-cient of 0.95 was obtained between the SalmonFan scoreassigned by computer vision and the sensory panel. Goodresults showed the potential of using computer vision tech-nique to qualify salmon fillets based on colour. In anotherstudy, Misimi, Mathiassen, and Erikson (2007) comparedthe results of computer vision with the values determinedmanually using the Roche SalmonFan� lineal ruler andRoche colour card. The results demonstrated that the com-puter vision method had the good evaluation of colour asthe Roche SalmoFan linear ruler. This study also foundthat the colour values generated by the chromameter hadlarge deviations in mean value to those generated by thecomputer vision. This was due to the brighter illuminationused by the computer vision setup and the different algo-rithms used to convert RGB into L*a*b* for two methods

15D. Wu, D.-W. Sun / Trends in Food Science & Technology 29 (2013) 5e20
(Misimi et al., 2007). The comparison of the performanceof a computer vision system and a colourimeter was alsocompared to measure the colour of uncooked fillets fromGulf of Mexico sturgeons fed three different diets, duringstorage on ice for 15 days (Oliveira & Balaban, 2006). Inorder to do the comparison, DE values were calculatedfrom the L*a*b* values measured using both the computervision system and the colourimeter. The DE value was usedto measure the “total” colour change, which was calculatedby the following function:
DE¼ffiffiffiffiffiffiffiffiffiffiffiffiffiffiffiffiffiffiffiffiffiffiffiffiffiffiffiffiffiffiffiffiffiffiffiffiffiffiffiffiffiffiffiffiffiffiffiffiffiffiffiffiffiffiffiffiffiffiffiffiffiffiffiffiðLo � LiÞ2þðao � aiÞ2þðbo � biÞ2
qð4Þ
where, the subscript o refers to the values at time 0, and irefers to values at 5, 10, or 15 days. DE values determinedusing computer vision showed colour change over storagetime, which was in accordance with mild colour changesvisually observed in the images of the centre slices of thesturgeon fillets. However, it was hard to find such colourchange using the colourimeter. Moreover, there was signif-icant difference of DE values (p < 0.05) between instru-ments, except for day 0. The difference could be due tothe different average daylight illuminants used, namelyD65 with a colour temperature of 6504 K for the colourim-eter and D50 with a colour temperature of 5000 K for themachine vision system. Similarly, Yagiz, Balaban,Kristinsson, Welt, and Marshall (2009) compared a Minoltacolourimeter and machine vision system in measuring col-our of irradiated Atlantic salmon. There were significantlyhigher readings obtained by the computer vision system forL*, a*, b* values than the Minolta colourimeter. Visualcomparison was then conducted to illustrate the actual col-ours to evaluate the measurements of the two instruments.The colour represented by the computer vision systemwas much closer to the average real colour of Atlanticsalmon fillets, while that measured using the colourimeterwas purplish based on average L*, a*, b* values (Fig. 4).The differences between colours measured by computer
Fig. 4. Colour representations of Minolta and machine vision readingresults and actual pictures of differently treated salmon fillets and stan-
dard red plate (Yagiz et al., 2009).
vision and colourimeter in this study (Yagiz et al., 2009)were similar to those of the study carried out by Oliveiraand Balaban (2006). However, unlike Oliveira andBalaban (2006) used different illuminants, Yagiz et al.(2009) used the same illuminant, i.e., D65 with a colourtemperature of 6504 K, for both instruments. In addition,the standard red plates they used for the calibration oftwo instruments had the similar L*, a*, b* values. Hence,the authors (Yagiz et al., 2009) recommended caution in re-porting colour values measured by any system, even whenthe ‘reference’ tiles were measured correctly. There are var-ious factors that can affect the colour readings, such as thesurface roughness and texture, the amount of surface‘shine’, the geometry of the measuring instrument. It is rec-ommended to visually compare the colour formed by theL*, a*, b* values read from any device with the observedcolour of the sample.
Liquid food productsOrange juice
Some studies have revealed that the colour of orangejuice is related to the consumer’s perception of flavour,sweetness and other quality characteristics (Fernandez-Vazquez, Stinco, Melendez-Martinez, Heredia, & Vicario,2011). Colour is found to influence sweetness in orangedrinks and affects intensity of typical flavour in most fruitdrinks (Bayarri, Calvo, Costell, & Duran, 2001). Insteadof subjective visual evaluation, traditional instrumentssuch as colourimeter have been used for the objective col-our evaluation of orange juice (Melendez-Martinez et al.,2005). New advances in computer vision offer the possibil-ity of evaluating colour in terms of millions of pixels at rel-atively low cost. Fernandez-Vazquez et al. (2011) exploredthe relationship between computer vision and sensory eval-uation of the colour attributes (lightness, chroma and hue)in orange juices. Hue (R ¼ 0.96) and lightness(R ¼ 0.92) were well correlated between panelists’ colourevaluation and the image values but not chroma(R ¼ 0.069). The poor measurement of chroma was proba-bly due to the fact that it is not an intuitive attribute.
Alcoholic beverageColour, which is one of the main parameters of the qual-
ity of wines, affects the determination of aroma, odour, va-riety, and the overall acceptability by consumers (Martin,Ji, Luo, Hutchings, & Heredia, 2007). Martin et al.(2007) measured colour appearance of red wines usinga calibrated computer vision camera for various wineswith reference to the change of depth. The results fromcomputer vision had good correlations with visual esti-mates for lightness (R2 ¼ 0.84), colourfulness(R2 ¼ 0.89), and hue (R2 ¼ 0.98) and with a MinoltaCS-1000 tele-spectroradiometer (R2 ¼ 0.99 for lightness,R2 ¼ 0.90 for colourfulness, and R2 ¼ 0.99 for hue). In an-other study, Sun, Chang, Zhou, and Yu (2004) investigatedcomputer vision for determining beer colour as compared

16 D. Wu, D.-W. Sun / Trends in Food Science & Technology 29 (2013) 5e20
to the European Brewery Convention (EBC) colourimetry.A high positive correlation was found between coloursmeasured by computer vision and those determined by us-ing spectrophotometry and colourimetry, demonstrating thefeasibility of determining beer colour using computervision. The computer vision was highly repeatable witha standard deviation of zero for measuring the colour ofbeer.
Other applicationsColour of potato chips is an important attribute in the
definition of the quality for the potato processing industryand it is strictly related to consumer perception(Pedreschi, Leon, Mery, & Moyano, 2006; Segnini,Dejmek, & Oste, 1999b; Pedreschi, Bunger, Skurtys,Allen, & Rojas, 2012). As an early research, Scanlon,Roller, Mazza, and Pritchard (1994) used computer visionto characterise colour of chips. On the basis of mean greylevel values from specific regions of potato chips, it wasfeasible to distinguish differences in chip colour from pota-toes stored at the two temperatures and to discriminate dif-ferent frying times for potato chips that had been stored at5 �C. Good relationships were obtained between colour as-sessed by mean grey level and colour measured by the Ag-tron M31A colour meter and Hunter Lab D25L-2colourimeter. Later, Segnini et al. (1999a) developeda new, easy and inexpensive procedure to quantify the col-our of potato chips by using computer vision technique.There was a clear relationship between the obtained L*,a*, or b* and the scale by human eyes. The method hadless influence from the undulating surface of the chipsand was not sensitive to light intensity. In another study,Segnini et al. (1999b) investigated the potential of usingcomputer vision for measuring colour of commercial potatochips as compared to sensory analysis. There was a goodrelationship (R > 0.79) between L* and most of the sensorycolour attributes, which include “yellow colour”, “burnt as-pect” and “sugar coloured aspect”. The a* attribute alsoshowed a good relationship with “burnt aspect”, while theb* attribute did not significantly correlate with any of thesensory parameters ( p > 0.05). Recently, Pedreschi, Mery,Bunger, and Yanez (2011) established the relationships be-tween colour measured by the sensory assessors and thecolour determined objectively in L*, a*, b* units by a com-puter vision system. Good relationships were found forsmooth potato chips using both linear (0.9711) and qua-dratic (0.9790) models, while undulated chips only had Rof 0.7869 and 0.8245 suing linear and quadratic methods,respectively.
Zapotoczny and Majewska (2010) measured the col-our of the seed coat of wheat kernels using computer vi-sion. The colour of the seed coat was saved in RGB spaceafter image acquisition, and was then transformed intoXYZ and L*a*b*, which enabled the computation of thehue and saturation of colour. After image analysis, highlinear correlations ( p < 0.05) were found between colour
measurements of the seed coat performed by computervision and spectrophotometer. The results of this studyshowed that the colour of the seed coat of wheat kernelscan be determined by computer vision instead ofspectrophotometry.
Mendoza and Aguilera (2004) implemented computervision to measure the colour of bananas with different rip-ening stages. There was a good correlation (R2 ¼ 0.97) be-tween a* values obtained with the computer vision systemand the Hunter Lab colourimeter, while smaller correlationcoefficients were obtained for L* (R2 ¼ 0.80) and b*(R2 ¼ 0.61) values. This difference between two methodswas mainly due to the fact that measurements with the col-ourimeter did not extend over the whole surface of the ba-nanas which had nonhomogeneous colours during ripening,in particular at the ends of the bananas. On the other hand,the computer vision system is possible to assess the overallcolour change during ripening, similar to human percep-tion. Recently, Hashim et al. (in press) used computer vi-sion to detect colour changes in bananas during theappearance of chilling injury symptoms. The raw RGBvalues obtained were transformed to normalized rgb andCIEL*a*b* space to remove the brightness from the colourand to distinguish the colour similar to human perception.Results show that the r and g in normalized rgb colourspace have strong correlation with visual assessment.
Quantification of colour nonhomogeneityColour nonhomogeneity is an important appearance at-
tribute and its quantitative measurement is required formost food products which have nonuniform colours.However, colourimeters fail for nonuniform colours be-cause only the “average” colour of food products can bemeasured by colourimeters. For this reason, Balaban(2008) applied computer vision technique to quantify uni-form or nonuniform colours of food products. Several im-age analysis methods were applied, which includedcolour blocks, contours, and “colour change index” (CCI).
The calculation of colour blocks included three steps:firstly, the number of colours in the RGB colour spacewas reduced by dividing each colour axis into either 4(4 � 4 � 4 ¼ 64 colour blocks) or 8 (8 � 8 � 8 ¼ 512 col-our blocks) or 16 (16 � 16 � 16 ¼ 4096 colour blocks);secondly, the number of pixels that fall within a colourblock is counted, and the percentage of that colour was cal-culated based on the total view area (total number of pixels)of the object; and finally, an appropriate threshold was setto consider only those colour blocks that have percent areasabove that threshold. On the basis of the set threshold, thehigher the number of colour blocks, the more nonhomoge-neous the colour is.
The calculation of colour contours included two steps:firstly, colour attributes lower than, or higher than a giventhreshold, or attributes between two thresholds wereidentified; secondly, the percentage of pixels within con-tours based on the total view area of an object was

17D. Wu, D.-W. Sun / Trends in Food Science & Technology 29 (2013) 5e20
calculated. The colours of defective areas, such as darkspots could be quantified based on the calculation ofcontours.
The calculation of CCI was based on colour primitives,which are several continuous areas of an image where the“intensity” of any pixel is within a given threshold value.The more colour primitives in an image, the more nonho-mogeneous the colour of that object is. The calculationfunction of CCI was proposed as follows:
CCI¼P
DI for all neighoring pixelsPdistances between equivalent circles
� number of neighbors
object area� 100 ð5Þ
The results of the study by Balaban (2008) showed thatthe colour blocks method was competent for the case if therange of hue values is large such as mangoes; and the CCImethod did well if the hue range is narrow as in the case ofrabbit samples.
Furthermore, because it is not easy to quantify nonho-mogeneous colours by sensory panels, most researcheswere conducted in the comparison and correlation of homo-geneous colour measurements between computer visionand instrumental or visual colour analysis. For this reason,Balaban, Aparicio, Zotarelli, and Sims (2008) proposeda method to quantify the perception of nonhomogeneouscolours by sensory panelists and compared the differencesin colour evaluation between a computer vision systemand sensory panels for the perception of nonhomogeneouscolours. Generally, the more nonuniform the colour ofa sample, the higher the error of a panelist was in quantify-ing the colour of a sample, which showed that panelists hadmore difficulty in evaluating more nonhomogeneous col-ours. Moreover, no significant difference in DE valueswas found between panelists’ errors based on evaluatingthe real fruit and evaluating its image (Balaban et al.,2008). Therefore, images can be used to evaluate colour in-stead of the real samples, which may be significant, sincevisual evaluation of images eliminates temporal and geo-graphical restrictions, especially for the evaluation of per-ishable foods. In addition, images can be transferredelectronically to distant places and stored much longerthan the food, which allows much more flexibility in theanalysis of visual attributes of food products.
Development of computerized colour measurementsystem
Nowadays, computer vision technique has been used ona production line or in the quality control lab. Severalworks have been carried out to develop computerized col-our measurement systems. Kihc, Onal-Ulusoy, Yildirim,and Boyaci (2007) designed a computerized inspection sys-tem that uses a flat-bed scanner, a computer, and an algo-rithm and graphical user interface coded and designed inMatlab 7.0 to determine food colour based on CIE
L*a*b* colour space. The USA Federal Colour Standardprintouts (SP) comprised of 456 different colours wereused to train and test the artificial neural network (ANN)integrated the system. High correlations were obtained be-tween the results estimated from the computer vision sys-tem and those obtained from a spectrophotometer for testimages data set. R2 values were 0.991, 0.989, and 0.995for L*, a*, and b*, respectively. When various food sampleswere used to evaluate the performance of the system,a good agreement was also found between colour measuredusing the system and the spectrophotometer (R2 valueswere 0.958, 0.938, and 0.962 for L*, a*, and b*, respec-tively). The mean errors of 0.60% and 2.34% obtainedrespectively for test and various food samples showed thefeasibility of using computer vision for the measurementof food colour instead of spectrophotometer. In anotherwork, Pedreschi et al. (2006) designed and implementedan inexpensive computer vision system to measure repre-sentatively and precisely the colour of potato chips inL*a*b* units from RGB images. The system had the func-tions of image acquisition, image storage, image pre-processing, object segmentation, feature extraction, andcolour transformation from RGB to L*a*b* units. The sys-tem allowed the measurements of the colour over the entiresurface of a potato chip or over a small specific surface re-gion of interest in an easy, precise, representative, objectiveand inexpensive way. There are also some other commer-cial systems available for food colour measurement, suchas QualiVision system (Dipix Technologies, Ottawa,Ontario, Canada), Lumetech Optiscan system (Koch Lume-tech, Kansas City, Mo., USA), Model L-10 Vision Weigher(Marel, Reykjavik, Iceland), Parasensor system (Precarn,Ottawa, Canada), Prophecy 550 system (Imaging Technol-ogy, Bedford, Mass.), and SINTEF system (SINTEF, Oslo,Norway) (Balaban & Odabasi, 2006).
Advantages and disadvantages of using computervision
Many reviews have concluded the advantages and disad-vantages of computer vision (Brosnan & Sun, 2004; Du &Sun, 2004; Gumus, Balaban, & Unlusayin, 2011).Especially for food colour measurement, the main advan-tages of applying computer vision technique include:
� The rapidness, preciseness, objectiveness, efficiency,consistency, and non-destruction of the measurementof colour data with low cost and no sample pretreatment;
� The ability of providing high spatial resolution, analyzingeach pixel of the surface of a food product, extractingmore colour features with spatial information, analyzingthe whole food even it is of small or irregular shape andof nonuniform colours, and selecting a region of interest,and generating the distribution map of colour;
� The automation of mass labour intensive operations andreduction of tedious and subjective human visual in-volvement; and

18 D. Wu, D.-W. Sun / Trends in Food Science & Technology 29 (2013) 5e20
� The availability of rapid generation of reproducible re-sults and a permanent storage of colour data for furtheranalysis by keeping the picture.
Although computer vision has the aforementioned ad-vantages, it does have some disadvantages (Brosnan &Sun, 2004; Gumus et al., 2011):
� The difficulties encountered with objects that are diffi-cult to separate from the background, overlapping ob-jects, or when both sides of a food need to be evaluated;
� The requirement of careful calibration and setting ofcamera and well-defined and consistent illumination(such as a light box, where the light intensity, spectrumand direction are all controlled); and
� The possible variation of intensity and the spectrum oflight bulbs over time (Balaban & Odabasi, 2006).
Conclusions and future trendsThis review covers fundamentals and typical applica-
tions of computer vision in food colour measurement. Asa science-based automated food inspection technique, com-puter vision has been proved to be efficient and reliable forcolour measurement with the capabilities not possible withother methods, especially the ability for analyzing foodsamples with nonhomogeneous colours, shapes, and sur-faces. The colour measurement of using computer visionis repeatable and flexible, permits the plant applicationwith high throughput and accuracy and a relatively lowcost, and allows human visual inspectors to focus onmore demanding and skilled jobs, instead of undertakingtedious, laborious, time-consuming, and repetitive inspec-tion tasks. Moreover, besides colour measurement, com-puter vision allows evaluation of other quality attributes,such as shape, size, orientation, defects, and nutrition.Based on the combination of these attributes, computer vi-sion offers the possibility of designing inspection systemsfor the automatic grading and quality determination offood products. On the basis of computer vision, it is feasi-ble to reduce industrial dependence on human graders, in-crease production throughput, decrease production cost,improve product consistency and wholesomeness, andenhance public confidence in the safety and quality of thefood products.
On the other hand, despite the above great researchefforts on colour measurement of food products using com-puter vision, there are still many challenges remain to de-sign a computer vision system that has sufficientflexibility and adaptability to handle the biological varia-tions in food products. Further in-depth research is requiredon system robustness, real-time capability, sample han-dling, and standardization, which also create many futureresearch opportunities. Some difficulties arise from the seg-mentation algorithms, which is a prerequisite to the successof all subsequent operations leading to successful computer
vision-based colour measurement without human interven-tion. Due to the complex nature of food images, no existingalgorithm is totally effective for food-image segmentation.The development of efficient and robust calibration is alsorequired to reduce the influence from the change of camera,illumination, and environment. Besides image process algo-rithms, the development in hardware and software of com-puter vision system is also critical to measure colour offood products rapidly and accurately. A faster, lighter/smaller, and less expensive hardware can decrease imageacquisition and analysis time, improve the speed and spaceof storage, and increase the image resolution for detailedcolour measurement.
AcknowledgementsThe authors would like to acknowledge the financial
support provided by the Irish Research Council for Science,Engineering and Technology under the Government ofIreland Postdoctoral Fellowship scheme.
References
Abdullah, M. Z. (2008). Image acquisition systems. In D.-W. Sun (Ed.),Computer vision technology for food quality evaluation. Elsevier,San Diego, California, USA: Academic Press.
Balaban, M. O. (2008). Quantifying nonhomogeneous colors inagricultural materials part I: method development. Journal of FoodScience, 73, S431eS437.
Balaban, M. O., Aparicio, J., Zotarelli, M., & Sims, C. (2008).Quantifying nonhomogeneous colors in agricultural materials. PartII: comparison of machine vision and sensory panel evaluations.Journal of Food Science, 73, S438eS442.
Balaban, M. O., & Odabasi, A. Z. (2006). Measuring color withmachine vision. Food Technology, 60, 32e36.
Barnard, K., Cardei, V., & Funt, B. (2002). A comparison ofcomputational color constancy algorithms e part I: methodologyand experiments with synthesized data. IEEE Transactions onImage Processing, 11, 972e984.
Barnard, K., Martin, L., Coath, A., & Funt, B. (2002). A comparison ofcomputational color constancy algorithms e part II: experimentswith image data. IEEE Transactions on Image Processing, 11,985e996.
Bayarri, S., Calvo, C., Costell, E., & Duran, L. (2001). Influence ofcolor on perception of sweetness and fruit flavor of fruit drinks.Food Science and Technology International, 7, 399e404.
Blasco, J., Aleixos, N., & Molto, E. (2003). Machine vision system forautomatic quality grading of fruit. Biosystems Engineering, 85,415e423.
Brosnan, T., & Sun, D.-W. (2004). Improving quality inspection offood products by computer vision e a review. Journal of FoodEngineering, 61, 3e16.
Costa, C., Antonucci, F., Menesatti, P., Pallottino, F., Boglione, C., &Cataudella, S. (2012). An advanced colour calibration method forfish freshness assessment: a comparison between standard andpassive refrigeration modalities. Food and Bioprocess Technology.
Costa, C., Antonucci, F., Pallottino, F., Aguzzi, J., Sun, D. W., &Menesatti, P. (2011). Shape analysis of agricultural products:a review of recent research advances and potential application tocomputer vision. Food and Bioprocess Technology, 4, 673e692.
Costa, C., Pallottino, F., Angelini, C., Proietti, P., Capoccioni, F.,Aguzzi, J., et al. (2009). Colour calibration for quantitativebiological analysis: a novel automated multivariate approach.Instrumentation Viewpoint, 8, 70e71.

19D. Wu, D.-W. Sun / Trends in Food Science & Technology 29 (2013) 5e20
Cubero, S., Aleixos, N., Molto, E., Gomez-Sanchis, J., & Blasco, J.(2011). Advances in machine vision applications for automaticinspection and quality evaluation of fruits and vegetables. Foodand Bioprocess Technology, 4, 487e504.
Du, C. J., & Sun, D.-W. (2004). Recent developments in theapplications of image processing techniques for food qualityevaluation. Trends in Food Science & Technology, 15, 230e249.
Du, C. J., & Sun, D.-W. (2005). Comparison of three methods forclassification of pizza topping using different colour spacetransformations. Journal of Food Engineering, 68, 277e287.
Du, C. J., & Sun, D.-W. (2006). Learning techniques used in computervision for food quality evaluation: a review. Journal of FoodEngineering, 72(1), 39e55.
Fairchild, M. D. (2005). Color appearance models, (2nd ed.). England:John Wiley & Sons Ltd.
Fernandez-Vazquez, R., Stinco, C. M., Melendez-Martinez, A. J.,Heredia, F. J., & Vicario, I. M. (2011). Visual and instrumentalevaluation of orange juice color: a consumers’ preference study.Journal of Sensory Studies, 26, 436e444.
Ford, A., & Roberts, A. (1998). Colour space conversions. London,UK: Westminster University.
Forsyth, D., & Ponce, J. (2003). Computer vision: A modern approach.New Jersey: Prentice Hall.
Gerrard, D. E., Gao, X., & Tan, J. (1996). Beef marbling and colorscore determination by image processing. Journal of Food Science,61, 145e148.
Gormley, T. R. (1992). A note on consumer preference of smokedsalmon color. Irish Journal of Agricultural and Food Research, 31,199e202.
Gumus, B., Balaban, M. O., & Unlusayin, M. (2011). Machine visionapplications to aquatic foods: a review. Turkish Journal of Fisheriesand Aquatic Sciences, 11, 167e176.
Gunasekaran, S. (1996). Computer vision technology for food qualityassurance. Trends in Food Science & Technology, 7, 245e256.
Gurbuz, S., Kawakita, M., & Ando, H. (2010). Color calibration formulti-camera imaging systems. In Proceeding of the 4thInternational Universal Communication Symposium (IUCS 2010).Beijing, China.
Hashim, N., Janius, R., Baranyai, L., Rahman, R., Osman, A., &Zude, M. Kinetic model for colour changes in bananas during theappearance of chilling injury symptoms. Food and BioprocessTechnology, in press.
Hunt, R. W. G. (1995). The reproduction of colour, (5th ed.). England:Fountain Press.
Hunt, R. W. G. (1998). Measuring colour. England: Fountain Press.Hurlbert, A. (2007). Colour constancy.Current Biology,17, R906eR907.Hutchings, J. B. (1994). Food colour and appearance. Glasgow, UK:
Blackie Academic & Professional.Hutchings, J. B. (1999). Food color and appearance. Gaithersburg,
Md: Aspen Publishers.Ilie, A., & Welch, G. (2005). Ensuring color consistency across
multiple cameras. In Proceedings of the tenth IEEE internationalconference on computer vision (ICCV-05).
Iqbal, A., Valous, N. A., Mendoza, F., Sun, D.-W., & Allen, P. (2010).Classification of pre-sliced pork and Turkey ham qualities basedon image colour and textural features and their relationships withconsumer responses. Meat Science, 84, 455e465.
Jackman, P., Sun, D.-W., & Allen, P. (2011). Recent advances in theuse of computer vision technology in the quality assessment offresh meats. Trends in Food Science & Technology, 22, 185e197.
Kays, S. J. (1991). Postharvest physiology of perishable plant products.New York: Van Nostrand Reinholt.
Kays, S. J. (1999). Preharvest factors affecting appearance. PostharvestBiology and Technology, 15, 233e247.
Kazlauciunas, A. (2001). Digital imaging e theory and applicationpart I: theory. Surface Coatings International Part B-CoatingsTransactions, 84, 1e9.
Kihc, K., Onal-Ulusoy, B., Yildirim, M., & Boyaci, I. H. (2007).Scanner-based color measurement in L*a*b* format with artificialneural networks (ANN). European Food Research and Technology,226, 121e126.
Konica, Minolta (1998). Precise color communication: Color controlfrom perception to instrumentation. Osaka: Konica MinoltaSensing, Inc.
Krutz, G.W., Gibson,H.G., Cassens, D. L., & Zhang,M. (2000). Colourvision in forest and wood engineering. Landwards, 55, 2e9.
Lana, M. M., Tijskens, L. M. M., & van Kooten, O. (2005). Effects ofstorage temperature and fruit ripening on firmness of fresh cuttomatoes. Postharvest Biology and Technology, 35, 87e95.
Larrain, R. E., Schaefer, D. M., & Reed, J. D. (2008). Use of digitalimages to estimate CIE color coordinates of beef. Food ResearchInternational, 41, 380e385.
Leon, K., Mery, D., Pedreschi, F., & Leon, J. (2006). Colormeasurement in L*a*b* units from RGB digital images. FoodResearch International, 39, 1084e1091.
Ling, Y. Z., & Hurlbert, A. (2008). Role of color memory in successivecolor constancy. Journal of the Optical Society of AmericaA-Optics Image Science and Vision, 25, 1215e1226.
Litwiller, D. (2005). CMOs vs. CCD: maturing technologies, maturingmarkets. Photonics Spectra, 39, 54e58.
Li, B., Xu, D., & Feng, S. H. (2009). Illumination estimation based oncolor invariant. Chinese Journal of Electronics, 18, 431e434.
Lu, J., Tan, J., Shatadal, P., & Gerrard, D. E. (2000). Evaluation of porkcolor by using computer vision. Meat Science, 56, 57e60.
Maguire, K. (1994). Perceptions of meat and food: some implicationsfor health promotion strategies. British Food Journal, 96, 11e17.
Mancini, R. A., & Hunt, M. C. (2005). Current research in meat color.Meat Science, 71, 100e121.
Martin, M. L. G. M., Ji, W., Luo, R., Hutchings, J., & Heredia, F. J.(2007). Measuring colour appearance of red wines. Food Qualityand Preference, 18, 862e871.
Mathworks (2012). Matlab user’s guide. Natick, MA: The MathWorks,Inc.
McCaig, T. N. (2002). Extending the use of visible/near-infraredreflectance spectrophotometers to measure colour of food andagricultural products. Food Research International, 35,731e736.
Melendez-Martinez, A. J., Vicario, I. M., & Heredia, F. J. (2005).Instrumental measurement of orange juice colour: a review.Journal of the Science of Food and Agriculture, 85, 894e901.
Mendoza, F., & Aguilera, J. M. (2004). Application of image analysisfor classification of ripening bananas. Journal of Food Science, 69,E471eE477.
Mendoza, F., Dejmek, P., & Aguilera, J. M. (2006). Calibrated colormeasurements of agricultural foods using image analysis.Postharvest Biology and Technology, 41, 285e295.
Menesatti, P., Angelini, C., Pallottino, F., Antonucci, F., Aguzzi, J., &Costa, C. (2012). RGB color calibration for quantitative imageanalysis: the “3D thin-plate spline” warping approach. Sensors,12, 7063e7079.
Misimi, E., Mathiassen, J. R., & Erikson, U. (2007). Computer vision-based sorting of Atlantic salmon (Salmo salar) fillets according totheir color level. Journal of Food Science, 72, S30eS35.
O’Sullivan, M. G., Byrne, D. V., Martens, H., Gidskehaug, L. H.,Andersen, H. J., & Martens, M. (2003). Evaluation of pork colour:prediction of visual sensory quality of meat from instrumental andcomputer vision methods of colour analysis. Meat Science, 65,909e918.
Oliveira, A. C. M., & Balaban, M. O. (2006). Comparison ofa colorimeter with a machine vision system in measuring color ofGulf of Mexico sturgeon fillets. Applied Engineering inAgriculture, 22, 583e587.
Pallottino, F., Menesatti, P., Costa, C., Paglia, G., De Salvador, F. R., &Lolletti, D. (2010). Image analysis techniques for automated
20 D. Wu, D.-W. Sun / Trends in Food Science & Technology 29 (2013) 5e20
hazelnut peeling determination. Food and Bioprocess Technology,3, 155e159.
Pascale, D. (2003). A review of RGB color spaces. Montreal: TheBabel Color Company.
Paschos, G. (2001). Perceptually uniform color spaces for colortexture analysis: an empirical evaluation. IEEE Transactions onImage Processing, 10, 932e937.
Pedreschi, F., Bunger, A., Skurtys, O., Allen, P., & Rojas, X. (2012).Grading of potato chips according to their sensory qualitydetermined by color. Food and Bioprocess Technology, 5,2401e2408.
Pedreschi, F., Leon, J., Mery, D., & Moyano, P. (2006). Development ofa computer vision system to measure the color of potato chips.Food Research International, 39, 1092e1098.
Pedreschi, F., Mery, D., Bunger, A., & Yanez, V. (2011). Computervision classification of potato chips by color. Journal of FoodProcess Engineering, 34, 1714e1728.
Prasad, S., & Roy, B. (2003). Digital photography in medicine. Journalof Postgraduate Medicine, 49, 332e336.
Qin, J. W. (2010). Hyperspectral imaging instruments. In D.-W. Sun(Ed.), Hyperspectral imaging for food quality analysis and control(1st ed.). (pp. 159e172) San Diego, California, USA: AcademicPress/Elsevier.
Quevedo, R. A., Aguilera, J. M., & Pedreschi, F. (2010). Color ofsalmon fillets by computer vision and sensory panel. Food andBioprocess Technology, 3, 637e643.
Rocha, A. M. C. N., & Morais, A. M. M. B. (2003). Shelf life ofminimally processed apple (cv. Jonagored) determined by colourchanges. Food Control, 14, 13e20.
Rossel, R. A. V., Minasny, B., Roudier, P., & McBratney, A. B. (2006).Colour space models for soil science. Geoderma, 133, 320e337.
Russ, J. C. (1999). Image processing handbook. Boca Raton: CRCPress.
Scanlon, M. G., Roller, R., Mazza, G., & Pritchard, M. K. (1994).Computerized video image-analysis to quantify color of potatochips. American Potato Journal, 71, 717e733.
Segnini, S., Dejmek, P., & Oste, R. (1999a). A low cost videotechnique for colour measurement of potato chips. Food Scienceand Technology e Lebensmittel-Wissenschaft & Technologie, 32,216e222.
Segnini, S., Dejmek, P., & Oste, R. (1999b). Relationship betweeninstrumental and sensory analysis of texture and color of potatochips. Journal of Texture Studies, 30, 677e690.
Shi, L. L., Xiong, W. H., & Funt, B. (2011). Illumination estimation viathin-plate spline interpolation. Journal of the Optical Society ofAmerica A-Optics Image Science and Vision, 28, 940e948.
Sun, D.-W. (2000). Inspecting pizza topping percentage anddistribution by a computer vision method. Journal of FoodEngineering, 44(4), 245e249.
Sun, D.-W., & Brosnan, T. (2003). Pizza quality evaluation usingcomputer vision e part 1 e Pizza base and sauce spread. Journalof Food Engineering, 57(1), 81e89.
Sun, F. X., Chang, Y. W., Zhou, Z. M., & Yu, Y. F. (2004).Determination of beer color using image analysis. Journal of theAmerican Society of Brewing Chemists, 62, 163e167.
Sun, X., Chen, K., Berg, E. P., & Magolski, J. D. (2011). Predicting freshbeef color grade using machine vision imaging and support vectormachine (SVM) analysis. Journal of Animal and VeterinaryAdvances, 10, 1504e1511.
Tan, J. L. (2004). Meat quality evaluation by computer vision. Journalof Food Engineering, 61, 27e35.
Tan, J., Gao, X., & Gerrard, D. E. (1999). Application of fuzzy sets andneural networks in sensory analysis. Journal of Sensory Studies, 14,119e138.
Tan, F. J., Morgan, M. T., Ludas, L. I., Forrest, J. C., & Gerrard, D. E.(2000). Assessment of fresh pork color with color machine vision.Journal of Animal Science, 78, 3078e3085.
The science of color. (1973). Washington: Committee on Colorimetry,Optical Society of America.
Unklesbay, K., Unklesbay, N., & Keller, J. (1986). Determination ofinternal color of beef ribeye steaks using digital image-analysis.Food Microstructure, 5, 227e231.
Van Poucke, S., Haeghen, Y. V., Vissers, K., Meert, T., & Jorens, P.(2010). Automatic colorimetric calibration of human wounds.BMC Medical Imaging, 10, 7.
Wu, D., Chen, X. J., Shi, P. Y., Wang, S. H., Feng, F. Q., & He, Y.(2009). Determination of alpha-linolenic acid and linoleic acid inedible oils using near-infrared spectroscopy improved by wavelettransform and uninformative variable elimination. AnalyticaChimica Acta, 634, 166e171.
Wu, D., He, Y., & Feng, S. (2008). Short-wave near-infraredspectroscopy analysis of major compounds in milk powder andwavelength assignment. Analytica Chimica Acta, 610,232e242.
Wu, D., He, Y., Nie, P. C., Cao, F., & Bao, Y. D. (2010). Hybridvariable selection in visible and near-infrared spectral analysis fornon-invasive quality determination of grape juice. AnalyticaChimica Acta, 659, 229e237.
Yagiz, Y., Balaban, M. O., Kristinsson, H. G., Welt, B. A., &Marshall, M. R. (2009). Comparison of Minolta colorimeter andmachine vision system in measuring colour of irradiated Atlanticsalmon. Journal of the Science of Food and Agriculture, 89,728e730.
Zapotoczny, P., & Majewska, K. (2010). A comparative analysis ofcolour measurements of the seed coat and endosperm of wheatkernels performed by various techniques. International Journal ofFood Properties, 13, 75e89.
Zheng, C. X., Sun, D.-W., & Zheng, L. Y. (2006a). Recent applicationsof image texture for evaluation of food qualities e a review. Trendsin Food Science & Technology, 17(3), 113e128.
Zheng, C. X., Sun, D.-W., & Zheng, L. Y. (2006b). Recentdevelopments and applications of image features for food qualityevaluation and inspection e a review. Trends in Food Science &Technology, 17(12), 642e655.