fmri guided microarray analysis imaging-guided microarray: isolating molecular profiles that...
TRANSCRIPT

fMRI guided Microarray analysis
Imaging-Guided Microarray: Isolating Molecular Profiles That Dissociate Alzheimer’s Disease from Normal Aging A.C. Pereira, W. Wu & S.A. Small Ann NY Acad. Sci. 1097, Feb 2007
Combining Brain Imaging with Microarray: Isolating Molecules Underlying the Physiologic Disorders of the Brain A. Pierce & S.A. Small Neurochemical Research, Vol. 29, No. 6, June
2004
Crash course: The CELL and microarrays in 3 slides
Cells internal processes and inter-cell communication based on proteins
Goal: Figure out which proteins exist in a cell under some condition Condition – e.g. disease Many times – detect proteins differentially
expressed – e.g. disease vs. control Basic: staining a specific protein and follow it
under a microscope Next: The CELL
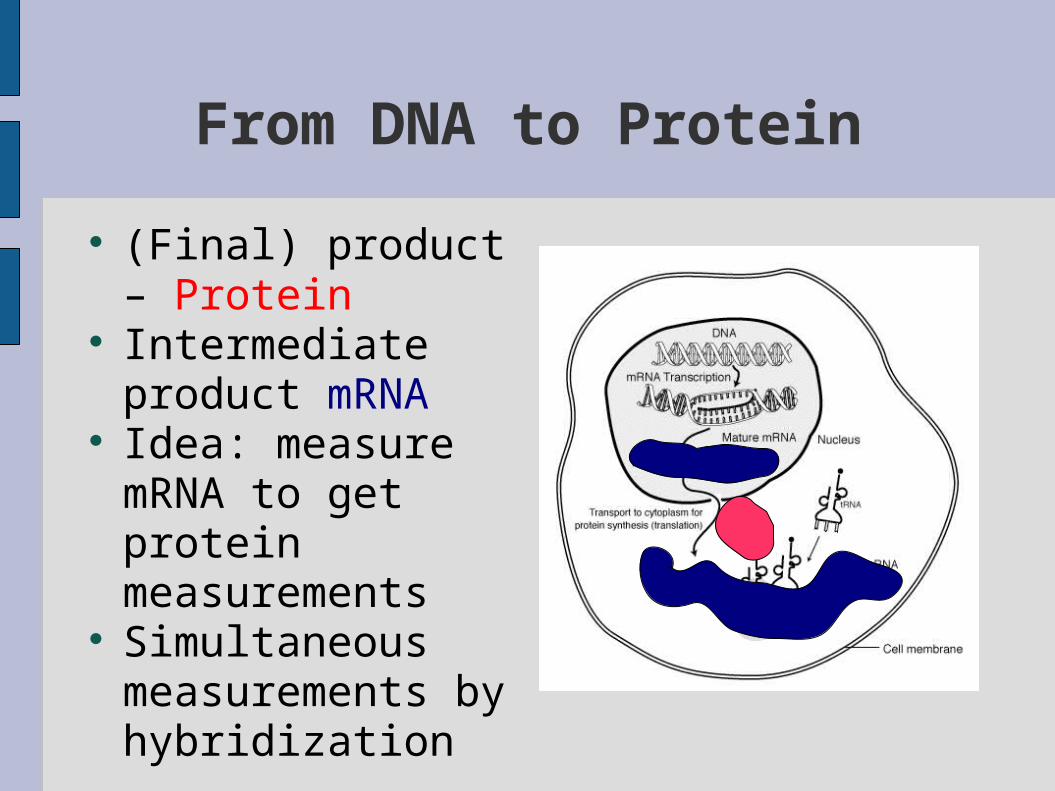
From DNA to Protein
(Final) product – Protein
Intermediate product mRNA
Idea: measure mRNA to get protein measurements
Simultaneous measurements by hybridization
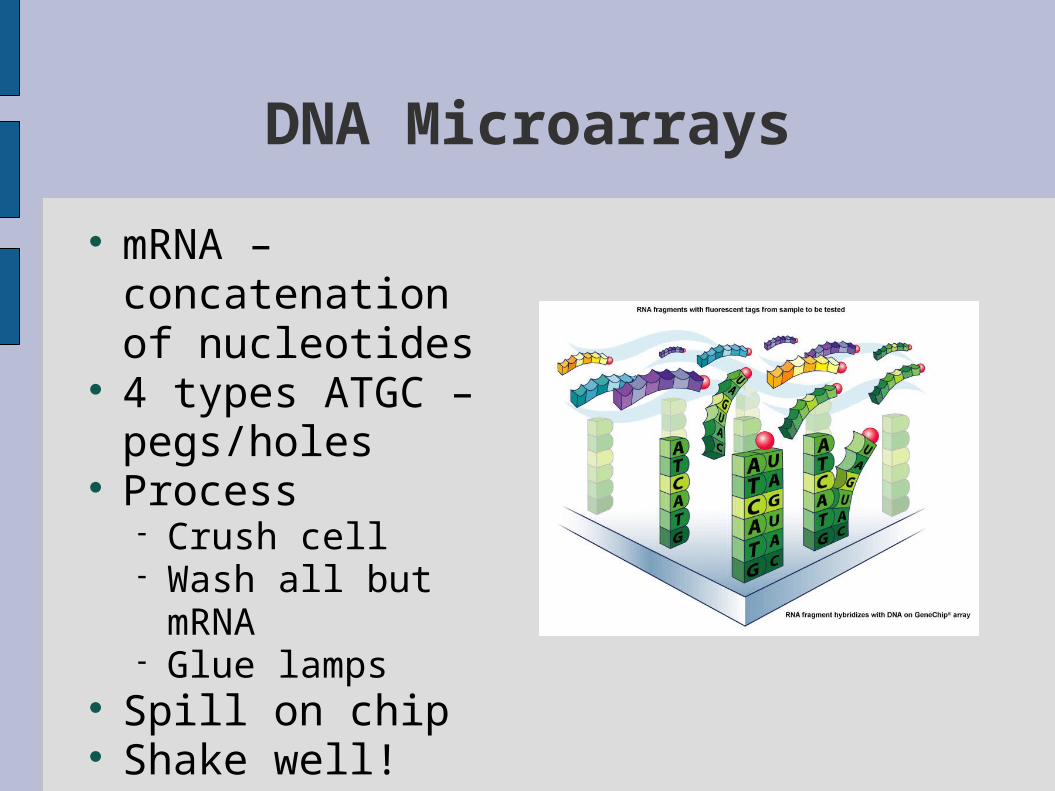
DNA Microarrays
mRNA – concatenation of nucleotides
4 types ATGC – pegs/holes
Process Crush cell Wash all but mRNA Glue lamps
Spill on chip Shake well!
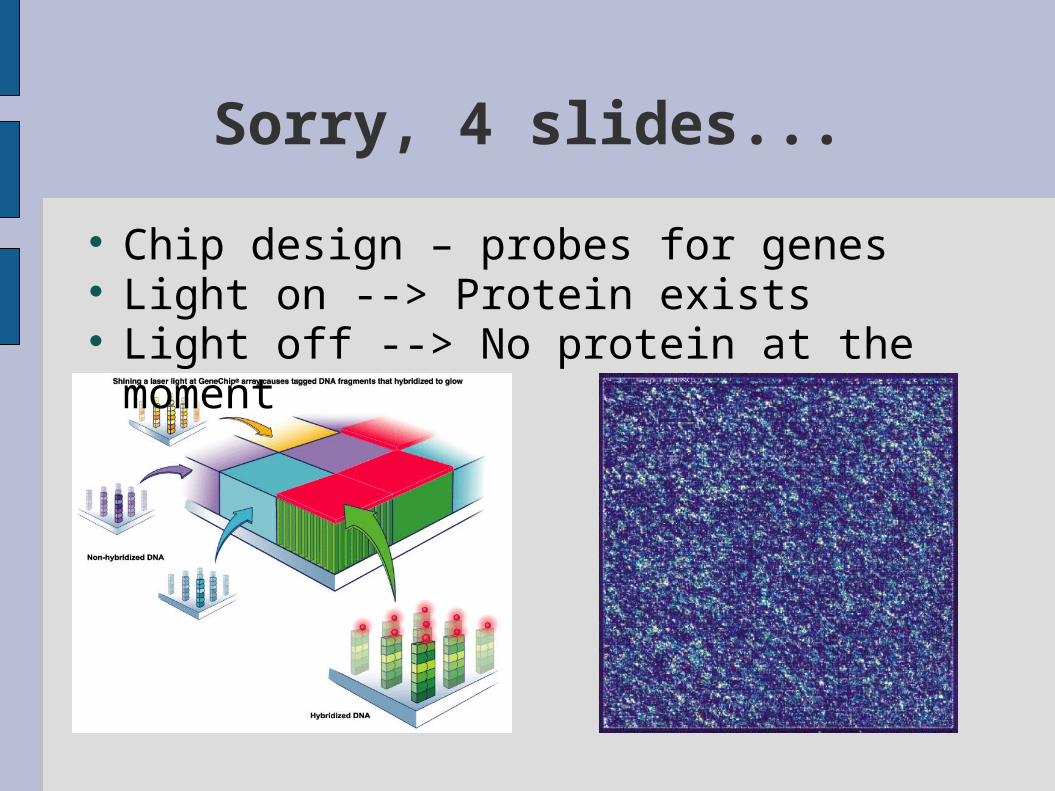
Sorry, 4 slides...
Chip design – probes for genes Light on --> Protein exists Light off --> No protein at the moment

Problem setting
Given two sets of DNA microarrays: Disease Control
Extract a set of differentially expressed genes Feature selection for classification Biological significant features for downstream
research

Problem setting revisited
Given two sets of DNA microarrays: Disease Control
+ fMRI measurements of the two populations Extract a small set of differentially expressed
pathogenic-behaving genes Feature selection for classification Biological significant features for downstream
research
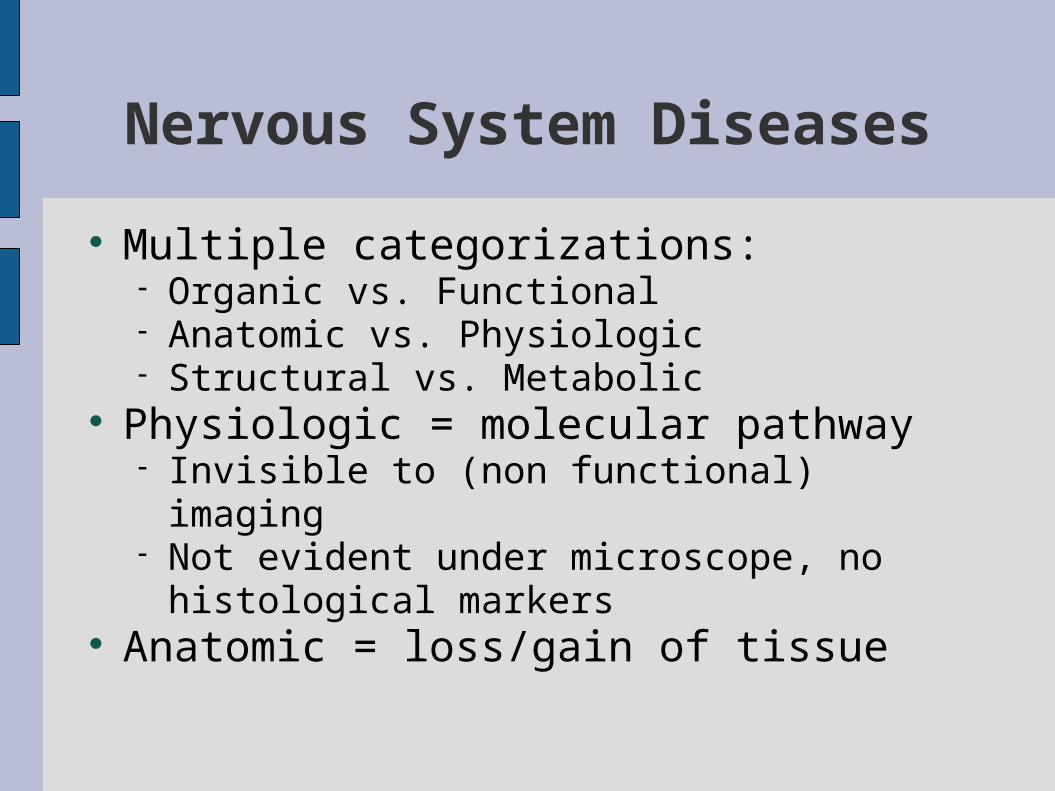
Nervous System Diseases
Multiple categorizations: Organic vs. Functional Anatomic vs. Physiologic Structural vs. Metabolic
Physiologic = molecular pathway Invisible to (non functional) imaging Not evident under microscope, no histological
markers Anatomic = loss/gain of tissue
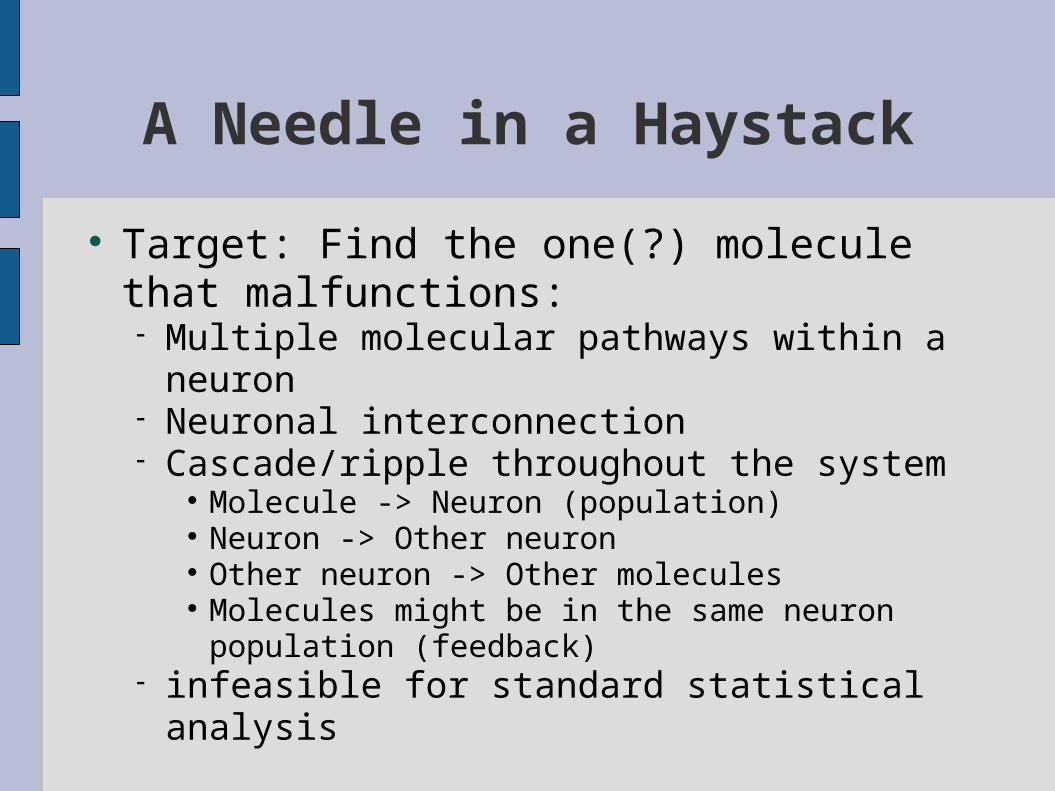
A Needle in a Haystack
Target: Find the one(?) molecule that malfunctions: Multiple molecular pathways within a neuron Neuronal interconnection Cascade/ripple throughout the system
Molecule -> Neuron (population) Neuron -> Other neuron Other neuron -> Other molecules Molecules might be in the same neuron population
(feedback) infeasible for standard statistical analysis
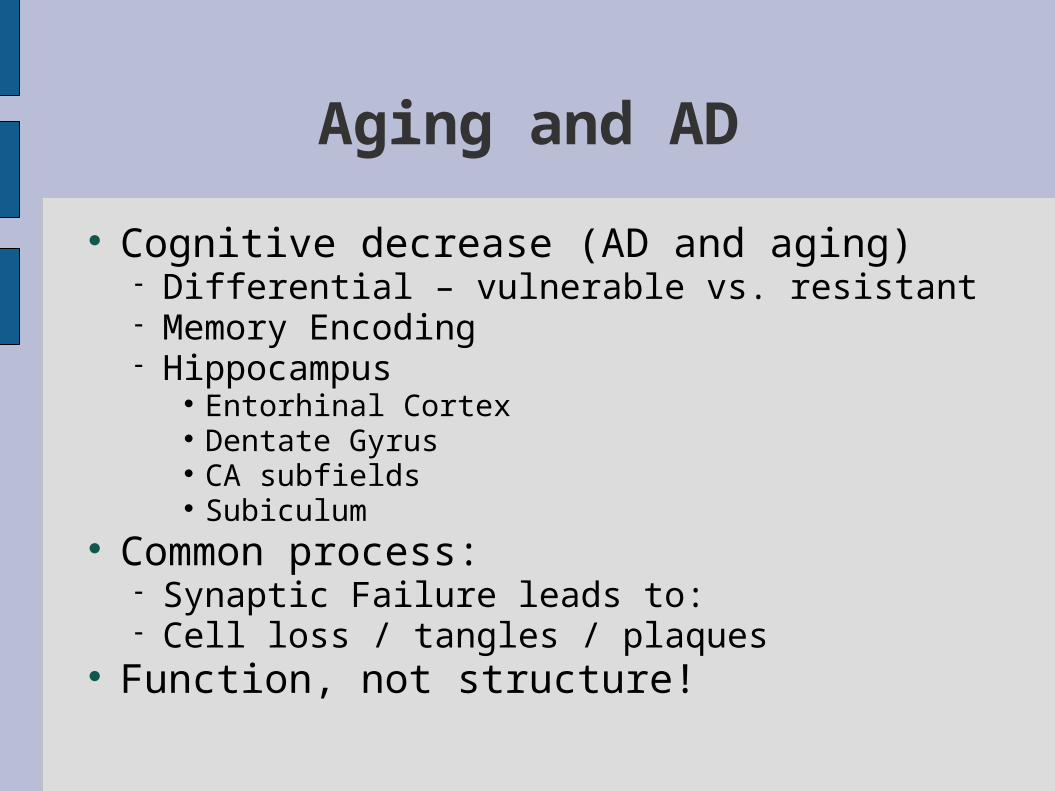
Aging and AD
Cognitive decrease (AD and aging) Differential – vulnerable vs. resistant Memory Encoding Hippocampus
Entorhinal Cortex Dentate Gyrus CA subfields Subiculum
Common process: Synaptic Failure leads to: Cell loss / tangles / plaques
Function, not structure!
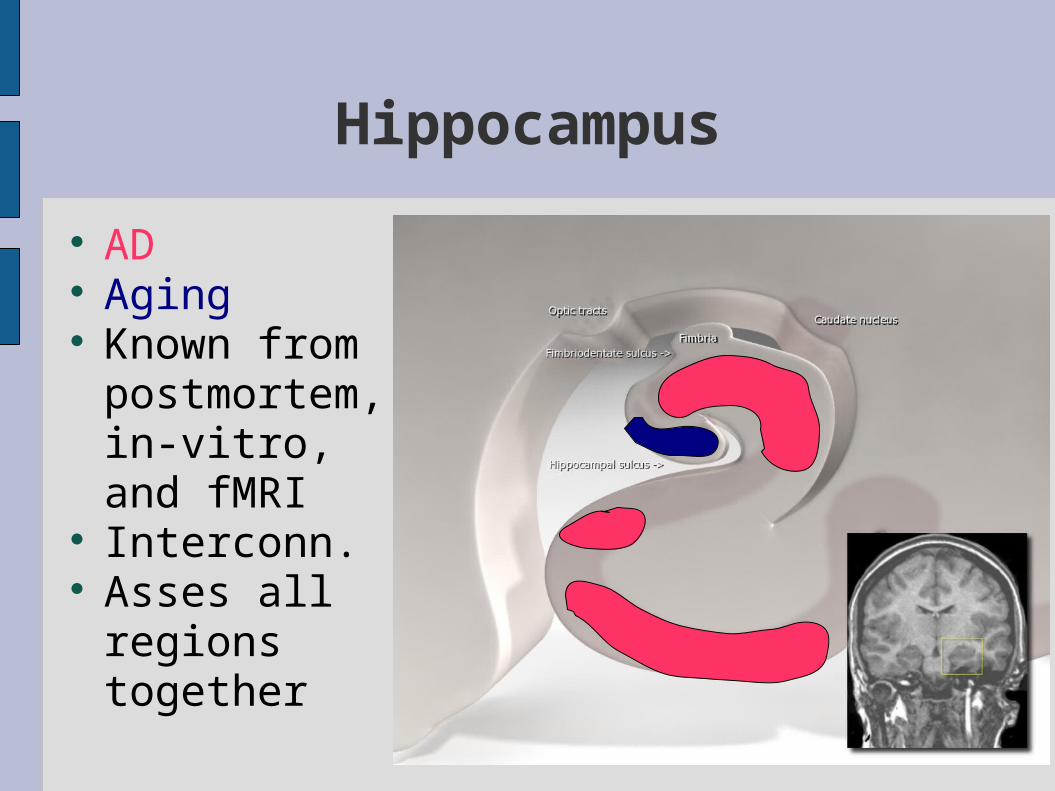
AD Aging Known from
postmortem,in-vitro, and fMRI
Interconn. Asses all
regions together
Hippocampus
Microarray analysis
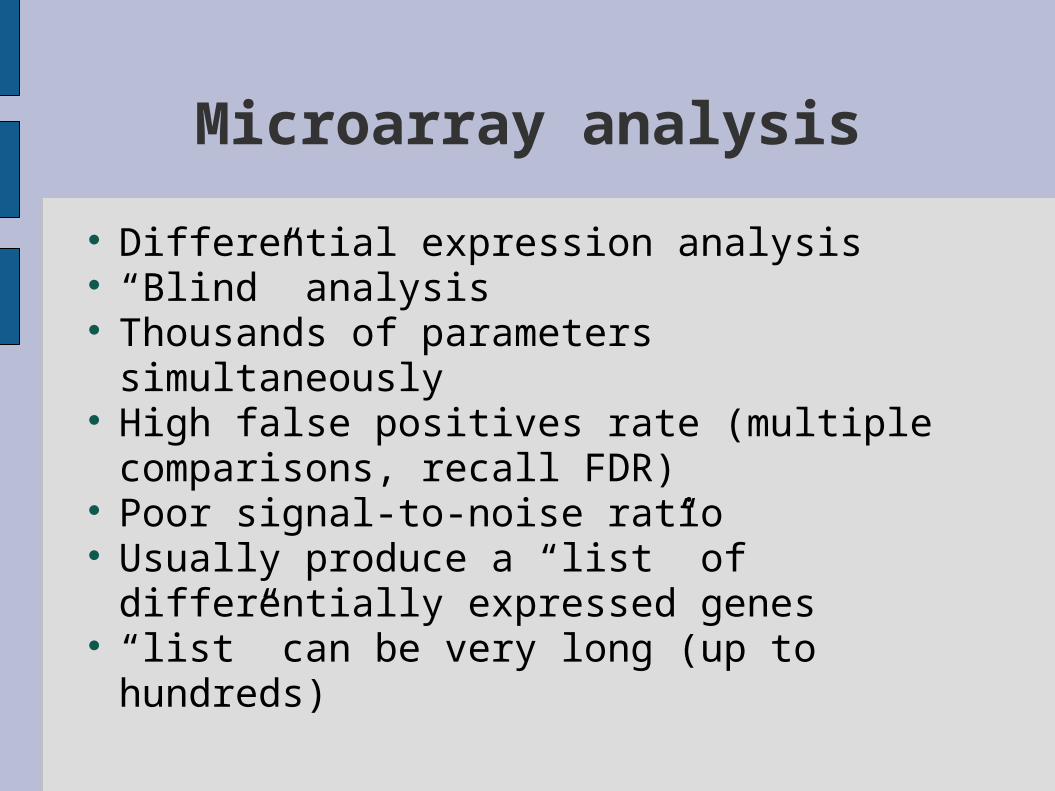
Differential expression analysis “Blind” analysis Thousands of parameters simultaneously High false positives rate (multiple
comparisons, recall FDR) Poor signal-to-noise ratio Usually produce a “list” of differentially
expressed genes “list” can be very long (up to hundreds)

Statistical Modeling
Temporal model 2nd stage for fMRI
Double subtraction
With sickness - basal metabolic rate changes as well
Control DiseaseVulnerable
Resistant
Multiple Studies
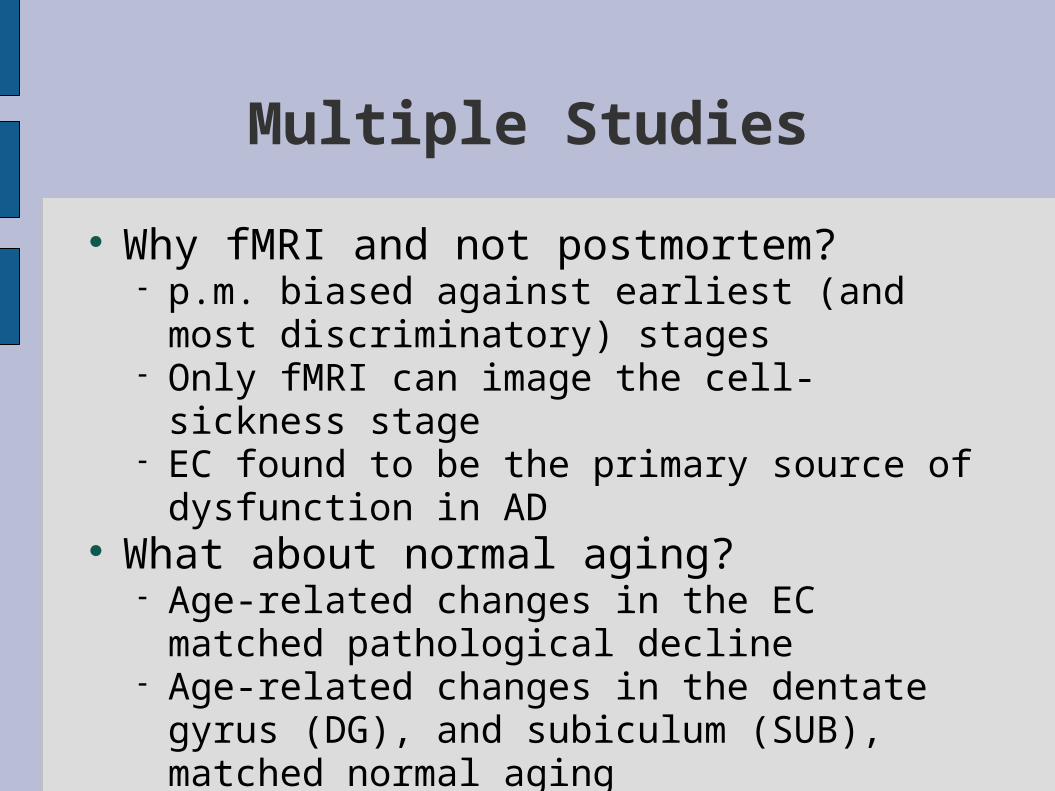
Why fMRI and not postmortem? p.m. biased against earliest (and most
discriminatory) stages Only fMRI can image the cell-sickness stage EC found to be the primary source of dysfunction
in AD What about normal aging?
Age-related changes in the EC matched pathological decline
Age-related changes in the dentate gyrus (DG), and subiculum (SUB), matched normal aging
Spatio-Temporal Model
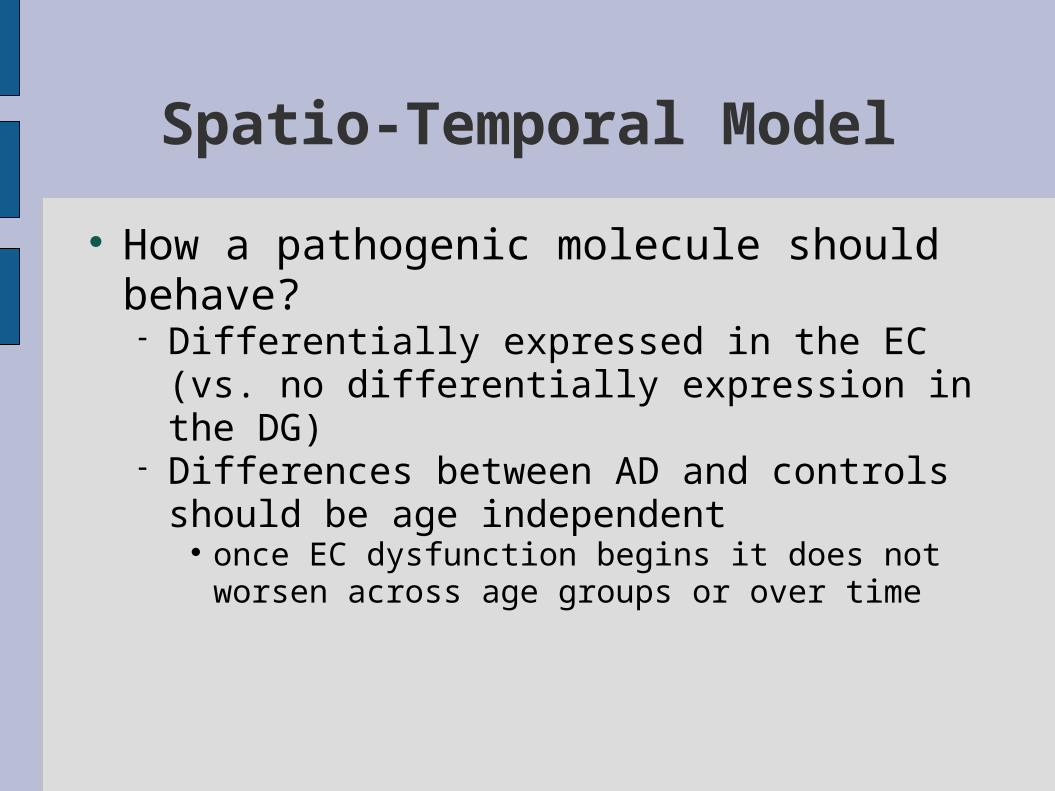
How a pathogenic molecule should behave? Differentially expressed in the EC (vs. no
differentially expression in the DG) Differences between AD and controls should be
age independent once EC dysfunction begins it does not worsen
across age groups or over time
Results
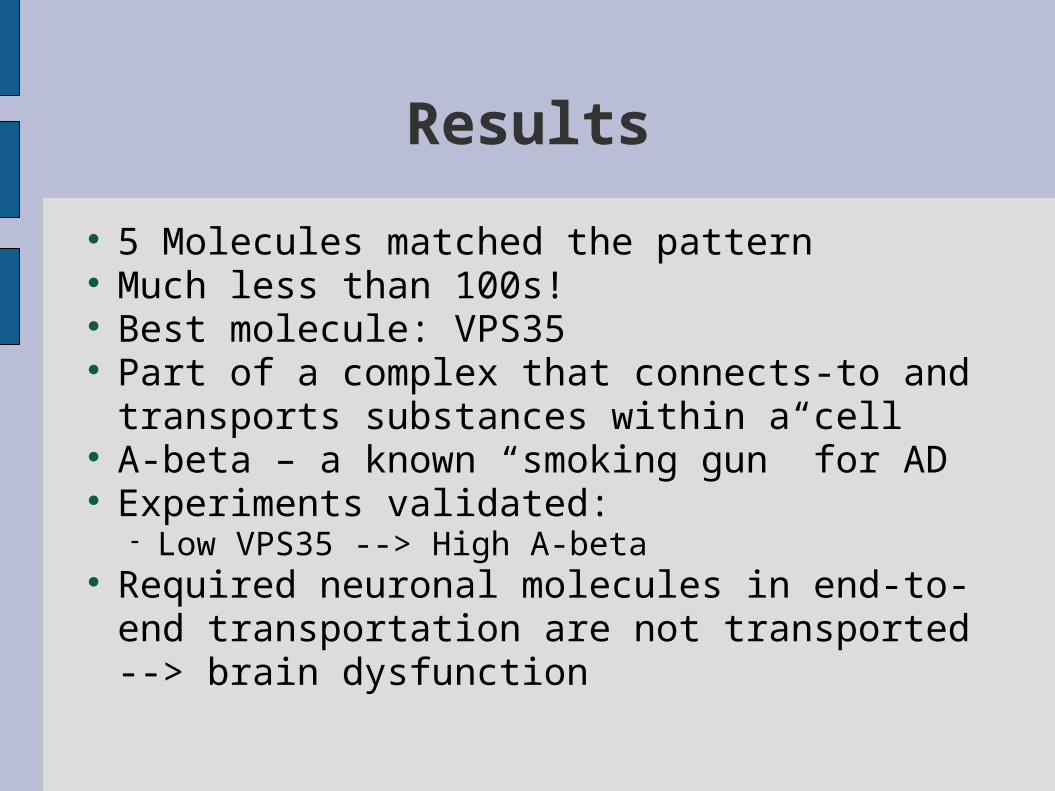
5 Molecules matched the pattern Much less than 100s! Best molecule: VPS35 Part of a complex that connects-to and
transports substances within a cell A-beta – a known “smoking gun” for AD Experiments validated:
Low VPS35 --> High A-beta Required neuronal molecules in end-to-end
transportation are not transported --> brain dysfunction
Conclusion
Microarrays – noisy, unfocused results fMRI – imaging in-vivo, not post-mortem Create statistical model (criteria) using fMRI,
for microarray differentiation Lack of specific methods Not a parametric model, like a thumb rule Nice example for research advance
My personal research is on PD Lots of imaging data Any suggestions? Thanks!