fisica nucleare e subnucleare ii · fisica nucleare e subnucleare ii, a.a. 2007-2008 - prof. a....
TRANSCRIPT

Fisica Nucleare e Subnucleare II, A.A. 2007-2008 - Prof. A. Capone Lezioni 10-11 1
Fisica Nucleare e Subnucleare II
– apparati rivelatori di particelle elementari
• Tempi di volo
• Transition Radiation detectors
• Cherenkov
• Camere a fili, proporzionali, drift, …
• Calorimetri, sviluppo di sciami e.m.
– rivelazione di raggi cosmici primari con
energia < 100 GeV
• misura della composizione dei raggi cosmici
primari
• misura della componente di antimateria nei
raggi cosmici primari
• palloni stratosferici

Fisica Nucleare e Subnucleare II, A.A. 2007-2008 - Prof. A. Capone Lezioni 10-11 2
Rapporto Protone/antiprotone
Nel 79 Golden et al. osservarono antiprotoni nei raggi cosmici. Segno diun universo simmetrico per materia ed antimateria ???.
Antiprotoni aspettati nelle interazioni di R.C. (protoni, He+, nuclei piùpesanti,...) con la materia interstellare (ISM).Il confronto fra flusso aspettato e misurato può offrire dati per“modellare” il trasporto dei R.C. (in particolare i nuclei più pesanti)nell’ISM.
Sono state considerate anche altre sorgenti ‘esotiche” quali “evaporazionedi black holes primordiali, decadimento di “dark matter”, accelerazione inplasma relativistico, ...
Le misure recenti di BESS, MASS2 , IMAX, e CAPRICE sono in accordocon il modello che la maggioranza degli antiprotoni sono prodottisecondari dell’interazione dei R.C. primari.

Fisica Nucleare e Subnucleare II, A.A. 2007-2008 - Prof. A. Capone Lezioni 10-11 3
I Palloni stratosferici

Fisica Nucleare e Subnucleare II, A.A. 2007-2008 - Prof. A. Capone Lezioni 10-11 4
MASS - Matter Antimatter Space ExperimentProgettato per misurare
antiprotoni con E ~ 4-20GeV
positroni con E ~ 4-10 GeV.
E’ l’evoluzione di MASS1 (exp. portato in volo nel
1989), con l’apparato tracciante migliorato grazie ad
un sistema di “camere a drift”.
L’identificazione delle particelle possibile grazie al
Cherenkov a gas (Freon-12) e ad un calorimetro
realizzato con tubi-streamer in ottone (ed
Isobutano). L’esperimento fu portato in volo per 23
ore nel settembre 1991 da Ft. Sumner, dopo 10 ore
perse il campo magnetico.

Fisica Nucleare e Subnucleare II, A.A. 2007-2008 - Prof. A. Capone Lezioni 10-11 5
HEAT - The TRDA schematic cross-sectional view of
the different detectors making up
HEAT, in the first configuration for
detection of electrons and positrons.
The HEAT Transition Radiation Detector
The Transition Radiation Detector (built by the University of Chicago) consists of six
polyethylene fiber radiator blankets, each with a multi-wire proportional chamber MWPC
(filled with a Xenon-methane gas mixture) attached underneath. When a charged particle
travels through an interface between materials of different dielectric constants, radiation
(in the form of X-rays) is generated with an intensity proportional to the relativistic
Lorentz factor gamma of the particle. As it travels through a polyethylene fiber blanket, a
high-energy electron (of high Lorentz gamma) encounters many interfaces and generates
transition radiation, whereas a proton of the same energy (but a much lower Lorentz factor
due to a higher mass) generates essentially no such radiation.
X-ray photons are absorbed by the gas mixture in the MWPC. The combination of energy
deposited by the X-rays and ionization losses (due to the passage of any charged particle -
electron or proton - through the gas in the chambers) is picked up electrically by cathode
electrodes running perpendicular to the wires in the chamber (used in the pulse-height
analysis below). Additionally, an electrical signal is also picked up by the wires in the
chamber, and both a signal amplitude and variation with time are recorded (used in the
time slice analysis below).
Pulse-height likelihood analysis
The total energy deposited in each of the six MWPCs is compared to the known signals
(from prior calibrations) obtained when an electron, proton or alpha particle traverses the
detector. A parameter is then calculated that indicates the likelihood that the particle was
an electron (technically, the parameter is the product for all six chambers of the
probability that the signal was produced by an electron or positron divided by the
probability that the signal was produced by a proton). Figure A below shows the
distribution of this maximum-likelihood parameter with clearly separated proton and
electron populations.
Time slice analysis
A software neural-net classifier (with 3 input nodes, 5 hidden nodes and one output node)
was devised, and trained to recognize the difference in the resulting time distribution of
charge clusters detected by the wires when an electron or a proton traverses the detector.
The output of the neural net analysis is a number between 0 and 1, indicating the
probability that the particle was a proton (near 0) or an electron or positron (near 1). The
excellent separation between protons and electrons is illustrated in figure B below.
MWPC

Fisica Nucleare e Subnucleare II, A.A. 2007-2008 - Prof. A. Capone Lezioni 10-11 6
!
IIntensity TR= m" =
m
1#$ 2
" =1
1#$ 2
=ETot
mc2% " #1=
EKin
mc2
!
ricavata nell'ipotesi Mpart. incid. >> me
4Be h" = 63.4 eV
13Al h" = 166.5 eV
29Cu h" = 375.6 eV
48Ag h" = 585.0 eV
79Au h" =1037.0 eV
Transition radiation is produced when a relativistic
particle traverses an inhomogeneous medium, in
particular the boundary between materials of
different electrical properties. The intensity of
transition radiation is roughly proportional to the
particle energy,
Radiazione di transizione
Ricordiamo per confronto la formula di Bethe-Bloch che descrive la perdita di energiaper ionizzazione di una particella carica di velocità v=!c, in un materiale con numero
di massa A e carica Z
è la densità di
elettroni del
materiale

Fisica Nucleare e Subnucleare II, A.A. 2007-2008 - Prof. A. Capone Lezioni 10-11 7
!
ricavata nell'ipotesi Mpart. incid. >> meBethe - Bloch
Fisica Nucleare e Subnucleare II, A.A. 2007-2008 - Prof. A. Capone Lezioni 10-11 8
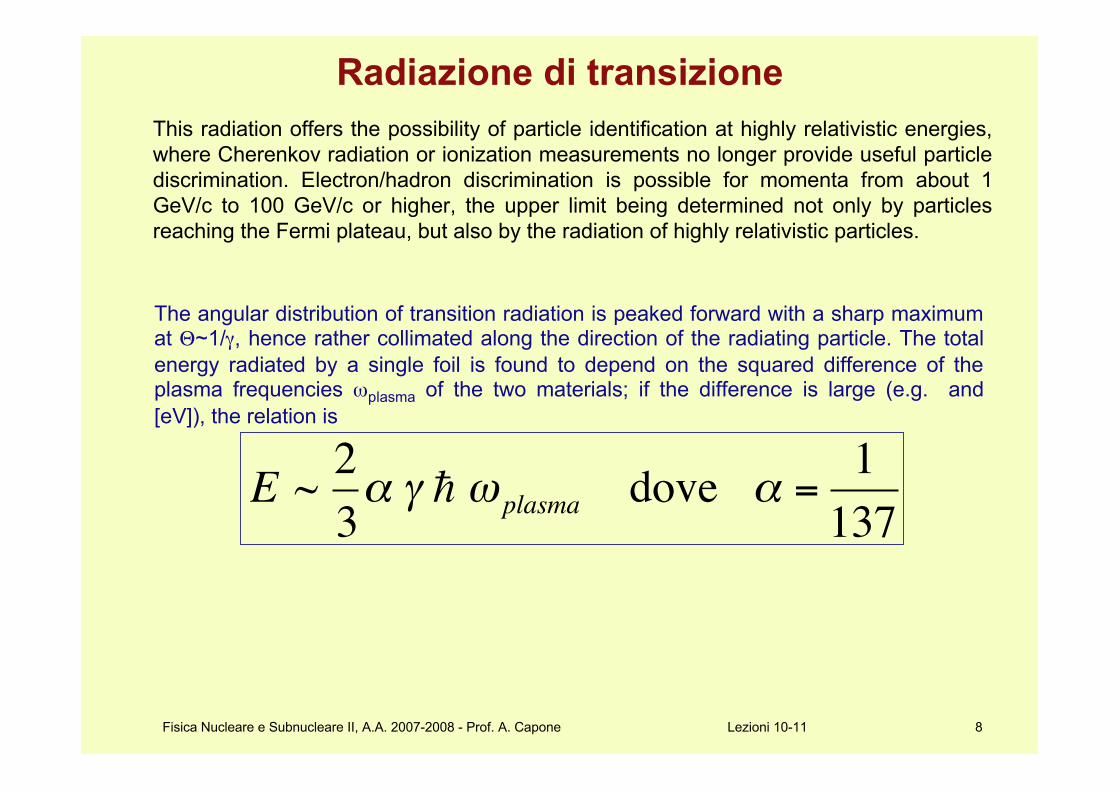
This radiation offers the possibility of particle identification at highly relativistic energies,
where Cherenkov radiation or ionization measurements no longer provide useful particle
discrimination. Electron/hadron discrimination is possible for momenta from about 1
GeV/c to 100 GeV/c or higher, the upper limit being determined not only by particles
reaching the Fermi plateau, but also by the radiation of highly relativistic particles.
Radiazione di transizione
The angular distribution of transition radiation is peaked forward with a sharp maximumat "~1/#, hence rather collimated along the direction of the radiating particle. The total
energy radiated by a single foil is found to depend on the squared difference of theplasma frequencies $plasma of the two materials; if the difference is large (e.g. and
[eV]), the relation is
!
E ~2
3" # h $ plasma dove " =
1
137

Fisica Nucleare e Subnucleare II, A.A. 2007-2008 - Prof. A. Capone Lezioni 10-11 9
Le camere a fili proporzionali, MWPCLe camere a fili o MWPC (MultiWire Proportional
Chamber), sono state inventate nel 1968 da
Charpak. Esse sono ottenute includendo nello
stesso volume gassoso più camere proporzionali,
costituite da una serie di fili sottili, che fungono
da anodo spaziati circa 2 mm l'uno dall'altro e
distanti circa 7-8 mm dalle pareti piane, che
costituiscono il catodo. La figura mostra un
accostamento di più camere a fili.

Fisica Nucleare e Subnucleare II, A.A. 2007-2008 - Prof. A. Capone Lezioni 10-11 10
HEAT: the T.O.F. systemThe HEAT Time-of-Flight system
The Time-of-Flight system consists of four paddles of plastic scintillator viewed by
eight photomultiplier tubes (built by the University of California at Berkeley), at the
top of the instrument, and three paddles of scintillator viewed by three
photomultiplier tubes (built by the University of California at Irvine), near the
bottom of the instrument. When a charged particle traverses a scintillator slab, a
small amount of light (proportional to the square of the charge of the particle
but inversely proportional to the square of its velocity) is generated; this light
is viewed by the photomultipler tubes and converted to electrical pulses, that
are then processed by assorted electronics module.
Particle velocity and direction of travel
The accurate times at which light is seen at the top and bottom are recorded,
and the time difference is used to calculate the velocity of the particle
(expressed in units of the speed of light). We are especially interested in
discriminating between particles traveling downwards through our instrument
and the so-called albedo particles traveling upwards (since an upgoing
negatively charged particle could fool us into thinking it was a positively
charged particle traveling downwards...). That we have achieved excellent
separation between upward and downward-going particles can be seen from figure
A below (where by definition positive velocities represent downgoing particles and
negative velocities upgoing).
Electric charge magnitude
An estimate of the magnitude of the electric charge of the particle is made from the
amount of light generated in the top scintillators (using the fact that the amount of
light is proportional to the square of the charge of the particle, so that a Helium
nucleus (charge 2) yields four times more light than a proton (charge 1)).
Figure B below illustrates our discrimination power between charge 1 and charge 2
particles. Note that charge 3 particles (nuclei of Lithium
atoms) are also present in the cosmic-ray flux, but they generate so much light that
they saturate our detector).

Fisica Nucleare e Subnucleare II, A.A. 2007-2008 - Prof. A. Capone Lezioni 10-11 11
HEAT: the magnetic spectrometer
The Magnetic Spectrometer consists of two parts:
A magnet consisting of two superconducting coils inside a cryogenic vessel filled with liquid
Helium, generating a magnetic field of 1 Tesla over a central room-temperature bore of dimensions
51 cm x 51 cm x 61 cm.
A precision tracking Drift-Tube Hodoscope, a chamber with 479 thin-walled drift tubes filled with
a CO2-hexane gas mixture, arrayed in 26 layers (18 aligned parallel with the magnetic field, 8
perpendicular), located inside the bore of the magnet.
When an electrically charged particle travels through the magnetic field permeating the hodoscope,
its trajectory is deflected due to the Lorentz force, in a direction perpendicular to the magnetic
field. As the particle travels through the gas inside the tubes, it deposits an electrical signal picked
up by a thin wire running down the center of the tube, and from the time at which the signal was
picked up in the various tubes, it can be determined to high accuracy (about
70 microns) how far from the wire the particle was traveling. We thus obtain a pattern of lined-up
"impact parameters" (distance of closest approach), as illustrated in the figure below (black circles
inside the gray tubes; the red tubes were rejected in this event although they had fired).
Momentum and charge sign determination
We fit a trajectory that is tangent to all the impact-parameter-circles, in each of the two views (the
bending view shown above, where the trajectory shown in sky blue is curved due to the magnetic
field, and the non-bending view (no trajectory deflection along the magnetic field lines), with 8
tubes used to fit a straight-line track. We combine the two views to obtain the particle's trajectory
in three dimensions. In particular, the track fitting algorithm determines the sign of the particle's
charge (depending on whether the particle was deflected to the right or to the left) and the rigidity
of the particle (momentum divided by charge), from which we calculate its momentum (using the
charge determined by the time-of-flight system).
Figure A showes the distribution of tracking residuals, illustrating the 70 microns resolution
achieved, and figure B the distribution of maximum-detectable-rigidities (MDR) obtained in
flight for electron candidates, where MDR is calculated on an event-by-event basis by combining
the field integral, path length through the spectrometer, number of tubes used in the rigidity fit and
average single point tracking error. The mean electron MDR of 170 GV provides good
performance for the measurement of electrons and positrons up to 50 GeV.
Rigidità = p c / Ze [GV]%[Gev/carica]

Fisica Nucleare e Subnucleare II, A.A. 2007-2008 - Prof. A. Capone Lezioni 10-11 12
HEAT - The electromagnetic calorimeterThe Electromagnetic Calorimeter (built by the University of California at Irvine) consists of ten plastic scintillator slabs viewed by one
photomultiplier tube each, interspersed with ten layers of Lead (each of a thickness equivalent to 0.9 electron radiation length), located at
the bottom of the instrument. When an electron or a hadron reaches the Lead layers, a shower of secondary particles is produced and
propagates through the rest of the stack (most of the secondary particles themselves produce further showering in deeper Lead layers),
until the energy of the parent particle is expended and the particle shower is eventually absorbed. When charged particles traverse the
scintillator slabs, light is generated and detected by the photomultipler tubes (and then converted to electrical pulses, processed by
assorted electronics module), in amounts proportional to the number of particles in the scintillator.
Shower shape discrimination
By measuring the number of particles in the shower at each scintillator layer in the stack (the so-called shower profile), we can
distinguish between showers initiated by electrons or positrons from those initiated by hadrons (such as protons or alpha particles),
since they result in quite different profiles. This is illustrated in figure A below, where the profile (number of shower particles as a
function of depth in the electromagnetic calorimeter) is plotted for electron and proton-induced showers. Given a certain profile in an
event, an assumption is made that the shower was electron or positron-induced, the corresponding energy is calculated (see below), and a
goodness-of-agreement-with-this-assumption parameter (so called chi-squared) is obtained. Figure B below shows the distribution of this
parameter, where clear populations due to electrons and protons are seen.
Energy calculation
For an electron-induced shower, the profile shape is well correlated with the energy of the parent primary, so that an estimate of the
energy is readily obtainable from the profile. The figure below illustrates the energy resolution of about 10% obtained for 10 GeV
electron showers (as calculated with computer models).
Fisica Nucleare e Subnucleare II, A.A. 2007-2008 - Prof. A. Capone Lezioni 10-11 13
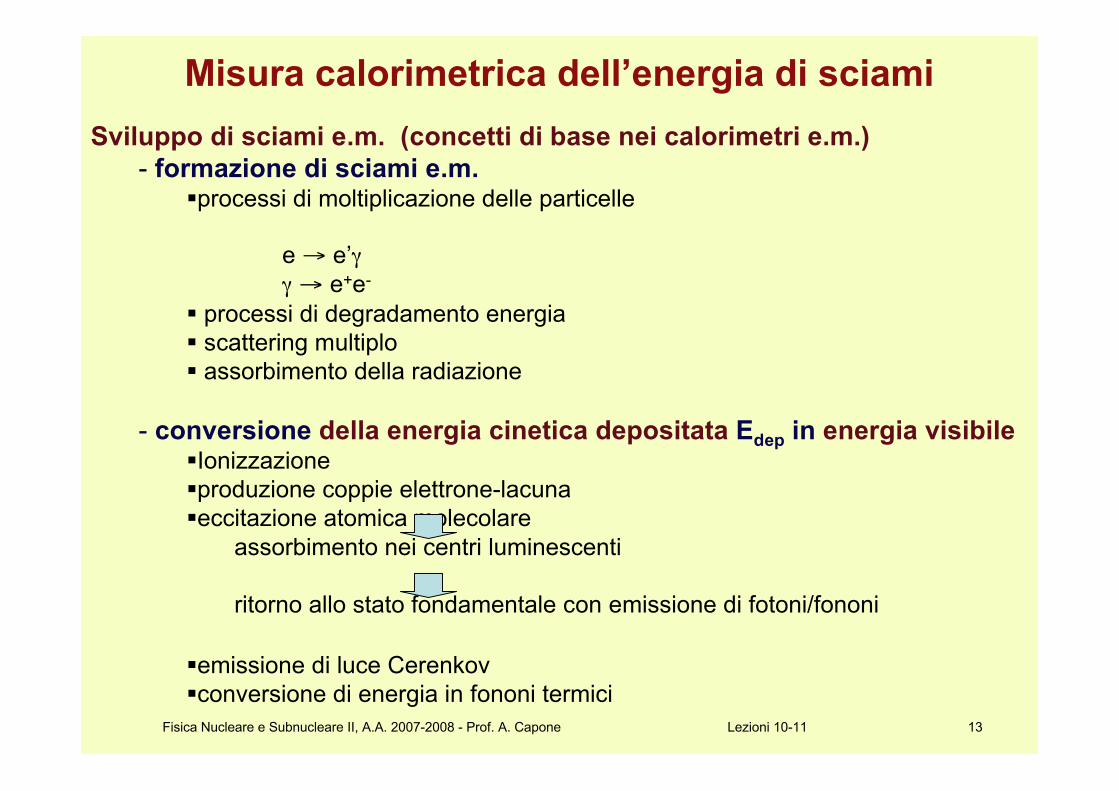
Sviluppo di sciami e.m. (concetti di base nei calorimetri e.m.)
- formazione di sciami e.m.!processi di moltiplicazione delle particelle
e & e’#
# & e+e-
! processi di degradamento energia
! scattering multiplo
! assorbimento della radiazione
- conversione della energia cinetica depositata Edep in energia visibile!Ionizzazione
!produzione coppie elettrone-lacuna
!eccitazione atomica molecolare
assorbimento nei centri luminescenti
ritorno allo stato fondamentale con emissione di fotoni/fononi
!emissione di luce Cerenkov
!conversione di energia in fononi termici
Misura calorimetrica dell’energia di sciami

Fisica Nucleare e Subnucleare II, A.A. 2007-2008 - Prof. A. Capone Lezioni 10-11 14
Sciami elettromagnetici: lunghezza di radiazione, energia critica, sezioni d’urto, …

Fisica Nucleare e Subnucleare II, A.A. 2007-2008 - Prof. A. Capone Lezioni 10-11 15
10 eV 1 keV 1 MeV 1 GeV 100 GeV
Photon Energy
Sezione d’urto totale per fotoni in Carbonio e Piombo in funzione dell’energia
dei fotoni.Si mostrano i contributi dei diversi processi:
Sezione d’urto totale per fotoni
Fisica Nucleare e Subnucleare II, A.A. 2007-2008 - Prof. A. Capone Lezioni 10-11 16
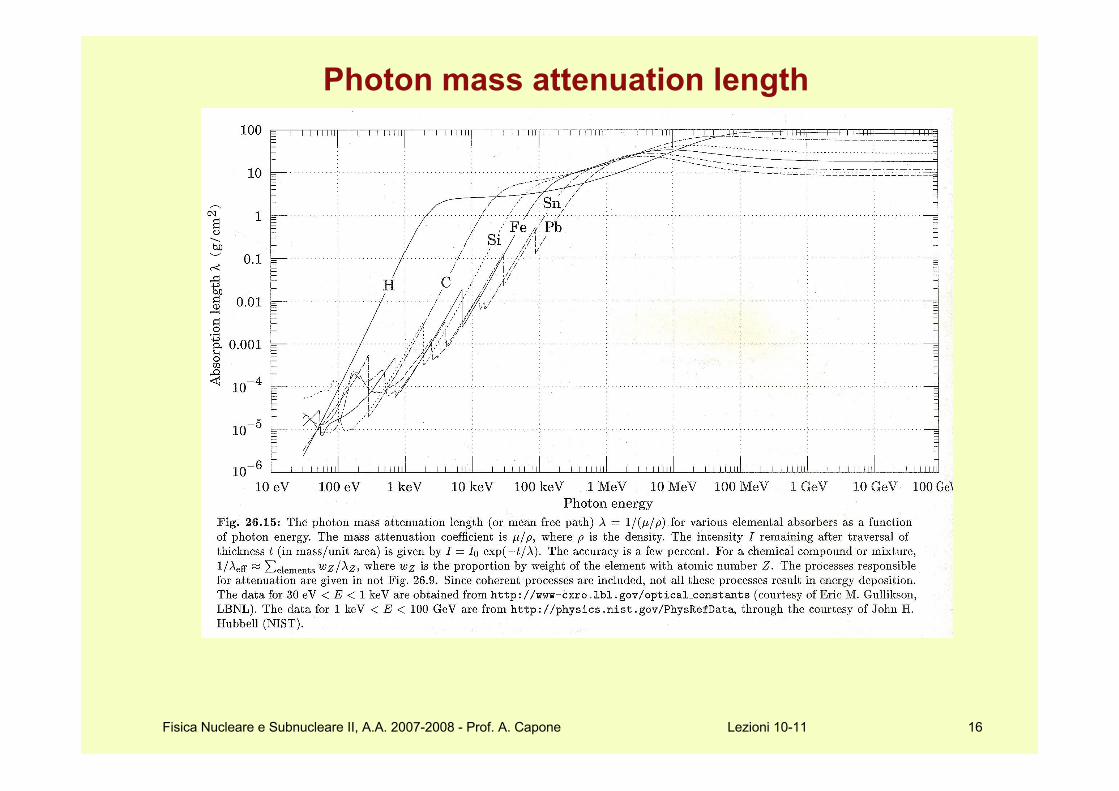
Photon mass attenuation length

Fisica Nucleare e Subnucleare II, A.A. 2007-2008 - Prof. A. Capone Lezioni 10-11 17
Elettroni-positroni “Fractional energy loss”
Simulazione di uno sciame elettromagnetico
Fisica Nucleare e Subnucleare II, A.A. 2007-2008 - Prof. A. Capone Lezioni 10-11 18
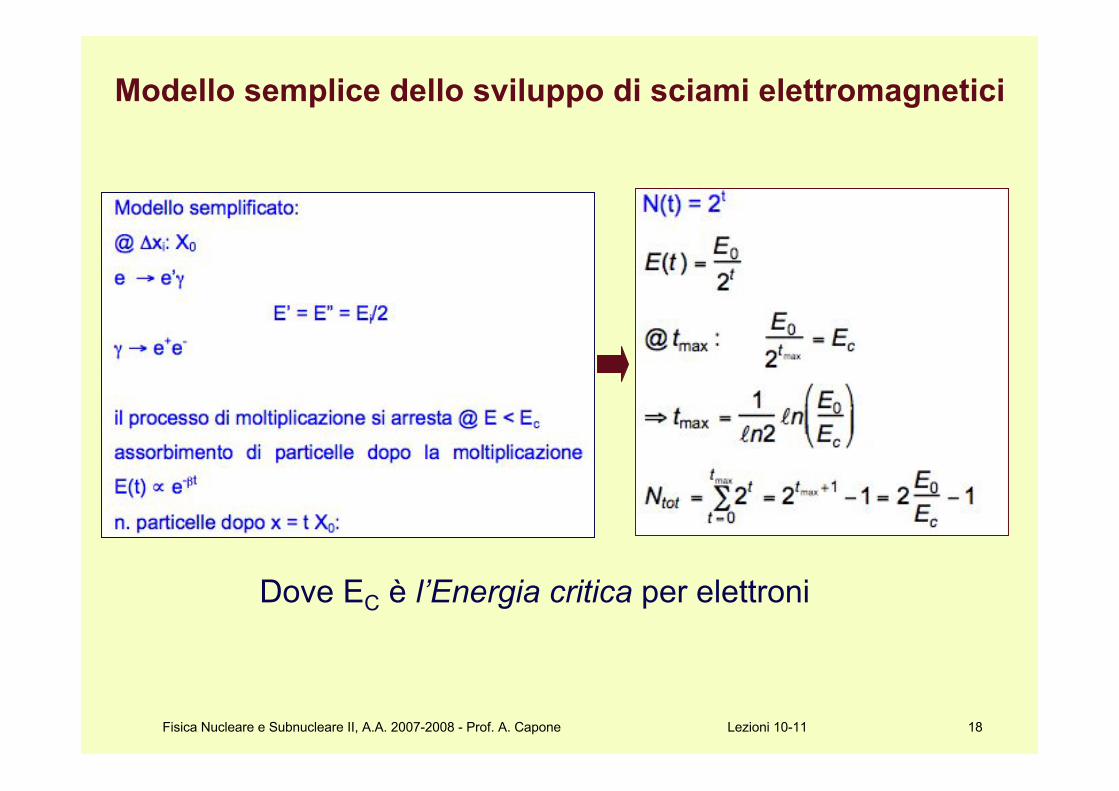
Modello semplice dello sviluppo di sciami elettromagnetici
Dove EC è l’Energia critica per elettroni

Fisica Nucleare e Subnucleare II, A.A. 2007-2008 - Prof. A. Capone Lezioni 10-11 19
Energia Critica per elettroni

Fisica Nucleare e Subnucleare II, A.A. 2007-2008 - Prof. A. Capone Lezioni 10-11 20
Caratteristiche degli sciami e.m.
Fisica Nucleare e Subnucleare II, A.A. 2007-2008 - Prof. A. Capone Lezioni 10-11 21
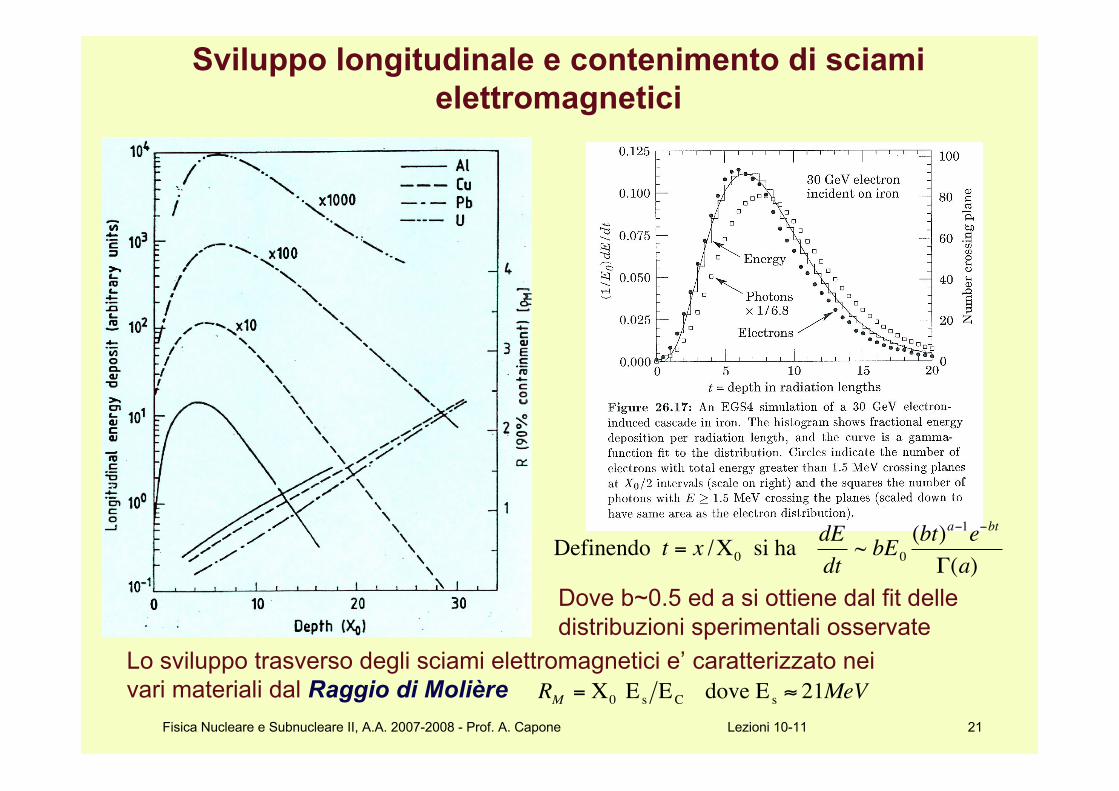
Sviluppo longitudinale e contenimento di sciami
elettromagnetici
!
Definendo t = x /"0 si ha dE
dt~ bE0
(bt)a#1e#bt
$(a)
Dove b~0.5 ed a si ottiene dal fit delle
distribuzioni sperimentali osservate
Lo sviluppo trasverso degli sciami elettromagnetici e’ caratterizzato nei
vari materiali dal Raggio di Molière
!
RM
= "0 E
sE
C dove E
s# 21MeV
Fisica Nucleare e Subnucleare II, A.A. 2007-2008 - Prof. A. Capone Lezioni 10-11 22
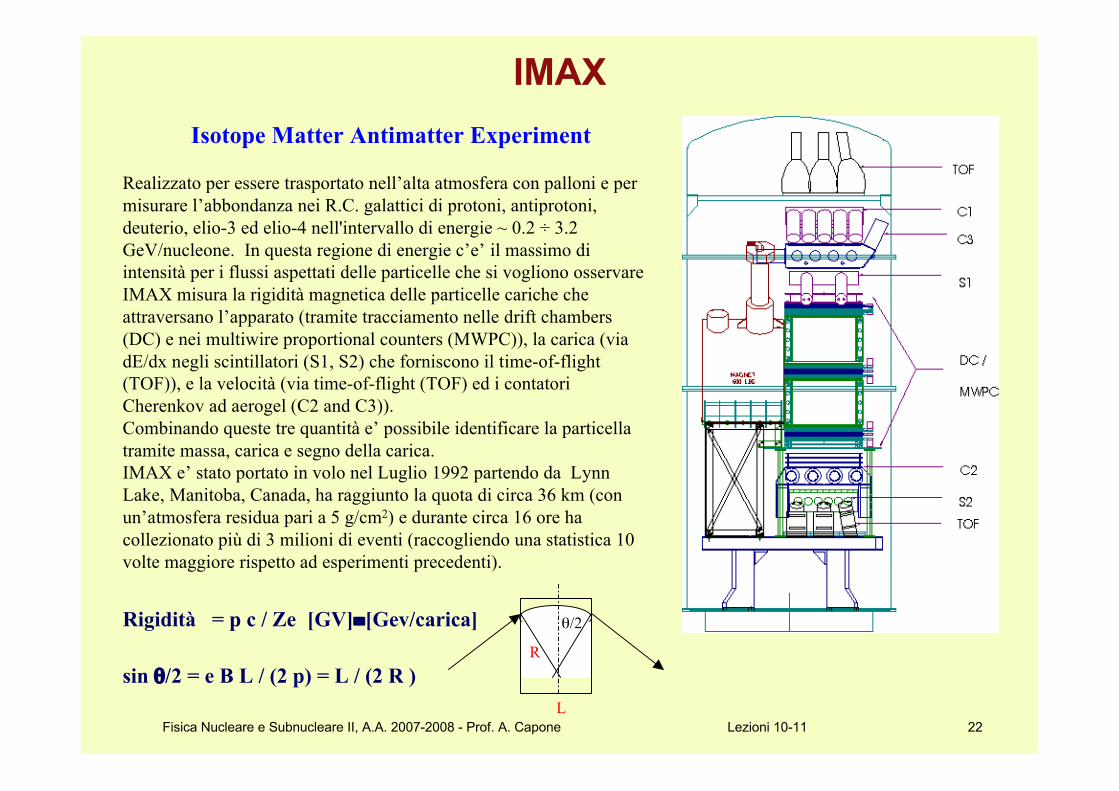
IMAX
Isotope Matter Antimatter Experiment
Realizzato per essere trasportato nell’alta atmosfera con palloni e per
misurare l’abbondanza nei R.C. galattici di protoni, antiprotoni,
deuterio, elio-3 ed elio-4 nell'intervallo di energie ~ 0.2 ÷ 3.2
GeV/nucleone. In questa regione di energie c’e’ il massimo di
intensità per i flussi aspettati delle particelle che si vogliono osservare
IMAX misura la rigidità magnetica delle particelle cariche che
attraversano l’apparato (tramite tracciamento nelle drift chambers
(DC) e nei multiwire proportional counters (MWPC)), la carica (via
dE/dx negli scintillatori (S1, S2) che forniscono il time-of-flight
(TOF)), e la velocità (via time-of-flight (TOF) ed i contatori
Cherenkov ad aerogel (C2 and C3)).
Combinando queste tre quantità e’ possibile identificare la particella
tramite massa, carica e segno della carica.
IMAX e’ stato portato in volo nel Luglio 1992 partendo da Lynn
Lake, Manitoba, Canada, ha raggiunto la quota di circa 36 km (con
un’atmosfera residua pari a 5 g/cm2) e durante circa 16 ore ha
collezionato più di 3 milioni di eventi (raccogliendo una statistica 10
volte maggiore rispetto ad esperimenti precedenti).
Rigidità = p c / Ze [GV]%[Gev/carica]
sin '/2 = e B L / (2 p) = L / (2 R )
'/2
L
R

Fisica Nucleare e Subnucleare II, A.A. 2007-2008 - Prof. A. Capone Lezioni 10-11 23
IMAX - La fase di lancio
FLIGHT
16-17 July 16-17, 1992, Lynn Lake, Manitoba, Canada. Float was reached about 7 hours after launch.
The instrument took data throughout ascent, recording about 1.4x10⁶ events. These data will be used to
determine altitude-dependent particle spectra. At the end of the float period, the magnet was ramped
down and data was taken with the magnet off in order to check the alignment of the tracking chambers.
Landing was near Peace River, Alberta, Canada, with the instrument being recovered in excellent
condition. All payload and detector systems appear to have performed well throughout the flight. Over
3.4x10⁶ events were recorded during the float period.

Fisica Nucleare e Subnucleare II, A.A. 2007-2008 - Prof. A. Capone Lezioni 10-11 24
IMAX - flusso di antiprotoni

Fisica Nucleare e Subnucleare II, A.A. 2007-2008 - Prof. A. Capone Lezioni 10-11 25
BESS - Baloon Superconducting Solenoid Experiment
Primary scientific objectives of the experiment arethe measurements of the cosmic antiproton energyspectrum, very sensitive search for antihelium,and the precision measurements of various cosmicray components.
The BESS detector has a unique cylindricalconfiguration with a large acceptance of 0.4,which is one order of magnitude larger than thatof previous spectrometers.

Fisica Nucleare e Subnucleare II, A.A. 2007-2008 - Prof. A. Capone Lezioni 10-11 26
BESS
Forty low energy cosmic antiprotonswere clearly detected for the first time bythe BESS detector. Measurement ofantiproton below 1 GeV can placerestrictions on several novel antiprotonproduction mechanisms such as theannihilation of neutralino dark matterand the evaporation of primordial blackholes.
Antihelium
BESS experiment already has placed anupper limit on antihelium to helium ratioof 2! 10-6, which is a factor improvementover previous experim-ents ,which is afactor of 50 improvement over previousexperiments.
Fisica Nucleare e Subnucleare II, A.A. 2007-2008 - Prof. A. Capone Lezioni 10-11 27
CAPRICE

Fisica Nucleare e Subnucleare II, A.A. 2007-2008 - Prof. A. Capone Lezioni 10-11 28
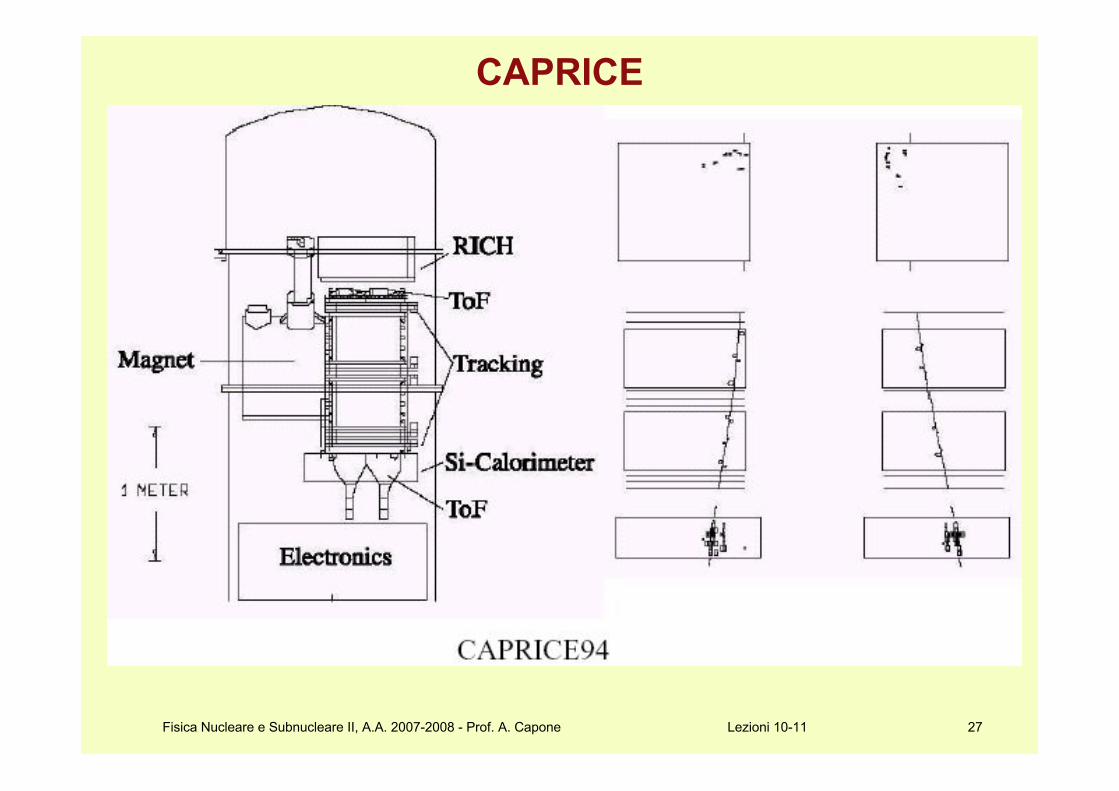
CAPRICE
COSMIC ANTIPARTICLE RING IMAGING CHERENKOV EXPERIMENT
Flew for the first time in a NASA balloon at 38 km altitude for 27 hours in August 1994(CAPRICE94). Collected > 6 millions cosmic ray particles. The aim of the experiment is to measurethe flux of antiparticles (antiprotons and positrons) in the cosmic radiation.
Besides the RICH detector the spectrometer includes a super-conducting magnet with a tracking detector system ofdrift chamber and multiproportional chambers, a time-of-flight system and a Si-W imaging calorimeter.
The CAPRICE97 experiment was successfully launched on the morning of 24 May 1997. All instruments workedwell and muon data were acquired during the three hour long ascent to a float altitude of 36 km. The flight had tobe terminated after four hours due to pressure problems.
CAPRICE98 was launched by balloon from Fort Sumner, New Mexico, on 1998 May 2. It floated at anatmospheric depth of about 5.5g/cm-2 for a period of 21 hr at a mean vertical cutoff rigidity of about 4.5 GV.
More than 5 million triggers were collected at a float altitude.
A total of 31 antiprotons were identified with small backgrounds from other particles.
The absolute antiproton energy spectrum was determined in the energy region at the top of the atmospherebetween 3.2 and 49.1 GeV. It was found that the observed antiproton spectrum and the antiproton to protonratio are consistent with a pure secondary origin. However, a primary component cannot be excluded.
The kinetic energy of 43 GeV for the antiproton flux is the highest ever reached. CAPRICE is one of the flightsperformed by the WiZard collaboration with members from France, Germany, Italy, Sweden and USA.
Fisica Nucleare e Subnucleare II, A.A. 2007-2008 - Prof. A. Capone Lezioni 10-11 29
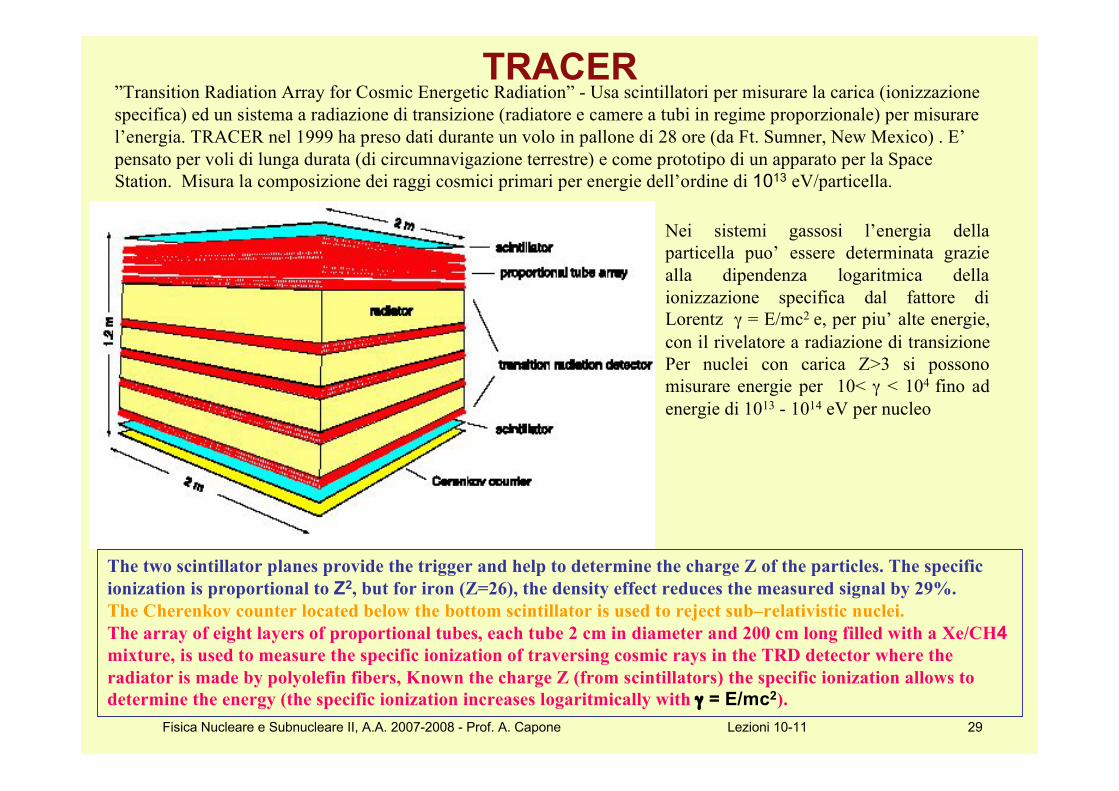
TRACER”Transition Radiation Array for Cosmic Energetic Radiation” - Usa scintillatori per misurare la carica (ionizzazione
specifica) ed un sistema a radiazione di transizione (radiatore e camere a tubi in regime proporzionale) per misurare
l’energia. TRACER nel 1999 ha preso dati durante un volo in pallone di 28 ore (da Ft. Sumner, New Mexico) . E’
pensato per voli di lunga durata (di circumnavigazione terrestre) e come prototipo di un apparato per la Space
Station. Misura la composizione dei raggi cosmici primari per energie dell’ordine di 1013 eV/particella.
Nei sistemi gassosi l’energia della
particella puo’ essere determinata grazie
alla dipendenza logaritmica della
ionizzazione specifica dal fattore di
Lorentz # = E/mc2 e, per piu’ alte energie,
con il rivelatore a radiazione di transizione
Per nuclei con carica Z>3 si possono
misurare energie per 10< # < 104 fino ad
energie di 1013 - 1014 eV per nucleo
The two scintillator planes provide the trigger and help to determine the charge Z of the particles. The specific
ionization is proportional to Z2, but for iron (Z=26), the density effect reduces the measured signal by 29%.
The Cherenkov counter located below the bottom scintillator is used to reject sub–relativistic nuclei.
The array of eight layers of proportional tubes, each tube 2 cm in diameter and 200 cm long filled with a Xe/CH4
mixture, is used to measure the specific ionization of traversing cosmic rays in the TRD detector where the
radiator is made by polyolefin fibers, Known the charge Z (from scintillators) the specific ionization allows to
determine the energy (the specific ionization increases logaritmically with # = E/mc2).

Fisica Nucleare e Subnucleare II, A.A. 2007-2008 - Prof. A. Capone Lezioni 10-11 30
TRACER - results
Measured charge distribution for
relativistic cosmic–ray nuclei.
The instrument floated at an altitude corresponding to 4 to 6 g/cm2 of residual atmosphere for a
duration of 28 hours, and was safely recovered by parachute.
The average geomagnetic cutoff rigidity was 4.5 GV.

Fisica Nucleare e Subnucleare II, A.A. 2007-2008 - Prof. A. Capone Lezioni 10-11 31
Rapporto protone/antiprotone, risultati delle misure
The antiproton flux at the top of the atmosphere. Solid
lines, upper an lower limit of the calculation: Simon,
]Molnar & Roesler (1998), dashed line: L.Bergstroem &
P. Ullio (private communication), dotted line: primary
antiproton flux given by annihilation from neutralino
from MSSM with a mass of 964 GeV; Ullio (1999)
The antiproton/proton ratio at the top of the
atmosphere. The lines are calculations of interstellar
antiprotons assuming a pure secondary production
during the propagation of cosmic rays in the galaxy.
Solid lines, upper an lower limit of the calculation:
Simon, Molnar & Roesler (1998), dashed line:
L.Bergstroem & P. Ullio (private communication)

Fisica Nucleare e Subnucleare II, A.A. 2007-2008 - Prof. A. Capone Lezioni 10-11 32
Misure effettuate per
70 MeV/A <E< 2000MeV/A
Abbondanza degli elementi che compongono i
raggi cosmici dall’He al Ni, espressa relativa
al Si, confrontata all’abbondanza relativa per
i pianeti del sistema solare.
Nei raggi cosmici elementi pesanti (Z>1) sono in percentuale
relativa maggiore, rispetto ai protoni, di quanto lo siano nel
sistema solare:
-nei raggi cosmici (rispetto alla materia presente nei corpi
del sistema solare) la percentuale di protoni e’ ridotta
dalla maggiore difficoltà di ionizzazione (dell'H rispetto
a nuclei più pesanti)
- gli elementi: Li, Be, B, Sc, V, Cr, Mn
sono molto più abbondanti rispetto alla materia del
sistema solare. Tali elementi sarebbero praticamente
assenti nella fase finale del processo di nucleosintesi
stellare. Nei raggi cosmici sono presenti in quanto
risultati delle reazioni nucleari dell’ossigeno (Li, Be, B) e
del ferro contenuti nei raggi cosmici (Sc, V, Cr, Mn) e la
materia interstellare (ISM). Ciò comporta un’ipotesi sul
tempo di permanenza dei raggi cosmici nella galassia:
- per spiegare la presenza di tali nuclei i raggi
cosmici devono attraversare una quantità di
materia pari a X = 5-10g/cm2
- la densità nel disco della galassia e’ pari a
(p ~1 protone/cm3 =1.67 ·10-24 g/cm3
- lo spessore del materiale attraversato corrisponde
quindi a X / (mp· (p) = 3 ·1024 cm ~ 1000kpc
1pc=1AU/1(secondo di grado)=1.5 ·1013/4.85 ·10-6
1pc=3.1 ·1018cm = 3.26 Ly
- i raggi cosmici rimangono “intrappolati” nella
galassia per )10 milioni di anni
Raggi cosmici primari
di “bassa energia”
ECR ~ 70-280 MeV/A
Risultati relativi allo studio della composizione dei raggi cosmici primari

Fisica Nucleare e Subnucleare II, A.A. 2007-2008 - Prof. A. Capone Lezioni 10-11 33
Caratteristiche di alcuni esperimenti su pallone