financial sector assessment program stress testing the banking sector—technical … ·...
TRANSCRIPT

© 2015 International Monetary Fund
IMF Country Report No. 15/7
GEORGIA FINANCIAL SECTOR ASSESSMENT PROGRAM STRESS TESTING THE BANKING SECTOR—TECHNICAL NOTE This Technical Note on Stress Testing the Banking Sector on Georgia was prepared by a staff team of the International Monetary Fund as background documentation for the periodic consultation with the member country. It is based on the information available at the time it was completed in October 2014.
Copies of this report are available to the public from
International Monetary Fund Publication Services 700 19th Street, N.W. Washington, D.C. 20431
Telephone: (202) 623-7430 Telefax: (202) 623-7201 E-mail: [email protected] Internet: http://www.imf.org
Price: $18.00 a copy
International Monetary Fund
Washington, D.C.
January 2015

GEORGIA FINANCIAL SECTOR ASSESSMENT PROGRAM
TECHNICAL NOTE STRESS TESTING THE BANKING SECTOR
Prepared By Monetary and Capital Markets Department
This Technical Note was prepared in the context of a joint IMF-World Bank Financial Sector Assessment Program (FSAP) mission in Georgia during May 2014 led by Elias Kazarian, IMF and Aurora Ferrari, World Bank, and overseen by the Monetary and Capital Markets Department, IMF, and the Finance and Private Sector Development Vice Presidency, World Bank. The note contains the technical analysis and detailed information underpinning the FSAP assessment’s findings and recommendations. Further information on the FSAP program can be found at http://www.imf.org/external/np/fsap/fssa.aspx.
October 2014

GEORGIA
2 INTERNATIONAL MONETARY FUND
CONTENTS
GLOSSARY _________________________________________________________________________________________ 4
EXECUTIVE SUMMARY ___________________________________________________________________________ 5
INTRODUCTION AND OVERVIEW _______________________________________________________________ 8
A. Background _____________________________________________________________________________________ 8
B. Key Risks to the Banking Sector _______________________________________________________________ 11
C. Overview of Stress Tests _______________________________________________________________________ 12
D. Scenarios ______________________________________________________________________________________ 14
SOLVENCY STRESS TESTS ______________________________________________________________________ 20
A. Bottom-up Stress Test _________________________________________________________________________ 21
B. FSAP Top-Down Stress Test ___________________________________________________________________ 23
C. NBG Top-Down Stress Tests ___________________________________________________________________ 29
D. Reconciliation of Results ______________________________________________________________________ 31
E. Recommendations _____________________________________________________________________________ 32
INDIVIDUAL LIQUIDITY AND NETWORK STRESS TESTS _____________________________________ 34
A. Models ________________________________________________________________________________________ 34
B. Results _________________________________________________________________________________________ 35
C. Interbank Contagion (Systemic) Risk __________________________________________________________ 36
D. Recommendations ____________________________________________________________________________ 37
BOX
1. Cross-Checking Shocks to Nonperforming Loans _____________________________________________ 16
FIGURES
1. Structure of Assets ______________________________________________________________________________ 9
2. Structure of Liabilities ___________________________________________________________________________ 9
3. Income Structure ________________________________________________________________________________ 9
4. Breakdown of Profit and Losses _________________________________________________________________ 9
5. Risk Transmission Channels ___________________________________________________________________ 11
6. Share of Nonresident Deposits ________________________________________________________________ 12
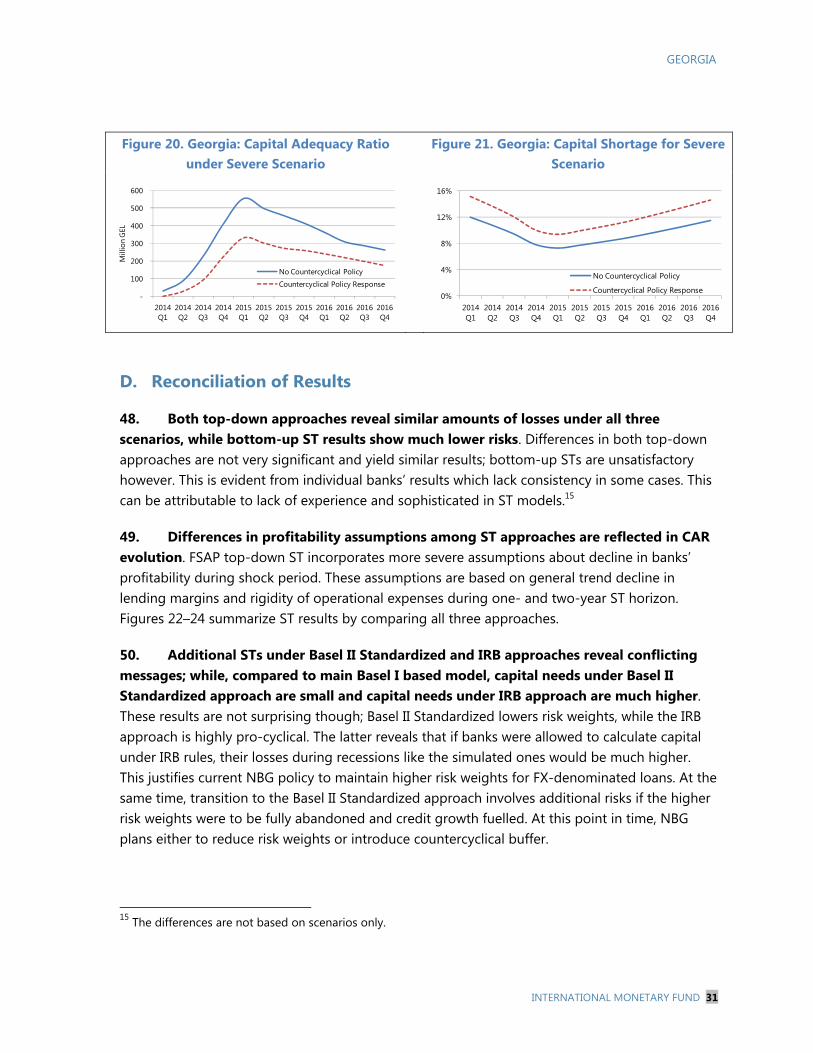
7. Key Structural Components of FSAP Stress Test Exercise ______________________________________ 13
8. Historical USD/GEL Rate _______________________________________________________________________ 15

GEORGIA
INTERNATIONAL MONETARY FUND 3
9. Forecasted Level of NPL Ratios _______________________________________________________________ 16
10. Georgia: Shocks in 2007–2009 _______________________________________________________________ 17
11. Developments of Profitability ________________________________________________________________ 17
12. Deposit Withdrawal in 2008–09 ______________________________________________________________ 18
13. Market Risk Exposures to Capital _____________________________________________________________ 23
14. Tier I CAR under Basel II Alternative Stress Testing: STD Approach __________________________ 28
15. Tier 1 CAR ____________________________________________________________________________________ 29
16. Recapitalization Needs _______________________________________________________________________ 29
17. Tier 1 CAR ____________________________________________________________________________________ 29
18. Recapitalization Needs _______________________________________________________________________ 29
19. Countercyclical Buffer ________________________________________________________________________ 30
20. Capital Adequacy Ratio under Severe Scenario ______________________________________________ 31
21. Capital Shortage for Severe Scenario ________________________________________________________ 31
22. ST Results: CAR under Baseline Scenario _____________________________________________________ 32
23. ST Results: CAR under Mild Recession Scenarios _____________________________________________ 32
24. ST Results: CAR under Adverse Recession Scenarios _________________________________________ 32
25. Liquidity Coverage Ratio (LCR): Before and After Stress ______________________________________ 36
26. Interbank Market Network ___________________________________________________________________ 37
TABLES
1. Recommendations _______________________________________________________________________________ 7
2. Financial Soundness Indicators, 2010–13 ______________________________________________________ 10
3. Introduction of Basel II/III Minimum Capital Adequacy Ratio__________________________________ 13
4. Scenario-based Solvency Stress Tests _________________________________________________________ 15
5. Summary of Assumptions for Liquidity Stress Tests ___________________________________________ 19
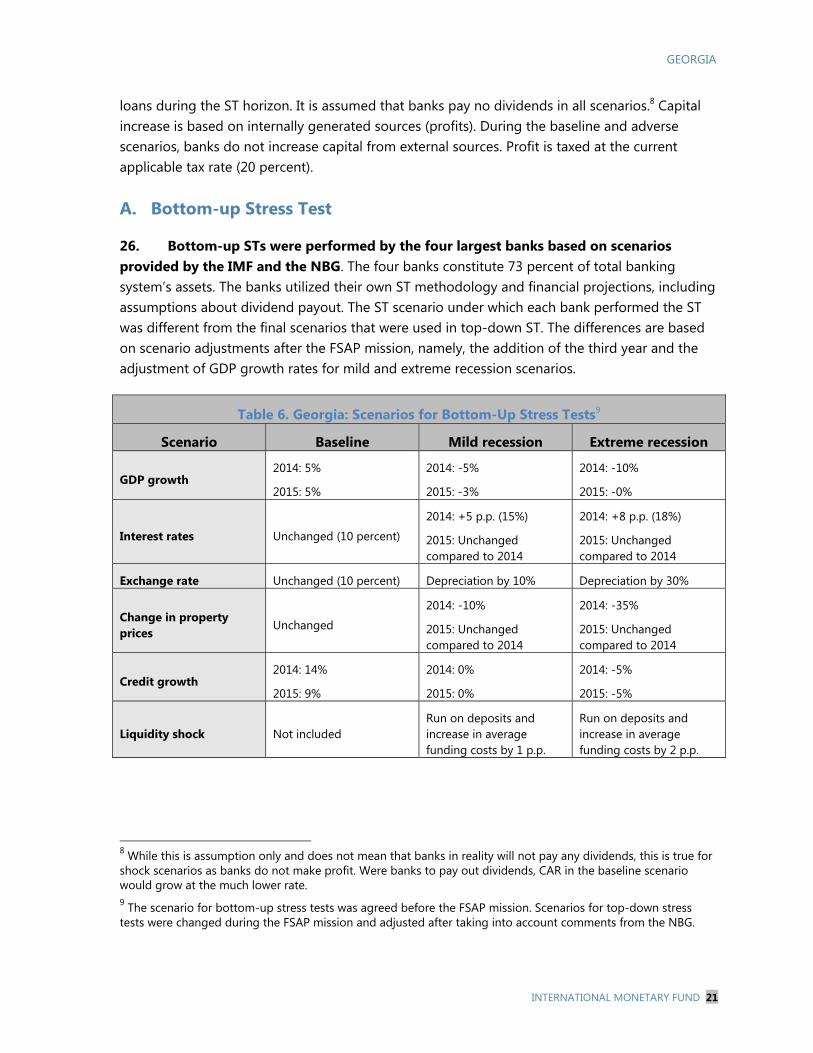
6. Scenarios for Bottom-Up Stress Tests _________________________________________________________ 21
7. Liquidity Stress Test Results ___________________________________________________________________ 35 APPENDIXES
I. Statistical Annex ________________________________________________________________________________ 39
II. Stress Test Matrix: Solvency and Liquidity Risks and Network Effects _________________________ 46
III. Top-Down Satellite Model for Credit Risk: IMF Approach ____________________________________ 50
IV. Top-Down Satellite Model for Credit Risk: NBG Approach ___________________________________ 58
V. Risk Assessment Matrix _______________________________________________________________________ 59
REFERENCES _____________________________________________________________________________________ 61
GEORGIA
4 INTERNATIONAL MONETARY FUND
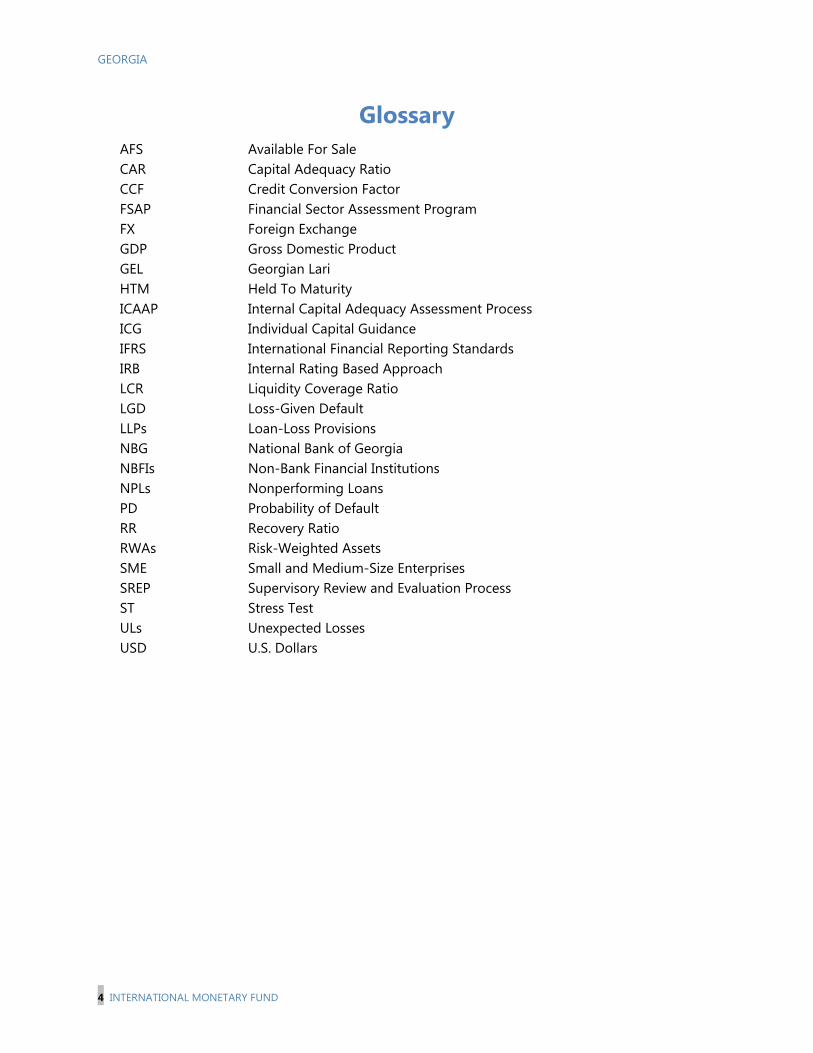
Glossary AFS Available For Sale CAR Capital Adequacy Ratio CCF Credit Conversion Factor FSAP Financial Sector Assessment Program FX GDP
Foreign Exchange Gross Domestic Product
GEL Georgian Lari HTM Held To Maturity ICAAP Internal Capital Adequacy Assessment Process ICG Individual Capital Guidance IFRS International Financial Reporting Standards IRB Internal Rating Based Approach LCR Liquidity Coverage Ratio LGD Loss-Given Default LLPs Loan-Loss Provisions NBG National Bank of Georgia NBFIs Non-Bank Financial Institutions NPLs Nonperforming Loans PD Probability of Default RR Recovery Ratio RWAs Risk-Weighted Assets SME Small and Medium-Size Enterprises SREP Supervisory Review and Evaluation Process ST Stress Test ULs USD
Unexpected Losses U.S. Dollars

GEORGIA
INTERNATIONAL MONETARY FUND 5
EXECUTIVE SUMMARY The Georgian banking sector is sound and stable and has continued to perform well, but faces a number of key risks and vulnerabilities that need to be closely monitored. Particularly challenging among them are credit and funding risks related to dollarization, concentration in the banking sector, and reliance on nonresident deposits. While NPLs are gradually declining from their peak in 2009, credit growth is above its long-term sustainable trend.
Dollarization presents specific challenges as it increases credit and liquidity risks. There are two major dollarization-related problems: First, most of the borrowers in U.S. dollars (USD) are unhedged, as their income and expenditures are in national currency (this is especially evident in case of households). Second, the NBG has limited ability to provide liquidity support in USD and other foreign currencies. However, it should be noted that the NBG is implementing a set of macroprudential measures aimed at making FX lending more expensive for banks. For example, current risk weights for FX loans are topped at 175 percent.
Separate stress tests (STs) performed by the NBG and by the FSAP mission show that the banking system as a whole is able to withstand severe shocks, given that most banks maintain healthy capital buffers well above regulatory minimum. The tests were conducted in several scenarios ranging from slow growth to severe macroeconomic shocks, and the results show that major banks would generally remain adequately capitalized, taking into account current profits and introduction of Basel II. In adverse scenarios, recapitalization needs are manageable in terms of GDP (1.6 percent for the worst-case scenario). At the same time, uncertainty due to non-linearity of shocks related to lari depreciation warrant continuation of build-up of capital buffers as long as FX denominated loans constitute substantial share of banks’ loan portfolios. Credit portfolio concentration risks are limited: default by the largest three borrowers would require additional capital of GEL 50 million for five banks. Market risks are very limited, and trading books do not exist.
However, some banks are particularly vulnerable and need to strengthen their capital buffers and to mitigate funding risks. These banks exceed the minimum capital requirement by only a few percentage points (p.p.), which limits their loss-absorption capacity. The high level of profitability and solid net interest margins would go down during crisis periods, driving down net interest and other income. To avoid this pitfall, it is important to introduce Individual Capital Guidance, especially for the weakest banks. When it comes to funding risks, further diversification of funding sources and de-dollarization could help to minimize identified vulnerabilities.
Strong profitability of the banking sector and high level of reserves are key factors that mitigate potential losses if crisis scenarios were to materialize. Furthermore, loan-loss provisions (LLPs) cover around 90 percent of NPLs, which is much higher than the international average of 60 percent. The crisis in 2008–09 highlighted the need to prepare contingency plans to deal with liquidity and solvency problems of individual banks and the whole system. It also justified the use of macroprudential tools to mitigate potential risks, especially those related to

GEORGIA
6 INTERNATIONAL MONETARY FUND
FX funding and lending. If a crisis were to materialize, the NBG would have the option to lower capital requirements to maintain countercyclical policy.
To mitigate systemic funding risks is a challenge given the current level of dollarization. Domestic banks without access to parent support might experience higher liquidity needs, especially in USD. The NBG’s ability to provide liquidity in USD would be difficult, taking into account the level of foreign reserves. It is also important that current regulatory requirements (Basel I) and higher risk weights to FX loans create additional buffers and help mitigate credit-flow-related risks (data shows that Georgia is on a slow de-dollarization trend) and balance sheet related imbalances (FX loans and deposits).
ST conducted during the FSAP mission is subject to data limitations as well as modeling challenges of FX related risks. During the period since independence in 1991, Georgia experienced multiple events that led to structural changes in the economy and its banking system. Models developed by the NBG and the FSAP team use data covering at least one business cycle and a crisis in 2008–09. Recovery from the banking crisis in 2008–09 is still not complete; hence, the length of the potential recovery period is still uncertain. A short time series limits the robustness of econometric models used to forecast losses for three years ahead, i.e., it is assumed that the forecasted period is much shorter than the time series of data used to estimate models. An additional level of modeling uncertainty is related to dollarization. Currency shocks are usually high in their magnitude (initial overshooting) and non-linear in their nature. Hence, the actual deterioration of loan portfolio quality after a shock could be higher than forecasted.
GEORGIA
INTERNATIONAL MONETARY FUND 7
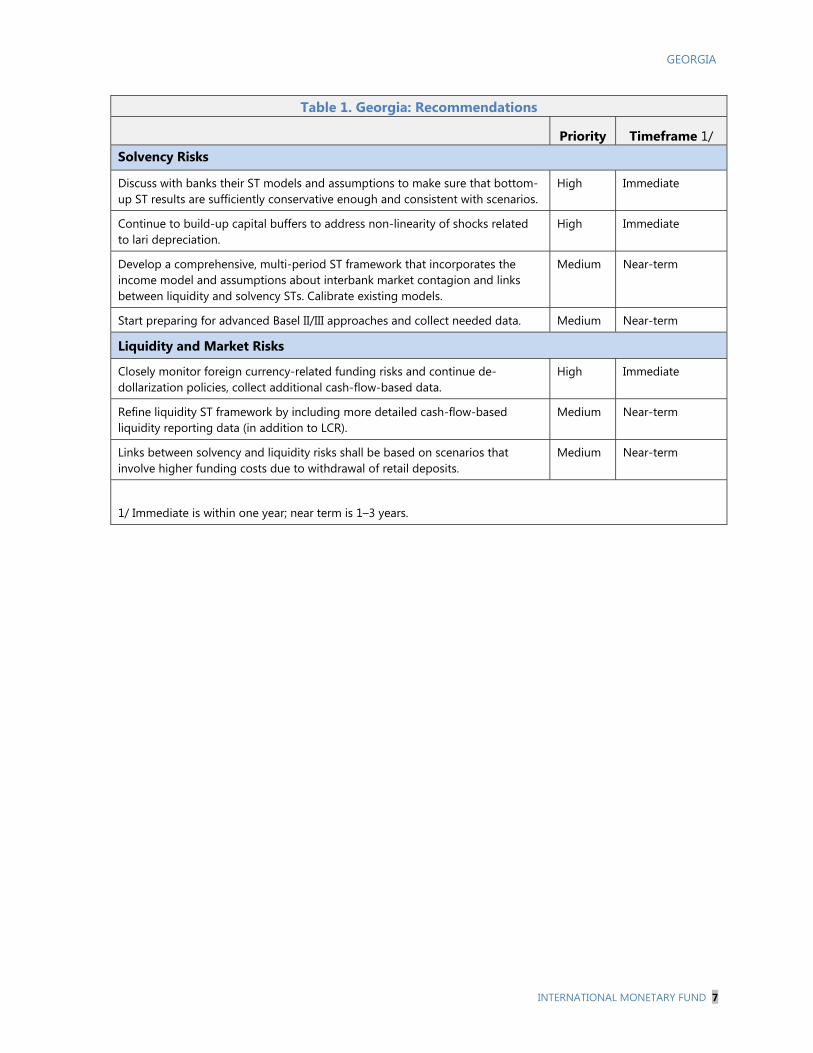
Table 1. Georgia: Recommendations
Priority Timeframe 1/ Solvency Risks
Discuss with banks their ST models and assumptions to make sure that bottom-up ST results are sufficiently conservative enough and consistent with scenarios.
High Immediate
Continue to build-up capital buffers to address non-linearity of shocks related to lari depreciation.
High Immediate
Develop a comprehensive, multi-period ST framework that incorporates the income model and assumptions about interbank market contagion and links between liquidity and solvency STs. Calibrate existing models.
Medium Near-term
Start preparing for advanced Basel II/III approaches and collect needed data. Medium Near-term
Liquidity and Market Risks
Closely monitor foreign currency-related funding risks and continue de-dollarization policies, collect additional cash-flow-based data.
High Immediate
Refine liquidity ST framework by including more detailed cash-flow-based liquidity reporting data (in addition to LCR).
Medium Near-term
Links between solvency and liquidity risks shall be based on scenarios that involve higher funding costs due to withdrawal of retail deposits.
Medium Near-term
1/ Immediate is within one year; near term is 1–3 years.

GEORGIA
8 INTERNATIONAL MONETARY FUND
INTRODUCTION AND OVERVIEW 1. This Note provides technical details of the ST exercise: coverage, scenarios, and their calibration for credit, liquidity, and systemic contagion tests; models used; and results obtained. 1 The exercise measured solvency, liquidity, and contagion risks under three scenarios: a baseline and two adverse. The ST framework applied in Georgia was based on the modified “The Next Generation Balance Sheet Stress Testing” framework (Schmieder et al, 2011), as well as on a simple cash-flow-based liquidity model. The note is organized as follows: main structural features and risks are presented in this introductory section, and the following sections address respectively scenarios and their calibration, solvency STs, and liquidity STs.
A. Background
2. The Georgian financial system is dominated by banks. Since 1995, the number of commercial banks gradually declined from 102 banks to 21 banks in 2013. The sector is highly concentrated, with the two largest banks accounting for 58 percent of assets. While a majority of banks are foreign owned (19), this does not necessarily mean that they are owned by a foreign financial institution. Other financial institutions include nonbank financial institutions (NBFIs), 70 microfinance institutions, 14 insurance companies, and five pension funds (as of June 2014). While relatively high in numbers, the nonbank financial sector is very small and has combined shares of less than 5 percent of GDP. Due to their relative insignificance and the lack of systemically important institutions, NFBIs were excluded from the exercise.
3. The banking system can be considered “plain vanilla,” i.e., loans constitute the largest chunk of banks’ assets and deposits are the dominant source of funding. Relatively limited links with other domestic and foreign financial institutions helped the banking system to a large extent in mitigating the impact of the global financial crisis. However, it was not immune to regional turmoil, which affected both GDP and loan portfolio quality. While loans are the largest item on the asset side, almost 22 percent of assets are very liquid, in cash and correspondent accounts. They cover almost 40 percent of all deposits. While the high share of very liquid instruments reduces potential profitability of banks, it provides additional cushioning against liquidity shocks, such as a sudden panic of depositors. Funding risks remain elevated due to the very short-term structure; a majority of deposits are below maturity of one month. At the same time, banks have sought to increase foreign funding, i.e., by attracting nonresident deposits and tapping foreign capital markets.
1 Prepared by Mindaugas Leika, IMF external expert.

GEORGIA
INTERNATIONAL MONETARY FUND 9
0%
20%
40%
60%
80%
100%
2006 2007 2008 2009 2010 2011 2012 2013Trading income (incl. FX) Other Non-Interest IncomeFees and Commissions Interest Income Source: NBG
-2,000
-1,000
0
1,000
2,000
3,000
2006 2007 2008 2009 2010 2011 2012 2013
Thou
sand
s
Interest Income Fees and Commissions Trading Income Other Non-Interest IncomeInterest Expenses Personnel ExpensesFixed Assets and Inventory Expenses Other Non-Interest ExpensesProvisions for Asset Losses Net Profit Source: NBG
5%
17%
0%
9%
57%
1%
2%
6%
3%Cash
Correspondent Accounts
Securities for Dealing Operations
Investment Securities
Net Loans
Accrued Interest and Dividends ReceivableEquity Investments
Fixed Assets
Other AssetsSource: NBG
5%
24%
31%1%
20%
2% 6%
7%4%
Deposits of Banks
Demand Deposits
Term Deposits
Accrued Interest and Dividends PayableBorrowed Funds
Other Liabilities
Paid-in Capital
Capital Reserves
Retained ProfitsSource: NBG
Figure 1. Georgia: Structure of Assets Figure 2. Georgia: Structure of Liabilities
4. Net interest income is the main source of banks’ income and profit. Net interest income constitutes about 70 percent of banks’ income, and income from fees and commissions, which are less prone to business cycle fluctuations, account for 10 percent. While trading income is not a significant component, a majority of trading profit is derived from currency conversion operations rather than securities trading. This provides an additional small comfort cushion against downturns: currency conversion is less cyclical than securities trading. High cyclicality of income is a major source of concern. On one hand, spreads between interest rates on assets and liabilities are high and slowly declining; on the other hand, fixed-rate loans are still dominating. Given the dominance of fixed-rate loans of longer maturity, a sudden increase in funding costs (e.g., shock to deposit interest rates) would squeeze banks’ profit margins.
Figure 3. Georgia: Income Structure Figure 4. Georgia: Breakdown of Profit and
Losses
Banks’ capital positions strengthened in recent years due to strong profitability. With a comfortable CAR buffer above minimum of 12 percent and declining NPLs, it can be expected that, in the absence of major geopolitical conflicts, the economy will continue to grow at around 5 percent and banks’ capital position would strengthen further in the medium term.

GEORGIA
10 INTERNATIONAL MONETARY FUND
Table 2. Georgia: Financial Soundness Indicators, 2010–13 2010 2011 2012 2013 Dec. Dec. Dec. Dec.Asset Quality Nonperforming loans (in % of total loans) 1/ 12.5 8.6 9.3 7.5Nonperforming loans (in % of total loans) 2/ 5.4 4.6 3.7 3.1Loans collateralized by real estate (in % of total loans) 47.5 53.4 50.6 52.5Loans in foreign exchange (in % of total loans) 74.0 68.8 67.5 62.1Specific provisions (in % of total loans) 6.5 4.6 4.6 3.8Net foreign assets (in % of total assets) -8.2 -13.7 -19.7 -17.4Credit-to-GDP ratio (in %) 29.9 31.7 33.2 38.0 Profitability 6.3 6.3 5.9 6.3Efficiency 45.0 47.8 41.3 42.1Return on average assets (ROAA) 1.7 2.8 1.0 2.5Return on average equity (ROAE) 3/ 9.6 17.3 5.8 14.6 Liquidity and Funding Liquidity ratio (in %) 4/ 38.7 37.3 39.8 41.8Deposit dollarization (residents and non-residents, in %) 68.6 63.3 66.0 63.6Deposit dollarization (residents, in %) 65.0 58.6 60.4 57.8Loan-to-deposit ratio (in %) 107.6 105.3 106.7 102.9Loans to resident deposits 126.4 129.9 134.7 129.0Net open foreign exchange position (in % of regulatory capital) 8.1 5.9 3.3 2.1Borrowed funds from abroad-to-GDP ratio 5/ 12.2 9.4 11.4 11.1 Capital Capital adequacy ratio (in %) 6/ 17.4 17.1 17.0 17.2Net Interest Margin 23.6 25.6 25.3 25.2Tier 1 Capital Ratio 13.7 11.3 13.4 13.0Financial Leverage (times) 5.9 6.0 6.0 6.0 Sources: National Bank of Georgia; and IMF staff estimates.
1/ National definition: NPLs are defined as loans in substandard, doubtful, and loss loan categories. 2/ Standard 90-day overdue definition.
3/ After tax 4/ Ratio of liquid assets to all deposits plus other liabilities with 6-month and shorter maturity. 5/ Borrowed funds include subordinated debt.
6/ National definition. Risk weight to forex loans was reduced from 200 to 175 percent in September 2008, and to 150 percent in August 2009, and raised to 175 percent in January 2011. 7/ Basel I definition.
GEORGIA
INTERNATIONAL MONETARY FUND 11
B. Key Risks to the Banking Sector
5. Notwithstanding positive macroeconomic developments, the banking system faces a number of key risks and vulnerabilities. These include credit risks related to dollarization, liquidity risks given weaknesses of safety net and crisis management framework, and concentration in the banking sector due to dominance of two banks. The FSAP team identified several key shocks to the financial system:
i) Regional geopolitical turmoil coupled with global recession due to fall in international trade and subsequent depreciation of lari; and
ii) Loss of confidence in the banking system by nonresidents, which yields to a large withdrawal of nonresident deposits.
Figure 5. Georgia: Risk Transmission Channels
6. Banks’ exposure to FX unhedged domestic clients is the key transmission channel for GDP and lari exchange rate shocks. Increasing defaults by domestic companies will be based primarily on a decline in export revenue, which leads to a fall in the exchange rate and an increased debt burden for the whole corporate sector. While the household debt to GDP ratio is low (27 percent) compared to industrialized countries, it can be assumed that debt is not evenly distributed, i.e., only households with sufficient income have long-term debt. Roughly 60 percent of both deposits and loans are in foreign currency, slightly lower than peaks of around 75 percent in 2008–2009 following the conflict with Russia and the global financial crisis. Over 90 percent of foreign currency borrowers have income sources in local currency and are unhedged against lari depreciation. Dollarization also complicates crisis management, as NBG can only provide limited liquidity support in foreign currencies.
Loss in confidence
in banking system
Regional
geopolitical
turmoil and
global slowdown
Mild shock
Extreme shock
Corporate sector
Households
Credit exposure
Loan margins
Credit growth
Capital
Loan losses
Net income
Liquidity shock
Liquidity position/LCR

GEORGIA
12 INTERNATIONAL MONETARY FUND
7. Increasing reliance on nonresident funding is the main transmission channel for liquidity shock due to a potential loss of confidence in the banking system. About 15 percent and 25 percent of bank funding came from nonresident deposits and wholesale funding respectively as of end-2013. At the same time, credit lines and nonresident deposits have proved to be relatively stable in the past shock episodes. Some smaller banks are vulnerable due to their exposure to a few large depositors.
Figure 6. Georgia: Share of Nonresident Deposits
C. Overview of Stress Tests
8. Time horizon. The ST exercise was based on solo data available as of end-December 2013. Models for Solvency ST included historical data for 2006–13. The ST time horizon was three years, i.e., quarterly results during 2014–2016. The relatively short time frame is based on the relatively short macroeconomic time series and ongoing structural changes in the Georgian economy, and in the financial sector in particular.
9. STs applied and cross-check of results. The ST exercise was comprehensive in terms of approaches employed: top-down STs were performed by the FSAP team and the NBG, and bottom-up STs were done by the four largest banks. To cross-check and verify obtained results, the FSAP team used various approaches; namely, it built a satellite model for credit-risk-related losses, a sensitivity-based model for income before loan-loss provisions, as well as, cross-checked output from the satellite model with cross-country study results obtained by Hardy and Schmieder (2013). It is important to note the limitations of quantitative models based on relatively short time series (as in the case of Georgia), as these models might not capture the full effects of extreme shocks.

GEORGIA
INTERNATIONAL MONETARY FUND 13
Figure 7. Georgia: Key Structural Components of FSAP Stress Test Exercise
10. Data and hurdle rates. The top-down STs used supervisory data while bottom-up STs were based on banks’ proprietary models and data. The hurdle rates for the capital adequacy ratio (CAR) were based on current and upcoming regulations, i.e., Basel I and Basel II/III. In 2014, capital adequacy was assessed against 8 percent rate for Tier I capital and 12 percent for total capital. CAR ratios for 2015 and 2016 were based on new regulations. In addition to this, the FSAP mission team made additional calculations to compare results with the upcoming Basel II standardized as well as quasi- Internal Ratings Based (IRB) frameworks.2
Table 3. Introduction of Basel II/III Minimum Capital Adequacy Ratio
2014
(in percent)2015
(in percent)2016
(in percent) 2017
(in percent)Tier I Capital 8 8.5 8.5 8.5
Total Capital 12 10.5 10.5 10.5
Phasing-out (Total CAR) 100 95 90 80
Source: NBG.
2 The NBG plans to introduce Basel II/III standardized approach by the end of 2014.
Top down by IMF
Satellite model for Credit risk
Sensitivity model for income
Sensitivity assumptions about credit growth
Macroeconomic
scenarios
developed by
IMF FSAP team
Baseline scenarios:
WEO projections for 2014-2016
Mild and Extreme
scenarios: Repeat of shock of 2008-9 Top down by NBG
Satellite model for Credit
risk. Income assumptions
Sensitivity assumptions
Bottom-up by banks
Banks’ own models
All banks
Four largest
banks
Liquidity
shocks
Network (Contagion)
shocks
Top down by NBG
All banks
Top down by IMF
All banks. Simple
Market risks
PDs: NPLs. Basel I
PDs: NPLs. Basel II
PDs: WR. Basel II/IRB
PDs: NPLs. Basel I
PDs: NPLs. Basel I

GEORGIA
14 INTERNATIONAL MONETARY FUND
D. Scenarios
Solvency Stress Tests Scenarios
11. The STs considered three scenarios: a baseline and two adverse (mild and extreme), which were applied over a three-year horizon. The scenarios were generated by the FSAP team using assumptions on how various macroeconomic and financial variables would evolve under the most likely path (baseline) and assuming hypothetical events (shock scenarios). The severity of STs (extreme scenario) exceeded the shock observed in 2008–09 by a wide margin. The GDP shock was lower than those observed in some Eastern European countries (e.g., Latvia, Lithuania, etc.), which reflects lower credit to GDP ratio and indebtedness of corporate sector and households in Georgia.
12. The baseline scenario is based on a forecast of the most likely developments in the Georgian economy three years ahead. For the baseline scenario, the FSAP team used the latest (April 2014) IMF’s World Economic Outlook (WEO) assumptions and projections for Georgia. The scenario was complemented by ad hoc assumptions regarding the development of property prices.
13. Both adverse scenarios are calibrated using historical episodes to reflect regional geopolitical tensions that affect real economy and the financial sector. The mild recession scenario resembles the economic situation in 2008–09, when Georgia was affected by regional geopolitical turmoil (including military conflict with its largest neighbor) and the effects of global financial crises. In this scenario, protracted regional political instability would affect Georgia’s economy through a number of channels. Reduced trade with major partners in the region, lower remittances, and the impact of uncertainty on investment would lead to a decline in GDP, depreciation of the exchange rate, an increase in lending interest rates, and a fall in real estate prices.
14. The extreme scenario reflects tail risks in the economy. In this scenario, the regional geopolitical instability would be more severe and last longer. It would have more protracted effects on Georgian economy: extreme decline in GDP, higher depreciation, and higher shock in interest rates and decline in real estate prices. The scenario is compounded by a liquidity shock based upon a run on nonresident deposits which spills over to resident deposits, by sharply increased dollarization, and by direct financial spillovers to banks (higher funding costs).
15. One of the key factors in shock scenario construction was exchange rate developments. Historically, besides the crisis in 2008-9, Georgia has experienced quite stable USD/GEL rate, albeit volatile around 1.6-2 GEL per USD boundaries. This was based on NBG approach to intervene in the markets to avoid sharp market volatility.3 A one-time devaluation of
3 See National Bank of Georgia Annual Report. 2008, page 4.
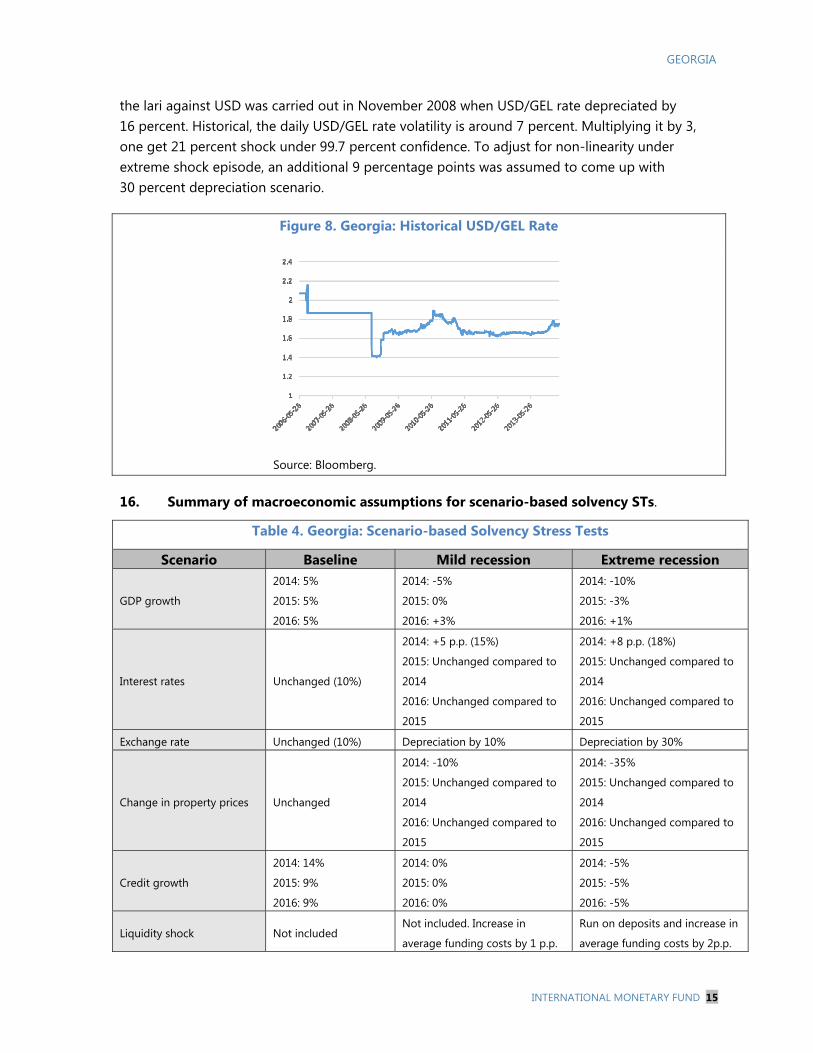
GEORGIA
INTERNATIONAL MONETARY FUND 15
the lari against USD was carried out in November 2008 when USD/GEL rate depreciated by 16 percent. Historical, the daily USD/GEL rate volatility is around 7 percent. Multiplying it by 3, one get 21 percent shock under 99.7 percent confidence. To adjust for non-linearity under extreme shock episode, an additional 9 percentage points was assumed to come up with 30 percent depreciation scenario.
Figure 8. Georgia: Historical USD/GEL Rate
Source: Bloomberg.
16. Summary of macroeconomic assumptions for scenario-based solvency STs.
Table 4. Georgia: Scenario-based Solvency Stress Tests
Scenario Baseline Mild recession Extreme recession
GDP growth
2014: 5%
2015: 5%
2016: 5%
2014: -5%
2015: 0%
2016: +3%
2014: -10%
2015: -3%
2016: +1%
Interest rates Unchanged (10%)
2014: +5 p.p. (15%)
2015: Unchanged compared to
2014
2016: Unchanged compared to
2015
2014: +8 p.p. (18%)
2015: Unchanged compared to
2014
2016: Unchanged compared to
2015
Exchange rate Unchanged (10%) Depreciation by 10% Depreciation by 30%
Change in property prices Unchanged
2014: -10%
2015: Unchanged compared to
2014
2016: Unchanged compared to
2015
2014: -35%
2015: Unchanged compared to
2014
2016: Unchanged compared to
2015
Credit growth
2014: 14%
2015: 9%
2016: 9%
2014: 0%
2015: 0%
2016: 0%
2014: -5%
2015: -5%
2016: -5%
Liquidity shock Not included Not included. Increase in
average funding costs by 1 p.p.
Run on deposits and increase in
average funding costs by 2p.p.

GEORGIA
16 INTERNATIONAL MONETARY FUND
0%
10%
20%
30%
Q4 2013
Q1 2014
Q2 2014
Q3 2014
Q4 2014
Q1 2015
Q2 2015
Q3 2015
Q4 2015
Q1 2016
Q2 2016
Q3 2016
Q4 2016
Mild Severe
Baseline (axis on the right) NPLs based on Hardy et al.Source: NBG
17. Banks in both mild and extreme recession scenarios are affected by an increase in credit risks due to depreciation of the lari, higher NPLs, and higher provisioning ratios due to a fall in property prices. The high level of dollarization in the financial sector and mostly unhedged borrowers led to sharp increase in NPLs. At the same time, increases in interest rates also affect banks’ funding costs and lower banks’ profitability. Shocks on NPLs and credit growth were calibrated using historical data, and in the case of extreme recession, output of IMF team macro model exceeds level of NPLs observed in 2009 (peak period, see Figure 10).
Figure 9. Georgia: Forecasted Level of NPL Ratios
Box 1. Georgia: Cross-Checking Shocks to Nonperforming Loans
To cross-check forecast accuracy with benchmarks provided by other IMF studies, the FSAP team used the Hardy et al (2013) approach, which revealed consistency with conservative benchmarks. It provides some elasticity coefficients for macro scenarios: by how much NPLs ratio would increase if real GDP growth rate deviates from its long-term trend. Georgia is an emerging market country, so elasticity for emerging markets was applied.1 It is assumed, that the extreme recession scenario is equal to severe shock under the different categories of GDP elasticity (Table below). The corresponding level of system-wide NPLS is provided in Figure 9.
GDP Elasticity Parameters.
GDP Elasticity
Advanced Economies Emerging Countries
Moderate shock
Medium shock
Severe Shock
Moderate shock
Medium shock
Severe Shock
Default Rate/NPL -0.4 -0.4 -0.8 -0.6 -0.8 -1.5 1Furthermore, as more conservative approach, extreme 10th percentile of elasticity was taken from this study.

GEORGIA
INTERNATIONAL MONETARY FUND 17
10
20
30
40
50
-20
-10
0
10
20
Dec-06 Dec-07 Dec-08 Dec-09 Dec-10 Dec-11 Dec-12 Dec-13
Net interest margin ROAROE Trading Income (% of Total Rev)Efficiency (Cost/Income), rhs
Shock period
Source: NBG
-25
0
25
50
75
0
5
10
15
20
Jan-06 Jan-07 Jan-08 Jan-09 Jan-10 Jan-11 Jan-12 Jan-13
NPLs to total loans CAR ratio
Annualized loan growth, rhs
Shock period
Source: NBG
18. Banks’ profitability during recession periods will be further affected by a decrease in net interest margins. Based on World Bank data, net interest margins in the Georgian banking system fell steadily since 2009.4 In 2009, the margin was 7.1 p.p., while in 2012 it dropped to 4.1 p.p. on average.5 The combination of solvency and liquidity risks produces an increase in average funding costs by 0.5 p.p. in mild shock scenarios and by 1 p.p. in extreme shock scenarios. The scenarios were calibrated using the same historical approach used for macro data (Figures 10 and 11).
Figure 10. Georgia: Shocks in 2007–2009 Figure 11. Georgia: Developments of
Profitability (in %)
Liquidity stress tests scenarios
19. Liquidity ST scenarios reflected two key risks in the banking system: (i) dollarization; and (ii) the significant share of nonresident funding.
Withdrawal of wholesale funding and closure of foreign funding markets. Wholesale funding based on loans and deposits is not rolled over according to the shock parameters in the table below.
Bank run. Deposit withdrawals of up to 30 percent; wholesale funding withdrawal of up to 30 percent; and fire sales of liquid assets with haircuts of up to 40 percent. The initial nominal stock of credit grows according to the baseline scenario; 50 percent of committed credit lines are drawn down. No net additional intra-group funding is available. The interbank market is closed.
4 See: http://data.worldbank.org/indicator/FR.INR.LNDP. 5 The NBG pointed out that there was no historical observation of significant drops in margins. At the same time, the FSAP mission focused on hypothetical extreme shock. Due to loan contract clauses, banks indeed may be able to pass increases in funding costs to their customers; however, the FSAP team assumed that this might generate political turmoil as happened in some other Eastern European countries (e.g., Hungary with FX rates used for loan conversion).
GEORGIA
18 INTERNATIONAL MONETARY FUND
Combined shocks. This scenario combines withdrawal of nonresident funding and bank-run shocks.
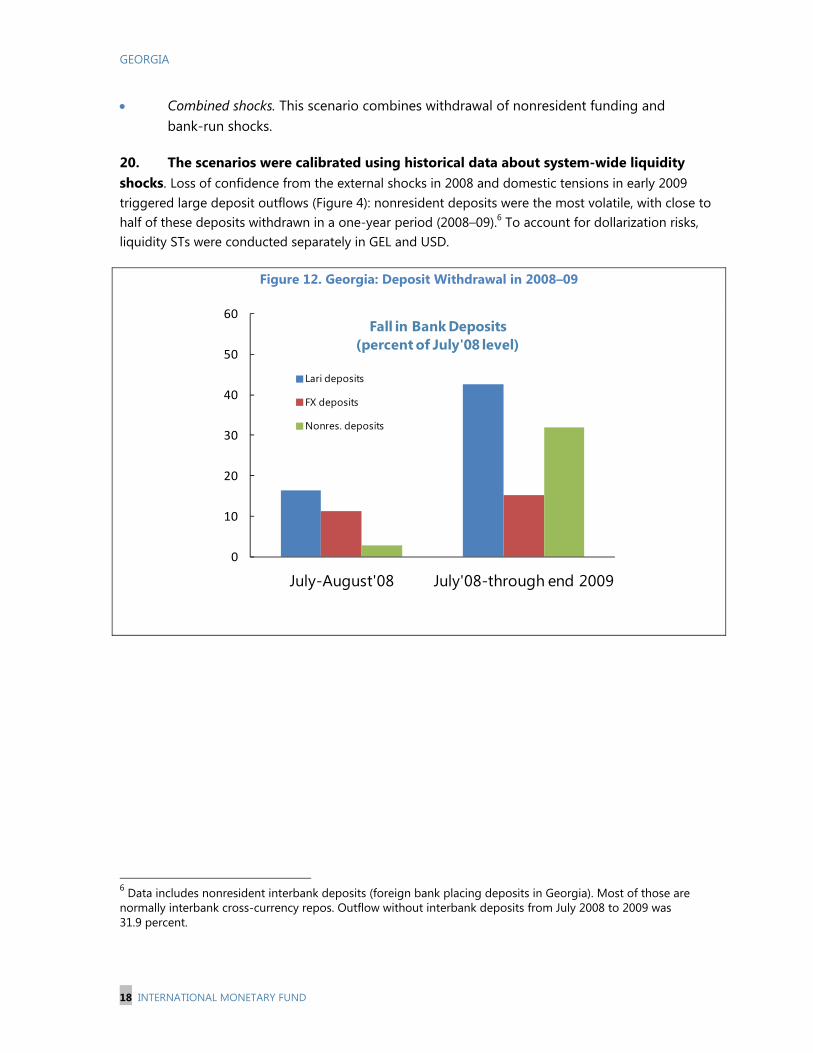
20. The scenarios were calibrated using historical data about system-wide liquidity shocks. Loss of confidence from the external shocks in 2008 and domestic tensions in early 2009 triggered large deposit outflows (Figure 4): nonresident deposits were the most volatile, with close to half of these deposits withdrawn in a one-year period (2008–09).6 To account for dollarization risks, liquidity STs were conducted separately in GEL and USD.
Figure 12. Georgia: Deposit Withdrawal in 2008–09
6 Data includes nonresident interbank deposits (foreign bank placing deposits in Georgia). Most of those are normally interbank cross-currency repos. Outflow without interbank deposits from July 2008 to 2009 was 31.9 percent.
July-August'08 July'08-through end 20090
10
20
30
40
50
60Fall in Bank Deposits
(percent of July'08 level)
Lari deposits
FX deposits
Nonres. deposits

GEORGIA
INTERNATIONAL MONETARY FUND 19
Table 5. Georgia: Summary of Assumptions for Liquidity Stress Tests Assumptions on Asset Liquidation for All Scenarios
Liquidation value (in percent) of cash and funds held at the central bank, interbank
deposits, deposits held at foreign banks, foreign government securities, and foreign
bonds.
Liquidation value (in percent) of deposits held at domestic banks, domestic government
securities, domestic bonds, and other liquid assets.
100 percent
60 percent
Other Assumptions for All Scenarios Interbank market is closed.
Percent of committed credit lines that are drawn down. 50 percent
Assumptions on Liabilities Withdrawals
Scenario 1
Withdrawal of nonresident funding and closure of foreign funding markets.
Overnight withdrawal of
wholesale funding.
(A) 10 percent of liabilities coming due within three months.
(B) 10 percent of all liabilities.
(C) 50 percent of liabilities coming due within three months.
In all cases, we assume no withdrawals of customer deposits.
Scenario 2
Bank run.
Withdrawal of resident and
nonresident deposits over 5- and
30-days horizons.
(A) A withdrawal of 10 percent of residents deposits (irrespective of the
currency of denomination and maturity of these deposits); 40 percent of
nonresidents deposits (irrespective of the currency of denomination and
maturity of these deposits), including foreign bank deposits; and
100 percent of domestic interbank deposits (irrespective of the currency of
denomination and maturity of these deposits).
(B) A withdrawal of 30 percent of residents deposits (irrespective of the
currency of denomination and maturity of these deposits); 80 percent of
nonresidents deposits (irrespective of the currency of denomination and
maturity of these deposits), including foreign bank deposits; and
100 percent of domestic interbank deposits (irrespective of the currency of
denomination and maturity of these deposits).
Scenario 3
A combination of scenarios 1A and 2 (A), 1B and 2 (A), and 1C and 2 (A)
Overnight withdrawal of liabilities
to parent banks and overnight
withdrawal of resident and
nonresident deposits.
(A) Combination of scenarios 1A and 2 (A).
(B) Combination of scenarios 1B and 2 (A).
(C) Combination of scenarios 1C and 2 (A).
GEORGIA
20 INTERNATIONAL MONETARY FUND
SOLVENCY STRESS TESTS 21. ST methodology is based on current capital adequacy requirements in Georgia, i.e., Basel I. Loan-loss provisions are subtracted from capital and risk-weighted assets (RWAs). The FSAP team used several parallel STs methods; namely, Basel II standardized approach and quasi-IRB approach (based on fixed loss-given default (LGD) assumption, i.e., quasi-foundation IRB) to take into account the forthcoming transition to Basel II. As for the Basel I STs, the main risk drivers were increases in NPLs, as provisioning rates were fixed at 100 percent, i.e., no collateral was taken into account.7 For Basel II STs, increases in NPLs were complemented by an additional factor—migration from higher (100 percent for loans in GEL and 175 percent for loans in USD) to lower risk weights (50 percent) for the baseline scenario and migration from 50 percent of risk weights to 100 percent risk weights for adverse scenarios. Main risk drivers under the quasi-IRB approach are quasi-probabilities of default (PDs) that lead to higher capital requirements.
22. The STs covered a two-year period (bottom-up) and a three-year period (top-down). The three-year (2014–2016) quarterly forecasting horizon was chosen due to an inadequate amount of historical observations.
23. Inclusion of various cross-checks, as well as an economic capital-based IRB model, adheres to the notion that ST results in volatile emerging markets need to be cross-checked using several approaches. Based on empirical evidence from similar emerging market countries, banks’ losses during crisis periods can exhibit a high degree of nonlinearity and might not be fully captured by econometric models. Hence, additional benchmark parameters should be used to overcome this issue. For example, Basel I and Basel II standardized approaches are less risk-sensitive compared to the IRB-based approach. The latter reveals vulnerabilities of the banking system much quicker.
24. While there is a danger that banks did not fully disclose the true condition of their loan books (due to ever-greening), the FSAP mission did not appear to face data quality and consistency issues. No additional assumptions about latent loan portfolio deterioration were made, as the majority of banks experience a relatively high increase in NPLs (up to 3 or 4 times the original level) and loan collateral is not taken into account for provisioning purposes. In addition to that, NBGs asset quality review system is well-suited to capture ever-green loans.
25. Solvency STs were based on static balance sheet and zero behavioral assumptions. Static balance sheet adopts the approach that nonperforming loans are not replaced by new
7 Regulatory provisioning of NPLs varies from 30 percent to 100 percent. NBG does not collect data on loan collateral valuation, hence that data were not available.
GEORGIA
INTERNATIONAL MONETARY FUND 21
loans during the ST horizon. It is assumed that banks pay no dividends in all scenarios.8 Capital increase is based on internally generated sources (profits). During the baseline and adverse scenarios, banks do not increase capital from external sources. Profit is taxed at the current applicable tax rate (20 percent).
A. Bottom-up Stress Test
26. Bottom-up STs were performed by the four largest banks based on scenarios provided by the IMF and the NBG. The four banks constitute 73 percent of total banking system’s assets. The banks utilized their own ST methodology and financial projections, including assumptions about dividend payout. The ST scenario under which each bank performed the ST was different from the final scenarios that were used in top-down ST. The differences are based on scenario adjustments after the FSAP mission, namely, the addition of the third year and the adjustment of GDP growth rates for mild and extreme recession scenarios.
Table 6. Georgia: Scenarios for Bottom-Up Stress Tests9
Scenario Baseline Mild recession Extreme recession
GDP growth 2014: 5%
2015: 5%
2014: -5%
2015: -3%
2014: -10%
2015: -0%
Interest rates Unchanged (10 percent)
2014: +5 p.p. (15%)
2015: Unchanged compared to 2014
2014: +8 p.p. (18%)
2015: Unchanged compared to 2014
Exchange rate Unchanged (10 percent) Depreciation by 10% Depreciation by 30%
Change in property prices
Unchanged
2014: -10%
2015: Unchanged compared to 2014
2014: -35%
2015: Unchanged compared to 2014
Credit growth 2014: 14%
2015: 9%
2014: 0%
2015: 0%
2014: -5%
2015: -5%
Liquidity shock Not included Run on deposits and increase in average funding costs by 1 p.p.
Run on deposits and increase in average funding costs by 2 p.p.
8 While this is assumption only and does not mean that banks in reality will not pay any dividends, this is true for shock scenarios as banks do not make profit. Were banks to pay out dividends, CAR in the baseline scenario would grow at the much lower rate. 9 The scenario for bottom-up stress tests was agreed before the FSAP mission. Scenarios for top-down stress tests were changed during the FSAP mission and adjusted after taking into account comments from the NBG.

GEORGIA
22 INTERNATIONAL MONETARY FUND
27. Bottom-up STs results suggest that three banks out of four would maintain minimum Tier I and total CAR under all scenarios. Under current regulatory minimum (8 percent of Tier I), one bank falls below minimum Tier I CAR only marginally (by less than 85 basis points) under the extreme recession scenario, and only in 2015. Under the new Tier I minimum of 8.5 percent (starting from 2015), the difference would be 135 basis points, and still only one bank fails under this higher threshold. It should be noted that the same bank was the only one that was mostly consistent with the scenarios and assumptions; its net income after loan-loss provisions was negative and net interest income fell substantially. Other banks would report positive income even after loan-loss provisioning in the STs.
28. Bottom-up results sharply contrast with top-down results, large due to ST methodologies and assumptions Analysis of individual banks’ top-down results reveal that banks are overly optimistic about their net interest and other income; in most of the cases, net income after loan-loss provisions remains positive even under the extreme recession scenario. While the FSAP team had no ability to familiarize itself with banks’ ST models, the differences most likely stem from assumptions about accrued interest income. Most of the ST exercises assume that only income that is received as cash is taken into account for capital calculation purposes, while income that is accrued is excluded from calculations. The FSAP team explicitly assumed in its own top-down STs that all accrued income from NPLs is excluded from profit calculations.
29. Based on limited ST experience of banks and the inability to fully trace losses and income assumptions, bottom-up results are of limited use. While the FSAP team asked for a detailed breakdown of results, they do not fully reveal why banks are very optimistic about their income before loan-loss provisions. To some extent, this can be attributed to banks’ contractual ability to re-price loans if their funding costs increase, but fail to account for an increase in NPLs due to higher interest rates (or, alternatively, a decline in net present value of the loan portfolio, if loans are restructured). The NBG needs to discuss with banks their models and assumptions to make sure that their ST results are conservative enough and are consistent with scenarios.
30. Banks’ results from market risks STs reveal no significant impact on CAR. Banks have very limited exposure to market risk, and the largest losses come from net open positions in USD. Among the four banks, two have short positions in FX and two have long positions. Overall, their positions do not exceed 8 percent of total capital (largest) (Figure 6). When it comes to the securities portfolio among the four banks, its size is limited; however, the largest exposure in the system is more than 110 percent of capital. It should be noted that most of the securities are debt securities and, according to data, are held to maturity (HTM). Hence, there is no impact on changes in interest rates on their prices. No bank reported available for sale (AFS) or trading book positions. Overall, shock effects from market risks are limited on the four banks’ income over the ST horizon. It should be noted, however, that some of the banks that are on the extreme right (shown in Figure 13) might experience higher impact on their CAR; however, these banks are very small, were excluded from the bottom-up ST exercises, and pose no systemic risk.

GEORGIA
INTERNATIONAL MONETARY FUND 23
Figure 13. Georgia: Market Risk Exposures to Capital
B. FSAP Top-Down Stress Test
Modeling approach
31. The ST model was constructed to link developments in Georgian economy to credit risk related losses in the banking system. The model has three structural components: (i) a satellite model that links NPLs with various macro variables; (ii) sensitivity-based income model; and (iii) balance sheet model that calculates CAR. The balance sheet model is a modified and simplified version of the Next Generation Balance Sheet Stress Testing framework (see Schmieder et al (2011)). This modified framework allows the application of various approaches toward credit risk modeling: Basel I, Basel II standardized, and IRB. While banks operating in Georgia have to comply with Basel I, by the end of 2014 they will have to comply with Basel II Standardized approach. None of them will be using the IRB approach during the ST scenario horizon as yet.
32. The ST model includes just domestic exposure and thus links domestic macroeconomic developments with credit portfolio losses. Because 98.5 percent of Georgian banks’ exposure is domestic, there are no significant cross-border exposures and geographical diversification. Within the domestic loan portfolio, this breaks down into 55 percent of loans to corporates and 43 percent to households. The most significant risk is based around FX as 60 percent of loans are in foreign currencies, mostly in USD. Capturing FX risk is not easy, as Georgia experienced just one significant depreciation episode, which was based on official devaluation (16 percent); except that the FX rate was managed by the NBG to avoid excess volatility in the market.

GEORGIA
24 INTERNATIONAL MONETARY FUND
Satellite model
33. NPLs ratio was used as a proxy for PD. The metrics is based on a share of the total loan portfolio that became nonperforming (the value of NPLs loans divided by total loan portfolio). Further modeling details are provided on Appendix III.
34. GDP growth and interest rates were significant explanatory variables in the satellite model, while inclusion of exchange rate dynamics in the equation showed relatively little impact of changes in the USD/GEL rate on NPLs. Almost 60 percent of the loan portfolio is in FX, thus calculating direct shock of currency devaluation on loan portfolio quality can yield significant non-linearity, hence underestimate total effect. While correlation between changes in real GDP growth rate and USD/GEL rate was low, devaluation usually follows decline in GDP and, as a result, interest rates go up (this is also consistent with macroeconomic theory and empirical evidence in Georgia). Hence, real GDP growth rate would be a leading indicator for depreciation of GEL and USD/GEL rate is a leading indicator of increase in interest rates. 10 To test for robustness of the hypothesis that indirect FX effects are captured by GDP and interest rate developments, an alternative assumption based on Hardy and Schmieder (2013) was used (Figure 9). The alternative specification was broadly in line with results obtained by the satellite model.
35. Forecast NPLs for the baseline and adverse scenarios were calculated using macro data on GDP and long-term interest rates (as specified in scenarios). All forecasts were based on quarterly data, using a simple transformation rule: annual y-o-y shocks were divided by 4 to reflect equal realization of the respective shock in each quarter, i.e., if an annual drop in GDP would be -10 percent, each quarter y-o-y real GDP growth rate would be reduced by -2.5 p.p. The same assumptions were applied in case of long-term interest rates.
Provisioning
36. Loan-loss provisions (credit losses) were calculated as differences (flows) between the stock of NPLs in two consecutive quarters multiplied by the provisioning ratio and exposure. The satellite model provides the estimated stock of NPLs for each quarter; to come up with flows (loan losses) for each quarter for each bank i, we deducted NPLs level in period t from the level in t+1:
Flow of additional loan-loss provisionst+1i = (NPLst+1
i-NPLsti)*Provisioning ratio*Loan portfolio
Loan-loss provisioning was based on current regulatory requirements. For the ST purposes a fixed 100 percent provisioning rate was used, i.e., the most conservative approach.11 Loan 10 The real GDP growth rate was assumed as a systematic risk factor. 11It is possible to use different fixed provisioning ratios: 66.4 percent (Ratio was obtained as 1-Recovery ratio). Recovery ratios are published by the World Bank: http://www.doingbusiness.org/data/exploreeconomies/georgia#resolving-insolvency) for the baseline scenario and 100 percent for the adverse scenarios. This would reflect an empirical link between increase in PDs and
(continued)

GEORGIA
INTERNATIONAL MONETARY FUND 25
portfolio (net) is equal to exposure at default (EAD), i.e., bank’s loan portfolio at time t. For Basel II approaches, the exposure included off-balance sheet items and the Credit Conversion Factor (CCF) was employed to include contingent exposures in the loan portfolio (for further details see Table 2). Income before loan loss provisions
37. Net income is the first line of defense against loan portfolio losses. Baseline and adverse scenarios included assumptions about net income before the loan-loss provisions. Relatively high loan interest rate margins over deposit interest rates and low competition allow banks to compensate for high levels of expected loan portfolio losses. The ST model includes the following assumptions:
a) Interest rate shock, which affects net interest income (including inverse yield curve); b) Credit growth: i.e., increase in net interest income; and c) NPLs growth: i.e., decline in net interest income.
Further modeling assumptions are explained in Appendix V.
Other assumptions
38. ST was based on a static balance sheet approach. It was assumed that over the horizon of ST, the composition of a balance sheet will change according to the scenario, i.e., nonperforming and defaulted loans will not be replaced by new loans, except for credit growth (positive or negative). It should be noted that there is no distinction between trading and banking books while calculating net interest income. The trading book in Georgian banks is very small because most assets are held until maturity; hence, for simplicity only, the banking book was considered for net interest income modeling purposes.
39. STs assumed that all banks in the system are price takers rather than price setters. While net interest income margin calculations are individualized, i.e., we used data about each individual bank loan margins and we assumed that margin changes will be the same for all banks. In addition to this, no second-round effects were included in the calculations, i.e., a disproportionate increase in funding costs due to higher fall in CAR for an individual bank i.
CAR calculation
40. The combination of various shocks increases provisioning and is likely to lead to lower CAR, especially if the bank’s income before provisions is not higher than the flow of
subsequent increase in LGD (downturn LGD) for adverse scenarios (or alternatively relationship between increase in NPLs and increase in provisioning ratios due to decline in collateral values; this relationship can only be observed in countries that allow banks to use IFRS 39 (9) standard).

GEORGIA
26 INTERNATIONAL MONETARY FUND
additional provisions. The increase in NPLs and the migration of loans from lower to higher risk categories12 will create additional flow of loan-loss provisions. Provisions might be partially (fully) covered by banks’ profit before provisions. The post-shock CAR is calculated as follows:
1tgrowthCredit todueRWA in Change+rate FXin change todue 1tRWAin Change1tetRWA1triskmarket from (loss) incomeNet 1te1tπtC
1tCAR
;tCAR1tCARΔCAR
where CARt+1 is the forecasted period CAR; CARt is the previous period CAR; Ct is the stock of regulatory capital at time t; πt+1 is the sum of next period’s net interest and net non-interest income; et+1 is the flow of additional loan-loss provisions in time t+1. RWAt are the risk-weighted assets for the current period. In addition to above mentioned components, net income (losses) from market risk related shocks are added (e.g., change in GEL/FX rate, repricing of securities in available for trade position, etc.). If net income after loan-loss provisioning is positive, 20 percent income tax rate is applied before this income is added to the CAR ratio.
41. Hence, the change in CAR is calculated as a change of both the nominator (existing regulatory capital) and the denominator, i.e., assets. Subtracting additional loan-loss provisions from regulatory capital reduces capital; however, the impact of deterioration of loan portfolio quality on capital position might be softened by positive income from current loan portfolio and positive net non-interest income. Subtracting loan-loss provisions from RWAs reduces the denominator, and this is in line with current regulatory requirements.
Concentration risk
42. Portfolio concentration risks are relatively small and manageable. Based on the simple assumption that the largest exposure defaults and using current 100 percent provisioning rule, no bank needs additional capital. Concentration testing was separate from shock scenarios, i.e., it was assumed that largest counterparts default independently. Using the same model and assuming default of three largest exposures, only five banks would need GEL 50 million recapitalization. It should be noted that it was assumed that the largest borrowers are independent for each bank (i.e., there is no contagion effect), which is simple but not very realistic because large companies usually have exposures to multiple banks.
12 Georgian banks operate under Basel I capital regulation. The majority of GEL loans have 100 percent risk weight (exceptions are loans to financial institutions and sovereign entities), while loans in FX have 175 percent risk weight. Based on this, there was no need to model loan portfolio risk weight migration explicitly.

GEORGIA
INTERNATIONAL MONETARY FUND 27
Results
43. Solvency top-down ST results suggest that banks are able to withstand considerable economic downturn, as the resulting capital shortfall during distress period is relatively modest in terms of GDP.
As for the baseline scenario, with all other factors fixed, the system’s Tier I capital would increase from 3 p.p. to 11 p.p. up to 16–24 percent range. This reflects the high level of profitability, capital buffers, moderate credit growth, and declining levels of NPLs. Were credit growth to increase; some banks would need additional capital to support loan portfolio growth.
As for the adverse scenarios, banking system resilience is very unevenly distributed: aggregated, system-wide results mask vulnerabilities of some banks. In the mild scenario, four banks would need additional capital to be in line with minimum CAR. However, it should be noted that total recapitalization needs are close to GEL 120 million, corresponding to 0.4 percent of GDP. The extreme shock scenario reveals vulnerabilities related to indirect foreign exchange shock related credit risks as well as decline in profitability. Eleven banks would not meet the minimum Tier I CAR. Total recapitalization needs are close to GEL 600million (1.7 percent of GDP). However, lowering risk weights (countercyclical policy) as a result of introducing Basel II and exclusion of collateral for provisioning purposes would unfreeze additional capital and lower recapitalization needs by almost half.
Analysis of single-factor shocks (interest, exchange rates) shows a very limited direct impact on the banking book. The impact on the trading book is negligible due to the fact that most of the assets are held until maturity (trading book is literally nonexistent). Direct losses from GEL depreciation are not large either, due to the small net open position.
Credit portfolio concentration risk ST reveals that while, overall through the system the largest exposures are 16 percent of regulatory capital, only several small banks are particularly vulnerable to default on their three largest borrowers and may fail the test. No one bank fails due to default of their largest borrower.
Detailed results are illustrated in Appendix I.
44. Basel II Standardized ST results reveal significant capital buffers that can be used to offset potential losses. Results reveal that even under severe shock scenario, total Tier I CAR would be above minimum level (Figure 14).13 At the same time, when it comes to individual
13 The Figure 15 already incorporates jump of Tier I CAR under Basel II: from 13 percent in Q4 2013 to almost 27 percent.

GEORGIA
28 INTERNATIONAL MONETARY FUND
banks, four banks would fall below the regulatory minimum and total recapitalization needs are close to GEL 100 million.
Figure 14. Georgia: Tier I CAR under Basel II Alternative Stress Testing: STD Approach
The IRB-based ST results reveal that banks have adequate capital buffers to cover losses under baseline and mild scenarios; however, they will need additional capital under severe shock scenario. While IRB ST results cannot be used for official capital adequacy calculation purposes, they can provide a risk-adjusted estimate of losses. The absence of real PDs and LGDs hinders calculation of potential losses, but, nevertheless, it is possible to use proxy data to arrive at a very approximate estimation.14 When it comes to the baseline and mild shocks using 66.4 percent LGD, results are more or less in line with Basel I ST results; however, losses under the severe scenario and the most conservative LGD approach (100 percent) double recapitalization needs compared to results under the Basel I. ST results under 66.4 percent of LGD provide considerably lower amount of potential losses—about twice as low as under the severe scenario using Basel I.
14 Write-offs are flow-based measure of PDs. Average estimation of percentage of stock that is written off is biased because NPLs for the next quarter are the result of two factors: (i) reduced by the amount of write-offs; (ii) increased due to flow of new NPLs. Although 100 percent LGD assumption is too conservative (average LGD under Basel IRB approaches varies between 20–50 percent), formula for proxy PDs is such, that 100 percent of LGDs is assumed due to the flow of write-offs. Ideally, write-offs of data and calculations should be supported by data on recoveries.

GEORGIA
INTERNATIONAL MONETARY FUND 29
0%
10%
20%
30%
Q4 2013
Q1 2014
Q2 2014
Q3 2014
Q4 2014
Q1 2015
Q2 2015
Q3 2015
Q4 2015
Q1 2016
Q2 2016
Q3 2016
Q4 2016
Baseline Mild Severe
0200400600800
100012001400
Q4 2013
Q1 2014
Q2 2014
Q3 2014
Q4 2014
Q1 2015
Q2 2015
Q3 2015
Q4 2015
Q1 2016
Q2 2016
Q3 2016
Q4 2016
Mil
lio
ns
Baseline Mild Severe
050
100150200250300350
Q4 2013
Q1 2014
Q2 2014
Q3 2014
Q4 2014
Q1 2015
Q2 2015
Q3 2015
Q4 2015
Q1 2016
Q2 2016
Q3 2016
Q4 2016
Mill
ions
Baseline Mild Severe
0%
10%
20%
30%
Q4 2013
Q1 2014
Q2 2014
Q3 2014
Q4 2014
Q1 2015
Q2 2015
Q3 2015
Q4 2015
Q1 2016
Q2 2016
Q3 2016
Q4 2016
Baseline Mild Severe
Figure 15. Georgia: Tier 1 CAR (66.4% LGD)
Figure 16. Georgia: Recapitalization Needs (66.4% LGD)
Figure 17. Georgia: Tier 1 CAR (100% LGD)
Figure 18. Georgia: Recapitalization Needs
(100% LGD)
C. NBG Top-Down Stress Tests
45. NBG developed its own stress testing framework, which is used for top-down stress tests. The framework is based around a satellite model that links NPLs to macro variables (for specification see Appendix IV). The key differences between IMF and NBG satellite models are as follows:
Modeling approach. While the FSAP satellite model uses dynamic panel modeling technique, i.e., GMM approach with White correction for heteroscedasticity, the NBG uses simple OLS technique panel model. The FSAP satellite model is based around banks as cross-sections (all banks in the system except for several very recent ones that have very short time series of historic NPLs), and the NBG model is based around economic sectors as cross-sections and system-wide NPLs;
Correction for different NPLs levels among banks. While the FSAP team uses individual NPLs level correction for banks (derived as individual constant for each bank), the NBG does not use any individual correction. Correction coefficients are used differently under baseline scenario and under mild and adverse shock scenarios: no individual level correction is used under the baseline scenario (to allow for faster recovery of losses, as GDP grows, losses would be lower than under 100 percent provisioning ratio due to cure rates and recoveries from collateral sale); and

GEORGIA
30 INTERNATIONAL MONETARY FUND
Explanatory variables. The NBG model covers a much wider array of variables, including GDP, interest rates, exchange rate, etc. The FSAP’s satellite model includes just interest rates and GDP. The NBG’s model can also capture (include) sector-specific risks and variables.
46. NBG’s top-down ST followed the same macro scenarios and logic as the FSAP ST. The NBG’s ST calculated amount of losses (provisioning), net income before loan-loss provisions and changes to risk-weighted assets according to assumptions about credit portfolio growth. The key differences between two approaches lies in:
i) assumption on net interest income before loan-loss provisions:
ii) The FSAP’s more conservative approach assuming that a larger share of the loan portfolio would not generate interest income; and
iii) The satellite model, where NBG includes FX rate and GDP directly, while FSAP assumes that interest rates and GDP growth rate are affected by devaluation (i.e., model makes assumptions about implicit effect of devaluation).
Figure 19. Georgia: Countercyclical Buffer
47. Results suggest that banks are well capitalized for baseline and for mild shock scenarios, but need additional capital to withstand adverse recession. No one bank needs additional capital for baseline scenario (the one bank that did not meet minimum CAR in Q4 2013 is already recapitalized). When it comes to a mild recession scenario, four banks might need up to GEL 30 million in additional capital. For the extreme recession scenario, 10 banks might need around GEL 550 million in additional capital. The ability to reduce risk weights for FX loans further lowers recapitalization needs (Figures 20 and 21).
GEORGIA
INTERNATIONAL MONETARY FUND 31
0%
4%
8%
12%
16%
2014 Q1
2014 Q2
2014 Q3
2014 Q4
2015 Q1
2015 Q2
2015 Q3
2015 Q4
2016 Q1
2016 Q2
2016 Q3
2016 Q4
No Countercyclical Policy
Countercyclical Policy Response-
100
200
300
400
500
600
2014 Q1
2014 Q2
2014 Q3
2014 Q4
2015 Q1
2015 Q2
2015 Q3
2015 Q4
2016 Q1
2016 Q2
2016 Q3
2016 Q4
Mill
ion
GEL
No Countercyclical Policy
Countercyclical Policy Response
Figure 20. Georgia: Capital Adequacy Ratio under Severe Scenario
Figure 21. Georgia: Capital Shortage for Severe Scenario
D. Reconciliation of Results
48. Both top-down approaches reveal similar amounts of losses under all three scenarios, while bottom-up ST results show much lower risks. Differences in both top-down approaches are not very significant and yield similar results; bottom-up STs are unsatisfactory however. This is evident from individual banks’ results which lack consistency in some cases. This can be attributable to lack of experience and sophisticated in ST models.15
49. Differences in profitability assumptions among ST approaches are reflected in CAR evolution. FSAP top-down ST incorporates more severe assumptions about decline in banks’ profitability during shock period. These assumptions are based on general trend decline in lending margins and rigidity of operational expenses during one- and two-year ST horizon. Figures 22–24 summarize ST results by comparing all three approaches.
50. Additional STs under Basel II Standardized and IRB approaches reveal conflicting messages; while, compared to main Basel I based model, capital needs under Basel II Standardized approach are small and capital needs under IRB approach are much higher. These results are not surprising though; Basel II Standardized lowers risk weights, while the IRB approach is highly pro-cyclical. The latter reveals that if banks were allowed to calculate capital under IRB rules, their losses during recessions like the simulated ones would be much higher. This justifies current NBG policy to maintain higher risk weights for FX-denominated loans. At the same time, transition to the Basel II Standardized approach involves additional risks if the higher risk weights were to be fully abandoned and credit growth fuelled. At this point in time, NBG plans either to reduce risk weights or introduce countercyclical buffer.
15 The differences are not based on scenarios only.

GEORGIA
32 INTERNATIONAL MONETARY FUND
0%
5%
10%
15%
20%
2013 Q1 2014
Q2 2014
Q3 2014
Q4 2014
Q1 2015
Q2 2015
Q3 2015
Q4 2015
Q1 2016
Q2 2016
Q3 2016
Q4 2016
Mild (IMF) Mild (Bottom-up)Mild (NBG)
0%
5%
10%
15%
20%
25%
2013 Q1 2014
Q2 2014
Q3 2014
Q4 2014
Q1 2015
Q2 2015
Q3 2015
Q4 2015
Q1 2016
Q2 2016
Q3 2016
Q4 2016
Hurdle Rate Tier 1 Capital Baseline (IMF)Baseline (Bottom-up) Baseline (NBG)
0%
4%
8%
12%
16%
2013 Q1 2014
Q2 2014
Q3 2014
Q4 2014
Q1 2015
Q2 2015
Q3 2015
Q4 2015
Q1 2016
Q2 2016
Q3 2016
Q4 2016
Extreme (IMF)Extreme (Bottom-up)Extreme (NBG)
Figure 22. Georgia: ST Results: CAR under Baseline Scenario
Figure 23. Georgia: ST Results: CAR under Mild Recession Scenario
Figure 24. Georgia: ST Results: CAR under Adverse Recession Scenario
E. Recommendations
51. Solvency ST results suggest that the Georgian banking system has strong capital buffers and is adequately capitalized against severe macroeconomic shocks. Strong economic recovery after the crisis observed in 2008–09 and banks’ high profitability led to a decline in NPLs and increase in capital buffers. Despite positive developments in the credit market, the banking system still faces the problem of stock of FX loans and increasing dependency from nonresident funding. ST results reveal that banks would suffer most from decline in GDP coupled with increase in interest rates and shock to USD/GEL rate. While NBG introduced higher risk weights to loans in FX, these measures might be not sufficient and more proactive approach towards de-dollarization might be warranted. For example, it might be straightforward prohibition of granting new FX loans to non-hedged borrowers.
GEORGIA
INTERNATIONAL MONETARY FUND 33
52. At the same time, banks need to continue building capital buffers as global and regional risks grow. The probability of realization of the extreme scenario is growing as regional tensions continue to build up. While Georgia may not be affected directly, a deteriorating situation in neighboring countries could affect trade and remittances. Also, additional capital buffers are needed to cope with loan portfolio dollarization issues.
53. NBGs solvency ST framework is very comprehensive, relies on micro data, but can be further refined by including profitability and bank-by-bank credit loss satellite models. NBG developed a very comprehensive and advanced ST framework. It is based on several components: a macro ST model that links NPLs with key macro variables, an enterprise ST model that uses information about individual loans (large exposures) and samples from retail, and SME loan portfolios of individual banks. All these models give the NBG flexibility to analyze credit risk in the banking system. At the same time, there are several key issues that need to be addressed:
Models for forecasting income and credit growth need to be developed. Profit before loan portfolio losses have a high impact on banks’ CAR. High profitability might completely offset losses from the loan portfolio quality deterioration; at the same time, some of these profits might be just accrued but not received as cash income. The NBG also needs to look deeper at developments with net interest margins, fees, and commissions income;
Existing ST model needs to be recalculated using either static panel and OLS or dynamic panel and GMM. The NBG developed a parallel model that monitors credit quality of large corporations. In doing so, NPLs from loans to large corporates shall be excluded from the satellite model, as there is a high possibility of double counting losses (adding both losses leads to portfolio overlap as some exposures are counted twice);
Existing credit risk ST model shall include links with liquidity STs. The simplest link is via inverse yield curve, i.e., higher funding costs and lower net interest margin. The ST scenarios thus can include assumptions about adverse developments in funding markets (behavior of depositors, especially nonresident ones) which lead to increase in short-term interest rates; and
Following the introduction of Basel II and some of the Basel III elements, the ST model shall include assumptions about migration of risk weights and in the future – concept of economic capital. While data on PDs and LGDs are absent at this point in time, the NBG can develop a strategy on how to address the data gap and start collecting relevant information from banks and other public sources. If the NBG chooses to allow banks using IRB-based approaches for CAR calculation, such data could support model validation, ICAAP, SREP, and ICG procedures.
GEORGIA
34 INTERNATIONAL MONETARY FUND
54. Banks’ ability to perform comprehensive bottom-up STs is limited so far. Bottom-up ST results reveal that banks need additional investments and guidance on macro STs: develop models, calibrate and use for capital allocation and risk management process. Bottom-up ST results are of limited use so far as banks struggle to incorporate macro shock scenarios into credit portfolio loss calculations. The NBG’s decision to develop a comprehensive in-house ST framework that uses micro data does not release banks from the need to have their own models in place.
INDIVIDUAL LIQUIDITY AND NETWORK STRESS TESTS A. Models
55. The liquidity STs examine banks’ resilience to liquidity shocks, including foreign currency and external funding. This test is based on both gross and net liquidity mismatch positions. Liquidity STs were carried out by the NBG under IMF-designed scenarios and included all banks in the system.
56. The liquidity ST model is based on a simple implied cash flow balance sheet approach. The NBG’s liquidity reporting framework does not allow using fully pledged cash-flow-based approach, as liquidity reporting is not based on contractual and behavioral cash flows (full maturity ladder reporting). However, available data allowed for a comprehensive simulation of outflows under various scenarios, including GEL and FX withdrawals and withdrawal of nonresident deposits.
57. STs address both funding and market liquidity. Market liquidity assumptions are incorporated into haircuts used to estimate the value of highly liquid assets under market stress conditions (fire-sale of assets): liquidation value (in percent) of deposits held at domestic banks, domestic government securities, domestic bonds, and other liquid assets is 60 percent (haircut of 40 percent). Funding liquidity shocks are incorporated using two main sources of funding liquidity risks: (i) retail funding - deposit withdrawals of residents and nonresident (separately and combined); and (ii) wholesale funding – residents and nonresidents, including funding from parent banks.
58. Contagion risks are estimated by the NBG using interbank market data. Interbank market activity in Georgia is still relatively shallow and does not constitute a significant source of financing or liquidity management tool for banks. At the same time, contagion effects via market prices are limited as government securities dominate in banks’ investment portfolios and their trading books are small. Hence, contagion risks were estimated using a simple balance sheet exposure-based network model. There is no second round or higher round spillover effects beyond direct losses due to credit exposures.

GEORGIA
INTERNATIONAL MONETARY FUND 35
B. Results
59. Results reveal that market risks due to loss of wholesale funding are manageable. Liquidity ST scenario 1 assumes various types of overnight wholesale liquidity withdrawal. ST results show that none of the banks face liquidity shortages in both, domestic and foreign currencies (Table 7).
60. The banks are mostly sensitive to retail funding risk, i.e., deposit withdrawals from residents and nonresidents. Scenario 2(B) assumes (irrespective of the currency of denomination and maturity of these deposits) withdrawal of 30 percent of residents deposits, 80 percent of nonresidents deposits, including foreign bank deposits and 100 percent of domestic interbank deposits. This scenario uses 5 day withdrawal period and is based on shock which is higher than the largest withdrawal of deposits observed in the last decade. It was found that 12 banks might need additional liquidity support in FX, while only one bank would fail under GEL liquidity shock. It should be noted, that taking into account total liquidity, only six banks would fail (i.e., liquidity shortages in FX would be offset by liquidity in GEL).
61. Overall, individual bank liquidity ST results suggest that while banks can withstand relatively high liquidity shocks, some of them face challenges to maintaining positive cash flows in foreign currencies during extreme adverse bank run scenarios. The most severe impact comes from the withdrawal of wholesale and retail funding in foreign currency: one systemically important bank and several small banks need additional liquidity support. The exercise suggests that foreign currency funding risks need to be monitored closely and NBG should continue its “larization” policy.
Table 7. Georgia: Liquidity Stress Test Results Sum of Liquidity Shortages Number of Banks with Shortages
GEL FX Total 1/ GEL FX Total 1/
Scenario 1(A)
Scenario 1(B)
Scenario 1(C)
Scenario 2 (A) (84,562,201) (10,356,295) 4 1
Scenario 2 (B) (2,148,134) (568,108,734) (114,909,709) 1 12 6
Scenario 3 (A) (85,151,709) (10,356,295) 4 1
Scenario 3 (B) (88,964,799) (10,356,295) 5 1
Scenario 3 (C) (87,509,744) (10,356,295) 4 1 1/ Based on total liquidity, i.e., including domestic and FX reserves.
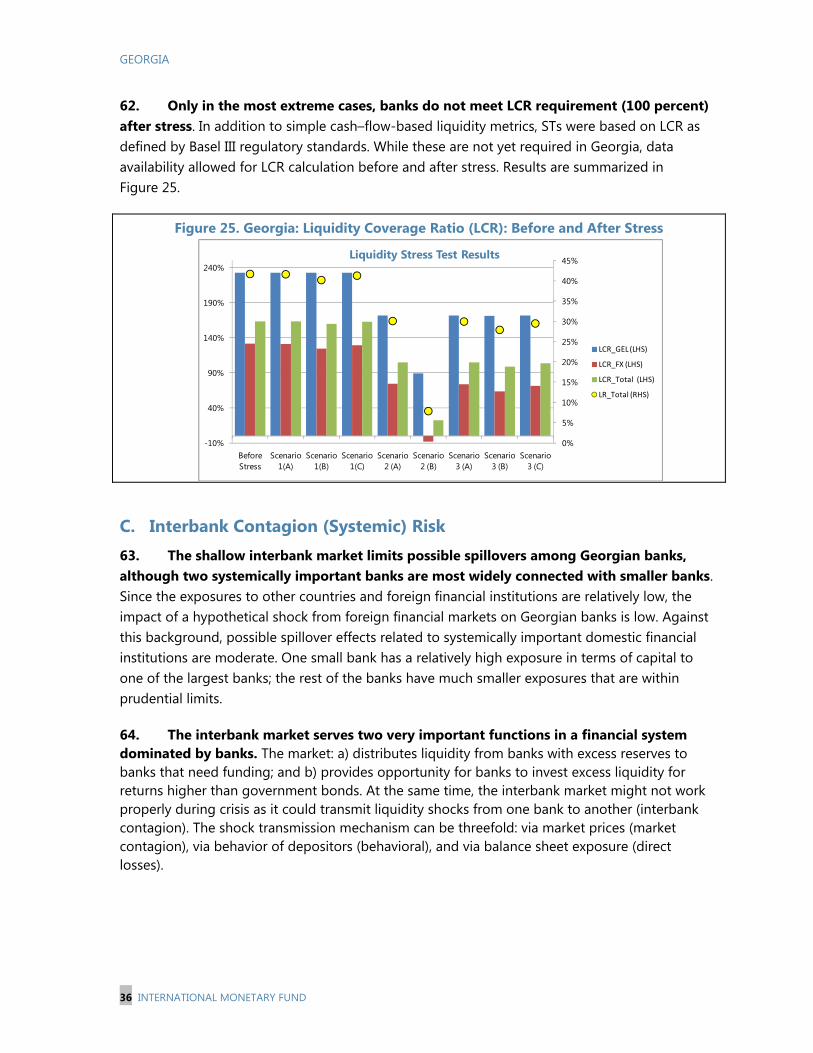
GEORGIA
36 INTERNATIONAL MONETARY FUND
0%
5%
10%
15%
20%
25%
30%
35%
40%
45%
-10%
40%
90%
140%
190%
240%
Before Stress
Scenario 1(A)
Scenario 1(B)
Scenario 1(C)
Scenario 2 (A)
Scenario 2 (B)
Scenario 3 (A)
Scenario 3 (B)
Scenario 3 (C)
Liquidity Stress Test Results
LCR_GEL (LHS)
LCR_FX (LHS)
LCR_Total (LHS)
LR_Total (RHS)
62. Only in the most extreme cases, banks do not meet LCR requirement (100 percent) after stress. In addition to simple cash–flow-based liquidity metrics, STs were based on LCR as defined by Basel III regulatory standards. While these are not yet required in Georgia, data availability allowed for LCR calculation before and after stress. Results are summarized in Figure 25.
Figure 25. Georgia: Liquidity Coverage Ratio (LCR): Before and After Stress
C. Interbank Contagion (Systemic) Risk 63. The shallow interbank market limits possible spillovers among Georgian banks, although two systemically important banks are most widely connected with smaller banks. Since the exposures to other countries and foreign financial institutions are relatively low, the impact of a hypothetical shock from foreign financial markets on Georgian banks is low. Against this background, possible spillover effects related to systemically important domestic financial institutions are moderate. One small bank has a relatively high exposure in terms of capital to one of the largest banks; the rest of the banks have much smaller exposures that are within prudential limits.
64. The interbank market serves two very important functions in a financial system dominated by banks. The market: a) distributes liquidity from banks with excess reserves to banks that need funding; and b) provides opportunity for banks to invest excess liquidity for returns higher than government bonds. At the same time, the interbank market might not work properly during crisis as it could transmit liquidity shocks from one bank to another (interbank contagion). The shock transmission mechanism can be threefold: via market prices (market contagion), via behavior of depositors (behavioral), and via balance sheet exposure (direct losses).

GEORGIA
INTERNATIONAL MONETARY FUND 37
Figure 26. Georgia: Interbank Market Network
Source: NBG calculations
65. In transition economies like Georgia, only the two latter channels are usually important, namely contagion via behavior of depositors, and direct losses in case one or more systemically important banks fail. In 2008, the banking system experienced one such episode, when loss of confidence in the banking system led to almost 13 percent deposit withdrawal. The interbank market was literally shut down. NBG data shows that there are two systemically important banks that attract excess liquidity from smaller market players (Figure 20). The interbank structure reveals that these two banks have relationships with almost all banks in the system. Interbank market ST was based on assumptions what happens if one of the systemically important banks faces liquidity/solvency issues. The results revealed that: a) four small banks might not be able to meet minimum CAR were one of the systemically banks to fail; b) there is little balance sheet contagion effect between systemically important banks. In one case, single counterparty risk for small banks exceeds 100 percent of their regulatory capital. While PD for systemically important banks is low, some of the smaller banks need to improve their risk management practice and impose prudential exposure limits to a single counterparty (as a percentage of their own capital.
D. Recommendations
66. Liquidity ST results reveal that banks’ liquidity is resilient to the extreme shocks, albeit additional precautionary liquidity buffers might be needed to cope with FX funding risks. In case of a system-wide deposit run, the NBG has limited ability to support banks in USD. In Q1 2014 NBG had US$2.3 billion as official reserves. Hence, it is not obvious how much of these reserves can actually be used to support banks without severely affecting FX rate.
GEORGIA
38 INTERNATIONAL MONETARY FUND
67. The NBG has an adequate liquidity ST and monitoring framework and is able to calculate LCR for individual banks, but liquidity ST framework needs to be refined. An effective framework for monitoring individual and systemic liquidity risks should be based on an extensive maturity ladder-based reporting system. Such a system includes data about behavioral and contractual cash flows in both GEL and FX (mainly USD) currencies. The NBG indicated that it is working on this, but that it is not part of the liquidity ST framework yet. The new reporting framework might be based on EU example and would allow NBG to better detect individual bank’s liquidity issues16. Cash flow based liquidity stress testing shall evaluate banks funding risks in different currencies and allows to test various types of scenarios which might be not available under concise LCR or balance sheet based reporting17.
68. Links between solvency and liquidity risks should be based on scenarios that involve higher funding costs due to withdrawal of retail deposits. While such scenarios are not very likely, they represent tail-risk events and better capture losses in the financial system. Such scenarios were observed in countries which, to a greater or lesser extent, relied on wholesale and retail funding from nonresidents.
16 Similar reporting framework is being implemented in the EU, for example CRD IV amends COREP reporting requirements by including LC 1.1, LC 1.2, LC 1.3 reporting forms. EU’s Capital Requirement Regulation allows for further enhancement of liquidity reporting (para 426). 17 For further examples see Schmieder et al (2012) Next Generation System-Wide Liquidity Stress Testing. IMF WP 12/03.

GEORGIA
INTERNATIONAL MONETARY FUND 39
Appendix I. Statistical Annex
Georgia: Stress Tests, Baseline Scenario

GEORGIA
40 INTERNATIONAL MONETARY FUND
Georgia: Stress Tests, Mild Recession

GEORGIA
INTERNATIONAL MONETARY FUND 41

GEORGIA
42 INTERNATIONAL MONETARY FUND
Georgia: Stress Tests, Extreme Recession
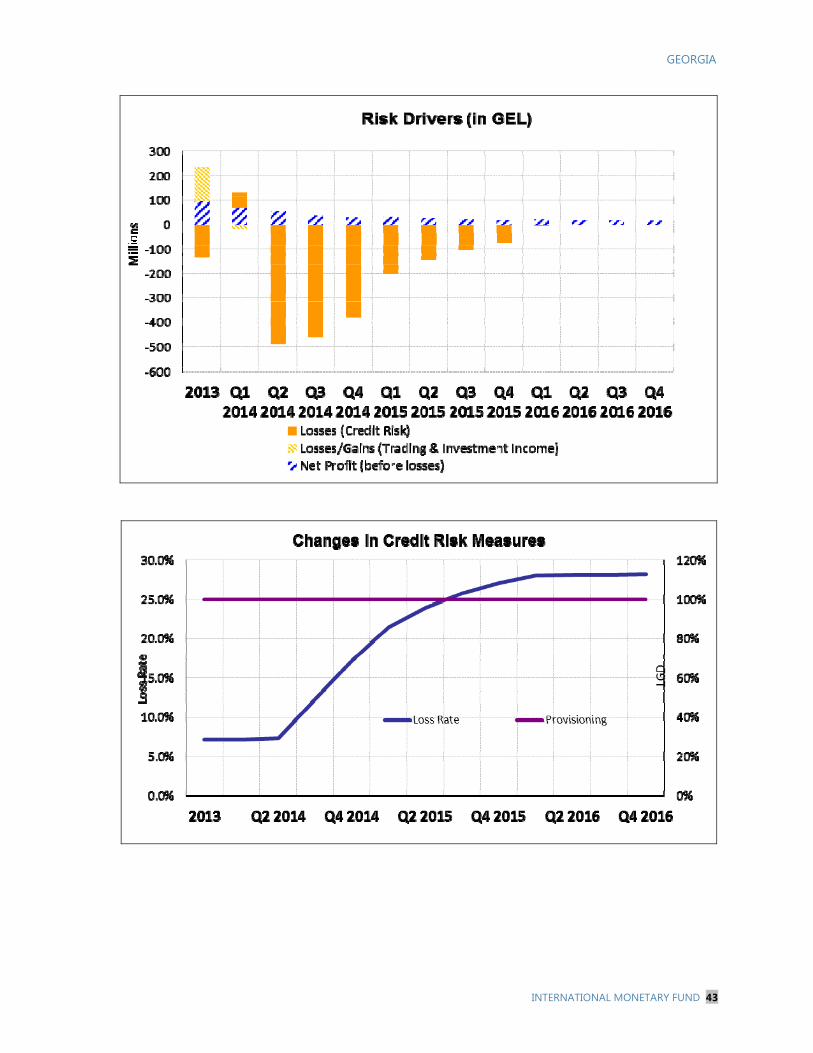
GEORGIA
INTERNATIONAL MONETARY FUND 43

GEORGIA
44 INTERNATIONAL MONETARY FUND
Georgia: Liquidity Stress Test Results: Liquidity Surplus/Shortfall

GEORGIA
INTERNATIONAL MONETARY FUND 45
Georgia: Liquidity Stress Test Results: Number of Banks with Liquidity Shortages
Georgia: Liquidity Stress Test Results: Sum of Shortages

GEORGIA
46 INTERNATIONAL MONETARY FUND
Appendix II. Stress Test Matrix Solvency and Liquidity Risks and Network Effects
Solvency Risk Stress Tests
Scope
Assumptions Bottom-Up by
Banks Top-Down by the NBG Top-Down by FSAP Team Institutions included
4 largest banks: Bank of Georgia, TBC Bank, ProCredit Bank, Liberty Bank
All banks
All banks
Market share 73 percent 100 percent 100 percent Data Banks’ own data Supervisory data Supervisory and public data Stress test horizon
2 years: 2014–2015 3 years: 2014–2016 3 years: 2014–2016
Methodology Banks’ own methodology for single-factor sensitivity analysis. Each bank used its own methodology, and in most of the cases this was simple sensitivity analysis.
NBGs’ own balance sheet model. Satellite model was used for credit losses and sensitivity model for net income.
Modified Next Generation Balance Sheet Model for balance sheet calculations. Satellite models for credit risk and sensitivity model for net income.
Shock scenarios Scenarios defined by the IMF team. Different from final ones used in the FSAP as bottom up scenarios were circulated to banks before final scenarios were amended based on NBG request.
Scenarios are the same as defined by the IMF team.
Slowdown in global economic growth against a baseline from April 2014 WEO projections. Sizes of GDP shocks are estimated from various macro shocks, including export revenue decline and slowdown in public and consumer spending. Regional shift in risk appetite leads to withdrawal of nonresident deposits and increase in funding costs for banks. Higher interest rates pass through to higher loan interest rates and credit losses. Single-factor shocks: Asset quality deterioration default of up to the three largest borrowers).
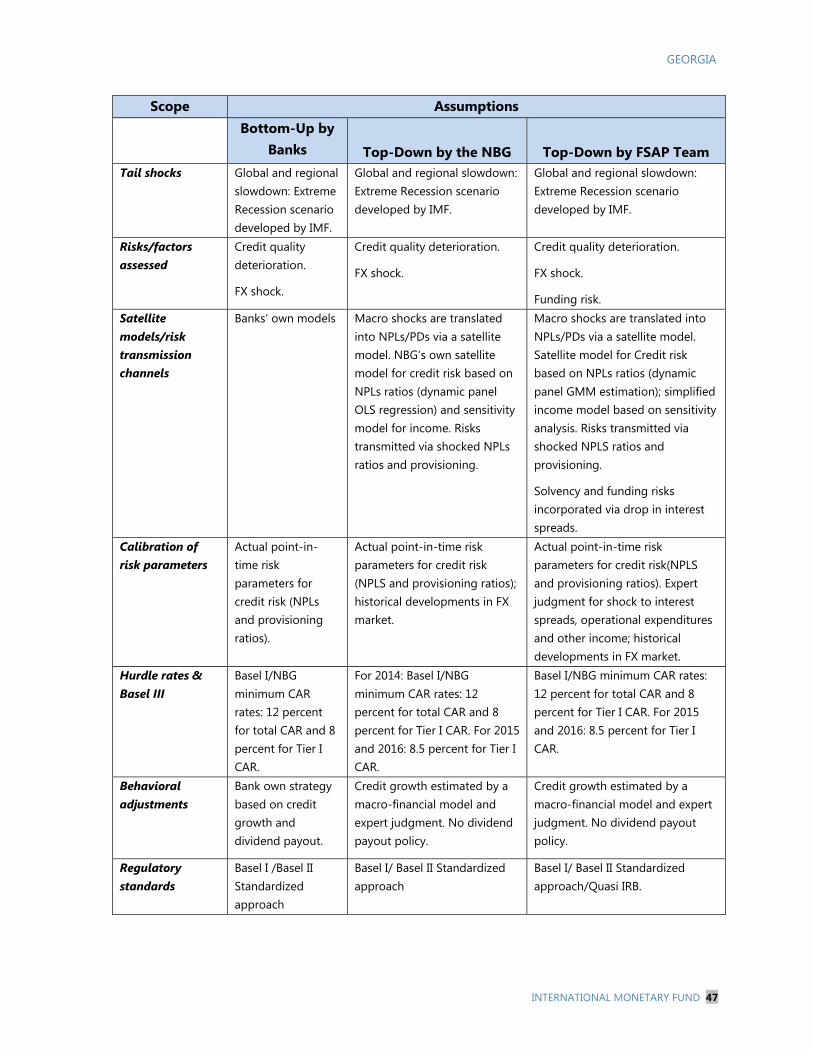
GEORGIA
INTERNATIONAL MONETARY FUND 47
Scope Assumptions Bottom-Up by
Banks Top-Down by the NBG Top-Down by FSAP Team Tail shocks Global and regional
slowdown: Extreme Recession scenario developed by IMF.
Global and regional slowdown: Extreme Recession scenario developed by IMF.
Global and regional slowdown: Extreme Recession scenario developed by IMF.
Risks/factors assessed
Credit quality deterioration.
FX shock.
Credit quality deterioration.
FX shock.
Credit quality deterioration.
FX shock.
Funding risk. Satellite models/risk transmission channels
Banks’ own models Macro shocks are translated into NPLs/PDs via a satellite model. NBG’s own satellite model for credit risk based on NPLs ratios (dynamic panel OLS regression) and sensitivity model for income. Risks transmitted via shocked NPLs ratios and provisioning.
Macro shocks are translated into NPLs/PDs via a satellite model. Satellite model for Credit risk based on NPLs ratios (dynamic panel GMM estimation); simplified income model based on sensitivity analysis. Risks transmitted via shocked NPLS ratios and provisioning.
Solvency and funding risks incorporated via drop in interest spreads.
Calibration of risk parameters
Actual point-in-time risk parameters for credit risk (NPLs and provisioning ratios).
Actual point-in-time risk parameters for credit risk (NPLS and provisioning ratios); historical developments in FX market.
Actual point-in-time risk parameters for credit risk(NPLS and provisioning ratios). Expert judgment for shock to interest spreads, operational expenditures and other income; historical developments in FX market.
Hurdle rates & Basel III
Basel I/NBG minimum CAR rates: 12 percent for total CAR and 8 percent for Tier I CAR.
For 2014: Basel I/NBG minimum CAR rates: 12 percent for total CAR and 8 percent for Tier I CAR. For 2015 and 2016: 8.5 percent for Tier I CAR.
Basel I/NBG minimum CAR rates: 12 percent for total CAR and 8 percent for Tier I CAR. For 2015 and 2016: 8.5 percent for Tier I CAR.
Behavioral adjustments
Bank own strategy based on credit growth and dividend payout.
Credit growth estimated by a macro-financial model and expert judgment. No dividend payout policy.
Credit growth estimated by a macro-financial model and expert judgment. No dividend payout policy.
Regulatory standards
Basel I /Basel II Standardized approach
Basel I/ Basel II Standardized approach
Basel I/ Basel II Standardized approach/Quasi IRB.
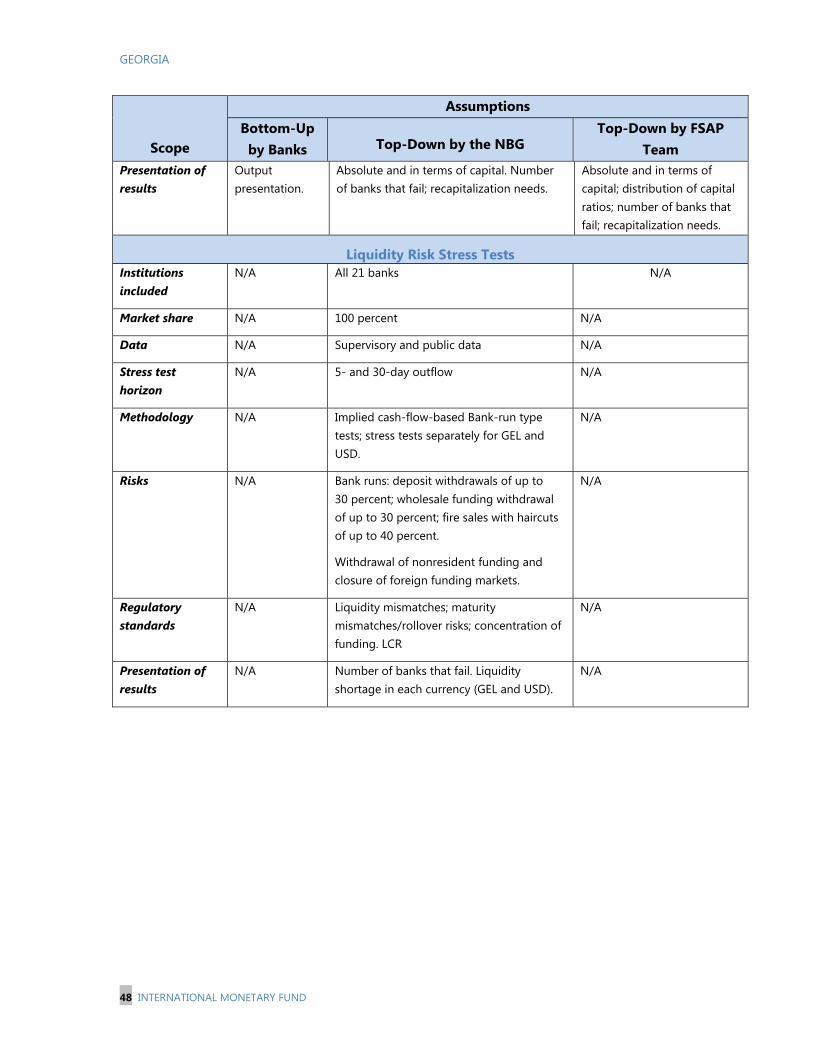
GEORGIA
48 INTERNATIONAL MONETARY FUND
Scope
Assumptions Bottom-Up by Banks Top-Down by the NBG
Top-Down by FSAP Team
Presentation of results
Output presentation.
Absolute and in terms of capital. Number of banks that fail; recapitalization needs.
Absolute and in terms of capital; distribution of capital ratios; number of banks that fail; recapitalization needs.
Liquidity Risk Stress Tests Institutions included
N/A All 21 banks N/A
Market share N/A 100 percent N/A
Data N/A Supervisory and public data N/A
Stress test horizon
N/A 5- and 30-day outflow N/A
Methodology N/A Implied cash-flow-based Bank-run type tests; stress tests separately for GEL and USD.
N/A
Risks N/A Bank runs: deposit withdrawals of up to 30 percent; wholesale funding withdrawal of up to 30 percent; fire sales with haircuts of up to 40 percent.
Withdrawal of nonresident funding and closure of foreign funding markets.
N/A
Regulatory standards
N/A Liquidity mismatches; maturity mismatches/rollover risks; concentration of funding. LCR
N/A
Presentation of results
N/A Number of banks that fail. Liquidity shortage in each currency (GEL and USD).
N/A
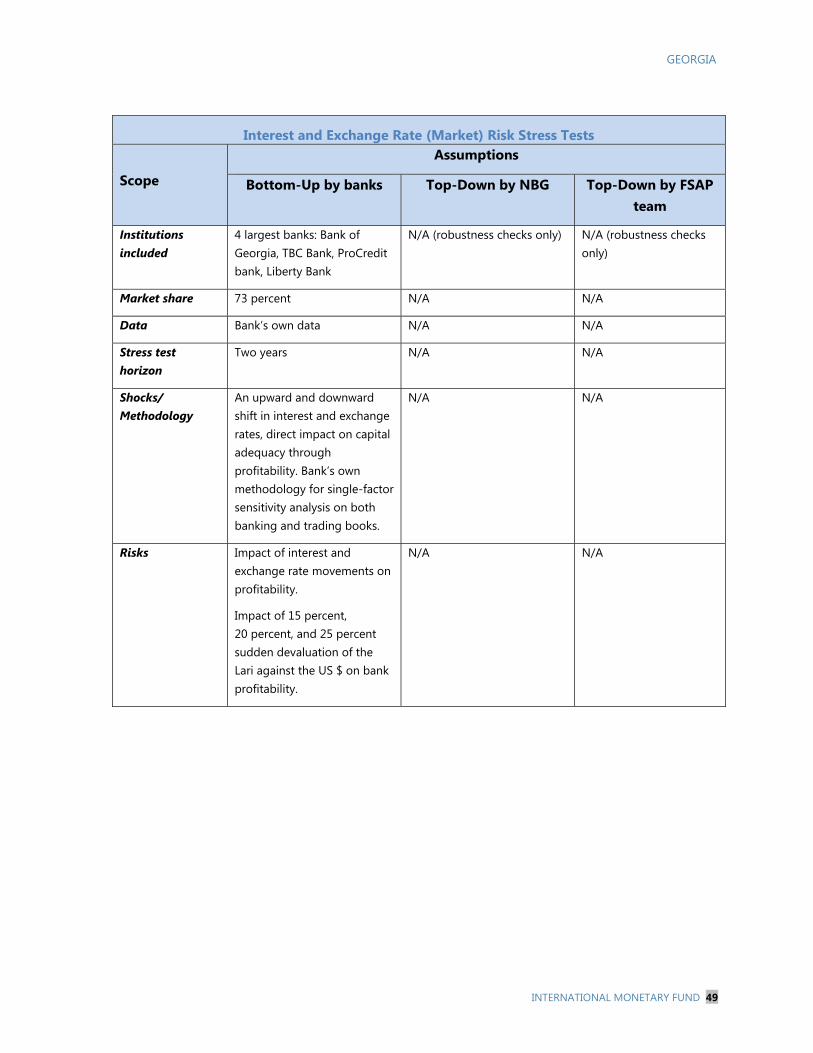
GEORGIA
INTERNATIONAL MONETARY FUND 49
Interest and Exchange Rate (Market) Risk Stress Tests
Scope
Assumptions
Bottom-Up by banks Top-Down by NBG Top-Down by FSAP team
Institutions included
4 largest banks: Bank of Georgia, TBC Bank, ProCredit bank, Liberty Bank
N/A (robustness checks only) N/A (robustness checks only)
Market share 73 percent N/A N/A
Data Bank’s own data N/A N/A
Stress test horizon
Two years N/A N/A
Shocks/ Methodology
An upward and downward shift in interest and exchange rates, direct impact on capital adequacy through profitability. Bank’s own methodology for single-factor sensitivity analysis on both banking and trading books.
N/A N/A
Risks Impact of interest and exchange rate movements on profitability.
Impact of 15 percent, 20 percent, and 25 percent sudden devaluation of the Lari against the US $ on bank profitability.
N/A N/A

GEORGIA
50 INTERNATIONAL MONETARY FUND
Appendix III. Top-Down Satellite Model for Credit Risk: IMF Approach
Specification of Satellite Model for Losses
Selection of proxy PDs. The FSAP model allows selection of various types of proxies for PDs: (i) nonperforming loans (NPLs) ratio (by default, NPLs ratio are stock measure; to come up with flow-based, forward-looking PDs we used differences of NPLs ratios between period t1 and t0, i.e., flow of NPLs); (ii) loan-loss provisions (LLPs); and (iii) loan write-offs. Historical bank-by-bank data are available for all variables, while NPLs ratios are also available on a sectoral basis. By definition, a loan is counted as nonperforming if it is past-due more than 90 days. LLPs are loan-loss provisions made taking into account collateral (i.e., provisioning amount varies from 30 percent to 100 percent based on days past due and collateral). Loan-write offs are net, i.e., after loan recoveries. All three variables exhibit similar behavior during the period of 2006–2013 (Figure 1), although write-offs are more volatile, as they are subject to on-off factors (like loan recoveries).
Figure 1. Georgia: Comparing NPLs, LLPs and Write-Offs
Source: NBG data and IMF calculations
For econometric calculation purposes, NPLs ratios were transformed into logit format to allow for non-linearity, as well as to limit the values of PDs strictly between zero and 1.1 Finally, the model was specified as follows:
titF
k
FtFti CXMcLNPLs
,
1,,

GEORGIA
INTERNATIONAL MONETARY FUND 51
Where LNPLs i,t denotes logit transformed NPLs ratio for bank i in quarter t, c is a constant term; βF,t denotes the elasticity of the impact of various macro factors MF,t at time period t; CXi – fixed effect for each individual bank i, and εt stands for an error term.
Regression covers quarterly macroeconomic data from 2006 Q2 till 2013 Q4 (477 observations that include 18 banks). Three individual banks’ NPLs ratios were either too short or too noisy to be included in calculations; hence, regression was based on data for 18 banks. Final regression specification obtained is as follows:
LNPLS = -1.5 + 0.7*LNPLS(-1) + 0.056*LINT - 0.033*GDP_R(-1) + CXi
Where LNPLs denote logit transformed NPLs ratio; LINT – long-term interest rate; GDP_R – real GDP rate growth and CXi – individual fixed effect for each bank.
The Generalized Methods of Moments (GMM) estimation method with fixed effects was used for the analysis. Inclusion of the autoregressive term made the panel dynamic, and, therefore, the panel GMM estimation technique (see Arellano M, S. Bond (1991)) was applied. This is a different approach from the top-down model employed by the NBG, where the dynamic panel is based on Ordinary Least Squares (OLS). To account for heteroscedasticity among cross-sections and observations in time and to obtain more robust estimation, white cross-section weighting was applied.
Further statistics on the obtained equation:
Dependent Variable: LNPLS
Method: Panel Generalized Method of Moments
Date: 05/26/14 Time: 14:32
Sample (adjusted): 2006Q2 2013Q4
Periods included: 31
Cross-sections included: 18
Total panel (unbalanced) observations: 477
White cross-section instrument weighting matrix
Instrument specification: C LNPLS(-2) LINT(-1) GDP_R(-2)
Constant added to instrument list
Variable Coefficient Std.
Error t-Statistic Prob.
C -1.50348 0.469758 -3.20055 0.0015
LNPLS(-1) 0.704018 0.063139 11.15028 0
LINT 0.056502 0.027949 2.021597 0.0438
GDP_R(-1) -0.0335 0.012568 -2.66516 0.008

GEORGIA
52 INTERNATIONAL MONETARY FUND
Effects Specification
Cross-section fixed (dummy variables)
R-squared 0.824392 Mean dependent var
-2.5949
Adjusted R-squared
0.816689 S.D. dependent var 1.395594
S.E. of regression
0.59752 Sum squared resid 162.806
Durbin-Watson stat
1.820923 J-statistic 2.26E-20
Instrument rank
21
Sensitivity model for income
The FSAP team used a simplified approach based on multiple back-of-the envelope calculations to overcome difficulties related to interest income modeling.18 It is difficult to build and calibrate a specific satellite model for banks’ profitability in a limited data environment; hence, simple back-of-the envelope calculations were used to calculate forecasted net interest income. A shock in interest rates has two main effects on banks’ income: a direct effect via net interest income and loan-loss provisions due to decline in loan portfolio quality (indirect effect). The direct effect comes from net interest spread, i.e., difference between average lending and deposit interest rates. Deposits are the main funding sources of banks in Georgia and, thus, interest paid on deposits represents funding costs. It is important to notice that while there is some competition in the market among banks, competition with nonbanks is virtually nonexistent, i.e., banks’ customers have very few alternatives to deposits other than keeping cash. Without indirect effects, net interest income and the net interest spread can be forecasted using the following equations:
Net interest income=Loan interest rate*Loan amount*(1+%Change in loan portfolio) – Deposit interest rate*Deposit amount*(1+%Change in deposit amount)
Net interest spread = Average loan interest rate – average deposit interest rate
While arithmetic behind net interest income calculations is simple and straightforward, it is difficult to forecast every item, i.e., loans, deposits, spreads, etc. The FSAP made simplified assumptions that net spread will not change (i.e., there will be no liquidity type of events in the banking system) for baseline scenarios. For mild scenarios and for extreme scenarios, the net
18 Indeed, it might be useful to build in the future a separate econometric model for income. Limited data availability and limited amount of time prevented the FSAP team from working on this. Sensitivity tests for income use results derived from a loss model, i.e., amount of loans that are nonperforming do not generate income, and scenario assumptions, i.e., squeezing of net interest margins.

GEORGIA
INTERNATIONAL MONETARY FUND 53
interest rate spread will fall by 1 p.p. and 2 p.p. respectively. Scenario calibration is based on events observed during the 2008-09 crisis. There are two caveats here: (i) banks have access to NBG liquidity facilities, and can obtain emergency funding; this might limit their need to raise interest rates on deposits for some period of time; and (ii) net income is derived not from simple arithmetic averages, but involves more complex maturity transformation process, i.e., ideally, assets and liabilities should be grouped into different maturity buckets and developments forecasted for each item. The simplified approach avoids this complexity, i.e., we use just change in net spread and change in loans that generate net interest income (credit growth for baseline and decline for adverse scenarios respectfully).
In the simplified model, the FSAP team assumed that the deposit amount would not change during a stress test horizon. The amounts of loans will either go up by credit growth or down by the proportion of increase in NPLs and deposits would not change. Average duration of both loans and deposits is relatively short in Georgia, therefore we assumed that pass-through of shock in increase in loan and/or deposit interest rates are instant. Finally, shocked net interest spread for each individual bank i is calculated as follows:
Shocked net interest spreadi = net interest spreadi + shock to net interest margin
The next step is to link net interest income with shock in NPLs, i.e., assuming that NPLs do not generate any interest income. We assume that loan amount change is equal to:
Change in loan portfolioi =
1
1
Finally, net income before loan-loss provisions is calculated as follows:
∗ ∗ 1
PercentagechangeinNetFeesandcommissionsincome 1
We assumed that non-interest income will decline by -15 percent for the mild shock and -30 percent for the extreme shock. The calibration was simple: during 2008–09 crisis non-interest income in the Georgian banking system declined by -31 percent for the month of July 2009 vs. July 2008 (average annual decline was 15 percent). OPEX in the same period declined by minus 13 to minus 20 percent; however, to account for relative rigidity, they were left unchanged for both shock scenarios and with half the average growth rate for the period (2005–
GEORGIA
54 INTERNATIONAL MONETARY FUND
2013)—12.5 percent for the baseline scenario19. Moreover, some banks had negative net fees and commission income and very high operating expenses. As this might be driven by on/off factors (for instance, for newly established banks), we assumed that banks with negative net fees and commissions income will have zero net fees and commissions income for the baseline scenario, and current negative levels for shock scenarios.
I. Alternative Stress Test: Basel II Standardized Approach.
Introduction of Basel II would allow banks to unfreeze significant amounts of capital. The alternative ST Approach was based on the assumption that Georgia implements Basel II by the end of this year; hence, it is important to estimate Basel II impact on banks’ CAR. The Basel II standardized approach would allow banks to save capital by having lower risk weights on most of the exposures. While precise exposure class mapping was not available during the FSAP mission, an assumption was made that most of the asset classes would fall under 50 percent risk-weight category. This is a significant reduction compared with current 100 percent weights for loans in GEL, and 175 percent for loans in U.S. dollars and other foreign currencies. An additional source of capital (and decline in provisioning levels) would be full introduction of the IFRS 39th standard (IFRS 9th standard in the future), i.e., allowing banks to reduce provisioning levels by deducting fair value of collateral (fair value of hedge).
Off-balance sheet exposures were included in credit loss calculations. Average CCF factor which was used for Basel II Standardized approach is 35 percent. While Basel II reduced risk weights significantly, adding off-balance sheet exposure increased amount of possible loan portfolio losses. It should be noted, that overall off-balance sheet exposure varies bank by bank significantly: from 0 percent to almost 50 percent from total credit exposure.
All other assumptions are the same as in the Basel I based ST. Income, balance sheet projections, hurdle rates and other factors are the same as in Basel I ST model.
19 Fifty percent of the growth rate was based on assumptions that credit growth will slow down compared to previous periods, hence, banks need to hire less staff, etc.
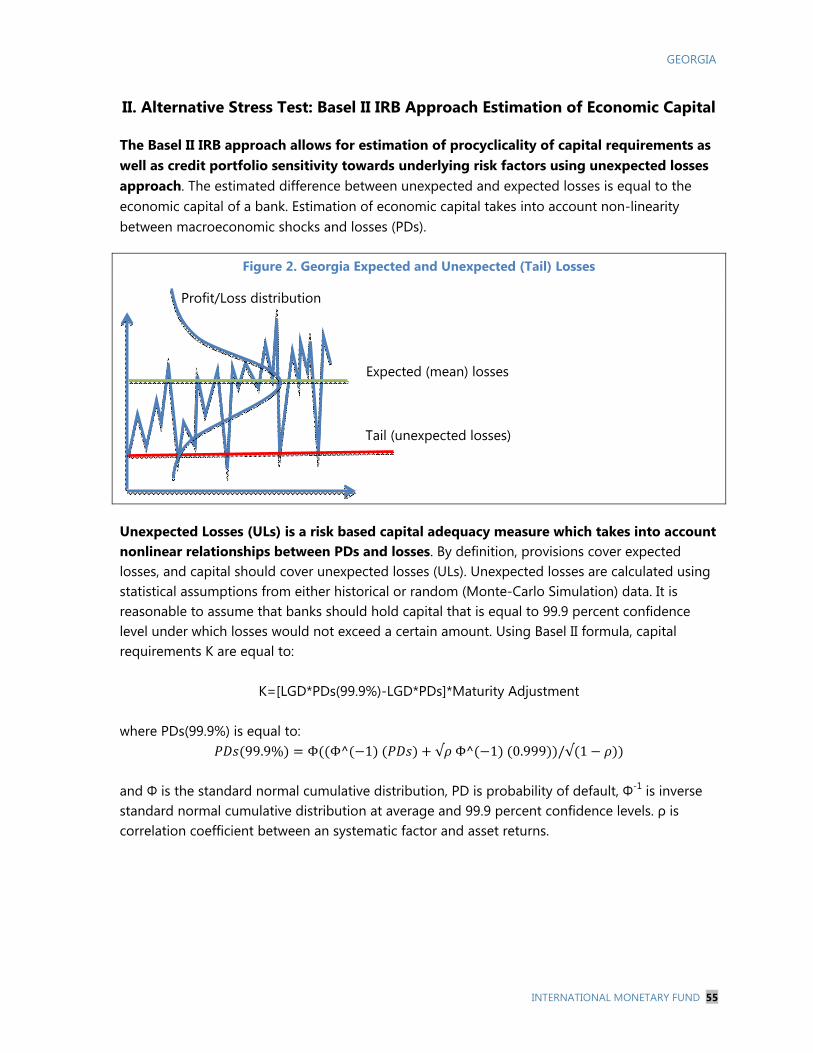
GEORGIA
INTERNATIONAL MONETARY FUND 55
II. Alternative Stress Test: Basel II IRB Approach Estimation of Economic Capital
The Basel II IRB approach allows for estimation of procyclicality of capital requirements as well as credit portfolio sensitivity towards underlying risk factors using unexpected losses approach. The estimated difference between unexpected and expected losses is equal to the economic capital of a bank. Estimation of economic capital takes into account non-linearity between macroeconomic shocks and losses (PDs).
Figure 2. Georgia Expected and Unexpected (Tail) Losses
Unexpected Losses (ULs) is a risk based capital adequacy measure which takes into account nonlinear relationships between PDs and losses. By definition, provisions cover expected losses, and capital should cover unexpected losses (ULs). Unexpected losses are calculated using statistical assumptions from either historical or random (Monte-Carlo Simulation) data. It is reasonable to assume that banks should hold capital that is equal to 99.9 percent confidence level under which losses would not exceed a certain amount. Using Basel II formula, capital requirements K are equal to:
K=[LGD*PDs(99.9%)-LGD*PDs]*Maturity Adjustment
where PDs(99.9%) is equal to:
99.9% Φ Φ^ 1 √ Φ^ 1 0.999 /√ 1 and Φ is the standard normal cumulative distribution, PD is probability of default, Φ-1 is inverse standard normal cumulative distribution at average and 99.9 percent confidence levels. ρ is correlation coefficient between an systematic factor and asset returns.
Tail (unexpected losses)
Expected (mean) losses
Profit/Loss distribution

GEORGIA
56 INTERNATIONAL MONETARY FUND
PDs were defined as the amount of write-offs divided by total amount of NPLs.20 Because none of the banks apply or are allowed to apply IRB models, “true” PDs are not available. Using NPLs as proxy for PDs makes little sense, as these are too high. The FSAP mission calibrated proxy PDs using loan write-off data. While write-offs are noisy (see Figure 7), their dynamics fits into the same cycle (without substantial lag effects) as NPLs and LLPs. To link write-offs with NPL cycle, simple calibration method was used: based on historical data, average through-the-cycle ration between NPLs and write-offs was calculated:
∑ 2013 42006 1
3210.88%
where WR are write-offs per quarter, NPLs – level of NPLs in quarter i. Results show, that on average, 10.88 percent of NPLs are written-off per quarter. Based on this assumption, PDs were calculated using the following equation:
*10.88%where PDs are calculated for each bank i for each forecasted quarter t. This means, that proxy through-the-cycle PDs were changing in line with macro forecasts. To avoid situations when banks reported zero write-offs for a quarter, we used Basel II minimum transition PDs of 0.03 percent.
The LGD definition was based on World Bank data and the conservative approach adopted by the NBG. Similar to PDs, no data on LGD are available. To solve this problem, the FSAP mission used World Bank data on recovery ratios.21 In 2012, the recovery rate (RR) for Georgia was 33.6 percent, this means, that average proxy LGD is equal (1-RR)=66.4 percent. The alternative approach was based on NBG assumptions, that banks need to provision 100 percent of NPLs and do not take collateral into account. In addition to this, write-offs used as a proxy for PDs already include assumptions about 100 percent LGD (i.e., write-offs are net of collateral value). As both approaches have their advantages and shortcomings, both results are included in this report.
Portfolio correlation, maturity adjustments and other parameters. Based on data availability on a bank-by-bank basis, additional parameters based on structure of loan portfolio (corporate, retail, and SME positions) and average duration of it are included in calculations. Other parameters like granularity adjustment and correlation between PDs and LGDs are not included in the calculations.
20 PDs measured using this approach are biased as write-offs are flows and NPLs are stocks. Using this approach, quarterly stock of NPLs which is cumulative and increased by flows of new NPLs and reduced by flows of write-offs. The FSAP team however believes, that this bias is not significant as measure is through-the-cycle, i.e., 10.88 percent of stock of NPLs are written-off each quarter on average. 21 See WB database: http://www.doingbusiness.org/data/exploreeconomies/georgia#resolving-insolvency.

GEORGIA
INTERNATIONAL MONETARY FUND 57
All other assumptions are the same as in Basel I based ST. Income, balance sheet projections, hurdle rates, and other factors are the same as in Basel I ST model. Key differences between Basel I, Basel II Standardized and IRB modeling approaches are summarized in Table 1 below.
Key Differences between Stress Tests under Different Methodologies
Approach Basel I Basel II
Standardized Basel II IRB
PDs (Proxy PDs)
NPLs/Total portfolio NPLs/Total portfolio Write-Offs (flows)/Total portfolio
LGDs (provisioning ratios)
100% for Baseline and 100% for adverse
100% for Baseline and 100% for adverse
66.4% or 100% for both Baseline and adverse
Risk weights Current (100% and 175% for FX loans)
50% baseline scenario 100% adverse scenarios
Model based
Exposure at default
Net loan portfolio Net loan portfolio + CCF of 35%
Net Loan portfolio + CCF of 75%

GEORGIA
58 INTERNATIONAL MONETARY FUND
Appendix IV. Top-Down Satellite Model for Credit Risk: NBG Approach
Model Output:
Dependent Variable: LNPL Method: Panel Least Squares Date: 04/01/14 Time: 14:55 Sample (adjusted): 1999Q2 2013Q2 Periods included: 55 Cross-sections included: 7 Total panel (unbalanced) observations: 373
Variable Coefficient Std. Error t-Statistic Prob.
Constant -0.372200 0.086119 -4.321925 0.0000 D08 1.045368 0.189871 5.505677 0.0000
NPL(-1)/[1-NPL(-1)] 0.552825 0.048268 11.45328 0.0000 NPL(-2)/[1+NPL(-2)] 0.245319 0.047614 5.152210 0.0000
GDP_gr -0.020003 0.007711 -2.594221 0.0099 IR_diff_gr (-1) 0.000461 0.000148 3.101952 0.0021
Depr(-1)-inf(-1) 0.013544 0.004929 2.747813 0.0063
Effects Specification
Cross-section fixed (dummy variables)
R-squared 0.744591 Mean dependent var -2.546152 Adjusted R-squared 0.736078 S.D. dependent var 1.125299 S.E. of regression 0.578104 Akaike info criterion 1.776105 Sum squared resid 120.3136 Schwarz criterion 1.912782 Log likelihood -318.2436 Hannan-Quinn criter. 1.830378 F-statistic 87.45887 Durbin-Watson stat 1.902538 Prob(F-statistic) 0.000000
Elasticities: Short Term Long Term
GDP_gr -1.86 -9.89
IR_diff_gr 0.04 0.23
Depr(-1)-inf (-1) 1.26 6.7
NPL-Non Performing Loan D08-Dummy variable for 3-rd and 4th quarter of 2008 GDP_gr- Real GDP growt rate Depr- Depreciation rate (when there is appreciation this becomes 0) Inf-CPI inflation rate IR_diff_gr-Growth rate of interest rate difference between interest rates in national and foreign currency

GEORGIA
INTERNATIONAL MONETARY FUND 59
Appendix V. Risk Assessment Matrix
Overall Level of Concern Nature/Source of
Main Threats Likelihood of Severe Realization of Threat
Sometime in the Next Three Years Expected Impact on Financial Stability, if
Threat Is Realized Global financial conditions
Assessment: Medium Surges in global financial market volatility (related to UMP exit), leading to economic and fiscal stress, and constraints on country policy settings.
Assessment: Medium
The banking system is dominated by foreign banks, both from advanced and emerging economies, providing significant cross-border lending to local markets. Thus, higher international market volatility would affect the funding situation for the Georgian banks, both from parent banks and nonresident deposits.
In addition, tight funding conditions could affect some foreign banks in Georgia if parent banks accelerate deleveraging, hoard liquidity, and cut intergroup lending.
Slower growth in advanced and emerging economies
Assessment: Medium
Advanced economies: larger than expected deleveraging or negative surprises on potential growth.
Emerging markets: earlier maturing of the cycle and incomplete structural reforms leading to prolonged slower growth in combination with currency depreciation.
Assessment: Medium
A long period of slow growth in the world economy (and particularly in Georgia’s main trading partners) would hurt export volumes and GDP growth, resulting in higher NPLs, lower profitability, and potential solvency pressures in some institutions.
Currency depreciation in emerging countries could directly impact Georgia’s exports, boost unemployment, and widen the current account deficit, leading to higher debt burdens of borrowers and higher NPL levels.
Increasing geopolitical tensions
Assessment: High
Further increase of tensions in Ukraine, leading to disruptions in trade, remittances, and commodity markets.
Assessment: High
Economic uncertainty would reduce investment and GDP growth, undermining credit quality by constraining the ability of the corporate and household sectors to service their debt.
It may also lead to reversal of capital inflows, including nonresident deposits, leading to funding and liquidity difficulties for banks.
Capital outflow
shock
Assessment: Medium
Large nonresident deposits and external funding that make the financial sector vulnerable to shifts confidence. Reliance on nonresident deposits continues to be a source of concern.
Assessment: High
A sharp drawdown of nonresident deposits, triggered by a change in risk sentiment could create a funding and liquidity problem.
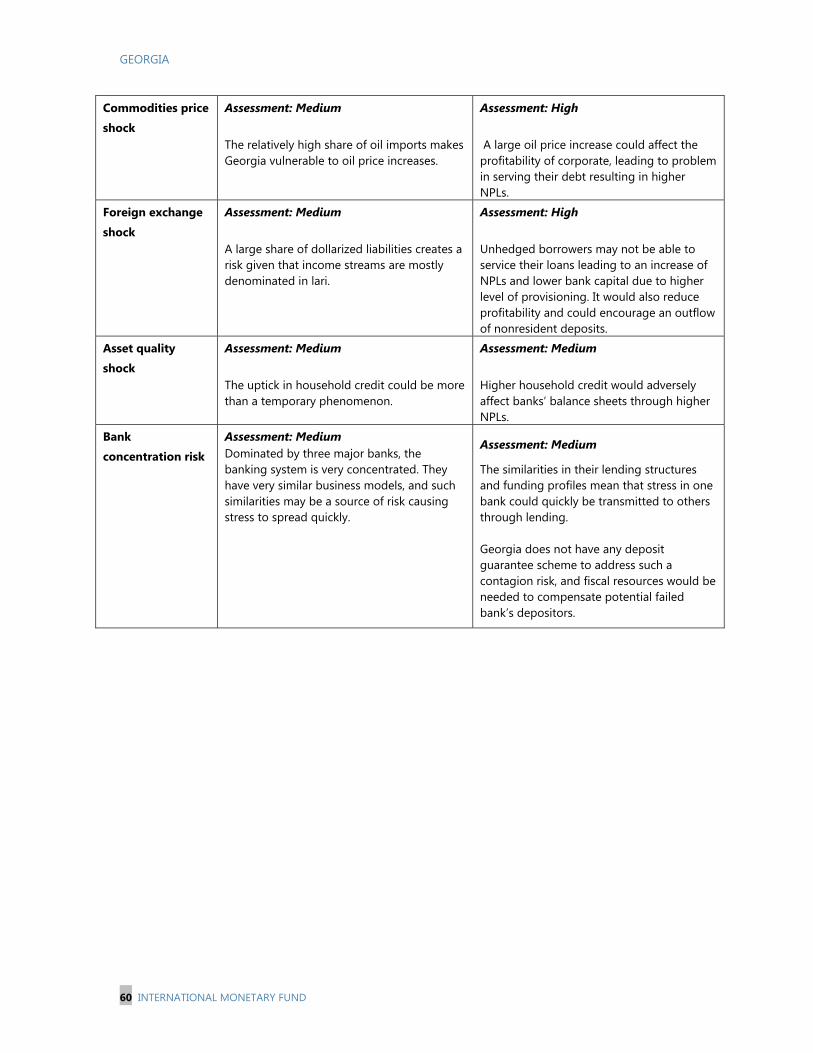
GEORGIA
60 INTERNATIONAL MONETARY FUND
Commodities price
shock
Assessment: Medium
The relatively high share of oil imports makes Georgia vulnerable to oil price increases.
Assessment: High
A large oil price increase could affect the profitability of corporate, leading to problem in serving their debt resulting in higher NPLs.
Foreign exchange
shock
Assessment: Medium
A large share of dollarized liabilities creates a risk given that income streams are mostly denominated in lari.
Assessment: High
Unhedged borrowers may not be able to service their loans leading to an increase of NPLs and lower bank capital due to higher level of provisioning. It would also reduce profitability and could encourage an outflow of nonresident deposits.
Asset quality
shock
Assessment: Medium
The uptick in household credit could be more than a temporary phenomenon.
Assessment: Medium
Higher household credit would adversely affect banks’ balance sheets through higher NPLs.
Bank
concentration risk
Assessment: Medium Dominated by three major banks, the banking system is very concentrated. They have very similar business models, and such similarities may be a source of risk causing stress to spread quickly.
Assessment: Medium
The similarities in their lending structures and funding profiles mean that stress in one bank could quickly be transmitted to others through lending. Georgia does not have any deposit guarantee scheme to address such a contagion risk, and fiscal resources would be needed to compensate potential failed bank’s depositors.

GEORGIA
INTERNATIONAL MONETARY FUND 61
References
Arellano, M. and S. Bond.,1991, “Some tests of specification for panel data: Monte Carlo evidence and an application to employment equations.” The Review of Economic Studies, 58. pp. 277–297
Hardy, Daniel and Christian Schmieder, 2013, “Rules of Thumb for Bank Solvency Stress Testing. IMF Working Paper No. 13/232 (Washington: International Monetary Fund).
International Convergence of Capital Measurement and Capital Standards, 2006, Bank for International Settlements (BIS).
Schmieder, Christian, Puhr Claus, and Maher K. Hasan, 2011, “Next Generation Balance Sheet Stress Testing,” IMF Working Paper No. 11/83 (Washington: International Monetary Fund).