atradius country reports...after a banking crisis in 2014 the sector has made big improvements, with...
TRANSCRIPT

Atradius Country ReportsCentral, Eastern and South-Eastern Europe – October 2017

Contents
2
Atradius STAR Political Risk Rating Page 3
Bulgaria Page 4
Czech Republic Page 6
Hungary Page 8
Poland Page 10
Romania Page 13
Russia Page 15
Slovakia Page 18
Turkey Page 20
Print this article
Print this article
Print this article
Print this article
Print this article
Print this article
Print this article
Print this article
Print all
Print this article
3
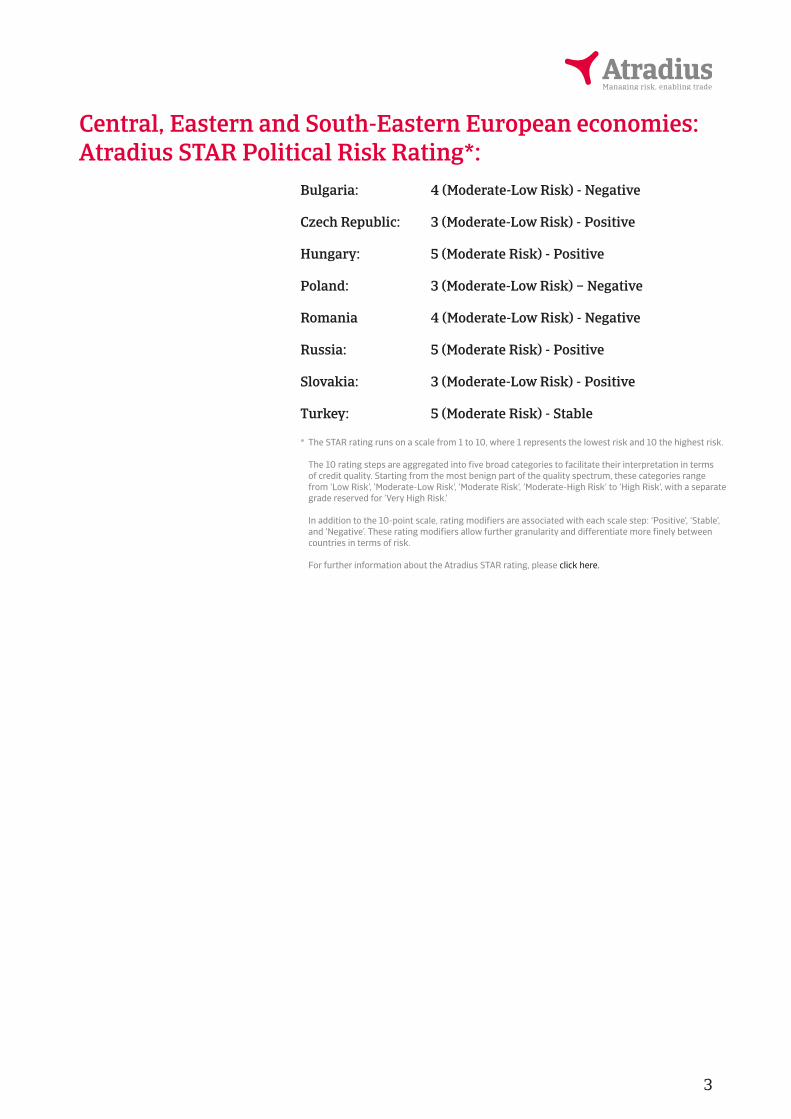
Central, Eastern and South-Eastern European economies: Atradius STAR Political Risk Rating*:
Bulgaria: 4 (Moderate-Low Risk) - Negative
Czech Republic: 3 (Moderate-Low Risk) - Positive
Hungary: 5 (Moderate Risk) - Positive
Poland: 3 (Moderate-Low Risk) – Negative
Romania 4 (Moderate-Low Risk) - Negative
Russia: 5 (Moderate Risk) - Positive
Slovakia: 3 (Moderate-Low Risk) - Positive
Turkey: 5 (Moderate Risk) - Stable
* The STAR rating runs on a scale from 1 to 10, where 1 represents the lowest risk and 10 the highest risk.
The 10 rating steps are aggregated into five broad categories to facilitate their interpretation in terms of credit quality. Starting from the most benign part of the quality spectrum, these categories range from ‘Low Risk’, ‘Moderate-Low Risk’, ‘Moderate Risk’, ‘Moderate-High Risk’ to ‘High Risk’, with a separate grade reserved for ‘Very High Risk.’
In addition to the 10-point scale, rating modifiers are associated with each scale step: ‘Positive’, ‘Stable’, and ‘Negative’. These rating modifiers allow further granularity and differentiate more finely between countries in terms of risk.
For further information about the Atradius STAR rating, please click here.
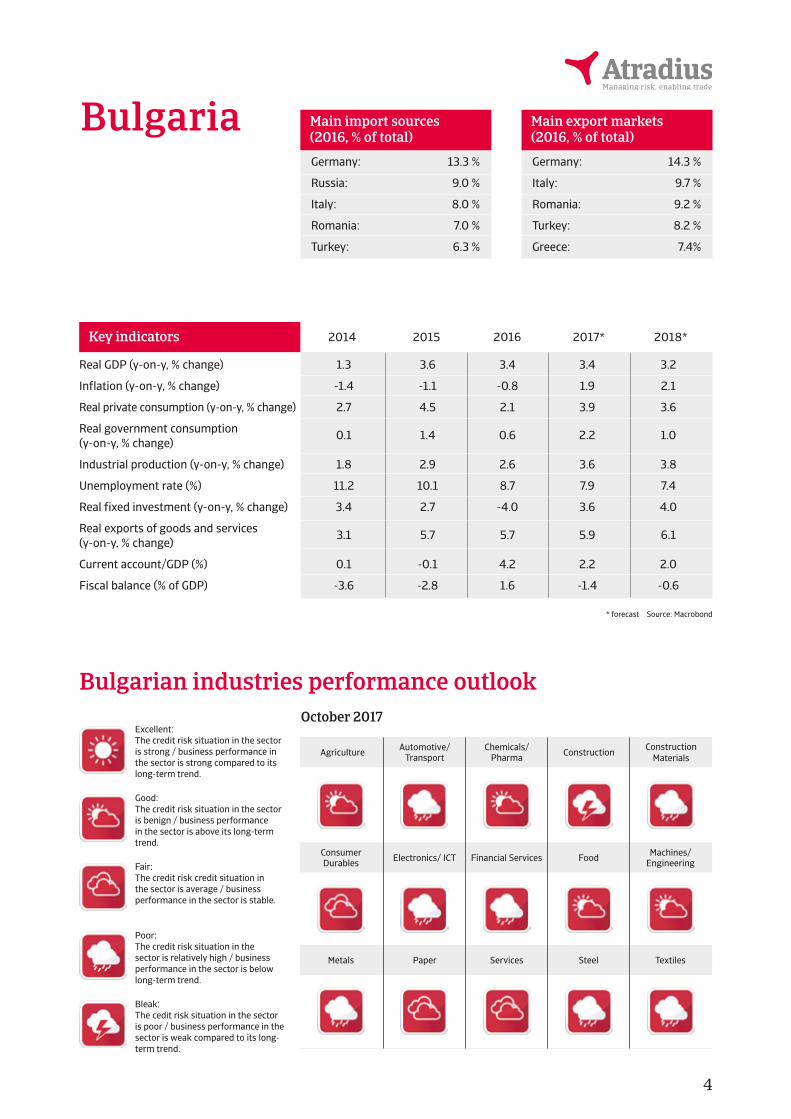
Bulgaria
4
Germany: 13.3 %
Russia: 9.0 %
Italy: 8.0 %
Romania: 7.0 %
Turkey: 6.3 %
Germany: 14.3 %
Italy: 9.7 %
Romania: 9.2 %
Turkey: 8.2 %
Greece: 7.4%
Main import sources (2016, % of total)
Main export markets (2016, % of total)
Bulgarian industries performance outlook
Agriculture
Electronics/ ICT
Automotive/Transport
Financial Services
Chemicals/Pharma
Food
Construction
Machines/Engineering
Construction Materials
Consumer Durables
Paper Services Steel TextilesMetals
October 2017
Key indicators 2014 2015 2016 2017* 2018*
Real GDP (y-on-y, % change) 1.3 3.6 3.4 3.4 3.2
Inflation (y-on-y, % change) -1.4 -1.1 -0.8 1.9 2.1
Real private consumption (y-on-y, % change) 2.7 4.5 2.1 3.9 3.6
Real government consumption 0.1 1.4 0.6 2.2 1.0(y-on-y, % change)
Industrial production (y-on-y, % change) 1.8 2.9 2.6 3.6 3.8
Unemployment rate (%) 11.2 10.1 8.7 7.9 7.4
Real fixed investment (y-on-y, % change) 3.4 2.7 -4.0 3.6 4.0
Real exports of goods and services 3.1 5.7 5.7 5.9 6.1(y-on-y, % change)
Current account/GDP (%) 0.1 -0.1 4.2 2.2 2.0
Fiscal balance (% of GDP) -3.6 -2.8 1.6 -1.4 -0.6
Good:The credit risk situation in the sector is benign / business performance in the sector is above its long-term trend.
Fair:The credit risk credit situation in the sector is average / business performance in the sector is stable.
Poor: The credit risk situation in the sector is relatively high / business performance in the sector is below long-term trend.
Bleak:The cedit risk situation in the sector is poor / business performance in the sector is weak compared to its long-term trend.
Excellent:The credit risk situation in the sector is strong / business performance in the sector is strong compared to its long-term trend.
* forecast Source: Macrobond

5
Solid growth expected in 2017 and 2018
Bulgaria recorded weak GDP growth after contraction in 2009, averaging only 0.9% annually between 2010 and 2014. However, economic growth has accel-erated since 2015, driven primarily by stronger exports and growing private consumption. GDP is forecast to increase more than 3% in 2017 and 2018, as household spending is spurred by low interest rates and an improving labour market. Unemployment is expected to decrease to about 8% in 2017. At the same time, exports continue to be driven by increased eurozone demand, and investments (including EU-financed infrastructure projects) are expected to pick up again. After a deflationary period between 2014 and 2016, which has severe-ly affected the profitability of Bulgarian businesses, consumer prices increased again in 2017, due to higher energy prices and strengthening domestic demand.
After a surplus in 2016, the fiscal balance is expected to turn to a modest deficit in 2017 and 2018. Rising private consumption and imports are boosting revenue collection. Public debt remains sustainable and is forecast to steadily decline (to reach 27.5% in 2018).
After a banking crisis in 2014 the sector has made big improvements, with the IMF’s 2016 banking sector assessment and a stress test made by the Central Bank showing that the sector is well-capitalised and more resilient to shocks. However, 14% of total loans are still non-performing, which continues to be a threat to bank profitability. Greek banks contribute more than 18% of the bank-ing assets in Bulgaria, which exposes the sector to adverse developments in the Greek economy.
Bulgaria’s monetary policy framework is strong with a solid commitment to its currency board arrangement (the lev is pegged to the euro), which supports for-eign investor confidence. However, this arrangement limits Bulgaria’s ability to combat external imbalances. The peg is maintainable due to large international reserves (10 months of import cover) and current account surpluses.
Political instability remains an issue for Bulgaria´s long term economic growth prospects, while corruption and red tape still hamper the business environment. Despite a decrease in the jobless rate, long-term unemployment remains a big social and economic issue, accounting for more than 60% of unemployment. The high level of emigration and an ageing population also add to the woes of the labour market and reduce the potential for long-term growth.
Economic situation
5
4
3
2
1
0
2014 2015 2016 2017f 2018fSource: Macrobond
Real GDP growth (y-on-y, % change)
Some political instability remains
After the snap elections held in March 2017 Boyko Borisov from the centre-right GERB party became Prime Minister for the third time. He heads a coalition government of GERB and the nationalist “United Patriots” party, with just a slim majority in parliament (122 of 240 seats). The snap elections became necessary as the previous government under Borisov had resigned after Rumen Radev, a socialist–backed pro-Russian won the November 2016 presidential elections.
Political discontent remains high, especially over the slow progress in comba-ting graft and corruption and social welfare issues. While the incumbent gover-nment pursues a pro-EU policy, the socialist party and President Radev favour closer political and economic relations with Russia.
Political situation
5
4
3
2
1
0
2014 2015 2016 2017f 2018fSource: Macrobond
2.7
4.5
2.1
3.93.6
Real private consumption (y-on-y, % change)
Head of state:President Rumen Radev (since January 2017)
Head of government:Prime Minister Boyko Borisov (since May 2017)
Population:7.0 million
1.3
3.6 3.4 3.4 3.2
5
4
3
2
1
0
2014 2015 2016 2017f 2018fSource: Macrobond
1.8
2.92.6
3.6 3.8
Industrial production (y-on-y, % change)
Print this article Return to contents page

Czech Republic
6
Germany: 30.8 %
Poland: 9.7 %
China: 7.5 %
Slovakia: 6.4 %
The Netherlands: 5.4 %
Germany: 32.4 %
Slovakia: 8.4%
Poland: 5.8 %
United Kingdom: 5.2 %
France: 5.2 %
Main import sources (2016, % of total)
Main export markets (2016, % of total)
Czech Republic industries performance outlook
Agriculture
Electronics/ICT
Automotive/Transport
Financial Services
Chemicals/Pharma
Food
Construction
Machines/Engineering
Construction Materials
Consumer Durables
Paper Services Steel TextilesMetals
October 2017
Key indicators 2014 2015 2016 2017* 2018*
Real GDP (y-on-y, % change) 2.7 4.6 2.3 3.0 2.6
Inflation (y-on-y, % change) 0.3 0.3 0.7 2.3 2.0
Real private consumption (y-on-y, % change) 1.8 3.1 2.8 3.1 2.6
Real government consumption 1.1 2.0 1.2 1.9 1.8(y-on-y, % change)
Industrial production (y-on-y, % change) 5.0 4.8 2.9 5.3 4.0
Unemployment rate (%) 6.1 5.1 4.0 3.2 2.8
Real fixed investment (y-on-y, % change) 3.9 9.1 -3.9 3.0 3.5
Real exports of goods and services 8.7 7.9 4.0 4.7 4.3(y-on-y, % change)
Current account/GDP (%) 0.2 0.2 1.1 0.9 0.4
Fiscal balance (% of GDP) -1.9 -0.6 0.6 -0.5 -1.0
Good:The credit risk situation in the sector is benign / business performance in the sector is above its long-term trend.
Fair:The credit risk credit situation in the sector is average / business performance in the sector is stable.
Poor: The credit risk situation in the sector is relatively high / business performance in the sector is below long-term trend.
Bleak:The cedit risk situation in the sector is poor / business performance in the sector is weak compared to its long-term trend.
Excellent:The credit risk situation in the sector is strong / business performance in the sector is strong compared to its long-term trend.
* forecast Source: Macrobond

7
Solid growth expected in 2017 and 2018
In 2017 Czech economic growth is expected to increase 3%, benefitting from robust private consumption, a rebound in private and public investment and buoyant exports (especially automotive related goods). In 2018 continued ro-bust GDP growth of 2.6% is forecast.
Domestic demand is expected to remain robust. Private consumption growth is driven by wage growth, decreasing unemployment and favourable lending conditions. At the same time export growth is set to continue, driven by demand from the eurozone and the country´s improved international competitiveness.
In April 2017 the central bank abandoned a cap (currency ceiling level) on the koruna against the euro amid rising inflation and robust economic growth. The cap was introduced in November 2013 in order to improve the country´s competitiveness, boost exports and contain deflationary pressures. Further rising inflation due to surging wages and rising house prices led to an increase in the benchmark interest rate from 0.05% to 0.25% in August 2017 - the first rate hike since 2008.
Government finances are solid, with a small budget surplus reached in 2016 due to income growth and increased tax compliance. In 2017 and 2018 small deficits are expected due to higher public expenses and investments. At 36% of GDP, government debt is low compared to other countries in the region. The good state of public finances means that the Czech Republic should have no troubles adhering to the adoption criteria of the euro. However, entering the eurozone still remains a controversial issue in Czech politics, with public opinion against it. Therefore, a eurozone entry in the coming years seems unlikely.
High export-dependency as a potential risk factor
Despite the generally benign outlook, downside risks remain. At more than 75%, the Czech Republic’s export-to-GDP ratio is one of the highest in the EU, and due to foreign investment, the Czech economy is highly integrated into interna-tional value chains. This makes the country vulnerable to foreign trade losses. The main risks in this respect are a strong exchange rate appreciation hurting Czech international competitiveness and sharp external demand decreases, e.g. triggered by increased political uncertainty (Brexit), or a sudden slowdown in the eurozone.
Economic situation
5
4
3
2
1
0
2014 2015 2016 2017f 2018fSource: Macrobond
Real GDP growth (y-on-y, % change)
Stable coalition government
Since January 2014 the Czech Republic is ruled by a centre-left coalition, hol-ding 111 of the 200 seats in parliament. The coalition is led by the leftist Czech Social Democratic Party (CSSD), the other two parties are the centrist ANO 2011 and the Christian Democrats (KDU-CSL). Next general elections are due to be held in October 2017.
Political situation
5
4
3
2
1
0
2014 2015 2016 2017f 2018fSource: Macrobond
1.8
3.12.8
3.12.6
Real private consumption (y-on-y, % change)
Head of state:President Milos Zeman (since March 2013)
Head of government:Prime Minister Bohuslav Sobotka (since January 2014)
Population:10.6 million
10
8
6
4
2
0
2014 2015 2016 2017f 2018fSource: Macrobond
8.77.9
4.04.7
4.3
Real exports of goods and services (y-on-y, % change)
Print this article Return to contents page
2.7
4.6
2.3
3.02.6

Hungary
8
Germany: 26.4 %
Austria: 6.4 %
China: 6.3 %
Poland: 5.5 %
Slovakia: 5.3 %
Germany: 28.2 %
Romania: 5.2 %
Slovakia: 5.0 %
Austria: 4.9 %
Italy: 4.9 %
Main import sources (2016, % of total)
Main export markets (2016, % of total)
Hungary industries performance outlook
Agriculture
Electronics/ICT
Automotive/Transport
Financial Services
Chemicals/Pharma
Food
Construction
Machines/Engineering
Construction Materials
Consumer Durables
Paper Services Steel TextilesMetals
October 2017
Key indicators 2014 2015 2016 2017* 2018*
Real GDP (y-on-y, % change) 3.9 3.1 1.9 3.6 3.4
Inflation (y-on-y, % change) -0.2 -0.1 0.4 2.6 3.0
Real private consumption (y-on-y, % change) 2.5 3.4 5.0 4.3 4.6
Real government consumption 4.4 1.0 0.1 2.8 3.0(y-on-y, % change)
Industrial production (y-on-y, % change) 7.7 7.4 0.9 5.2 5.3
Unemployment rate (%) 7.7 6.8 5.1 4.4 4.1
Real fixed investment (y-on-y, % change) 9.9 1.9 -15.5 11.5 6.0
Export of goods and non-factor services 9.8 7.7 5.8 6.0 5.6(y-on-y, % change)
Current account/GDP (%) 2.0 3.3 4.9 3.4 2.7
Fiscal balance (% of GDP) -2.1 -1.6 -1.9 -2.5 -2.7
* forecast Source: Macrobond
Good:The credit risk situation in the sector is benign / business performance in the sector is above its long-term trend.
Fair:The credit risk credit situation in the sector is average / business performance in the sector is stable.
Poor: The credit risk situation in the sector is relatively high / business performance in the sector is below long-term trend.
Bleak:The cedit risk situation in the sector is poor / business performance in the sector is weak compared to its long-term trend.
Excellent:The credit risk situation in the sector is strong / business performance in the sector is strong compared to its long-term trend.

9
Slower growth in 2016, followed by a rebound in 2017
Hungary´s GDP growth slowed down to 1.9% in 2016, as public spending on infrastructure sharply decreased (lower disbursement of EU funds). That said, economic growth was sustained by robust private consumption (up 5.0%).
In 2017 and 2018 economic growth is forecast to increase by about 3.5% an-nually as private and public investments have picked up again. After deflation in 2014 and 2015 (mainly due to regulated household energy prices) consumer prices have started to grow again, and are forecast to increase 2.6% in 2017 and 3.0% in 2018.
Private consumption growth will be driven by wage growth (minimum wage increases in 2017 and 2018) and increasing employment, while exports (driven by eurozone demand) are expected to remain solid. Risks stem from an end of the eurozone rebound and a cooling down of world trade, which would hurt Hungarian export growth.
Containing the budget deficit within 3% of GDP is a top priority of the admini-stration in order to avoid EU sanctions. However, since 2010 the government has been using unorthodox ways to balance the budget, most notably extraor-dinary taxes on banks and utilities. The budget deficit is forecast to increase in 2017 and 2018 due to lowered corporate taxes and social security contributions and VAT decreases. Public debt remains high at 77% of GDP (Central-Eastern Eu-rope median is 52% of GDP), but fiscal consolidation policies will be postponed until after the general elections in 2018.
High debt level as a major weakness
Hungary’s major weakness remains its high level of external debt (almost 100% of GDP in 2017). A large share of it is foreign currency-denominated, which exacerbates the problem, as a forint depreciation would hurt many Hungarian households and businesses whose loans are denominated in foreign currencies. Additionally, more than 30% of public debt is denominated in foreign currency. Despite the fact that current account surpluses bolster the exchange rate, the forint remains highly vulnerable to international investors’ sentiment due to the high external and public debt levels and a suboptimal institutional and policy environment.
Economic situation
5
4
3
2
1
0
2014 2015 2016 2017f 2018fSource: Macrobond
3.9
3.1
1.9
3.6 3.4
Real GDP growth (y-on-y, % change)
Troublesome relationship with the EU remains
The ruling conservative coalition of the Fidesz and KDNP parties under Prime Minister Viktor Orbán has repeatedly taken actions that led to confrontations with the EU commission and its EU peers (e.g. a controversial media law, some constitutional amendments curbing judicial independence, and a tough stance in the migrant policy, together with a lack of willingness to accept the manda-tory quotas for refugees passed by the EU). Together with some unorthodox economic policy decisions like additional taxes on banks, the government’s repeated confrontations with the EU have led to some uncertainty among its European peers and international investors.
Political situation Head of state:President Janos Ader (since May 2012)
Head of government:Prime Minister Viktor Orbán(since May 2010)
Population:9.7 million
5
4
3
2
1
0
2014 2015 2016 2017f 2018fSource: Macrobond
2.5
3.4
5.04.3
4.6
Real private consumption (y-on-y, % change)
0
-1
-2
-3
-4
-5
2014 2015 2016 2017f 2018fSource: Macrobond
-2.1
-1.6-1.9
-2.5 -2.7
Fiscal balance (% of GDP)
Print this article Return to contents page

Poland
10
Germany: 28.3 %
China: 7.9 %
The Netherlands: 6.0 %
Russia: 5.8 %
Italy: 5.3 %
Germany: 27.4 %
United Kingdom: 6.6 %
Czech Republic: 6.6 %
France: 5.4 %
Italy: 4.8 %
Main import sources (2016, % of total)
Main export markets (2016, % of total)
Poland industries performance outlook
Agriculture
Electronics/ICT
Automotive/Transport
Financial Services
Chemicals/Pharma
Food
Construction
Machines/Engineering
Construction Materials
Consumer Durables
Paper Services Steel TextilesMetals
October 2017
Key indicators 2014 2015 2016 2017* 2018*
Real GDP (y-on-y, % change) 3.3 3.8 2.7 3.6 3.3
Inflation (y-on-y, % change) 0.1 -0.9 -0.7 1.8 2.2
Real private consumption (y-on-y, % change) 2.4 3.0 3.8 4.5 3.4
Real government consumption 4.1 2.4 2.8 4.5 3.3(y-on-y, % change)
Industrial production (y-on-y, % change) 3.4 4.8 2.9 3.9 3.2
Unemployment rate (%) 12.3 10.5 9.0 7.4 7.2
Real fixed investment (y-on-y, % change) 10.0 6.1 -7.9 3.5 5.5
Real exports of goods and services 6.7 7.7 9.0 8.6 7.1(y-on-y, % change)
Current account/GDP (%) -2.1 -0.6 -0.2 -0.5 -0.7
Fiscal balance (% of GDP) -1.7 -2.4 -2.5 -3.0 -2.6
* forecast Source: Macrobond
Good:The credit risk situation in the sector is benign / business performance in the sector is above its long-term trend.
Fair:The credit risk credit situation in the sector is average / business performance in the sector is stable.
Poor: The credit risk situation in the sector is relatively high / business performance in the sector is below long-term trend.
Bleak:The cedit risk situation in the sector is poor / business performance in the sector is weak compared to its long-term trend.
Excellent:The credit risk situation in the sector is strong / business performance in the sector is strong compared to its long-term trend.

11
Economic growth above eurozone average
After a moderate slowdown in 2016, Polish GDP growth is expected toincrease again above 3% in 2017 and 2018, due to robust consumerdemand, rising business investment and increased investments linked to EUfunding.
Private consumption is expected to increase 4.5% in 2017 and 3.4% in 2018, underpinned by increasing employment, rising wages and social transfers. In-vestments are supported by a strong business sentiment and low interest rates. Export growth is expected to remain buoyant. Following deflation in 2015 and 2016, consumer prices have started to grow again this year, and are forecast to increase 1.8% in 2017 and 2.2% in 2018.
The government’s fiscal easing widened the deficit to 2.5% of GDP in 2016, which is expected to increase further in 2017 due to increased social spending and public investment. Policies focused on increasing child benefits and invest-ment are mostly funded by new taxes on banks and better tax collection. Under pressure, the government has already stepped back on some promises such as watering down its mortgage relief plan. This should ensure that the country does not re-enter the EU excessive deficit procedure in 2017-2018. Public debt is moderate around 45% of GDP.
The Polish banking sector is stable, well-capitalized, liquid and profitable. However, banks are exposed to foreign exchange risk as more than 30% of housing loans are denominated in Swiss francs. Government policies to convert franc-denominated mortgages into zloty should help to ease this risk without significantly hurting bank profits or credit growth.
Economic situation
5
4
3
2
1
0
2014 2015 2016 2017f 2018fSource: Macrobond
3.33.8
2.7
3.63.3
Real GDP growth (y-on-y, % change)
The new administration launched some controversial initiatives
The national –conservative Law and Justice (PiS) party prevailed in the October 2015 elections gaining 235 out of 460 seats in parliament. Immediately after its inauguration the new PiS-administration launched some controversial policy initiatives, such as seizing direct control of the state broadcasting channels and the security services, and purging the heads of state-owned companies. A major issue are attempts to curb the independence of the judiciary by imposing political control over courts and the appointment of judges.
This has triggered mass demonstrations in Poland itself, while the European Commission has repeatedly warned the Polish government that such moves pose a systemic risk to the rule of law and violate EU statutes.
Political situation Head of state:President Andrzej Duda (since August 2015)
Head of government:Prime Minister Beata Szydlo (since November 2015)
Population:38.3 million
5
4
3
2
1
0
2014 2015 2016 2017f 2018fSource: Macrobond
4.1
2.42.8
4.5
3.3
Real government consump-tion (y-on-y, % change)

12
Vulnerable to financial market volatility and exposed to negativeBrexit impacts
Poland remains vulnerable to international investor sentiment. Together with external factors like the Brexit decision and uncertainty over US policy direction, concerns over adverse economic and domestic policies by the Polish govern-ment have led to increased currency volatility and higher sovereign bond yields in 2016. Poland´s external financing requirement in 2017 is high, at 83% of its international reserves and structural current account deficits have contributed to a relatively high external debt ratio of around 70% of GDP.
That said, risks to Poland’s external economic stability are largely mitigated by international reserves covering more than five months of goods and services imports. The country also has access to an IMF precautionary line in case of emergency. A large share of external debt is in intercompany loans, mitigating refinancing risk.
In Central Europe, Poland‘s economy looks most vulnerable to the financial and economic fallout of the United Kingdom‘s vote to leave the EU. Annual remit-tances from Poles living abroad amount to about EUR 4 billion, a large share of it from the UK. In the longer term an EU departure of the United Kingdom could impact EU structural funds, which play a major role in Poland´s economic pro-gress. The UK is also Poland´s second largest export destination after Germany.
10
8
6
4
2
0
2014 2015 2016 2017f 2018fSource: Macrobond
6.77.7
9.0 8.6
7.1
Real exports of goods and services (y-on-y, % change)
Print this article Return to contents page

Romania
13
Germany: 20.6 %
Italy: 10.3 %
Hungary: 7.4 %
France: 5.6 %
Poland: 5.2 %
Germany: 21.5 %
Italy: 11.6 %
France: 7.2 %
Hungary: 5.2 %
United Kingdom: 4.3 %
Main import sources (2016, % of total)
Main export markets (2016, % of total)
Romania industries performance outlook
Agriculture
Energy (oil, gas)
Automotive/Transport
Financial Services
Chemicals/Pharma
Food
Construction
Machines/Engineering
Consumer Durables
Electronics/ ICT
Paper Services Steel TextilesMetals
October 2017
Key indicators 2014 2015 2016 2017* 2018*
Real GDP (y-on-y, % change) 3.1 3.9 4.8 4.2 3.7
Consumer price (y-on-y, % change) 1.1 -0.6 -1.6 1.2 2.8
Real private consumption (y-on-y, % change) 4.4 5.7 7.5 6.6 5.8
Real government consumption 0.5 -0.8 3.6 13.0 8.0(y-on-y, % change)
Industrial production (y-on-y, % change) 6.1 2.8 1.7 4.0 3.3
Unemployment rate (%) 6.8 6.8 5.9 5.3 4.9
Real fixed investment (y-on-y, % change) 3.8 7.2 -2.2 6.0 6.0
Real exports of goods and services 8.3 5.3 8.1 8.8 6.7(y-on-y, % change)
Current account/GDP (%) -0.7 -1.2 -2.3 -2.5 -2.5
Fiscal balance (% of GDP) -1.9 -1.5 -2.4 -4.0 -3.5
* forecast Source: Macrobond
Good:The credit risk situation in the sector is benign / business performance in the sector is above its long-term trend.
Fair:The credit risk credit situation in the sector is average / business performance in the sector is stable.
Poor: The credit risk situation in the sector is relatively high / business performance in the sector is below long-term trend.
Bleak:The cedit risk situation in the sector is poor / business performance in the sector is weak compared to its long-term trend.
Excellent:The credit risk situation in the sector is strong / business performance in the sector is strong compared to its long-term trend.

14
Lower, but still solid growth expected in 2017 and 2018
Romania has shown robust GDP growth rates over the last couple of years, mainly driven by surging domestic demand. In 2016 economic growth increased 4.8%, mainly due to robust 7.5% growth in private consumption, helped by VAT reduc-tions, low interest rates, rising wages and decreasing unemployment.
Despite the uncertain political situation in H1 of 2017 the robust growth has continued, and GDP is expected to grow 4.2% in 2017 and 3.7% in 2018, driven by continued strong private consumption and rising investments, including structural funds from the EU. Exports, mainly to the EU, have also picked up at a reasonable rate and are expected to grow again this year above 8%. The country maintains one of the strongest growth outlooks in the region.
The Romanian banking sector has continued its trend of substantial improvement in 2016, with rising capital adequacy ratios and decreasing non-performing loans. However, the sector is still subject to elevated credit risk due to foreign exchange mismatches and low credit growth.
The budget deficit increased in 2016 due to the VAT reduction and the expansion of public spending in the run-up to the November 2016 general election. In 2017 and 2018 the deficit is expected to increase further due to the continuation of expansive fiscal policies. This leaves the government budget more dependent on a positive economic outlook, and there is still an urgent need for improving tax administration. However, at about 39% of GDP public debt is expected to remain moderate in 2017 and 2018.
Vulnerable to international investor sentiment
Romania remains exposed to some external vulnerabilities. While the current account deficit has decreased from 12% of GDP in 2008 to 0.7% of GDP in 2014 it has increased again since then as high growth in domestic demand is driving up imports. At the same time external debt is relatively high, at around 70% of GDP. The currency is subject to some volatility (e.g. the political turmoil in early 2017 caused the Romanian leu to drop to its weakest against the euro since 2012, but it has rebounded since then). While the country remains vulnerable to some capital outflows should there be adverse internal and external developments, there are some solid buffers in place – abundant international reserves (six months of im-port cover, low public debt and a flexible exchange rate.
Economic situation
5
4
3
2
1
0
2014 2015 2016 2017f 2018fSource: Macrobond
3.1
3.9
4.84.2
3.7
Real GDP growth (y-on-y, % change)
Political uncertainty remains an issue
In January 2017 the newly elected coalition government between the social de-mocratic PSD and the liberal ALDE under Prime Minister Sorin Grindeanu passed a decree that would have decriminalised some major corruption cases, which spurred the largest public protests since the Revolution of 1989. As a conse-quence, the controversial decree was withdrawn. This issue, together with rows within the PSD, led to the dismissal of Grindeanu with a no-confidence vote in parliament in June. A new Prime Minister from the PSD took office at the end of the same month; President Iohannis (former head of the opposition National Liberal Party) confirmed his appointment to maintain economic stability and to prevent the collapse of the six-month-old government. Corruption and graft remain major issues in Romanian politics and economics, and popular dissatis-faction and distrust with the political system run deep.
Political situation Head of state:President Klaus Werner Iohannis (since December 2014)
Head of government:Prime Minister Mihai Tudose (since June 2017)
Population:19.7 million
10
8
6
4
2
0
2014 2015 2016 2017f 2018fSource: Macrobond
4.45.7
7.56.6
5.8
Real private consumption (y-on-y, % change)
0
-1
-2
-3
-4
-5
2014 2015 2016 2017f 2018fSource: Macrobond
-1.9-1.5
-2.4
-4.0-3.5
Fiscal balance (% of GDP)
Print this article Return to contents page

Russia
15
China: 20.9 %
Germany: 10.7 %
USA: 6.1 %
Belarus: 5.2 %
France: 4.7 %
The Netherlands: 10.2 %
China: 9.8 %
Germany: 7.4 %
Belarus: 4.9 %
Turkey: 4.8 %
Main import sources (2016, % of total)
Main export markets (2016, % of total)
Russia industries performance outlook
Agriculture
Electronics/ICT
Automotive/Transport
Financial Services
Chemicals/Pharma
Food
Construction
Machines/Engineering
Construction Materials
Consumer Durables
Paper Services Steel TextilesMetals
October 2017
Key indicators 2014 2015 2016 2017* 2018*
Real GDP (y-on-y, % change) 0.8 -2.8 -0.2 1.6 1.5
Inflation (y-on-y, % change) 7.8 15.5 7.0 4.1 4.0
Real private consumption (y-on-y, % change) 2.0 -9.7 -4.5 2.6 2.8
Real government consumption -2.1 -3.0 -0.5 -0.1 -0.3(y-on-y, % change)
Industrial production (y-on-y, % change) 1.7 -0.9 1.4 1.6 2.1
Unemployment rate (%) 5.2 5.6 5.5 5.4 5.4
Real fixed investment (y-on-y, % change) -0.2 -9.2 -2.6 1.0 1.2
Real exports of goods and services 0.6 3.6 3.1 5.3 1.9(y-on-y, % change)
Current account/GDP (%) 2.8 5.1 2.0 3.4 2.4
Fiscal balance (% of GDP) -0.4 -2.4 -3.4 -2.1 -1.3
* forecast Source: Macrobond
Good:The credit risk situation in the sector is benign / business performance in the sector is above its long-term trend.
Fair:The credit risk credit situation in the sector is average / business performance in the sector is stable.
Poor: The credit risk situation in the sector is relatively high / business performance in the sector is below long-term trend.
Bleak:The cedit risk situation in the sector is poor / business performance in the sector is weak compared to its long-term trend.
Excellent:The credit risk situation in the sector is strong / business performance in the sector is strong compared to its long-term trend.

16
Domestic politics: continued stability - but at the expense of democracy
Nationalistic sentiment has risen since the outbreak of the Ukraine crisis and the annexation of Crimea, supported by aggressive propaganda through the state-controlled media. Playing the nationalist card, especially in relation to the EU and the US, appears to be the key to keeping approval ratings up.
Any opposition has been marginalised by a hardening of authoritarianism: hardliners have effectively been given license to attack liberals and crack down further on independent media and non-governmental organisations. The upcoming September 2017 parliamentary elections will be tightly managed and most likely keep the current government in control.
Relationship with the EU and the US remains tense
Since the outbreak of the Ukraine crisis in early 2014 the relationship between Russia and the EU and US has gradually deteriorated. Russia´s intervention in the civil war in Syria added another area of conflict to the already strained relationships.
Moscow´s annexation of Crimea in March and its tacit support of separatist forces in Eastern Ukraine triggered several rounds of sanctions from the EU and the US, mainly in the form of frozen assets, travel bans on Russian and Crimean individuals, long-term financing limitations restricting access to EU/US capital markets for major Russian banks and some oil and defense businesses and restrictions on the export of certain types of products to Russia, including dual-use technologies and high-tech equipment for the oil industry. Russia itself imposed retaliatory sanctions on the import of food and agricultural products from the EU, the US, Australia, Canada and Norway.
The EU/US sanctions may have a very significant impact on the Russian economy in the longer term. In particular, they will influence the refinancing capacity of major domestic corporations and banks.
Political situation Head of state:President Vladimir Putin (since May 2012)
Head of government:Prime Minister Dmitry Medvedev (since May 2012)
Form of government:Government formed by the Party United Russia and non-partisan technocrats
Population:147.0 million

17
Economic situation
2
1
0
-1
-2
-3
2014 2015 2016 2017f 2018fSource: Macrobond
0.8
-2.8
-0.2
1.6
Real GDP growth (y-on-y, % change)
6
3
0
-3
-6
-9
-12
2014 2015 2016 2017f 2018fSource: Macrobond
2.0
-9.7
-4.5
2.6 2.8
Real private consumption(y-on-y, % change)
18
15
12
9
6
3
0
2014 2015 2016 2017f 2018fSource: Macrobond
7.8 7.0
4.1
Inflation (y-on-y, % change)
15.5
4.0
2
0
-2
-4
-6
-8
-10
2014 2015 2016 2017f 2018fSource: Macrobond
-0.2
-9.2
-2.6
1.0 1.2
Real fixed investment(y-on-y, % change)
A modest economic rebound in 2017 and 2018
Russian GDP growth has rebounded since H2 of 2016, and after two years of contraction the economy is expected to grow about 1.5% in 2017 and 2018. This recovery is mainly due to the rebound in oil prices. Private consumption, invest-ments and exports are expected to pick up again.
The rouble has strengthened again on the back of higher oil prices, by about 20% since March 2016. Together with a strong harvest that helps to curb food prices (which are still elevated due to the on-going sanctions that Russia has imposed on EU imports), the rouble appreciation is having a positive effect on inflation: the increase in consumer prices is expected to slow down to just about 4% in 2017 and 2018. This should sustain the rebound in private consumption, which is expected to increase 2.6% and 2.8% respectively.
Both the rouble appreciation and decreased inflation have provided the Central Bank with more leeway to lower interest rates, which have been decreased to 9% (after having reached an all-time high of 17% in December 2014). This should also support the economic rebound.
The Central bank allows the rouble to float. This has an impact on inflation if the currency depreciates, but also acts as a shock absorber for the current account, which is expected to remain in surplus in 2017 and 2018. At the same time, the fairly large international reserve position of Russia hardly erodes as capital out-flows are contained.
Russia´s short-term economic policy during the previous recession has been rather prudent. Despite very low public debt of about 10% of GDP and pressure from the low oil price on the budget, the government deficit has been kept within acceptable margins. In 2017 and 2018 fiscal tightening is expected, with lower deficits of 2.1% of GDP and 1.3% of GDP respectively. The government has con-firmed its plans to balance the budget by 2020, using a fixed USD 40 per barrel oil price. Any extra revenue generated by a higher oil price will be used to further build up currency reserves.
Major structural weaknesses remain
Despite the on-going economic rebound, the long-term prospect for higher and sustainable growth rates remains subdued, as structural weaknesses and the ne-gative impact of sanctions on productivity and investment will continue to weigh on growth.
The Russian business climate is plagued by uncertainty regarding property rights, a weak transport infrastructure and lack of competition in goods and services markets. The authorities failed to seize the opportunity during the windfall years to strengthen Russia’s economic structure and enhance its non-oil potential by prudently investing high oil revenues in other industries to diversify the economy away from the dominant oil and gas sector.
There is an underlying deterrent for investments, badly needed to modernise the energy sector and help to diversify the economy. Even before the outbreak of the Ukrainian crisis, the investment level was too low and foreign direct investment too limited, partly due to an unfriendly business climate and the firm grip of the state on large parts of the economy. This is now exacerbated by the international sanctions imposed by the EU and the US that aim to prevent technology transfers and financing to Russian firms, especially in the energy and military sectors.
Print this article Return to contents page
1.5

Slovakia
18
Germany: 20.2 %
Czech Republic: 16.9%
Austria: 9.8 %
Poland: 6.4 %
Hungary: 6.1 %
Germany: 21.9 %
Czech Republic: 11.9 %
Poland: 7.7 %
France: 6.1 %
United Kingdom: 5.9 %
Main import sources (2016, % of total)
Main export markets (2016, % of total)
Slovakia industries performance outlook
Agriculture
Electronics/ICT
Automotive/Transport
Financial Services
Chemicals/Pharma
Food
Construction
Machines/Engineering
Construction Materials
Consumer Durables
Paper Services Steel TextilesMetals
October 2017
Key indicators 2014 2015 2016 2017* 2018*
Real GDP (y-on-y, % change) 2.6 3.8 3.3 3.1 3.5
Inflation (y-on-y, % change) -0.1 -0.3 -0.5 1.5 1.6
Real private consumption (y-on-y, % change) 1.4 2.2 2.9 3.1 2.8
Real government consumption 5.3 5.4 1.6 1.2 2.5(y-on-y, % change)
Industrial production (y-on-y, % change) 3.5 7.3 4.8 3.5 4.5
Unemployment rate (%) 12.8 11.5 9.5 7.7 7.4
Real fixed investment (y-on-y, % change) 1.2 16.9 -9.3 5.6 4.0
Real exports of goods and services 3.7 7.0 4.8 5.3 4.7(y-on-y, % change)
Current account/GDP (%) 1.1 0.2 -0.7 -0.2 0.7
Fiscal balance (% of GDP) 2.7 -2.7 -1.7 -1.6 -1.4
* forecast Source: Macrobond
Good:The credit risk situation in the sector is benign / business performance in the sector is above its long-term trend.
Fair:The credit risk credit situation in the sector is average / business performance in the sector is stable.
Poor: The credit risk situation in the sector is relatively high / business performance in the sector is below long-term trend.
Bleak:The cedit risk situation in the sector is poor / business performance in the sector is weak compared to its long-term trend.
Excellent:The credit risk situation in the sector is strong / business performance in the sector is strong compared to its long-term trend.

19
Growth forecast to remain above 3% in 2017 and 2018
The Slovakian economy grew 3.3% in 2016, and growth is expected to remain above 3% in 2017 and 2018 (3.1% and 3.5% respectively), driven by continued robust domestic demand, surging investment and exports to the eurozone.
Private consumption is forecast to continue to be one of the primary drivers of the economic expansion, fueled by rising household incomes. The labour market shows strong improvement, with the unemployment rate expected to continue its decrease from 14.1% in 2013 to 7.7% in 2017 and 7.4% in 2018, mainly due to improving domestic economic conditions.
Exports are expected to continue to grow in 2017 and 2018, mainly driven by the favourable outlook of the automotive industry. Large foreign investments have increased productivity and export opportunities. Business investments and infrastructure spending is expected to grow.
Government finances are stable with the budget deficit being kept below 3% of GDP since 2013. The budget deficit is expected to decrease to 1.6% in 2017 and 1.4% in 2017. Public debt amounts to 52% of GDP.
Slovakia´s external economic position is solid. The current account deficit is expected to turn into a surplus in 2018.
Highly dependent on (automotive) exports
As the Slovakian economy is heavily reliant on industrial exports (especially automotive related) to the eurozone and Germany in particular, it remains very vulnerable to a eurozone downturn and/or adverse developments in the auto-motive sector.
Economic situation
5
4
3
2
1
0
2014 2015 2016 2017f 2018fSource: Macrobond
2.6
3.83.3 3.1
3.5
Real GDP growth (y-on-y, % change)
Ruling party lost its absolute majority in the March 2016 elections
In the March 2016 general elections, which were mainly focused on the Euro-pean migrant crisis, the ruling social-democratic Smer-SD party lost more than 15% and its absolute majority in parliament, mainly at the expense of nationalist and right-wing parties. Despite the losses the Smer-SD remained the largest party in parliament and forms a coalition government together with the natio-nalist SNS party and the liberal conservative Most-Híd party.
Political situation Head of state:President Andrej Kiska (since June 2014)
Head of government:Prime Minister Robert Fico (since April 2012)
Population:5.4 million
Print this article Return to contents page
5
4
3
2
1
0
2014 2015 2016 2017f 2018fSource: Macrobond
1.4
2.22.9 3.1
2.8
Real private consumption (y-on-y, % change)
10
8
6
4
2
0
2014 2015 2016 2017f 2018fSource: Macrobond
3.7
7.0
4.8 5.3 4.7
Real exports of goods and services (y-on-y, % change)

Turkey
20
China: 12.8 %
Germany: 10.8 %
Russia: 7.6 %
USA: 5.5 %
Italy: 5.1 %
Germany: 9.8 %
United Kingdom: 8.2 %
Iraq: 5.4 %
Italy: 5.3 %
USA 4.6 %
Main import sources (2016, % of total)
Main export markets (2016, % of total)
Turkey industries performance outlook
Agriculture
Electronics/ICT
Automotive/Transport
Financial Services
Chemicals/Pharma
Food
Construction
Machines/Engineering
Construction Materials
Consumer Durables
Paper Services Steel TextilesMetals
October 2017
Key indicators 2014 2015 2016 2017* 2018*
Real GDP growth (y-on-y, % change) 5.2 5.9 3.0 4.1 3.4
Inflation (y-on-y, % change) 8.9 7.7 7.8 10.3 7.8
Real private consumption (y-on-y, % change) 3.0 5.6 2.3 3.4 3.3
Real government consumption 3.1 3.6 7.6 7.8 8.5(y-on-y, % change)
Industrial production (y-on-y, % change) 3.5 2.9 1.8 3.2 2.8
Unemployment rate (%) 10.0 10.3 10.9 11.5 11.4
Real fixed investment (y-on-y, % change) 5.3 8.9 3.1 2.8 3.4
Real exports of goods and services 8.2 4.1 -1.9 4.8 4.4(y-on-y, % change)
Current account/GDP (%) -4.7 -3.7 -3.8 -4.2 -4.1
Fiscal balance (% of GDP) -1.1 -1.0 -1.1 -2.3 -2.4
* forecast Source: Macrobond
Good:The credit risk situation in the sector is benign / business performance in the sector is above its long-term trend.
Fair:The credit risk credit situation in the sector is average / business performance in the sector is stable.
Poor: The credit risk situation in the sector is relatively high / business performance in the sector is below long-term trend.
Bleak:The cedit risk situation in the sector is poor / business performance in the sector is weak compared to its long-term trend.
Excellent:The credit risk situation in the sector is strong / business performance in the sector is strong compared to its long-term trend.

21
The country is divided and purges continue
In a referendum held in April 2017 major constitutional changes were approved, which means that the country will feature a presidential system, abolishing former constitutional checks and balances. While the presidential system will officially be implemented after the November 2019 general elections, (Presi-dent Erdogan could serve two additional 5-year terms as president) de facto political power already lies with Erdogan.
The narrow referendum result (just 51.4% in favour), highlights the serious political division within the country, especially when considering that the no-camp was restricted in its freedom to campaign. While the state of emergency declared after the failed July 2016 coup attempt has once again been extended, the massive crackdown to purge officials suspected of having links to the coup and the Gülen movement have continued.
So far, around 150.000 people (including military, police, judges, prosecutors, journalists, civil servants, etc.) have been suspended, sacked or arrested. The rule of law and the human rights situation are further deteriorating. Businesses could get a trustee assigned in their management to oversee their business.
The southeastern part of the country remains affected by the civil war in Syria and cross-border interventions by the Turkish army. Fighting between Turkish forces and the Kurdistan Workers´ Party (PKK) has flared-up again after Ankara ended a two-year ceasefire and terminated informal peace talks with the PKK. The risk of terrorist attacks remains elevated.
Relationships with Western partners have deteriorated
Relations with the US remain strained, mainly due to Washington´s refusal to extradite Gülen and the US supplying arms to the Kurdish People’s Protection Units for their fight against IS. Relations with the EU and some major members (especially Germany) have deteriorated over criticism of the curbing of the rule of law and democracy in Turkey and the detention of journalists and human right activists with EU-citizenship.
Given the increased political risks due to the turbulent domestic political situa-tion, the new escalation of the conflict with the PKK, terrorist attacks and more strained relationships with the EU and the US, economic repercussions in the mid- and long-term cannot be ruled out, e.g. a sudden slowdown (or reversal) in capital inflows, a serious decrease in foreign investments and consumer spen-ding. This could negatively influence economic growth, exchange rate stability, external funding opportunities, refinancing and insolvencies.
Political situation Head of state:President Recep Tayyip Erdogan (since August 2014)
Head of government:Prime Minister Binali Yildirim (since May 2016)
Nature of regime:Republican parliamentary democracy and secular state. The armed forces´ political influence has been curbed.
Population:79.5 million

22
12
10
8
6
4
2
0 2014 2015 2016 2017f 2018f
Source: Macrobond
8.9
7.7 7.8
10.3
7.8
Inflation (% of GDP)
Economic growth driven by stimulus measures
Economic growth deteriorated after the failed coup attempt, but bounced back in Q4 of 2016, and is expected to increase about 4% in 2017. In order to stimula-te faltering domestic demand, the Turkish government uses stimulus measures such as tax breaks and the expansion of its Credit Guarantee Fund in order to prop up economic confidence and credit-led domestic demand. While the bud-get deficit is expected to increase above 2% of GDP in 2017 and 2018, govern-ment finances still have room for temporary stimulus, as government debt is still low at around 30% of GDP.
That said, the business and investment climates are negatively affected by the deterioration in institutional quality. It is expected that the pace of economic ex-pansion in the coming years will remain below the average growth rate between 2010 and 2015 - not enough to absorb the increase in the working age populati-on of about one million people per year. The unemployment rate is already high at 11.5%, and inflation remains persistently high, affecting private consumption growth.
Increased risk in the banking and corporate sectors
The Turkish banking system is still sound, as banks are liquid and well capi-talized (capital adequacy ratio of 16%), while non-performing loans remain generally low (about 3%). However, the government policy aimed at stimulating credit growth is worrying, as there has been a reversal of tighter regulations to slow down credit growth. The loan-to-value ratio has been relaxed from 75% to 80% and the government applies moral suasion on banks to keep mortgage rates low, despite rising funding costs. By now credit growth has exceeded the 15% ceiling previously considered by the Central Bank to be healthy. In the medi-um-run excessive loan growth could push up non-performing-loans.
Through high corporate foreign currency debt banks are also indirectly vulne-rable to currency risk. Total corporate debt has risen to about 66% of GDP by the end of 2016 (from 62% at the beginning of the year), encouraged by credit stimulus. About 45% is denominated in foreign currency. Turkish corporates (particularly in the energy, construction materials, steel, transport (airlines) and chemicals sectors) have extensively borrowed in foreign currency from local banks. As foreign exchange assets only cover about 40% of the liabilities, cor-porates run a substantial currency risk. Most at risk are smaller sized firms with earnings mostly in local currency that are not sufficiently hedged.
Mitigating factors are that two thirds of foreign currency loans are in sectors with a natural hedge (e.g. via export revenues). Moreover, foreign exchange lending growth has slowed, as government policy is promoting the use of credit in liras. So far, Turkish corporates still have good access to international capital markets.
Economic situation
10
8
6
4
2
0
2014 2015 2016 2017f 2018fSource: Macrobond
5.25.9
3.04.1
3.4
Real GDP growth (y-on-y, % change)
10
8
6
4
2
0
2014 2015 2016 2017f 2018fSource: Macrobond
3.0
5.6
2.33.4 3.3
Real private consumption (y-on-y, % change)

23 Print this article Return to contents page
10
8
6
4
2
0 2014 2015 2016 2017f 2018f
Source: Macrobond
5.3
8.9
3.1 3.4
Real fixed investment(y-on-y, % change)
Exchange rate has stabilized, but reserves are low
In the turbulent period after the coup attempt, Turkey faced capital outflows and a sharp depreciation of the lira, of about 17%, against the USD. Foreign reserves declined despite Central Bank measures to limit the drain. Although enough to pay for more than six months of imports, foreign reserves are insufficient to cover the external financing requirements.
This year the exchange rate has stabilized again, partly due to overdue monetary tightening measures by the Central Bank, which somehow managed to resist government pressure to keep interest rates low. While it left its key policy rate unchanged, it has raised its late effective funding rate (Late Liquidity Window) from 10% at the beginning of 2017 in three steps, to 12.25% in April 2017. In order to counter rising interest rate expectations in the US and in light of inflation still well above target, the Central Bank may have to tighten its policy further. Ho-wever, this would curb the domestically driven economic recovery, and may prove to be difficult facing pressure from the government.
High dependence on capital inflow remains a major vulnerability
Turkey’s medium-sized, relatively closed, and low-savings economy remains vulnerable to shocks due to a high reliance on short-term and volatile portfolio capital inflows. The current account deficit remains high in 2017 and 2018, above 4% of GDP. Positive export effects due to a weaker lira are countered by higher import costs on the back of rising oil prices and the ongoing problems in the tourism sector amid increased security risks.
Increasing foreign debt and substantial capital inflows are needed to cover the current account deficits. However, since much of those deficits are financed from volatile short-term capital inflows and sensitive portfolio investment, this makes the economy very vulnerable to any negative shake-ups in financial markets, which could trigger a massive capital withdrawal and could also lead to more fluctuations in the lira exchange rate.
Currently external debt (which is mostly held by the private sector) is considered sustainable, but the level is high (more than 200% in exports of goods and ser-vices), and sensitive to rising interest rates in the US and exchange rate risk.
For the time being shock absorbing capacity is underpinned by sound govern-ment finances, a still solid banking system (despite increased risks) and still good access to international financial markets. Yields on Turkish government bonds continued to ease back to more normal levels since it reached an all-time high in January 2017. Good access to capital is key to ensuring that the large infra-structure projects, which are part of the “Agenda 2023”, are accomplished.
Structural constraints for higher long-term growth remain
The future earnings capacity of the Turkish economy is constrained by macro-economic imbalances related to high credit growth, high inflation and a large external deficit, coupled with structural issues related to its low savings rate and weaknesses in competitiveness, limiting FDI inflow. The investment climate is also hampered by a weak judicial system and an inflexible labour market. Moves to privatise state banks and the power sector are also proceeding too slowly. Wi-thout structural reforms to raise savings, reduce dependency on energy imports and improve the investment climate, Turkey´s potential growth rate will decrease to 3% - 3.5% per annum. However, no major structural reforms are expected in the current political situation.
0
-1
-2
-3
-4
-5
2014 2015 2016 2017f 2018fSource: Macrobond
-4.7
-3.7 -3.8-4.2 -4.1
Current account (% of GDP)
2.8
10
8
6
4
2
0 2014 2015 2016 2017f 2018f
Source: Macrobond
3.1 3.6
7.6 7.88.5
Real government consump-tion (y-on-y, % change)

If you’ve found this country report useful, why not visit our website www.atradius.com, where you’ll find many more Atradius publications focusing on the global economy, including more country reports, industry analysis, advice on credit management and essays on current business issues.
On Twitter? Follow @Atradius or search #countryreports to stay up to date with the latest edition.
Connect with Atradius on Social Media
Atradius N.V.David Ricardostraat 1– 1066 JS Amsterdam
Postbus 8982 – 1006 JD AmsterdamThe Netherlands
Phone: +31 20 553 9111 [email protected]
@atradius Atradius atradius
DisclaimerThis report is provided for information purposes only and is not intended as a recommendation or advice as to par-ticular transactions, investments or strategies in any way to any reader. Readers must make their own independent decisions, commercial or otherwise, regarding the information provided. While we have made every attempt to ensure that the information contained in this report has been obtained from reliable sources, Atradius is not responsible for any errors or omissions, or for the results obtained from the use of this information. All information in this report is provided ’as is’, with no guarantee of completeness, accuracy, timeliness or of the results obtained from its use, and without warranty of any kind, express or implied. In no event will Atradius, its related partnerships or corporations, or the partners, agents or employees thereof, be liable to you or anyone else for any decision made or action taken in reliance on the information in this report or for any consequential, special or similar damages, even if advised of the possibility of such damages.
Copyright Atradius N.V. 2017