financial sector assessment program … sector assessment program stress testing the banking and...
TRANSCRIPT

© 2016 International Monetary Fund
IMF Country Report No. 16/191
GERMANY
FINANCIAL SECTOR ASSESSMENT PROGRAM
STRESS TESTING THE BANKING AND INSURANCE
SECTORS—TECHNICAL NOTE
This Technical Note on Stress Testing the Banking and Insurance Sectors on Germany
was prepared by a staff team of the International Monetary Fund. It is based on the
information available at the time it was completed in June 2016.
Copies of this report are available to the public from
International Monetary Fund Publication Services
PO Box 92780 Washington, D.C. 20090
Telephone: (202) 623-7430 Fax: (202) 623-7201
E-mail: [email protected] Web: http://www.imf.org
Price: $18.00 per printed copy
International Monetary Fund
Washington, D.C.
June 2016
GERMANY FINANCIAL SECTOR ASSESSMENT PROGRAM
TECHNICAL NOTE
STRESS TESTING THE BANKING AND INSURANCE SECTORS
Prepared By Monetary and Capital Markets Department
This Technical Note was prepared in the context of an IMF Financial Sector Assessment Program (FSAP) mission in Germany during February–March 2016 led by Ms. Michaela Erbenova. It contains technical analysis and detailed information underpinning the FSAP’s findings and recommendations. Further information on the FSAP can be found http://www.imf.org/external/np/fsap/fssa.aspx
June 2016

GERMANY
2 INTERNATIONAL MONETARY FUND
CON TENTS
EXECUTIVE SUMMARY ______________________________________________________________________________ 4
INTRODUCTION _____________________________________________________________________________________ 6
FINANCIAL SYSTEM AND MARKET STRUCTURE ___________________________________________________ 8
A. Economic and Financial Interlinkages ______________________________________________________________ 8
B. Banking Sector ____________________________________________________________________________________10
C. Insurance Sector ___________________________________________________________________________________16
STRESS TESTING THE BANKING SECTOR _________________________________________________________ 21
A. Solvency Risk ______________________________________________________________________________________21
B. Liquidity Risk ______________________________________________________________________________________28
STRESS TESTING THE INSURANCE SECTOR ______________________________________________________ 30
A. Data and Methodologies __________________________________________________________________________31
B. Results _____________________________________________________________________________________________36
SYSTEMIC RISK ANALYSIS ________________________________________________________________________ 40
A. Methodologies ____________________________________________________________________________________40
B. Results _____________________________________________________________________________________________40
POLICY RECOMMENDATIONS ____________________________________________________________________ 44 BOX 1. Loss Absorption Capacities ________________________________________________________________________34 FIGURES 1. Cross-Border Banking Exposures ___________________________________________________________________ 8 2. Financial System Structure __________________________________________________________________________ 9 3. Banking System Consolidation ____________________________________________________________________10 4. Banking Sector Structure in 2010 and 2015 _______________________________________________________11 5. Geographical Loan Distribution ___________________________________________________________________12 6. Net Interest Margins for Selected Types of German Banks ________________________________________14 7. Peer Comparison: Asset Quality and Profitability __________________________________________________15 8. Risk- and Asset-based Capital Ratios, and RWA Density __________________________________________15 9. Evidence of Searching for Yield ____________________________________________________________________17 10. Sensitivities of Liabilities and Guaranteed Rate __________________________________________________19 11. Life Insurers’ Interest Rates _______________________________________________________________________20
GERMANY
INTERNATIONAL MONETARY FUND 3
12. Macroeconomic Scenarios—Key Variables _______________________________________________________21 13. Sectoral Exposure Composition and Loan Loss Provisions (2014) ________________________________22 14. Solvency Stress Test ______________________________________________________________________________24 15. Low Interest Rates and Bank Profitability (Bottom-Up Test) ______________________________________25 16. Sovereign Exposures, Risk Index, and Valuation Losses under Stress ____________________________27 17. LCR Estimates ____________________________________________________________________________________28 18. LCR Reported by German Banks in the BCBS QI5) _______________________________________________29 19. Net Stable Funding Ratio (NSFR) Over Time _____________________________________________________29 20. Solvency I Ratios _________________________________________________________________________________31 21. Trend of Solvency II SCR Coverage Ratio (Group Level) __________________________________________33 22. Own Funds and Sources of Loss Absorption Capacities __________________________________________35 23. Overall SCR Coverage Ratio ______________________________________________________________________37 24. Impact Analysis of SCR Changes _________________________________________________________________38 25. Relationship between Loss and Capital Shortfalls ________________________________________________39 26. Outward and Inward Spillover of the German Banking Sector ___________________________________41 27. Interconnectedness among Publicly Traded German Banks and Insurers ________________________41 28. Net Contribution to Systemic Risk _______________________________________________________________42 29. Interconnectedness between Deutsche Bank, Commerzbank, and GSIBs ________________________43 TABLES 1. Key Indicators for Different Types of Banks _______________________________________________________13 2. Sovereign Exposures and Duration ________________________________________________________________26 3. Further Impact Analysis of Large, Medium, and Small Insurers ____________________________________37 ANNEXES I. Insurance Sector Safety Net ________________________________________________________________________46 II. Technical Appendix On Systemic Risk and Spillover Analysis ______________________________________47 III. Stress Test Matrix (STEM) For The Banking Sector ________________________________________________50 IV. Stress Test Matrix (STEM) for the Insurance Sector _______________________________________________61 V. Stress Test Matrix (STEM) For Systemic Risk Analysis ______________________________________________63

GERMANY
4 INTERNATIONAL MONETARY FUND
EXECUTIVE SUMMARY Germany’s financial sector plays a key role in the global economy. The country is home to two global systemically important financial institutions, Deutsche Bank AG and Allianz SE, with domestic and global interlinkages to major financial counterparties, as well as one of the largest global central counterparties (CCP), Eurex Clearing. The Bund, Germany’s sovereign bond, is a safe haven and benchmark for fixed income instruments. But the system is also very heterogeneous, with a large number of smaller banks and insurance companies, and a wide range of different business models. The banking system has consolidated and restructured since the global financial crisis. The number of banks has been decreasing steadily, including through consolidation in certain segments of the system. Banks are working out nonperforming loans, and have been able to strengthen capital positions and asset quality even during the crisis. The Landesbanken, which used to be the weakest link, have been reorienting their business models, and are now less homogenous. Public ownership in the banking system continues to be substantial, albeit declining.
While banks’ strong solvency position and predominantly conservative business models point to a stable system, the sector is not immune to risks. First, the drop in global demand is leaving its mark on German exporters with effects on banks. And structural changes, like in the shipping and manufacturing industries, are increasing banks’ credit risk. Second, the largest German banks are highly interconnected with strong ties to European and global markets, and are exposed to market volatility. Unusual volatilities, as experienced in the beginning of the year, can have a substantial impact on the banks’ trading income and balance sheet positions, as well as on their share prices. Third, the low interest rate environment is taking a toll on banks exclusively engaged in maturity transformation, which have seen their interest income drop considerably in recent years. This income drop has, however, been largely offset by reduced interest expenses, thanks to unprecedented favorable market funding and ECB refinancing conditions. And fourth, the new regulatory and supervisory framework, together with the introduction of bail-inable debt and a number of macroprudential tools, has led to a new, more restricted environment, to which the banks have to adapt.
German insurers face challenges from the low interest rate environment. Despite the potential for stimulating the economy in general, ultra-low interest rates have become a serious issue for life insurance companies. While it is not an immediate financial stability concern, a prolonged period of low rates will seriously challenge insurance companies’ business models and their ability to generate returns, which are guaranteed in certain insurance policies. Capital adequacy ratios have been on a downward trend in recent years. The EU framework for insurance regulation, Solvency II, in effect since January 1, 2016, has created additional pressures on life insurers to recognize, in a forward looking assessment, the impact of low interest rates on solvency. All these factors have contributed to a search for yield, where some insurers look for riskier investments.
Risk analyses show that most banks are resilient to severe shocks, thanks to substantial capital and liquidity buffers. Under the baseline scenario, banks would on average sustain their current solvency levels, although some banks may become challenged as net interest income continues to compress. Under the adverse scenarios, banks would see their loan losses rise sharply, while adverse
GERMANY
INTERNATIONAL MONETARY FUND 5
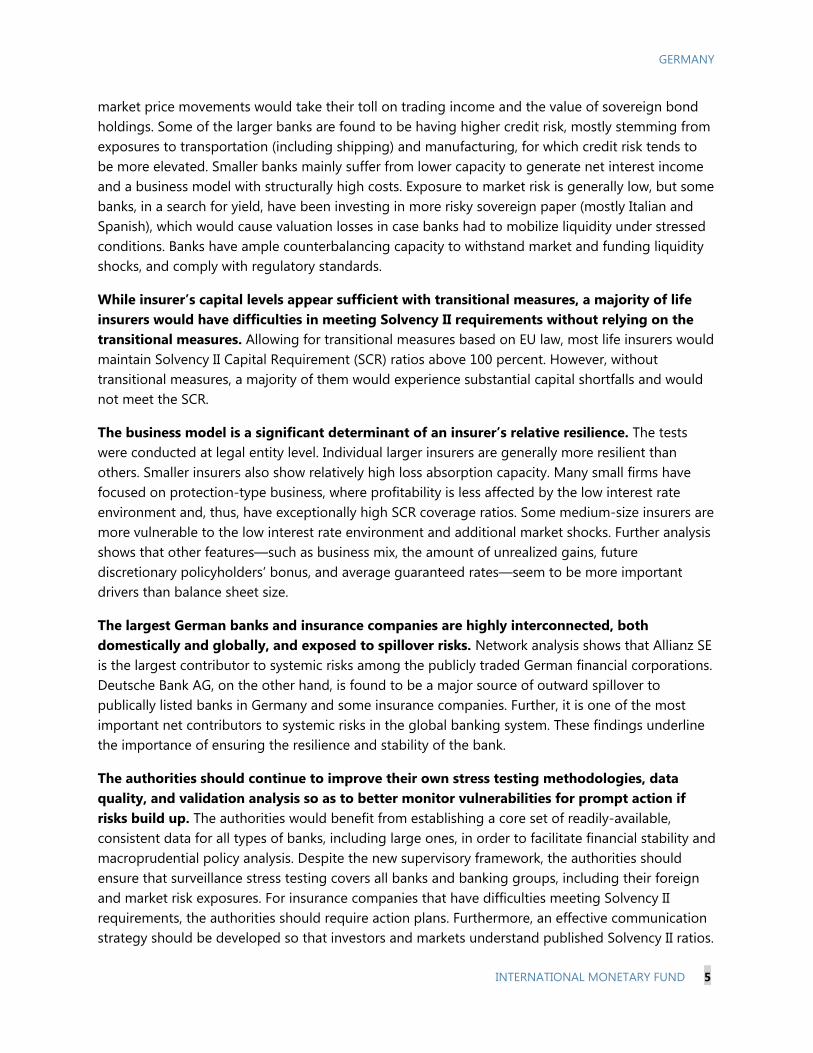
market price movements would take their toll on trading income and the value of sovereign bond holdings. Some of the larger banks are found to be having higher credit risk, mostly stemming from exposures to transportation (including shipping) and manufacturing, for which credit risk tends to be more elevated. Smaller banks mainly suffer from lower capacity to generate net interest income and a business model with structurally high costs. Exposure to market risk is generally low, but some banks, in a search for yield, have been investing in more risky sovereign paper (mostly Italian and Spanish), which would cause valuation losses in case banks had to mobilize liquidity under stressed conditions. Banks have ample counterbalancing capacity to withstand market and funding liquidity shocks, and comply with regulatory standards.
While insurer’s capital levels appear sufficient with transitional measures, a majority of life insurers would have difficulties in meeting Solvency II requirements without relying on the transitional measures. Allowing for transitional measures based on EU law, most life insurers would maintain Solvency II Capital Requirement (SCR) ratios above 100 percent. However, without transitional measures, a majority of them would experience substantial capital shortfalls and would not meet the SCR.
The business model is a significant determinant of an insurer’s relative resilience. The tests were conducted at legal entity level. Individual larger insurers are generally more resilient than others. Smaller insurers also show relatively high loss absorption capacity. Many small firms have focused on protection-type business, where profitability is less affected by the low interest rate environment and, thus, have exceptionally high SCR coverage ratios. Some medium-size insurers are more vulnerable to the low interest rate environment and additional market shocks. Further analysis shows that other features—such as business mix, the amount of unrealized gains, future discretionary policyholders’ bonus, and average guaranteed rates—seem to be more important drivers than balance sheet size.
The largest German banks and insurance companies are highly interconnected, both domestically and globally, and exposed to spillover risks. Network analysis shows that Allianz SE is the largest contributor to systemic risks among the publicly traded German financial corporations. Deutsche Bank AG, on the other hand, is found to be a major source of outward spillover to publically listed banks in Germany and some insurance companies. Further, it is one of the most important net contributors to systemic risks in the global banking system. These findings underline the importance of ensuring the resilience and stability of the bank.
The authorities should continue to improve their own stress testing methodologies, data quality, and validation analysis so as to better monitor vulnerabilities for prompt action if risks build up. The authorities would benefit from establishing a core set of readily-available, consistent data for all types of banks, including large ones, in order to facilitate financial stability and macroprudential policy analysis. Despite the new supervisory framework, the authorities should ensure that surveillance stress testing covers all banks and banking groups, including their foreign and market risk exposures. For insurance companies that have difficulties meeting Solvency II requirements, the authorities should require action plans. Furthermore, an effective communication strategy should be developed so that investors and markets understand published Solvency II ratios.

GERMANY
6 INTERNATIONAL MONETARY FUND
INTRODUCTION1 1. Macroprudential stress testing is one of the most powerful tools for analyzing the stability of financial systems. At the International Monetary Fund (IMF), stress testing has become a central instrument of financial system surveillance. It is a key component of the FSAP, and also an important tool in early warning exercises, surveillance under Article IV, and IMF programs. FSAPs are intended to help member countries identify key sources of systemic risk in the financial sector and implement policies to enhance its resilience to shocks and contagion. These stress tests focus on credit, market, liquidity, and contagion risk.2
2. This Technical Note assesses Germany’s financial system and, in particular, its potential for spillover risk. The analysis comprises structural and financial statement analyses, detailed stress tests for banks and insurance companies, and spillover risk analysis. Solvency and liquidity stress tests cover all 1,776 banks operating in Germany, and the insurance sector analysis covers 93 percent of the life insurance sector in terms of the assets. Risk factors assessed are solvency risk, including credit, market, foreign exchange, asset, equity and house price risk, interest rate risk, funding and market liquidity risk, as well as insurance specific risks like lapse and mortality risks.
3. The risk and vulnerability analysis under the Germany FSAP comprises a very broad set of analyses and tools, which allows for an in-depth analysis of the system’s resilience. The tools include structural analysis, financial statement analysis, stress testing of banks and insurers, as well as domestic and cross-border spillover analysis. The EU CRD IV/CRR forms the basis for the assessment of banks, and insurance companies are assessed against Solvency II. The loss-absorbing capacity of certain capital instruments and long-term impact on policyholder behavior of dividend policies would be the most important factors in the analysis of financial soundness of the life insurers.
4. The FSAP team used multiple data sources to compile a database for banking sector stress testing. For small and medium banks, the FSAP team used bank-by-bank supervisory data on regulatory capital and income statement, the borrower statistics on credit risk exposure, together with data on trading income, FX exposures, and sovereign exposures. For large banks, the FSAP team constructed, in order to overcome data gaps, a stress testing database using five different sources: the European reporting templates (FINREP and COREP), 2015 EBA Transparency exercise, supervisory data from the Bundesbank, and Bankscope. In particular, the COREP database provided regulatory information, while the FINREP and the EBA transparency exercise data cross-validated the income statement and information on sovereign exposures. For those large banks that did not apply IFRS accounting, the data were complemented by supervisory data from the Bundesbank and Bankscope. Data access was further constrained by a data sharing arrangement whereby the IMF
1 This Technical Note was prepared by Emanuel Kopp, Western Hemisphere Department, IMF, Nobuyasu Sugimoto, and TengTeng Xu, both Monetary and Capital Markets Department, IMF. 2 Certain categories of risk affecting financial institutions—such as legal risk, business risk, or risk related to fraud—are not subject to FSAP risk analysis.

GERMANY
INTERNATIONAL MONETARY FUND 7
staff had access to confidential data only within the premises of the Deutsche Bundesbank, limiting ability to back-test results or make any adaptations to onsite work only.
5. To test the resilience of banks and insurers, the FSAP analyzed three macrofinancial scenarios: (i) a global stress scenario with serious recessions in advanced economies, triggered by a tightening of global financial conditions and credit cycle downturns in emerging economies (EMs); (ii) the reemergence of an EA balance sheet recession; and (iii) excessive financial risk-taking in response to the low interest rate environment. These are analyzed using a battery of quantitative techniques:
A global stress scenario could result from a slow or incomplete implementation of structural reforms in Europe, China, and Japan, hampering medium-term growth prospects. Oil prices would drop even further. Suppressed demand from EMs and oil exporters would dampen global trade. German exporters would be hit by reduced demand, and both investment and consumption would drop as confidence deteriorates. A sharp correction of asset prices, paired with strong foreign exchange rate movements, would affect un-hedged market positions and hit banks’ trading income.
The return of the EA crisis could be triggered by continued policy uncertainty, delays in structural reforms, as well as social resistance to austerity programs combined with generally lower investor sentiment towards the EA. In this scenario, sovereign yields in highly indebted EA countries would increase sharply, driving up market refinancing costs for both sovereigns and banks. In countries with a weak corporate sector, this could lead to a growing corporate indebtedness and weakening bank asset quality, while the sovereign-bank link could intensify. Even though still relevant, flight-to-quality effects would diminish, and also the ‘core’ countries would see their refinancing conditions deteriorate, albeit to a lesser extent. Investor sentiment would deteriorate, and the EA would enter a deflationary phase. The uncertainties associated with the possibility of a British exit from the EU could usher in a heightened macroeconomic uncertainty and financial market volatility.
Excessive risk-taking associated with the protracted low interest rate environment may result from banks and insurers tempted to adopt risky search-for-yield strategies. In principle, banks are key beneficiaries of the unconventional monetary policy in the EA through improved growth prospects and borrower credit worthiness, amongst others. However, prevailing business models of German banks and insurers may make them particularly vulnerable to the associated adverse side effects.3 Separately, lower market liquidity fuels asset price volatility. Banks could see a drop in deposit funding, and institutional investors could channel funds towards higher-yield investments.
3 Current negative interest rates may be unique in accelerating margin compression over time as banks have so far proven unwilling or legally unable to pass on the negative rates to depositors. The impact on different types of banks depends on their capacity to reprice loans, deposits and non-deposit liabilities, the relative importance of net interest income to profitability, and ability to generate noninterest income. See IMF (2016), “Global Financial Stability Report”, April 2016, Chapter 1, Box 1.3 for a discussion on broader effects of low and negative interest rates on banks.

GERMANY
8 INTERNATIONAL MONETARY FUND
FINANCIAL SYSTEM AND MARKET STRUCTURE A. Economic and Financial Interlinkages
6. Germany is highly interconnected through trade and financial channels. The total consolidated claims of German banks on foreign banks, the non-bank private sector, and the public sector stood at about USD $1.7 trillion in 2015Q2 (45 percent of GDP), with the majority of the cross-border exposures vis-à-vis the United States, the United Kingdom, France, and Italy. A similar pattern is observed for foreign claims on Germany, which reached about USD $1.3 trillion in the first half of 2015 (34 percent of GDP), with the largest claims from Italy, France, the Netherlands, the United States, and the United Kingdom (Figure 1). Consistent with banking sector exposures, Europe and the United States also have close linkages with Germany through trade, sovereign holdings, and cross-border exposures through the insurance sector.
Figure 1. Cross-Border Banking Exposures
Sources: BIS Consolidated Banking Statistics, IMF Staff calculations.
7. Intermediation is concentrated between households (HHs) and financial institutions, while nonfinancial corporates (NFCs) rely less on bank financing, and more on intra-segment financing (Figure 2). A network diagram developed by the FSAP team shows that, compared to households, NFCs rely less on the bank channel and more on intra-segment financing (such as trade and suppliers’ credits, loans to subsidiaries). Households are closely interlinked with banks (loans; deposits, bank bonds, and equity holdings) and insurance companies (via claims on insurance reserves). NFC financing by households mainly constitutes payments to corporate pension funds. Insurance companies, pension funds, and (to a lesser extent) households have increased their exposure to investment funds. Insurance companies and investment funds are expanding their claims via debt securities, which have almost doubled since 2008.
0
100
200
300
400
500
US
UK
Fran
ce
Italy
Spai
n
Net
herla
nds
Switz
erla
nd
Aust
ria
Irela
nd
Swed
en
Public Sector Non-bank private sector Banks
German Banks' Combined Foreign Claims: Top 10 Countries by Exposure(in USD bn)
Numbers are from Q2 2015 on an ultimate risk basis.
0
40
80
120
160
200Ita
ly
Net
herla
nds*
Fran
ce US
UK
Japa
n
Switz
erla
nd
Swed
en
Spai
n
Aust
ria
Public Sector Non-bank private sector Banks
Consolidated Foreign Claims on Germany: Top 10 Countries by Origin(in USD bn)
Numbers are from Q2 2015 on an ultimate risk basis.Note '*' : For the Netherlands, the breakdown by public sector, non-bank private sector and banks were were estimated by the corresponding share for total foreign claims on Germany, as the disaggregated data were not published by the BIS.

GERMANY
INTERNATIONAL MONETARY FUND 9
Figure 2. Financial System Structure Intermediation is concentrated between households and
financial institutions …
…while nonbanks play a smaller role.
Banks’ business models are conservative … …. But suppressed interest rate margins depress returns
from maturity transformation.
Source: Bundesbank, ECB, IMF staff calculations.
Notes: The category “banks” includes all monetary financial institutions as defined by the ECB. All financial instruments for which comprehensive debtor/creditor relationships exist are taken into account (deposits, debt securities, loans, listed shares, investment fund shares and claims on insurance corporations and pension funds). The thickness of the edges indicates how strongly various sectors are interlinked, and the size of the node gives the interconnectedness within a sector. The arrows show the direction of interlinkages (from whom to whom).
8. Germany’s financial sector is dominated by banks and is rather heterogeneous. In particular, the financial system is characterized by the presence of a large number of savings and cooperative banks as well as global players like Deutsche Bank AG and Allianz SE, two systemically important financial institutions. Germany’s banking sector accounts for close to 70 percent of total financial sector assets (Figure 2). The insurance sector is smaller than its peers as a share of GDP, while the asset management sector is the third-largest in Europe as measured by assets under management (57 percent of GDP).
68%
5%
9%
3%
4%
2%
8%
Financial System Overall Structure
Banks
Pension Funds
Life Insurers
Reinsurers
Other Insurers
Retail Funds
Special Funds
Source: Bundesbank
0
2
4
6
8
10
2011 2015 2011 2015
Banking System Assets and Liabilities(in EUR tn)
Cash
Lending to MFIs
Lending to non-MFIs
Participating interests
Other assets
Deposits of MFIs
Deposits of non-MFIs
Debt securities
Capital
Other liabilities
Source: Bundesbank
Total Assets Total Liabilities
Households NFC
PublicSectorBanks
OtherIntermediaries
Insurance
PensionFundsInvestmentFunds
-1.0
-0.5
0.0
0.5
1.0
1.5
2.0
2.5
3.0
1 2 3 4 5 6 7 8 9 10 15
Yield Curve(in percent)
EA par yield rate, all EA central government bondsGermany par yield rate, all german central government bonds
Years
Data as of December 30, 2015Source: Bundesbank, ECB

GERMANY
10 INTERNATIONAL MONETARY FUND
9. Germany is also home to Eurex Clearing, one of the world’s largest CCPs, interlinked with over 180 clearing members in 17 countries. Eurex Clearing is one the largest CCPs in the world for exchange-traded derivatives with a large and global membership. Its clearing members include 24 globally significant banks (G-SIBs), creating potential contagion channels through interbank markets and multiple memberships of these G-SIBs in CCPs around the world.
10. Germany’s sovereign bonds, the Bunds, continue to be a global safe haven benchmark in fixed income, and yields have been historically low in recent years. The low yields, in fact negative for bonds with maturity up to five years, reflect in part Germany’s stable macro economic conditions, and the expectation of further unconventional monetary policy measures and continued easing stance in the euro zone.
B. Banking Sector Structural Analysis
11. The German banking sector comprises three main “pillars”: private commercial banks, public savings banks, and cooperative banks. While the three-pillar structure has been fairly stable over the past decade, the German banking system has gone through a sustained period of consolidation.4 Since 2010, the number of banks has declined by about 100, with consolidation mainly taking place at local savings and cooperative banks level (Table 1, Figure 3).
4 Compared with 1995, the number of banking institutions has declined by about 50 percent.
Figure 3. Banking System Consolidation
The number of banks has declined by more than one hundred since 2010.
Source: Deutsche Bundesbank Monthly Reports
1,650
1,700
1,750
1,800
1,850
1,900
1,950
2,000
2010 2011 2012 2013 2014 2015 2016 (Feb)
Germany: Number of Banking Institutions

GERMANY
INTERNATIONAL MONETARY FUND 11
Figure 4. Banking Sector Structure in 2010 and 2015
Source: Deutsche Bundesbank
12. The first pillar, private commercial banks, is composed of big banks, regional and other commercial banks, and branches of foreign banks (Figure 4). While comparatively lower in the number of institutions, private commercial banks represent the largest segment of the banking sector by assets, accounting for 39 percent of the system in May 2015, slightly above the share in 2010. The “big banks” tend to operate with large branch networks, both domestically and internationally. They typically cover retail, corporate banking as well as investment banking business, and act as the principal banking partners of Germany’s major industrial enterprises.5 The regional and other commercial banks tend to be smaller in size and operate within a particular region, mainly focusing on credit to households and non-financial corporates, with deposits as the primary source of funding (Deutsche Bundesbank, 2015).
13. The second pillar, public savings banks, includes both Landesbanken and savings banks (Sparkassen) and accounts for about 27 percent of banking system assets. The savings banks operate under a regional principle, providing a range of banking services to households and small- and medium- enterprises (SMEs) in their own region. While competing with commercial banks, savings banks do not tend to compete with each other and they are mandated to provide a public good and to support local economic development. Landesbanken, the central institution of the savings banks, have become increasingly involved in wholesale banking and capital market activities in recent years, in direct competition with commercial banks (Deutsche Bundesbank, 2015). While local savings banks weathered the 2008 financial crisis fairly well, partly due to their conservative business models and strong deposit base, some Landesbanken experienced large losses as a result of their involvement in structured finance and derivative products. As a result, several Landesbanken were consolidated and merged after the crisis.6
5 The “big bank” group includes Commerzbank, Deutsche Bank, Deutsche Postbank, and UniCredit. 6 The savings banks and the Landesbanken were backed by mutual guarantees in the past; however, the guarantees were phased out in 2005.
Commercial banks39%
Landesbanken13%
Savings banks14%
Regional institutions of credit cooperatives
4%
Credit cooperatives10%
Mortage banks5%
Building and loan associations
3%Special purpose
banks12%
German Banking System(Share of Banking Sector Assets, as of May 2015)
Commercial banks36%
Landesbanken18%
Savings banks13%
Regional institutions of credit cooperatives
3%
Credit cooperatives8%
Mortage banks
9%
Building and loan associations
2% Special purpose banks11%
German Banking System(Share of Banking Sector Assets, as of December 2010)

GERMANY
12 INTERNATIONAL MONETARY FUND
14. The third pillar, cooperative banks, includes more than 1,000 financial institutions, accounting for about 14 percent of the banking assets. Similar to savings banks, credit cooperatives are subject to a regional principle and operate under an extensive network of regional branches, with mutual guarantees. The cooperative banks are owned by their members, who tend also to be their depositors and borrowers, and usually offer core banking services to their customers. The two regional institutions of credit cooperative act as central institutions for cooperative banks, DZ-Bank-AG, and WGZ-Bank-AG, with the former also being a large commercial bank in Germany. The regional institutions of credit cooperatives play a more active role than the Landesbanken in redistributing liquidity among the affiliated institutions, operating chiefly in the interbank and capital markets (Deutsche Bundesbank, 2015).
15. The remaining 20 percent of the German banking sector comprises mortgage banks, building and loan associations and special purpose banks. Mortgage banks suffered sizable losses during the financial crisis, and subsequently went through restructuring and resolution. Their asset size has declined to under five percent of the banking system in 2015 (Table 1).
16. While the German banking sector has sizeable linkages with U.S. and the rest of Europe in absolute terms, it is generally oriented towards the domestic market (Figure 5). Changing business models have induced shifts in exposures from advanced economies to the German market. Loan exposures to German borrowers increased to 80 percent of the banks’ credit portfolio (up +10 percent since 2010). Engagement in Asia and Eastern and Central Europe continues to be very low. The sectoral distribution of loan exposures, however, has changed only slightly over time. At end-2014, foreign exposures still constituted 25 percent of the lending portfolio (down 2 percentage points since 2010). The other notable change is in loans to households and non-profit institutions serving households (+2.5 percentage points).
Figure 5. Geographical Loan Distribution
Source: IMF FSI Database
Domestic Exposures
73%Advanced
Economies w/o China24%
Central and Eastern Europe,
CIS1%
Developing Asia w/China
0%
Other2%
Geographical Loan Distribution2010Q1
Domestic Exposures
80%
Advanced Economies w/o
China17%
Central and Eastern Europe,
CIS1%
Developing Asia w/China
0%
Other2%
Geographical Loan Distribution2014Q3
GERMANY
INTERNATIONAL MONETARY FUND 13
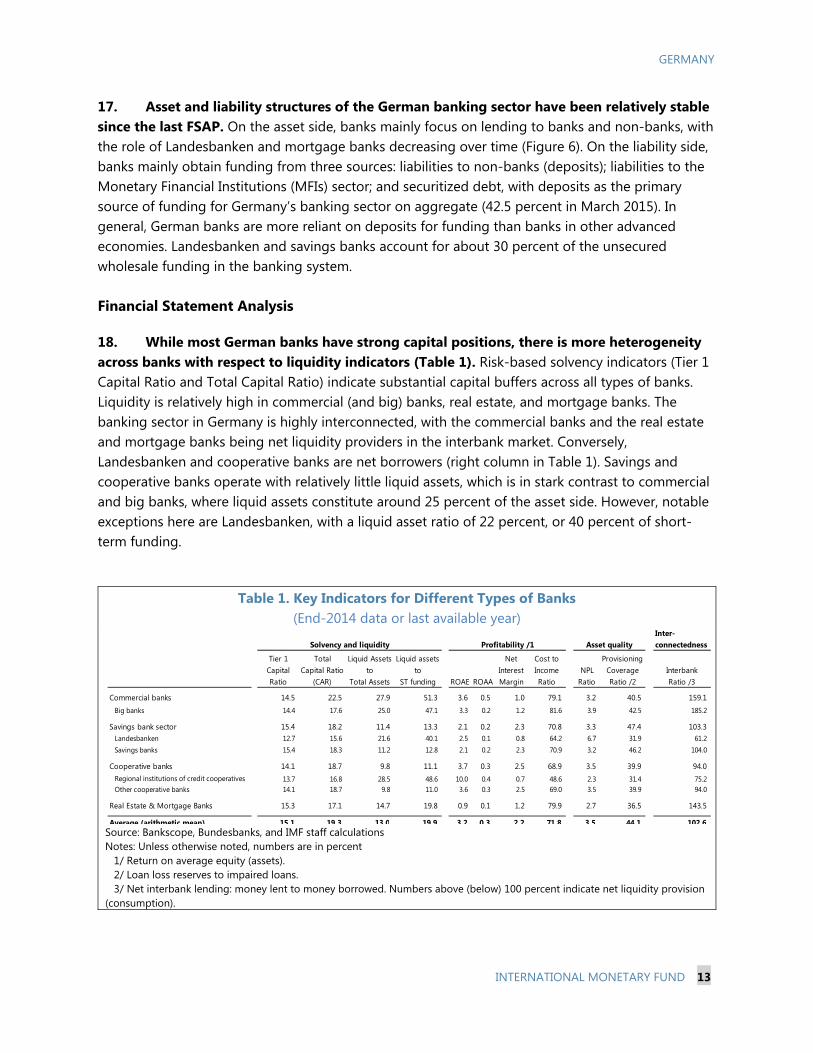
17. Asset and liability structures of the German banking sector have been relatively stable since the last FSAP. On the asset side, banks mainly focus on lending to banks and non-banks, with the role of Landesbanken and mortgage banks decreasing over time (Figure 6). On the liability side, banks mainly obtain funding from three sources: liabilities to non-banks (deposits); liabilities to the Monetary Financial Institutions (MFIs) sector; and securitized debt, with deposits as the primary source of funding for Germany’s banking sector on aggregate (42.5 percent in March 2015). In general, German banks are more reliant on deposits for funding than banks in other advanced economies. Landesbanken and savings banks account for about 30 percent of the unsecured wholesale funding in the banking system. Financial Statement Analysis
18. While most German banks have strong capital positions, there is more heterogeneity across banks with respect to liquidity indicators (Table 1). Risk-based solvency indicators (Tier 1 Capital Ratio and Total Capital Ratio) indicate substantial capital buffers across all types of banks. Liquidity is relatively high in commercial (and big) banks, real estate, and mortgage banks. The banking sector in Germany is highly interconnected, with the commercial banks and the real estate and mortgage banks being net liquidity providers in the interbank market. Conversely, Landesbanken and cooperative banks are net borrowers (right column in Table 1). Savings and cooperative banks operate with relatively little liquid assets, which is in stark contrast to commercial and big banks, where liquid assets constitute around 25 percent of the asset side. However, notable exceptions here are Landesbanken, with a liquid asset ratio of 22 percent, or 40 percent of short-term funding.
Table 1. Key Indicators for Different Types of Banks (End-2014 data or last available year)
Source: Bankscope, Bundesbanks, and IMF staff calculations Notes: Unless otherwise noted, numbers are in percent 1/ Return on average equity (assets). 2/ Loan loss reserves to impaired loans. 3/ Net interbank lending: money lent to money borrowed. Numbers above (below) 100 percent indicate net liquidity provision (consumption).
Inter-connectedness
Tier 1 Capital Ratio
Total Capital Ratio
(CAR)
Liquid Assets to
Total Assets
Liquid assets to
ST funding ROAE ROAA
Net Interest Margin
Cost to Income Ratio
NPL Ratio
Provisioning Coverage Ratio /2
Interbank Ratio /3
Commercial banks 14.5 22.5 27.9 51.3 3.6 0.5 1.0 79.1 3.2 40.5 159.1Big banks 14.4 17.6 25.0 47.1 3.3 0.2 1.2 81.6 3.9 42.5 185.2
Savings bank sector 15.4 18.2 11.4 13.3 2.1 0.2 2.3 70.8 3.3 47.4 103.3Landesbanken 12.7 15.6 21.6 40.1 2.5 0.1 0.8 64.2 6.7 31.9 61.2Savings banks 15.4 18.3 11.2 12.8 2.1 0.2 2.3 70.9 3.2 46.2 104.0
Cooperative banks 14.1 18.7 9.8 11.1 3.7 0.3 2.5 68.9 3.5 39.9 94.0Regional institutions of credit cooperatives 13.7 16.8 28.5 48.6 10.0 0.4 0.7 48.6 2.3 31.4 75.2Other cooperative banks 14.1 18.7 9.8 11.0 3.6 0.3 2.5 69.0 3.5 39.9 94.0
Real Estate & Mortgage Banks 15.3 17.1 14.7 19.8 0.9 0.1 1.2 79.9 2.7 36.5 143.5
Average (arithmetic mean) 15.1 19.3 13.0 19.9 3.2 0.3 2.2 71.8 3.5 44.1 102.6
Solvency and liquidity Profitability /1 Asset quality
GERMANY
14 INTERNATIONAL MONETARY FUND
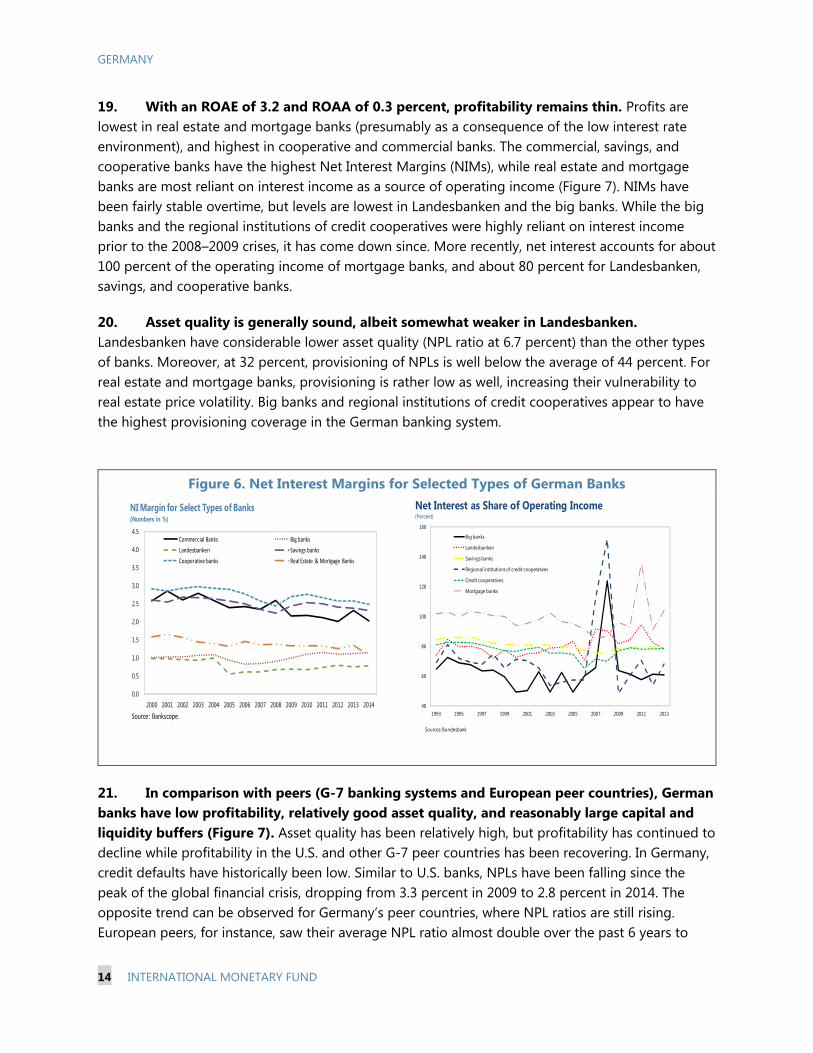
19. With an ROAE of 3.2 and ROAA of 0.3 percent, profitability remains thin. Profits are lowest in real estate and mortgage banks (presumably as a consequence of the low interest rate environment), and highest in cooperative and commercial banks. The commercial, savings, and cooperative banks have the highest Net Interest Margins (NIMs), while real estate and mortgage banks are most reliant on interest income as a source of operating income (Figure 7). NIMs have been fairly stable overtime, but levels are lowest in Landesbanken and the big banks. While the big banks and the regional institutions of credit cooperatives were highly reliant on interest income prior to the 2008–2009 crises, it has come down since. More recently, net interest accounts for about 100 percent of the operating income of mortgage banks, and about 80 percent for Landesbanken, savings, and cooperative banks.
20. Asset quality is generally sound, albeit somewhat weaker in Landesbanken. Landesbanken have considerable lower asset quality (NPL ratio at 6.7 percent) than the other types of banks. Moreover, at 32 percent, provisioning of NPLs is well below the average of 44 percent. For real estate and mortgage banks, provisioning is rather low as well, increasing their vulnerability to real estate price volatility. Big banks and regional institutions of credit cooperatives appear to have the highest provisioning coverage in the German banking system.
21. In comparison with peers (G-7 banking systems and European peer countries), German banks have low profitability, relatively good asset quality, and reasonably large capital and liquidity buffers (Figure 7). Asset quality has been relatively high, but profitability has continued to decline while profitability in the U.S. and other G-7 peer countries has been recovering. In Germany, credit defaults have historically been low. Similar to U.S. banks, NPLs have been falling since the peak of the global financial crisis, dropping from 3.3 percent in 2009 to 2.8 percent in 2014. The opposite trend can be observed for Germany’s peer countries, where NPL ratios are still rising. European peers, for instance, saw their average NPL ratio almost double over the past 6 years to
Figure 6. Net Interest Margins for Selected Types of German Banks
0.0
0.5
1.0
1.5
2.0
2.5
3.0
3.5
4.0
4.5
2000 2001 2002 2003 2004 2005 2006 2007 2008 2009 2010 2011 2012 2013 2014
NI Margin for Select Types of Banks(Numbers in %)
Commercial Banks Big banks
Landesbanken Savings banks
Cooperative banks Real Estate & Mortgage Banks
Source: Bankscope.
40
60
80
100
120
140
160
1993 1995 1997 1999 2001 2003 2005 2007 2009 2011 2013
Big banks
Landesbanken
Savings banks
Regional institutions of credit cooperatives
Credit cooperatives
Mortgage banks
Net Interest as Share of Operating Income(Percent)
Sources: Bundesbank

GERMANY
INTERNATIONAL MONETARY FUND 15
5.5 percent at end-2014. In addition, more than 50 percent of banking sector assets in Germany (AQR sample) have NPL ratios below 5 percent—a more favorable position than in most of the euro area peers.
Figure 7. Peer Comparison: Asset Quality and Profitability
Source: IMF. FSI data on “Return on Equity” starts from 2009 for Germany and the U.S.
22. While risk-based capital ratios give the impression of substantial solvency buffers, RWA density is relatively low (Figure 8). Looking at the capital adequacy ratio (CAR), the German banking system appears very well capitalized compared to its peers (left chart). This result is, however, mainly due to relatively low risk-weighted assets, on average. German banks’ average RWA density (RWA to total assets) stood at only 31.2 percent in December 2014—well below the peer groups (right chart). Capital ratios may, therefore, understate risks as leverage remains high for some banks. On the other hand, German banks’ aggregate leverage ratio (measured as regulatory capital to total assets) stands at just 5.6 percent, i.e., at the G-7 average, but still below its European peer group.
Figure 8. Risk- and Asset-based Capital Ratios, and RWA Density
Source: IMF, EBA, ECB. IMF staff calculations.
0
2
4
6
8
10
2009 2010 2011 2012 2013 2014
Non-performing Loans(in percent of total loans)
Germany US G-7, average EA Peers, average
-10
0
10
20
30
40
2005 2006 2007 2008 2009 2010 2011 2012 2013 2014
Return on Equity (in percent)
Germany US G-7, average EA Peers, average
20
30
40
50
60
70
80
90
100
2009 2010 2011 2012 2013 2014
RWA Density (RWA to total assets, percent)
Germany US
Other G-7, average EA peers, average
4
5
6
7
8
9
10
11
12
13
14
2009 2010 2011 2012 2013 2014
Leverage Ratio(Regulatory capital to total assets, percent)
Germany US
Other G-7, average EA peers, average
10
11
12
13
14
15
16
17
18
19
20
2009 2010 2011 2012 2013 2014
Capital Adequacy Ratio(Regulatory capital to RWA, percent)
Germany US
Other G-7, average EA peers, average

GERMANY
16 INTERNATIONAL MONETARY FUND
C. Insurance Sector 23. German life insurers invest conservatively. The largest shares of life insurers’ investments are in German government securities (25 percent) and mortgage bonds (21 percent), which are ultimately financed by the originating banks, followed by bonds of financial institutions (11 percent). Exposures to equity and other risky assets are limited (equity exposure amounts to 6 percent and the total alternative investments to one percent). At 12 and 4 percent, respectively, loan and real estate exposures also are relatively low. The investment allocation of non-life insurers (property and casualty (P&C) and reinsurers) is similarly conservative.
24. Nevertheless, there is evidence of search for yield. Against the backdrop of prolonged low interest rates, life insurers have increased the share of corporate bonds from 4.3 percent in 2011 to 8.2 percent in the second quarter of 2015. Average ratings in the fixed income portfolio of life insurers have declined, including through rating downgrades without active changes in asset allocation. Meanwhile, the portion of securities with AAA ratings fell from 48.5 percent to 36.2 percent between 2011 and 2014, while the share of BBB rose from 6.6 percent to 9.9 percent (Figure 9), reflecting rating migrations. German insurance groups have also stepped up their investment in non-German sovereign bonds. For example, investment in Italian and Spanish government bonds increased by 5 and 25 percent, respectively, from 2013 to 2014, albeit from a low basis, while exposures to the German Bund fell slightly. For German life insurers, asset duration increased from 8.1 years to 10 years (2011 to 2014). While this helps the industry reduce the duration gap and interest rate risk, higher risk investments (such as BBB) with longer duration build up credit risks going forward.
25. Products with guarantees still dominate the life insurance market. In contrast to other advanced economies, the German insurance market is dominated by minimum guarantee products (such as participating products). Unit-linked and related products account for less than 10 percent of the total liabilities of life insurers. Data on premiums from new sales of unit-linked products (which accounted for about 15 percent of total premium income in the last 5 years) suggest that they may increase in the future, but likely only gradually. Non-life insurance is characterized by traditional lines of business (such as motor, property, and liability). At less than 1 percent of total premium income, the share of less traditional business lines, such as credit and surety insurance, is negligible.
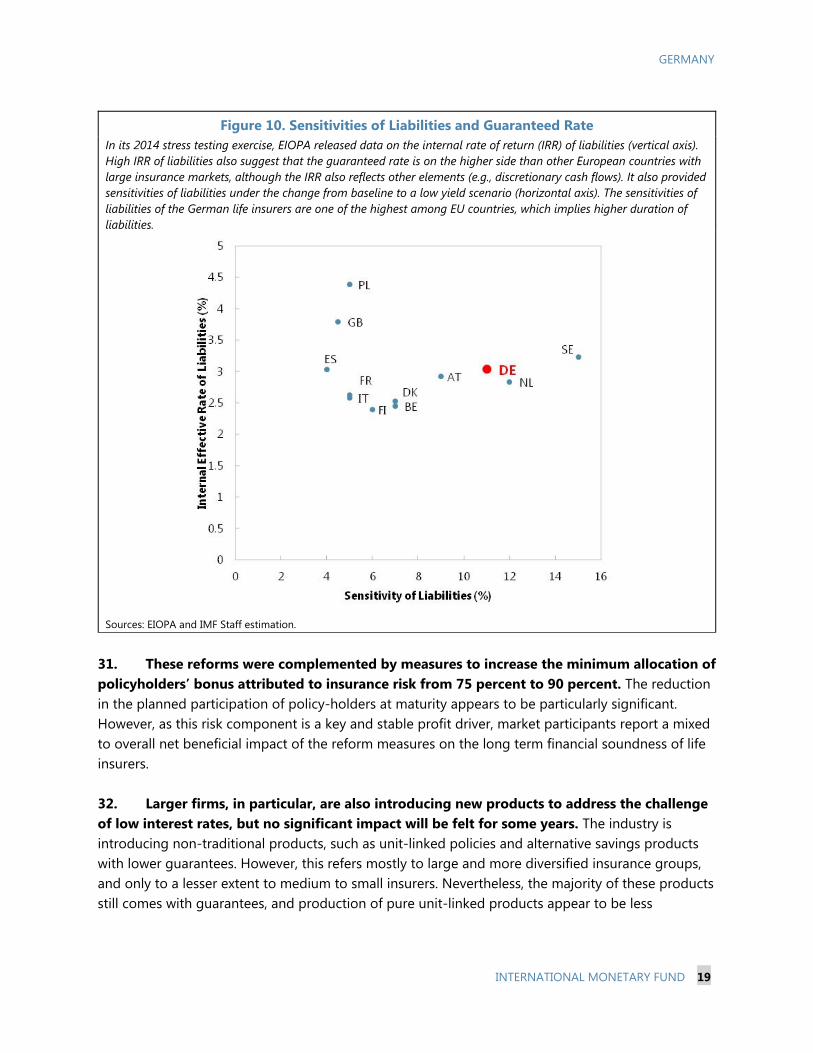
26. Guarantee products expose life insurers to risks (Figure 10). According to the European Insurance and Occupational Pensions Authority (EIOPA), the average rate for existing products guaranteed by German insurers is one of the highest among European countries. In addition, the duration of liabilities is relatively long which requires German life insurers to cover the guaranteed costs for substantially longer periods than insurers in other countries.7
7 The average duration of insurance liabilities is difficult to estimate, owing to complex contingencies inherent in insurance products. Also, longer duration could entail a degree of resiliency resulting from the promise of future discretionary bonuses.

GERMANY
INTERNATIONAL MONETARY FUND 17
Figure 9. Evidence of Searching for Yield Fixed income portfolios are gradually shifting to lower credit grades
.
Sources: Bundesbank and Assekurata
Modified duration of fixed income portfolio of life insurers has increased in the last 4 years.
Source: Assekurata.
27. Owing to the dominance of guaranteed products, prolonged low interest rates are affecting the financial soundness of life insurers. Although maximum rates are set by the Ministry of Finance (and are reduced gradually in accordance with market rates to 0.9 percent by January 2017), the maximum rate applies only to new policies and the guarantee rates for existing policies
0%
20%
40%
60%
80%
100%
2011 2012 2013 2014
Life Insurers: FI Portfolio Rating Distribution
High Yield BBB A AA AAA
0 3 6 9 12 15
AAA
AA
A
BBB
HighYield
Total
Duration of Assets (Year)
2011 2012 2013 2014

GERMANY
18 INTERNATIONAL MONETARY FUND
remain unchanged at the level of the origination time.8 Consequently, the average contractual guarantee rate can and has been reduced only gradually and now stands at 3 percent. At the same time, average investment returns have declined more rapidly. For this reason, German insurers have already built an additional premium reserve in recent years, reducing the strain from high contractual guarantees to some extent.
28. Health, property and casualty, and reinsurance companies appear to be more robust. They are also affected by the low interest rate environment but to a more limited extent, reflecting lower dependence on investment returns. Other risks, from the underwriting cycle for example, and from downward pressure on reinsurance rates, are being managed through changes in the business mix and active re-pricing.
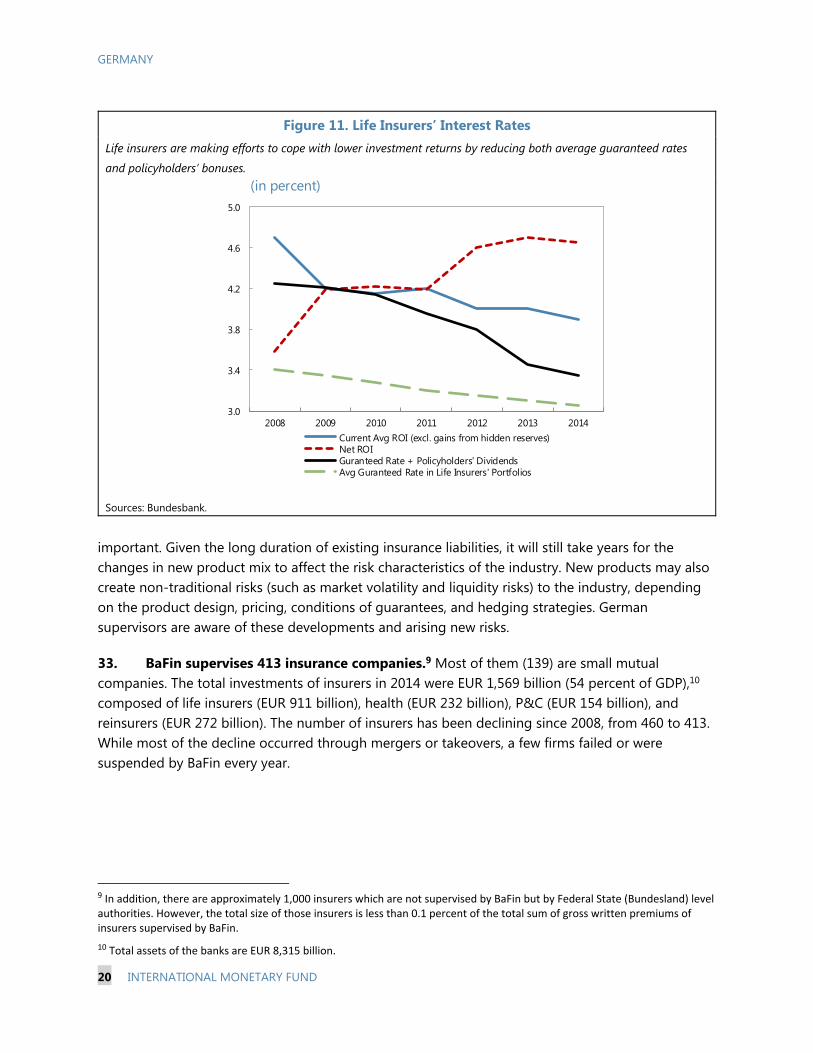
29. Life insurers are making efforts to cope with lower investment returns by reducing both guaranteed rates in new business and policyholders’ profit participation (Figure 11). While net investment return (net ROI) has been increasing since 2008, the improvement is partly due to profits from realization of gains on fixed income securities. If those are excluded, effective investment returns (current average ROI) reported by insurers would show a clear downward trend. In addition, market participants report that life insurance companies rely heavily on investment funds (specialized funds) to increase their investment income. Data published by some large insurance groups show that reinvestment returns are considerably lower than the industry-average investment income, indicating that underlying performance may be even weaker. To cope with severe challenges on the investment side, life insurers have been reducing the guaranteed rates in their new business and policyholders’ bonuses. 30. In 2014, the authorities sought to reduce some of the pressures on life insurers through measures in the Life Insurance Reform Act. Legislators amended the regulatory framework to improve the soundness of life insurers. Key measures in this regard were:
A reduction of the maximum interest rate for new insurance contracts from 1.75 percent to 1.25 percent as of January 1, 2015;
A restriction on shareholder’s bonus payments and the limitation of policyholders’ participation in valuation reserves of fixed-income securities only if the valuation reserves are greater than the amount needed to safeguard the interests of continuing policyholders; and
Flexibility for insurers to offset loss from investments with gain from insurance risk assumptions (such as mortality) and other income, when determining amounts of policyholder profit participation.
8 The Ministry effectively sets a maximum rate on the guarantee that can be offered on new product sales.
GERMANY
INTERNATIONAL MONETARY FUND 19
31. These reforms were complemented by measures to increase the minimum allocation of policyholders’ bonus attributed to insurance risk from 75 percent to 90 percent. The reduction in the planned participation of policy-holders at maturity appears to be particularly significant. However, as this risk component is a key and stable profit driver, market participants report a mixed to overall net beneficial impact of the reform measures on the long term financial soundness of life insurers. 32. Larger firms, in particular, are also introducing new products to address the challenge of low interest rates, but no significant impact will be felt for some years. The industry is introducing non-traditional products, such as unit-linked policies and alternative savings products with lower guarantees. However, this refers mostly to large and more diversified insurance groups, and only to a lesser extent to medium to small insurers. Nevertheless, the majority of these products still comes with guarantees, and production of pure unit-linked products appear to be less
Figure 10. Sensitivities of Liabilities and Guaranteed Rate In its 2014 stress testing exercise, EIOPA released data on the internal rate of return (IRR) of liabilities (vertical axis). High IRR of liabilities also suggest that the guaranteed rate is on the higher side than other European countries with large insurance markets, although the IRR also reflects other elements (e.g., discretionary cash flows). It also provided sensitivities of liabilities under the change from baseline to a low yield scenario (horizontal axis). The sensitivities of liabilities of the German life insurers are one of the highest among EU countries, which implies higher duration of liabilities.
Sources: EIOPA and IMF Staff estimation.
GERMANY
20 INTERNATIONAL MONETARY FUND
important. Given the long duration of existing insurance liabilities, it will still take years for the changes in new product mix to affect the risk characteristics of the industry. New products may also create non-traditional risks (such as market volatility and liquidity risks) to the industry, depending on the product design, pricing, conditions of guarantees, and hedging strategies. German supervisors are aware of these developments and arising new risks.
33. BaFin supervises 413 insurance companies.9 Most of them (139) are small mutual companies. The total investments of insurers in 2014 were EUR 1,569 billion (54 percent of GDP),10 composed of life insurers (EUR 911 billion), health (EUR 232 billion), P&C (EUR 154 billion), and reinsurers (EUR 272 billion). The number of insurers has been declining since 2008, from 460 to 413. While most of the decline occurred through mergers or takeovers, a few firms failed or were suspended by BaFin every year.
9 In addition, there are approximately 1,000 insurers which are not supervised by BaFin but by Federal State (Bundesland) level authorities. However, the total size of those insurers is less than 0.1 percent of the total sum of gross written premiums of insurers supervised by BaFin.
10 Total assets of the banks are EUR 8,315 billion.
Figure 11. Life Insurers’ Interest Rates Life insurers are making efforts to cope with lower investment returns by reducing both average guaranteed rates
and policyholders’ bonuses.
Sources: Bundesbank.
3.0
3.4
3.8
4.2
4.6
5.0
2008 2009 2010 2011 2012 2013 2014
(in percent)
Current Avg ROI (excl. gains from hidden reserves)Net ROIGuranteed Rate + Policyholders' DividendsAvg Guranteed Rate in Life Insurers' Portfolios
GERMANY
INTERNATIONAL MONETARY FUND 21
STRESS TESTING THE BANKING SECTOR A. Solvency Risk
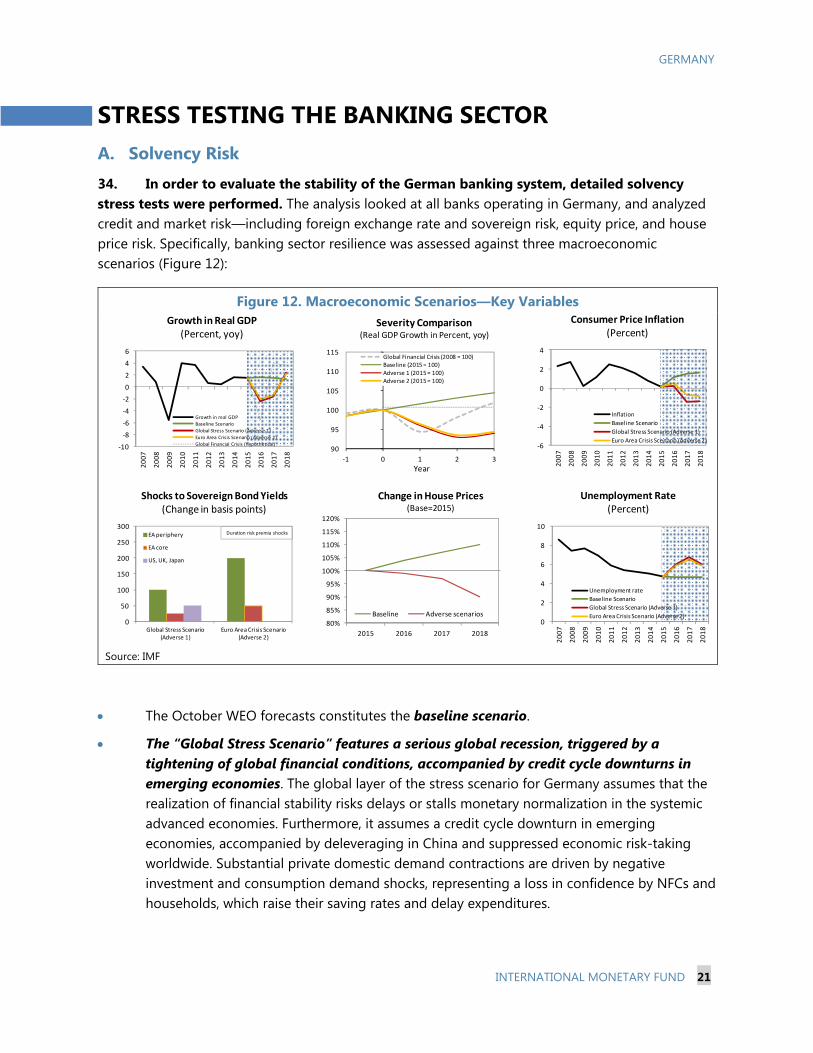
34. In order to evaluate the stability of the German banking system, detailed solvency stress tests were performed. The analysis looked at all banks operating in Germany, and analyzed credit and market risk—including foreign exchange rate and sovereign risk, equity price, and house price risk. Specifically, banking sector resilience was assessed against three macroeconomic scenarios (Figure 12):
The October WEO forecasts constitutes the baseline scenario.
The “Global Stress Scenario” features a serious global recession, triggered by a tightening of global financial conditions, accompanied by credit cycle downturns in emerging economies. The global layer of the stress scenario for Germany assumes that the realization of financial stability risks delays or stalls monetary normalization in the systemic advanced economies. Furthermore, it assumes a credit cycle downturn in emerging economies, accompanied by deleveraging in China and suppressed economic risk-taking worldwide. Substantial private domestic demand contractions are driven by negative investment and consumption demand shocks, representing a loss in confidence by NFCs and households, which raise their saving rates and delay expenditures.
Figure 12. Macroeconomic Scenarios—Key Variables
Source: IMF
-10
-8
-6
-4
-2
0
2
4
6
20
07
20
08
20
09
20
10
20
11
20
12
20
13
20
14
20
15
20
16
20
17
20
18
Growth in Real GDP(Percent, yoy)
Growth in real GDP
Baseline Scenario
Global Stress Scenario (Adverse 1)
Euro Area Crisis Scenario (Adverse 2)
Global Financial Crisis (hypothetical)90
95
100
105
110
115
-1 0 1 2 3
Severity Comparison(Real GDP Growth in Percent, yoy)
Global Financial Crisis (2008 = 100)Baseline (2015 = 100)Adverse 1 (2015 = 100)Adverse 2 (2015 = 100)
Year
0
2
4
6
8
10
20
07
20
08
20
09
20
10
20
11
20
12
20
13
20
14
20
15
20
16
20
17
20
18
Unemployment Rate(Percent)
Unemployment rate
Baseline Scenario
Global Stress Scenario (Adverse 1)
Euro Area Crisis Scenario (Adverse 2)
-6
-4
-2
0
2
4
20
07
20
08
20
09
20
10
20
11
20
12
20
13
20
14
20
15
20
16
20
17
20
18
Consumer Price Inflation(Percent)
Inflation
Baseline Scenario
Global Stress Scenario (Adverse 1)
Euro Area Crisis Scenario (Adverse 2)
0
50
100
150
200
250
300
Global Stress Scenario (Adverse 1)
Euro Area Crisis Scenario (Adverse 2)
Shocks to Sovereign Bond Yields(Change in basis points)
EA periphery
EA core
US, UK, Japan
Duration risk premia shocks
80%
85%
90%
95%
100%
105%
110%
115%
120%
2015 2016 2017 2018
Change in House Prices (Base=2015)
Baseline Adverse scenarios
GERMANY
22 INTERNATIONAL MONETARY FUND
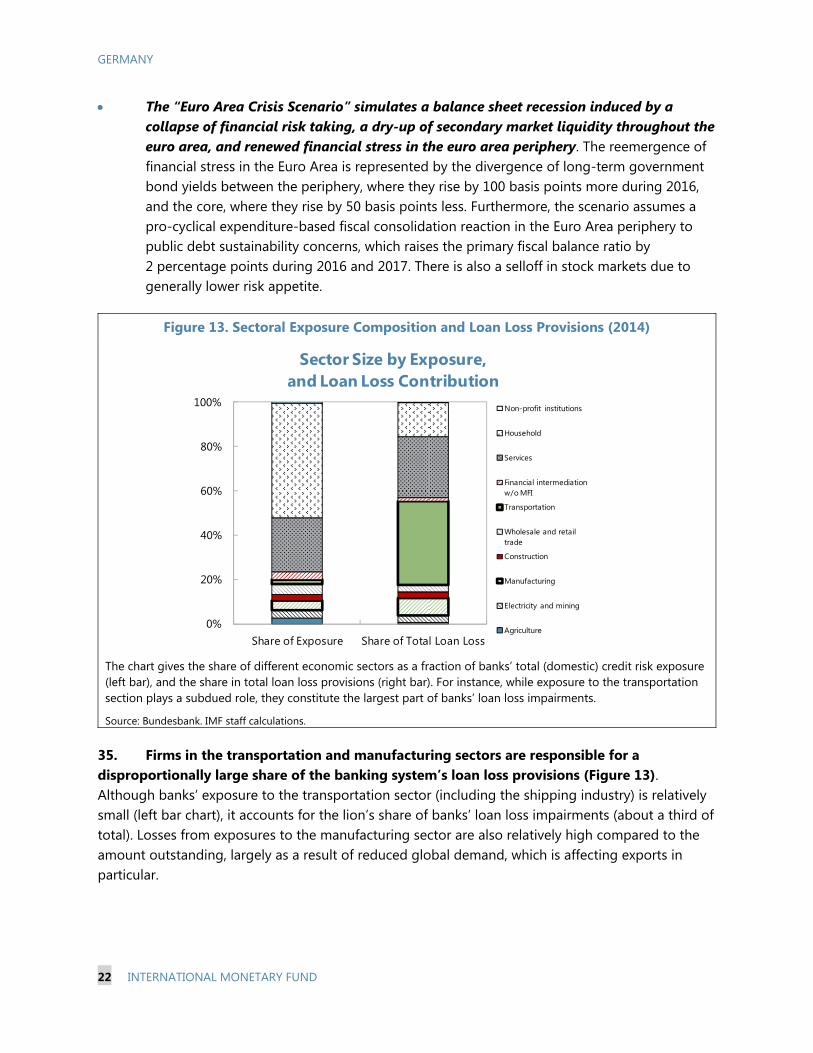
The “Euro Area Crisis Scenario” simulates a balance sheet recession induced by a collapse of financial risk taking, a dry-up of secondary market liquidity throughout the euro area, and renewed financial stress in the euro area periphery. The reemergence of financial stress in the Euro Area is represented by the divergence of long-term government bond yields between the periphery, where they rise by 100 basis points more during 2016, and the core, where they rise by 50 basis points less. Furthermore, the scenario assumes a pro-cyclical expenditure-based fiscal consolidation reaction in the Euro Area periphery to public debt sustainability concerns, which raises the primary fiscal balance ratio by 2 percentage points during 2016 and 2017. There is also a selloff in stock markets due to generally lower risk appetite.
35. Firms in the transportation and manufacturing sectors are responsible for a disproportionally large share of the banking system’s loan loss provisions (Figure 13). Although banks’ exposure to the transportation sector (including the shipping industry) is relatively small (left bar chart), it accounts for the lion’s share of banks’ loan loss impairments (about a third of total). Losses from exposures to the manufacturing sector are also relatively high compared to the amount outstanding, largely as a result of reduced global demand, which is affecting exports in particular.
Figure 13. Sectoral Exposure Composition and Loan Loss Provisions (2014) The chart gives the share of different economic sectors as a fraction of banks’ total (domestic) credit risk exposure (left bar), and the share in total loan loss provisions (right bar). For instance, while exposure to the transportation section plays a subdued role, they constitute the largest part of banks’ loan loss impairments.
Source: Bundesbank. IMF staff calculations.
0%
20%
40%
60%
80%
100%
Share of Exposure Share of Total Loan Loss
Sector Size by Exposure, and Loan Loss Contribution
Non-profit institutions
Household
Services
Financial intermediation w/o MFI
Transportation
Wholesale and retail trade
Construction
Manufacturing
Electricity and mining
Agriculture

GERMANY
INTERNATIONAL MONETARY FUND 23
36. The German banking system would remain broadly stable under the baseline scenario (Figure 14).11 Banks are relatively well capitalized, with CET1 ratios around 15 percent, on average. Both the large banks (also known as significant institutions or SIs) and small- and medium-sized banks (less significant institutions or LSIs) are found to be resilient, with an improvement in their solvency levels under the baseline. For both groups, interest income would continue to deteriorate, albeit substantially absorbed by lower interest expenses, thanks to favorable market funding and ECB refinancing conditions.
37. Under the adverse scenarios, banks would see an increase in their loan losses, while adverse market price movements take a toll on trading income and the value of sovereign bond holdings. The macro and financial shocks under the stress scenarios would increase default probabilities by up to 90 percent compared to current levels, according to the credit risk model. Banks would experience almost a doubling of annual credit impairment needs, albeit from a very low level, in part because of the scenarios’ stress on house prices that impacts mortgages’ collateral values. Larger banks would suffer a 40 percent drop in trading income, while small- and medium-sized banks with very little trading exposure and open foreign exchange (FX) positions would be affected much less. The direction of net FX positions varies across banks and, on average, the impact is not large. Some of the large banks are affected by credit risk and sovereign bond valuation losses. Smaller banks mainly suffer from continuously falling net interest income, and continued structurally high costs.
Under the Global Stress Scenario, the CET1 ratio of the group of large banks would drop by 2.6 percentage points, but remains above 10 percent. On aggregate, capital shortfalls amount to EUR 6.0 billion, or 0.2 percent of annual GDP. Smaller banks are more resilient, and that group as a whole would experience a temporary drop in CET1 ratio of only around 0.3 percentage point against the fully-loaded CET1 hurdle, including buffers. The total CET1 capital shortfall amounts to around EUR 0.5 billion. Thirty-two banks out of 1,755 in that bucket would see their CET1 capital ratios drop below fully-loaded regulatory hurdle rates in 2018.
The EA Crisis Scenario would cause the average CET1 ratio to drop by 2.2 percentage points, to 12.7 percent in 2018 for large banks, corresponding to a capital shortfall of EUR 4.2 billion, or 0.1 percent of annual GDP. Again, smaller banks are more resilient, and that group as a whole would experience a drop of only around 0.2 percentage in the first year, against the fully-loaded CET1 hurdle, including buffers, with an improvement in subsequent years. The aggregate CET1 capital shortfalls stand at around EUR 448 million, with 30 small- and medium-sized banks breaching the regulatory hurdles.12
11 The stress tests were performed against the end-2019 “fully-loaded” regulatory definitions, including applicable buffers. 12 One-off effects are an important driver of the capital shortfall, in particular non-recurring write-offs. In contrast to the 2016 EU-wide bottom up stress test of the European Banking Authority, such events at the base year (2015) have not been removed from the balance sheet when profit and loss positions were projected three years (2016-2018) into the future. See “2016 EU-wide stress test-Methodological note” for the EBA methodology. http://www.eba.europa.eu/-/eba-launches-2016-eu-wide-stress-test-exercise.

GERMANY
24 INTERNATIONAL MONETARY FUND
Figure 14. Solvency Stress Test
Source: IMF Staff Calculations
Note: The top panel shows the evolution of CET1 ratio under the three scenarios. Capital shortfalls to regulatory hurdles are shown as bars in the panel below, together with the share of total assets that the banks dropping below hurdle rates correspond with (markers, rhs). The drivers are expressed in terms of percentage points of CET1 ratio. For example, the credit risk losses experienced by large banks in the Global Stress Scenario equal 2.3 percentage points of the CET1 ratio.
-20
-15
-10
-5
0
5
10
15
Global Stress Scenario Euro Area Crisis
Main Drivers of CET1 Ratio, Large Banks(in percent)
Dividends
Tax
RWA (unexpected loss)
FX gains/losses
Sovereign bonds valuation gain/lossLoan loss impairments (expected loss)Personnel and other expenses
Other income
Net trading income (w/o sovereign valuation gains/loss)Net fee and commission income
Net interest income
16.714.9
12.3
12.7
6
8
10
12
14
16
18
2015 2016 2017 2018
BaselineGlobal Stress ScenarioEuro Area Crisis Scenario
Common Equity Tier 1 CapitalLarge Banks(in percent of RWA)
16.8
15.015.4
15.6
11
12
13
14
15
16
17
18
2015 2016 2017 2018
BaselineGlobal Stress ScenarioEuro Area Crisis Scenario
Common Equity Tier 1 CapitalSmall- and Medium-sized Banks(in percent of RWA)
-15
-10
-5
0
5
10
15
Global Stress Scenario Euro Area Crisis
Main Drivers of CET1 Ratio, Small- and Medium-sized Banks(in percent)
Dividends
Tax
RWA (unexpected loss)
FX gains/losses
Sovereign bonds valuation gain/lossLoan loss impairments (expected loss)Personnel and other expenses
Other income
Net trading income (w/o sovereign valuation gains/loss)Net fee and commission income
Net interest income
0
2
4
6
8
10
Baseline Global Stress Scenario
Euro Area Crisis Scenario
CET1 Capital Shortfall (EUR bn)
CETI Capital Shortfall below CET1 Minimum Large Banks(incl. CCB and OSII buffers)
0.0
0.2
0.4
0.6
Baseline Global Stress Scenario
Euro Area Crisis Scenario
CET1 Capital Shortfall (EUR bn)
CET1 Capital Shortfall below CET1 Minimum Small- and Medium-sized Banks(incl. CCB)

GERMANY
INTERNATIONAL MONETARY FUND 25
In-depth analysis of banks’ sensitivity to low interest rate environment shows that the persistently low interest rates weighed significantly on the profitability of small- and medium-sized German credit institutions.13 According to banks’ own interest rate projections, profitability is expected to decline by around 25 percent by 2019. Should the low interest rate phase persist, operating profit could slump by 50 percent, on average, and under a static balance sheet assumption. If the interest rate level were to fall by a further 100 basis points, banks’ operating profits could decline by 60 to 75 percent, depending on a dynamic or static balance sheet assumption, respectively (Figure 15).
13 See Bundesbank Survey (2015) on the Profitability and Resilience of German Credit Institutions in a Low-Interest-Rate Setting.
Figure 15. Low Interest Rates and Bank Profitability (Bottom-Up Test)
Source: Bundesbank
Note: The charts show, for five different tests, the evolution of operating profit to total assets for some 1500 LSIs. The top-left chart gives weighted averages for each scenario tested, while the other charts show the median and the 5th/95th percentile of individual banks’ operating profit. Details about methodology, scenarios, and samples can be found in the Stress Test Matrix.
-25%
-50%
-10%
-75%
- 60%
0
0.1
0.2
0.3
0.4
0.5
0.6
2014 2015 2016 2017 2018 2019
Overview(Operating profit, in percent of total assets)
Banks' own projectionsLow interest rate environment+200bp shift (static)-100bp shift (static)-100bp shift (dynamic)
0.0
0.2
0.4
0.6
0.8
1.0
1.2
1.4
2014 2015 2016 2017 2018 2019
Banks' own projections (dynamic)(in percent)
Median 5th percentile 95th percentile
-0.2
0.0
0.2
0.4
0.6
0.8
1.0
1.2
1.4
2014 2015 2016 2017 2018 2019
Low interest rate environment (static)(in percent)
Median 5th percentile 95th percentile
-0.6
-0.4
-0.2
0.0
0.2
0.4
0.6
0.8
1.0
1.2
1.4
2014 2015 2016 2017 2018 2019
+200bp Shift (static)(in percent)
Median 5th percentile 95th percentile
-0.6
-0.4
-0.2
0.0
0.2
0.4
0.6
0.8
1.0
1.2
1.4
2014 2015 2016 2017 2018 2019
-100bp Shift (static)(in percent)
Median 5th percentile 95th percentile
-0.4
-0.2
0.0
0.2
0.4
0.6
0.8
1.0
1.2
1.4
2014 2015 2016 2017 2018 2019
-100bp Shift (dynamic)(in percent)
Median 5th percentile 95th percentile
GERMANY
26 INTERNATIONAL MONETARY FUND
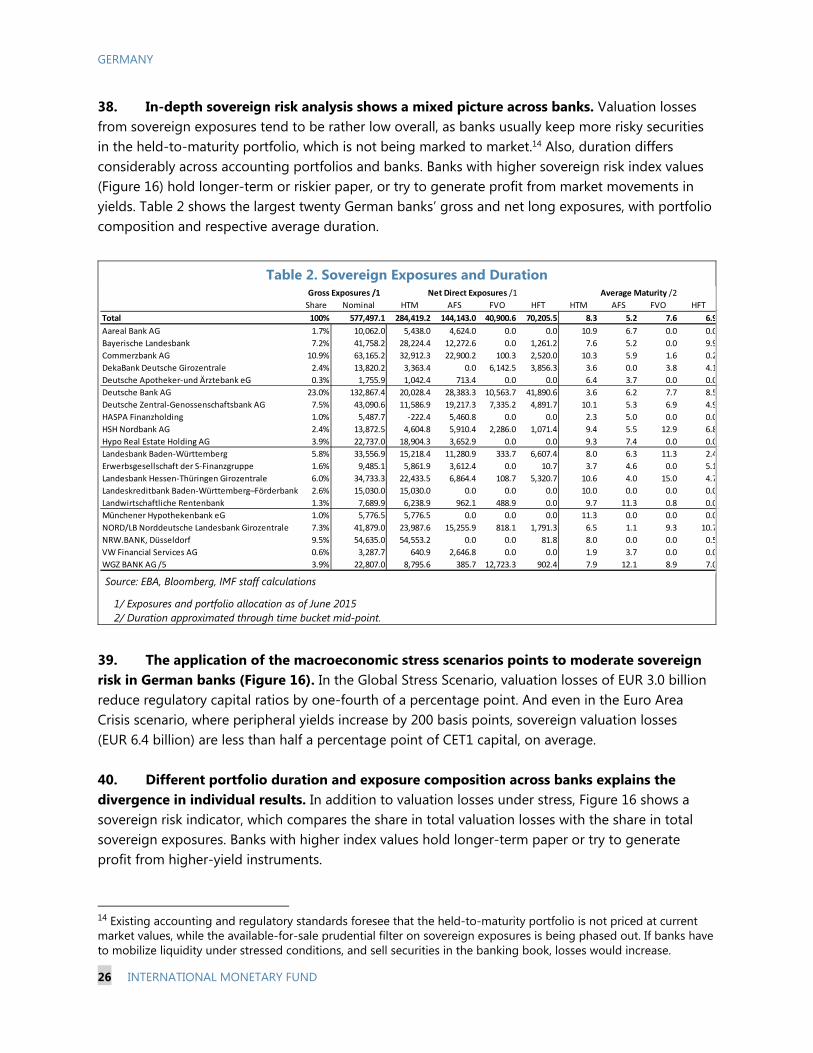
38. In-depth sovereign risk analysis shows a mixed picture across banks. Valuation losses from sovereign exposures tend to be rather low overall, as banks usually keep more risky securities in the held-to-maturity portfolio, which is not being marked to market.14 Also, duration differs considerably across accounting portfolios and banks. Banks with higher sovereign risk index values (Figure 16) hold longer-term or riskier paper, or try to generate profit from market movements in yields. Table 2 shows the largest twenty German banks’ gross and net long exposures, with portfolio composition and respective average duration.
39. The application of the macroeconomic stress scenarios points to moderate sovereign risk in German banks (Figure 16). In the Global Stress Scenario, valuation losses of EUR 3.0 billion reduce regulatory capital ratios by one-fourth of a percentage point. And even in the Euro Area Crisis scenario, where peripheral yields increase by 200 basis points, sovereign valuation losses (EUR 6.4 billion) are less than half a percentage point of CET1 capital, on average. 40. Different portfolio duration and exposure composition across banks explains the divergence in individual results. In addition to valuation losses under stress, Figure 16 shows a sovereign risk indicator, which compares the share in total valuation losses with the share in total sovereign exposures. Banks with higher index values hold longer-term paper or try to generate profit from higher-yield instruments.
14 Existing accounting and regulatory standards foresee that the held-to-maturity portfolio is not priced at current market values, while the available-for-sale prudential filter on sovereign exposures is being phased out. If banks have to mobilize liquidity under stressed conditions, and sell securities in the banking book, losses would increase.
Table 2. Sovereign Exposures and Duration
Source: EBA, Bloomberg, IMF staff calculations
1/ Exposures and portfolio allocation as of June 2015 2/ Duration approximated through time bucket mid-point.
Share Nominal HTM AFS FVO HFT HTM AFS FVO HFT
Total 100% 577,497.1 284,419.2 144,143.0 40,900.6 70,205.5 8.3 5.2 7.6 6.9
Aareal Bank AG 1.7% 10,062.0 5,438.0 4,624.0 0.0 0.0 10.9 6.7 0.0 0.0
Bayerische Landesbank 7.2% 41,758.2 28,224.4 12,272.6 0.0 1,261.2 7.6 5.2 0.0 9.9
Commerzbank AG 10.9% 63,165.2 32,912.3 22,900.2 100.3 2,520.0 10.3 5.9 1.6 0.2
DekaBank Deutsche Girozentrale 2.4% 13,820.2 3,363.4 0.0 6,142.5 3,856.3 3.6 0.0 3.8 4.1
Deutsche Apotheker-und Ärztebank eG 0.3% 1,755.9 1,042.4 713.4 0.0 0.0 6.4 3.7 0.0 0.0
Deutsche Bank AG 23.0% 132,867.4 20,028.4 28,383.3 10,563.7 41,890.6 3.6 6.2 7.7 8.5
Deutsche Zentral-Genossenschaftsbank AG 7.5% 43,090.6 11,586.9 19,217.3 7,335.2 4,891.7 10.1 5.3 6.9 4.9
HASPA Finanzholding 1.0% 5,487.7 -222.4 5,460.8 0.0 0.0 2.3 5.0 0.0 0.0
HSH Nordbank AG 2.4% 13,872.5 4,604.8 5,910.4 2,286.0 1,071.4 9.4 5.5 12.9 6.8
Hypo Real Estate Holding AG 3.9% 22,737.0 18,904.3 3,652.9 0.0 0.0 9.3 7.4 0.0 0.0
Landesbank Baden-Württemberg 5.8% 33,556.9 15,218.4 11,280.9 333.7 6,607.4 8.0 6.3 11.3 2.4
Erwerbsgesellschaft der S-Finanzgruppe 1.6% 9,485.1 5,861.9 3,612.4 0.0 10.7 3.7 4.6 0.0 5.1
Landesbank Hessen-Thüringen Girozentrale 6.0% 34,733.3 22,433.5 6,864.4 108.7 5,320.7 10.6 4.0 15.0 4.7
Landeskreditbank Baden-Württemberg–Förderbank 2.6% 15,030.0 15,030.0 0.0 0.0 0.0 10.0 0.0 0.0 0.0
Landwirtschaftliche Rentenbank 1.3% 7,689.9 6,238.9 962.1 488.9 0.0 9.7 11.3 0.8 0.0
Münchener Hypothekenbank eG 1.0% 5,776.5 5,776.5 0.0 0.0 0.0 11.3 0.0 0.0 0.0
NORD/LB Norddeutsche Landesbank Girozentrale 7.3% 41,879.0 23,987.6 15,255.9 818.1 1,791.3 6.5 1.1 9.3 10.7
NRW.BANK, Düsseldorf 9.5% 54,635.0 54,553.2 0.0 0.0 81.8 8.0 0.0 0.0 0.5
VW Financial Services AG 0.6% 3,287.7 640.9 2,646.8 0.0 0.0 1.9 3.7 0.0 0.0
WGZ BANK AG /5 3.9% 22,807.0 8,795.6 385.7 12,723.3 902.4 7.9 12.1 8.9 7.0
Gross Exposures /1 Net Direct Exposures /1 Average Maturity /2

GERMANY
INTERNATIONAL MONETARY FUND 27
Figure 16. Sovereign Exposures, Risk Index, and Valuation Losses under Stress
Source: IMF Staff Calculations using EBA 2015Q2 data.
Note: The sovereign risk index gives for each bank the valuation loss (VL) with the gross volume of sovereign bond exposures held (Exp), relative to the total sample If the index value is 1, the valuation loss corresponds to the total sovereign exposure held by the bank, signaling average risk from sovereign exposures. If the value is above 1, the bank’s valuation loss is disproportionally higher than its holdings would imply, indicating that the sovereign bond portfolio has relatively more risk (and vice versa). Index values are determined by (i) the issuer’s risk as expressed by the sovereign yield and its volatility of time, (ii) average maturity of the bonds in the portfolio together with (iii) the bank’s accounting of that exposure (HTM, AFS, FVO, HFT).
0
2
4
6
8
10
Scenario 1 Scenario 2
Valuation Loss(in EUR bn)
0
2
4
6
8
10
0
80
160
240
320
400
HTM AFS FVO HFT
Net Direct Exposures and Duration(in EUR bn and Years)
Net direct exposure (lhs) Average maturity (rhs)
1 1
i in n
j jj j
VL ExpIdx
VL Exp
0 1 2 3
Aareal Bank AG
Bayerische Landesbank
Commerzbank AG
DekaBank Deutsche Girozentrale
Deutsche Apotheker-und Ärztebank eG
Deutsche Bank AG
Deutsche Zentral-Genossenschaftsbank AG
HASPA Finanzholding
HSH Nordbank AG
Hypo Real Estate Holding AG
Landesbank Baden-Württemberg
Erwerbsgesellschaft der S-Finanzgruppe
Landesbank Hessen-Thüringen Girozentrale
Landeskreditbank Baden-Württemberg–Förderbank
Landwirtschaftliche Rentenbank
Münchener Hypothekenbank eG
NORD/LB Norddeutsche Landesbank Girozentrale
NRW.BANK, Düsseldorf
VW Financial Services AG
WGZ BANK AG
Sovereign Risk Index(in EUR bn)
Valuation Loss (EUR bn) Sovereign risk index

GERMANY
28 INTERNATIONAL MONETARY FUND
B. Liquidity Risk 41. Cash-flow based top-down liquidity stress tests were performed for all banks operating in Germany (around 1,800 institutions). Besides the stress test metrics, the FSAP looked into long- to medium-term structural liquidity measures and mismatches. For this purpose, the Net Stable Funding Ratio (NSFR), which is currently under an observation period, with the aim of becoming a binding standard by 2018, was analyzed for the 70 German banks participating in the BIS Quantitative Impact Study (QIS).
42. German banks comply with regulatory liquidity standards (Figure 17). Tests based on the Liquidity Coverage Ratio (LCR) show that most of the 1,800 banks would be able to withstand market and funding liquidity shocks. Almost all banks show ratios above 70 percent, and most banks already today have LCR ratios above 100 percent, with foreign banks showing the lowest dispersion.
Figure 17. LCR Estimates (In percent)
Source: Bundesbank.
Note: Results were estimated from reporting data through a matching with CRD IV asset and liability categorization (i.e., net outflows and liquid assets). The Whisker plots give the lower and upper quartile, the median (black line inside the box), and the lower and upper 5 percent percentile. The orange line is the current (2016) regulatory minimum of 70 percent, while the dashed line shows the fully phased-in hurdle rate of 100 percent. Outliers are not shown. Results for the four big banks are not shown, as individual LCRs could be identified. However, they are all above 70 percent regulatory minimum. The big bank group includes Commerzbank, Deutsche Bank, Deutsche Postbank, and UniCredit.

GERMANY
INTERNATIONAL MONETARY FUND 29
43. During recent months in particular, banks have been increasing both LCR and NSFR, and larger banks appear to be managing their ratios more efficiently. Differentiating between QIS group 1 and group 2 banks, Figures 18 and 19 show the evolution of LCR and NSFR over time. Besides a general observable improvement in ratios since 2011, the variation across banks’ LCRs has reduced over time.
Figure 19. Net Stable Funding Ratio (NSFR) Over Time
Source: Bundesbank.
Notes: The box gives the lower and upper quartile (25th and 75th percentile, respectively), the median (black line separating the box, and the weighted average (orange circle). Whiskers are drawn at the 5th and 95th percentile. The horizontal orange line marks the future expected, and fully loaded regulatory NSFR minimum of 100 percent. Whiskers extending above the vertical axis’ range are removed.
Figure 18. LCR Reported by German Banks in the BCBS QIS
Source: Bundesbank.
Notes: The box gives the lower and upper quartile (25th and 75th percentile, respectively), the median (black line separating the box, the weighted average (orange circle), and whiskers are at the 5th and 95th percentile. The orange line marks the current regulatory minimum of 70 percent, while the dotted line gives the fully phased-in minimum of 100 percent. Whiskers extending above the vertical axis’ range are removed.

GERMANY
30 INTERNATIONAL MONETARY FUND
STRESS TESTING THE INSURANCE SECTOR 44. In order to quantify the impact of prolonged low interest rates on the life insurance sector under the Solvency II regime, top-down stress tests were performed. The scenarios cover major market shocks, such as lower interest rates, a widening of sovereign and corporate credit spreads, and shocks to equity and property markets.15 Sensitivity analysis was used to assess the potential impact of other material, insurance-specific risks, longevity, and lapse risk in particular. The exercise covers 93 percent of the life insurance sector’s assets.
45. The results are stated on the SCR ratio, with and without transitional measures. Based on EU law, the transitional measures allow insurers, on BaFin’s approval, to mitigate material Solvency II impacts arising from lower interest rates (the transitional period is 16 years, with the benefit phased out linearly). Given that both ratios—with and without transitional measures—will be published, there is already market focus on the extent and implications of likely reliance by many insurers on the transitional measures to meet solvency requirements (some large groups have announced that they will not be using the measures). The stress test has therefore been conducted with 2 hurdle rates: coverage ratios of 100 percent of the new SCR, with and without transitional measures.
46. The insurance industry remains profitable with high solvency ratios, although careful analysis is needed of these numbers, especially in the case of life insurers. Average ROEs in the last 3 years are 6.6 percent for life, 4.0 percent for P&C, and 8.3 percent for reinsurers. The average solvency ratios under Solvency I at the end of 2014 were 163 percent for life insurers, 312 percent for P&C, and 885 percent for reinsurers (Figure 20). In the past few years, life insurers have been required to generate profits to address additional reserves requirements in place since 2011, and the majority of them appear to have done so by generating profits from the sale of fixed income securities with unrealized gains. The underlying performance of life insurers could therefore be much lower than the published figures. P&C insurers are also facing growing pressures on profitability from competition and, in motor insurance, a pronounced underwriting cycle.
47. The stress test focuses on the life insurance sector, which is the largest (by assets and premium income) and the most exposed to interest rate risk. About 60 percent of insurance sector assets are held by the life sector. P&C and reinsurers are less affected by low interest rates, and have stable profits. Large and globally active insurance groups, which have diversified portfolios, geographically and between life and P&C, are in principle more resilient than small and medium size life insurers, which are concentrated in domestic life business. Therefore, the stress test has been applied to individual legal entities in the life insurance sector. The exercise covers 75 life insurers (out of 86) or 93 percent of the assets of all the life insurers subject to Solvency II, including a significant number of smaller entities.
15 These shocks are in line with those in macroeconomic stress scenarios for the banking sector, where relevant.

GERMANY
INTERNATIONAL MONETARY FUND 31
Figure 20. Solvency I Ratios
P&C and reinsurers keep high Solvency Ratios under Solvency I, while life insurers have lowest ratio.
Sources: BaFin. Data as of the end-2014.
48. The insurance stress test assesses all major risks to the sector. According to the comprehensive life insurance survey in 2014, conducted by BaFin, market risk is the dominant risk factor, representing about 70 percent of total risk. Here, spread risk is the most significant, followed by interest rate, equity, and property risk. The focus of the exercise is on these market risks, notably assuming a prolonged period of low interest rates. Sovereign shocks are also included.
49. The stress test covers the impact on both assets and liabilities. Lower interest rates will increase the value of insurers’ assets but increase the value of liabilities to a greater extent, because of a negative duration gap. Traditional insurance features policyholder participation in returns, which allows insurers to reduce future policyholders’ profit participation in response to adverse shocks. This insurance stress test aims to capture these complex interactions between assets and liabilities. In addition, sensitivity tests have been conducted to estimate the impacts of key insurance risks (such as lapse and longevity risk) separately, with the objective of keeping the exercise simple.
A. Data and Methodologies 50. Except for the 2014 EIOPA stress test, all stress testing exercises conducted by the authorities have been based on Solvency I standards. In the past, national bottom up stress tests were conducted annually by BaFin, and covered all insurers. BaFin’s prognosis survey focused on life insurance and was undertaken twice in 2015. The Bundesbank has developed top down tests for
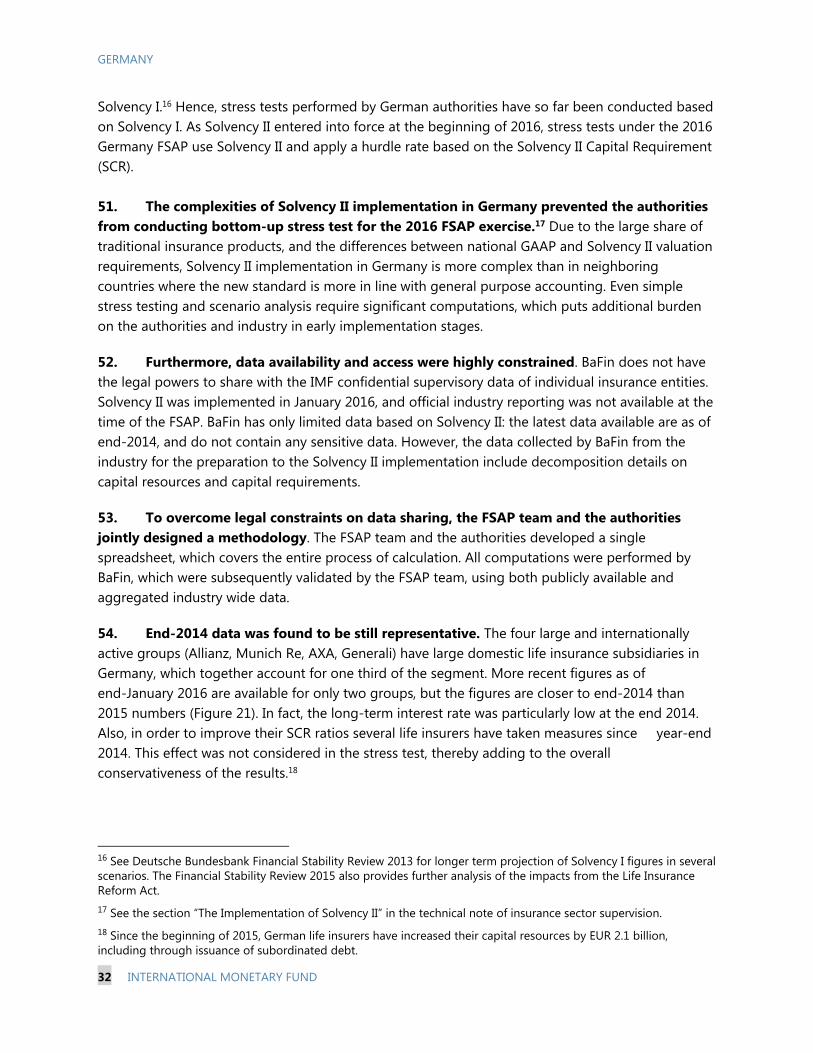
GERMANY
32 INTERNATIONAL MONETARY FUND
Solvency I.16 Hence, stress tests performed by German authorities have so far been conducted based on Solvency I. As Solvency II entered into force at the beginning of 2016, stress tests under the 2016 Germany FSAP use Solvency II and apply a hurdle rate based on the Solvency II Capital Requirement (SCR). 51. The complexities of Solvency II implementation in Germany prevented the authorities from conducting bottom-up stress test for the 2016 FSAP exercise.17 Due to the large share of traditional insurance products, and the differences between national GAAP and Solvency II valuation requirements, Solvency II implementation in Germany is more complex than in neighboring countries where the new standard is more in line with general purpose accounting. Even simple stress testing and scenario analysis require significant computations, which puts additional burden on the authorities and industry in early implementation stages.
52. Furthermore, data availability and access were highly constrained. BaFin does not have the legal powers to share with the IMF confidential supervisory data of individual insurance entities. Solvency II was implemented in January 2016, and official industry reporting was not available at the time of the FSAP. BaFin has only limited data based on Solvency II: the latest data available are as of end-2014, and do not contain any sensitive data. However, the data collected by BaFin from the industry for the preparation to the Solvency II implementation include decomposition details on capital resources and capital requirements.
53. To overcome legal constraints on data sharing, the FSAP team and the authorities jointly designed a methodology. The FSAP team and the authorities developed a single spreadsheet, which covers the entire process of calculation. All computations were performed by BaFin, which were subsequently validated by the FSAP team, using both publicly available and aggregated industry wide data.
54. End-2014 data was found to be still representative. The four large and internationally active groups (Allianz, Munich Re, AXA, Generali) have large domestic life insurance subsidiaries in Germany, which together account for one third of the segment. More recent figures as of end-January 2016 are available for only two groups, but the figures are closer to end-2014 than 2015 numbers (Figure 21). In fact, the long-term interest rate was particularly low at the end 2014. Also, in order to improve their SCR ratios several life insurers have taken measures since year-end 2014. This effect was not considered in the stress test, thereby adding to the overall conservativeness of the results.18
16 See Deutsche Bundesbank Financial Stability Review 2013 for longer term projection of Solvency I figures in several scenarios. The Financial Stability Review 2015 also provides further analysis of the impacts from the Life Insurance Reform Act. 17 See the section “The Implementation of Solvency II” in the technical note of insurance sector supervision. 18 Since the beginning of 2015, German life insurers have increased their capital resources by EUR 2.1 billion, including through issuance of subordinated debt.
GERMANY
INTERNATIONAL MONETARY FUND 33
Figure 21. Trend of Solvency II SCR Coverage Ratio (Group Level)
Publicly available Solvency II figures suggest that end of 2014 figures is a good proxy of the latest figures.
Sources: Disclosures by insurers, 2015 figures of Munich Re and Generali are as of the end September 2015.
55. The methodology developed takes into account the loss absorption capacities of traditional insurance products. Traditional insurance policies have policyholder participation features, which allow insurers to reduce the future discretionary bonuses in case adverse scenarios materialize. In Germany, policyholders’ bonuses are determined by National GAAP rather than the Solvency II balance sheet, which requires complex parallel calculations. To overcome this, the top-down stress test used part of the scenarios embedded in the Solvency II standardized formula. In this exercise, the IMF staff and the authorities worked together to develop methodologies to take into account such loss absorption capacities properly while imposing appropriate caps to avoid overestimation of such capacities. Assumptions were, generally, set conservatively.
56. To avoid overestimation of loss absorption capacities, capping mechanisms were introduced into the stress testing methodology (Box 1 and Figure 22). German life insurers recognize significant amount of FDB and net DTL as part of their liabilities, which justify insurers to recognize Loss Absorption Capacities in Technical Provisions (LAC_TP) and Loss Absorption Capacities in Deferred Tax (LAC_DT). However, to avoid overuse of FDB and net DTL, capping mechanisms of LAC_TP and LAC_DT are introduced to make sure that total loss absorption capacity does not exceed the initial source of each capacity. For example, the ultimate source of LAC_TP is FDB before the shock. Assuming no increase of FDB, the total LAC_TP, which is used to reduce the loss and reduce the SCR after the shock, is capped at the level of FDB before the shocks. A similar

GERMANY
34 INTERNATIONAL MONETARY FUND
capping mechanism is imposed on LAC_DT so that the total recognition of LAC_DT does not exceed the net deferred tax liabilities before the shocks.
Box. 1 Loss Absorption Capacities Loss absorption capacities play key roles in measuring the resilience of life insurance companies. The EIOPA stress test conducted in 2014 shows that Loss Absorption Capacities in Technical Provisions (LAC_TP) and in Deferred Taxes (LAC_DT) reduced the gross capital requirements by 23 percent and 8 percent respectively.1 Solvency regimes in other regions are different from the Solvency II calculation, but many regimes recognize such loss absorption capacities in one way or the other, for example through recognition of those capacities in the capital buffer or reduction of liabilities by increasing discount rates. LAC_TP is mainly coming from traditional life insurance products which allow life insurers to cut future discretionary bonuses to the policyholders. Life insurers are required or expected to pay a substantial share of future profits to the policyholders through policyholder bonuses. For example, in Germany, the minimum allocation ratio to the policyholders is set at 90 percent of investment return and technical surplus and 50 percent of other surplus. Therefore, insurers are recognizing significant amounts of Future Discretionary Benefits (FDB) in their liabilities (in the case of Germany, they reached EUR 136 billion at the end 2014, about twice as high as their capital resources). However, insurers generally have flexibility in when and how much of the bonuses are paid to the policyholders and have relatively high flexibility in Germany. FDB is generated through a complex calculation with continuous interaction between the Solvency II balance sheet and national GAAP. However, the risk of overestimation is reduced by the fact that FDB recognition reduces the capital by increasing the liability, but does not affect total asset valuation. LAC_DT is mainly coming from a possible reduction of deferred tax liabilities. Solvency II allows insurers to recognize the best estimate of future profit from the existing policies with the condition of proper recognition of tax liabilities associated with such future profit. Therefore, under the Solvency II balance sheet, insurers tend to have net deferred tax liabilities. In case of Germany, life insurers’ net deferred tax liabilities have reached close to EUR 10 billion. In a deteriorating environment, insurers will reduce the best estimate of future profit from the existing policies, and correspondingly the estimation of deferred tax liabilities. While it is appropriate and important to recognize those loss absorption capacities, careful consideration should be given to possible negative impacts on future profitability of the industry. While it is legally possible to reduce the policyholders’ profit participation in case of adverse situation, reduction of policyholders’ profit participations might have negative impact on its reputation and may cause lower sales of new products and higher lapse of existing products. This is particularly important in the Solvency II regime, as the impact of profitability of existing products will immediately affect current capital adversely. In Solvency II, all insurers may recognize LAC_TP and LAC_DT regardless of their internal model approval status. As described above, the estimation of LAC_TP and LAC_DT are highly dependent on the complex modeling of future cash flow and profitability projections. According to BaFin experts, insurers with internal model approvals are subject to rigid validation processes and validation includes estimation of loss absorption capacities. The validation of this exercise conducted jointly with BaFin and IMF staff identifies some possible overestimation of the figures in a small number of small and medium insurers. BaFin is aware of the data quality and currently addressing the issue to improve the quality of official reporting data as part of its 2016 work program. ____________________ 1 The figures are based on “core sample,” which is compose by 60 groups and 107 individual undertakings, including 33 life, 43 non-life, 36 composite, 2 re-insurers and 53 other insurers.

GERMANY
INTERNATIONAL MONETARY FUND 35
57. Given the risk associated with the industry’s reliance on Solvency II transitional arrangements, the stress test has been conducted with and without taking into account the impact of those arrangements. Based on EU-law, the transitional measures allow insurers, on BaFin’s approval, to mitigate material Solvency II impacts arising from lower interest rates (the transitional period is 16 years, with the benefit phased out linearly). However, insurers using the arrangements must disclose the Solvency II figures with and without application of these measures. While it may not be an immediate risk, insurers relying on transitional arrangements to meet SCR may be less resilient to general market turmoil or a stress affecting an individual company.
58. The stress scenarios are calibrated mainly from the calibration of the Solvency II standardized formula. The target criteria of the formula are Value at Risk with 99.5 percent confidence level for a one-year time horizon (a one in 200 years’ event). Major risks, including interest rate risk, equity risk, spread risk and property risk, are calibrated with the same scenario used to calibrate Solvency II. A sovereign stress scenario is also added, which is the same as the global stress test scenario used in the banking stress test.
Interest rates; a shift of the risk free yield curve down by 20 percent (long term) to 75 percent (short term).
Equity; a 22 to 49 percent fall in the price of equities.
19 Reconciliation reserve equals the total excess of assets over liabilities reduced by the amount of own shares, foreseeable dividends, etc.
Figure 22. Own Funds and Sources of Loss Absorption Capacities Surplus Funds, Reconciliation Reserve19 and Other Own Funds are recognized as capital resources (the numerator of SCR coverage ratio). Future Discretionary Benefits and Net DTL are recognized as part of liabilities, while loss absorption capacities are indirectly recognized through LAC_TP and LAC_DT (to reduce the denominator in the SCR calculation). The amount of Future Discretionary Bonus is much larger than Own Funds without transitional measures in German life insurers.
Sources: BaFin.
0
20
40
60
80
100
120
140
Other own funds Reconciliation reserve Surplus funds
Composition of Own Funds (Capital Buffer)(in EUR bn)
0
20
40
60
80
100
120
140
Net DTL Future Discretionary Benefits
Maxium Loss Absorption Capacity (Liabilities)(in EUR bn)

GERMANY
36 INTERNATIONAL MONETARY FUND
Spread for corporate bonds and loans; shock levels depending on duration and credit quality, e.g., for a 5-year duration a 4.5 to 37.5 percent haircut.
Property: shocks of 25 percent for both commercial and residential real estate prices.
Shocks on sovereign bonds; 100 b.p. higher spreads of peripheries sovereign bonds, 25 b.p. higher spread of core sovereign bonds and 50 b.p. for the U.S., the U.K., and Japan.
59. A correlation matrix is used to calculate the overall capital impact, and to make the scenario more plausible. Solvency II allows two steps of correlation recognition, namely within market risk and among overall risks. The FSAP exercise applied the correlation matrix used in the Solvency II standardized formula within market risk, so as to make the overall scenario broadly consistent with a 1-in-200 years event.20
60. Top down stress tests require a number of critical assumptions. When assumptions were needed to be made, a conservative approach was taken. The detailed descriptions of those assumptions are provided at the end section of the Stress Test Matrix (STeM).
B. Results 61. With transitional measures, insurers’ capital levels appear generally sufficient, although a minority would have difficulties in meeting SCR ratios after the shocks (Figure 23). Life insurers maintain SCR coverage ratios above 100 percent even after the shocks, although the weighted average of SCR coverage ratios drops from 372 percent to 236 percent. No firm would have negative capital after the shocks, although 13 out of 75 firms would not be able to maintain a 100 percent SCR coverage ratio after the shocks. Resulting nominal capital shortfalls after the shocks would not be material. 21
62. Without transitional measures, in the stress scenario a majority of life insurers experiences difficulties in meeting Solvency II SCR ratios. Weighted average SCR coverage ratios would fall from 126 percent to 48 percent. 34 firms (58 firms) would not be able to meet a 100 percent of SCR coverage ratio before (after) the shocks. Eight firms and 27 firms would have negative capital before and after the shocks, respectively. The total capital shortfall would be EUR 12 billion before shocks, and EUR 39 billion after shocks.
63. Business model is a significant determinant of an insurer’ relative resilience (Table 3). Individual large insurance companies generally appear more resilient than companies of other sizes. Smaller insurers further show relatively high loss absorption capacity, and many of them focus on
20 The impact of the application of correlation matrix is estimated around 20 percent reduction of the loss in the entire industry level. The impact would be different and depending on the risk characteristics of each firm. 21 Capital shortfalls are measured by the gap between SCR and own funds for the insurers with SCR-coverage ratio below 100 percent, without offsetting the capital surplus of other insurers.
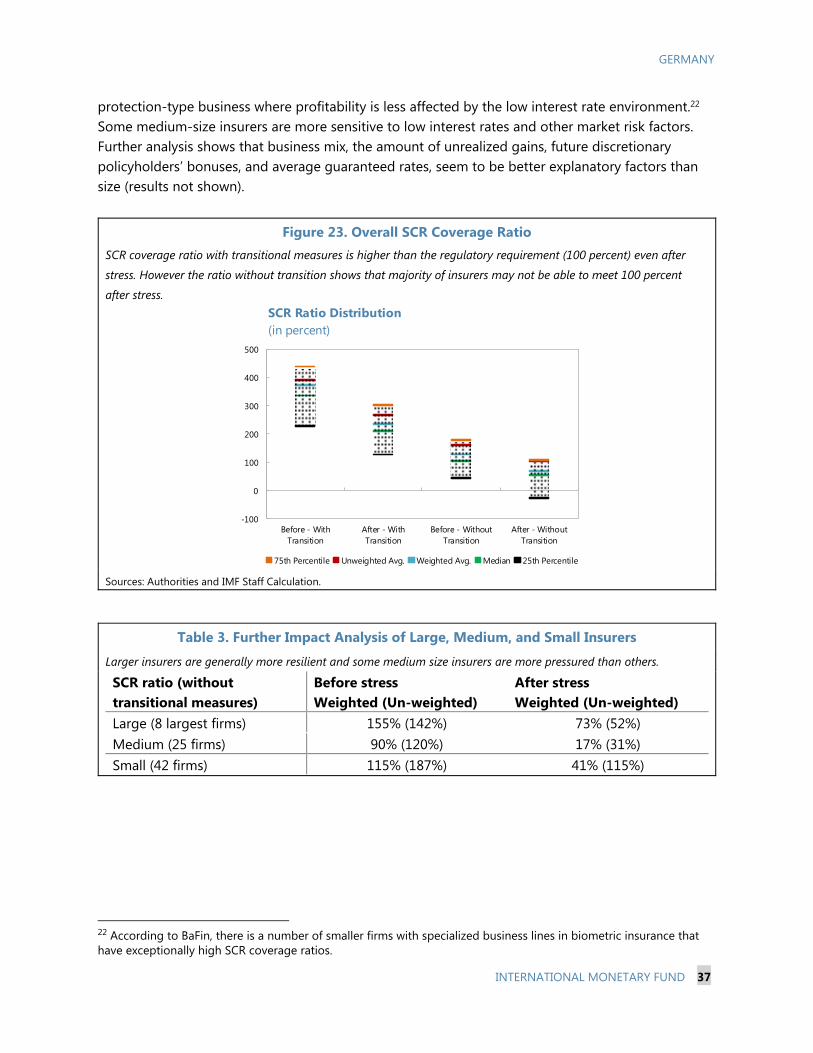
GERMANY
INTERNATIONAL MONETARY FUND 37
protection-type business where profitability is less affected by the low interest rate environment.22 Some medium-size insurers are more sensitive to low interest rates and other market risk factors. Further analysis shows that business mix, the amount of unrealized gains, future discretionary policyholders’ bonuses, and average guaranteed rates, seem to be better explanatory factors than size (results not shown).
22 According to BaFin, there is a number of smaller firms with specialized business lines in biometric insurance that have exceptionally high SCR coverage ratios.
Figure 23. Overall SCR Coverage Ratio SCR coverage ratio with transitional measures is higher than the regulatory requirement (100 percent) even after
stress. However the ratio without transition shows that majority of insurers may not be able to meet 100 percent
after stress.
Sources: Authorities and IMF Staff Calculation.
Table 3. Further Impact Analysis of Large, Medium, and Small Insurers
Larger insurers are generally more resilient and some medium size insurers are more pressured than others.
SCR ratio (without transitional measures)
Before stress Weighted (Un-weighted)
After stress Weighted (Un-weighted)
Large (8 largest firms) 155% (142%) 73% (52%) Medium (25 firms) 90% (120%) 17% (31%) Small (42 firms) 115% (187%) 41% (115%)
-100
0
100
200
300
400
500
Before - WithTransition
After - WithTransition
Before - WithoutTransition
After - WithoutTransition
SCR Ratio Distribution(in percent)
75th Percentile Unweighted Avg. Weighted Avg. Median 25th Percentile

GERMANY
38 INTERNATIONAL MONETARY FUND
64. The solvency position of insurers is significantly impacted by spread and interest rate risks, but LAC_TP improved the SCR coverage ratio significantly (Figure 24). Without the effect of transitional arrangements, interest rate and spread risks have material negative impact on SCR coverage ratios. The gross loss causes the overall coverage ratio to turn negative. However, loss absorption capacity from traditional insurance will mitigate the gross loss by more than 50 percent, bringing the average above zero.
65. The capital shortfall is a non-linear function of loss amount (Figure 25). The chart shows the relationship between loss amount and capital shortfall without transitional measures. Five different combinations of shocks were applied, and the capital shortfall is calculated for each scenario.23 The chart shows that the capital shortfall does not increase for relatively small losses, but increases substantially for higher losses: The more severe the stress scenario, the less loss absorption capacities is available. Therefore, the capital shortfall amount is sensitive to the assumption and estimation of loss amount and thus requires a careful interpretation of the figures.
23 5 different shocks are 1; interest rate shock only, combinations of 2; interest rate shock + equity shock, 3; interest rate shock + equity shock + property shock, 4; interest rate shock + equity shock + property shock+ credit spread shock, and 5; interest rate shock + equity shock + property shock + credit spread shock + sovereign shock. In addition, the figure 25 has a capital short fall amount without any shock.
Figure 24. Impact Analysis of SCR Changes (Without transitional measures)
Spread and interest rate risks have material impact, but LAC_TP reduced the loss by more than 50 percent of the loss.
Sources: BaFin and IMF staff calculation.
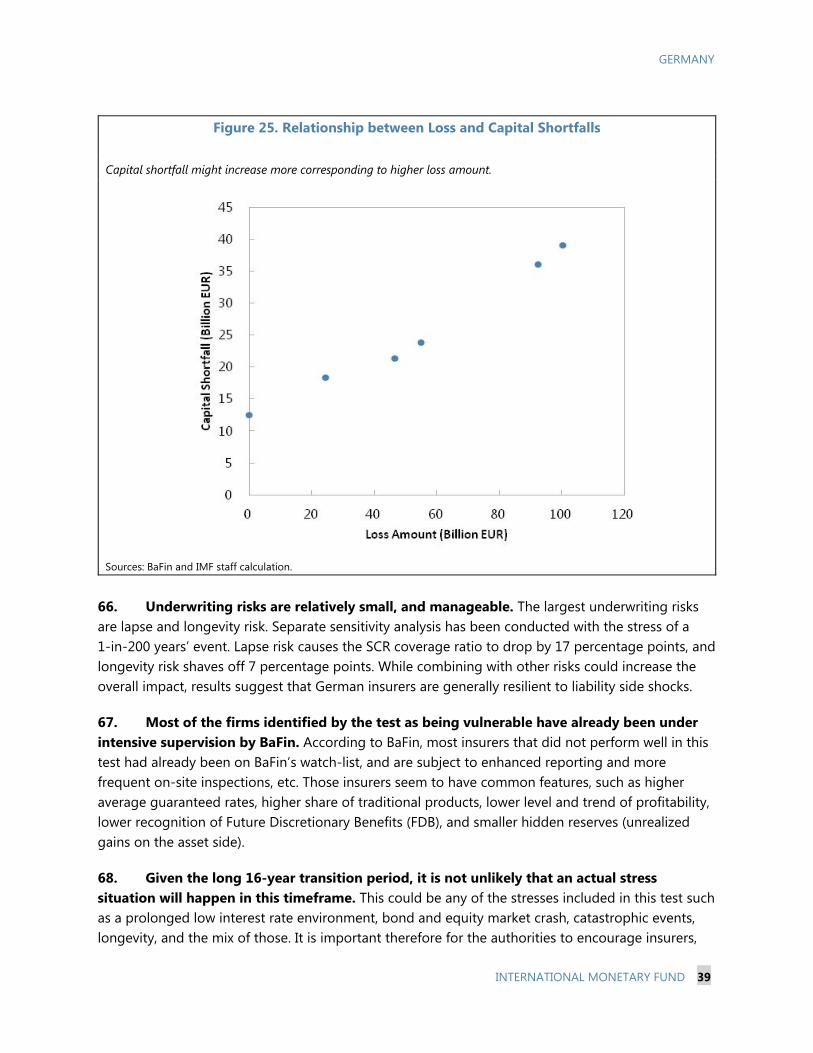
GERMANY
INTERNATIONAL MONETARY FUND 39
Figure 25. Relationship between Loss and Capital Shortfalls
Capital shortfall might increase more corresponding to higher loss amount.
Sources: BaFin and IMF staff calculation.
66. Underwriting risks are relatively small, and manageable. The largest underwriting risks are lapse and longevity risk. Separate sensitivity analysis has been conducted with the stress of a 1-in-200 years’ event. Lapse risk causes the SCR coverage ratio to drop by 17 percentage points, and longevity risk shaves off 7 percentage points. While combining with other risks could increase the overall impact, results suggest that German insurers are generally resilient to liability side shocks.
67. Most of the firms identified by the test as being vulnerable have already been under intensive supervision by BaFin. According to BaFin, most insurers that did not perform well in this test had already been on BaFin’s watch-list, and are subject to enhanced reporting and more frequent on-site inspections, etc. Those insurers seem to have common features, such as higher average guaranteed rates, higher share of traditional products, lower level and trend of profitability, lower recognition of Future Discretionary Benefits (FDB), and smaller hidden reserves (unrealized gains on the asset side).
68. Given the long 16-year transition period, it is not unlikely that an actual stress situation will happen in this timeframe. This could be any of the stresses included in this test such as a prolonged low interest rate environment, bond and equity market crash, catastrophic events, longevity, and the mix of those. It is important therefore for the authorities to encourage insurers,
GERMANY
40 INTERNATIONAL MONETARY FUND
particularly those using transitional measures, to develop feasible plans to meet the SCR coverage ratio without transitional measures even under some plausible stress situation as used in the stress test.
SYSTEMIC RISK ANALYSIS A. Methodologies
69. Contagion risks and interconnectedness are assessed using two different approaches. The first approach applies the Espinoza-Vega and Sole (2010) methodology to examine cross-border bank exposures, using BIS consolidated Banking Statistics. The second approach uses the Diebold and Yilmaz (2014) methodology with daily equity returns data to examine the contagion between publicly traded banks and insurance companies in Germany, and the spillover among Deutsche Bank, Commerzbank, and GSIBs.
70. The analysis based on the network framework of Espinoza-Vega and Sole (2010) considers both credit and funding shocks to the banking systems.24 An initial negative credit or funding shock to a country’s financial system could be propagated through the network of bilateral claims across countries (based on the BIS consolidated banking statistics), and could distress banking systems in other countries beyond the direct losses from the initial shocks. If any banking system incurs losses larger than their capital, the system “fails.” This failure can subsequently cause some other banking system to fail, triggering domino effects, where a failure of a banking system in a network transmits to other banking systems. Two sets of simulations are considered in the analysis. The first simulation applies to reporting banks’ exposure to foreign banks, and the second one applies to the total exposure of the banking sector.
B. Results 71. Network analysis suggests a higher degree of outward spillover from the German banking sector than inward spillover (Figure 26). In particular, Germany, France, the U.K. and the U.S. have the highest degree of outward spillover as measured by the average percentage of capital loss of other banking systems due to banking sector shock in the source country. The impact of inward spillover to the German banking sector is considerably more moderate, as measured by the percentage of capital loss in a banking system due to the default of all exposures. The result shows that the failure of all other banking systems could lead to a 5 percent capital loss in Germany, similar to the U.K., and if one takes into account of total exposures, the loss amounts to about 30 percent, relatively low by international comparison.
24 The sample consists of 16 BIS reporting countries with the highest banking sector exposure to Germany.

GERMANY
INTERNATIONAL MONETARY FUND 41
72. The largest German banks and insurance companies are highly interconnected (Figure 27). The highest degree of interconnectedness can be found between Allianz, Munich Re, Hannover Re, Deutsche Bank, Commerzbank and Aareal Bank, with Allianz being the largest contributor to systemic risks among the publicly trade German financials.25 Both Deutsche Bank and Commerzbank are found to be the source of outward spillovers to most other publicly listed banks and insurers in Germany. This finding suggests that the linkages between German banks and insurers should be closely monitored.
25 The interconnectedness measure is derived from the variance decomposition of the underlying vector autogression (VAR).
Figure 26. Outward and Inward Spillover of the German Banking Sector
Source: IMF Staff Calculations. Results are based on the Espinoza-Vega and Sole (2010) approach and BIS Consolidated Banking Statistics for 2015Q1.
Figure 27. Interconnectedness among Publicly Traded German Banks and Insurers
Source: IMF Staff Calculations. Results are based on the Diebold and Yilmaz (2014) approach using daily equity returns from July 16, 2015 to February 23, 2016. Note: The blue and green nodes denote banks and insurance companies, respectively. The thickness of the edges capture total linkages (both inward and outward), and the arrow captures the direction of net spillover. The size of the nodes reflects asset size. Chart constructed with NodeXL.
0
30
60
90
120
150
Aust
ralia
Aust
ria
Belg
ium
Cana
da
Finl
and
Fran
ce
Ger
man
y
Italy
Japa
n
Kore
a
Net
herla
nds
Spai
n
Swed
en
Switz
erla
nd UK
US
Outward Spillover: Percentage of Capital Loss
Bank Exposure All Exposure
0
9
18
27
36
45
Aus
tral
ia
Aus
tria
Belg
ium
Can
ada
Finl
and
Fran
ce
Ger
man
y
Italy
Jap
an
Ko
rea
Net
herl
and
s
Spai
n
Swed
en
Switz
erla
nd UK US
Inward Spillover: Percentage of Capital Loss
Bank Exposure All Exposure

GERMANY
42 INTERNATIONAL MONETARY FUND
73. Deutsche Bank is also a major source of systemic risk in the global financial system (Figure 28). The net contribution to global systemic risk is captured by the difference between the outward spillover to the system from the bank and the inward spillover to the bank from the system based on forecast error variance decomposition. Deutsche Bank appears to the most important net contributor to systemic risks in the global banking system, followed by HSBC and Credit Suisse. U.S. banks such as JP Morgan, Goldman Sachs, and Bank of America also contribute positively to systemic risks, while the Asian banks tend to be the net recipients of systemic risks despite the relative large asset size. Commerzbank, while an important player in Germany, does not appear to be a main contributor to systemic risks globally.
74. Moreover, Deutsche Bank appears to be a key source of outward spillovers to all other G-SIBs as measured by bilateral linkages (Figure 29). There are some regional clusters among banks, for example, European banks are highly interconnected with each other. A similar pattern could also be found for American banks and some Asian banks. Consistent with the result on the net contribution to systemic risks, Commerzbank does not appear to be an important source of outward spillover. In general, Commerzbank tends to be the recipient of inward spillover from the U.S. and European GSIBs, with the exception of some smaller GSIBs, such as State Street or Standard Chartered. The relative importance of Deutsche Bank underscores the importance of risk management and intense supervision of G-SIBs and the close monitoring of their cross-border exposures.
Figure 28. Net Contribution to Systemic Risk
Source: IMF Staff Calculations based on the Diebold and Yilmaz (2014) methodology. Note: The GSIB list follows the November 2015 update by the FSB. Groupe BPCE and the Agricultural Bank of China (ABC) are not included due to the lack of public traded data and short sample size. Germany’s second largest bank, Commerzbank, is included in the analysis.
-25
-20
-15
-10
-5
0
5
10
15
20
25
Alli
anz
Han
nove
r R
e
Aar
eal
Deu
tsch
e Ba
nk
Tala
nx
Co
mm
erzb
ank
Mun
ich
Re
Rhe
inla
nd
Mer
kur
Qui
rin
Um
wel
tban
k
DEU
Pfa
ndb
rief IKB
Old
enb
urg
isch
e
Nue
rnb
erg
er
Cas
h Li
fe
Publicly Listed Banks and Insurers in Germany
-60-50-40-30-20-10
010203040
Deu
tsch
eBan
kH
SBC
Cre
dit
Suis
seJP
Mo
r gan
Go
ldm
anSa
chs
Ban
kOfA
mer
ica
BN
PP
arib
asSa
nta
nd
erB
ankO
fNY
Mel
lon
Mo
r gan
Stan
ley
SocG
enC
red
itA
gri
cole
Wel
lsFa
r go
Cit
i gro
up
No
rdea
Co
mm
erzb
ank
Stat
eStr
eet
Un
iCre
dit
UB
SR
BS
Mit
sub
ish
iB
arcl
ays
Stan
dar
dC
har
tere
dSu
mit
om
oC
hin
aCo
nst
ruct
ion
Ban
kIC
BC
Ban
kOfC
hin
aIN
GB
ank
Miz
uh
o
Globally Systemically Important Banks (GSIBs)
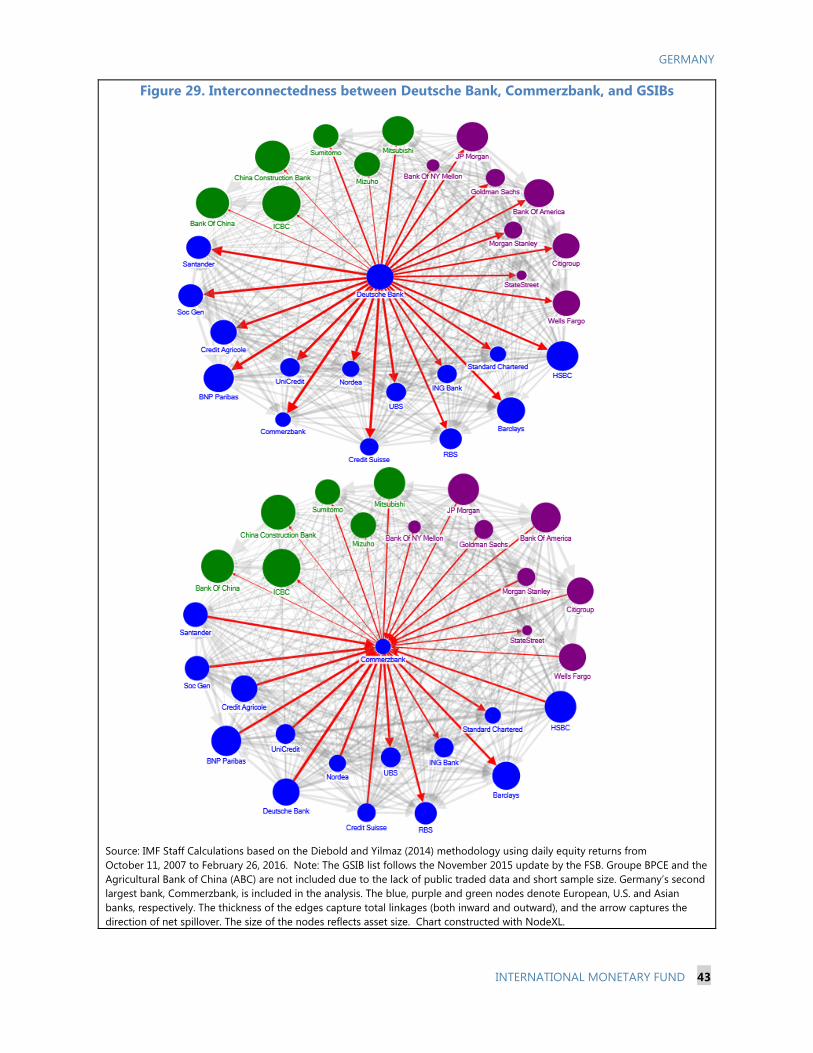
GERMANY
INTERNATIONAL MONETARY FUND 43
Figure 29. Interconnectedness between Deutsche Bank, Commerzbank, and GSIBs
Source: IMF Staff Calculations based on the Diebold and Yilmaz (2014) methodology using daily equity returns from October 11, 2007 to February 26, 2016. Note: The GSIB list follows the November 2015 update by the FSB. Groupe BPCE and the Agricultural Bank of China (ABC) are not included due to the lack of public traded data and short sample size. Germany’s second largest bank, Commerzbank, is included in the analysis. The blue, purple and green nodes denote European, U.S. and Asian banks, respectively. The thickness of the edges capture total linkages (both inward and outward), and the arrow captures the direction of net spillover. The size of the nodes reflects asset size. Chart constructed with NodeXL.

GERMANY
44 INTERNATIONAL MONETARY FUND
POLICY RECOMMENDATIONS 75. Authorities would benefit from establishing a readily available, consistent set of data for financial stability analysis. While there is a wealth of data being collected by the authorities, it can be challenging and extraordinarily time-consuming to condense and integrate the different sources and definitions of data. The process could be simplified and facilitated by having a consistent set of automatically updated key data that allows performing various stability analyses without the need of first collecting and condensing all necessary raw data.
76. Despite newly organized supervisory responsibilities, the Bundesbank should continue performing and developing top-down stress tests for the large banks, as well as for the medium-sized and small banks. It is important for all supervisors to have a clear understanding of categories of banks, their interaction, and their combined impact on the German and European economy. The perimeter of concurrent stress tests should be expanded so as to cover and assess in more detail foreign loan exposures, sovereign and off balance sheet exposures, including hedges. Foreign credit exposures, while limited for smaller banks, are substantial in larger banks. It is therefore important to cover these assets, and collect meaningful risk parameters so that the risk exposures can be stress tested more appropriately.
77. While top-down stress testing frameworks have been improving over the years, there is still scope for further development. Here, balance sheets and unexpected losses should be modeled more dynamically, not least because the share of IRB portfolios is relatively large. Also, the authorities may want to design a better integration of liquidity and solvency risk analysis, instead of keeping those largely separate. Furthermore, interconnectedness analysis should be strengthened, and also cover inward and outward cross-border spillover effects.
78. BaFin should require action plans where companies face difficulties in meeting Solvency II requirements. Given uncertainty over the financial health of the insurers on the Solvency II measures, and market focus on the new requirements, BaFin should ensure that, where companies are relying on transitional measures, insurers have robust and credible plans for meeting the full requirements, including under stress conditions that may occur in the long transitional period, and by the end of the period. BaFin should take action to restrict business or withdraw approval of transitional measures, where necessary.
79. The authorities are encouraged to develop a strategy on communications to the public and policyholders so as to mitigate the risk. Transparency over Solvency II figures without transitional measures is appropriate. However, disclosure of the complex figures without supplemental explanation could damage market confidence in the industry. Disclosures therefore should be accompanied by well written explanation and credible recovery plans. Given that many firms are expecting to rely on transitional arrangements, not only the industry but also the authorities should fulfill the accountability (such as through the speeches and publication describing the actions taken in general terms) so that the public keep reasonable assurance on such firms and the entire industry.

GERMANY
INTERNATIONAL MONETARY FUND 45
80. Authorities should continue to improve stress testing methodologies and conduct macroprudential stress tests regularly. There is scope to improve on the stress testing approach used in the FSAP to make it ready for practical supervisory usage. Data quality and availability are expected to improve greatly after the insurers’ reports based on Solvency II become available. The authorities should continue to improve the stress testing methodologies, data quality and validation analysis, so as to capture industry vulnerabilities under Solvency II and to conduct stress tests regularly on an industry wide basis.
81. The authorities are encouraged to analyze the sufficiency and flexibility of the safety net of the insurance sector in the medium term. Although this stress test needs significant development to draw concrete policy recommendations on the safety net, this exercise has identified the potential capital shortfalls, which may be more than an individual firm’s capacity to meet. While encouraging the best efforts of individual firm to remedy the situation and improving recovery and resolution planning, an adequate and flexible safety net could help the industry from disruptive reputational failure and further deterioration of capital positions in the worst cases. The German life insurance sector has insurance guarantee schemes (such as Protektor), however there is uncertainty about effectiveness of transferability of complex portfolio.26 The authorities are encouraged to satisfy themselves that the current safety net is sufficient even in a plausible market wide stress situation and improve the safety net as necessary.
26 See comments on ICP 12 of the Technical Note on Insurance Sector Supervision. Insurance assets and corresponding assets will be transferred to a failed insurer to Protektor. However, there is uncertainty in the process of transferring derivative and reinsurance transactions, if the failed insurer has material transactions of those.
GERMANY
46 INTERNATIONAL MONETARY FUND
Annex I. Insurance Sector Safety Net
Germany has two Insurance Guarantee Schemes, Protektor for life insurance and Medicator for private health insurance. Both were established as voluntary industry-based schemes and in that form Protektor (as the private insurance company Protektor Lebensversicherungs AG) acquired the insurance portfolio of Mannheimer Life in 2003. The government subsequently assigned to Protektor the management of a new public guarantee fund for life insurance. Protector is financed ex ante and has accumulated a fund of EUR 897 million and the maximum size of the fund could reach to EUR 3.4 billion. The fund accumulation is based on 1 per mille of the net technical provisions of all members. Additional special contributions up to EUR 863 million can be levied, if necessary and beyond that point BaFin is required to use its powers to impose a 5 percent reduction of liabilities. Under separate, private arrangements, German life insurers have committed to provide additional funds up to a further 1 percent of net technical provisions (some EUR 9 billion at present). However, unlike in many other countries, the role of German guarantee schemes is strictly limited to run off insurance contracts. They may also seek and can transfer the policies to other insurers. Other guarantee schemes tend to have a capacity to compensate policyholders of insolvent insurers for loss up to a limited amount and/or can provide capital to facilitate smooth transfer of the insurance policies. The limited role of guarantee schemes may cause difficulties in case of insurer’s failure with complex operations. For example, it is not clear how a failure would be managed where the sufficiency of assets depends on hedges using derivatives or there are reinsurance arrangements. The life insurance industry is changing their business from simple and traditional business to more complex and non-traditional business. These reforms are necessary to meet the new Solvency II requirements, however active hedging through derivative products and reinsurance activities will put more challenges in the resolution and recovery process in case of companies failure. It could be addressed through recovery and resolution planning at the individual firm level. However, as this is more the industry wide issue, it is recommended that BaFin and the federal government review the adequacy and sufficiency of the insurance guarantee scheme.

GERMANY
INTERNATIONAL MONETARY FUND 47
Annex II. Technical Appendix on Systemic Risk and Spillover Analysis
Contagion risks and interconnectedness are assessed using two different approaches. The first approach applies the Espinoza-Vega and Sole (2010) methodology to examine cross-border bank exposures, using BIS consolidated Banking Statistics. The second approach uses the Diebold and Yilmaz (2014) methodology with daily equity returns data to examine the contagion between publicly traded banks and insurance companies in Germany, and the spillover among Deutsche Bank, Commerzbank and GSIBs.
Network Analysis Framework (Espinoza-Vega and Sole, 2010)
The analysis based on the network framework of Espinoza-Vega and Sole (2010) considers both credit and funding shocks to the banking systems.
Credit shock: “Failure” of banking system A will incur credit losses to system B that has claims against A. The credit loss rate assumption controls for the severity of credit cost upon failure. A loss given default rate of 100 percent is assumed to capture the impact of an extreme credit shock. 27
Funding shock: “Failure” of banking system A will force system B (that has claims against A) to find alternative sources of funding. This may result in the fire sale of liquid assets by system B to fill the funding gap. The fraction of lost funding that is not replaceable is assumed to be 35 percent (65 percent rollover) and the haircut in the fire sale is assumed to be 50 percent.28
The sample consists of 16 BIS reporting countries including those with the highest banking sector exposure to Germany. 29 Cross-border banking exposure data are based on BIS consolidated statistics on ultimate risk basis. Tier 1 regulatory data are taken from IMF’s FSI Statistics. The analysis is based on 2015Q1 data.
An initial negative credit or funding shock to a country’s financial system could be propagated through the network of bilateral claims across countries (based on the BIS consolidated banking
27 A loss given default rate of 100 percent is also assumed in Espinoza-Vega and Sole (2010), the Italy 2013 FSAP and the 2012 Japan FSAP. Espinoza-Vega and Sole (2010) and Wells (2004) argue that network studies should consider higher loss-given-default estimates than typically assumed, as banks tend to face substantial uncertainty over recovery rates in the short run. The simulation results should be interpreted as the maximum possible impact of systemic instability. Note that collaterals and hedging instruments are not taken into account due to data limitations. 28 The same assumptions on the funding shock were made in Espinoza-Vega and Sole (2010). While the final numerical results are sensitive to these assumptions; however, the relative importance of systemic countries remain the same. 29 The sample consists of Australia, Austria, Belgium, Canada, Finland, France, Germany, Italy, Japan, Korea, the Netherlands, Spain, Sweden, Switzerland, the United Kingdom and the United States.

GERMANY
48 INTERNATIONAL MONETARY FUND
statistics), and could distress banking systems in other countries beyond the direct losses from the initial shocks.
If any banking system incurs losses larger than their total Tier 1 capital, the system “fails.” This failure can subsequently cause some other banking system to fail, triggering domino effects, where a failure of a banking system in a network transmits to other banking systems.
Two sets of simulations are considered in the analysis. The first simulation applies to reporting banks’ exposure to foreign banks, and the second one applies to the total exposure of the banking sector.
Spillover Analysis with Market Data (Diebold and Yilmaz, 2014)
The spillover analysis using the Diebold and Yilmaz (2014) methodology first estimates a Vector Autoregression (VAR) model with market data. The interconnectedness measure is then derived from the Generalized Variance Decomposition (Pesaran and Shin, 1998) of the underlying VAR. In contrast to the traditional Cholesky and other structural identification strategies, the Generalized Variance Decomposition (GVD) does not impose any assumptions on the order of variables, instead, it relies on a largely data-based identification scheme (“let the data speak”).
Two sets of simulations are conducted as part of the market-based spillover analysis. The first set of simulations examines the interconnectedness between publically traded banks and insurers in Germany, while the second studies the spillover and the contribution to systemic risks among GSIBs. Daily equity returns, as constructed as the log difference of equity prices are used in both exercises. The sample spans from July 16, 2015 to February 23, 2016 for the German bank-insurer analysis, and from October 11, 2007 to February 26, 2016 for the GSIB analysis.30
The FSAP team derives a set of pair-wise directional connectedness measure between financial firms, based on the Generalized Variance Decompositions. On aggregate, the from-degree measure captures exposures of individual firms to systemic shocks from the network (inward spillover), in a fashion analogous to Marginal Expected Shortfalls (MES). The to-degree measure captures contributions of individual firms to systemic network events (outward spillover), in a fashion analogous to Delta CoVaR (see Diebold and Yilmaz, 2014). In addition, the net-degree measure (the difference between to- and from- measures) describes the relative contribution to systemic risks from each financial firm. The results are based on rolling window estimations and the relative importance of each institution’s contribution to systemic risks (the net-degree measure) is broadly stable and robust over time. The following charts present the net contribution to systemic risks in the German financial sector (among publically traded firms) and among GSIBs. For space considerations, only select firms with a positive net contribution to systemic risks are presented.
30 The sample size for the German bank-insurer analysis was restricted by data availabilities, in particular, for the Deutsche Pfandbrief bank. The data source is Bloomberg.

GERMANY
INTERNATIONAL MONETARY FUND 49
0
5
10
15
20
25
30
Munich Re Hannover Re Allianz TalanxDeutsche Bank Commerzbank Aareal
Net Contributors to Systemic Risks in the German Financial Sector
Note: Results are based on the Diebold and Yilmaz (2014) approach using daily stock returns data from 16 July 2015 to 23 February 2016. Net spillover for each entity is computed as the difference between the outward spillover to the financial system from the entity and inward spillover to the entity from the financial system based on variance decomposition of the underlying Vector Autoregression (VAR) model.
10
12
14
16
18
20
22
24
26
28
30
8/24/2015 9/24/2015 10/24/2015 11/24/2015 12/24/2015 1/24/2016 2/24/2016
BNPParibas DeutscheBank SantanderCreditSuisse HSBC BankOfAmericaBankOfNYMellon GoldmanSachs JPMorganMorganStanley
Source: IMF Staff Calculations based on the Diebold and Yilmaz (2014) methodology using daily equity returns from 11 October 2007 to 26 February 2016. Net spillover for each entity is computed as the difference between the outward spillover to the financial system from the entity and inward spillover to the entity from the financial system based on variance decomposition of the underlying Vector Autoregression (VAR) model.
Top Ten Net Contributors to Systemic Risks among GSIBs

50 IN
TERNATIO
NAL M
ON
ETARY FUN
D
GERM
ANY
BANKING SECTOR: SOLVENCY RISK
Domain Assumptions Bottom-Up by Banks Top-down by Bundesbank and FSAP Team
Institutions included. Around 1,600 institutions. 1,776 institutions operating in Germany.
1. Institutional Perimeter
Market share 28 percent of total banking sector assets
Nearly 100 percent of total banking sector assets
Data and baseline date
Balance sheet, income statement, and portfolio data as of December 2014
Publicly available data and reporting data. For small and medium banks (LSIs), the FSAP
team applied national reporting data from various reporting templates. Specifically, the FSAP applied bank-by-bank supervisory data on regulatory capital and income statement, the borrower statistics on credit risk exposure, together with data on trading income, FX exposure and sovereign exposure for 1,755 banks.
Due to incomplete and/or inconsistent data for large banks and banking groups (SIs) the FSAP had to establish a stress testing database using five different sources: the European reporting templates (FINREP and COREP), publicly available data from the 2015 EBA Transparency Exercise, supervisory data from the Bundesbank, and Bankscope for 21 banks. In particular, the COREP database provided regulatory information,
GERM
ANY
Annex III. Stress Test M
atrix (STEM) for the Banking
Sector
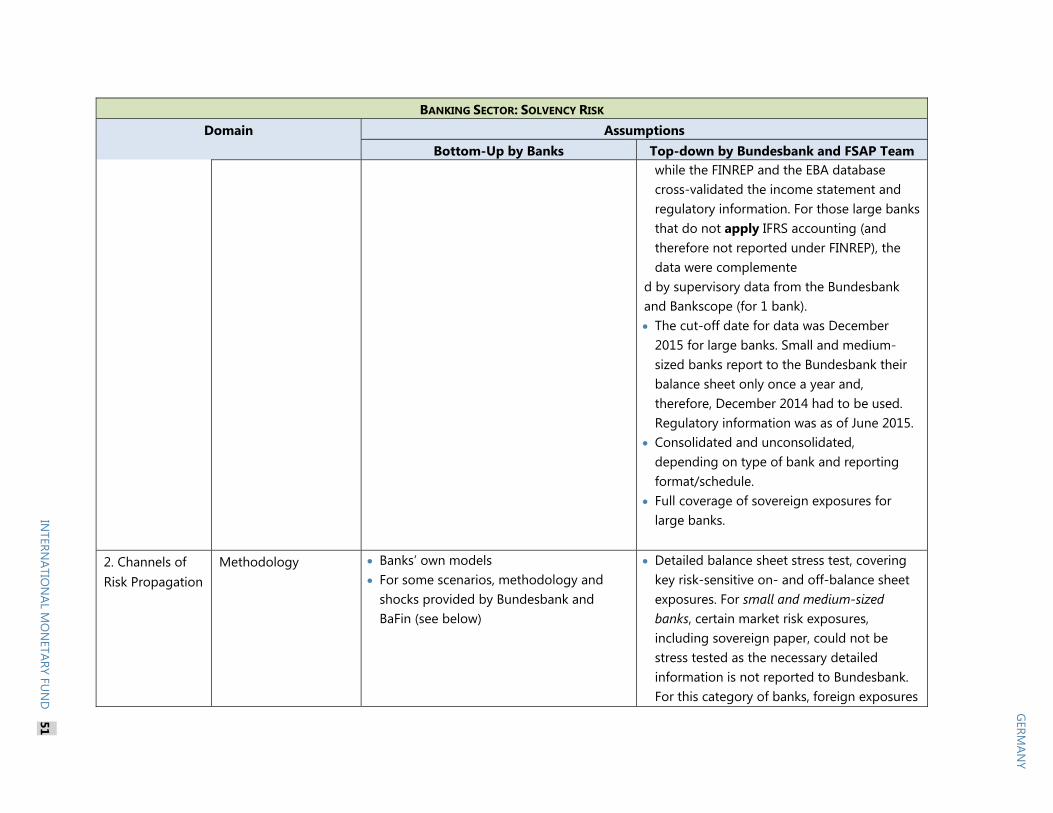
GERM
ANY
INTERN
ATION
AL MO
NETARY FU
ND
51
BANKING SECTOR: SOLVENCY RISK Domain Assumptions
Bottom-Up by Banks Top-down by Bundesbank and FSAP Team while the FINREP and the EBA database cross-validated the income statement and regulatory information. For those large banks that do not apply IFRS accounting (and therefore not reported under FINREP), the data were complemente
d by supervisory data from the Bundesbank and Bankscope (for 1 bank). The cut-off date for data was December
2015 for large banks. Small and medium-sized banks report to the Bundesbank their balance sheet only once a year and, therefore, December 2014 had to be used. Regulatory information was as of June 2015.
Consolidated and unconsolidated, depending on type of bank and reporting format/schedule.
Full coverage of sovereign exposures for large banks.
2. Channels of Risk Propagation
Methodology Banks’ own models For some scenarios, methodology and
shocks provided by Bundesbank and BaFin (see below)
Detailed balance sheet stress test, covering key risk-sensitive on- and off-balance sheet exposures. For small and medium-sized banks, certain market risk exposures, including sovereign paper, could not be stress tested as the necessary detailed information is not reported to Bundesbank. For this category of banks, foreign exposures

52 IN
TERNATIO
NAL M
ON
ETARY FUN
D
GERM
ANY BANKING SECTOR: SOLVENCY RISK
Domain Assumptions Bottom-Up by Banks Top-down by Bundesbank and FSAP Team
were also excluded from the exercise, first, because of incomplete risk and geographic information and, second, because foreign exposures constitute only around 1 percent of small and medium-sized banks’ total assets). Large banks were analyzed on the group/holding level, taking into account both domestic and foreign exposures. In order to stress test sovereign risk, net direct sovereign exposures published by EBA were used. In one single case, interest rate hedges were taken into account. For the other banks, hedges could not be taken into consideration as that information is not available to Bundesbank. FX shocks were applied to net open (unhedged) positions. For both categories of banks, trading losses were estimated by applying scenario-specific haircuts on asset and equity values.
Economic sector-specific credit risk parameters were used for calculating macro-financial elasticities. The following sectors of economic activity were treated individually: agriculture; electricity and mining; manufacturing; construction; wholesale and retail trade; transportation (incl. shipping); financial intermediation excluding MFIs;

GERM
ANY
INTERN
ATION
AL MO
NETARY FU
ND
53
BANKING SECTOR: SOLVENCY RISK Domain Assumptions
Bottom-Up by Banks Top-down by Bundesbank and FSAP Team services; household/retail; non-profit institutions.
Market risk shocks were either included in the macroeconomic scenarios, or applied separately to banks’ risk exposures. The house price shock (assuming over three years a 10 percent reduction in real estate values vis-à-vis the starting point) further affected mortgage exposures through higher loss rates (modeled via stressed LGD) compared to other loan exposures.
Satellite Models for Macro-Financial linkages
Banks own models used to translate common scenarios into risk parameter shifts
For certain constrained bottom-up tests, risk parameter shifts are provided by Bundesbank and BaFin (see below)
Credit losses for large, small and medium-sized banks were modeled via macroeconomic credit risk models, using Moody’s KMV 12-month expected default frequencies (EDFs).
Sovereign risk was assessed through haircuts on sovereign exposure holdings, estimated separately for each accounting portfolio, and depending on duration. An instantaneous and permanent shock was assumed, with realization of valuation loss in first year, and no recovery in yields.
Stress test horizon Five-year horizon: 2015–2019.
Three-year horizon: 2016–2018.

54 IN
TERNATIO
NAL M
ON
ETARY FUN
D
GERM
ANY BANKING SECTOR: SOLVENCY RISK
Domain Assumptions Bottom-Up by Banks Top-down by Bundesbank and FSAP Team
3. Tail shocks Scenario analysis
Constrained BU tests include the following common shocks for all scenarios: Increase in PDs between 60 and 155 percent; haircut on collateral of 10% and 20%; widening of credit spreads on trading book exposures Scenario 1: Banks estimate their
performance under a scenario that assumes a continuation of the current low interest rate environment (based on banks’ own expectations). Under these assumptions, performance is then estimated (dynamic balance sheet assumption).
Scenario 2: Banks estimate their performance under a constrained scenario, where the yield curve shape and its level are fixed at December 2014. No behavioral response.
Scenario 3: -100 basis points parallel shift (drop) in yield curve as of December 2014, with behavioral response (dynamic balance sheet).
“Baseline Scenario” was the IMF October 2015 World Economic Outlook. ”Global Stress Scenario” features: a serious recession, triggered by a tightening
of global financial conditions, accompanied by credit cycle downturns in emerging economies;
realization of financial stability risks delays or stalls monetary normalization in the systemic advanced economies, including an abrupt decompression of asset risk premia relative to the baseline;
secondary market liquidity drops in all of the systemic advanced economies as financial risk taking unwinds.
credit cycle downturn in emerging economies, accompanied by a disorderly deleveraging in China, and suppressed economic risk-taking worldwide. Substantial drop in private domestic demand induced by negative investment and consumption demand shocks, representing a loss in confidence by nonfinancial corporates and households, which raise their saving rates and delay expenditures. Both weigh heavily on aggregate demand.
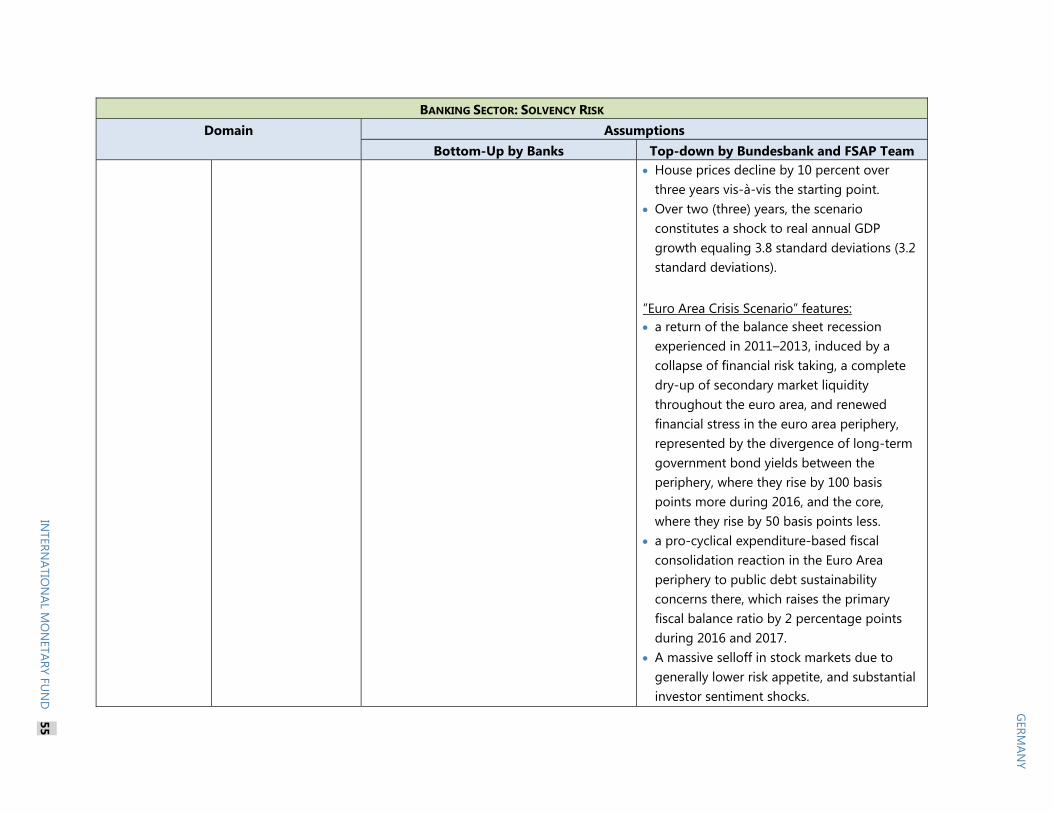
GERM
ANY
INTERN
ATION
AL MO
NETARY FU
ND
55
BANKING SECTOR: SOLVENCY RISK Domain Assumptions
Bottom-Up by Banks Top-down by Bundesbank and FSAP Team House prices decline by 10 percent over
three years vis-à-vis the starting point. Over two (three) years, the scenario
constitutes a shock to real annual GDP growth equaling 3.8 standard deviations (3.2 standard deviations).
”Euro Area Crisis Scenario” features: a return of the balance sheet recession
experienced in 2011–2013, induced by a collapse of financial risk taking, a complete dry-up of secondary market liquidity throughout the euro area, and renewed financial stress in the euro area periphery, represented by the divergence of long-term government bond yields between the periphery, where they rise by 100 basis points more during 2016, and the core, where they rise by 50 basis points less.
a pro-cyclical expenditure-based fiscal consolidation reaction in the Euro Area periphery to public debt sustainability concerns there, which raises the primary fiscal balance ratio by 2 percentage points during 2016 and 2017.
A massive selloff in stock markets due to generally lower risk appetite, and substantial investor sentiment shocks.

56 IN
TERNATIO
NAL M
ON
ETARY FUN
D
GERM
ANY BANKING SECTOR: SOLVENCY RISK
Domain Assumptions Bottom-Up by Banks Top-down by Bundesbank and FSAP Team
Consistent with that, house prices decline by 10 percent over three years vis-à-vis the starting point.
Over two (three) years, the scenario constitutes a shock to real annual GDP growth equaling 3.5 standard deviations (3.0 standard deviations).
Sensitivity analysis
Scenario 3: +200 basis point parallel shift (increase) as of December 2014 yield curve under the static balance sheet assumption
Scenario 4: -100 basis points parallel shift (drop) in yield curve as of December 2014, without behavioral response (i.e., static)
NA
4. Risks and Buffers
Risks/factors assessed
Interest rate risk, credit risk, asset price risk
Credit risk Market risk (FX risk, equity price risk, house
price risk, interest rate risk, incl. sovereign risk)
Behavioral adjustments
Conditional on test and scenario (see scenarios and tests described above)
Constant balance sheet assumptions, with full replacement of defaulted exposures. Risk weighted assets (RWAs) are kept constant for STA banks and stressed for IRB banks in adverse scenarios, following the approach and formulas foreseen in Chapter 3 of the EU CRR for the IRB banks.

GERM
ANY
INTERN
ATION
AL MO
NETARY FU
ND
57
BANKING SECTOR: SOLVENCY RISK Domain Assumptions
Bottom-Up by Banks Top-down by Bundesbank and FSAP Team Dividend payout (assumed at 40 percent)
conditional on positive net profit. A 30 percent tax rate is applied to remaining net profit. Post tax net profit is calculated towards capital.
Invariant asset allocation, i.e., no change in business models, lending standards, or investment pattern in response to shocks (over three years).
5. Regulatory and Market-Based Standards and Parameters
Calibration of risk parameters
Either internal parameters or determined by Bundesbank and BaFin (in constrained bottom-up tests)
For small and medium firms, point-in-time PDs (Moody’s KMV Expected default frequencies), and point-in-time LGDs, estimated from the borrowers statistics.
For large banks, point-in-time PDs and LGDs are taken from COREP, with the exposure adjusted downwards to account for performing exposures and those to the non-financial private sector only. Specifically, PDs are taken from COREP template 8.2, excluding defaulted exposures.
Regulatory/ Accounting and Market-Based Standards
National regulation and accounting (GAAP)
CRD IV / CRR fully loaded levels for CET1, Tier 1, and Total Capital, including Capital Conservation Buffer (CCB) and G-SIB and O-SII buffers. Capital shortfalls were measured for CET1, in order to reflect the effect of injecting high-quality capital on other capital definitions.

58 IN
TERNATIO
NAL M
ON
ETARY FUN
D
GERM
ANY BANKING SECTOR: SOLVENCY RISK
Domain Assumptions Bottom-Up by Banks Top-down by Bundesbank and FSAP Team
IAS 39 accounting standards (no mark-to-market for held-to-maturity portfolio; to sovereign exposures accounted in the available-for-sale portfolio, the AFS Prudential Filter (60 percent) was applied. Fair value option and held-for-trading sovereign exposures.
6. Reporting Format for Results
Output presentation Evolution and distribution of operating profit
Evolution of capital ratios. Aggregate results according to type and size
of banks. Impact of different result drivers, including
profit components, losses due to realization of different risk factors.
Capital shortfall as sum of individual shortfalls; in euro and in percent of nominal annual GDP.
Number of banks and corresponding percentage of assets below regulatory minimum.

GERM
ANY
INTERN
ATION
AL MO
NETARY FU
ND
59
BANKING SECTOR: LIQUIDITY RISK
Domain Assumptions Bottom-Up by Banks Top-down by Bundesbank and FSAP Team
1. Institutional Perimeter
Institutions included 44 German banks participating in Basel Quantitative Impact Study (QIS)
All 1,800 banks operating in Germany
Market share More than 90 percent of total banking sector assets and liabilities
100 percent of total banking sector assets and liabilities
Data and baseline date
Basel QIS data for German banks participating in the study
Results for 2011Q2 to 2015Q2, in 6-month intervals
Supervisory and regulatory reporting data as of June and December 2015
2. Channels of Risk Propagation
Methodology
Bottom-up: LCRs and NSFRs as calculated by the banks
Basel III Liquidity Coverage Ratio (LCR) Basel III Net Stable Funding Ratio (NSFR) Bank run and dry up of wholesale
funding markets, taking into account haircuts to liquid assets.
Top-down: cash-flow-based, short-term liquidity stress test, assessing resilience to multifactor scenario. This analysis constitutes an approximation of banks’ CRD IV Liquidity Coverage Ratio (LCR), using supervisory and regulatory reporting data.
3. Risks and Buffers
Risks Funding liquidity risk Market liquidity risk Medium-term maturity mismatch
analysis
Funding liquidity risk Market liquidity risk
Buffers Counterbalancing capacity after the application of market liquidity shocks, stressed liquidity inflows
Assessment of available and required stable funding across maturity buckets
Counterbalancing capacity after the application of market liquidity shocks, stressed net liquidity outflows
Stressed available and required stable funding (NSFR)

60 IN
TERNATIO
NAL M
ON
ETARY FUN
D
GERM
ANY Central bank facilities
BANKING SECTOR: LIQUIDITY RISK
Domain Assumptions Bottom-Up by Banks Top-down by Bundesbank and FSAP Team
4. Tail shocks
Shocks For LCR, see: BCBS (2013), The Liquidity Coverage Ratio and liquidity risk monitoring tools, Basel, January 2013.
For NSFR, see: BCBS (2014), Basel III: The Net Stable Funding Ratio – Consultative Document, Basel, April 2014.
Regulation (EU) No. 575/2013 of the European Parliament and the Council on prudential requirements for credit institutions and investment firms.
BCBS (2013), The Liquidity Coverage Ratio and liquidity risk monitoring tools, Basel, January 2013.
CRD IV/ CRR liquidity standards
5. Regulatory and Market-Based Standards and Parameters
Regulatory standards Basel III liquidity standards for LCR and NSFR
Liquidity ratios, disaggregated by type and size of bank
Counterbalancing capacity Whisker plots for different groups of banks:
total; small and medium-sized banks; foreign banks; savings banks; and cooperative banks.
6. Reporting
Output presentation Liquidity ratios, disaggregated by type and size of bank
Counterbalancing capacity Box plots with whiskers at fifth and
ninety-fifth percentile, and weighted average separately for Group 1 and Group 2 banks.
All 1,800 banks operating in Germany

GERM
ANY
INTERN
ATION
AL MO
NETARY FU
ND
61
Annex IV
. Stress Test Matrix (STEM
) for the Insurance Sector
Domain Assumptions Top-down by BaFin and FSAP Team
1.Institutional Perimeter
Institutions included German life insurance companies
Market share 93 percent of life insurance companies’ assets
Data and baseline date QRT as of the end of 2014, comprehensive life survey 2015, EIOPA stress test 2014, local GAAP-accounting, BaFin sovereign survey basis
2. Channels of Risk Propagation
Methodology Solvency II Standard Formula
Stress test horizon Instant shocks
3. Tail shocks Scenario analysis One in 200 years event using Solvency II parameters as a basis, including: A shift of the risk free yield curve down by 20 percent (LT) to 75 percent (ST) A 22 to 49 percent fall in the price of equities A 4.5 to 37.5 percent haircut of corporate bonds (with 5 year maturity) 100 b.p. higher spreads of peripheries sovereign bonds, 25 b.p. higher spread of core
sovereign bonds and 50 b.p. for US, UK and Japan Shocks of 25 percent for both commercial and residential real estate prices
Sensitivity analysis
One in 200 years event using Solvency II parameters as a basis, including: Increased lapse rate Decreased mortality rate relative to latest observed actuarial data
4.Risks and Buffers
Risks/factors assessed Interest rate, equity, property, credit risks
Behavioral adjustments No management actions after the stress scenario assumed
5. Regulatory and Market-Based Standards
Regulatory/Accounting and Market-Based Standards
Solvency II own funds and SCR with and without transitional measures
6. Reporting Format for Results
Output presentation Dispersion of solvency ratios: average with 25 and 75 percentile of distribution, with and without transitional arrangements, with additional segmentation information of large, medium and small insurers
Capital shortfall to reach 100% SCR coverage ratio, system-wide

62 IN
TERNATIO
NAL M
ON
ETARY FUN
D
GERM
ANY
Domain Assumptions Top-down by BaFin and FSAP Team
7. Key assumptions
Conservative assumptions
Four market scenarios are calibrated as one in 200 years event. However, sovereign shocks are added on the top of the scenarios, which make the entire exercise more conservative than one in 200 years event in terms of calibration of the Solvency II market risk standard formula.
No management actions are considered, such as de-risking. In some cases, insurers may be able to reduce the risky position without material impacts on the market prices.
Some insurers did not apply the volatility adjustment at the end of 2014. In addition, spread widening in the stress scenario would result in a higher volatility adjustment. This would have an offsetting effect on own funds as the risk free rate used for valuing technical provisions would be increased.
Loss amount from sovereign shocks are applied without taking into account the convexity.
Some companies didn't provide FDB figures and assumed FDB equal to LAC_TP. Some companies have reporting errors which result in underestimation of SCR
reduction after the shocks.
Other assumptions, which impact is either unknown or positive
LAC_DT could be higher or lower depending on the magnitude of the stress and the extent that DTA is recoverable.
Reduction of policyholders’ profit participation does not have any negative impact on the future profitability of the existing policies.
LAC_TP and LAC_DT after the shocks are recognized in the same way as before the shocks as long as FDB and net DTL are remaining.
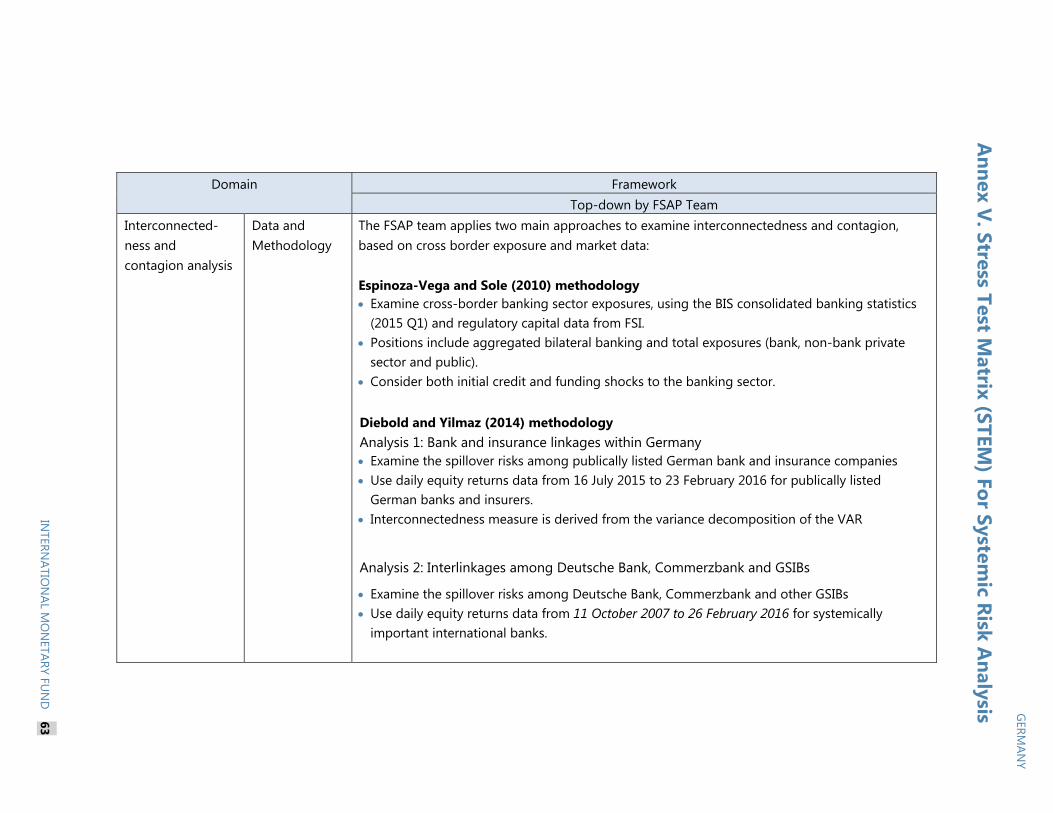
GERM
ANY
INTERN
ATION
AL MO
NETARY FU
ND
63
Annex IV
. Stress Test Matrix (STEM
) for the Insurance Sector
Domain Framework
Top-down by FSAP Team Interconnected-ness and contagion analysis
Data and Methodology
The FSAP team applies two main approaches to examine interconnectedness and contagion, based on cross border exposure and market data: Espinoza-Vega and Sole (2010) methodology Examine cross-border banking sector exposures, using the BIS consolidated banking statistics
(2015 Q1) and regulatory capital data from FSI. Positions include aggregated bilateral banking and total exposures (bank, non-bank private
sector and public). Consider both initial credit and funding shocks to the banking sector. Diebold and Yilmaz (2014) methodology Analysis 1: Bank and insurance linkages within Germany Examine the spillover risks among publically listed German bank and insurance companies Use daily equity returns data from 16 July 2015 to 23 February 2016 for publically listed
German banks and insurers. Interconnectedness measure is derived from the variance decomposition of the VAR
Analysis 2: Interlinkages among Deutsche Bank, Commerzbank and GSIBs
Examine the spillover risks among Deutsche Bank, Commerzbank and other GSIBs Use daily equity returns data from 11 October 2007 to 26 February 2016 for systemically
important international banks.
Annex V
. Stress Test Matrix (STEM
) For Systemic Risk A
nalysis