final nielsen deck
TRANSCRIPT

Spring Semester 2015 Nielsen Project
2
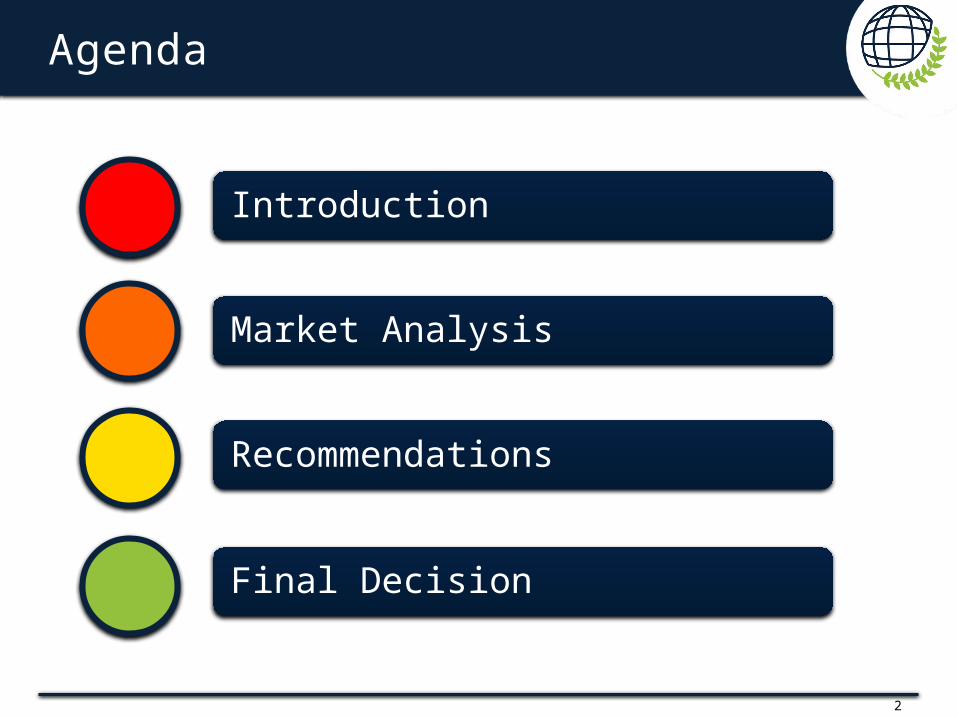
Agenda
Introduction
Market Analysis
Recommendations
Final Decision

3
INTRODUCTION
4Nielsen Case Deck Slides 12
Overview
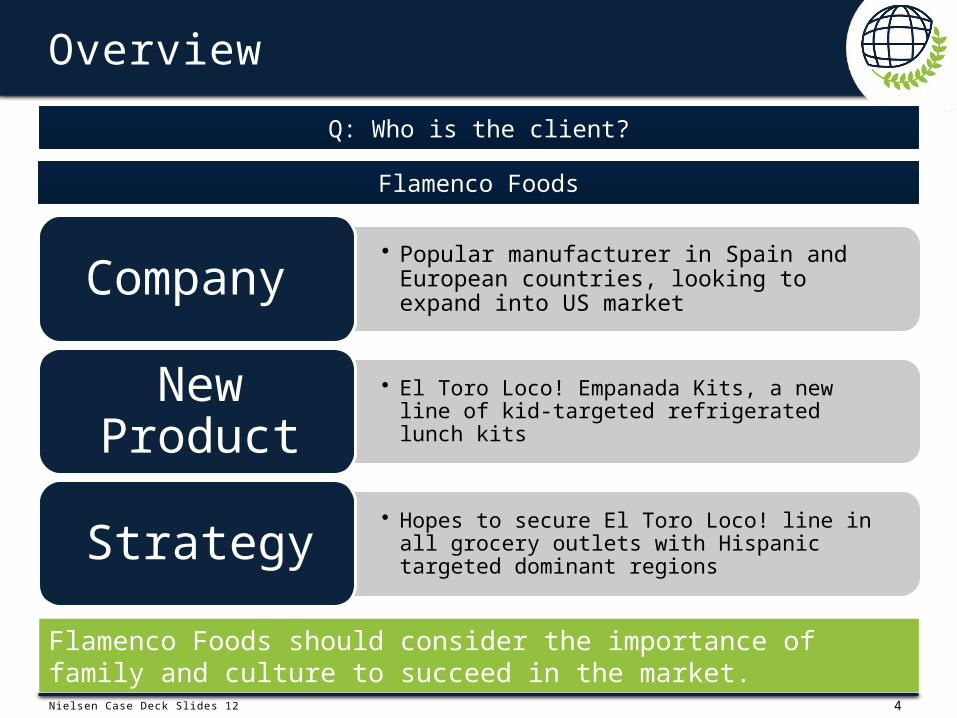
Q: Who is the client?
Flamenco Foods
• Popular manufacturer in Spain and European countries, looking to expand into US market
Company
• El Toro Loco! Empanada Kits, a new line of kid-targeted refrigerated lunch kits
New Product
• Hopes to secure El Toro Loco! line in all grocery outlets with Hispanic targeted dominant regionsStrategy
Flamenco Foods should consider the importance of family and culture to succeed in the market.
5Nielsen Case Deck Slides 12 and 15
Flamenco Foods – Initiative
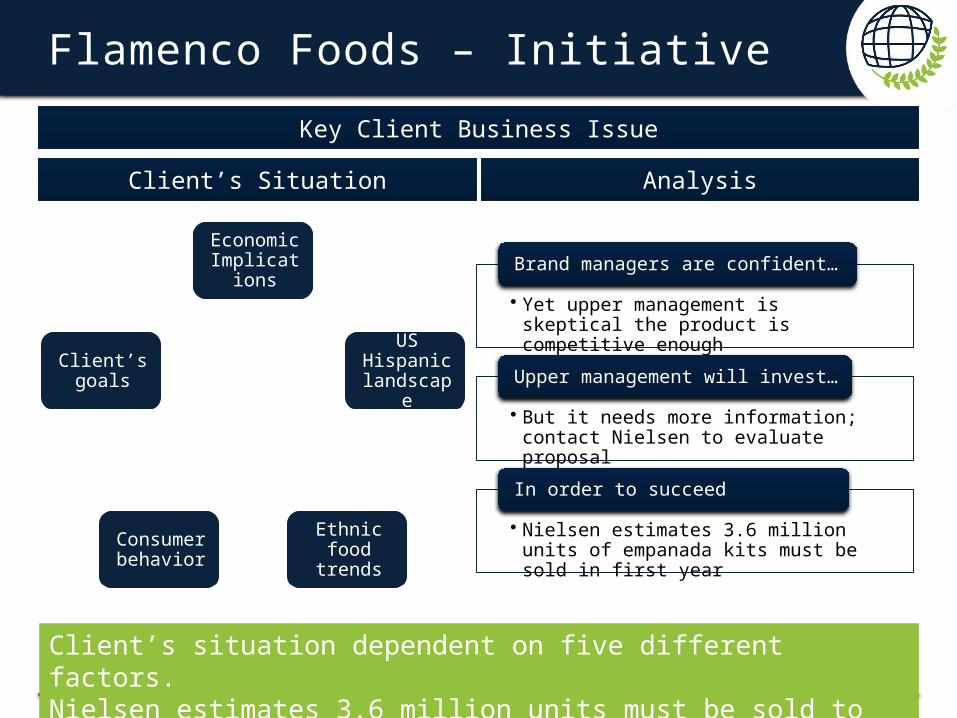
Key Client Business Issue
AnalysisClient’s Situation
Client’s situation dependent on five different factors.Nielsen estimates 3.6 million units must be sold to reach client goals.
• Yet upper management is skeptical the product is competitive enough
Brand managers are confident…
• But it needs more information; contact Nielsen to evaluate proposal
Upper management will invest…
• Nielsen estimates 3.6 million units of empanada kits must be sold in first year
In order to succeed
Economic Implication
s
US Hispanic
landscape
Ethnic food
trends
Consumer behavior
Client’s goals
6Nielsen Case Deck Slides 13
Flamenco Foods – New Product
Q: What is the product?
El Toro Loco! Empanada Kit
3 options of lunch kit contains meals balanced with empanada entrée, dessert, and drink.
Lunch
Kit
• Contains one empanada, pudding cup, and one drink
Easy
• Requires no prep work, which means more time for parents
Variety
• Three varieties with unique flavors; costs $3.89/kit
Lunch kit
Chicken &
Cheese
Ham & Cheese
Black Bean & Cheese
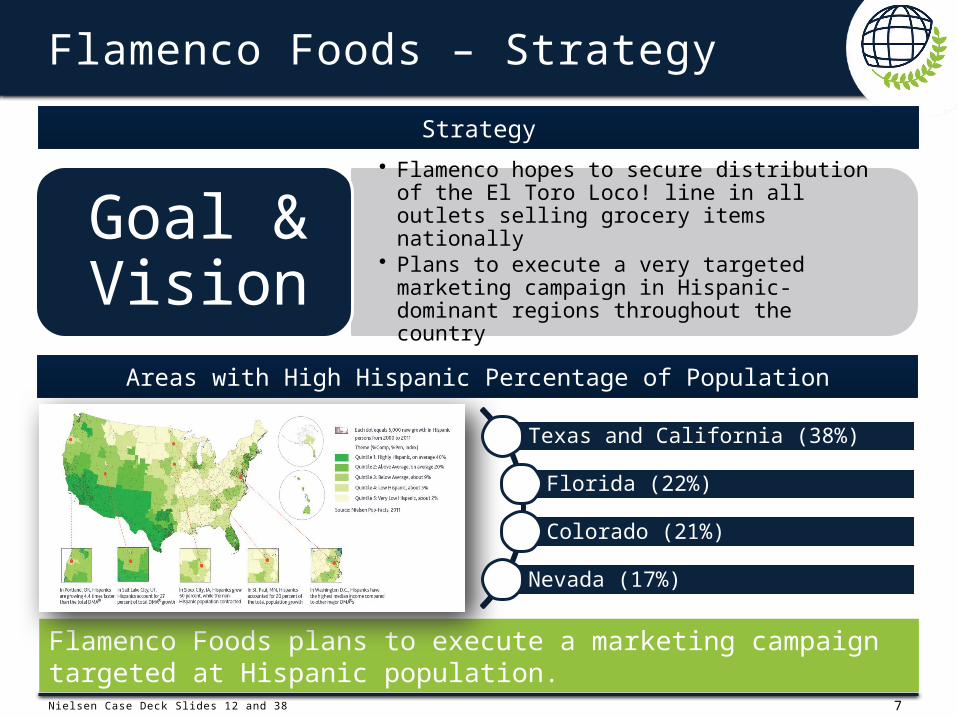
7Nielsen Case Deck Slides 12 and 38
Flamenco Foods – Strategy
Strategy
Flamenco Foods plans to execute a marketing campaign targeted at Hispanic population.
Texas and California (38%)
Florida (22%)
Colorado (21%)
Nevada (17%)
Areas with High Hispanic Percentage of Population
• Flamenco hopes to secure distribution of the El Toro Loco! line in all outlets selling grocery items nationally
• Plans to execute a very targeted marketing campaign in Hispanic-dominant regions throughout the country
Goal & Vision

8
MARKET ANALYSIS
9
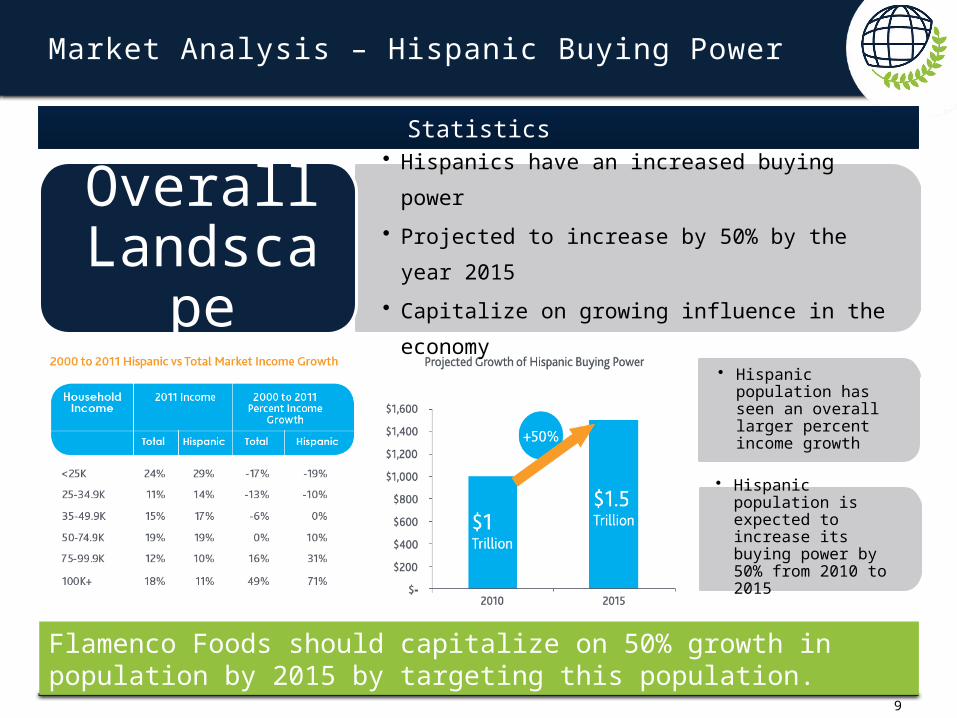
Market Analysis – Hispanic Buying Power
• Hispanics have an increased buying power
• Projected to increase by 50% by the year
2015
• Capitalize on growing influence in the
economy
Overall Landscap
e
Statistics
Flamenco Foods should capitalize on 50% growth in population by 2015 by targeting this population.
• Hispanic population has seen an overall larger percent income growth
• Hispanic population is expected to increase its buying power by 50% from 2010 to 2015
10
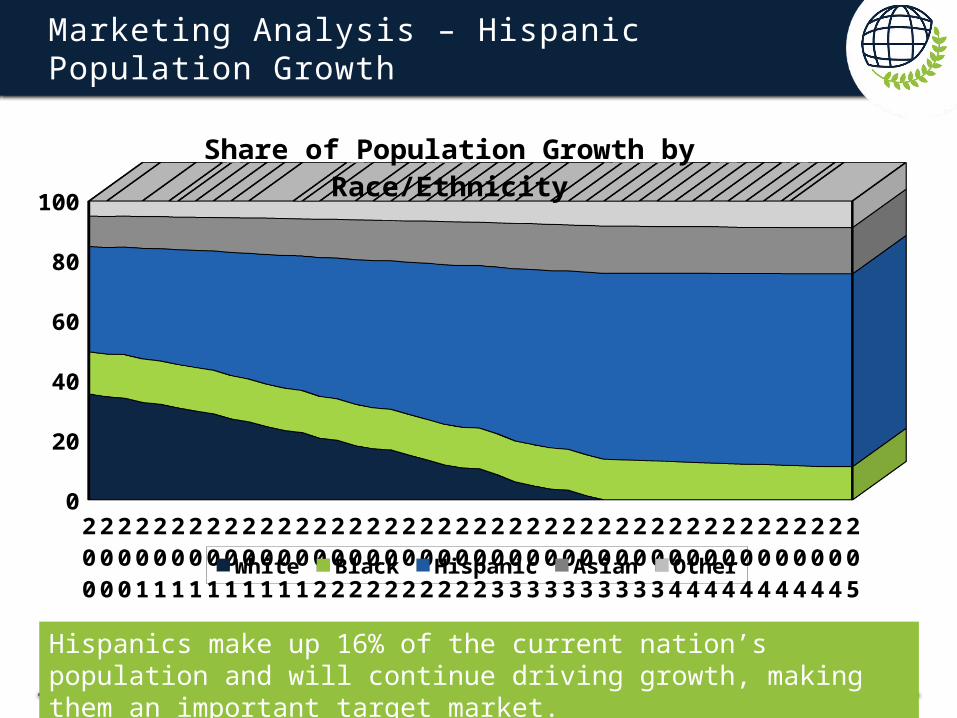
Marketing Analysis – Hispanic Population Growth
2007
2008
2009
2010
2011
2012
2013
2014
2015
2016
2017
2018
2019
2020
2021
2022
2023
2024
2025
2026
2027
2028
2029
2030
2031
2032
2033
2034
2035
2036
2037
2038
2039
2040
2041
2042
2043
2044
2045
2046
2047
2048
2049
2050
0102030405060708090
100
Share of Population Growth by Race/Ethnicity
White Black Hispanic Asian Other
Hispanics make up 16% of the current nation’s population and will continue driving growth, making them an important target market.
11
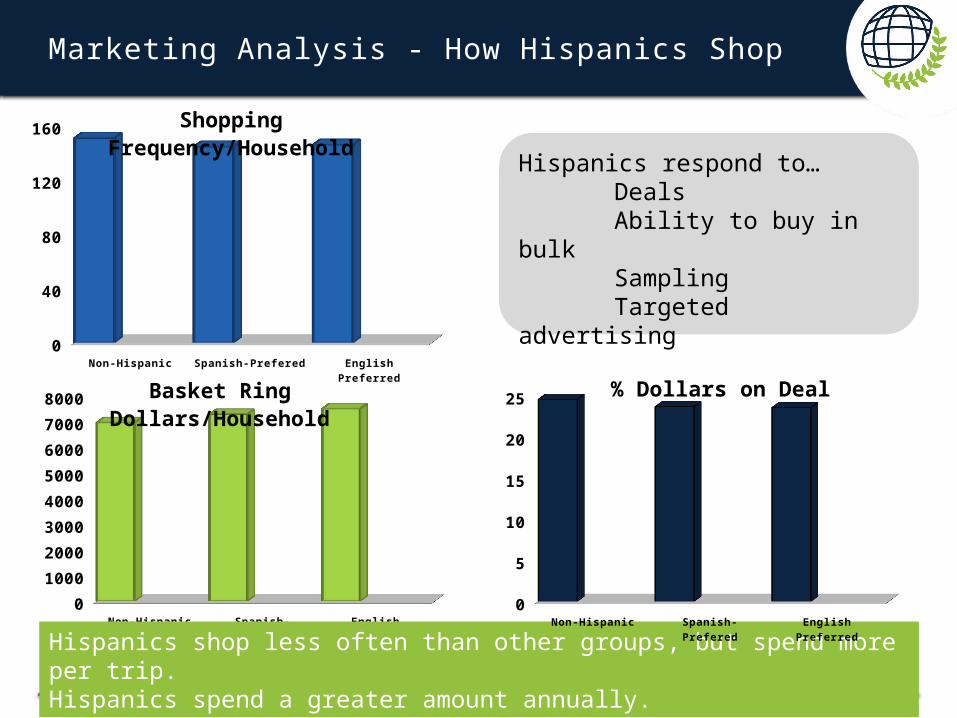
Marketing Analysis - How Hispanics Shop
Hispanics respond to…DealsAbility to buy
in bulkSamplingTargeted
advertisingNon-Hispanic Spanish-Prefered English Preferred
0
40
80
120
160Shopping Frequency/Household
Non-Hispanic Spanish-Prefered English Preferred0
1000
2000
3000
4000
5000
6000
7000
8000Basket Ring Dollars/Household
Hispanics shop less often than other groups, but spend more per trip.Hispanics spend a greater amount annually.
Non-Hispanic Spanish-Prefered English Preferred0
5
10
15
20
25% Dollars on Deal
12
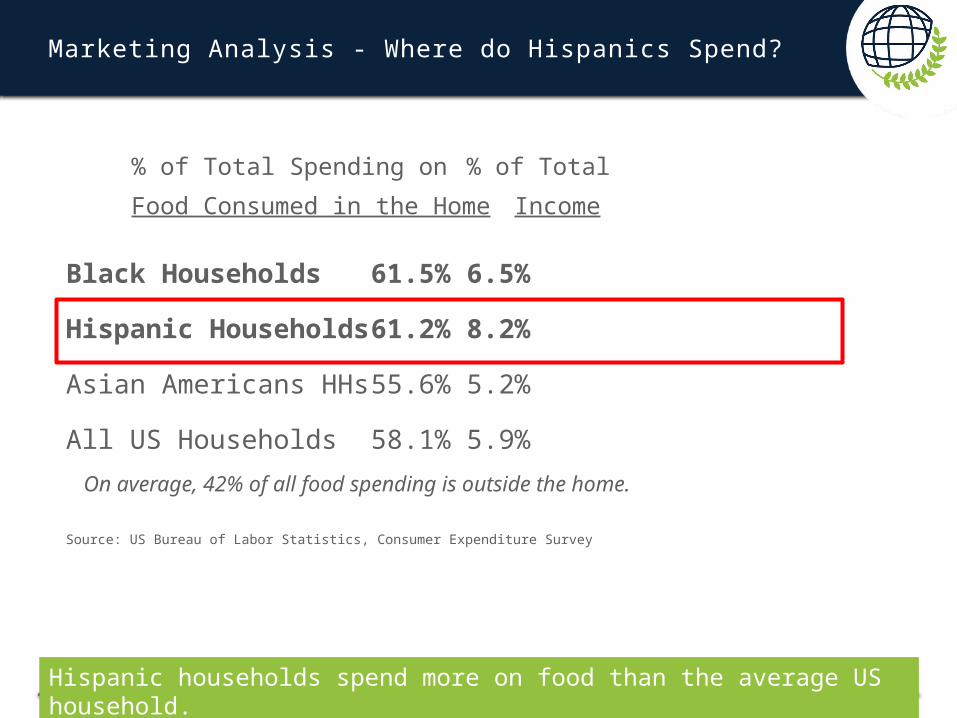
Marketing Analysis - Where do Hispanics Spend?
% of Total Spending on % of Total
Food Consumed in the Home Income
Black Households 61.5%6.5%
Hispanic Households 61.2%8.2%
Asian Americans HHs 55.6% 5.2%
All US Households 58.1% 5.9%
On average, 42% of all food spending is outside the home.
Source: US Bureau of Labor Statistics, Consumer Expenditure Survey
Hispanic households spend more on food than the average US household.
13
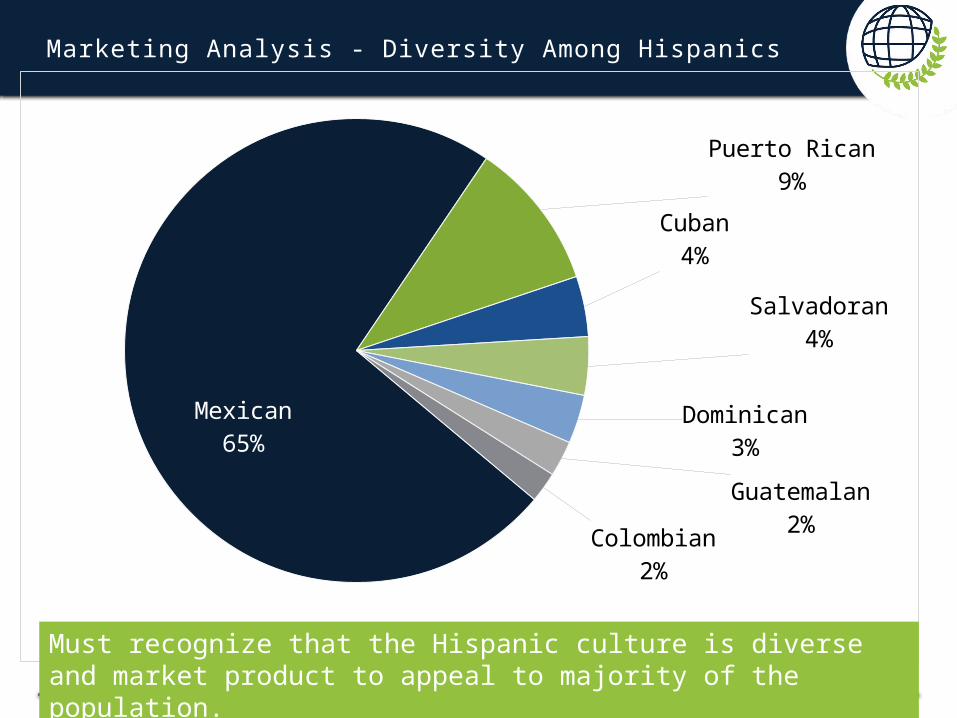
Marketing Analysis - Diversity Among Hispanics
Mexican65%
Puerto Rican9%
Cuban4%
Salvadoran4%
Dominican3%
Guatemalan2%
Colombian2%
Must recognize that the Hispanic culture is diverse and market product to appeal to majority of the population.
14Marketing Kerin, Hanglin Li
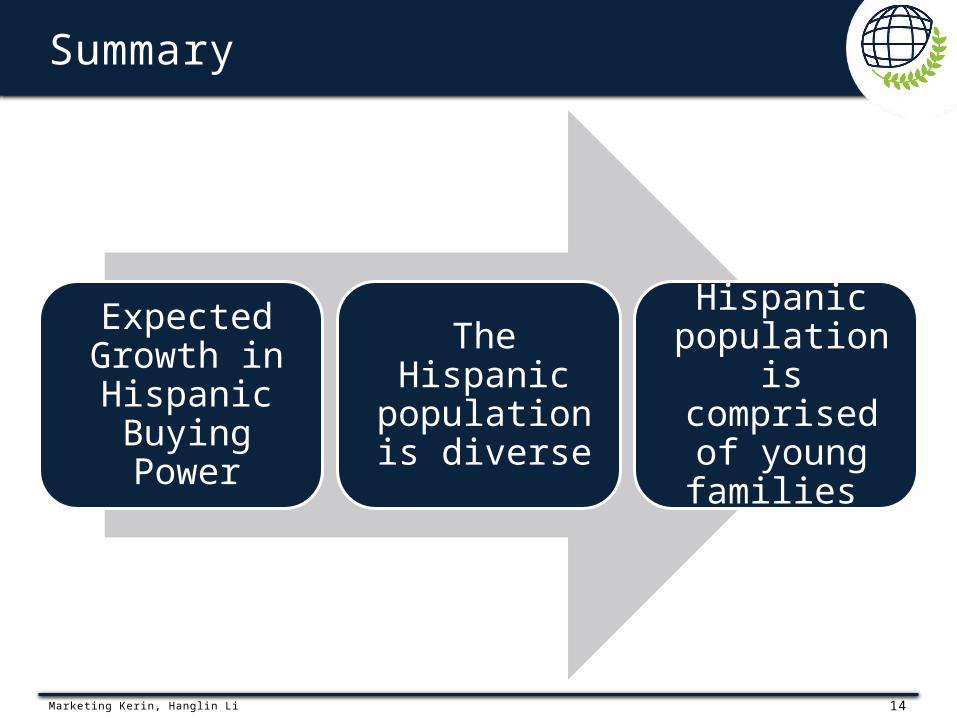
Summary
Expected Growth in Hispanic Buying Power
The Hispanic population is
diverse
Hispanic population is comprised of
young families

15
INITIAL DECISION
16
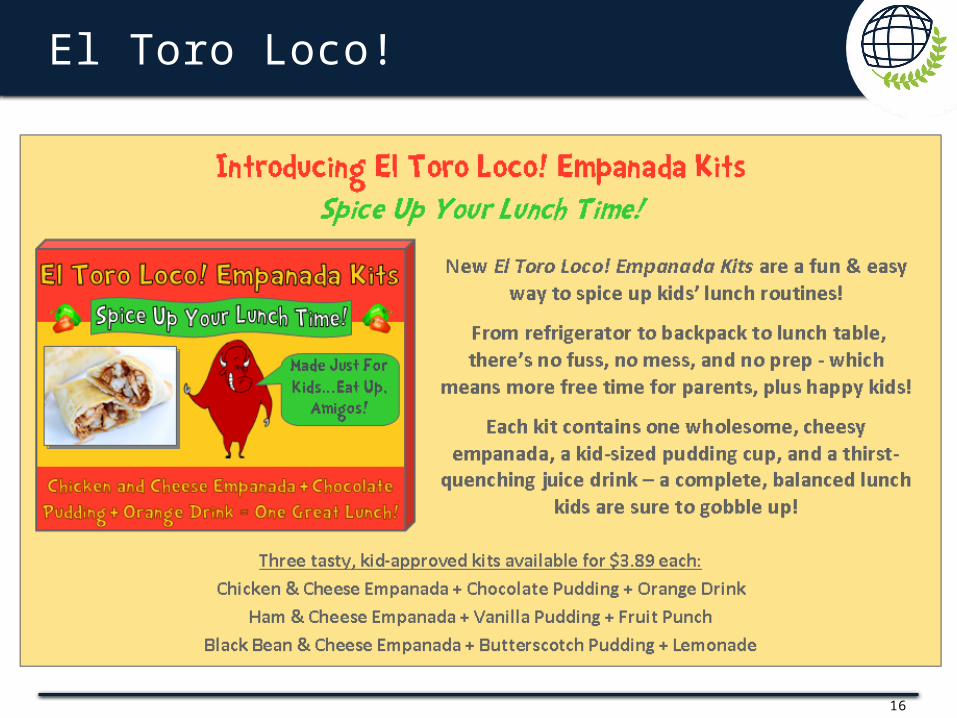
El Toro Loco!
17
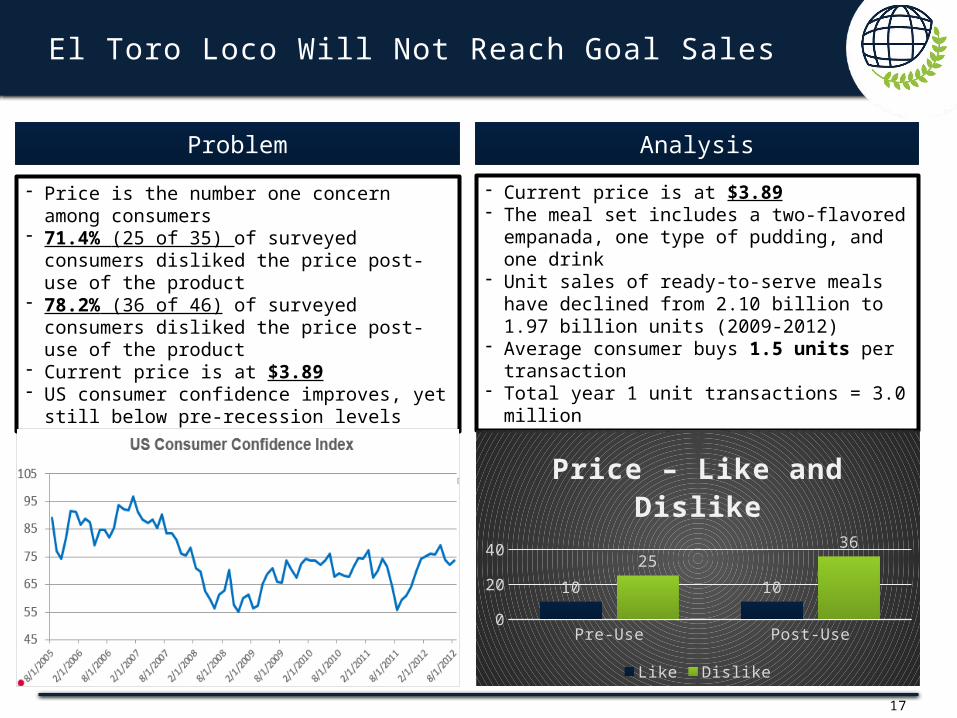
El Toro Loco Will Not Reach Goal Sales
- Price is the number one concern among consumers
- 71.4% (25 of 35) of surveyed consumers disliked the price post-use of the product
- 78.2% (36 of 46) of surveyed consumers disliked the price post-use of the product
- Current price is at $3.89- US consumer confidence improves, yet still
below pre-recession levels
Problem Analysis
- Current price is at $3.89- The meal set includes a two-flavored
empanada, one type of pudding, and one drink
- Unit sales of ready-to-serve meals have declined from 2.10 billion to 1.97 billion units (2009-2012)
- Average consumer buys 1.5 units per transaction
- Total year 1 unit transactions = 3.0 million
Pre-Use Post-Use0
10203040
10 10
25
36
Price – Like and Dislike
Like Dislike

18
RECOMMENDATIONS

19
PRODUCT ALTERATIONS
20Nielsen Case Deck Slides
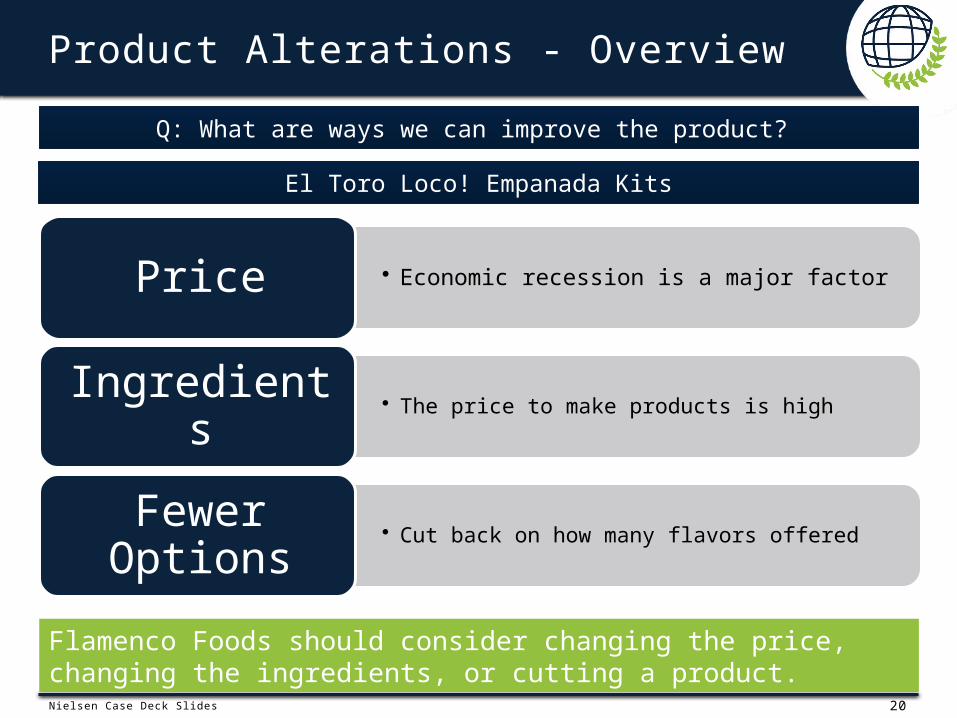
Product Alterations - Overview
Q: What are ways we can improve the product?
El Toro Loco! Empanada Kits
• Economic recession is a major factorPrice
• The price to make products is highIngredients
• Cut back on how many flavors offeredFewer
Options
Flamenco Foods should consider changing the price, changing the ingredients, or cutting a product.
21Nielsen Case Deck Slides 32 ,33, and 34 School Nutrition Association, http://www.nbcnews.com/business/economy/meat-prices-expected-keep-climbing-2015-n276906
Product Alterations - El Toro Loco Proposals
Product Improvement
Analysis Problem
Price is a major concern.Current economic situation appears unfavorable.
• Families resort to cooking for basic needs
In tough times…
• US consumer confidence rates are still below pre-recession rates
Price is number one concern
• Driving consumers to make trade-offs or buy less
Current economic situation
8/1/
2005
8/1/
2006
8/1/
2007
8/1/
2008
8/1/
2009
8/1/
2010
8/1/
2011
8/1/
2012
45
65
85
105
School Lunche
s
• The average price of a school lunch meal is $2.70 and $3.10
• Lunch kit currently costs $3.89
22Nielsen Case Deck Slides 52 and 55, http://www.bls.gov/regions/mid-atlantic/data/AverageRetailFoodAndEnergyPrices_USandMidwest_Table.htm
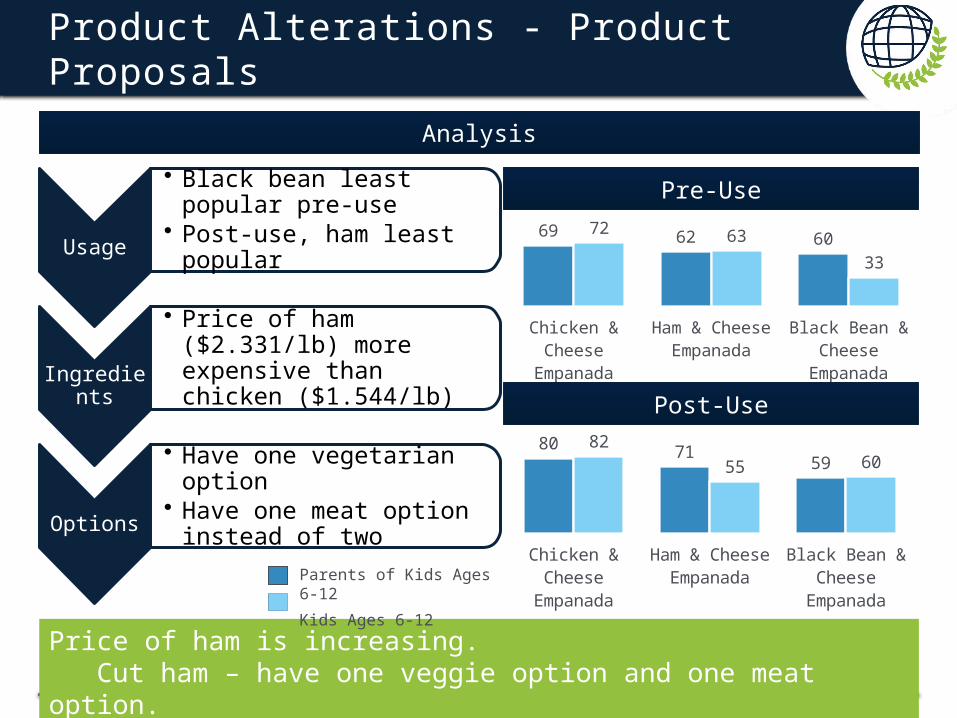
Product Alterations - Product Proposals
Analysis
Price of ham is increasing.Cut ham – have one veggie option and one meat option.
Usage
• Black bean least popular pre-use
• Post-use, ham least popular
Ingredients
• Price of ham ($2.331/lb) more expensive than chicken ($1.544/lb)
Options
• Have one vegetarian option
• Have one meat option instead of two
Chicken & Cheese
Empanada
Ham & Cheese Empanada
Black Bean & Cheese Em-
panada
80 7159
82
55 60
Chicken & Cheese
Empanada
Ham & Cheese Empanada
Black Bean & Cheese Em-
panada
69 62 6072 63
33
Pre-Use
Post-Use
Parents of Kids Ages 6-12
Kids Ages 6-12

23
BRANDING
24http://academic.mintel.com.proxy.library.nd.edu/display/708453/?highlight#hit1
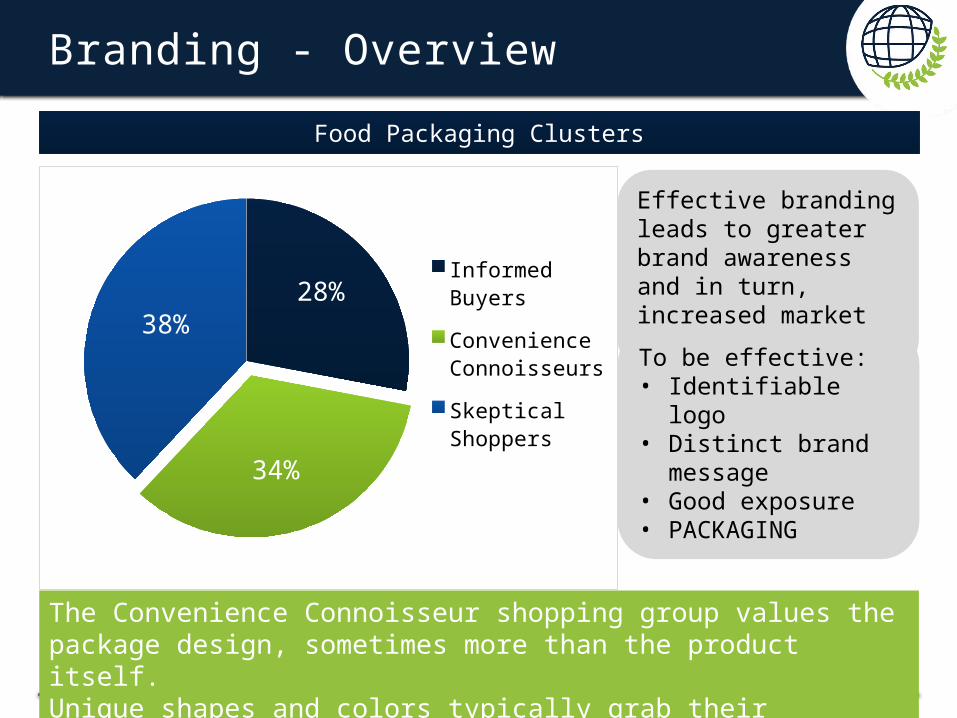
Branding - Overview
Effective branding leads to greater brand awareness and in turn, increased market share.
To be effective:• Identifiable logo • Distinct brand
message• Good exposure• PACKAGING
28%
34%
38%
Informed Buyers
Convenience Connoisseurs
Skeptical Shoppers
Food Packaging Clusters
The Convenience Connoisseur shopping group values the package design, sometimes more than the product itself. Unique shapes and colors typically grab their attention.
25http://academic.mintel.com.proxy.library.nd.edu/display/708450/
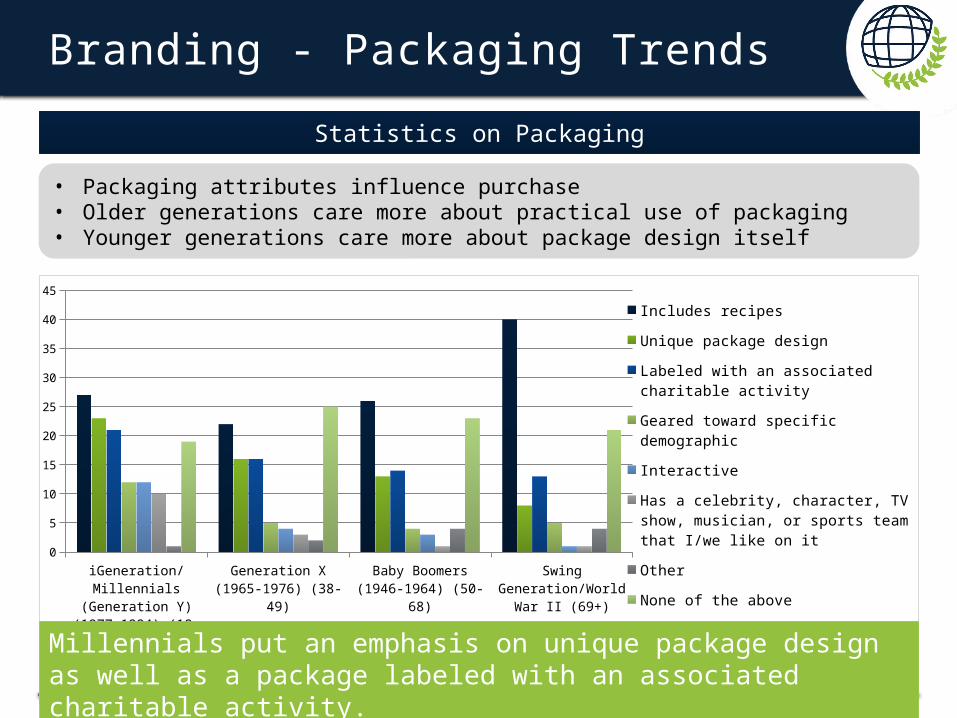
Branding - Packaging Trends
• Packaging attributes influence purchase• Older generations care more about practical use of packaging• Younger generations care more about package design itself
iGeneration/Millen-nials (Generation Y) (1977-1994) (18-37)
Generation X (1965-1976) (38-49)
Baby Boomers (1946-1964) (50-68)
Swing Generation/World
War II (69+)
0
5
10
15
20
25
30
35
40
45
Includes recipes
Unique package design
Labeled with an associated chari-table activity
Geared toward specific de-mographic
Interactive
Has a celebrity, character, TV show, musician, or sports team that I/we like on it
Other
None of the above
Statistics on Packaging
Millennials put an emphasis on unique package design as well as a package labeled with an associated charitable activity.
26Nielsen Case Deck Slides
Branding – Use Family and Cultural Ties
Q: What are ways we can increase the potential success of Flamenco Foods?
Family Culture
• A child’s interest in an item impacts the likelihood of buying product
Children
• Wants to appease child’s desires; make family happy
Parents
• Easy for families on the go; requires minimal preparation
Utility
Flamenco Foods should consider the importance of family and culture to succeed in the market.
• Hispanics will be #1 contributor to US population growth
Growth
• Spending power has increased from $1 trillion to $1.5 trillion
Money
• No Hispanic-styled lunch in current market; little competition
Niche
27http://academic.mintel.com.proxy.library.nd.edu/display/696017/?highlight
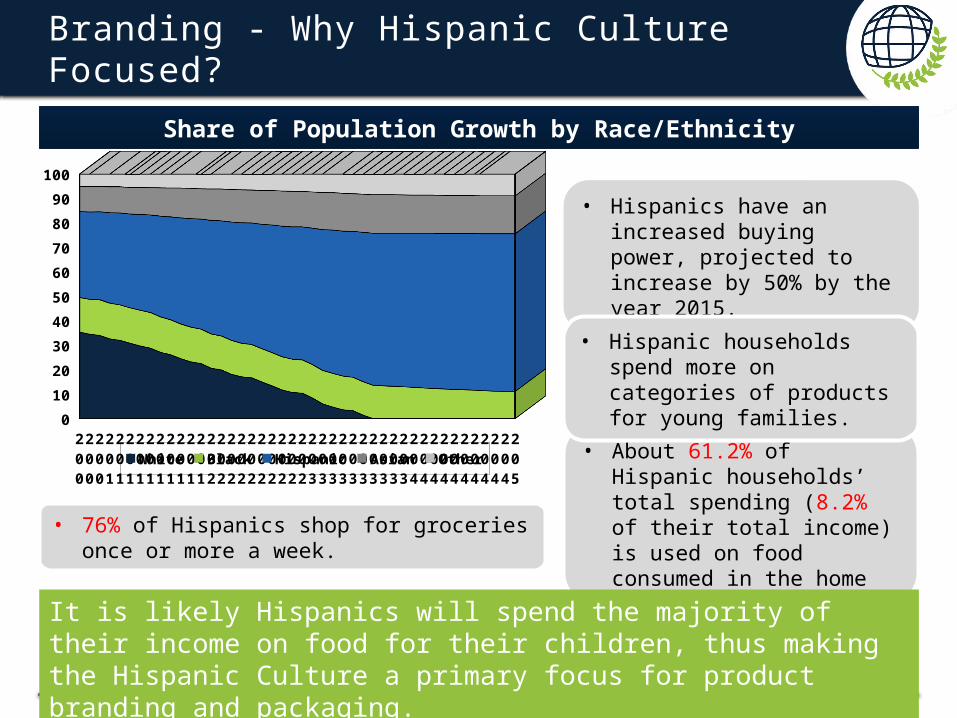
Branding - Why Hispanic Culture Focused?
2007
2008
2009
2010
2011
2012
2013
2014
2015
2016
2017
2018
2019
2020
2021
2022
2023
2024
2025
2026
2027
2028
2029
2030
2031
2032
2033
2034
2035
2036
2037
2038
2039
2040
2041
2042
2043
2044
2045
2046
2047
2048
2049
2050
0
10
20
30
40
50
60
70
80
90
100
White Black Hispanic Asian Other
• Hispanics have an increased buying power, projected to increase by 50% by the year 2015.
• About 61.2% of Hispanic households’ total spending (8.2% of their total income) is used on food consumed in the home
• Hispanic households spend more on categories of products for young families.
Share of Population Growth by Race/Ethnicity
• 76% of Hispanics shop for groceries once or more a week.
It is likely Hispanics will spend the majority of their income on food for their children, thus making the Hispanic Culture a primary focus for product branding and packaging.
28http://academic.mintel.com.proxy.library.nd.edu/display/715814/?highlight
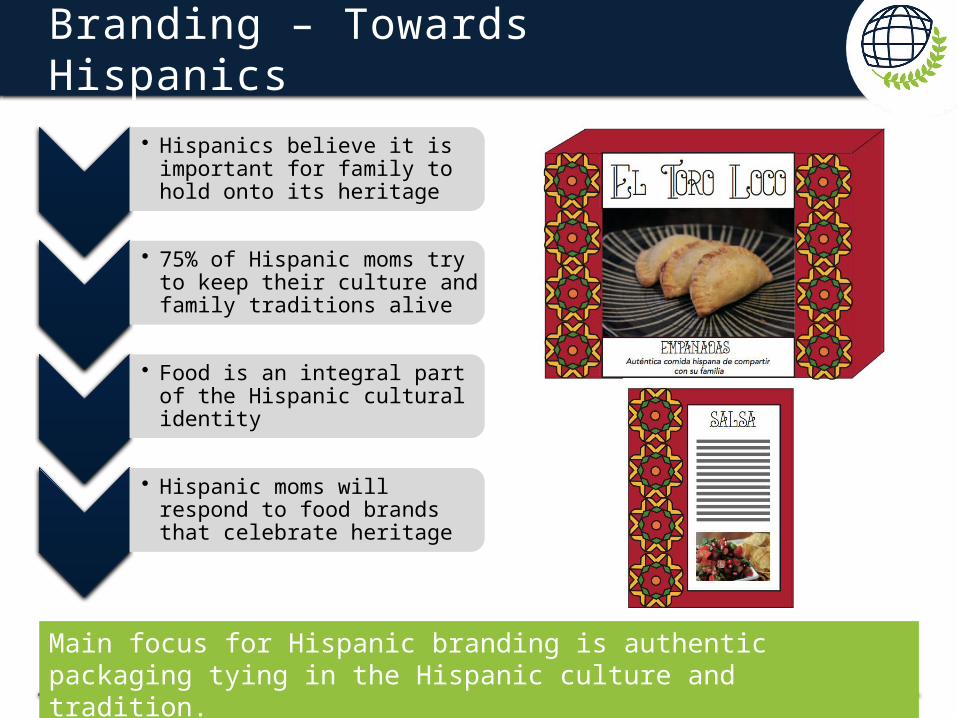
Branding – Towards Hispanics
Main focus for Hispanic branding is authentic packaging tying in the Hispanic culture and tradition.
• Hispanics believe it is important for family to hold onto its heritage
• 75% of Hispanic moms try to keep their culture and family traditions alive
• Food is an integral part of the Hispanic cultural identity
• Hispanic moms will respond to food brands that celebrate heritage
29http://academic.mintel.com.proxy.library.nd.edu/display/583043/
Branding - Why Child Focused?
0
10
20
30
40
50
60
70
80
90
100
Likely %
Not likely %
My kid never asks me for this %
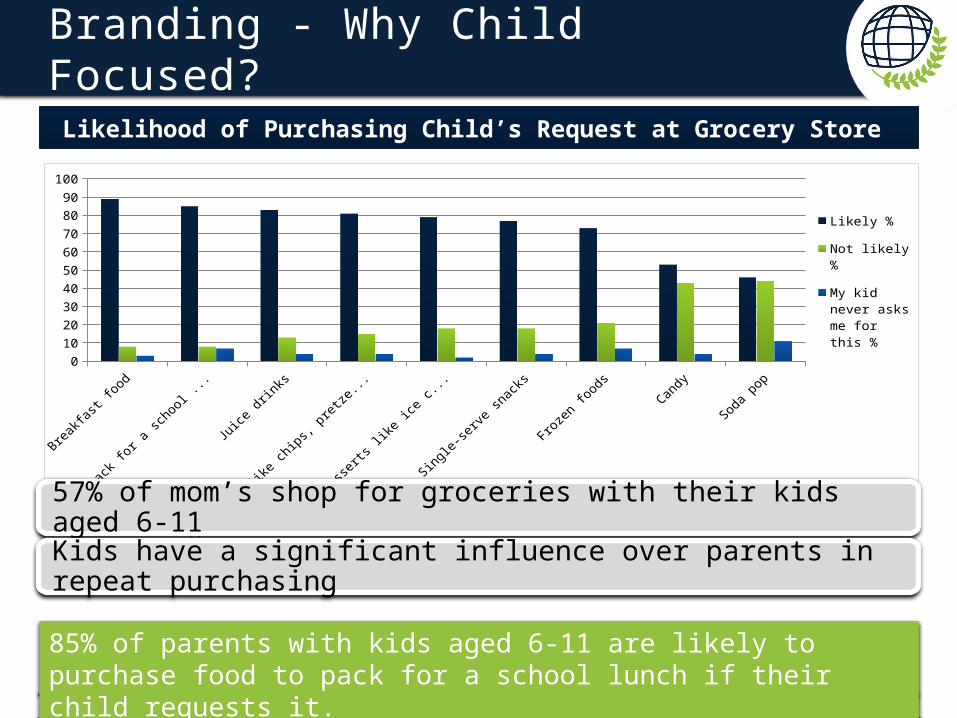
85% of parents with kids aged 6-11 are likely to purchase food to pack for a school lunch if their child requests it.
Likelihood of Purchasing Child’s Request at Grocery Store
57% of mom’s shop for groceries with their kids aged 6-11
Kids have a significant influence over parents in repeat purchasing
30http://academic.mintel.com.proxy.library.nd.edu/display/703659/?highlight#hit1
Branding - Towards Children
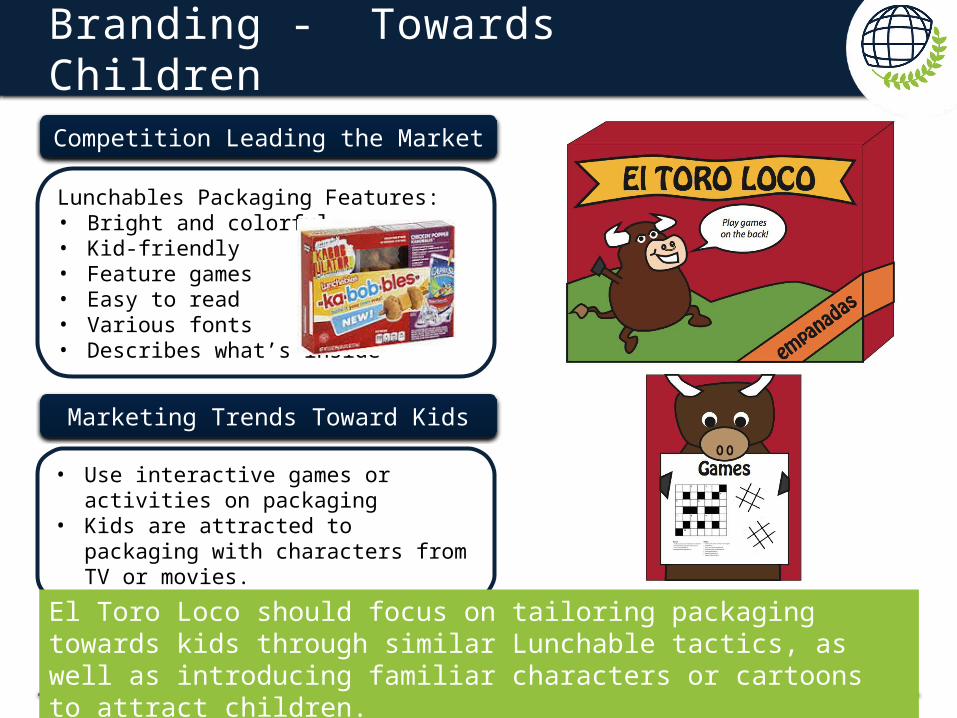
Competition Leading the Market
Lunchables Packaging Features:• Bright and colorful• Kid-friendly• Feature games• Easy to read• Various fonts • Describes what’s inside
• Use interactive games or activities on packaging
• Kids are attracted to packaging with characters from TV or movies.
Marketing Trends Toward Kids
El Toro Loco should focus on tailoring packaging towards kids through similar Lunchable tactics, as well as introducing familiar characters or cartoons to attract children.
31Nielsen Case Deck Slide
Branding - Summary
Family and Culture Important for Flamenco Foods
Family
• Child’s interest is paramount in purchase decision
• Parents need quality and convenience• If these benefits are met, they are willing to
buy what their children desire
Culture
• Hispanics will drive US’s population growth; currently, 16% are Hispanic citizens
• Buying power increasing from $1 trillion (2010) to $1.5 trillion (2015)

32
RETAIL
33http://www.dailyyonder.com/rural-america-2000s-population/2010/07/12/2834
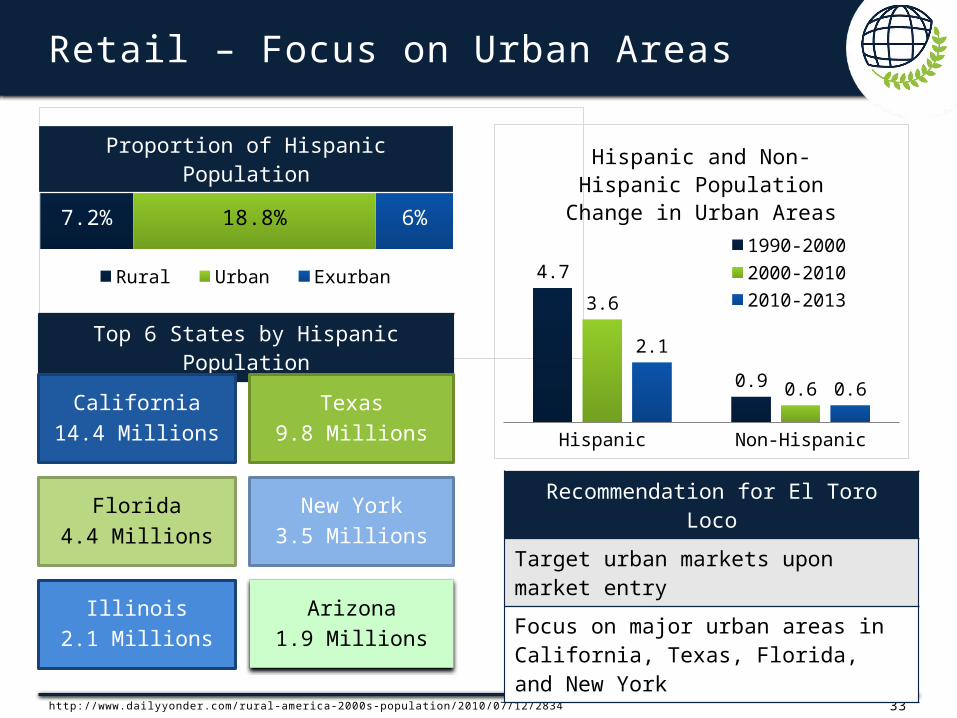
Retail – Focus on Urban Areas
7.2% 18.8% 6%
Rural Urban Exurban
Top 6 States by Hispanic Population
Proportion of Hispanic Population
California14.4 Millions
Texas9.8 Millions
Florida4.4 Millions
New York3.5 Millions
Illinois2.1 Millions
Arizona1.9 Millions
Recommendation for El Toro Loco
Target urban markets upon market entry
Focus on major urban areas in California, Texas, Florida, and New York
Hispanic Non-Hispanic
4.7
0.9
3.6
0.6
2.1
0.6
Hispanic and Non-Hispanic Population Change in Urban
Areas
1990-2000
Source: Nielsen Homescan AND US Census Bureau Population Projections
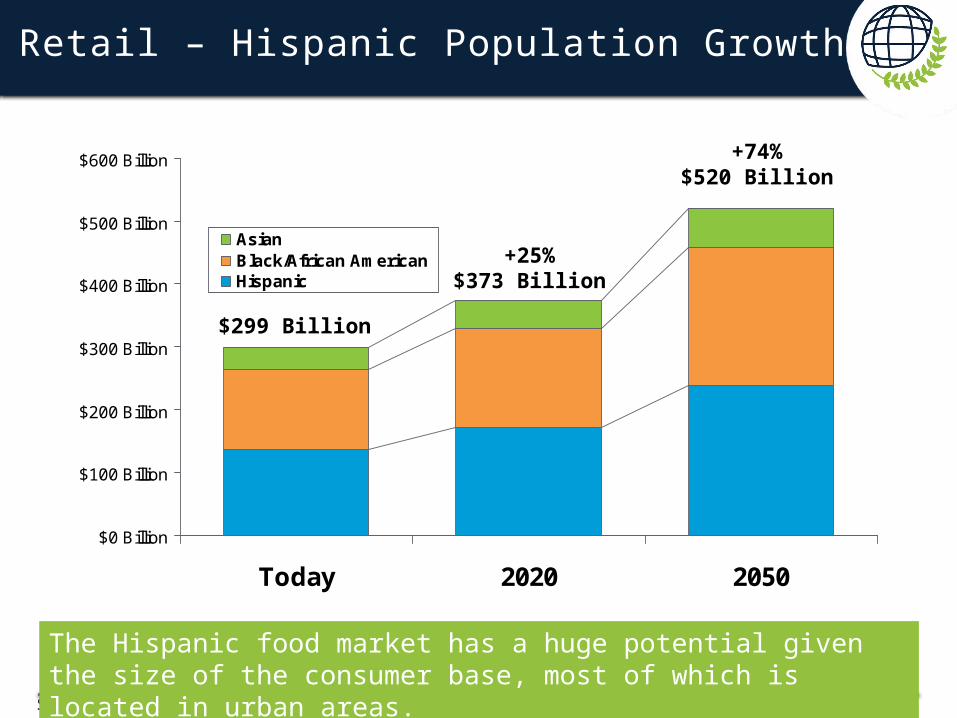
$0 Billion
$100 Billion
$200 Billion
$300 Billion
$400 Billion
$500 Billion
$600 Billion
Today 2020 2050
AsianBlack/African AmericanHispanic
$299 Billion
+25%$373 Billion
+74%$520 Billion
Retail – Hispanic Population Growth
The Hispanic food market has a huge potential given the size of the consumer base, most of which is located in urban areas.
35
Huge Increase in
Multicultural Ad Spending
AHAA Marketer of
the Year
Leader in Targeting
Latino Consumers
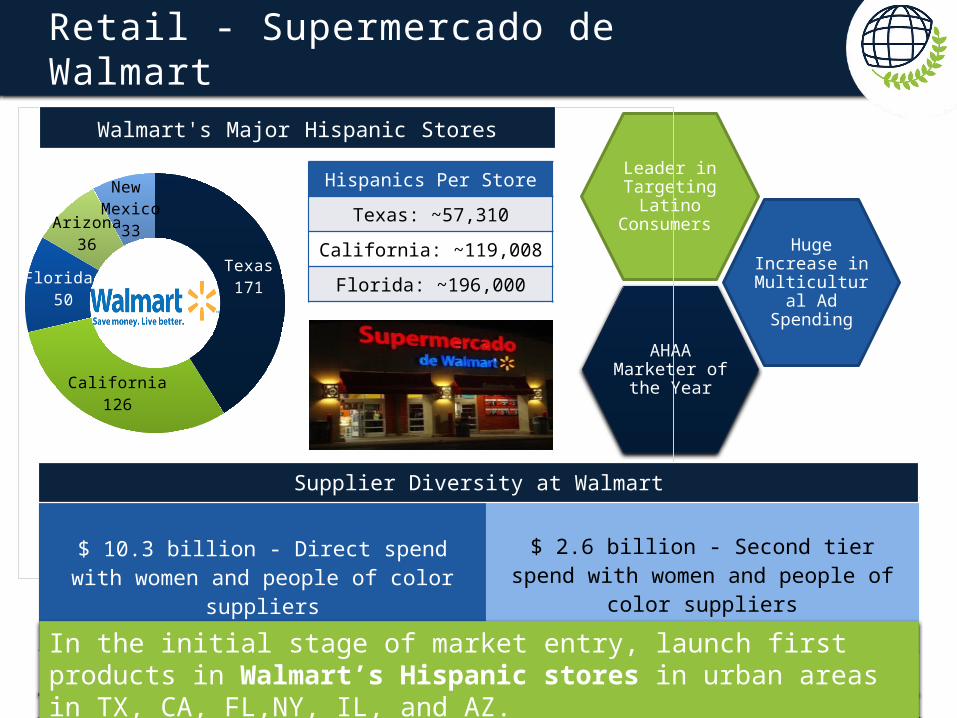
Retail - Supermercado de Walmart
Texas171
California126
Florida 50
Arizona36
New Mexico
33
Walmart's Major Hispanic Stores
$ 10.3 billion - Direct spend with women and people of color suppliers
$ 2.6 billion - Second tier spend with women and people of color suppliers
Hispanics Per Store
Texas: ~57,310
California: ~119,008
Florida: ~196,000
Supplier Diversity at Walmart
In the initial stage of market entry, launch first products in Walmart’s Hispanic stores in urban areas in TX, CA, FL,NY, IL, and AZ.
36
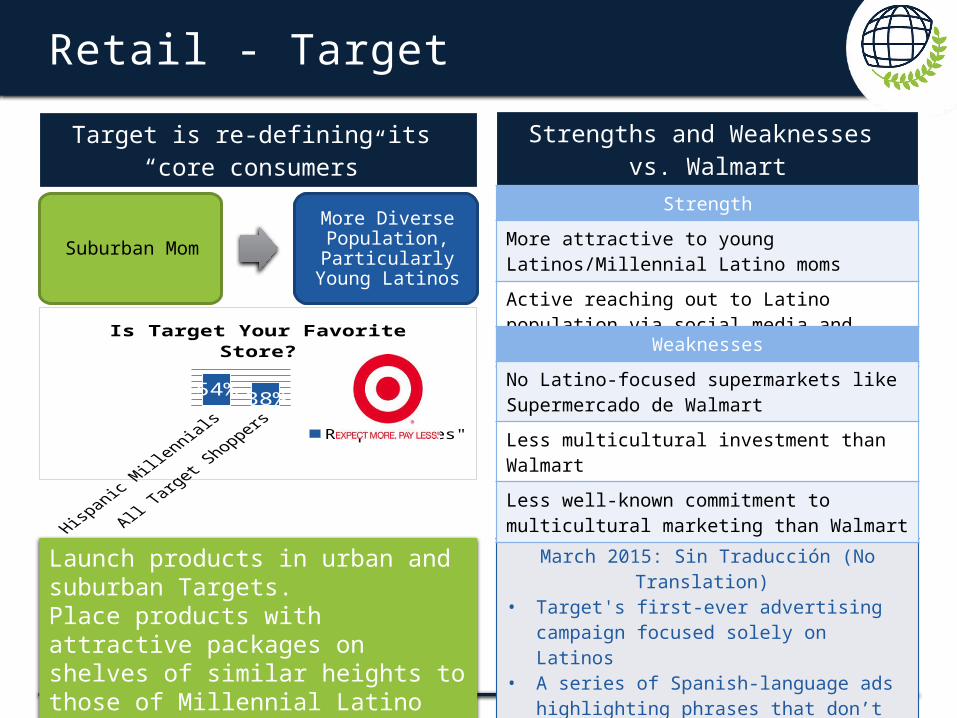
Retail - Target
54% 38%
Is Target Your Favorite Store?
Respond "Yes"
Target is re-defining its “core consumers”
Suburban Mom
More Diverse Population, Particularly
Young Latinos
March 2015: Sin Traducción (No Translation)
• Target's first-ever advertising campaign focused solely on Latinos
• A series of Spanish-language ads highlighting phrases that don’t have an English equivalent
Strengths and Weaknesses vs. Walmart
Strength
More attractive to young Latinos/Millennial Latino moms
Active reaching out to Latino population via social media and Spanish-language ads
Weaknesses
No Latino-focused supermarkets like Supermercado de Walmart
Less multicultural investment than Walmart
Less well-known commitment to multicultural marketing than Walmart
Launch products in urban and suburban Targets. Place products with attractive packages on shelves of similar heights to those of Millennial Latino moms.
37
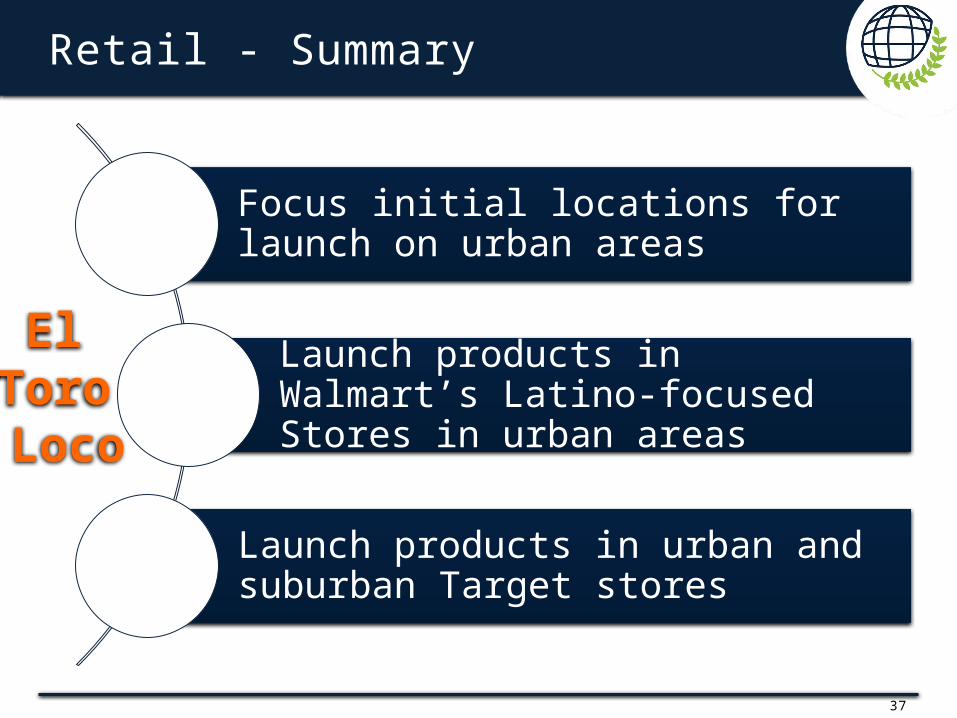
Retail - Summary
Focus initial locations for launch on urban areas
Launch products in Walmart’s Latino-focused Stores in urban areas
Launch products in urban and suburban Target stores
El Toro Loco

38
IN STORE DISPLAYS
39Wikispace picture, Marketing Kerin 11 th edition, Hanglin Li
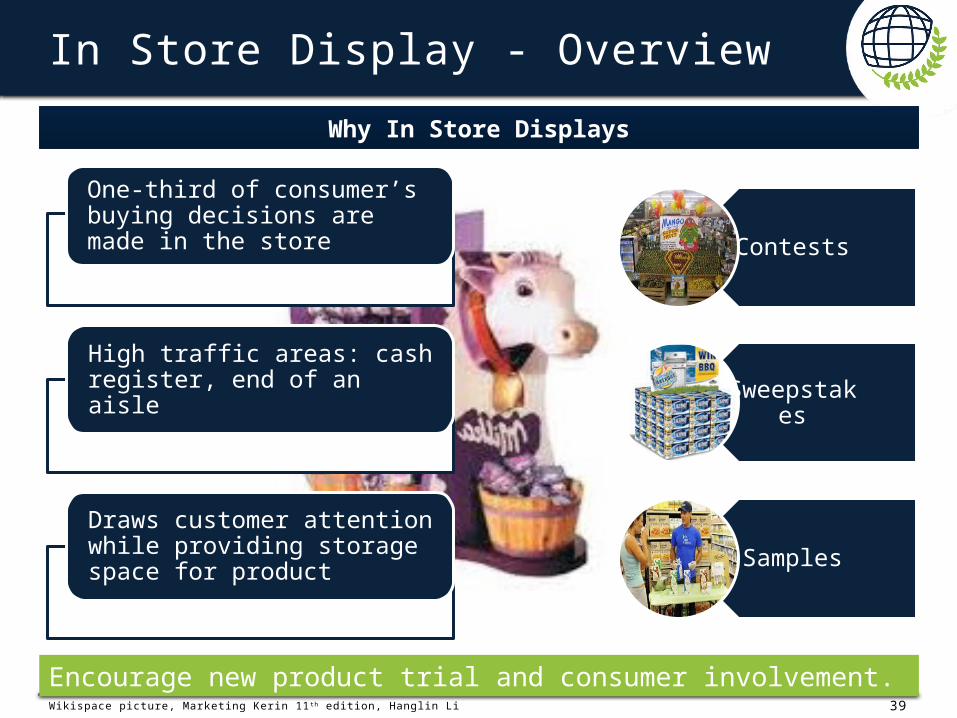
In Store Display - Overview
One-third of consumer’s buying decisions are made in the store
High traffic areas: cash register, end of an aisle
Draws customer attention while providing storage space for product
Contests
Sweepstakes
Samples
Why In Store Displays
Encourage new product trial and consumer involvement.
40Slidedeck, Hanglin Li
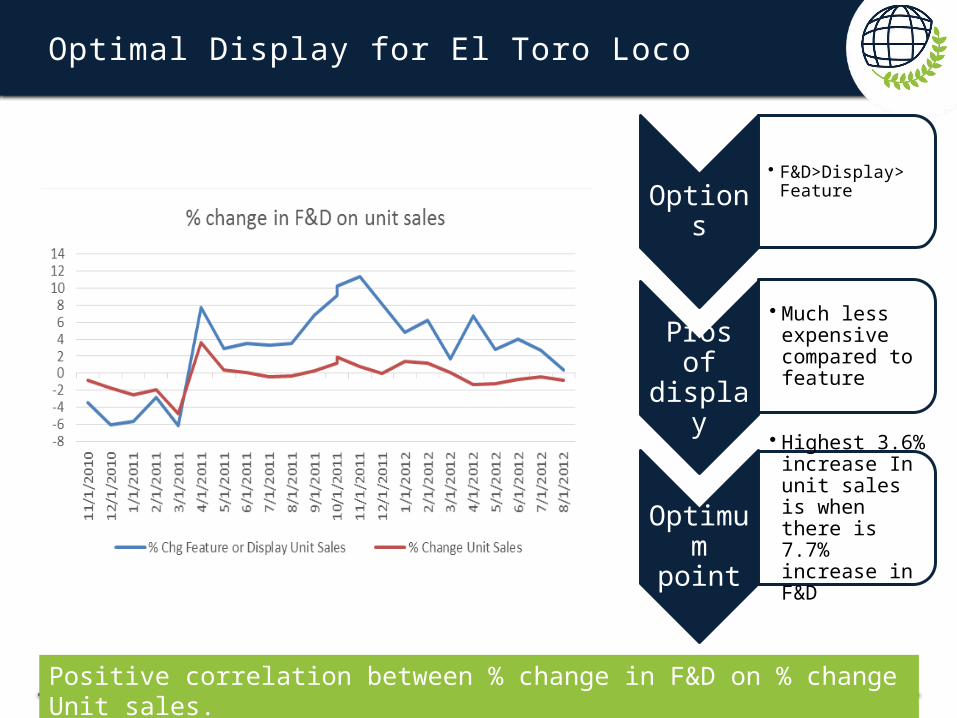
Optimal Display for El Toro Loco
Optimum
point
• Highest 3.6% increase In unit sales is when there is 7.7% increase in F&D
Options
• F&D>Display> Feature
Pros of
display
• Much less expensive compared to feature
Positive correlation between % change in F&D on % change Unit sales.
41Slidedeck, Hanglin Li
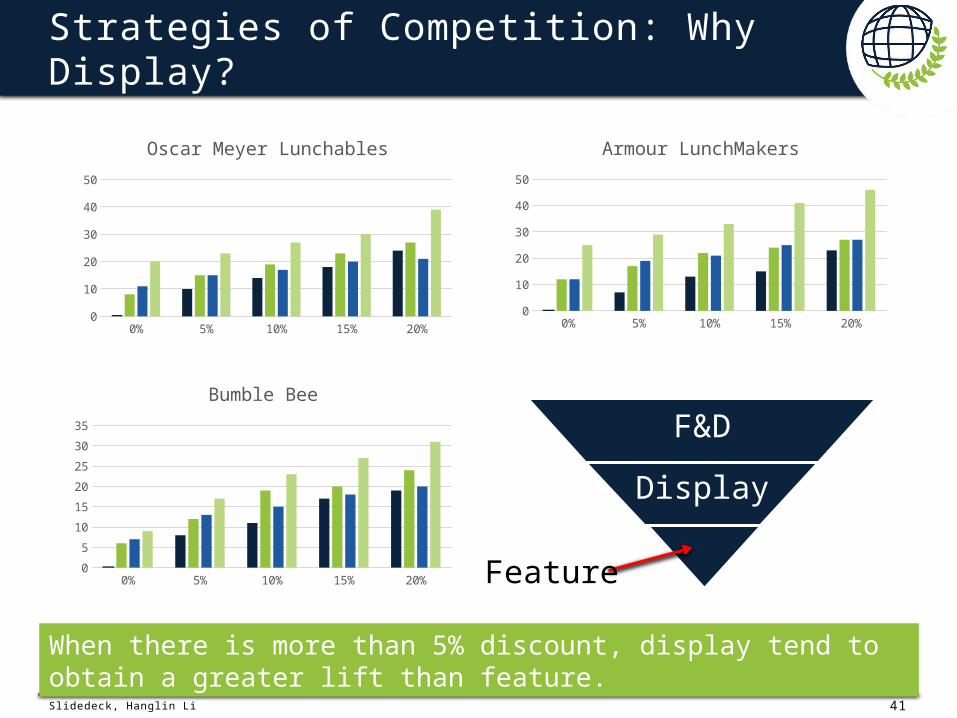
Strategies of Competition: Why Display?
0% 5% 10% 15% 20%
TPR(26.7) 0 10 14 18 24
Display(15.2) 8 15 19 23 27
Feature(12.9) 11 15 17 20 21
F&D(8.9) 20 23 27 30 39
2.5
17.5
32.5
Oscar Meyer Lunchables
0% 5% 10% 15% 20%
TPR(29.1) 0 7 13 15 23
Display(11.6) 12 17 22 24 27
Feature(7.2) 12 19 21 25 27
F&D(6.7) 25 29 33 41 46
2.517.532.547.5
Armour LunchMakers
0% 5% 10% 15% 20%
TPR(15.7) 0 8 11 17 19
Display(8.1) 6 12 19 20 24
Feature(14.7) 7 13 15 18 20
F&D(9.1) 9 17 23 27 31
2.5
12.5
22.5
32.5
Bumble Bee
F&D
Display
When there is more than 5% discount, display tend to obtain a greater lift than feature.
Feature
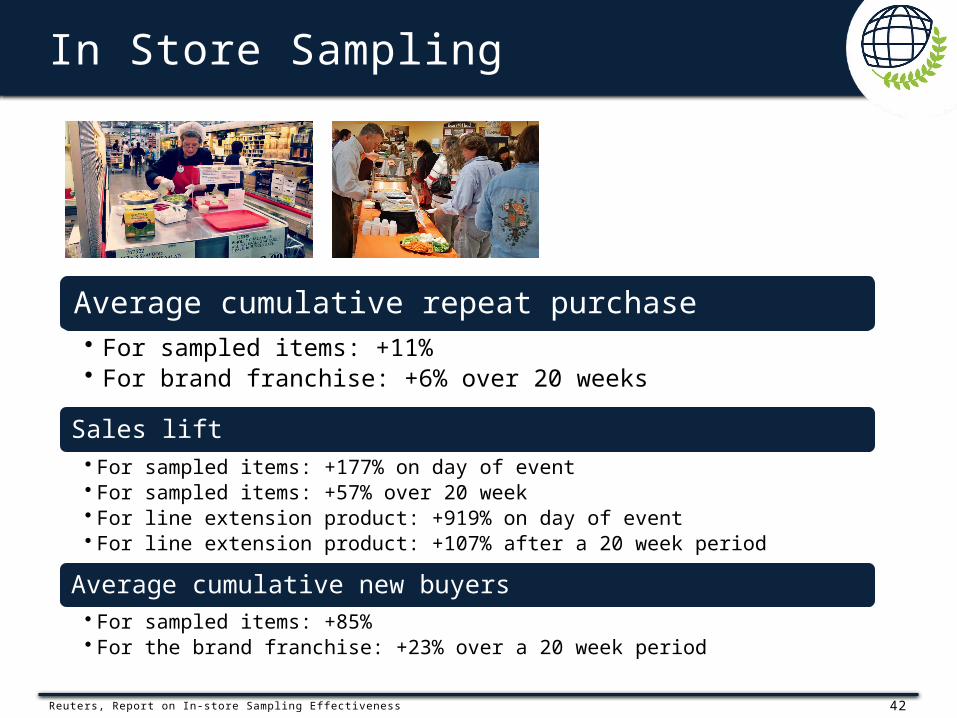
42Reuters, Report on In-store Sampling Effectiveness
In Store Sampling
Average cumulative repeat purchase• For sampled items: +11%• For brand franchise: +6% over 20 weeks
Sales lift• For sampled items: +177% on day of event• For sampled items: +57% over 20 week• For line extension product: +919% on day of event• For line extension product: +107% after a 20 week period
Average cumulative new buyers• For sampled items: +85%• For the brand franchise: +23% over a 20 week period
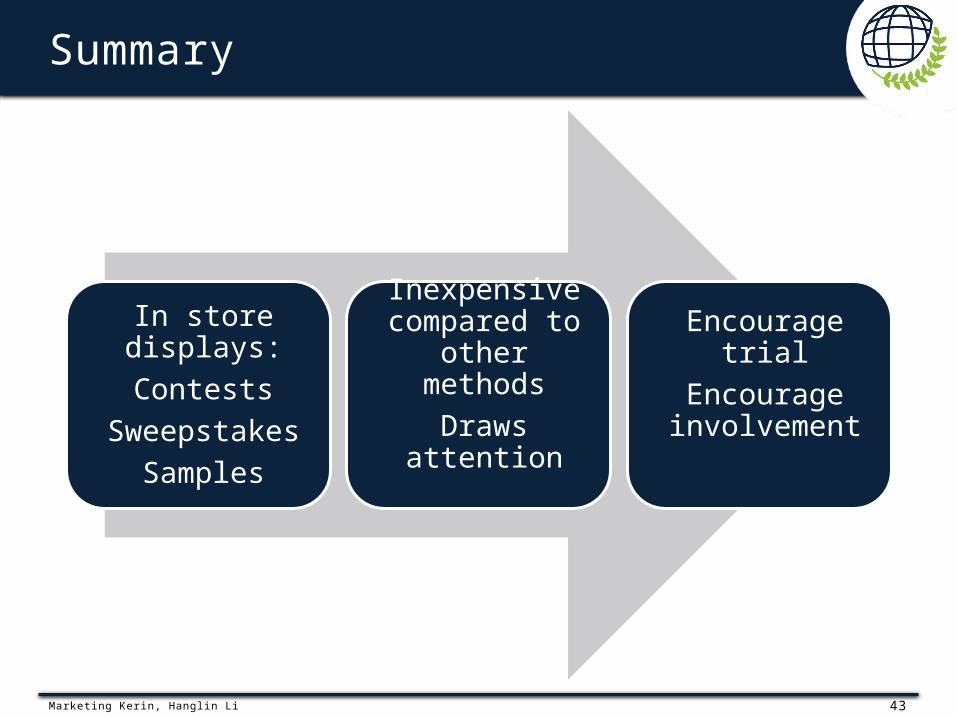
43Marketing Kerin, Hanglin Li
Summary
In store displays:Contests
SweepstakesSamples
Inexpensive compared to
other methodsDraws
attention
Encourage trialEncourage
involvement

44
FINAL DECISION
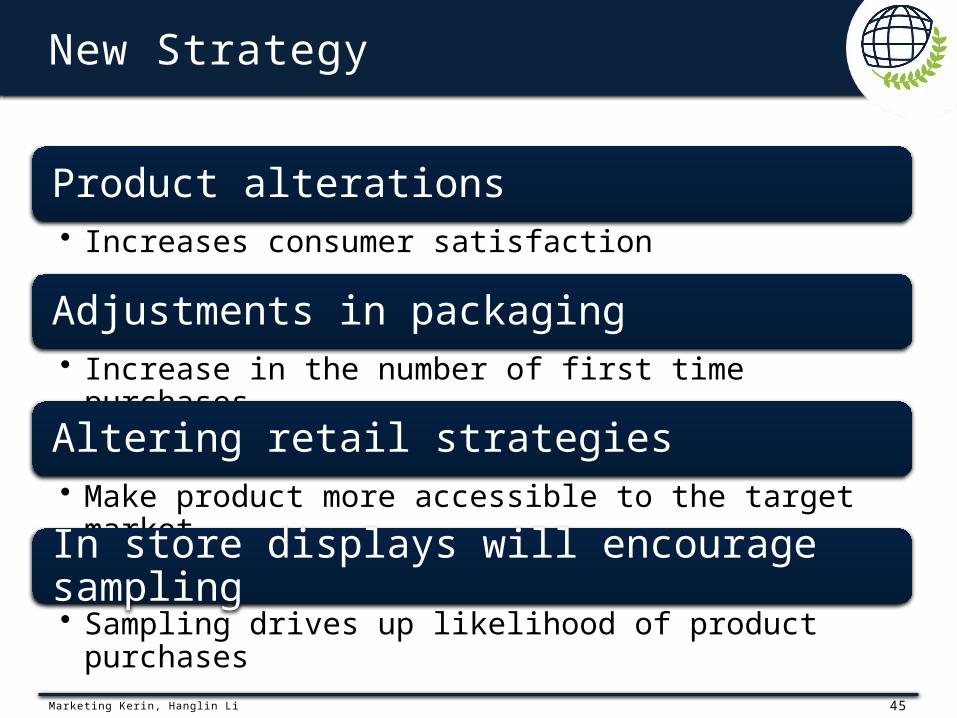
45Marketing Kerin, Hanglin Li
New Strategy
Product alterations• Increases consumer satisfaction
Adjustments in packaging• Increase in the number of first time purchases
Altering retail strategies• Make product more accessible to the target market
In store displays will encourage sampling• Sampling drives up likelihood of product purchases
46
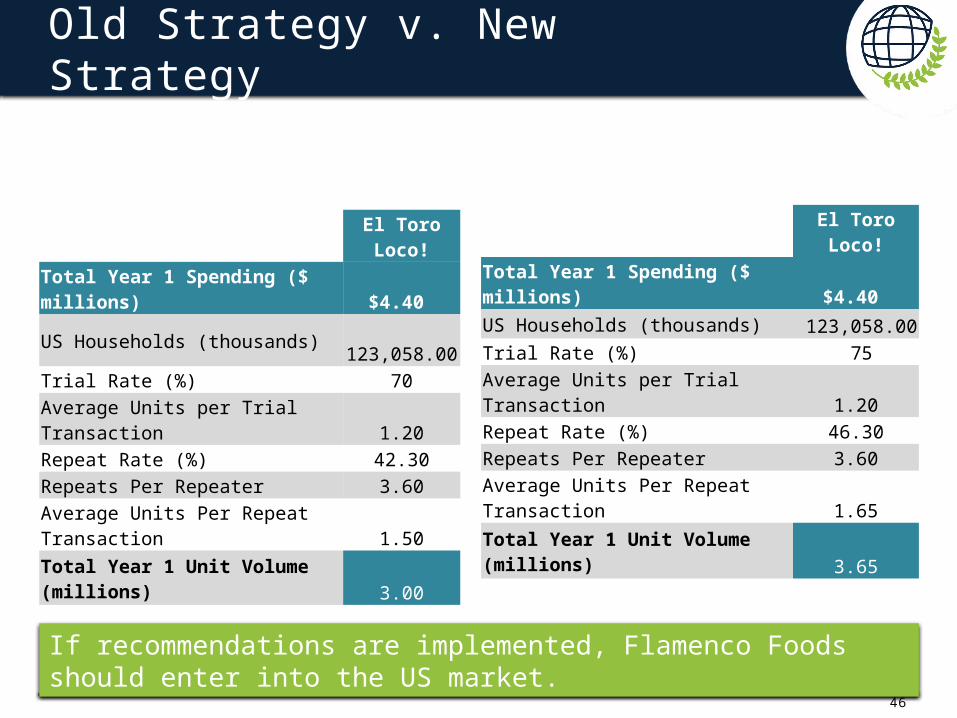
Old Strategy v. New Strategy
El Toro Loco!
Total Year 1 Spending ($ millions) $4.40 US Households (thousands) 123,058.00 Trial Rate (%) 70 Average Units per Trial Transaction 1.20 Repeat Rate (%) 42.30 Repeats Per Repeater 3.60 Average Units Per Repeat Transaction 1.50
Total Year 1 Unit Volume (millions) 3.00
El Toro Loco!
Total Year 1 Spending ($ millions) $4.40 US Households (thousands) 123,058.00 Trial Rate (%) 75Average Units per Trial Transaction 1.20 Repeat Rate (%) 46.30 Repeats Per Repeater 3.60 Average Units Per Repeat Transaction 1.65
Total Year 1 Unit Volume (millions) 3.65
If recommendations are implemented, Flamenco Foods should enter into the US market.

47
QUESTIONS?