GFZ
?"'< Enei
Jl! ^ KAHE
m 1HP CRES
GTNi
Integrated Geophysical ExplorationTechnologies for deep fractured
geothermal systems (I-GET) -Review of geophysical explorationmethods applied to deep fractured
geothermal reservoirsFinal Report
BRGM/RP-57089-FRFebruary, 2009
CEOWATT 7AC
Geosdence fora sustainable Earth
brgm3 5000 00058680 9

GFZPOT «DAM
>W¿ Enef
• Carl > » ; I I » I
^ ¡m CRES
GEODÄT*
Integrated Geophysical ExplorationTechnologies for deep fractured
geothermal systems (I-GET) -Review of geophysical explorationmethods applied to deep fractured
geothermal reservoirsFinal Report
BRGM/RP-57089-FRFebruary, 2009
Study carried out as part of research activities - BRGM 2006 and European researchprogramme FP6-2004-ENERGY-3, contract number 51378- (SES6)
J.M. Baltassat, R. Bertani, D. Bruhn , S. Ciuffi, H. Fabriol, A. Fiordelisi,C. Giolito, H-G. Holl, C. Karytsas, B. Kepinska, A. Manzella, Mazotti A., D.Mendrinos, I. Moeck, I. Perticone, M. Pussak, K. Thorwart, M. Wolfgramm
Checked by:
Name: P. Jousset
Date:
Signature:
Approved by:
Name: H. Modaressi
Date:
Signature:
If the present report has not been signed in its digital form, a signed originalof this document will be available at the information and documentation Unit (STI).
BRGM's quality management system is certified ISO 9001:2000 by AFAQ.
m Geoscience fora sustainable Earth
brgm

Keywords: geophysics, exploration, geothermal, reservoir, fracture
In bibliography, this report should be cited as follows:
Baltassat, J.M., R. Bertani, D. Bruhn , S. Ciuffi, H. Fabriol, H. A. Fiordelisi, C. Giolito, H-G.
Holl, B. Kepinska, A. Manzella, D. Mendrinos, I. Moeck, I. Perticone, M. Pussak, K. Thonwart, M.Wolfgramm (2009) - Integrated Geophysical exploration technologies for deep fracturedgeothermal systems (l-GET) - Review of geophysical exploration methods applied to deep,fractured geothermal reservoirs. BRGM Report RP-57089-FR, 137 p., 89 fig., 1 ann..
© BRGM, 2009. No part of this document may be reproduced without the prior pemnission of BRGM.
Review of geophysical methods for exploration of deep geothermal systems
Synopsis
The l-GET project aims at developing an innovative geothermal exploration approachbased on advanced geophysical methods.
Since exploration and drilling costs to access geothermal resources represent over60% of the total investment, a reduction in such costs can significantly increase thecompetitiveness of geothermal energy. This goal can be achieved if the presence offluids inside natural and/or enhanced geothermal systems can be detected before anydrilling operations. The main issue, not yet satisfactorily solved, is the detection offractures and zones of high permeability. Surface geophysical exploration methodsshould apply to the detection of such targets, but still need development and testing inorder to improve and check their efficiency and reliability.
The innovative approach proposed by l-GET will be tested on four Europeangeothermal systems with different geological and thermodynamic reservoircharacteristics: Gross-Schonebeck and Skierniewice (medium- to low-enthalpy systemin sedimentary rocks), and Travale and Hengill (high-enthalpy system in crystallinerock). As part of the WP2 package of the l-GET project, an inventory of the existingdata on the selected European sites was made (Baltassat and Fabriol 2009). Theselected sites include the test sites mentioned above and are completed by:
Two additional high-enthalpy geothermal systems in volcanic areas: Milos inGreece and Bouillante in the French West Indies (Guadeloupe Island);
One medium-enthalpy geothermal system in Hungary.
This report presents the geological and geothermal settings of the different sites, thecase histories of their geophysical exploration, and the major conclusions concerningthe feasibility and performance of the different geophysical methods used.
BRGM/RP-57089-FR - Final report

Review of geophysical methods for exploration of deep geothermal systems
Contents
1. Introduction15
2. Presentation of the different european sites and their geophysicalexploration historic cases17
2.1. LARDERELLO- TRAVALE17
2. 1.1. Main geological and geothermal setting17
2. 1.2.Geophysical case history20
2.2. GROSS SCHÓNEBECK35
2. 2.1. From gas exploration to geothermal test site35
2.2.2. Geological and geothermal setting36
2.2.3. Geophysical case history39
2.2.4. 3D structural geological modelling43
2.3. SKIERNIEWICE (from Bujakowski et al., 2007)46
2. 3.1.Geological and geothermal setting46
2.3.2. Geophysical case history48
2.4. MILOS (from Mendrinos and Karytsas, 2006)50
2.5. HENGILL56
2. 5.1.General presentation (from Gunnlaugsson and Gislason, 2005)56
2.5.2.Surface exploration57
2.5.3.Model ofthe geothermal system68
BRGM/RP-57089-FR - Final report
Review of geophysical methods for exploration of deep geothermal systems
2.6. BOUILLANTE68
2. 6.1. Exploration case history68
2.6.2. Geology70
2.6.3. Geophysical case history73
2.6.4. Model ofthe geothermal system (Lachassagne etal., 2007)78
2.7. FÁBIÁNSEBESTYÉN-NAGYSZÉNÁS79
2.7.1. High-enthalpy geothermal reservoirs in Hungary79
2.7.2. Geological setting79
2.7.3.Geophysical setting86
2.7.4. Combination ofthe geophysical methods and geology89
2.7.5. Geological model of high-enthalpy reservoirs in Hungary91
2.7.6. Proving a reservoir by means of geophysical methods93
3. State of the art of surface geophysics applied to geothermal exploration95
3.1. RESISTIVITY METHODS95
3. 1.1. Resistivity model of a geothermal reservoir96
3. 1.2. DC electrical methods98
3. 1.3.Transient Electromagnetic Method (TEM)98
3.1.4.Magnetotelluric(MT) method99
3.2. SEISMIC METHODS102
3.2. 1.Active seismics102
3.2.2.Passiveseismics107
BRGM/RP-57089-FR - Final report
Review of geophysical methods for exploration of deep geothermal systems
3.3. GRAVITY110
3.4. MAGNETIC METHOD111
3.5. WELL LOGGING114
4. Summary of experience of applying geophysical tools to geothermalexploration in the different selected sites117
5. Conclusions119
6. References121
BRGM/RP-57089-FR - Final report
Review of geophysical methods for exploration of deep geothermal systems
List of illustrations
Figure 1 -Schematic geological map ofthe Larderello-Travale geothermal area18
Figure 2 -Geological and structural setting ofthe Travale test site19
Figure 3 - Temperature features of the Larderello-Travale geothermal systems20
Figure 4 - Gradient (left) and heat-flow (right) maps of the Larderello Mte-Amiata region(Fiordelisi and Bertani, 2006)21
Figure 5 - DC-Resistivity mapping (AB=100 m) ofthe electrically resistive shallowreservoir in the Larderello - Travale area (Fiordelisi and Bertani, 2006)21
Figure 6 - The Larderello-Travale low-density anomaly interpreted as a moltenintrusion from well constrained 2D/3D modelling using density data from coremeasurements (Fiordelisi and Bertani, 2006)22
Figure 7 - Reprocessed seismic line Lar-37 (migrated version) showing the mainfeatures of the structural interpretation (Fiordelisi et al., 2005)24
Figure 8 - Map ofthe K horizon as a result of 2D section re-processing showinginterpreted faults and paths ofthe seismic lines (Fiordelisi etal., 2005)24
Figure 9 - Schematic structural reconstruction of the Travale geothermal field (Bertini etal., 2005)25
Figure 10 - 3D-seismic interpretation ofthe H-marker and selection of potential drillingtargets in areas with the highest RMS amplitude (Cappetti et al., 2005)25
Figure 1 1 - Location of 1992 MT survey (MT stations as black dots, left), of the remotereference in Capraia island (right) and boundary ofthe Travale area (red rectangle)(Bertani et al., 2006)26
Figure 12 - Location ofthe 2004 MT survey (MT stations as black triangles, left), oftheremote reference in Sardinia (right), and ofthe boundary ofthe Larderello area (redrectangle) (Manzella A., 2006)27
Figure 13 - Magnitude (left) and phase (right) polar diagrams of impedance tensor at22 Hz (top) and 0.02 Hz (bottom). Only sites in the main 3D area are shown. The roundshape at high frequency implies an almost-1D structure at shallow depth. At greaterdepth, a N45°W strike direction is shown by the direction of elongated magnitude polardiagrams on most sites (Manzella A., 2006)28
Figure 14 - Horizontal slices of 3D resistivity distribution obtained by ANNreconstruction. Only sites in the main 3D area have been considered (Manzella A.,2006)28
Figure 15 - Resistivity cross-section overiapped by the geological model (Manzella A.,2006)29
Figure 16 -Configuration ofthe Larderello seismic network (from Batini etal., 1995)30
Figure 17 - Map of P-wave velocity resulting from the tomography inversion for depths1-2 km and 4-5 to 6-7 km (top) and Bouguer anomaly map (bottom) where the isohypseof the K-horizon (white isolines) is also shown (Vanorio et al. ,2003)31
BRGM/RP-57089-FR - Final report
Review of geophysical methods for exploration of deep geothermal systems
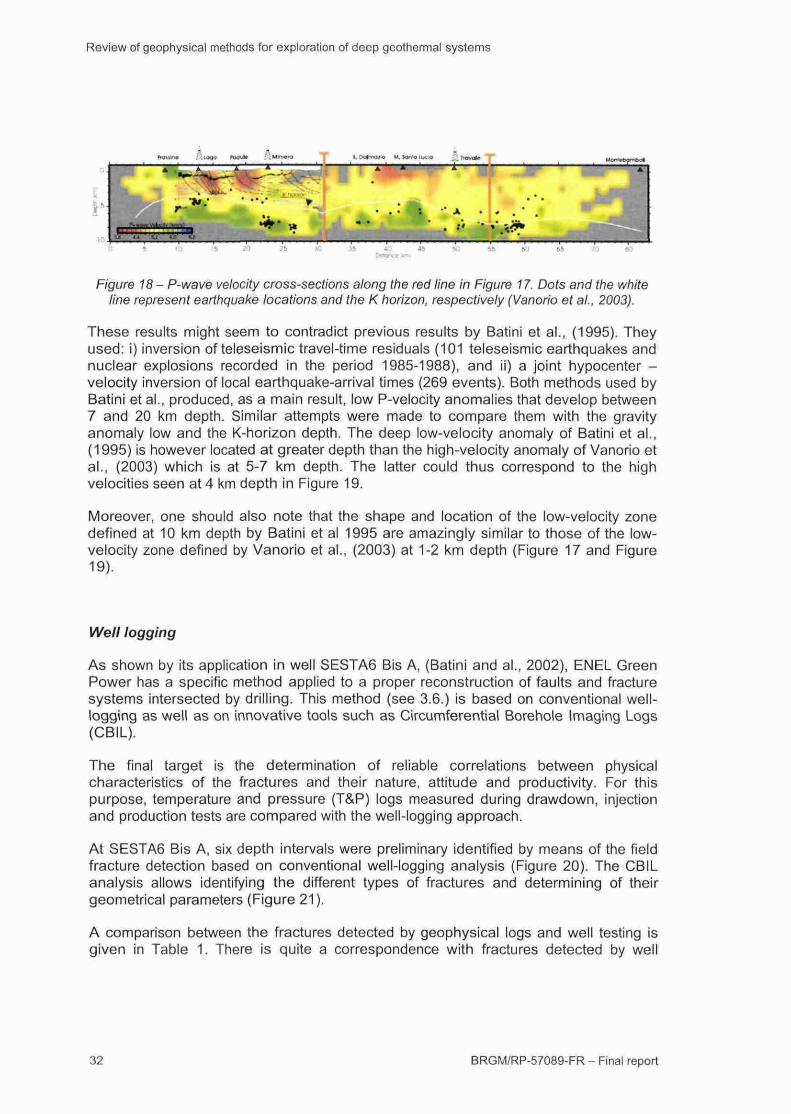
Figure 18 - P-wave velocity cross-sections along the red line in Figure 17. Dots and thewhite line represent earthquake locations and the K horizon, respectively (Vanorio etal., 2003)32
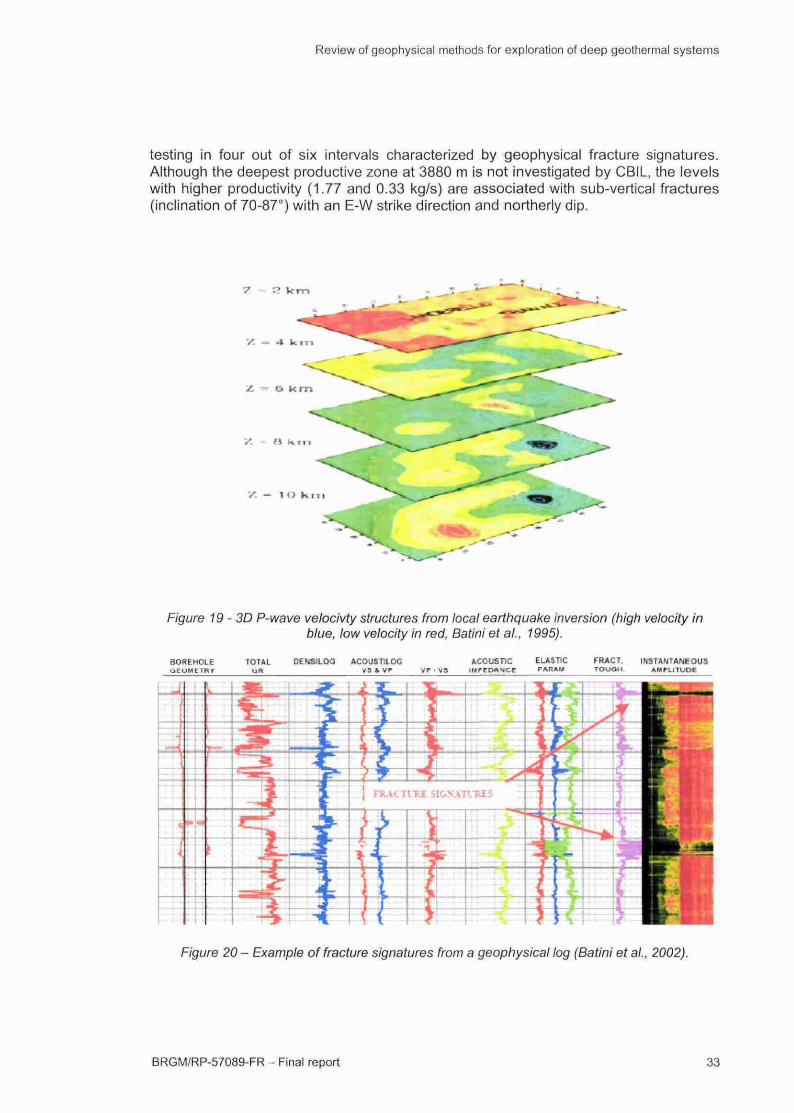
Figure 19 - 3D P-wave velocivty structures from local earthquake inversion (highvelocity in blue, low velocity in red, Batini et al., 1995)33
Figure 20- Example of fracture signatures from a geophysical log (Batini etal., 2002)33
Figure 21- Example of fracture analysis from CBIL (Batini etal., 2002)34
Figure 22 - The South Permian Basin during the Rotliegend period (Early Permian).The geothermal aquifer system of Groli Schonebeck is restricted to the continentalclastic sections ofthe basin (modified from Gast and Gundlach, 2006, Ziegler et al.,2005 and Ziegler, 1988)35
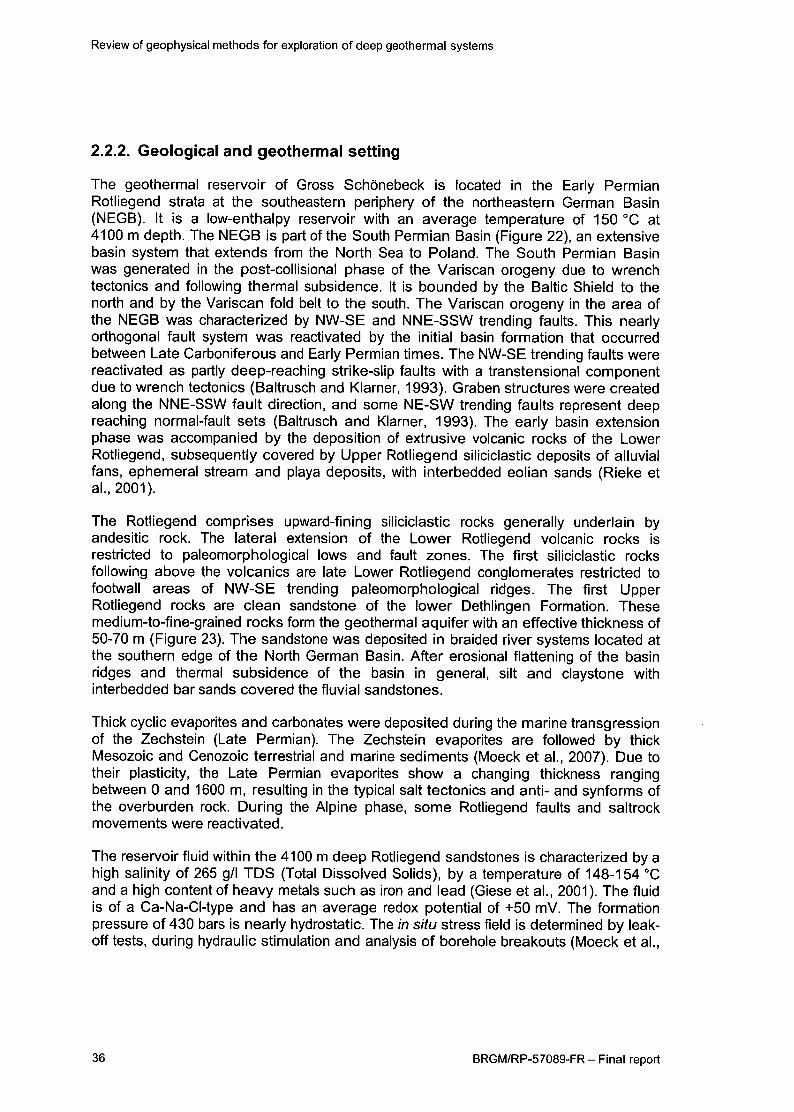
Figure 23 - (A) Geological profile through well doublet in Grolî Schonebeck. (B)Lithological profile ofthe Rotliegend; the red box indicates the reservoir section.Legend: 1 - Claystone, 2 - Siltstone, 3 - Fine- to medium-grained sandstone, 4 -Medium- to coarse-grained sandstone, 5 - Andesitic volcanic rock37
Figure 24 - Slip tendency plot for the four fault planes that surround the geothermal wellGrSk 3/90. On the left, the different fault planes (numbered 1 to 4) are shown as polesin the lower hemisphere projection. On the right, the spatial extension ofthe faultsystem and the slip tendency along the faults are visualized in the 3D fault model. Theslip tendency for a given fault pole is indicated on the colour scale, where red indicatesa relatively high slip tendency and blue a relatively low slip tendency (Moeck et al.,2007)38
Figure 25 - Basemap of the re-processed 2D seismic sections around the GroliSchonebeck test site39
Figure 26 - Reflection-seismic section Liebenwalde 01 (LEW01), Amplitude. Red lines:faults; Yellow lines: horizon interpretation; Z1: top of basal Zechstein anhydrite; R1:-top Niendorf Member; R2: -top Dethlingen Formation; H6: top Lower Rotliegendvolcanics; Carb.1: top Carboniferous40
Figure 27 - Depth-dependent illustration of spectral gamma-ray data (potassium versusthorium) (Holl etal., 2005)41
Figure 28 - Comparison of logging data (Nphi) with measured core porosities as wellas calculated permeabilities with core permeabilities (porosity: n = 290; permeability:n= 109). The right track illustrates a borehole temperature measurement afterstimulation. Bright yellow areas show the stimulated intervals (modified from Holl et al.,2005)43
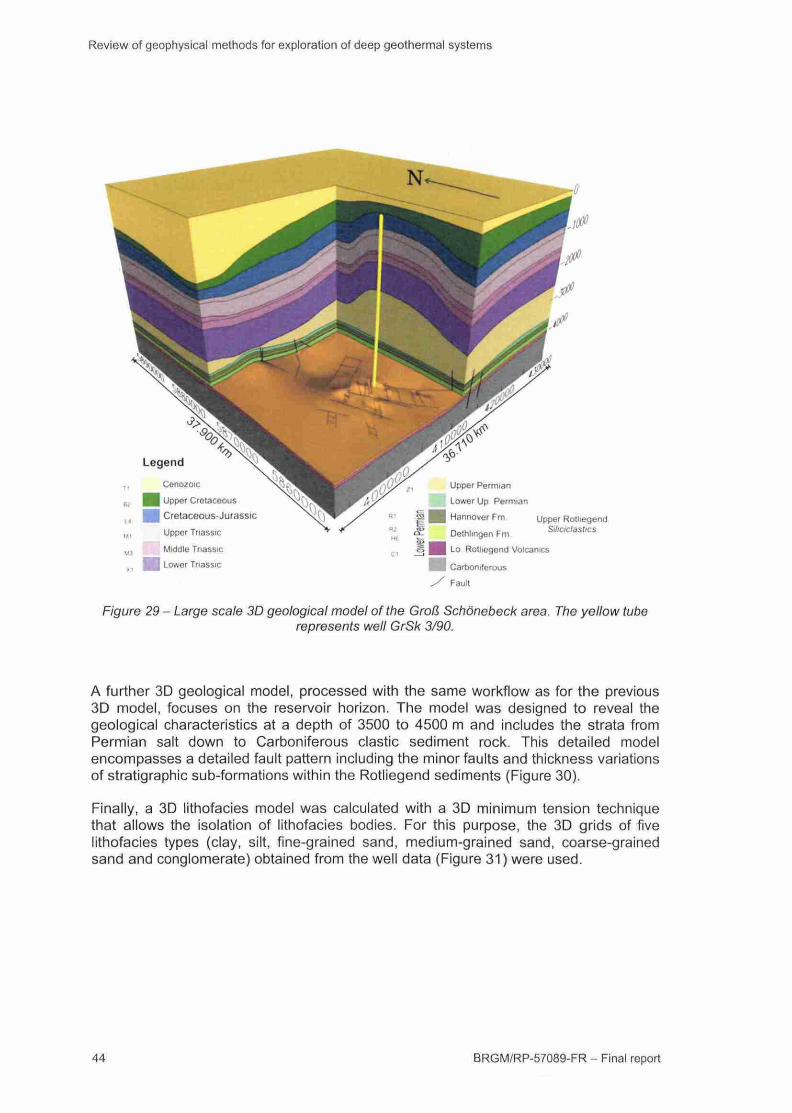
Figure 29 - Large scale 3D geological model of the Groli Schonebeck area. The yellowtube represents well GrSk 3/9044
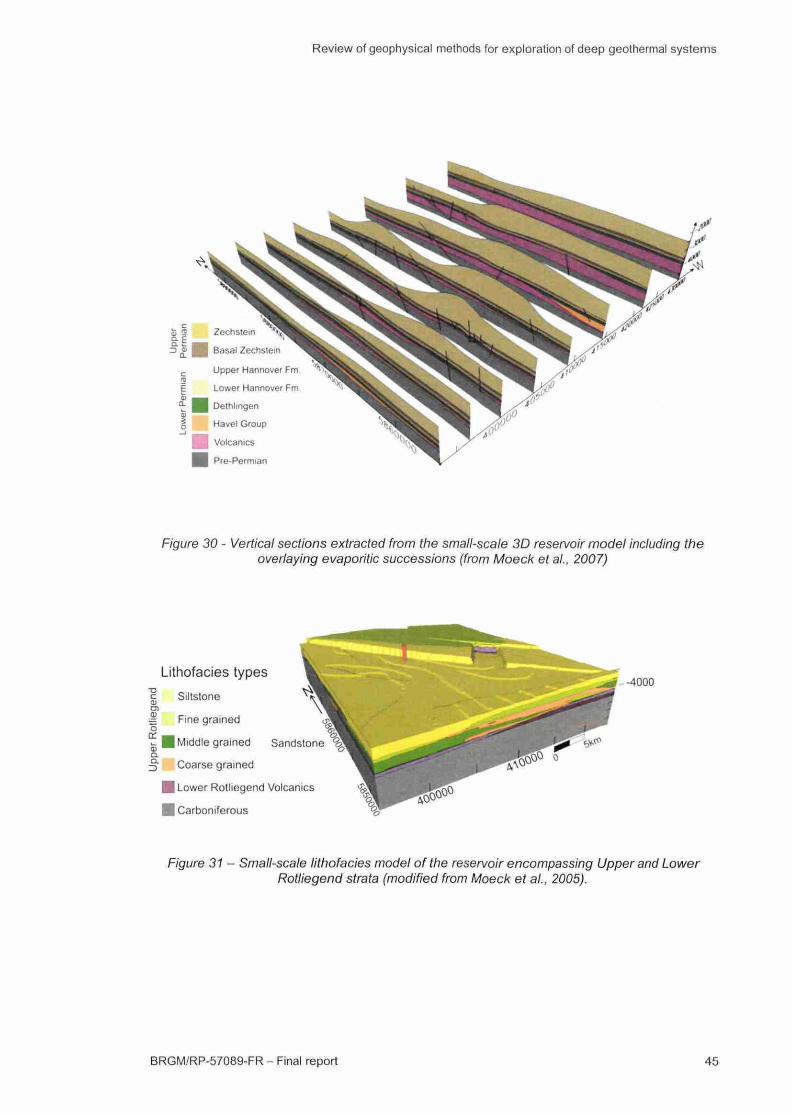
Figure 30 - Vertical sections extracted from the small-scale 3D reservoir modelincluding the overiaying evaporitic successions (from Moeck etal., 2007)45
Figure 31 - Small-scale lithofacies model ofthe reservoir encompassing Upper andLower Rotliegend strata (modified from Moeck et al., 2005)45
Figure 32 - Geological cross-section across the Skierniewice - Lowicz - Sochaczewarea (after Dembowska and Marek, 1985)46
Figure 33 - Temperature log and stratigraphy from the Kompina-2 well, Skierniewicearea47
BRGM/RP-57089-FR - Final report
Review of geophysical methods for exploration of deep geothermal systems
Figure 34 - Location of reflection-seismic lines available for re-processing in theSkierniewice area48
Figure 35 - Bouguer anomaly map of the Skierniewice area calculated for a density of2.25 g/cm^ (isolines in mGals)49
Figure 36 - Geological map of Milos Island (Mendrinos et al. 2009)51
Figure 37- Map of geothermal surface manifestations (Fytikas, 1977)52
Figure 38 - Gravity map of Milos (Tsokas, 2000)53
Figure 39- Temperature gradient in °C/10 m53
Figure 40 - Map and cross-section of micro-earthquake epicenters (adapted fromWoehllenberg et al., 1989)54
Figure 41 - Apparent resistivity map at AB/2=1000 from DC-Schlumberger soundingsurvey55
Figure 42 -Apparent resistivity distibution at 1 Hz frequency from CSAMT survey55
Figure 43 - Geology of deep wells drilled on Milos Island (Mendrinos 1988)56
Figure 44 - Location of the Hengill geothermal field. Hot springs and fumaroles areindicated by dots ( and major faults by tagged lines (modified from Bodvarsson et al.,1990a)58
Figure 45 - The three volcanic systems of the Hengill complex (from Gunnlaugsson andGislason, 2005)59
Figure 46 - Left: Geological cross section through Hellisheiôi area. Blue formations arelava series, and all other colours indicate individual hyaloclastite beds. Well traces areshown as black lines. Thin orange lines between wells 6 and 3 are traces of volcanicfissures of 2000 and 5000 years. Right: Comparison of alteration and formationtemperature on the same cross-section (Franzson et al., 2005)61
Figure 47 - Resistivity cross-section from Nesjavellir geothermal field, alteration zoningin wells and temperature (Arnason et al., 2000)61
Figure 48 - Resistivity at 100 m b.s.l. according to a recent TEM survey. Shown in blueare visible fault lines and, in green, faults as defined by earthquake locations (fromArnason and Magnusson, 2001)62
Figure 49 - General resistivity structure of the basaltic crust in Iceland. The depth scaleis arbitrary; the actual scale will depend on the past and present temperature profiles(Flovenz et al., 2005)63
Figure 50 - Conceptual model ofthe Hellisheidi high-temperature system (Franzson etal., 2005)63
Figure 51- Location of MT stations southwest of Hengill as part ofthe DGP project(from Oskooi et al., 2005)64
Figure 52 - 2D inversion model of joint TE- and TM-mode data (Oskooi et al., 2005)65
Figure 53 - Schematic map of the main structural features of the area and theapproximate extents if the bodies imaged by the tomographic inversion (Foulger, 1989)66
Figure 54 - Vertical cross-section ofthe profile located in Figure 50, showing thedistribution of seismicity in relation to velocity tomography based on local earthquakerecords. Hypocenters are all those accurately located within 1.5 km horizontal distance
10 BRGM/RP-57089-FR - Final report
Review of geophysical methods for exploration of deep geothermal systems
from the section line , relocated with the three dimensional velocity model (Foulger,1989)67
Figure 55 - Contoured average teleseismic P-wave delays for 21 events recorded overa three-month period. Stations are indicated as dots annotated with the corresponding
delay value in seconds. The main tectonic feaures are also shown (solid line = NNEtrending erupfion fissure zones; dashed line = main erupfive systems (Foulger, 1989)67
Figure 56 - Location of Guadeloupe island within the Carribean arc (Feuillet et al.,2001)69
Figure 57 - Structural sefting of Guadeloupe island with the location of the main activefaults and historic earthquakes (Feuillet et al., 2001)70
Figure 58- Geological map ofthe Bouillante area (Sanjuan etal. 2005)71
Figure 59 - Main faults and hydrothermal activity in the Bouillante area (Sanjuan et al.2005)72
Figure 60 - Temperature (corrected) map at 1 .25 m below ground surface (Goguel1965). Boreholes B01-4 are shown as red stars74
Figure 61 - 2D modelling ofthe gravity anomaly profile crossing Bouillante area:theBouguer anomaly is essentially controlled by low-density shallow rocks (in yellow)corresponding to pyroclasfic deposits (Truffert etal. 1999)74
Figure 62 - Magnetic (above) and electrical-resistivity tomography (below) results alonga north-south profile crossing the current production area, compared with the thermalmanifestations (arrows), helium anomaly (orange bars), and fauft locations (F).Magnetic profiles: black line = total field anomaly, green and blue lines = polereductions, red line = analytic signal76
Figure 63 - Resistivity zoning based on the vertical distribution of resisitivity producedby 2D inversion at boreholes B02 and B04-7, and comparison with temperature andclay data from boreholes77
Figure 64 - Hydrogeological synthesis of thermal and water-flow exchanges in theBouillante geothermal field78
Figure 65 - Sketch map of the karstified and/or tectonically fractured rocks (potentialhigh-enthalpy reservoirs); Fábiánsebestyén-Nagyszénás site is shown shown by theblack rectangle ( according to Hajnal et al., (2004), Csontos et al., (2002), Nagy et al.,(1992), Stegena et al., (1992)); legend: 1 Raba-Veporic line, 2 Balaton line, 3 Zagrebline, 4 Mecsekaija line, 5 Bekes line, 6 Hungarian lineament, 7 Darno line, 8 Diosjenoline, 9 Mor line, 10 Mur-Mürz Small Carparthians80
Figure 66 - Simplified geological cross-sections through Hungary (Haas, 2001)81
Figure 67 - Structural map of the Nagyszénás-Fábiánsebestyén area based on theresults of previous seismic exploration and drilling data (Nagy et al., 1992); red points -steam wells, grey points - deep wells; patch in Figure 6582
Figure 68 - Schematic stratigraphie conditions at the Fábiánsebestyén-Nagyszénássite for well Fáb-4 (based on drill core information obtained from MGSZ (MagyarGeologiai Szolgáiat - Geological Survey of Hungary) - red: main inflow zone. Verticalscale in meters83
Figure 69 - Temperatures in selected wells at the Fábiánsebestyén-Nagyszénás siteaccording to MGSZ archive data84
Figure 70 - Geo-isotherms in Hungary at 2 km depth b.s.l. (Dóvényiet al., 1983)85
BRGM/RP-57089-FR - Final report 1 1
Review of geophysical methods for exploration of deep geothermal systems
Figure 71 - Pressure behaviour in well Fáb-4 - fault below the hydraulically tight clay-mari group (MGSZ archive data)86
Figure 72 - Integrated results of MT (blue) and seismic survey (black) data at the Fáb-4steam well. Seismic-reflection horizons representing interfaces between Pliocene,Miocene and Mesozoic formations are incorporated in the MT Bostick-resistivity vs.depth pseudosection after fime to depth conversion of seismic data (Nagy etal., 1992)87
Figure 73 - Gravity anomaly at the Fábiánsebestyén-Nagyszénás site (MGSZ archivedata)88
Figure 74 - 3D presentation ofthe approximate depth ofthe top ofthe Early Pannonianbased on MGSZ archive data; black lines - assumed fault traces; red line - seismic
profile89
Figure 75 - Geothermal field of Nagyszénás (Nagy et al., 1992) on the basis of MTsurvey. Legend: 1. Depth contours (km) ofthe top horizon of high resistivity unfracturedsubstratum; 2. Zone of fractured rocks (potential reservoir) with increased electricalconductivity, located over a depth range of considerable width in the pre-Neogenebasement90
Figure 76 - Profile through the extension ofthe gravity (MSGZ), magnetics(ELGI/MSGZ) and MT (MOL) anomalies. Geology based on well logs (MGSZ), the Nsz-3 well logs being adapted for integration into the profile91
Figure 77 - Resistivity model of a typical geothermal reservoir, modified after Johnstonetal., 199297
Figure 78 - Apparent resistivity and phase plots obtained from site n°3 sounding of MteAmiata MT reconnaissance: robust least-squares single site processing results on theleft; Larsen's robust remote-reference processing results using the island of Capraia
site as remote on the right (Fiordelisi et al., 2000)101
Figure 79 - Migrated seismic profile (left) and VSP (right) compared to directionaldrilling observations (Gameli et al., 2000)104
Figure 80 - Empirical correspondence between seismic reflections and fractures(Cameli etal., 2000)104
Figure 81 - Synthetic seismogram of a productive fracture calculated on the basis ofwell-logging data (above) and showing a signiflcant reflection (Cameli etal., 2000)105
Figure 82 - Reflection coefficient modulus versus angle of incidence for the fracturezone of Figure 81 (Cameli et al., 2000)106
Figure 83 - Geological setfing ofthe Soultz geothermal site ( Place etal., 2006)108
Figure 84 - Subvertical fault imaging using VSP (Place et al., 2006)108
Figure 85 - Densification as a result of hydrothermal alteration within the volcanic areaof Taupo (New Zealand, contours in mgals). a) Broadlands geothermal system: dashedline encloses the most permeable part of the system with temperatures >270 °C at 900m depth; hatching denotes the resistivity boundary at 500-1000 m depth, b) Alterationin the Ohakuri epithermal prospect109
Figure 86 - Shaded horizontal-gradient map showing the main magnetic disconfinuifiesin relation with the geothermal activity (Smith et al., 2002)112
Figure 87 - Correlation between higher heat flux and shallower Curie depths resultingfrom magnetic interpretation at Kiushu island, Japan (Okubo, 1985). Above: Curie
1 2 BRGM/RP-57089-FR - Final report
Review of geophysical methods for exploration of deep geothermal systems
depth map, 1 km isoline spacing; x1 et x2: production sites; triangles: activevolcanoes. Below: Measured heat flux, 1 HFU = 42 mW/m^) Isoline spacing113
Figure 88 - Processing flow chart of density and acoustic well logging data (Bafini etal., 2002)115
Figure 89 - Processing flow chart for fracture analyses from well logging (Batini et al.,2002)116
List of annexes
Annex 1133
BRGM/RP-57089-FR - Final report 13

Review of geophysical methods for exploration of deep geothermal systems
1. Introduction
The share of renewable energy sources in the European energy balance can beincreased by a meaningful contribution of geothermal energy. Since the explorationand drilling costs to access the resources represent over 60% of the total investment, areduction in these costs can significantly increase the competitiveness of geothermalenergy. This goal can be achieved if we can detect the presence of fluids inside naturaland/or enhanced geothermal systems before any drilling operation.
The exploration of geothermal resources aims at detecting and defining thermalanomalies and macroscopic geological structures, such as large-scale permeability orintensely fractured zones that determine the productivity conditions of a geothermalreservoir. Many geothermal reservoirs are associated with fractures characterized byhigh permeability, which are quite commonly unevenly distributed.
Many exploration and exploitation wells woridwide were drilled into targets that werepromising in terms of high-temperature rock formations, but which lacked sufficientpermeability to sustain commercial production.
High-temperature targets are not the major challenge today, as they can be identifiedand located with sufficient resolution using appropriate tools and proper care. Themajor and not yet satisfactorily solved problem is how to detect fractures and highpermeability zones.
However, the rock environment of a geothermal reservoir is quite specific, with highlysaline geothermal fluids and high temperatures close to the liquid/steam transition. Thebehaviour of rocks with increasing temperature and pressure is already deeplyinvestigated, but their impact on the interpretation of resistivity or seismic-impedancemeasurements from surface geophysics has not been studied with the necessarydetail.
The l-GET Project aims at developing an innovative geothermal exploration approachbased on advanced geophysical methods. This new approach will be tested on four
European geothermal systems with different geological and thermodynamic reservoircharacteristics. These are:
Two high-enthalpy geothermal systems: Travale, Italy, in metamorphic rocksand Hengill, Iceland, in volcanic rocks;
One medium-enthalpy geothermal system in deep sedimentary rocks at Gross-Schonebeck near Beriin, Germany;
One low-enthalpy geothermal system in medium-deep sedimentary rocks atSkierniewice, Poland.
BRGM/RP-57089-FR - Final report 1 5
Review of geophysical methods for exploration of deep geothermal systems
As part of the WP2 package of the l-GET Project, an inventory of the existing data inthe selected European sites was made by Baltassat and Fabriol in 2009. The selectedsites include the test sites mentioned above and are completed by:
Two more high-enthalpy geothermal systems in volcanic areas: Milos in Greeceand Bouillante in the French West Indies (Guadeloupe Island);
One medium-enthalpy geothermal system in Hungary (Fabiansebestyen -Nagyszenas).
This report presents the geological and geothermal settings of the different sites, thecase histories of their geophysical exploration, and the main conclusions concerningthe feasibility and the performance ofthe different geophysical methods used.
1 6 BRGM/RP-57089-FR - Final report
Review of geophysical methods for exploration of deep geothermal systems
2. Presentation ofthe different european sites
and their geophysical exploration historiccases
2.1 . LARDERELLO - TRAVALE
2.1.1. Main geological and geothermal setting
The geological and structural characteristics of the Larderello-Travale geothermal fieldresult from the tectonic evolution of southern Tuscany, which belongs to the northernApennine Mountains. Structurally, the Larderello-Travale geothermal system lies in abroad Neogenic basin that was filled by allochthonous sediments during extensionaltectonics and is characterized by crustal thinning and high heatflow values.
The geological and structural setting (Figure 1 and Figure 2) involves, below theNeogenic sediments, the following overiapping tectonic units.
Ligurian unit, an allochthonous formation consisting of Flysch faciès, mainlyshale, of Eariy Cretaceous to Eocene age;
Tuscan Nappe, a sandstone and limestone unit of Late Triassic to Eariy
Miocene age;
Tectonic wedge units: anhydrite, quartzite, carbonate and phyllite of EarlyPermian to Late Trias age;
Metamorphic basement: Eariy Palaeozoic phyllite, micaschist and gneiss.
On the basis of existing geological-geophysical and well data, a preliminary geothermalmodel of the Travale field was constructed. In particular two different reservoirs wereidentified:
- A shallow steam-dominated reservoir hosted at 500-1000 m depth in carbonateand evaporite rocks. It is characterized by medium-to-high permeability, atemperature of about 270 °C, and a reservoir pressure of 60 bars;
- A deep superheated steam reservoir, in vapour-static equilibrium with theshallow one, hosted in the metamorphic basement and thermo-metamorphic
rocks. It shows a highly anisotropic permeability distribution, temperaturesranging between 300-350 °C, and a reservoir pressure of 70 bars.
BRGM/RP-57089-FR - Final report 1 7
Review of geophysical methods for exploration of deep geothermal systems
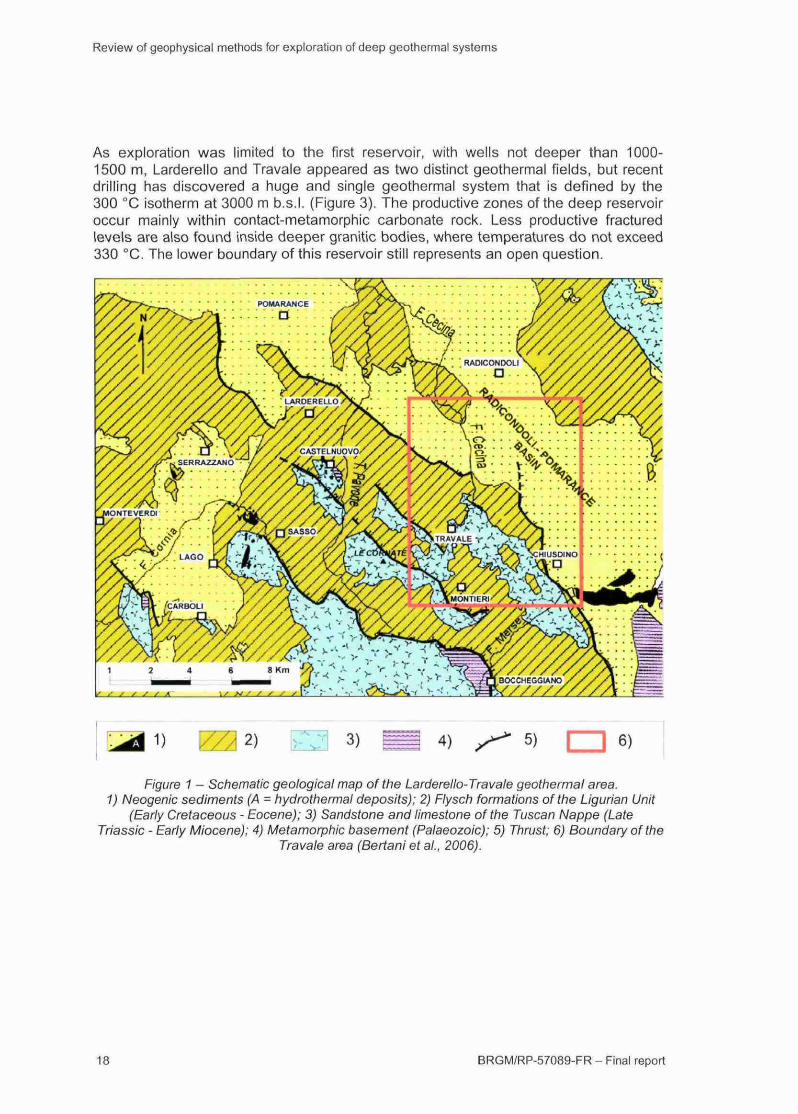
As exploration was limited to the first reservoir, with wells not deeper than 1000-1500 m, Larderello and Travale appeared as two distinct geothermal fields, but recentdrilling has discovered a huge and single geothermal system that is defined by the300 °C isotherm at 3000 m b.s.l. (Figure 3). The productive zones of the deep reservoiroccur mainly within contact-metamorphic carbonate rock. Less productive fracturedlevels are also found inside deeper granitic bodies, where temperatures do not exceed330 °C. The lower boundary of this reservoir still represents an open question.
f ,' S S S S
1) 3) 4) 6)
Figure 1 - Schematic geological map of the Larderello- Travale geothermal area.1) Neogenic sediments (A = hydrothermal deposits); 2) Flysch formations of the Ligurian Unit
(Early Cretaceous - Eocene); 3) Sandstone and limestone of the Tuscan Nappe (LateThassic - Early Miocene); 4) Metamorphic basement (Palaeozoic); 5) Thrust; 6) Boundary of the
Travale area (Bertani et al., 2006).
18 BRGM/RP-57089-FR - Final report
Review of geophysical methods for exploration of deep geothermal systems
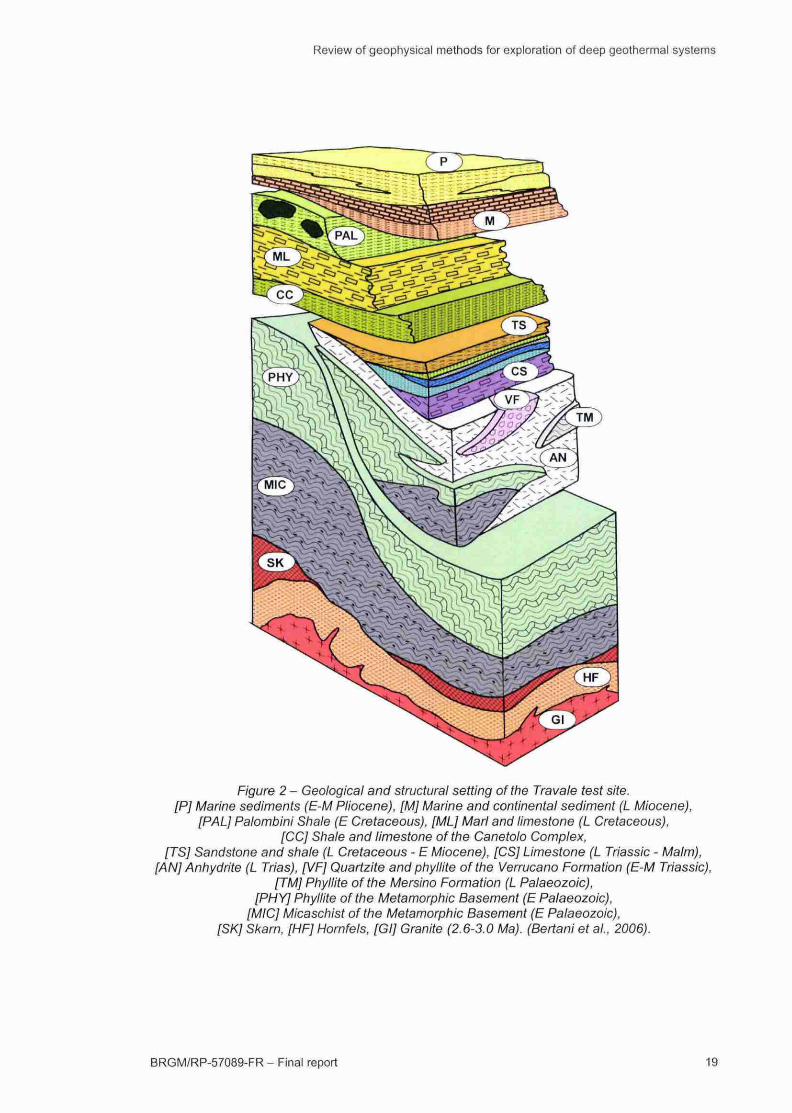
Figure 2 - Geological and structural setting of the Travale test site.[P] Marine sediments (E-M Pliocene), [M] Marine and continental sediment (L Miocene),
[PAL] Palombini Shale (E Cretaceous), [ML] Marl and limestone (L Cretaceous),[CC] Shale and limestone of the Canetolo Complex,
[TS] Sandstone and shale (L Cretaceous - E Miocene), [CS] Limestone (L Thassic - Malm),[AN] Anhydrite (L Trias), [VF] Quartzite and phyllite of the Verrucano Formation (E-M Triassic),
[TM] Phyllite of the Mersino Formation (L Palaeozoic),[PHY] Phyllite of the Metamorphic Basement (E Palaeozoic),
[MIC] Micaschist of the Metamorphic Basement (E Palaeozoic),[SK] Skarn, [HF] Hornfels, [Gl] Granite (2.6-3.0 Ma). (Bertani et al., 2006).
BRGM/RP-57089-FR - Final report 19
Review of geophysical methods for exploration of deep geothermal systems
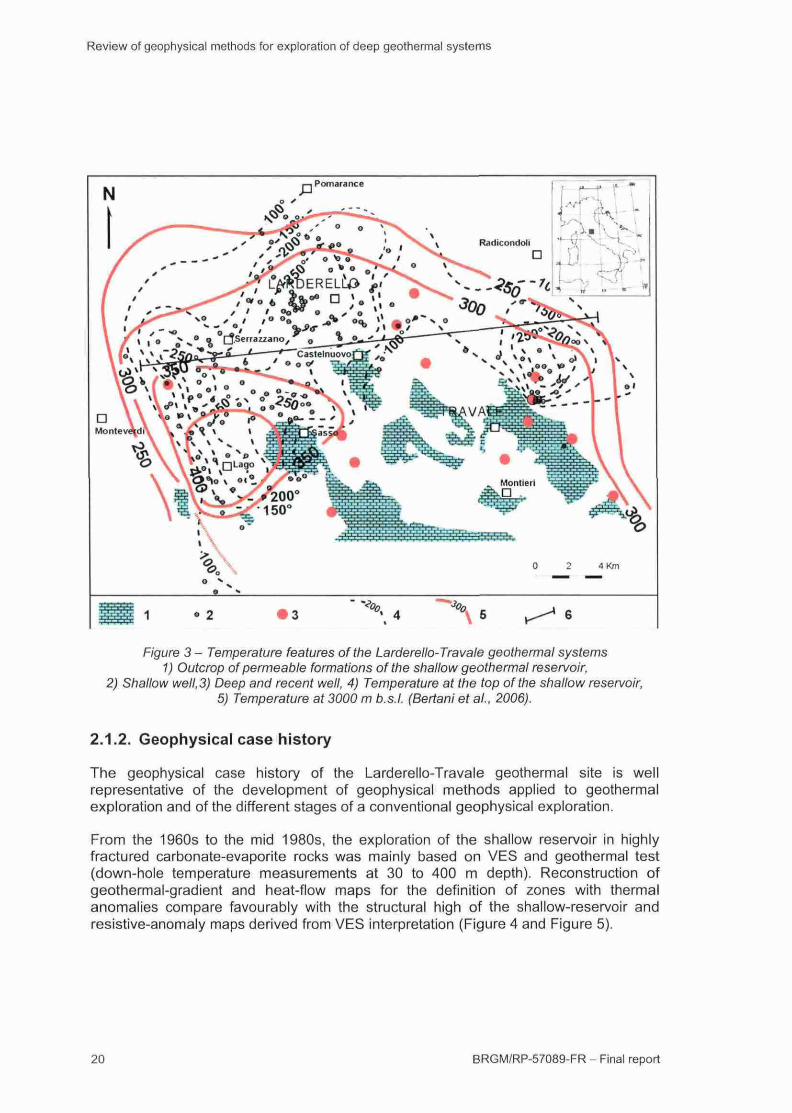
Figure 3 - Temperature features of the Larderello-Travale geothermat systems1) Outcrop of permeable formations of the shallow geothermal reservoir,
2) Shallow well, 3) Deep and recent well, 4) Temperature at the top of the shallow reservoir,5) Temperature at 3000 m b.s.l. (Bertani et al., 2006).
2.1.2. Geophysical case history
The geophysical case history of the Larderello-Travale geothermal site is wellrepresentative of the development of geophysical methods applied to geothermalexploration and of the different stages of a conventional geophysical exploration.
From the 1960s to the mid 1980s, the exploration of the shallow reservoir in highlyfractured carbonate-evaporite rocks was mainly based on VES and geothermal test(down-hole temperature measurements at 30 to 400 m depth). Reconstruction ofgeothermal-gradient and heat-flow maps for the definition of zones with thermalanomalies compare favourably with the structural high of the shallow-reservoir andresistive-anomaly maps derived from VES interpretation (Figure 4 and Figure 5).
20 BRGM/RP-57089-FR - Final report
Review of geophysical methods for exploration of deep geothermal systems
1 I ' 1
\
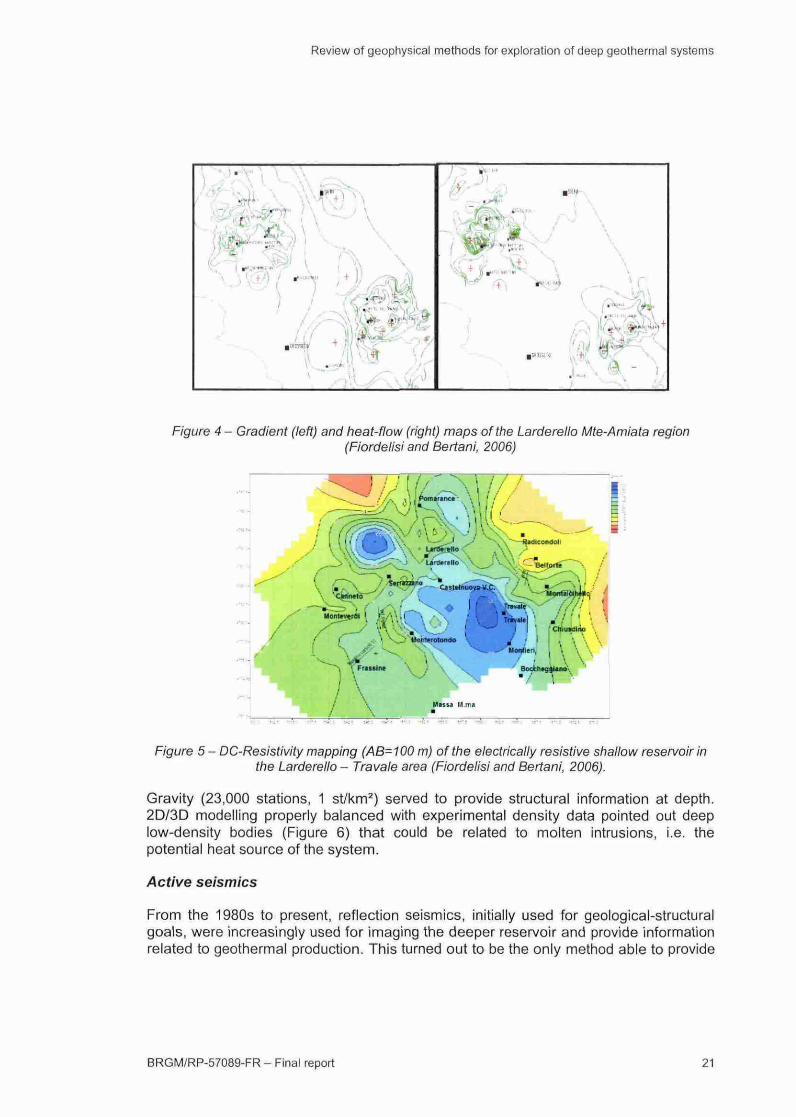
F/gure 4 - Gradient (left) and heat-ftow (right) maps of the Larderelio Mte-Amiata region(Fiordelisi and Bertani, 2006)
Figure 5 - DC-Resistivity mapping (AB= 100 m) of the electrically resistive shallow reservoir inthe Larderelio - Travale area (Fiordelisi and Bertani, 2006).
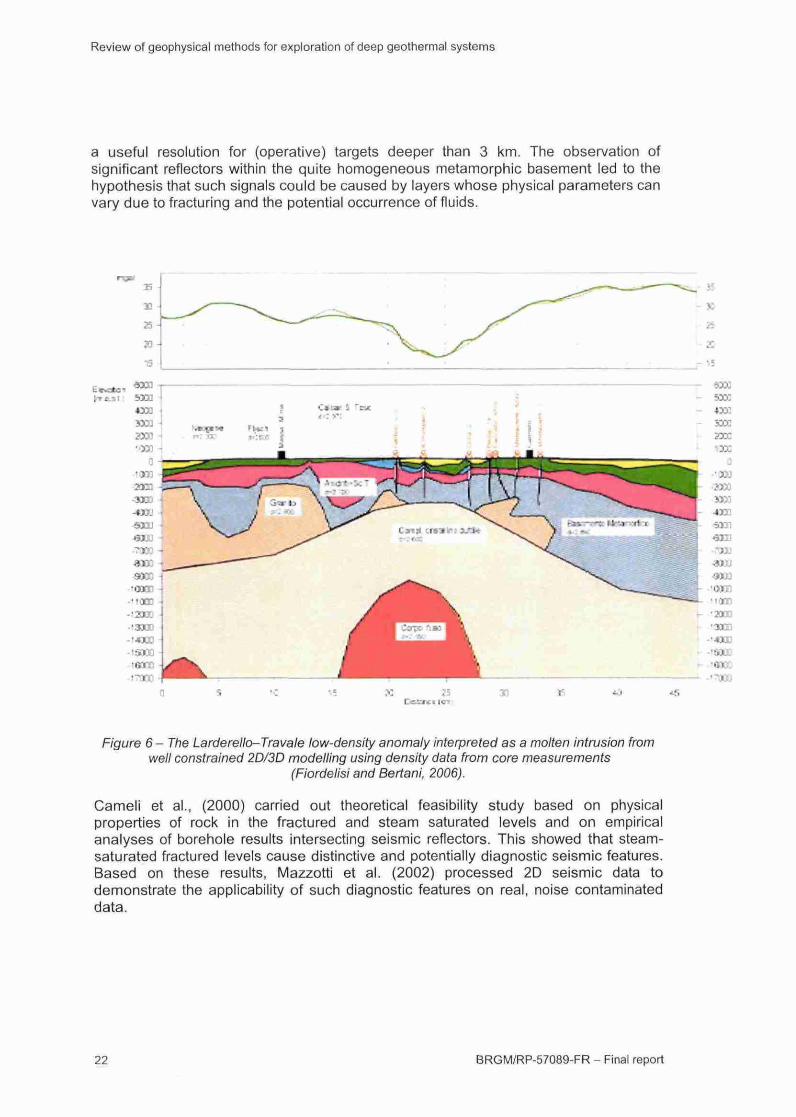
Gravity (23,000 stations, 1 st/km2) served to provide structural information at depth.2D/3D modelling properly balanced with experimental density data pointed out deeplow-density bodies (Figure 6) that could be related to molten intrusions, i.e. thepotential heat source of the system.
Active seismics
From the 1980s to present, reflection seismics, initially used for geological-structuralgoals, were increasingly used for imaging the deeper reservoir and provide informationrelated to geothermal production. This turned out to be the only method able to provide
BRGM/RP-57089-FR - Final report 21
Review of geophysical methods for exploration of deep geothermal systems
a useful resolution for (operative) targets deeper than 3 km. The observation ofsignificant reflectors within the quite homogeneous metamorphic basement led to thehypothesis that such signals could be caused by layers whose physical parameters canvary due to fracturing and the potential occurrence of fluids.
s33
25 -
33-
15
ÜÚ0
-6
Figure 6 - The Larderello-Travale low-density anomaly interpreted as a molten intrusion fromwell constrained 2D/3D modelling using density data from core measurements
(Fiordelisi and Bertani, 2006).
Cameli et al., (2000) carried out theoretical feasibility study based on physicalproperties of rock in the fractured and steam saturated levels and on empiricalanalyses of borehole results intersecting seismic reflectors. This showed that steam-saturated fractured levels cause distinctive and potentially diagnostic seismic features.Based on these results, Mazzotti et al. (2002) processed 2D seismic data todemonstrate the applicability of such diagnostic features on real, noise contaminateddata.
22 BRGM/RP-57089-FR - Final report
Review of geophysical methods for exploration of deep geothermal systems
Fiordelisi et al., (2005) re-processed and re-interpreted more than 170 km of 2Dseismic lines, acquired from 1976 till 2000 with various characteristics and increasingcoverage for the more recent data. During this work, emphasis was put on detailedvelocity analysis and trace-amplitude consistency in an attempt to provide a common
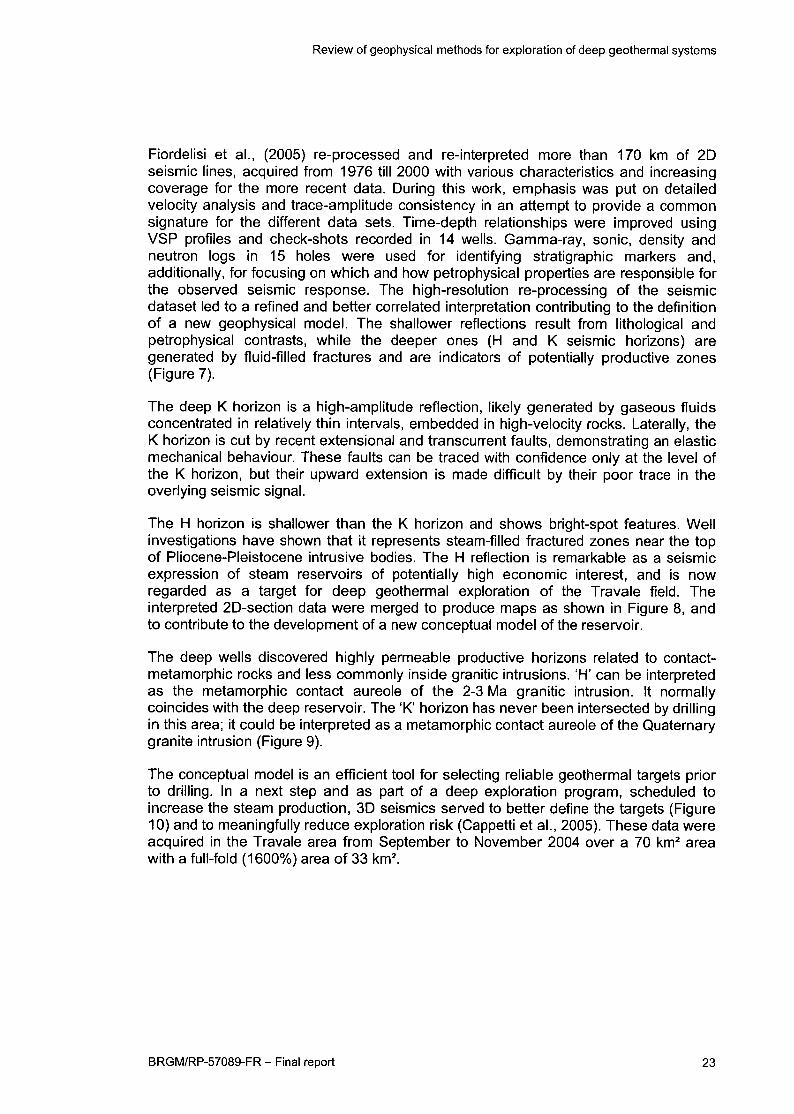
signature for the different data sets. Time-depth relationships were improved usingVSP profiles and check-shots recorded in 14 wells. Gamma-ray, sonic, density andneutron logs in 15 holes were used for identifying stratigraphie markers and,additionally, for focusing on which and how petrophysical properties are responsible forthe observed seismic response. The high-resolution re-processing of the seismicdataset led to a refined and better correlated interpretation contributing to the definitionof a new geophysical model. The shallower reflections result from lithological andpetrophysical contrasts, while the deeper ones (H and K seismic horizons) aregenerated by fluid-filled fractures and are indicators of potentially productive zones(Figure 7).
The deep K horizon is a high-amplitude reflection, likely generated by gaseous fluidsconcentrated in relatively thin intervals, embedded in high-velocity rocks. Laterally, theK horizon is cut by recent extensional and transcurrent faults, demonstrating an elasticmechanical behaviour. These faults can be traced with confidence only at the level ofthe K horizon, but their upward extension is made difficult by their poor trace in theoveriying seismic signal.
The H horizon is shallower than the K horizon and shows bright-spot features. Wellinvestigations have shown that it represents steam-filled fractured zones near the topof Pliocene-Pleistocene intrusive bodies. The H reflection is remarkable as a seismic
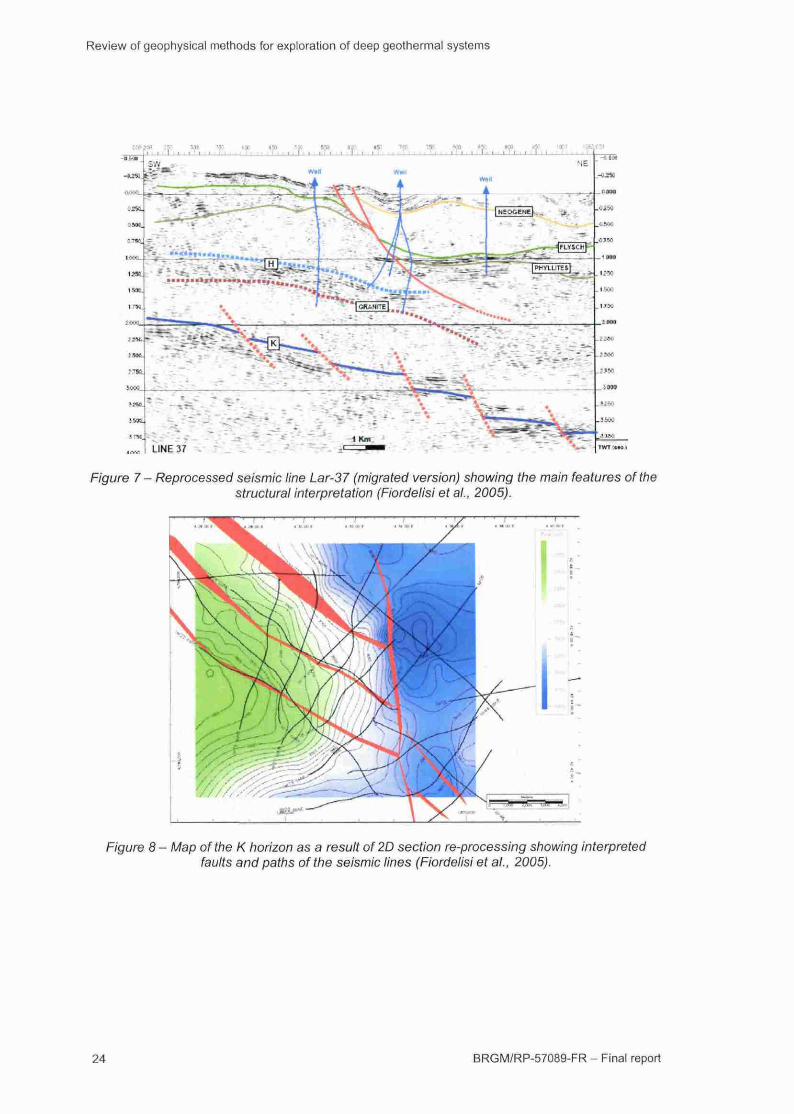
expression of steam reservoirs of potentially high economic interest, and is nowregarded as a target for deep geothermal exploration of the Travale field. Theinterpreted 2D-section data were merged to produce maps as shown in Figure 8, andto contribute to the development of a new conceptual model of the reservoir.
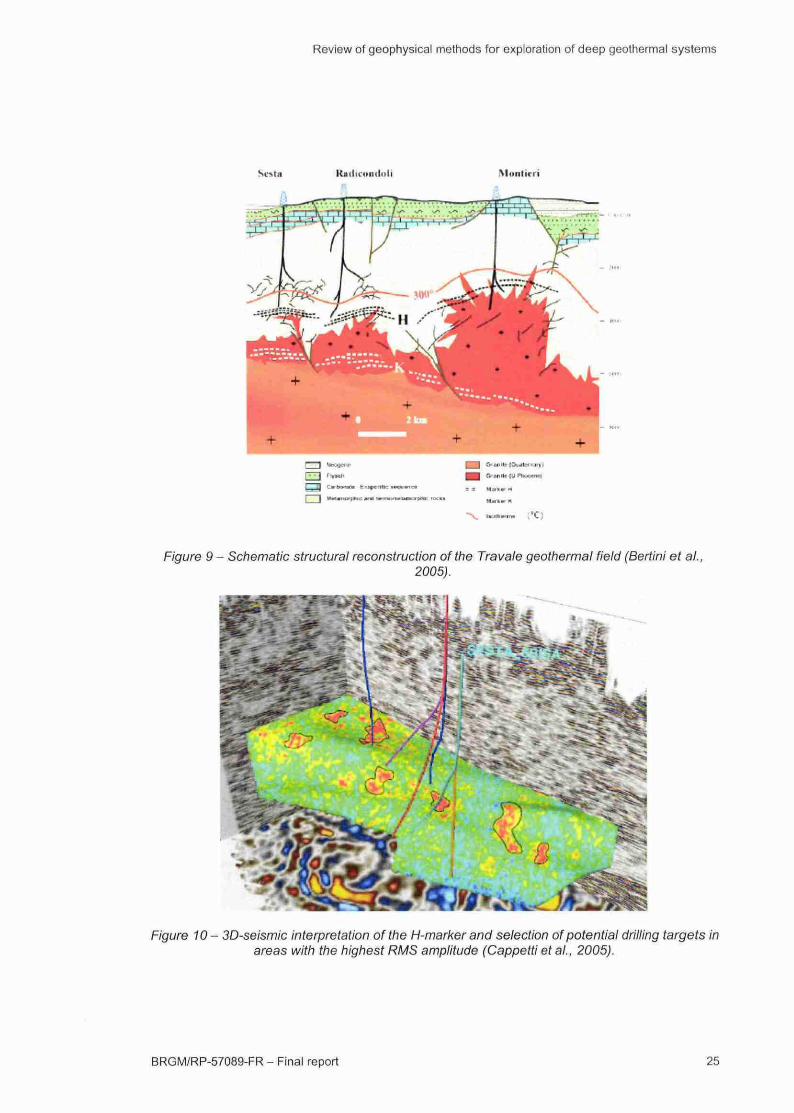
The deep wells discovered highly permeable productive horizons related to contact-
metamorphic rocks and less commonly inside granitic intrusions. 'H' can be interpretedas the metamorphic contact aureole of the 2-3 Ma granitic intrusion. It normallycoincides with the deep reservoir. The 'K' horizon has never been intersected by drillingin this area; it could be interpreted as a metamorphic contact aureole of the Quaternarygranite intrusion (Figure 9).
The conceptual model is an efficient tool for selecting reliable geothermal targets priorto drilling. In a next step and as part of a deep exploration program, scheduled toincrease the steam production, 3D seismics served to better define the targets (Figure10) and to meaningfully reduce exploration risk (Cappetti et al., 2005). These data wereacquired in the Travale area from September to November 2004 over a 70 km^ area
with a full-fold (1600%) area of 33 km^
BRGM/RP-57089-FR - Final report 23
Review of geophysical methods for exploration of deep geothermal systems
í-v-fí» : » spa w «c «M ™ KO MO «p •*» ÍW *» «c «O «• íop-i ¡f;1 i i r I i i i i 1 i i i i I i i ¡ | T- • i ; I • • ' • I • ' i I I . i • I Í i i i I • i • r I t i • i ! • i 1 [ i . l , I i l I I 1 i I l I l M . — 1 _
a , % ^ ^
Figure 7 - Reprocessed seismic line Lar-37 (migrated version) showing the main features of thestructural interpretation (Fiordelisi et al., 2005).
Figure 8 - Map of the K horizon as a result of 2D section re-processing showing interpretedfaults and paths of the seismic lines (Fiordelisi et ai, 2005).
24 BRGM/RP-57089-FR - Final report
Review of geophysical methods for exploration of deep geothermä! systems
KJMIICOIHIOII M ont ¡tri
Figure 9 - Schematic structural reconstruction of the Travale geothermal field (Bertini et al.2005).
Figure 10-3D-seism¡c interpretation of the H-marker and selection of potential drilling targets inareas with the highest RMS amplitude (Cappetti et al., 2005).
BRGM/RP-57089-FR - Final report 25
Review of geophysical methods for exploration of deep geothermal systems
Magnetotellurics (MT)
An MT survey was undertaken in southern Tuscany primarily for geothermal and deepcrustal exploration. Before 1991, the data were acquired on a single site or werereferenced to a local site less than 3 km distant. For these data the strongelectromagnetic noise affecting the data for frequencies below 1 Hz cannot beseparated from the MT signal, and generally only shallow information can be obtainedfrom these data (Manzella, 2004). After 1991, a method of acquisition was adoptedusing remote references for filtering electromagnetic noise from local power plants,geothermal exploitation, or various other human activities and electric railways. In orderto deal with the last source of noise, which mainly affects the long-period signal, veryremote reference stations were used on Capraia and Sardinia islands. This effect, theproposed method of coherency processing using remote reference, and its applicationare described in Fiordelisi et al., (1995) and Larsen et al., (1996).
The recent MT surveys using this methodology and that intersect the Travale area, are:
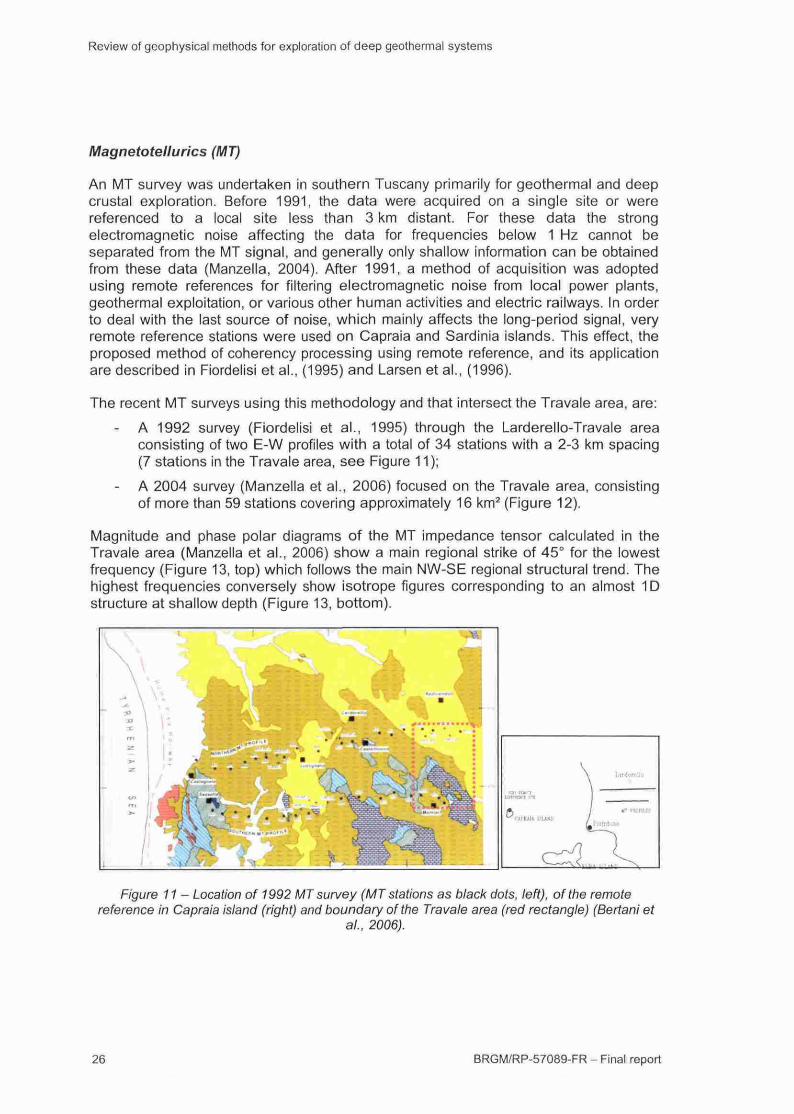
- A 1992 survey (Fiordelisi et al., 1995) through the Larderello-Travale areaconsisting of two E-W profiles with a total of 34 stations with a 2-3 km spacing(7 stations in the Travale area, see Figure 11 );
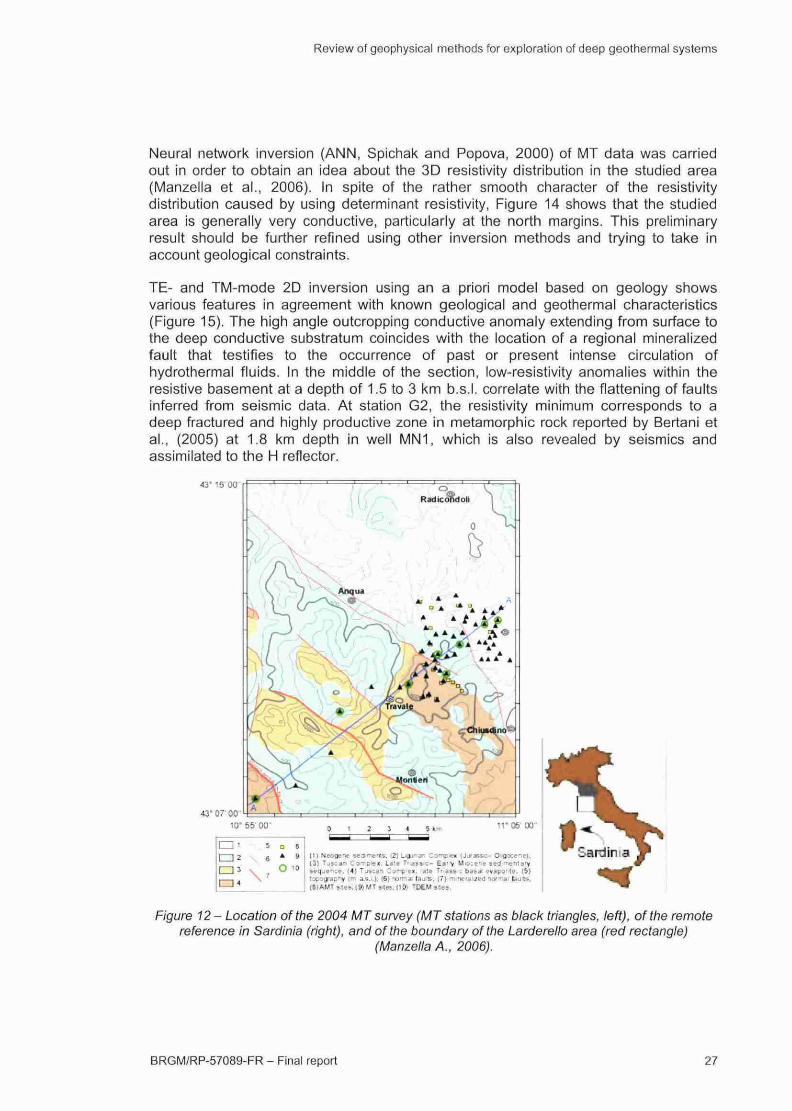
- A 2004 survey (Manzella et al., 2006) focused on the Travale area, consistingof more than 59 stations covering approximately 16 km2 (Figure 12).
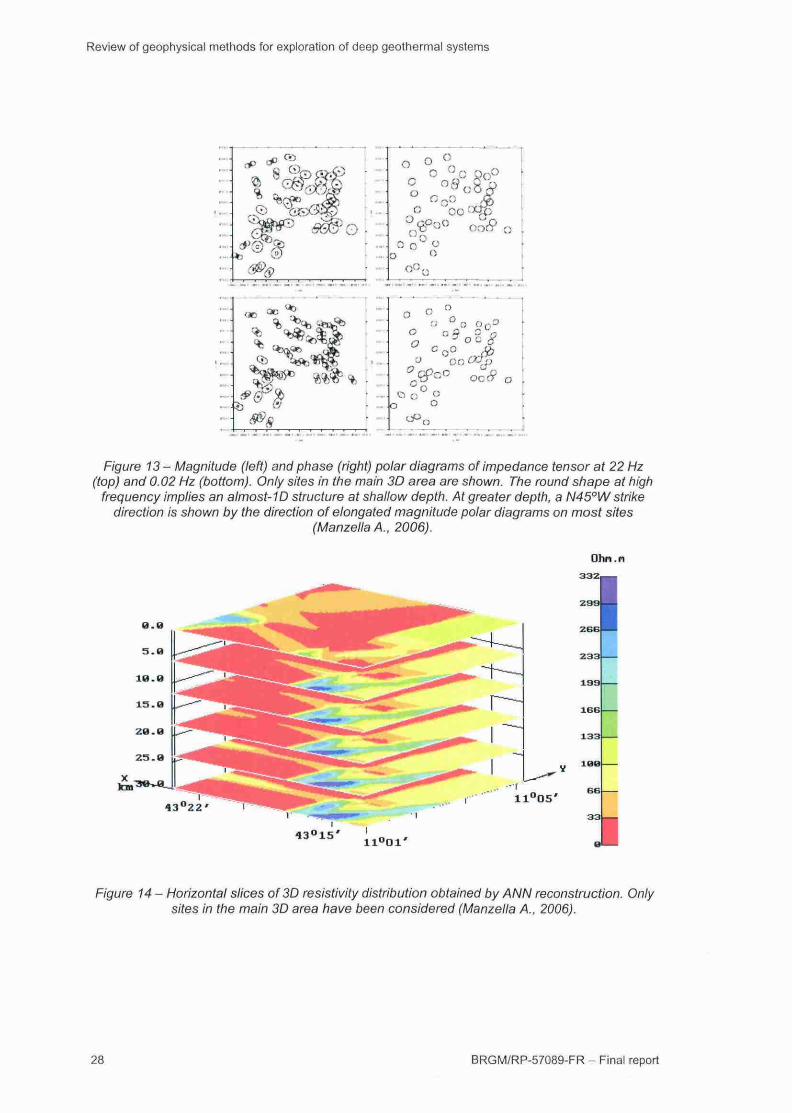
Magnitude and phase polar diagrams of the MT impedance tensor calculated in theTravale area (Manzella et al., 2006) show a main regional strike of 45° for the lowestfrequency (Figure 13, top) which follows the main NW-SE regional structural trend. Thehighest frequencies conversely show isotrope figures corresponding to an almost 1Dstructure at shallow depth (Figure 13, bottom).
Figure 11 - Location of 1992 MT survey (MT stations as black dots, left), of the remotereference in Capraia island (right) and boundary of the Travale area (red rectangle) (Bertani et
at., 2006).
28 BRGM/RP-57089-FR - Final report
Review of geophysical methods for exploration of deep geothermal systems
Neural network inversion (ANN, Spichak and Popova, 2000) of MT data was carriedout in order to obtain an idea about the 3D resistivity distribution in the studied area(Manzella et al., 2006). In spite of the rather smooth character of the resistivitydistribution caused by using determinant resistivity, Figure 14 shows that the studiedarea is generally very conductive, particularly at the north margins. This preliminaryresult should be further refined using other inversion methods and trying to take inaccount geological constraints.
TE- and TM-mode 2D inversion using an a priori model based on geology showsvarious features in agreement with known geological and geothermal characteristics(Figure 15). The high angle outcropping conductive anomaly extending from surface tothe deep conductive substratum coincides with the location of a regional mineralizedfault that testifies to the occurrence of past or present intense circulation ofhydrothermal fluids. In the middle of the section, low-resistivity anomalies within theresistive basement at a depth of 1.5 to 3 km b.s.l. correlate with the flattening of faultsinferred from seismic data. At station G2, the resistivity minimum corresponds to adeep fractured and highly productive zone in metamorphic rock reported by Bertani etal., (2005) at 1.8 km depth in well MN1, which is also revealed by seismics andassimilated to the H reflector.
43" 16 00
43°070010"
en
i
2
1
4
55 00"
V
\
5
6
7
*
O
BB
1013) TjKJn Carpís ï. Li'n T> .ass.;- Ea'V Mtacens sed
te. (4) Tjs;an Car-^'cx. 'sie Tr ass : basa cvapo'fle. (5)ppiy (m a.s.i.); [6¡ Torrea lajiB. (7) -rvwra^ed naf-jf burs.
.(10| TDEMsies.
Figure 12 - Location of the 2004 MT survey (MT stations as black triangles, left), of the remotereference in Sardinia (right), and of the boundary of the Larderello area (red rectangle)
(Manzella A., 2006).
BRGM/RP-57089-FR - Final report 27
Review of geophysical methods for exploration of deep geothermal systems
oco
:5í9ÜOfT O
Figure 13 - Magnitude (left) and phase (right) polar diagrams of impedance tensor at 22 Hz(top) and 0.02 Hz (bottom). Only sites in the main 3D area are shown. The round shape at high
frequency implies an almost-1D structure at shallow depth. At greater depth, a N45°W strikedirection is shown by the direction of elongated magnitude polar diagrams on most sites
(ManzellaA., 2006).
Figure 14 - Horizontal slices of 3D resistivity distribution obtained by ANN reconstruction. Onlysites in the main 3D area have been considered (Manzella A., 2006).
BRGM/RP-57089-FR - Final report

Review of geophysical methods for exploration of deep geothermal systems
Figure 15- Resistivity cross-section overlapped by the geological model (Manzella A., 2006).
The cause of the low resistivity (<100 ohm.m) observed at great depth below the Khorizon (Figure 15) is not understood. The rock matrix should not cause a strongvariation since gneiss and granite resistivities are similar and the geothermal fluid,which is defined as superheated steam, is assumed to be resistant and thus should notcontribute to a resistivity reduction. Moreover, due to the low rock permeability,geothermal fluid circulation in the reservoir host formations is not expected to produce,or have produced, widespread alteration and a significant contribution of veryconductive clay is not expected. A bulk resistivity of many thousands of ohm.m isexpected on the basis of laboratory data, even accounting for the very hightemperarure and pressure conditions (Manzella A., 2004; Manzella et al., 2006).
Experimental analyses of electrical behaviour under reservoir conditions on drill coresunder well-defined laboratory conditions, and studies of rock properties under realreservoir conditions from borehole measurements, could serve as models in order toobtain a better understanding of the in situ phenomena, and provide useful guidelinesand constraints for the interpretation of surface MT measurements.
Passive seismics
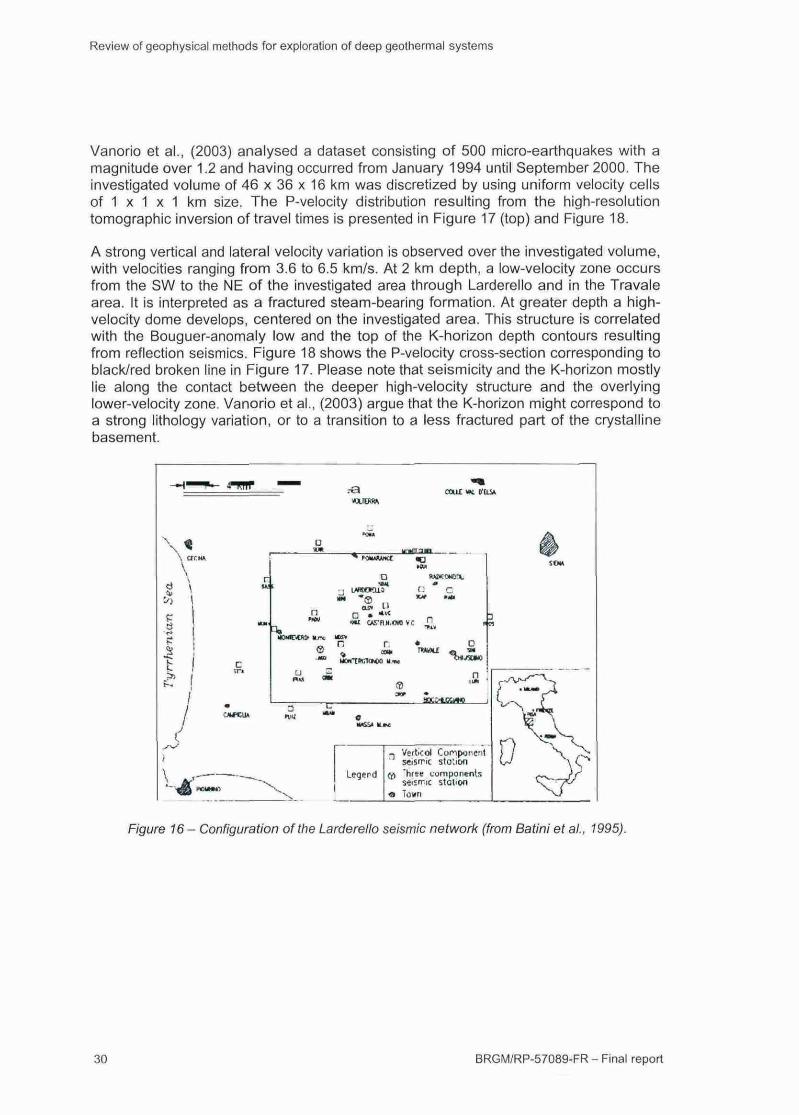
Since 1977, the seismic activity of the Larederello-Travale field is monitored by apermanent seismic network consisting of 26 stations operated by Enel Green Power.
BRGM/RP-57089-FR - Final report
Review of geophysical methods for exploration of deep geothermal systems
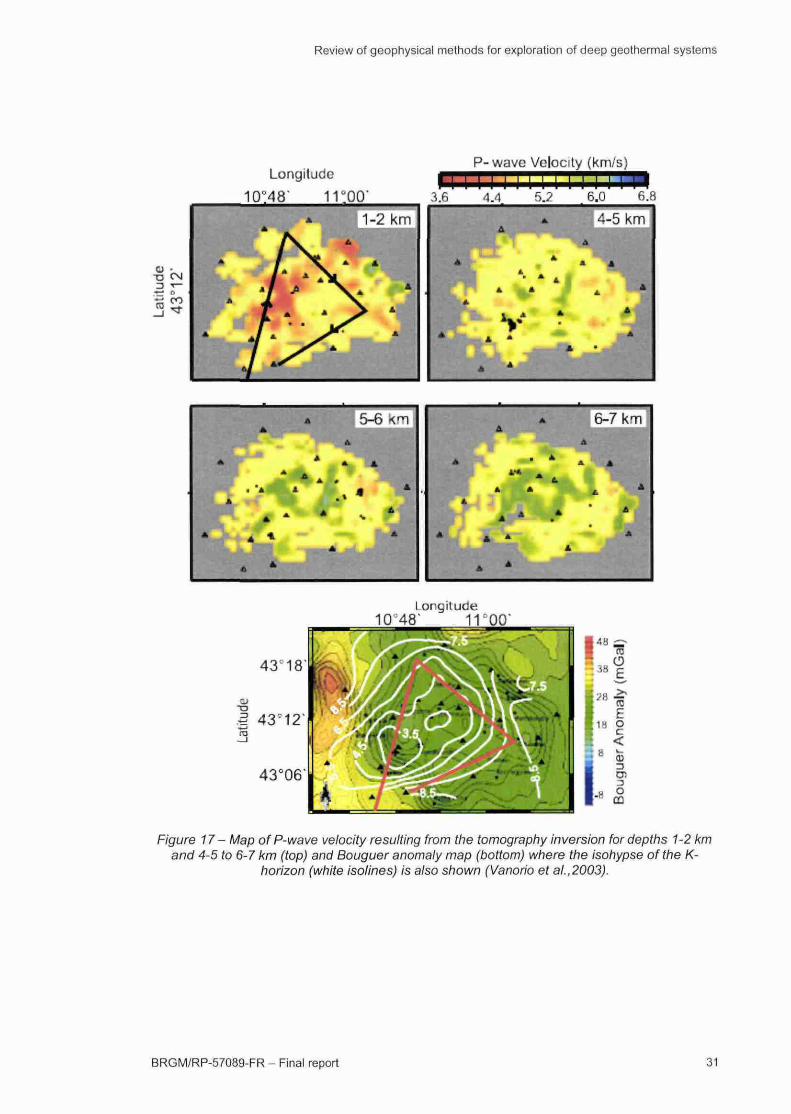
Vanorio et al., (2003) analysed a dataset consisting of 500 micro-earthquakes with amagnitude over 1.2 and having occurred from January 1994 until September 2000. Theinvestigated volume of 46 x 36 x 16 km was discretized by using uniform velocity cellsof 1 x 1 x 1 km size. The P-velocity distribution resulting from the high-resolutiontomographic inversion of travel times is presented in Figure 17 (top) and Figure 18.
A strong vertical and lateral velocity variation is observed over the investigated volume,with velocities ranging from 3.6 to 6.5 km/s. At 2 km depth, a low-velocity zone occursfrom the SW to the NE of the investigated area through Larderello and in the Travalearea. It is interpreted as a fractured steam-bearing formation. At greater depth a high-velocity dome develops, centered on the investigated area. This structure is correlatedwith the Bouguer-anomaly low and the top of the K-horizon depth contours resultingfrom reflection seismics. Figure 18 shows the P-velocity cross-section corresponding toblack/red broken line in Figure 17. Please note that seismicity and the K-horizon mostlylie along the contact between the deeper high-velocity structure and the overlyinglower-velocity zone. Vanorio et al., (2003) argue that the K-horizon might correspond toa strong lithology variation, or to a transition to a less fractured part of the crystallinebasement.
OXII <*i D'ELiA
\\ CfC»t*
<3 \
Si \
i !
rIK :
•swD
•a«
n»I'M
©
WU CAE'flM.iMl VC
r. *
\ ^ - Legend
p1 seisrric sto'.ionM "hree components
seisn-.ic sloüon« Túwn
c~¿Ü N
Figure 16 - Configuration of the Larderello seismic network (from Batini et al,, 1995).
30 BRGM/RP-57089-FR - Final report
Review of geophysical methods for exploration of deep geothermal systems
TO
Longitude
10*48" 11!00"
P-wavc Velocity (km/s)
3.G •3.7 6.0 G.R
* V J * *
5-6 6-7 km
fc"4
ft *
r
ZJ
S
43°
43V
43°
18'lfea-
12-PSS
I-
10
Ij
48
I
ongitude11
i ' •» , • • . - - r
w
il vjÉ -
^[48 ^
OSH
/¿Ü
3Oí
O
Figure 17 - Map of P-wave velocity resulting from the tomography inversion for depths 1-2 kmand 4-5 to 6-7 km (top) and Bouguer anomaly map (bottom) where the Isohypse of the K-
horizon (white isolines) is also shown (Vanorio et al.,2003).
BRGM/RP-57089-FR - Final report 31
Review of geophysical methods for exploration of deep geothermal systems
Figure 18- P-wave velocity cross-sections along the red line in Figure 11. Dots and the whiteline represent earthquake locations and the K horizon, respectively (Vanorio et al., 2003).
These results might seem to contradict previous results by Batini et al., (1995). Theyused: i) inversion of teleseismic travel-time residuals (101 teleseismic earthquakes andnuclear explosions recorded in the period 1985-1988), and ii) a joint hypocenter -velocity inversion of local earthquake-arrival times (269 events). Both methods used byBatini etal., produced, as a main result, low P-velocity anomalies that develop between7 and 20 km depth. Similar attempts were made to compare them with the gravityanomaly low and the K-horizon depth. The deep low-velocity anomaly of Batini et al.,(1995) is however located at greater depth than the high-velocity anomaly of Vanorio etal., (2003) which is at 5-7 km depth. The latter could thus correspond to the highvelocities seen at 4 km depth in Figure 19.
Moreover, one should also note that the shape and location of the low-velocity zonedefined at 10 km depth by Batini et al 1995 are amazingly similar to those of the low-velocity zone defined by Vanorio et al., (2003) at 1-2 km depth (Figure 17 and Figure19).
Well logging
As shown by its application in well SESTA6 Bis A, (Batini and al., 2002), ENEL GreenPower has a specific method applied to a proper reconstruction of faults and fracturesystems intersected by drilling. This method (see 3.6.) is based on conventional well-logging as well as on innovative tools such as Circumferential Borehole Imaging Logs(CBIL).
The final target is the determination of reliable correlations between physicalcharacteristics of the fractures and their nature, attitude and productivity. For thispurpose, temperature and pressure (T&P) logs measured during drawdown, injectionand production tests are compared with the well-logging approach.
At SESTA6 Bis A, six depth intervals were preliminary identified by means of the fieldfracture detection based on conventional well-logging analysis (Figure 20). The CBILanalysis allows identifying the different types of fractures and determining of theirgeometrical parameters (Figure 21).
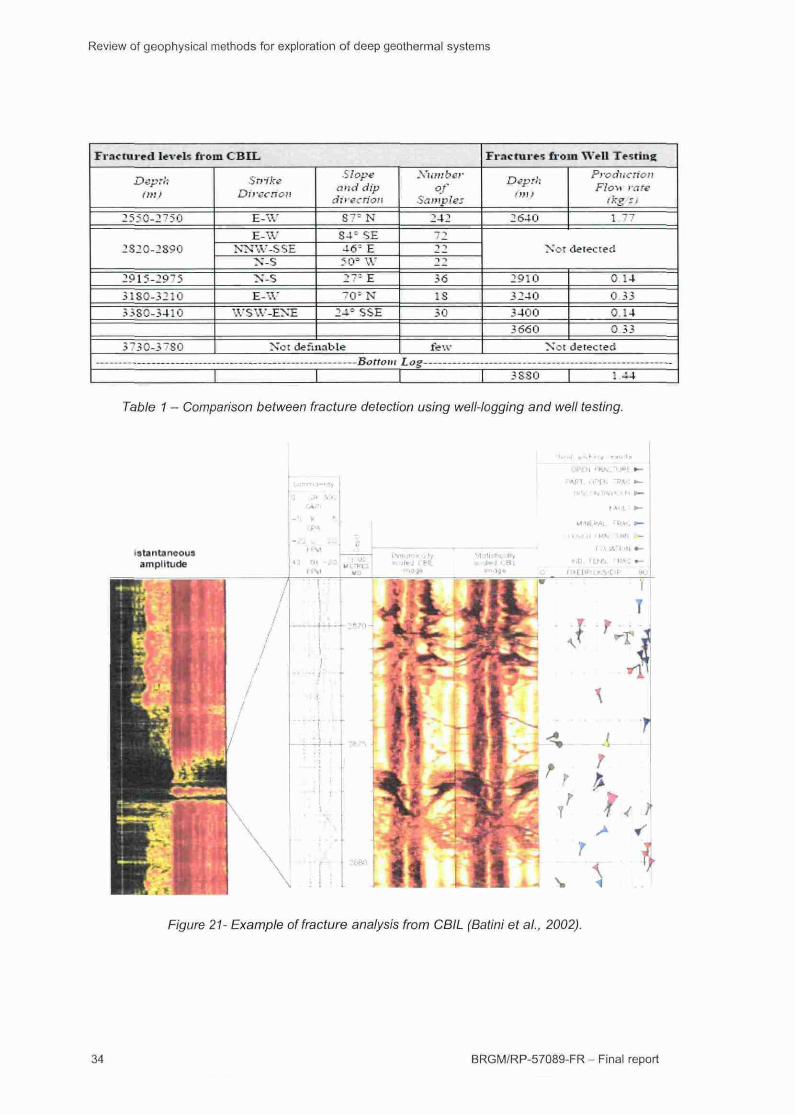
A comparison between the fractures detected by geophysical logs and well testing isgiven in Table 1. There is quite a correspondence with fractures detected by well
32 BRGM/RP-57089-FR - Final report
Review of geophysical methods for exploration of deep geothermäl systems
testing in four out of six intervals characterized by geophysical fracture signatures.Although the deepest productive zone at 3880 m is not investigated by CBIL, the levelswith higher productivity (1.77 and 0.33 kg/s) are associated with sub-vertical fractures(inclination of 70-87°) with an E-W strike direction and northerly dip.
X f l
V. — 1 < ) K 111
Figure 19 - 3D P-wave velocivty structures from local earthquake inversion (high velocity inblue, low velocity in red, Batini et al., 1995).
BOREHOLE TOTAL DENSILOG ACOUST1LOG ACOUSTIC ELASTiC FRACT. INSTANTANEOUSÛCUMETRT L>R V5 * Vr vr i VO IMrCDANCC PARAM TOUOII. AHPUTUDC
Figure 20 - Example of fracture signatures from a geophysical log (Batini et al., 2002).
BRGM/RP-57089-FR - Final report
Review of geophysical methods for exploration of deep geothermal systems
Fractured levels from CBIL
Deprhfnif
25?G-J7?0
2S2O-2S9O
2?l?-29^551S0-32IÜ35SO-541O
3730-37S0
StiikeDirection
E - W
E-'.YNNW-SSE
N - S
X - S
E - W
WSW-ENE
Slopea*ici dip
direction
S7 r N
S4C SE46 = E? 0 ; W2 T T E
"0-" N
:-= sSE
Not definable___ Bottom
Xumberof
S<.-»w!es
242
-: ^
56IS
50
f e w
Los
Fracture« from Well Testing
Deprh
2640
ProdiiCTtonFIOM rare
'kg - •
1 77
"NOT detected
2 910
5 240
34003 660
0 :40 330.140 33
Not detected
3 SSO : -¿4
Table 1 - Comparison between fracture detection using well-logging and well testing.
Figure 21- Example of fracture analysis from CBIL (Batini et al., 2002).
34 BRGM/RP-57089-FR - Final report
Review of geophysical methods for exploration of deep geothermal systems
2.2. GROSS SCHÖNEBECK
2.2.1. From gas exploration to geothermal test site
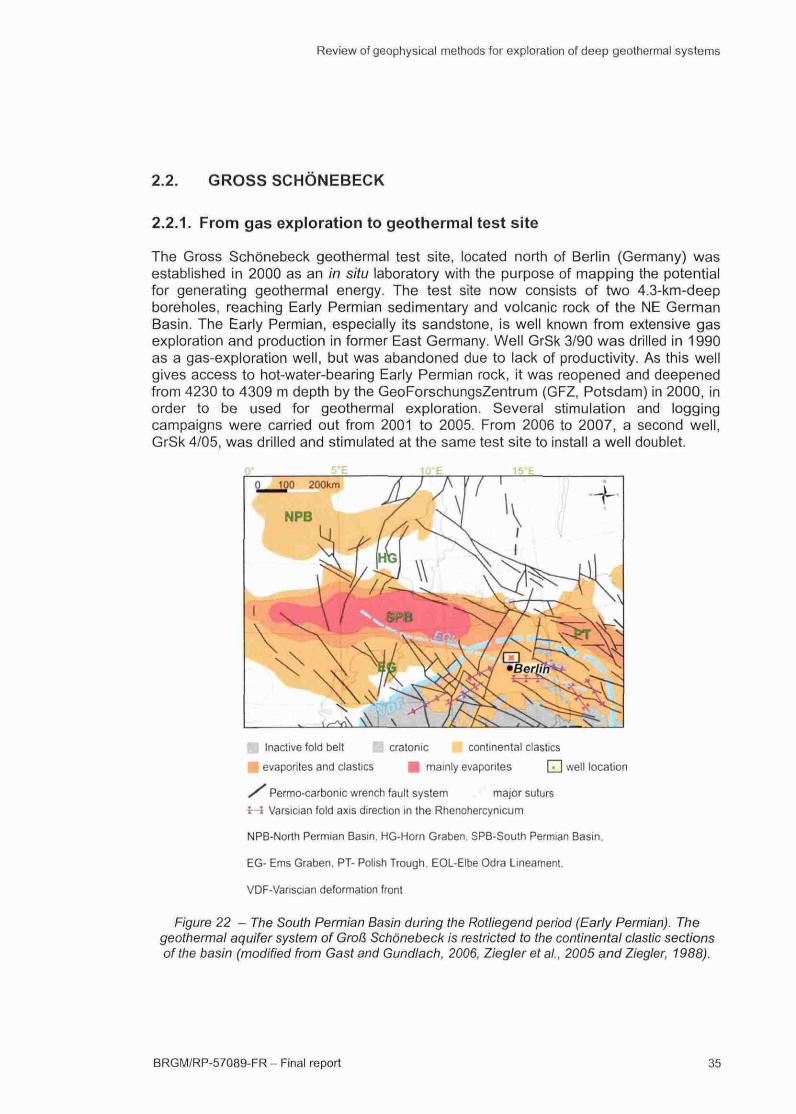
The Gross Schönebeck geothermal test site, located north of Berlin (Germany) wasestablished in 2000 as an in situ laboratory with the purpose of mapping the potentialfor generating geothermal energy. The test site now consists of two 4.3-km-deepboreholes, reaching Early Permian sedimentary and volcanic rock of the NE GermanBasin. The Early Permian, especially its sandstone, is well known from extensive gasexploration and production in former East Germany. Well GrSk 3/90 was drilled in 1990as a gas-exploration well, but was abandoned due to lack of productivity. As this wellgives access to hot-water-bearing Early Permian rock, it was reopened and deepenedfrom 4230 to 4309 m depth by the GeoForschungsZentrum {GFZ, Potsdam) in 2000, inorder to be used for geothermal exploration. Several stimulation and loggingcampaigns were carried out from 2001 to 2005. From 2006 to 2007, a second well,GrSk 4/05, was drilled and stimulated at the same test site to install a well doublet.
f y Inactive fold belt cratonic continental elastics
• evaporites and elastics • mainly evapontes GD well location
/ ^ Permo-carbonic wrench fault system major suturs
í—ï Varsician fold axis direction in the Rhenohercynicum
NPB-North Permian Basin, HG-Horn Graben. SPB-South Permian Basin,
EG- Ems Graben, PT- Polish Trough, EOL-Elbe Odra Lineament,
VDF-Variscian deformation front
Figure 22 - The South Permian Basin during the Rotliegend period (Early Permian). Thegeothermal aquifer system of Groß Schönebeck is restricted to the continental clastic sectionsofthebasin (modified from Gast and Gundlach, 2006, Ziegler et al., 2005 and Ziegler, 1988).
BRGM/RP-57089-FR - Final report 35
Review of geophysical methods for exploration of deep geothermal systems
2.2.2. Geological and geothermal setting
The geothermal reservoir of Gross Schonebeck is located in the Eariy PermianRotliegend strata at the southeastern periphery of the northeastern German Basin(NEGB). It is a low-enthalpy reservoir with an average temperature of 150 °C at4100 m depth. The NEGB is part ofthe South Permian Basin (Figure 22), an extensivebasin system that extends from the North Sea to Poland. The South Permian Basinwas generated in the post-collisional phase of the Variscan orogeny due to wrenchtectonics and following thermal subsidence. It is bounded by the Baltic Shield to thenorth and by the Variscan fold belt to the south. The Variscan orogeny in the area ofthe NEGB was characterized by NW-SE and NNE-SSW trending faults. This neariyorthogonal fault system was reactivated by the initial basin formation that occurredbetween Late Carboniferous and Early Permian times. The NW-SE trending faults werereactivated as partly deep-reaching strike-slip faults with a transtensional componentdue to wrench tectonics (Baltrusch and Klarner, 1993). Graben structures were createdalong the NNE-SSW fault direction, and some NE-SW trending faults represent deepreaching normal-fault sets (Baltrusch and Klarner, 1993). The eariy basin extensionphase was accompanied by the deposition of extrusive volcanic rocks of the Lower
Rotliegend, subsequently covered by Upper Rotliegend siliciclastic deposits of alluvialfans, ephemeral stream and playa deposits, with interbedded eolian sands (Rieke etal., 2001).
The Rotliegend comprises upward-fining siliciclastic rocks generally underiain byandesitic rock. The lateral extension of the Lower Rotliegend volcanic rocks isrestricted to paleomorphological lows and fault zones. The first siliciclastic rocksfollowing above the volcanics are late Lower Rotliegend conglomerates restricted tofootwall areas of NW-SE trending paleomorphological ridges. The first UpperRotliegend rocks are clean sandstone of the lower Dethlingen Formation. Thesemedium-to-flne-grained rocks form the geothermal aquifer with an effective thickness of50-70 m (Figure 23). The sandstone was deposited in braided river systems located atthe southern edge of the North German Basin. After erosional flattening of the basinridges and thermal subsidence of the basin in general, silt and claystone withinterbedded bar sands covered the fluvial sandstones.
Thick cyclic evaporites and carbonates were deposited during the marine transgressionof the Zechstein (Late Permian). The Zechstein evaporites are followed by thickMesozoic and Cenozoic terrestrial and marine sediments (Moeck et al., 2007). Due totheir plasticity, the Late Permian evaporites show a changing thickness rangingbetween 0 and 1600 m, resulting in the typical salt tectonics and anti- and synforms ofthe overburden rock. During the Alpine phase, some Rotliegend faults and saltrockmovements were reactivated.
The reservoir fluid within the 4100 m deep Rotliegend sandstones is characterized by ahigh salinity of 265 g/l TDS (Total Dissolved Solids), by a temperature of 148-154 °Cand a high content of heavy metals such as iron and lead (Giese et al., 2001). The fluidis of a Ca-Na-CI-type and has an average redox potential of +50 mV. The formationpressure of 430 bars is nearly hydrostatic. The in situ stress field is determined by leak-off tests, during hydraulic stimulation and analysis of borehole breakouts (Moeck et al..
36 BRGM/RP-57089-FR - Final report
Review of geophysical methods for exploration of deep geothermal systems
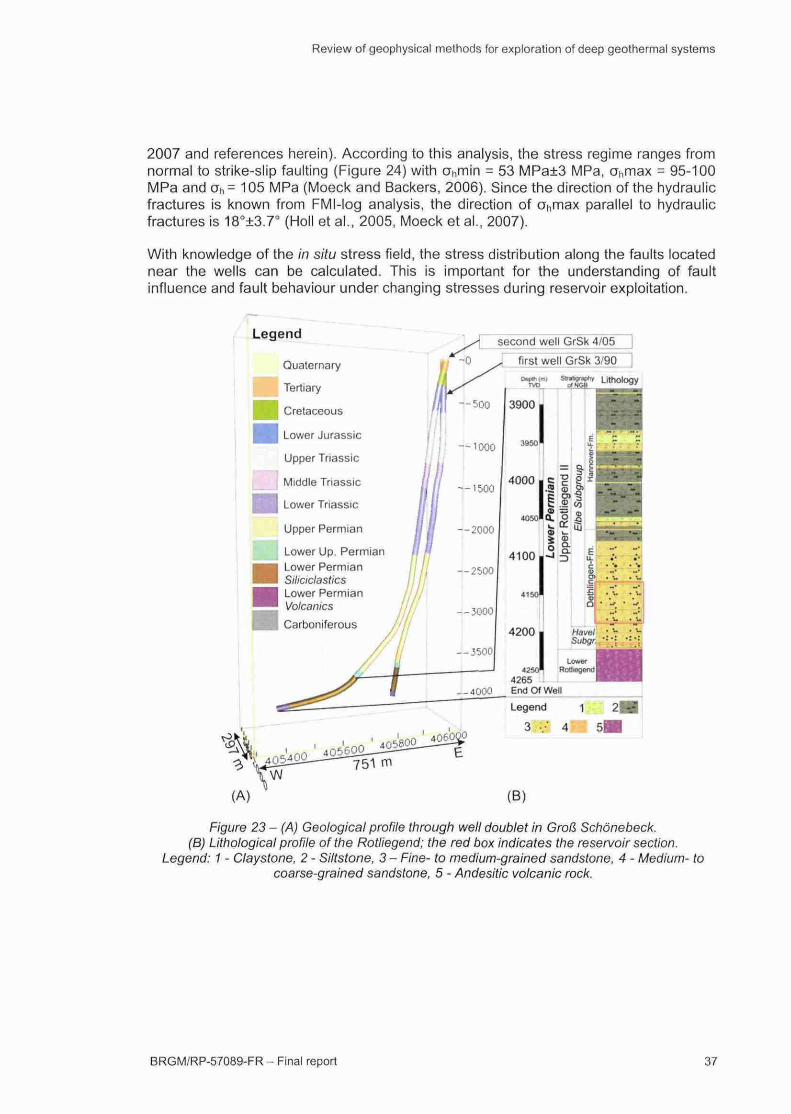
2007 and references herein). According to this analysis, the stress regime ranges fromnormal to strike-slip faulting (Figure 24) with ahmin = 53 MPa±3 MPa, ahmax = 95-100MPa and ah= 105 MPa (Moeck and Backers, 2006). Since the direction of the hydraulicfractures is known from FMI-log analysis, the direction of ahmax parallel to hydraulicfractures is 18°±3.7° (Holl et al., 2005, Moeck et al., 2007).
With knowledge of the in situ stress field, the stress distribution along the faults locatednear the wells can be calculated. This is important for the understanding of faultinfluence and fault behaviour under changing stresses during reservoir exploitation.
Legend
Quaternary
Tertiary
Cretaceous
Lower Jurassic
Upper Triassic
Middle Triassic
Lower Triassic
second well GrSk 4/05
first well GrSk ZI9ÖJ
Upper Permian
Lower Up. PermianLower PermianSiliaclasticsLower PermianVolcantes
Carboniferous
Lithology
3900
3950
4000
4100
4150'
4200
• • > . . •
• *v
• •* ** -3 -
•*
Legend
3 •-• 4
I tó 21
(B)
Figure 23 - (A) Geological profile through well doublet in Groß Schönebeck.(B) Lithological profile of the Rotliegend; the red box indicates the reservoir section.
Legend: 1 - Claystone, 2 - SHtstone, 3 - Fine- to medium-grained sandstone, 4 - Medium- tocoarse-grained sandstone, 5 - Andesitic volcanic rock.
BRGM/RP-57089-FR - Final report 37
Review of geophysical methods for exploration of deep geothermal systems
Normal faulting stress regime: SHmax/SV=0.78, Shm/n/SV=0.55
.354
Transition normal-strike slip faulting: SHmax/SV=1.0, Shm/n/SV=0.55
.343
,309
0.274
0.240
•0.172It 0.137
• o , 0.103
0.069
.034
10.000
Well GrSk 3/90
'*ê 3900rr4000m
4100m
\
Strike slip faulting: SHmax/SV=2.1, Shm/n/SV=0.79
692
0.623
0.553
0.000
0.415
0.346
0.277
0.208
0.136
0 069
o.ooo
Well GrSk 3/90
\
Figure 24 - Slip tendency plot for the four fault planes that surround the geothermal well GrSk3/90. On the left, the different fault planes (numbered 1 to 4) are shown as poles in the lower
hemisphere projection. On the right, the spatial extension of the fault system and the sliptendency along the faults are visualized in the 3D fault model. The slip tendency for a given fault
pole is indicated on the colour scale, where red indicates a relatively high slip tendency andblue a relatively low slip tendency (Moeck et al., 2007).
38 BRGM/RP-57089-FR - Final report
Review of geophysical methods for exploration of deep geothermal systems
2.2.3. Geophysical case history
Reprocessing of pre-existing 2D seismic data (kindly provided by Erdöl Erdgas GmbH),well log interpretation, and 3D geological model construction, were integrated toprovide spatial relationships and to assess both reservoir volumes and permeabilitydistribution.
Some MT measurement campaigns and microseismic recordings during hydraulicstimulation of GrSk 3/90 in 2003 resulted in unsatisfactory data quality. Somemicroseismicity was recorded in 2007 during stimulation of the new well GrSk 4/05.
Reprocessing of 2D seismic data and interpretation concept
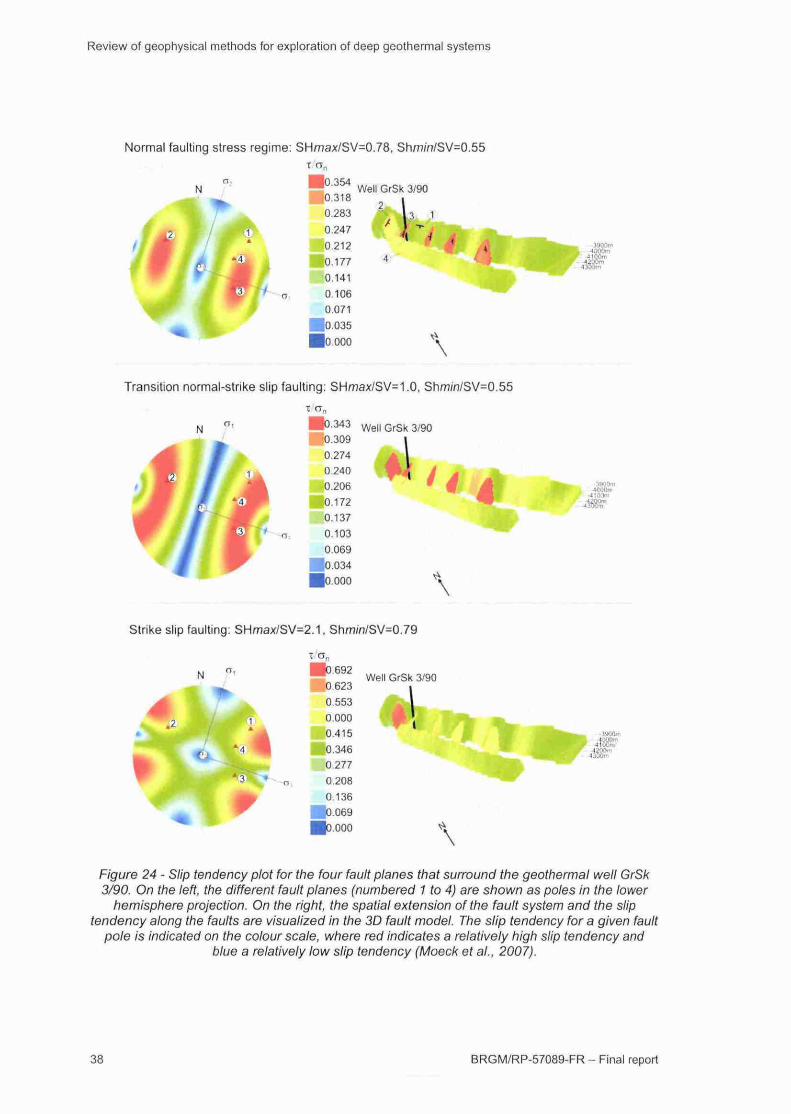
Six pre-existing standard industrial reflection-seismics profiles collected from 1984-1988, were used for estimating local fault systems or irregularities in the horizoncorrelation of the subsalinar (i.e. below the Zechstein). The seismic sections, with atotal length of 138 km, are located near the in-situ laboratory well Groß Schönebeck3/90 (Figure 25). The earlier derived interpretation of the seismic sections provided noevidence for fault systems (König and Meyer 1988, Piske et al., 1992). The goal of thereprocessing was the identification of fault zones using new capabilities of modernsoftware packages.
13D30' 13M 13" 50'
52'60'
52°58'<
52" 56'
Grüneberg
52 "521
Eberswalde-. Finow '
Tuchen
geothermal research well well location 2D seismic line
Figure 25 - Basemap of the re-processed 2D seismic sections around the Groß Schönebecktest site
BRGM/RP-57089-FR - Final report
Review of geophysical methods for exploration of deep geothermal systems
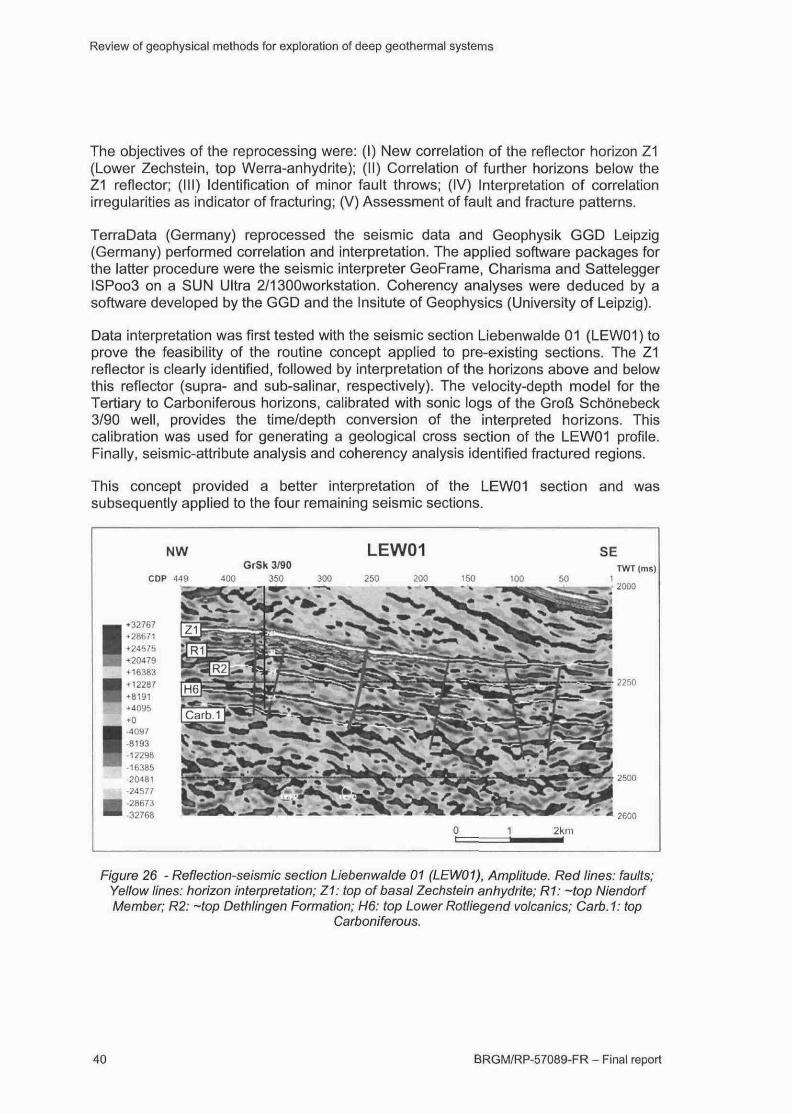
The objectives of the reprocessing were: (I) New correlation of the reflector horizon Z1(Lower Zechstein, top Werra-anhydrite); (II) Correlation of further horizons below theZ1 reflector; (III) Identification of minor fault throws; (IV) Interpretation of correlationirregularities as indicator of fracturing; (V) Assessment of fault and fracture patterns.
TerraData (Germany) reprocessed the seismic data and Geophysik GGD Leipzig(Germany) performed correlation and interpretation. The applied software packages forthe latter procedure were the seismic interpreter GeoFrame, Charisma and SatteleggerISPoo3 on a SUN Ultra 2/1300workstation. Coherency analyses were deduced by asoftware developed by the GGD and the Insitute of Geophysics (University of Leipzig).
Data interpretation was first tested with the seismic section Liebenwalde 01 (LEW01) toprove the feasibility of the routine concept applied to pre-existing sections. The Z1reflector is clearly identified, followed by interpretation of the horizons above and belowthis reflector (supra- and sub-salinar, respectively). The velocity-depth model for theTertiary to Carboniferous horizons, calibrated with sonic logs of the Groß Schönebeck3/90 well, provides the time/depth conversion of the interpreted horizons. Thiscalibration was used for generating a geological cross section of the LEW01 profile.Finally, seismic-attribute analysis and coherency analysis identified fractured regions.
This concept provided a better interpretation of the LEW01 section and wassubsequently applied to the four remaining seismic sections.
TWT(ms)
2000
2250
2600
Figure 26 - Reflection-seismic section Liebenwalde 01 (LEW01), Amplitude. Red lines: faults;Yellow lines: horizon interpretation; 11: top of basal Zechstein anhydrite; R1: -top NiendorfMember; R2: -top Dethlingen Formation; H6: top Lower Rotliegend volcanics; Carb. 1: top
Carboniferous.
40 BRGM/RP-57089-FR - Final report
Review of geophysical methods for exploration of deep geöthermal systems
The high signal-to-noise ratio of the dataset of the LEW 01 section and thepredominant frequencies of 30-35 Hz allowed resolution of layers thicker than 30 mafter reprocessing. Multiple reflections from the Zechstein evaporites interfere with theseismic signals of the Rotliegend strata below, particulary in the southeast of thesection (Figure 26). After careful filtering of the Zechstein signals, normal faults and twosmall graben structures were identified in the Rotliegend.
Well logging
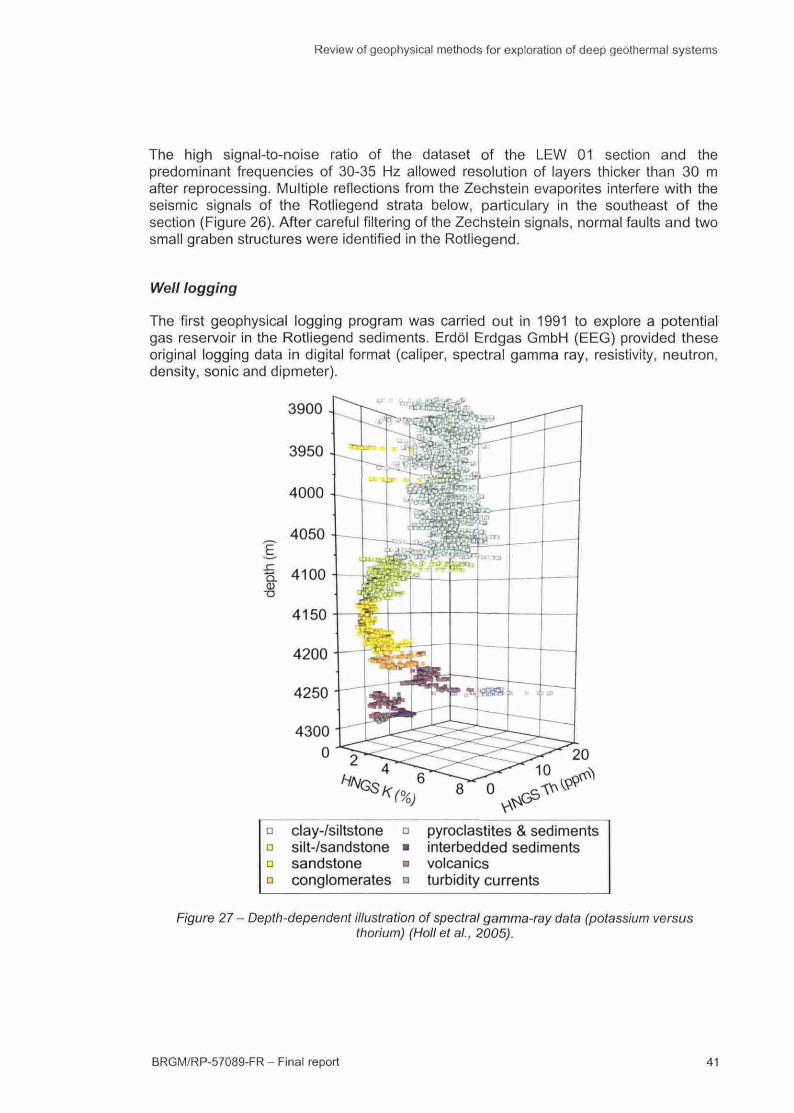
The first geophysical logging program was carried out in 1991 to explore a potentialgas reservoir in the Rotliegend sediments. Erdöl Erdgas GmbH (EEG) provided theseoriginal logging data in digital format (caliper, spectral gamma ray, resistivity, neutron,density, sonic and dipmeter).
3900 -
Q.0)•o
•D
••
clay-/siltstonesilt-/sandstonesandstoneconglomerates
o•D
a
pyroclastites & sedimentsinterbedded sedimentsvolcanicsturbidity currents
Figure 27 - Depth-dependent illustration of spectral gamma-ray data (potassium versusthorium) (Holletal., 2005).
BRGM/RP-57089-FR - Final report 41
Review of geophysical methods for exploration of deep geothermal systems
The (GFZ) logging operations implementing caliper, electric, spectral gamma ray,resistivity and acoustic measurements were performed by the Operational SupportGroup of the GFZ. An acoustic borehole televiewer (ABF14) was used fordetermination of structural features and fracture detection.
The last logging campaign by Schlumberger in winter 2003 provided microresistivity
formation images (Fullbore Formation Micro Imager, FMI, Schlumberger trademark) ofhigher quality for fracture detection than the ABF14. FMI data are also used for
analysis of sedimentary structures (paleocurrent directions on trough and tabular cross-bedded sets). Reservoir Saturafion Tool logs (RST, Schlumberger trademark) alloweda quantitative lithological interpretation based on elemental concentrationmeasurements.
Figure 27 depicts spectral gamma-ray data (potassium versus thorium as a function ofdepth). The volcanic sucession of the Lower Rotliegend consists of two magmafic rocktypes as described by Benek et al., (1996) in the NEGB. The upper series showshigher thorium contents than the lower series. The former are probably more stronglydifferentiated with a trachy-dacitic or -andesitic character. The geochemical propertiesof the lower series derive from a more primitive source and are classified as basaltic
andésite. Both volcanic-rock suites are intersected by a cross-bedded tuffaceous ortuffitic layer with thorium contents of up to 20 ppm. Additional interbedded sedimentsconsist of mari, mariy limestone and mudstone, subordinately interbedded by thinanhydritic evaporite layers and interpreted as lacustrine deposits (Holl. et al., 2005).
The potassium and thorium concentration in sandstone and conglomerate of the HavelSubgroup is lower than for the volcanic rocks, which is attributed to the depletion ofmechanically unstable, chemically altered volcanic-rock fragments within fining-upwardcycles. The nearly clean sandstone of the Lower Dethlingen formation (4130 to4175 m, Lower Elbe Subgroup, see also Figure 27) exhibit the lowest potassiumcontent of all siliciclastic sediments because of their low clay content (Holl et al., 2005).
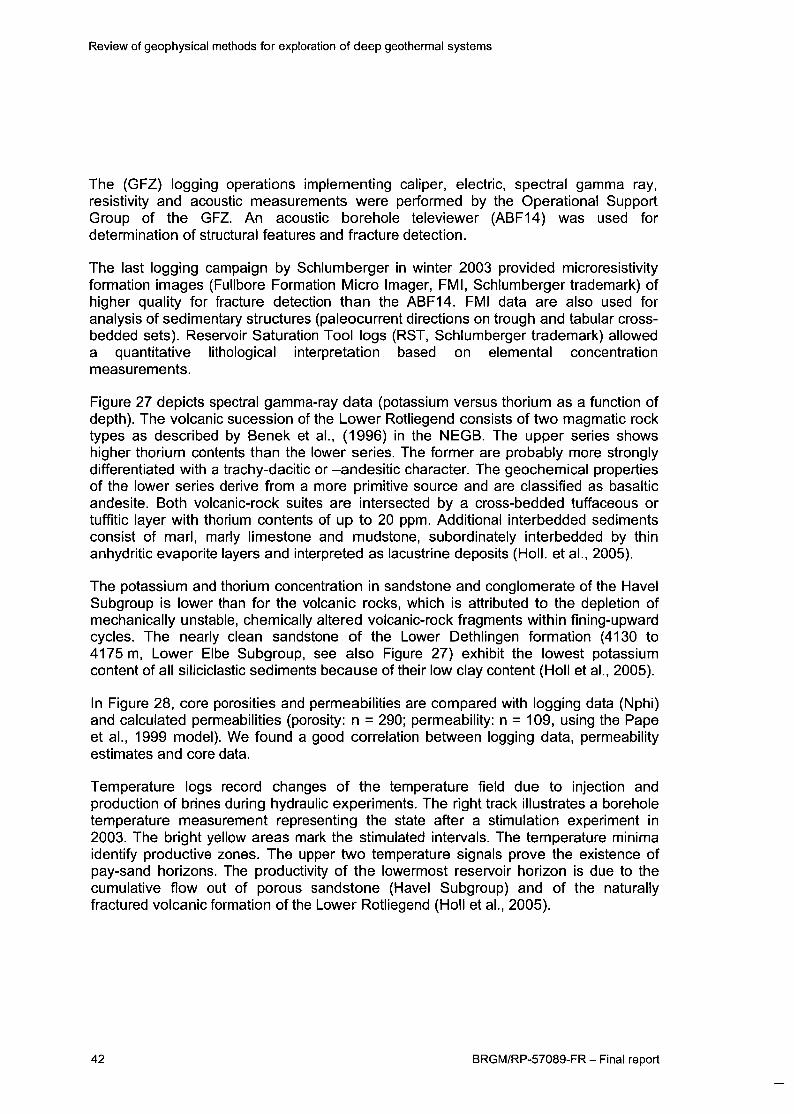
In Figure 28, core porosities and permeabilities are compared with logging data (Nphi)and calculated permeabilities (porosity: n = 290; permeability: n = 109, using the Papeet al., 1999 model). We found a good correlation between logging data, permeabilityestimates and core data.
Temperature logs record changes of the temperature field due to injection andproduction of brines during hydraulic experiments. The right track illustrates a boreholetemperature measurement representing the state after a stimulation experiment in
2003. The bright yellow areas mark the stimulated intervals. The temperature minimaidentify productive zones. The upper two temperature signals prove the existence ofpay-sand horizons. The productivity of the lowermost reservoir horizon is due to thecumulative flow out of porous sandstone (Havel Subgroup) and of the naturallyfractured volcanic formation ofthe Lower Rotliegend (Holl et al., 2005).
42 BRGM/RP-57089-FR - Final report
Review of geophysical methods for exploration of deep geothermal systems
Stratigraphy ' •=• Lithology GR • cale permeability1000 mD 0.001
temperature afterstimula lion
150• core permeability
1000 mD 0.001
Lower «50Rotliegend
Carbonif. 4300
Figure 28 - Comparison of logging data (Nphi) with measured core porosities as well ascalculated permeabilities with core permeabilities (porosity: n - 290; permeability: n= 109). Theright track illustrates a borehole temperature measurement after stimulation. Bright yellow areas
show the stimulated intervals (modified from Holl et al., 2005).
2.2.4. 3D structural geological modelling
Several 3D geological models have been developed to describe the geologicalcharacteristics near the geothermal in-situ laboratory, focusing on the structural patternof the reservoir horizon. The models are based on data from 15 wells, all deeper than4000 m, and the above-mentioned six re-processed 2D seismic sections. The general3D model encompasses an area of 120 krn2 with an elevation from +200 m to -5000 m,including strata from Quaternary to Carboniferous age. It gives an overview of thegeneral geological setting (Figure 29). The fault and horizon surfaces of the 3D modelswere gridded with a two-stage normal minimum tension technique.
BRGM/RP-57089-FR - Final report 43
Review of geophysical methods for exploration of deep geothermal systems
Legend
Cenozoic
| Upper Cretaceous
Cretaceous - J u rassic
Upper Trias sic
Middle Tnassic
! Lower Tnassic
Upper Permian
Lower Up Permian
Hannover Fm.
Delhlingen Fm
Lo Rot I legend Vol carnes
Carboniferous
Fault
Upper Rot I legendSiliaclastics
Figure 29 - Large scale 3D geological model of the Groß Schönebeck area. The yellow tuberepresents well GrSk 3/90.
A further 3D geological model, processed with the same workflow as for the previous3D model, focuses on the reservoir horizon. The model was designed to reveal thegeological characteristics at a depth of 3500 to 4500 m and includes the strata fromPermian salt down to Carboniferous clastic sediment rock. This detailed modelencompasses a detailed fault pattern including the minor faults and thickness variationsof stratigraphie sub-formations within the Rotliegend sediments (Figure 30).
Finally, a 3D lithofacies model was calculated with a 3D minimum tension techniquethat allows the isolation of lithofacies bodies. For this purpose, the 3D grids of fivelithofacies types (clay, silt, fine-grained sand, medium-grained sand, coarse-grainedsand and conglomerate) obtained from the well data (Figure 31) were used.
44 BRGM/RP-57089-FR - Finaf report
Review of geophysical methods for exploration of deep geothermal systems
Zechstein
Basal Zechstein
Upper Hannover Fm
Lower Hannover Fm
Delhlmgen
Havel Group
Volca nies
Pre-Permian
Figure 30 - Vertical sections extracted from the small-scale 3D reservoir model including theoverlaying evapohtic successions (from Moeck et al., 2007)
Lithofacies types
g Siltstone
M Fine grainedoce ^^ • Middle grained Sandstonea.
3 Coarse grained
H Lower Rotliegend Volcanics
H Carboniferous
-4000
Figure 31 - Small-scale lithofacies model of the reservoir encompassing Upper and LowerRotliegend strata (modified from Moeck et al., 2005).
BRGM/RP-57089-FR - Final report
Review of geophysical methods for exploration of deep geothermai systems
2.3. SKIERNIEWICE (from Bujakowski et al., 2007)
Experience from Gross-Schönebeck site shows that the minimum required fluid flow forexploitability is about 50 m3/h. This has guided the choice of the Skierniewice area inPoland. Here, no water flows out of the Rotliegend rocks and the most promisingreservoir corresponds to the Early Triassic Bundsandstein formation at over 4000 mdepth.
2.3.1. Geological and geothermai setting
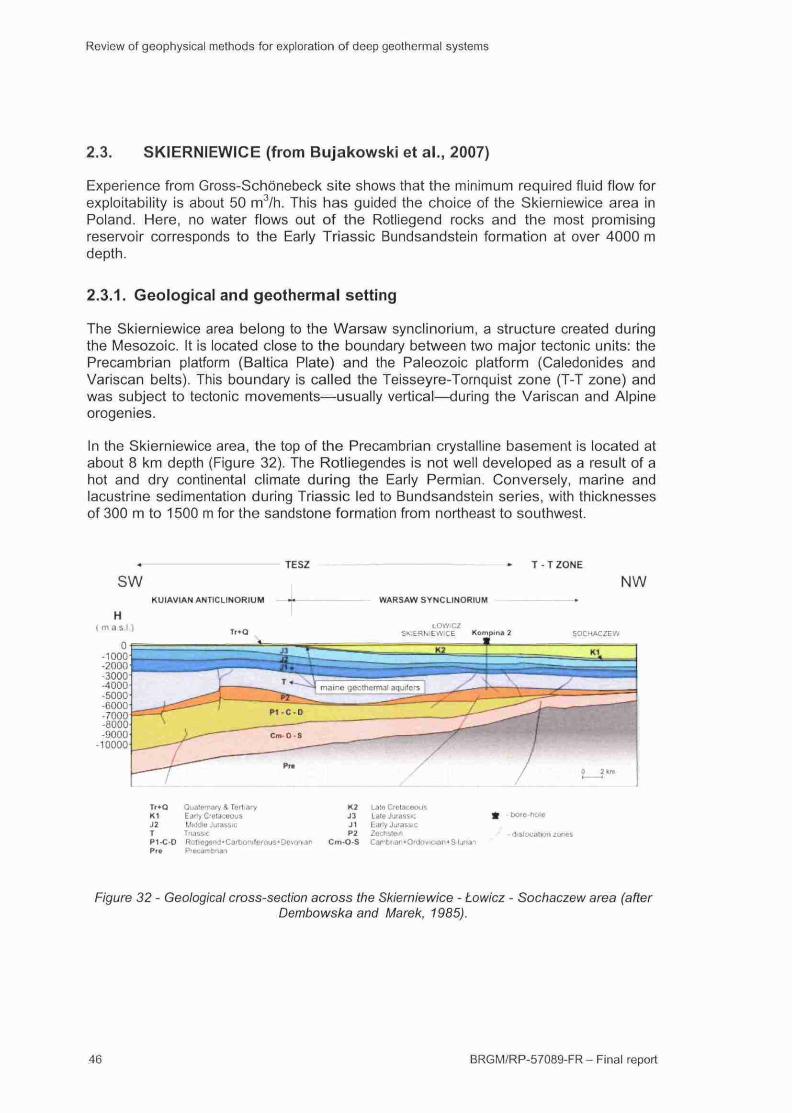
The Skierniewice area belong to the Warsaw synclinorium, a structure created duringthe Mesozoic. It is located close to the boundary between two major tectonic units: thePrecambrian platform (Báltica Plate) and the Paleozoic platform (Caledonides andVariscan belts). This boundary is called the Teisseyre-Tornquist zone (T-T zone) andwas subject to tectonic movements—usually vertical—during the Variscan and Alpineorogenies.
In the Skierniewice area, the top of the Precambrian crystalline basement is located atabout 8 km depth (Figure 32). The Rotliegendes is not well developed as a result of ahot and dry continental climate during the Early Permian. Conversely, marine andlacustrine sedimentation during Triassic led to Bundsandstein series, with thicknessesof 300 m to 1500 m for the sandstone formation from northeast to southwest.
TESZ T - T ZONE
SW NW
Tr+QKlJ2T
Quaiern.Kv A TertiaryEarly CreiacoousMiddle JurassicT'iass.c
K2J3J1P2
Late CretaceousLate JurassicEarly JurassicZochsiein
^ • bore hole
• dislocation ¿on«sP1-C-D Rotiiegond-Carbon ife* aus* Devonian Cm-O-S Cambnan'Ordovician'SilunanPr»
Figure 32 - Geological cross-section across the Skierniewice - towicz - Sochaczew area (afterDembowska and Marek, 1985).
BRGM/RP-57089-FR - Final report
Review of geophysical methods for exploration of deep geothermal systems
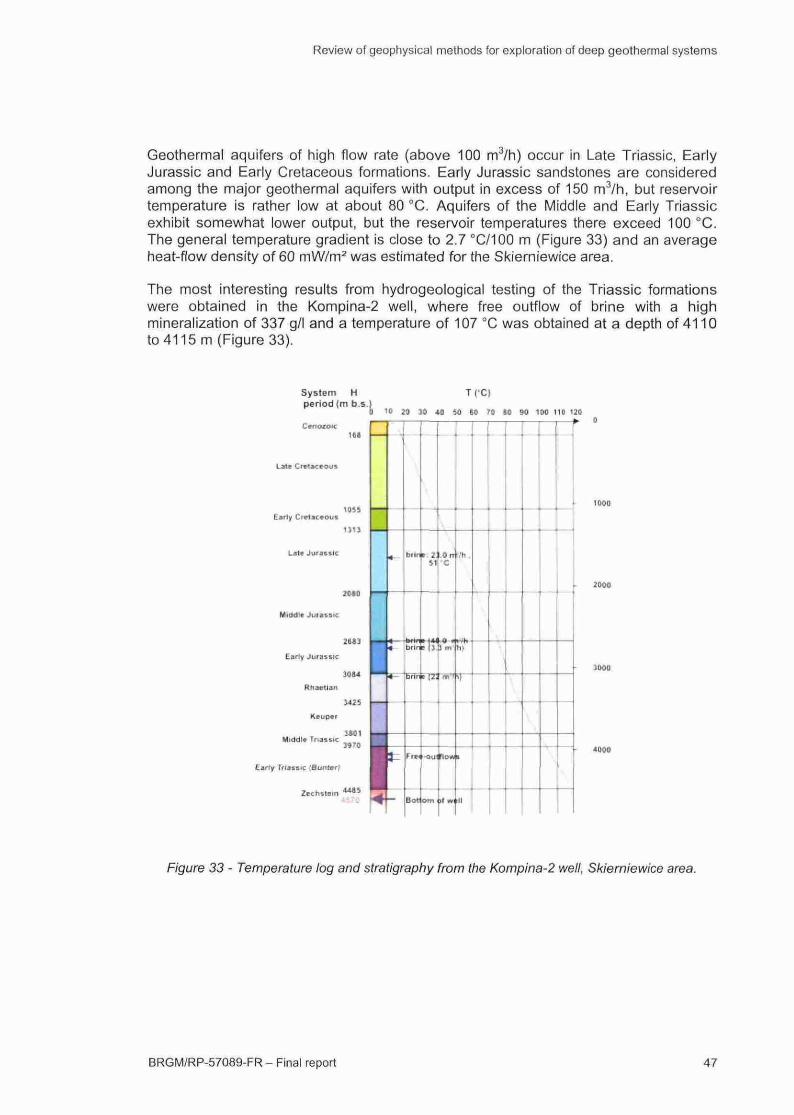
Geothermal aquifers of high flow rate (above 100 m3/h) occur in Late Triassic, EarlyJurassic and Early Cretaceous formations. Early Jurassic sandstones are consideredamong the major geothermal aquifers with output in excess of 150 m3/h, but reservoirtemperature is rather low at about 80 °C. Aquifers of the Middle and Early Triassicexhibit somewhat lower output, but the reservoir temperatures there exceed 100 °C.The general temperature gradient is close to 2.7 °C/100 m (Figure 33) and an averageheat-flow density of 60 mW/m2 was estimated for the Skierniewice area.
The most interesting results from hydrogeological testing of the Triassic formationswere obtained in the Kompina-2 well, where free outflow of brine with a highmineralization of 337 g/l and a temperature of 107 °C was obtained at a depth of 4110to 4115 m (Figure 33).
System Hperiod (m b.s.)
T('C)
o ii> M » 40 M ee TO SO M mo no 120
two
2QO0
ÎQO0
40O0
Figure 33 - Temperature log and stratigraphy from the Kompina-2 well, Skierniewice area.
BRGM/RP-57089-FR - Final report 47
Review of geophysical methods for exploration of deep geothermal systems
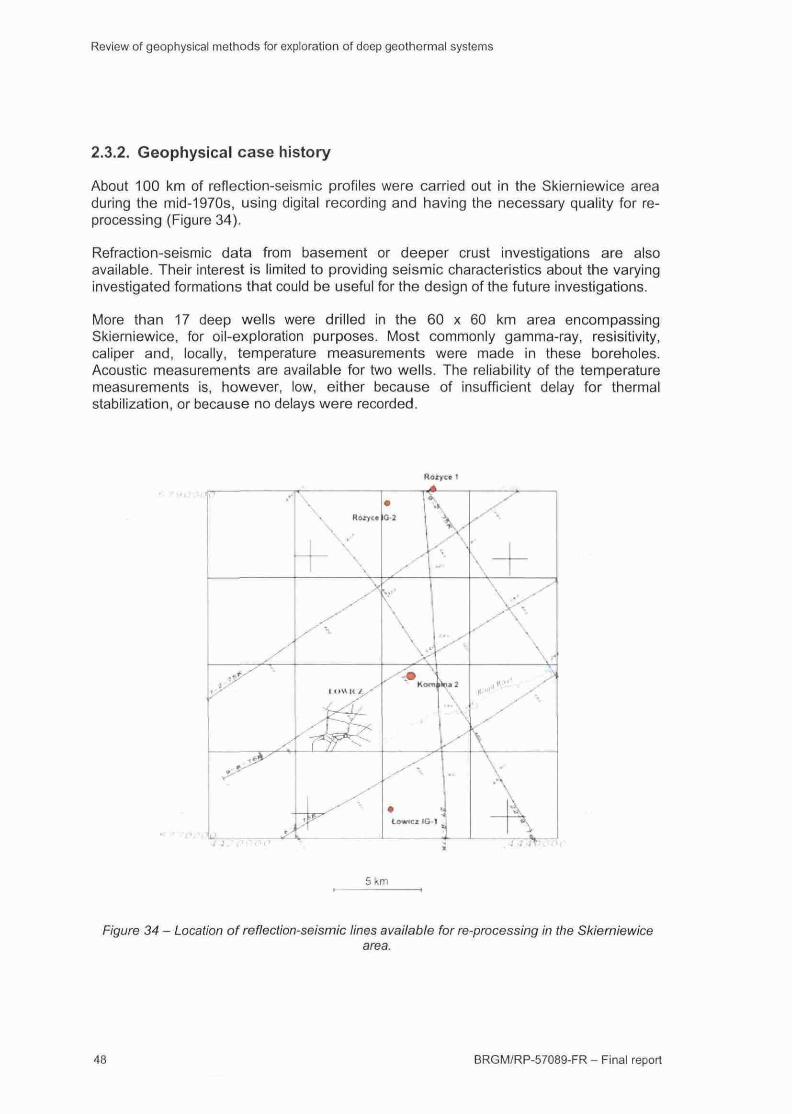
2.3.2. Geophysical case history
About 100 km of reflection-seismic profiles were carried out in the Skierniewice areaduring the mid-1970s, using digital recording and having the necessary quality for re-processing (Figure 34).
Refraction-seismic data from basement or deeper crust investigations are alsoavailable. Their interest is limited to providing seismic characteristics about the varyinginvestigated formations that could be useful for the design of the future investigations.
More than 17 deep wells were drilled in the 60 x 60 km area encompassingSkierniewice, for oil-exploration purposes. Most commonly gamma-ray, resisitivity,caliper and, locally, temperature measurements were made in these boreholes.Acoustic measurements are available for two wells. The reliability of the temperaturemeasurements is, however, low, either because of insufficient delay for thermalstabilization, or because no delays were recorded.
S (.'I. :? i.l
5 km
Figure 34 - Location of reflection-seismic lines available for re-processing in the Skierniewicearea.
48 BRGM/RP-57089-FR - Final report
Review of geophysical methods for exploration of deep geotherma! systems
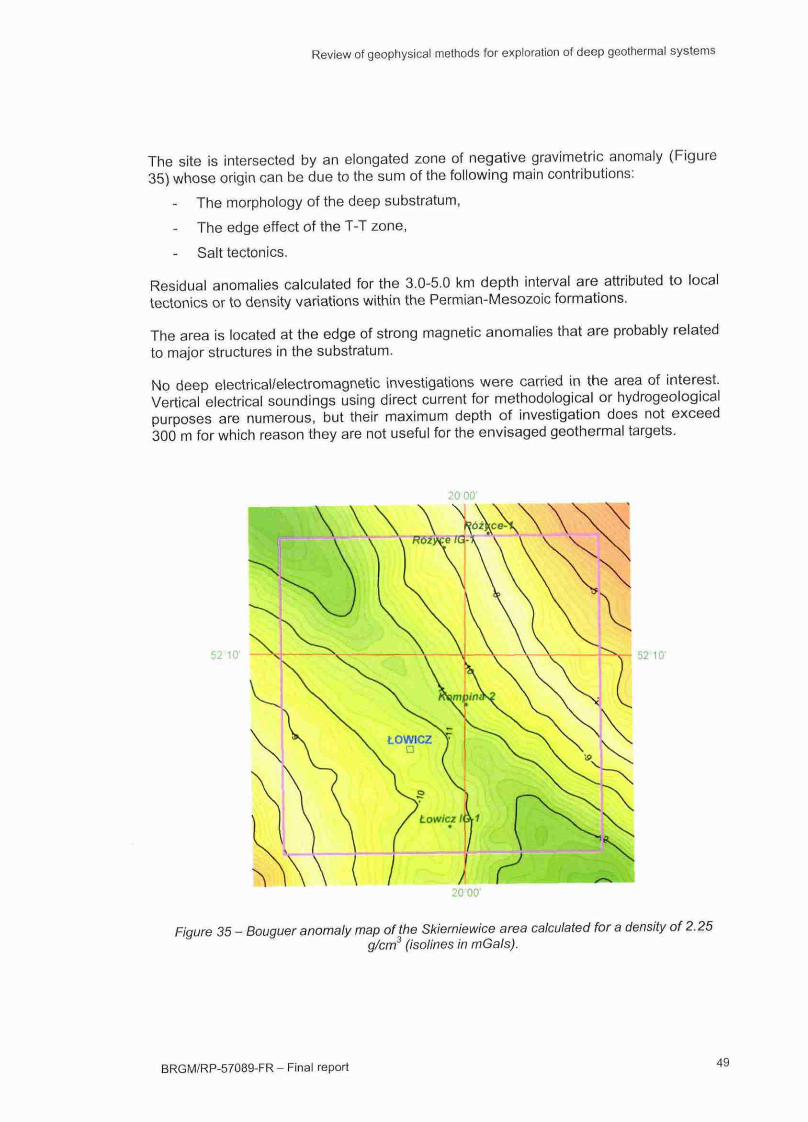
The site is intersected by an elongated zone of negative gravimetric anomaly (Figure35) whose origin can be due to the sum of the following main contributions:
- The morphology of the deep substratum,
- The edge effect of the T-T zone,
Salt tectonics.
Residual anomalies calculated for the 3.0-5.0 km depth interval are attributed to localtectonics or to density variations within the Permian-Mesozoic formations.
The area is located at the edge of strong magnetic anomalies that are probably relatedto major structures in the substratum.
No deep electrical/electromagnetic investigations were carried in the area of interest.Vertical electrical soundings using direct current for methodological or hydrogeologicalpurposes are numerous, but their maximum depth of investigation does not exceed300 m for which reason they are not useful for the envisaged geothermal targets.
20 001
52 10 52 10*
Figure 35 - Bouguer anomaly map of the Skiemiewice area calculated for a density of 2.25g/cm3 (isolines in mGals).
BRGM/RP-57089-FR - Final report 49
Review of geophysical methods for exploration of deep geothermal systems
2.4. MILOS (from Mendrinos and Karytsas, 2006)
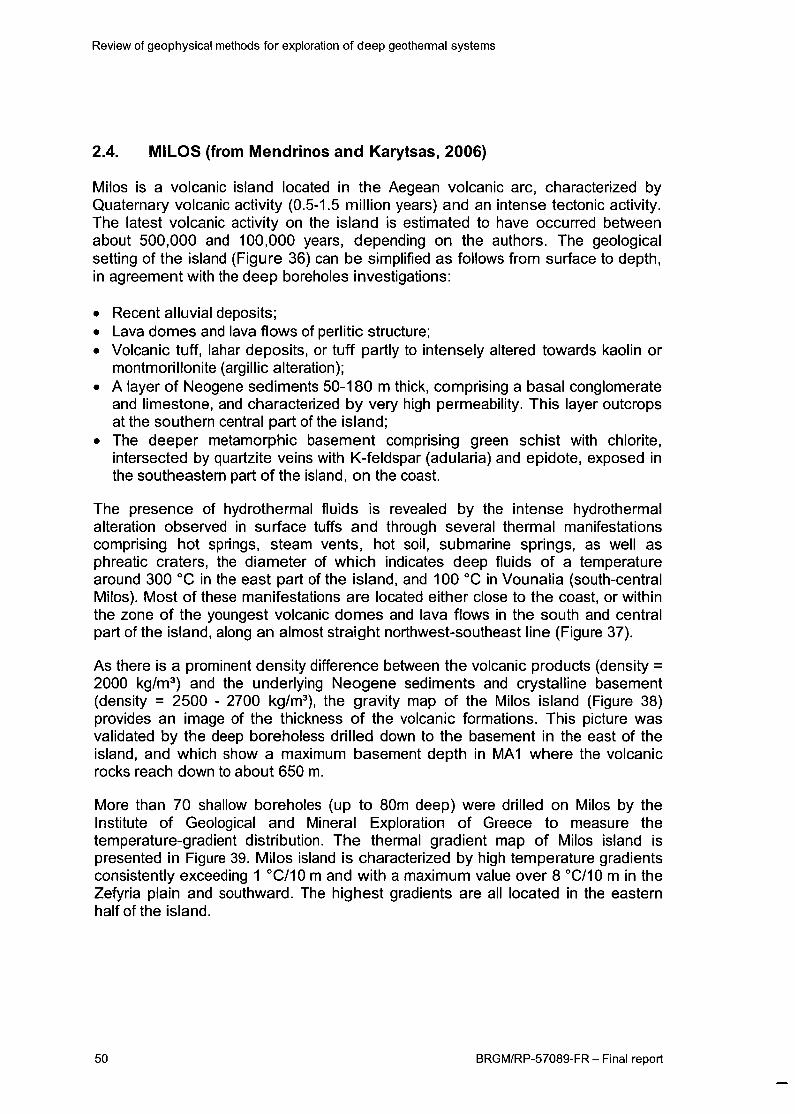
Milos is a volcanic island located In the Aegean volcanic arc, characterized byQuaternary volcanic activity (0.5-1.5 million years) and an intense tectonic activity.The latest volcanic activity on the island is estimated to have occurred betweenabout 500,000 and 100,000 years, depending on the authors. The geologicalsetting of the island (Figure 36) can be simplified as follows from surface to depth,in agreement with the deep boreholes investigations:
Recent alluvial deposits;
Lava domes and lava flows of periltic structure;
Volcanic tuff, lahar deposits, or tuff partly to intensely altered towards kaolin ormontmorillonite (argillic alteration);
A layer of Neogene sediments 50-180 m thick, comprising a basal conglomerateand limestone, and characterized by very high permeability. This layer outcropsat the southern central part ofthe island;
The deeper metamorphic basement comprising green schist with chlorite,intersected by quartzite veins with K-feldspar (adularia) and epidote, exposed inthe southeastern part of the Island, on the coast.
The presence of hydrothermal fluids is revealed by the intense hydrothermalalteration observed in surface tuffs and through several thermal manifestationscomprising hot springs, steam vents, hot soil, submarine springs, as well asphreatic craters, the diameter of which indicates deep fluids of a temperaturearound 300 °C in the east part ofthe island, and 100 °C in Vounalia (south-centralMilos). Most of these manifestations are located either close to the coast, or withinthe zone of the youngest volcanic domes and lava flows in the south and centralpart ofthe island, along an almost straight northwest-southeast line (Figure 37).
As there Is a prominent density difference between the volcanic products (density =2000 kg/m^) and the underlying Neogene sediments and crystalline basement(density = 2500 - 2700 kg/m^), the gravity map of the Milos Island (Figure 38)provides an image of the thickness of the volcanic formations. This picture wasvalidated by the deep boreholess drilled down to the basement in the east of theisland, and which show a maximum basement depth in MA1 where the volcanicrocks reach down to about 650 m.
More than 70 shallow boreholes (up to 80m deep) were drilled on Milos by theInstitute of Geological and Mineral Exploration of Greece to measure thetemperature-gradient distribution. The thermal gradient map of Milos island Ispresented In Figure 39. Milos island is characterized by high temperature gradientsconsistently exceeding 1 °C/10 m and with a maximum value over 8 °C/10 m in theZefyria plain and southward. The highest gradients are all located in the easternhalf of the island.
50 BRGM/RP-57089-FR - Final report
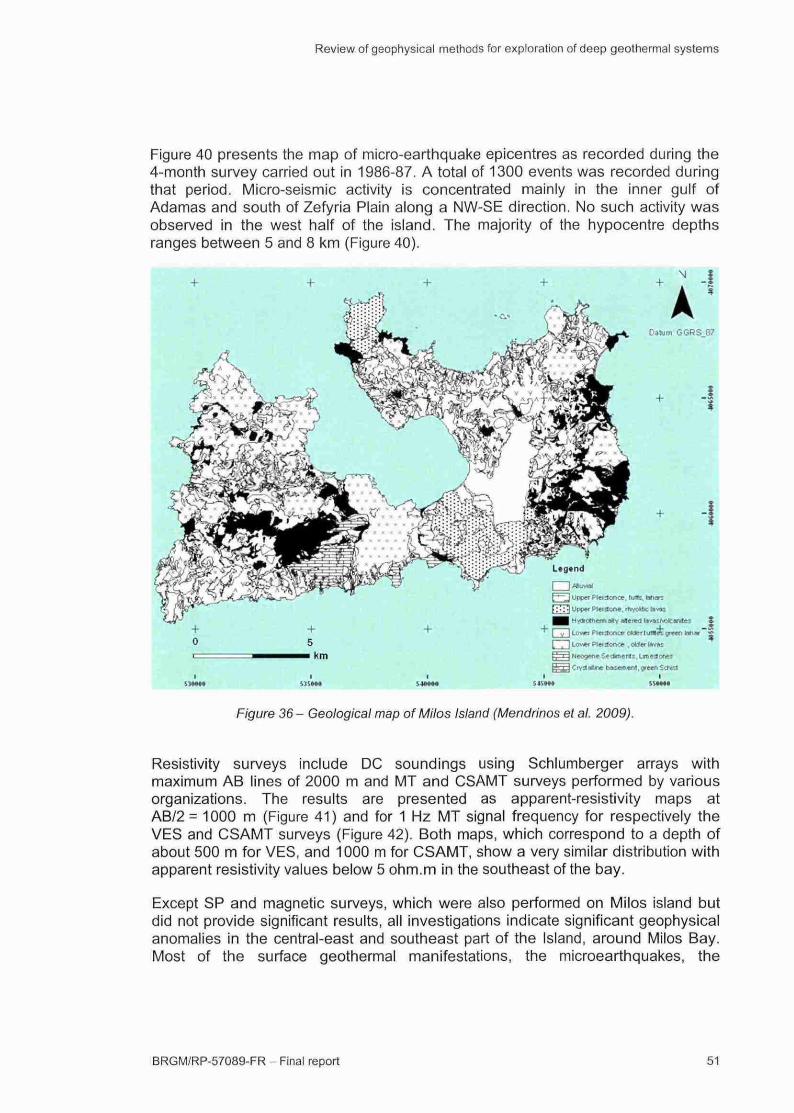
Review of geophysical methods for exploration of deep geothermal systems
Figure 40 presents the map of micro-earthquake epicentres as recorded during the4-month survey carried out in 1986-87. A total of 1300 events was recorded duringthat period. Micro-seismic activity is concentrated mainly in the inner gulf ofAdamas and south of Zefyria Plain along a NW-SE direction. No such activity wasobserved in the west half of the island. The majority of the hypocentre depthsranges between 5 and 8 km {Figure 40).
Datum GGBS 87
\ It"*~J UrW Pteiatmce. tults, toiiars
, rtiyo*be taes
^ | H**athennaiv Mena tavashofcmtes' [ y | Lowei Pieiaonœ oWfi iuHÄ^wn M I
t , | LOW Pl«ig(*l« , OU« l*v»s
| j ~ jg Ciy daine basemenl. green SduslI I
S4SM« IS****
Figure 36 - Geological map of MHos Island (Mendrinos et al. 2009).
Resistivity surveys include DC soundings using Schlumberger arrays withmaximum AB lines of 2000 m and MT and CSAMT surveys performed by variousorganizations. The results are presented as apparent-resistivity maps atAB/2 = 1000 m (Figure 41) and for 1 Hz MT signal frequency for respectively theVES and CSAMT surveys (Figure 42). Both maps, which correspond to a depth ofabout 500 m for VES, and 1000 m for CSAMT, show a very similar distribution withapparent resistivity values below 5 ohm.m in the southeast of the bay.
Except SP and magnetic surveys, which were also performed on Milos island butdid not provide significant results, all investigations indicate significant geophysicalanomalies in the central-east and southeast part of the Island, around Milos Bay.Most of the surface geothermal manifestations, the microearthquakes, the
BRGM/RP-57089-FR - Final report 51
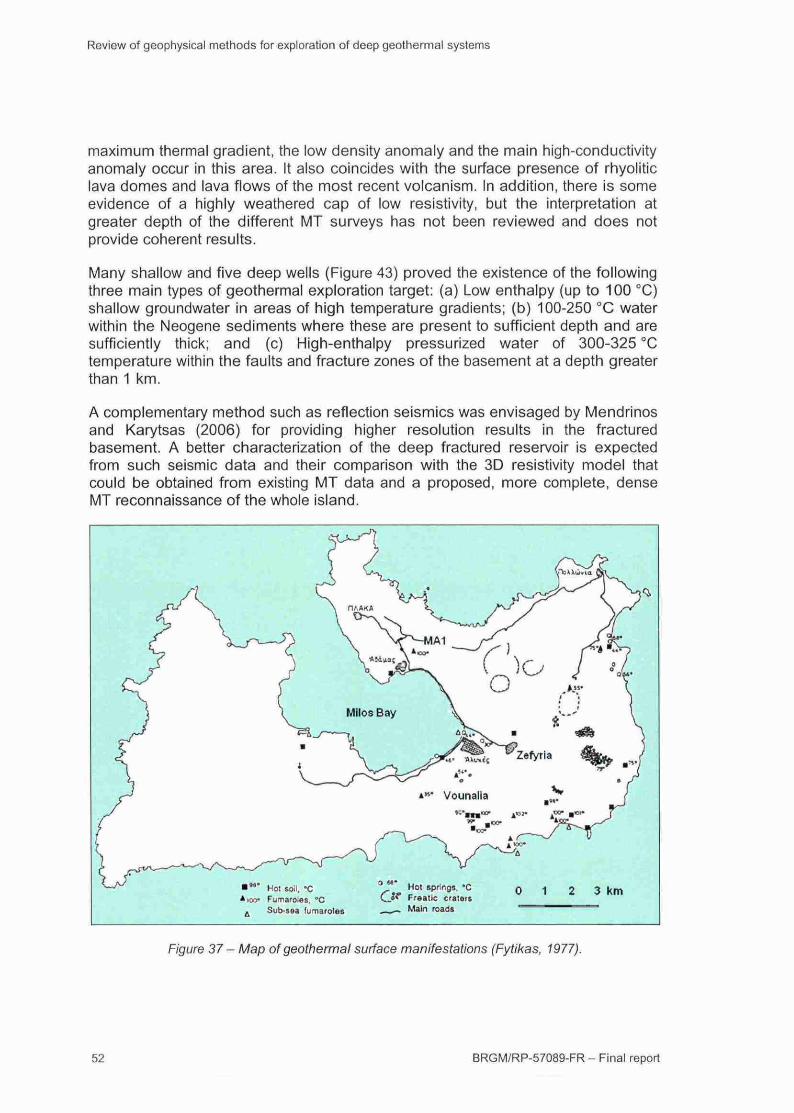
Review of geophysical methods for exploration of deep geothermal systems
maximum thermal gradient, the low density anomaly and the main high-conductivityanomaly occur in this area. It also coincides with the surface presence of rhyoliticlava domes and lava flows of the most recent volcanism. In addition, there is someevidence of a highly weathered cap of low resistivity, but the interpretation atgreater depth of the different MT surveys has not been reviewed and does notprovide coherent results.
Many shallow and five deep wells (Figure 43) proved the existence of the followingthree main types of geothermal exploration target: (a) Low enthalpy (up to 100 °C)shallow groundwater in areas of high temperature gradients; (b) 100-250 °C waterwithin the Neogene sediments where these are present to sufficient depth and aresufficiently thick; and (c) High-enthalpy pressurized water of 300-325 °Ctemperature within the faults and fracture zones of the basement at a depth greaterthan 1 km.
A complementary method such as reflection seismics was envisaged by Mendrinosand Karytsas (2006) for providing higher resolution results in the fracturedbasement. A better characterization of the deep fractured reservoir is expectedfrom such seismic data and their comparison with the 3D resistivity mode! thatcould be obtained from existing MT data and a proposed, more complete, denseMT reconnaissance of the whole island.
Fumaroles. "CSub-sea fu marolas
Freaiic cratersMain roads
0 1 2 3 km
Figure 37 - Map of geothermal surface manifestations (Fytikas, 1977).
52 BRGM/RP-57089-FR - Final report
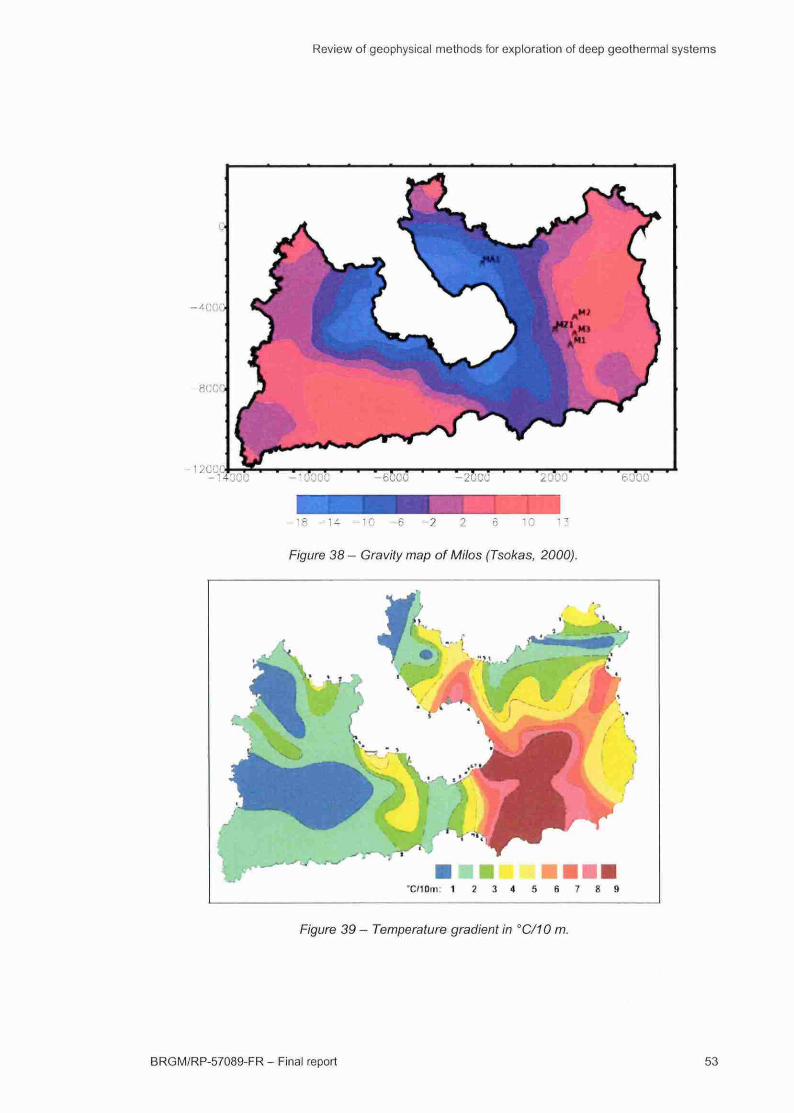
Review of geophysical methods for exploration of deep geothermal systems
- 4 CCO
- 12CÜÜ
- 1 8 - 1 4 - 1 0 - 6 - 2 2 6 10 1?
Figure 38 - Gravity map of Milos (Tsokas, 2000).
• C M O m : 1 2 3 4 5 6 7 8 9
Figure 39 - Temperature gradient in "C/10 m.
BRGM/RP-57089-FR - Final report 53
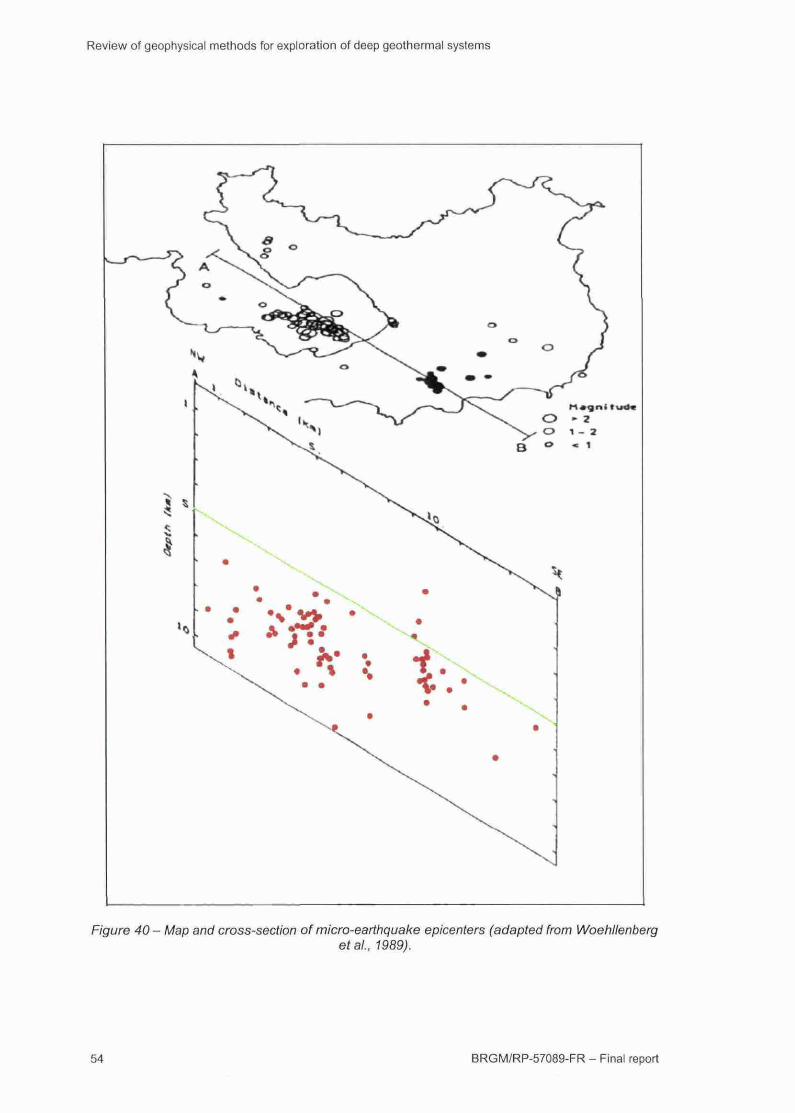
Review of geophysical methods for exploration of deep geothermal systems
Figure 40 - Map and cross-section of micro-earthquake epicenters (adapted from Woehllenberget ai., 1989).
54 BRGM/RP-57089-FR - Fina! report
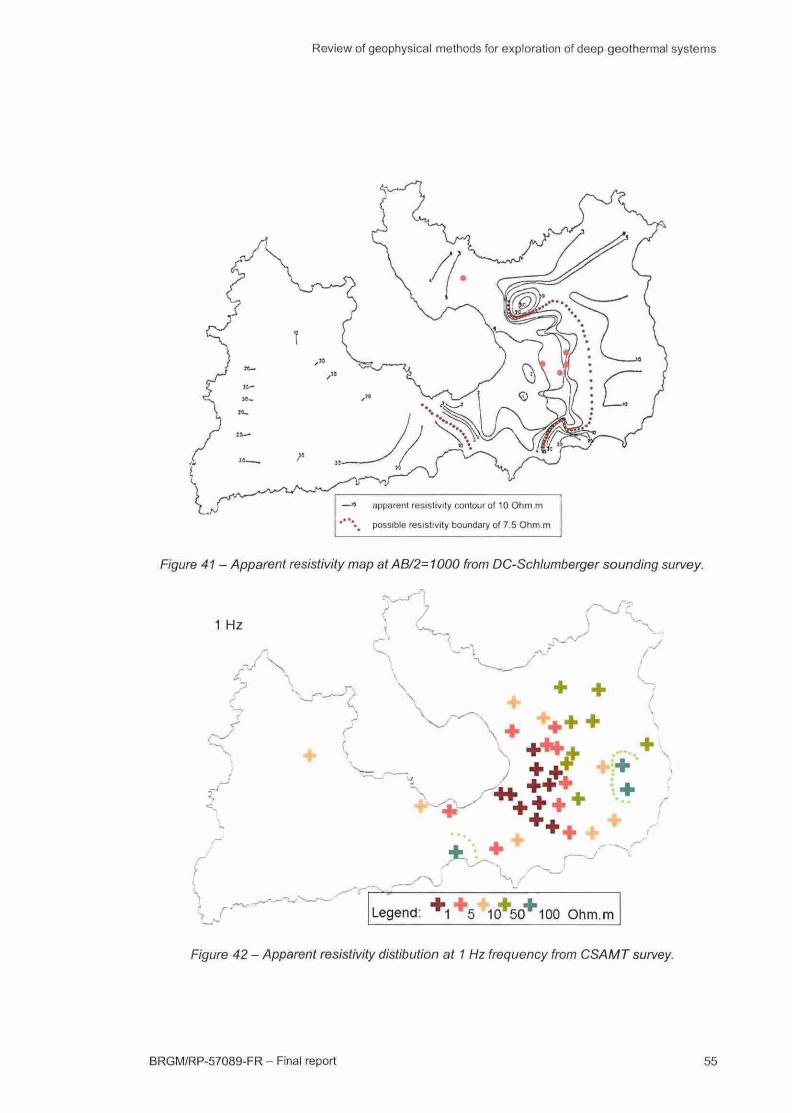
Review of geophysical methods for exploration of deep geothermal systems
—" apparent resistivity contour of 10 Ohm m
* *«4 possible resistivity boundary of 7.5 Ohm.m
Figure 41 - Apparent resistivity map atAB/2=1000 from DC-Schlumberger sounding survey.
1 Hz
•> J'
Figure 42 - Apparent resistivity distibution at 1 Hz frequency from CSAMT survey.
BRGM/RP-57089-FR - Final report
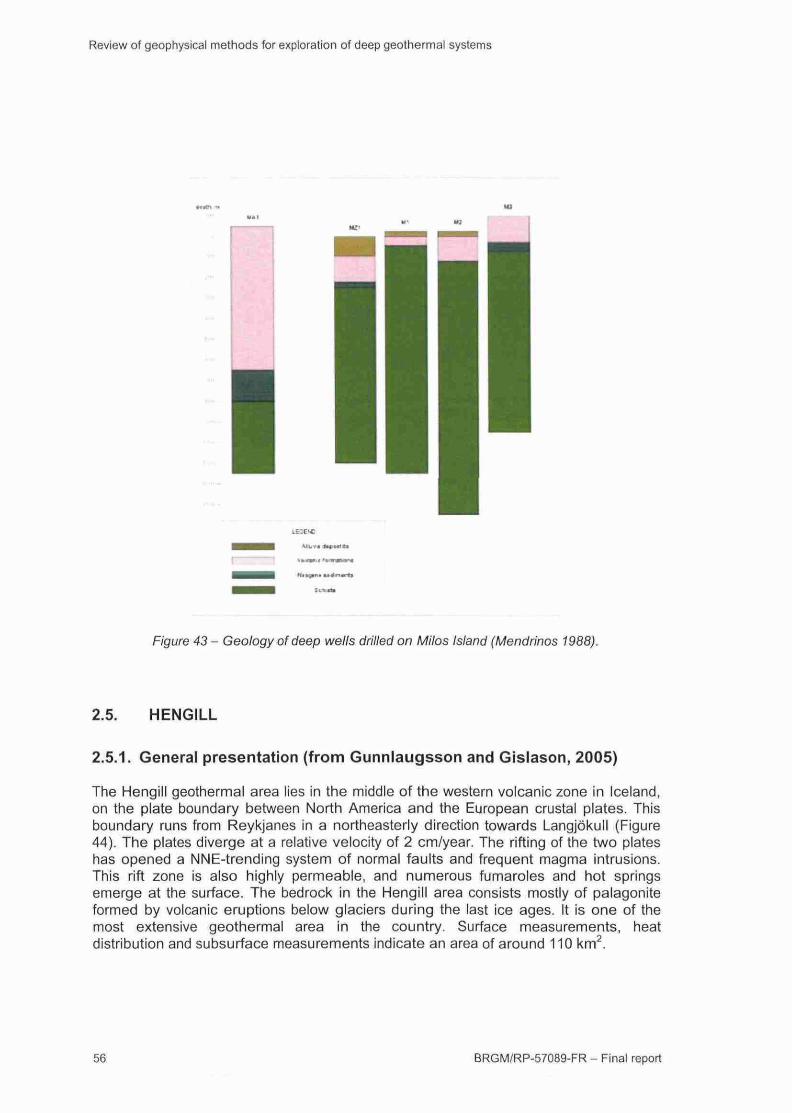
Review of geophysical methods for exploration of deep geothermal systems
Figure 43 - Geology of deep wells drilled on Milos Island (Mendhnos 1988).
2.5. HENGILL
2.5.1. General presentation (from Gunnlaugsson and Gislason, 2005)
The Hengill geothermal area lies in the middle of the western volcanic zone in Iceland,on the plate boundary between North America and the European crustal plates. Thisboundary runs from Reykjanes in a northeasterly direction towards Langjökull (Figure44). The plates diverge at a relative velocity of 2 cm/year. The rifting of the two plateshas opened a NNE-trending system of normal faults and frequent magma intrusions.This rift zone is also highly permeable, and numerous fumaroles and hot springsemerge at the surface. The bedrock in the Hengill area consists mostly of palagoniteformed by volcanic eruptions below glaciers during the last ice ages. It is one of themost extensive geothermal area in the country. Surface measurements, heatdistribution and subsurface measurements indicate an area of around 110 km2.
56 BRGM/RP-57089-FR - Final report
Review of geophysical methods for exploration of deep geothermal systems
Geothermal activity is associated with three volcanic systems of different age within thecomplex (Figure 45). The geothermal heat source In Reykjadalur and Hveragerôi isrelated to Grensdalur, the oldest of the three volcanoes. North of Grensdalur lies
Hrómundartindur, which last erupted about 10,000 years ago, and which provides theheat for geothermal activity around Ôlkelduhàls. West of these volcanic systems is theHengill system, with volcanic features and faults stretching from southwest to northeastthrough Hellisheiôi, Nesjavellir and Lake t=>ingvallavatn. Several potential geothermalfields can be distinguished within the Hengill complex. Only two of these areas havebeen developed, one for space heating, industrial use and greenhouse heating in thetown of Hveragerdi, and the other at Nesjavellir, where a geothermal power plant and ahot-water plant for space heating are set up.
A fault zone associated with the Hengill Volcano cuts through the volcanic zone fromsouthwest to northeast. The most interesting geothermal prospects are thoseassociated with this fault zone, Nesjavellir farthest to the north, and Hellisheidi on the
south side. Three volcanic eruptions are known to have occurred over the last 11,000
years, the most recent eruption having taken place 2,000 years ago. The last erupfionin the vicinity occurred in the year 1000 on a fissure west of Hengill, forming theSvinafellsbruni lava field. The geology of the Hengill area can be illustrated by a NW-SE cross-section established in the Hellisheiôi field (south part of the Hengill system.Figure 46).
It Is mainly composed of two rock types; hyaloclastite and lava. The former is dominantand was formed in sub-glacial eruptions, while lava series form during interglacialperiods. Although of relafively high porosity, basaltic hyaloclastite tends to have a lowpermeability, especially when it has been hydrothermally altered. It formed In highlandswhile Interglacial lava, when erupting in the highlands, will flow downhill and
accumulate In the lowlands surrounding the volcano. This is shown in Figure 46 (left)where hyaloclasfites dominate in the central part of the field while lava seriesintercalate the hyaloclastite in the western part and rapidly thin out towards east.
The Graben fault with a large displacement of about 250 m in the west, may cause apreferential upflow in the region. But the volcanic fissures of the postglacial volcanism(central part of Figure 46, left) are the most Important contributors to the present hightemperature permeability. They can be traced farther to the north up to LakeThingavallavatn through the Nesjavellir field, where they act as the main outfiowchannel ofthe geothermal system towards north.
2.5.2. Surface exploration
The Hengill Volcano has been studied extensively from as early as 1947. Initial work
focused on geological, geophysical and geochemical studies, which led to the drilling ofa few shallow exploratory wells. More wells were drilled at Hveragerdi as a spin-offfrom the inifial exploration phase. These wells have been used for space heating aswell as for heating greenhouses. Extensive geological, geophysical and geochemicalsurveys have been carried out throughout the Hengill area In conjuncfion with theNesjavellir and Hellisheiôi projects. The pioneering work of Saemundsson (1967)
BRGM/RP-57089-FR - Final report 57
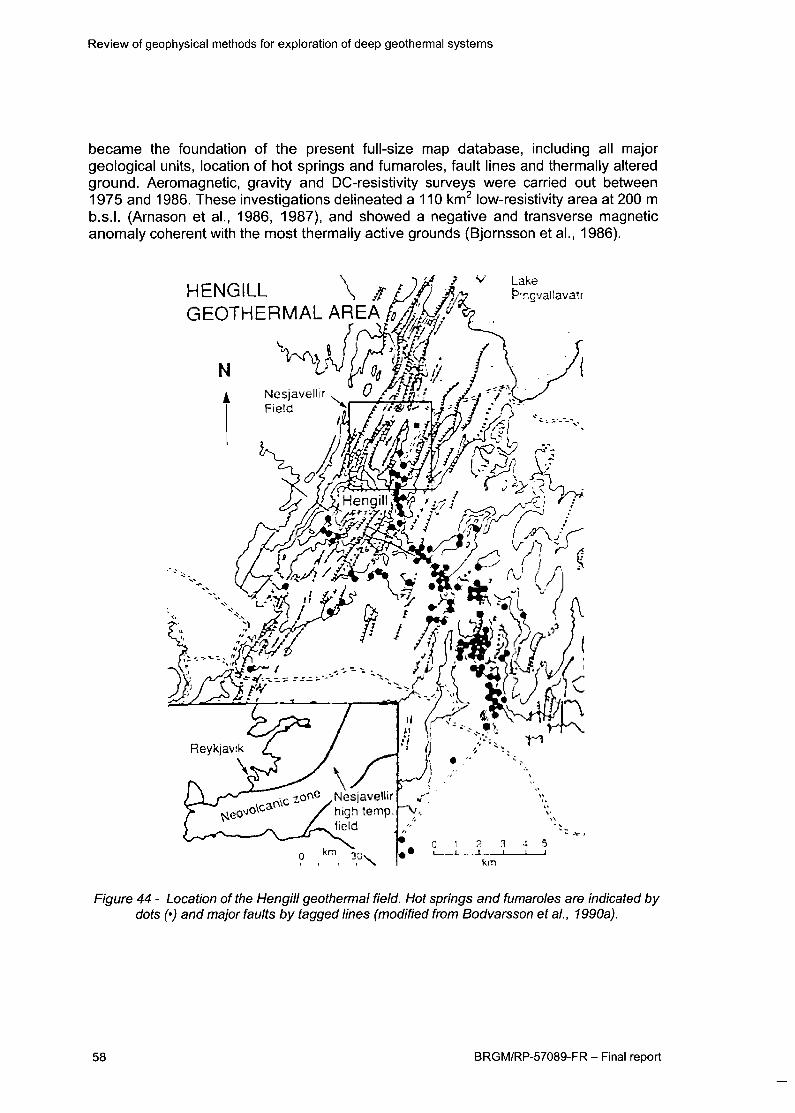
Review of geophysical methods for exploration of deep geothermal systems
became the foundation of the present full-size map database, including all majorgeological units, location of hot springs and fumaroles, fault lines and thermally alteredground. Aeromagnetic, gravity and DC-resistivity surveys were carried out between1975 and 1986. These investigations delineated a 110 km^ low-resistivity area at 200 mb.s.l. (Arnason et al., 1986, 1987), and showed a negative and transverse magneticanomaly coherent with the most thermally active grounds (Bjornsson et al., 1986).
HENGILL \ Jf l/JI fi/^ ¿gvallavatrGEOTHERMAL AREA hÂtJJ'
¡rompfN V^Uq^ %%,'/ j \ /{
a r^ MilNesjavellir U /V/<?Field ^1 //>
íMñ'L
" ^"' r ' I f\ ^
Figure 44 - Location ofthe Hengill geothermal field. Hot springs and fumaroles are indicated bydots (') and major faults by tagged lines (modified from Bodvarsson et al., 1990a).
58 BRGM/RP-57089-FR - Final report
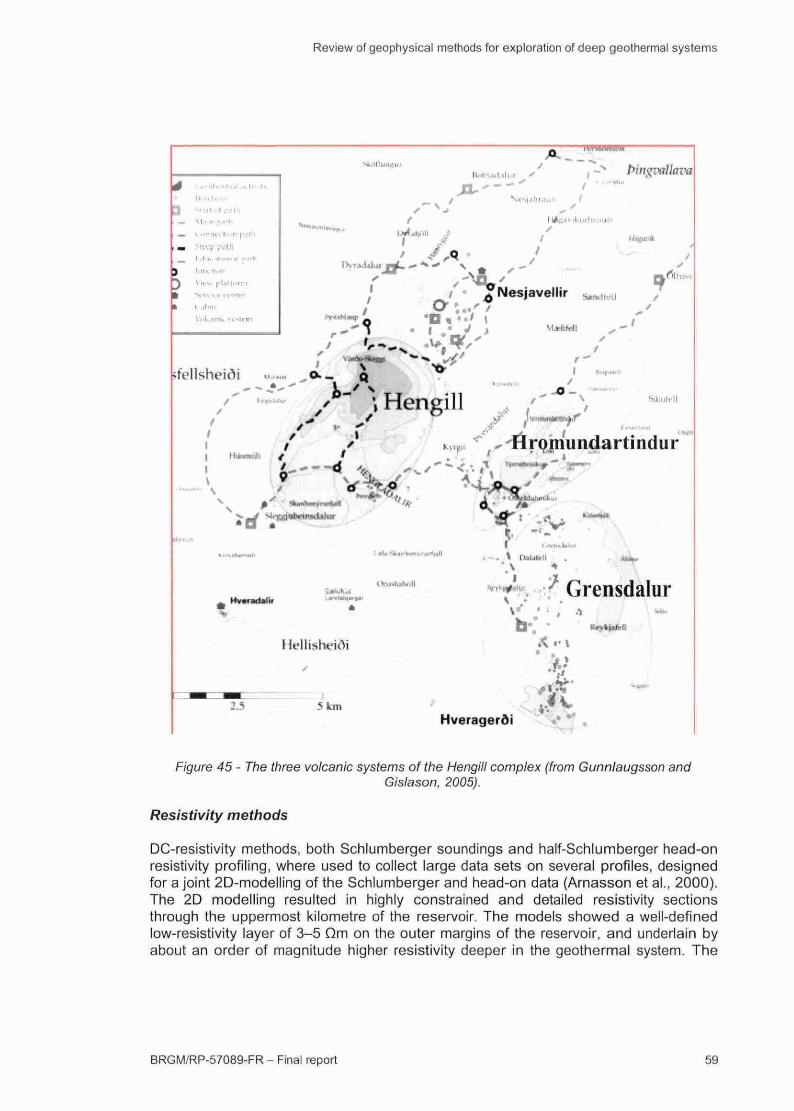
Review of geophysical methods for exploration of deep geothermal systems
0 • „• sK-im.tl ,„|r. K
J M3rt •.'! pj'^i
on f\ilh
1.1,1, nM.vil
I i .ihm
Viili.ini\
( r ^ ' , -% PingvaUavai ' • - - • •
Ni-.|.ihr.tun /
Nesjavellir
v • • F
»fellsheiói
/ 1 i HengillM _ '««ml.-
' / s kvrpi VÄ ^ f l rQj r íundar t indurI Hibmúii / » ' »
I «U-«anW«»™t+Bll
OrvMauhf.il
DalafriJ
»v-.::£ GrensdalurO". Htvki«fcß
2.5 5 kmHverageröi
Figure 45 - The three volcanic systems of the Hengill complex (from Gunnlaugsson andGislason, 2005).
Resistivity methods
DC-resistivity methods, both Schlumberger soundings and half-Schlumberger head-onresistivity profiling, where used to collect large data sets on several profiles, designedfor a joint 2D-modelling of the Schlumberger and head-on data (Arnasson et al., 2000).The 2D modelling resulted in highly constrained and detailed resistivity sectionsthrough the uppermost kilometre of the reservoir. The models showed a well-definedlow-resistivity layer of 3-5 Qm on the outer margins of the reservoir, and underlain byabout an order of magnitude higher resistivity deeper in the geothermal system. The
BRGM/RP-57089-FR - Final report 59
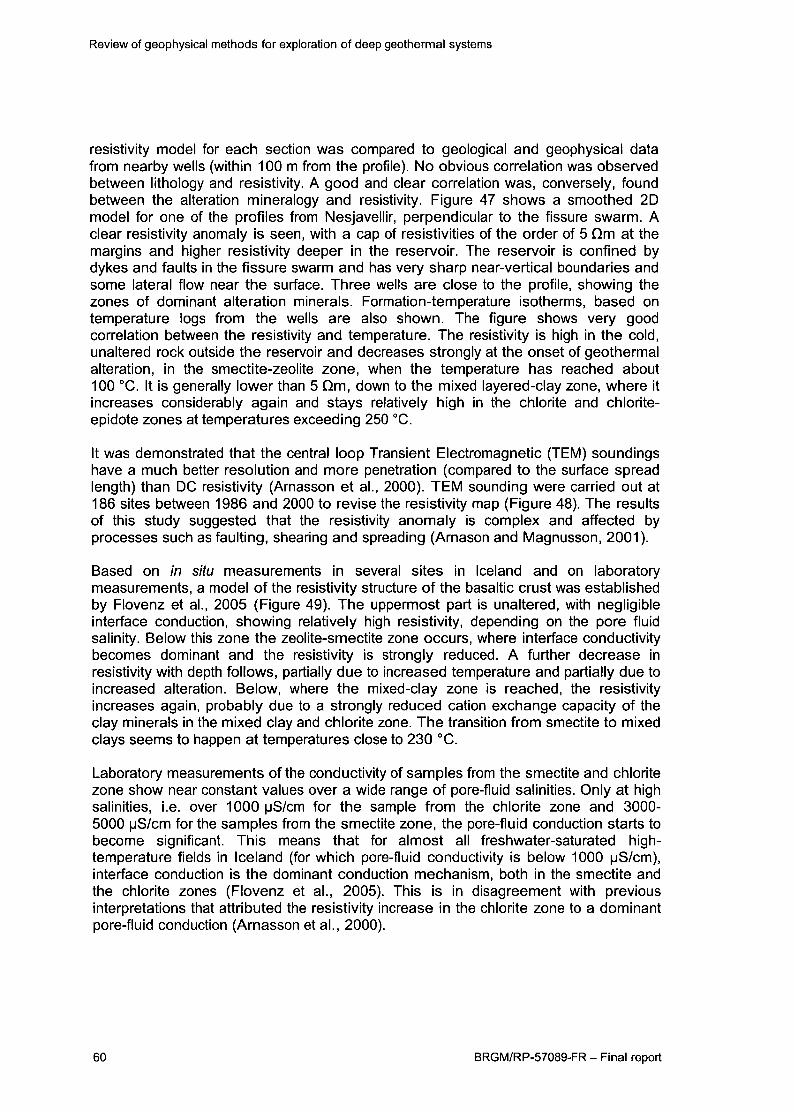
Review of geophysical methods for exploration of deep geothermal systems
reslsfivity model for each section was compared to geological and geophysical datafrom nearby wells (within 100 m from the profile). No obvious correlation was observedbetween lithology and resistivity. A good and clear correlation was, conversely, foundbetween the alterafion mineralogy and resistivity. Figure 47 shows a smoothed 2Dmodel for one of the profiles from Nesjavellir, perpendicular to the fissure swarm. Aclear resistivity anomaly Is seen, with a cap of reslstivifies of the order of 5 Qm at themargins and higher resistivity deeper in the reservoir. The reservoir is confined bydykes and faults In the fissure swarm and has very sharp near-vertical boundaries andsome lateral flow near the surface. Three wells are close to the profile, showing thezones of dominant alteration minerals. Formafion-temperature isotherms, based on
temperature logs from the wells are also shown. The figure shows very goodcorrelation between the resistivity and temperature. The resistivity is high in the cold,unaltered rock outside the reservoir and decreases strongly at the onset of geothermalalteration, in the smectite-zeolite zone, when the temperature has reached about100 °C. It is generally lower than 5 Qm, down to the mixed layered-clay zone, where itincreases considerably again and stays relatively high in the chlorite and chlorite-epidote zones at temperatures exceeding 250 °C.
It was demonstrated that the central loop Transient Electromagnetic (TEM) soundingshave a much better resolution and more penetration (compared to the surface spreadlength) than DC reslsfivity (Arnasson et al., 2000). TEM sounding were carried out at186 sites between 1986 and 2000 to revise the resistivity map (Figure 48). The resultsof this study suggested that the resistivity anomaly is complex and affected byprocesses such as faulting, shearing and spreading (Arnason and Magnusson, 2001).
Based on in situ measurements In several sites in Iceland and on laboratorymeasurements, a model of the resistivity structure of the basaltic crust was establishedby Flovenz et al., 2005 (Figure 49). The uppermost part is unaltered, with negligibleinterface conduction, showing relafively high resistivity, depending on the pore fluidsalinity. Below this zone the zeolite-smectite zone occurs, where interface conductivitybecomes dominant and the resistivity Is strongly reduced. A further decrease inresistivity with depth follows, partially due to increased temperature and partially due toincreased alteration. Below, where the mixed-clay zone is reached, the resistivityincreases again, probably due to a strongly reduced cation exchange capacity of theclay minerals In the mixed clay and chlorite zone. The transifion from smectite to mixedclays seems to happen at temperatures close to 230 °C.
Laboratory measurements ofthe conductivity of samples from the smectite and chloritezone show near constant values over a wide range of pore-fluid salinifies. Only at highsalinifies, i.e. over 1000 pS/cm for the sample from the chlorite zone and 3000-
5000 pS/cm for the samples from the smectite zone, the pore-fluid conduction starts tobecome significant. This means that for almost all freshwater-saturated high-temperature fields in Iceland (for which pore-fluid conductivity is below 1000 pS/cm),interface conducfion is the dominant conduction mechanism, both in the smectite and
the chlorite zones (Flovenz et al., 2005). This Is In disagreement with previousinterpretafions that attributed the resistivity increase in the chlorite zone to a dominantpore-fluid conducfion (Arnasson et al., 2000).
60 BRGM/RP-57089-FR - Final report
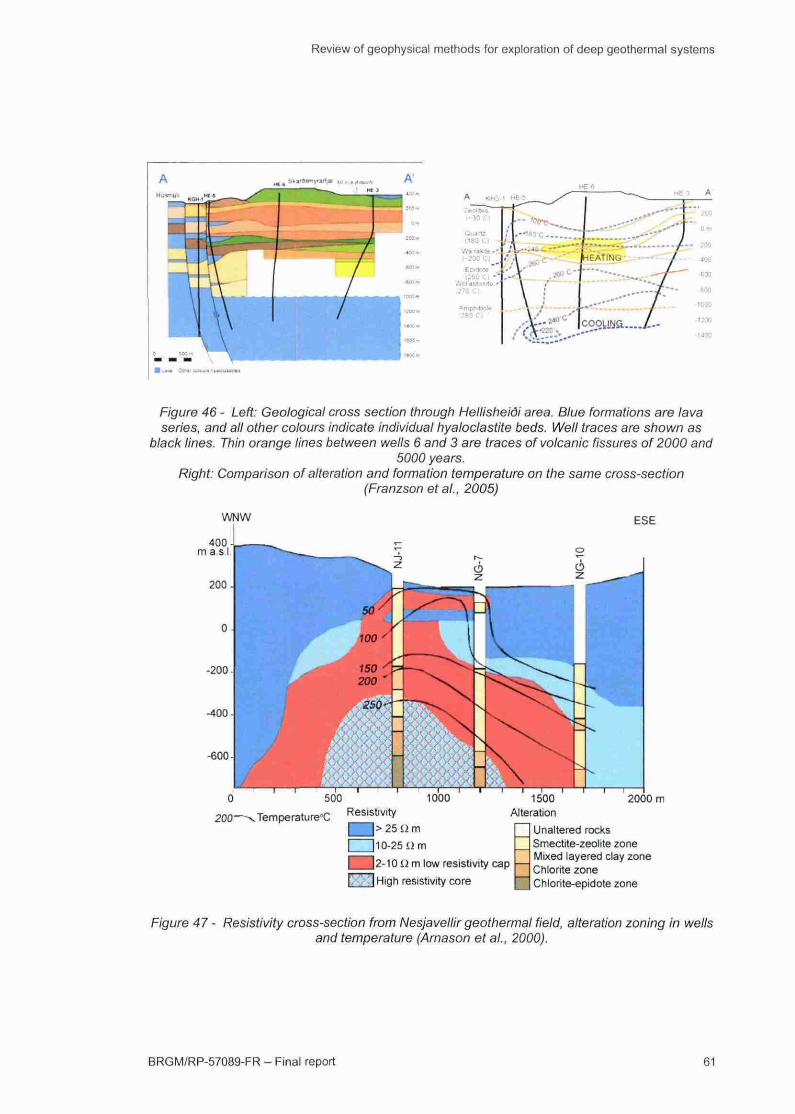
Review of geophysical methods for exploration of deep geothermal systems
Figure 46 - Left: Geological cross section through Hellisheiôi area. Blue formations are lavaseries, and all other colours indicate individual hyaloclastite beds. Well traces are shown as
black lines. Thin orange lines between wells 6 and 3 are traces of volcanic fissures of 2000 and5000 years.
Right: Comparison of alteration and formation temperature on the same cross-section(Franzsonetal., 2005)
WNW
-400
-600
ESE
O 500
200-^ Temperature^ Resistivity
1000
| 110-25 i l m
Kt.ri2-10 lim low resistivity cap
[j ' -IHigh resistivity core
2000 m1500Alteration
Unaltered rocksSmectite-zeolite zoneMixed layered clay zoneChlorite zoneChlorite-eptdote zone
Figure 47 - Resistivity cross-section from Nesjavellir geothermal field, alteration zoning in wellsand temperature (Arnason et al., 2000).
BRGM/RP-57089-FR - Final report
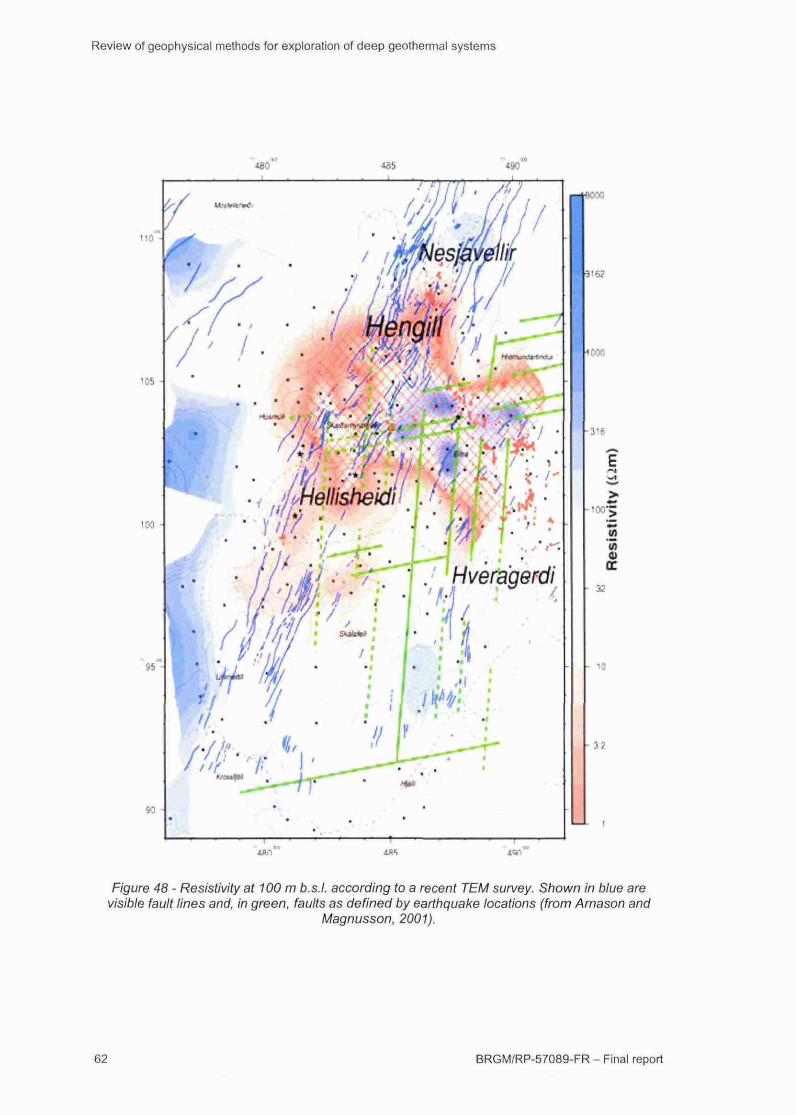
Review of geophysical methods for exploration of deep geothermal systems
110-
' 0 5 •
103 •
Figure 48 - Resistivity at 100 m b.s.l. according to a recent TEM survey. Shown in blue arevisible fault lines and, in green, faults as defined by earthquake locations (from Arnason and
Magnusson, 2001).
62 BRGM/RP-57089-FR - Final report
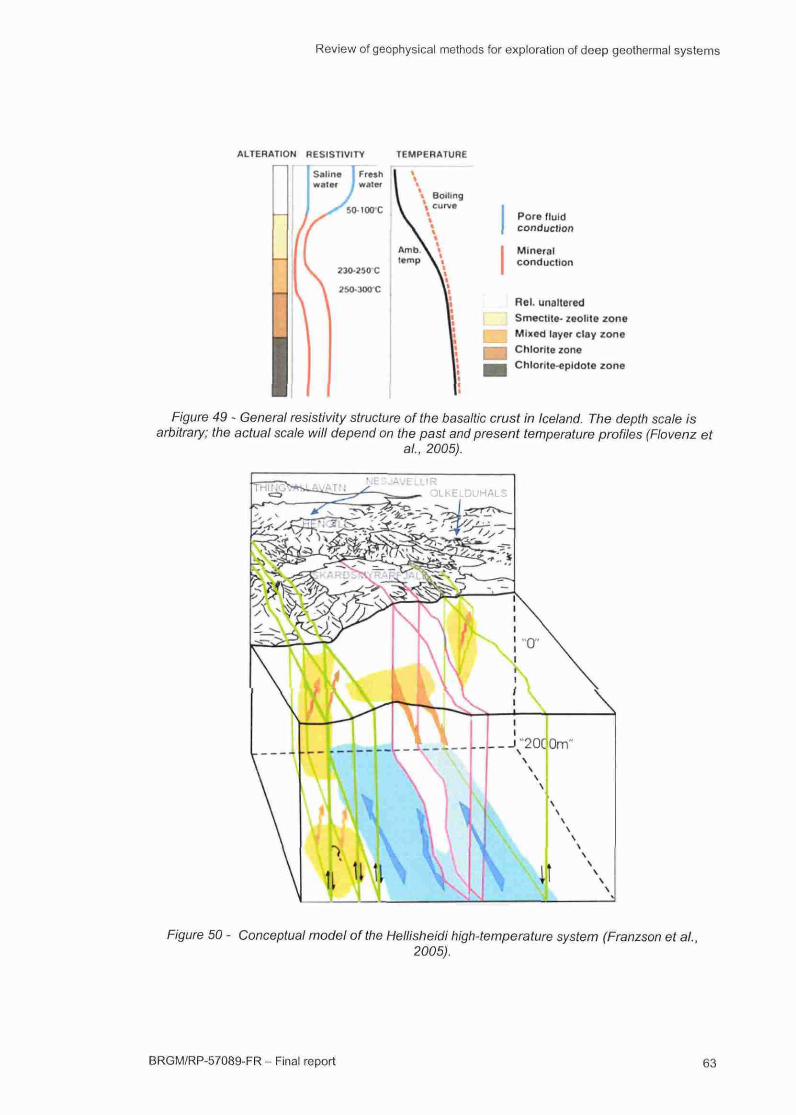
Review of geophysical methods for exploration of deep geothermal systems
t RESISTIVITY
I Saline | Fresh1 water J waterJi y1 ^ ^ 5 0 - t O O
(
1IV 230-250 C
\ 2W-300C\
TEMPERATURE
1 \
1 i Boiling\ \ curve\ \
\ \
Amb\ «temp \ \
\ 'I1 M
Pore fluidconduction
Mineralconduction
Rel. unaltered
Smectite- zeolite zoneMixed layer clay zone
i Chlorite zonei Chlorite-epidote zone
Figure 49 ~ General resistivity structure of the basaltic crust in Iceland. The depth scale isarbitrary; the actual scale will depend on the past and present temperature profiles (Flovenz et
al., 2005).
"JJLKELDUHALS
wFigure 50 - Conceptual model of the Hellisheidi high-temperature system (Franzson et al.
2005).
BRGM/RP-57089-FR - Final report
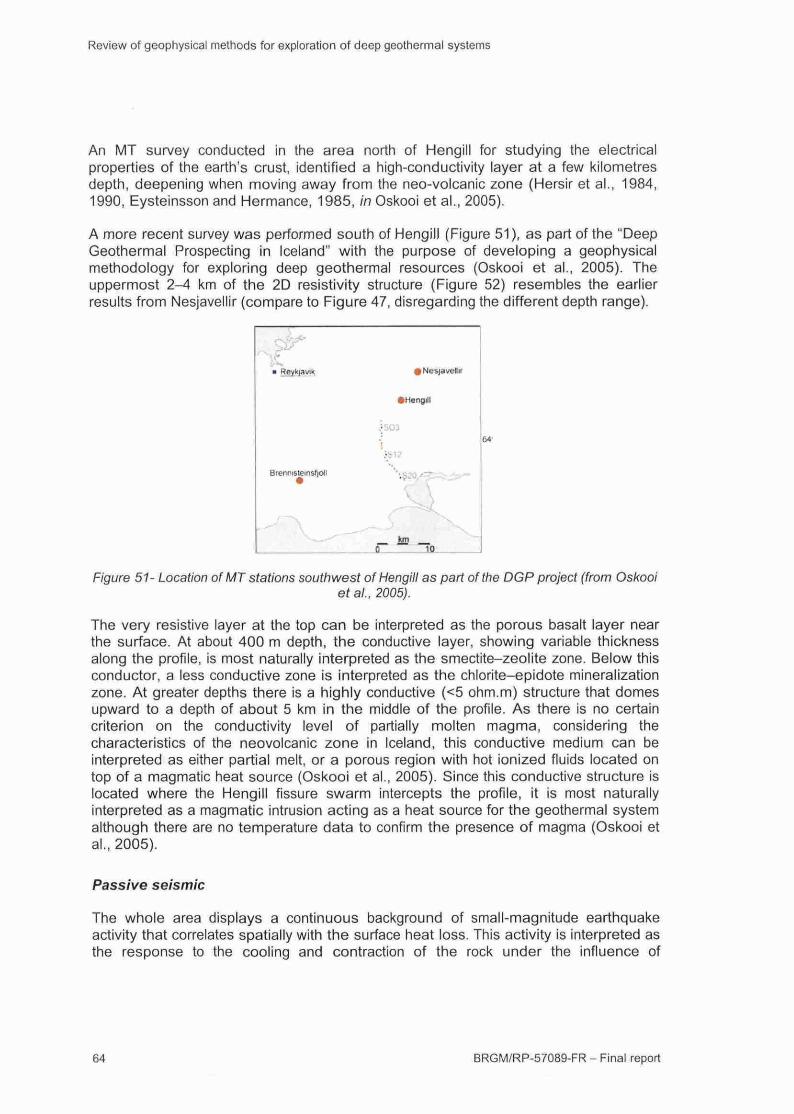
Review of geophysical methods for exploration of deep geothermal systems
An MT survey conducted in the area north of Hengill for studying the electricalproperties of the earth's crust, identified a high-conductivity layer at a few kilometresdepth, deepening when moving away from the neo-volcanic zone (Hersir et al., 1984,1990, Eysteinsson and Hermanee, 1985, in Oskooi et al., 2005).
A more recent survey was performed south of Hengill (Figure 51 ), as part of the "DeepGeothermal Prospecting in Iceland" with the purpose of developing a geophysicalmethodology for exploring deep geothermal resources (Oskooi et al., 2005). Theuppermost 2-4 km of the 2D resistivity structure (Figure 52) resembles the earlierresults from Nesjavellir (compare to Figure 47, disregarding the different depth range).
Hengril
.JS03
Brenn istemstjoli
64'
Figure 51- Location of MT stations southwest of Hengill as part of the DGP project (from Oskooiet ai, 2005).
The very resistive layer at the top can be interpreted as the porous basalt layer nearthe surface. At about 400 m depth, the conductive layer, showing variable thicknessalong the profile, is most naturally interpreted as the smectite-zeolite zone. Below thisconductor, a less conductive zone is interpreted as the chlonte-epidote mineralizationzone. At greater depths there is a highly conductive (<5 ohm.m) structure that domesupward to a depth of about 5 km in the middle of the profile. As there is no certaincriterion on the conductivity level of partially molten magma, considering thecharacteristics of the neovolcanic zone in Iceland, this conductive medium can beinterpreted as either partial melt, or a porous region with hot ionized fluids located ontop of a magmatic heat source (Oskooi et al., 2005). Since this conductive structure islocated where the Hengill fissure swarm intercepts the profile, it is most naturallyinterpreted as a magmatic intrusion acting as a heat source for the geothermal systemalthough there are no temperature data to confirm the presence of magma (Oskooi etal., 2005).
Passive seismic
The whole area displays a continuous background of small-magnitude earthquakeactivity that correlates spatially with the surface heat loss. This activity is interpreted asthe response to the cooling and contraction of the rock under the influence of
BRGM/RP-57089-FR - Final report
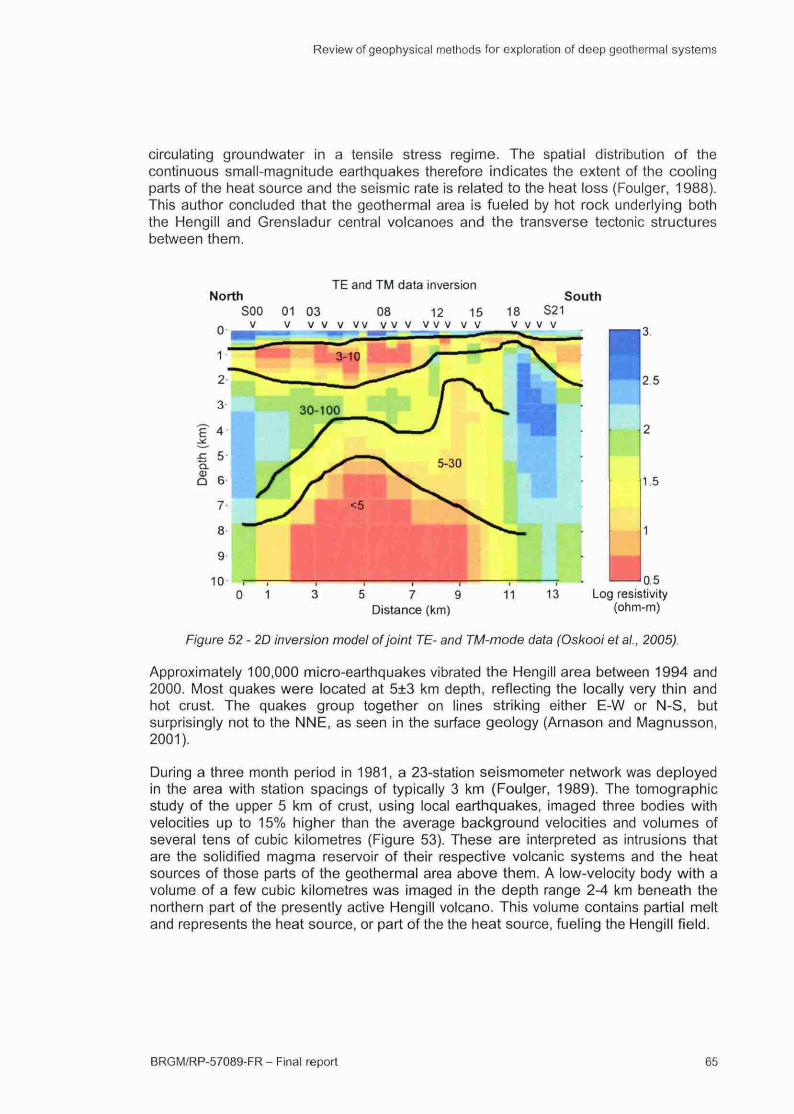
Review of geophysical methods for exploration of deep geothermal systems
circulating groundwater in a tensile stress regime. The spatial distribution of thecontinuous small-magnitude earthquakes therefore indicates the extent of the coolingparts of the heat source and the seismic rate is related to the heat loss (Foulger, 1988).This author concluded that the geothermal area is fueled by hot rock underlying boththe Hengill and Grensladur central volcanoes and the transverse tectonic structuresbetween them.
Northsoo
v
TE and TM data inversion
01 03 08 12 15V V V V V V V V V V V V V V
South18 S21V V V V n25
1.5
0 1 5 7 9Distance (km)
110.5
Log resistivity(ohm-m)
Figure 52 - 2D inversion model of joint TE- and TM-mode data (Oskooi et al., 2005)
Approximately 100,000 micro-earthquakes vibrated the Hengill area between 1994 and2000. Most quakes were located at 5±3 km depth, reflecting the locally very thin andhot crust. The quakes group together on lines striking either E-W or N-S, butsurprisingly not to the NNE, as seen in the surface geology (Arnason and Magnusson,2001).
During a three month period in 1981, a 23-station seismometer network was deployedin the area with station spacings of typically 3 km (Foulger, 1989). The tomographicstudy of the upper 5 km of crust, using local earthquakes, imaged three bodies withvelocities up to 15% higher than the average background velocities and volumes ofseveral tens of cubic kilometres (Figure 53). These are interpreted as intrusions thatare the solidified magma reservoir of their respective volcanic systems and the heatsources of those parts of the geothermal area above them. A low-velocity body with avolume of a few cubic kilometres was imaged in the depth range 2-4 km beneath thenorthern part of the presently active Hengill volcano. This volume contains partial meltand represents the heat source, or part of the the heat source, fueling the Hengill field.
BRGM/RP-57089-FR - Final report
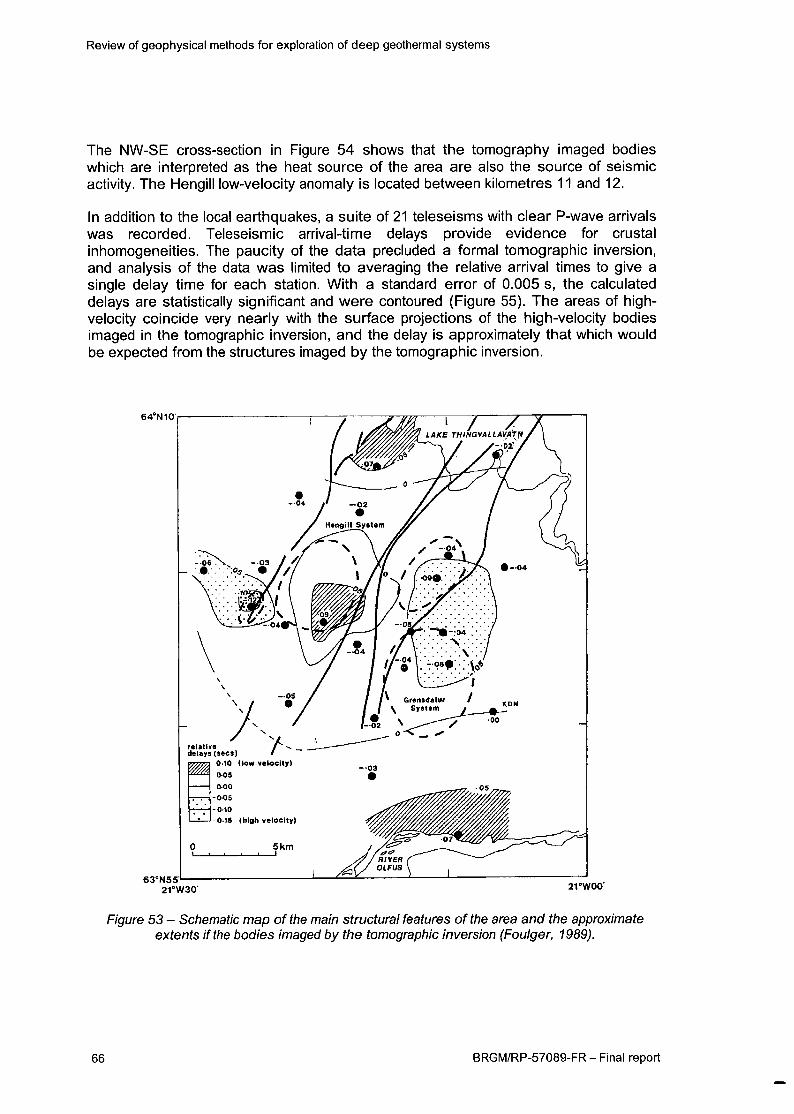
Review of geophysical methods for exploration of deep geothermal systems
The NW-SE cross-secfion In Figure 54 shows that the tomography imaged bodieswhich are interpreted as the heat source of the area are also the source of seismicactivity. The Hengill low-velocity anomaly is located between kilometres 11 and 12.
In addition to the local earthquakes, a suite of 21 teleselsms with clear P-wave arrivalswas recorded. Teleseismic arrival-time delays provide evidence for crustalinhomogeneltles. The paucity of the data precluded a formal tomographic inversion,and analysis of the data was limited to averaging the relative arrival times to give asingle delay time for each stafion. With a standard error of 0.005 s, the calculateddelays are statisfically significant and were contoured (Figure 55). The areas of high-velocity coincide very nearly with the surface projections of the high-velocity bodiesimaged in the tomographic Inversion, and the delay is approximately that which wouldbe expected from the structures imaged by the tomographic inversion.
64°N10
63°N55
relativa
delaya (secs)
0-10 (low velocity)
0.05
0.00
-0O5
-010
-OIS (high velocity)
0IL
ai^wao' arwoo'
Figure 53 - Schematic map of the main structural features of the area and the approximateextents if the bodies imaged by the tomographic inversion (Foulger, 1989).
66 BRGM/RP-57089-FR - Final report
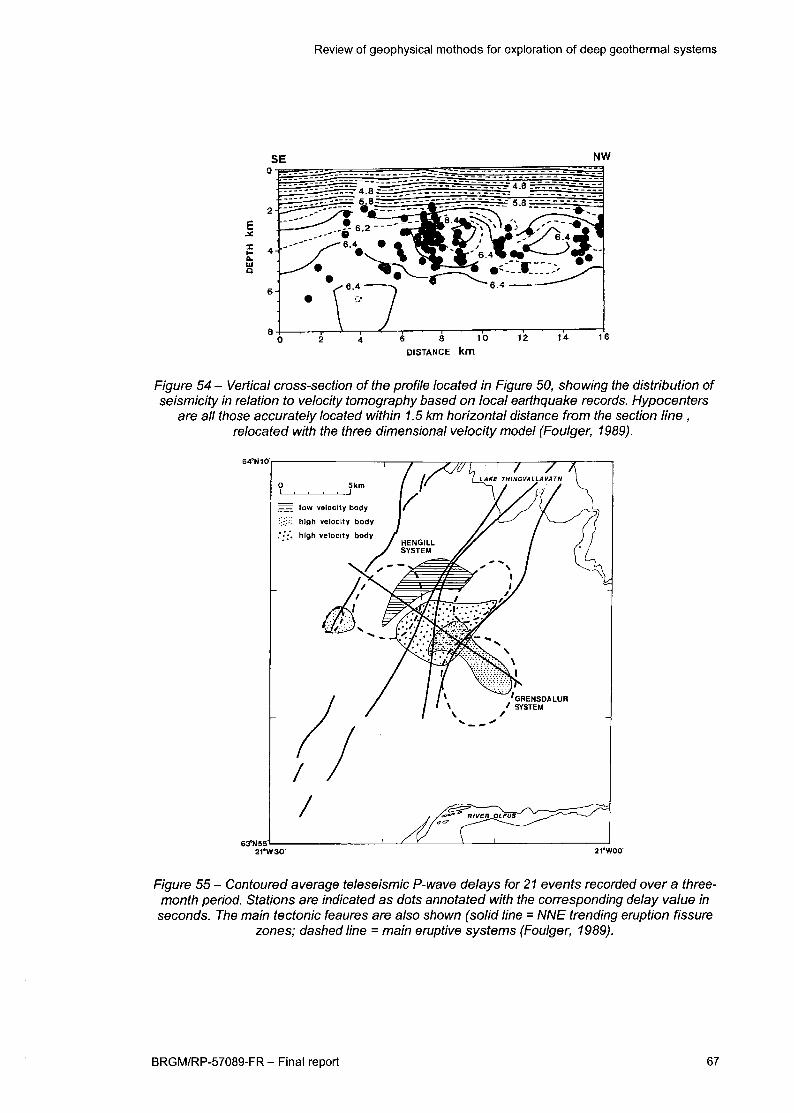
Review of geophysical methods for exploration of deep geothermal systems
E
DISTANCE km
Figure 54 - Vertical cross-section of the profile located in Figure 50, showing the distribution ofseismicity in relation to velocity tomography based on local earthquake records. Hypocenters
are all those accurately located within 1.5 km horizontal distance from the section line ,
relocated with the three dimensional velocity model (Foulger, 1989).
64°N10'
Skm_J
low velocity body
iiigh velocity body
high velocity body
63°N55121"W30'
Figure 55 - Contoured average teleseismic P-wave delays for 21 events recorded over a three-month period. Stations are indicated as dots annotated with the corresponding delay value inseconds. The main tectonic feaures are also shown (solid line = NNE trending eruption fissure
zones; dashed line = main eruptive systems (Foulger, 1989).
BRGM/RP-57089-FR - Final report 67
Review of geophysical methods for exploration of deep geothermal systems
2.5.3. Model of the geothermal system
The disconfinuous geothermal model of the Hengill system can be illustrated by theconceptual model of the Hellisheidi high-temperature system proposed by Franzson etal., (2005; Figure 50). The main outflow is supposed to follow partly the graben faults tothe east and mostly the post-glacial volcanic fissures in the central part of the field,where they provide 260-280 °C temperature fluids above 800 m b.s.l. depth. However,the lower temperature at the base of the drilled reservoir compared to that of theoverlying alteration zone, suggests that the same fissures cause an inflow of cold watertowards the centre ofthe reservoir.
2.6. BOUILLANTE
The Bouillante geothermal area is located on the west coast of Basse-Terre island ofGuadeloupe (Lesser Anfilles). Its high-temperature geothermal potential is largelycontrolled by the volcanic and structural condifions of Guadeloupe island that belongsto the Lesser Anfilles volcanic arc, linked to the subducfion of the North American platebeneath the Caribbean one (Figure 56 and Figure 57). The volcanic activity is recent(from 2.5 to 0.6 Ma) and well represented in the Bouillante area by hot springs,steaming grounds, fumaroles and mud pools (Sanjuan et al., 2000). It is located at theintersection between a terrestrial E-W graben system (Traîneau et al., 1997) and asubmarine NW-SE fault scarp known from bathymétrie data (Feuillet et al., 2001). Thehydrothermal activity, which is related to a fissurai volcanic activity. Is supposed to belinked to these major regional structural features. The subvertical dips explain thestrong contrast of fracture permeability observed in the exploration wells, in spite oftheir restricted area of occurrence.
2.6.1. Exploration case history
Explorafion of the field started in 1973 when four wells (B01 to B04) were drilled,based on hydrothermal surface manifestations, geology, temperature gradient inshallow wells, geochemistry and geophysics (mainly electrics and electromagnefics).The B02 well found a geothermal resource at 320 m depth, with a temperature of248 °C and a total production of 120 t/h of water, among which 20-25 t/h of steam. Inthe B04 well, a maximum temperature of 253 °C and a producfion rate of about 50 t/hof water and 10 t/h of steam were measured In the 1970s. Invesfigations started againin the 1990s and thermal stimulation increased the producfion rate of B04 by 50%(Tullnius et al., 2000). New geological studies, tracers tests and brine analysis(Sanjuan et al., 2000) indicated that B02 and B04 are not directly connected, but arerelated to the same large reservoir, with a composition of brine of 40% seawater and60% meteoric water origin. This is consistent with a fault system striking N100-120°
separated by permeability barriers. In 1999 it was decided to drill three new direcfionalwells: B05 and B06 towards the north and B07 towards the south. The objecfiveswere to intersect: 1) the fault system and 2) the areas of low resistivity recognized bymagnetotellurics and electrical methods in the 1980s. B05 and B06 wells becamegood producers, with temperatures of 250 °C and 275 °C, respectively. MeanwhileB07, despite temperatures over 240 °C, was dry and had no permeability.
68 BRGM/RP-57089-FR - Final report
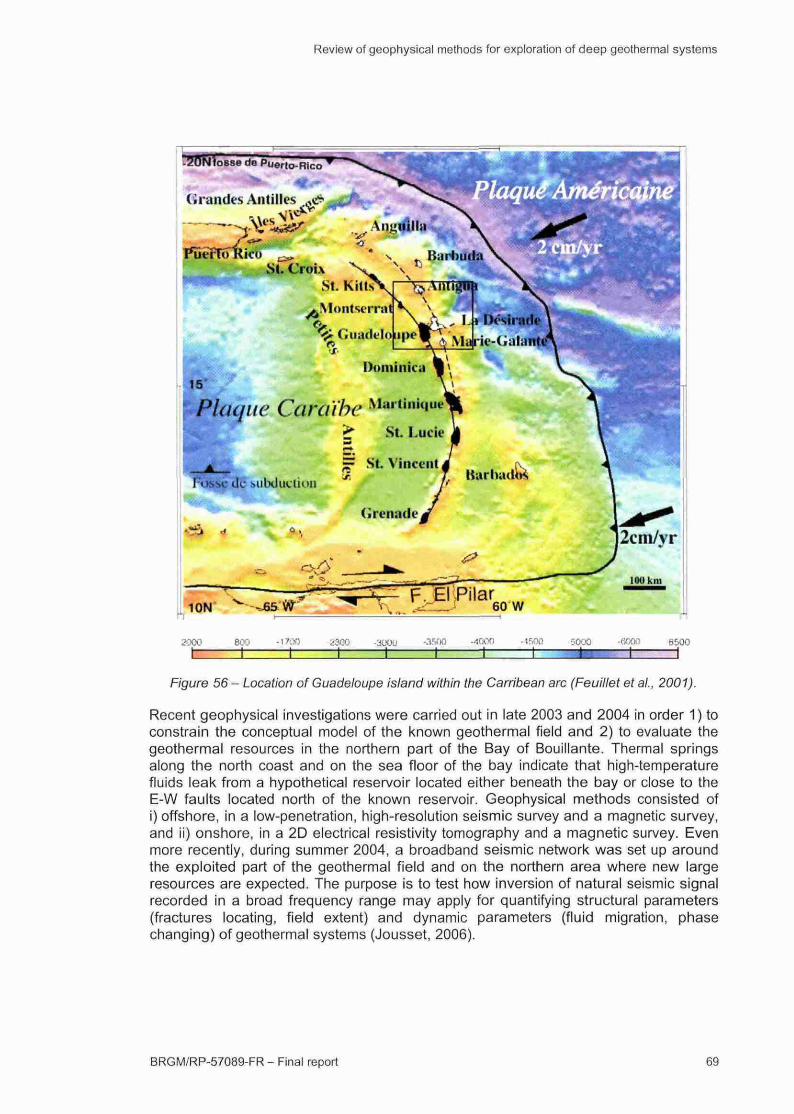
Review of geophysical methods for exploration of deep geothermal systems
Plaque Caraïbe ^ " » 'St. Lucie f
60 W
2000 800 • 3UÜU -•1™ - ir.oo •30CIÛ ssoo
Figure 56 - Location of Guadeloupe island within the Carribean arc (Feuillet et al., 2001).
Recent geophysical investigations were carried out in late 2003 and 2004 in order 1) toconstrain the conceptual model of the known geothermal field and 2) to evaluate thegeothermal resources in the northern part of the Bay of Bouillante. Thermal springsalong the north coast and on the sea floor of the bay indicate that high-temperaturefluids leak from a hypothetical reservoir located either beneath the bay or close to theE-W faults located north of the known reservoir. Geophysical methods consisted ofi) offshore, in a low-penetration, high-resolution seismic survey and a magnetic survey,and ii) onshore, in a 2D electrical resistivity tomography and a magnetic survey. Evenmore recently, during summer 2004, a broadband seismic network was set up aroundthe exploited part of the geothermal field and on the northern area where new largeresources are expected. The purpose is to test how inversion of natural seismic signalrecorded in a broad frequency range may apply for quantifying structural parameters(fractures locating, field extent) and dynamic parameters (fluid migration, phasechanging) of geothermal systems (Jousset, 2006).
BRGM/RP-57089-FR - Final report
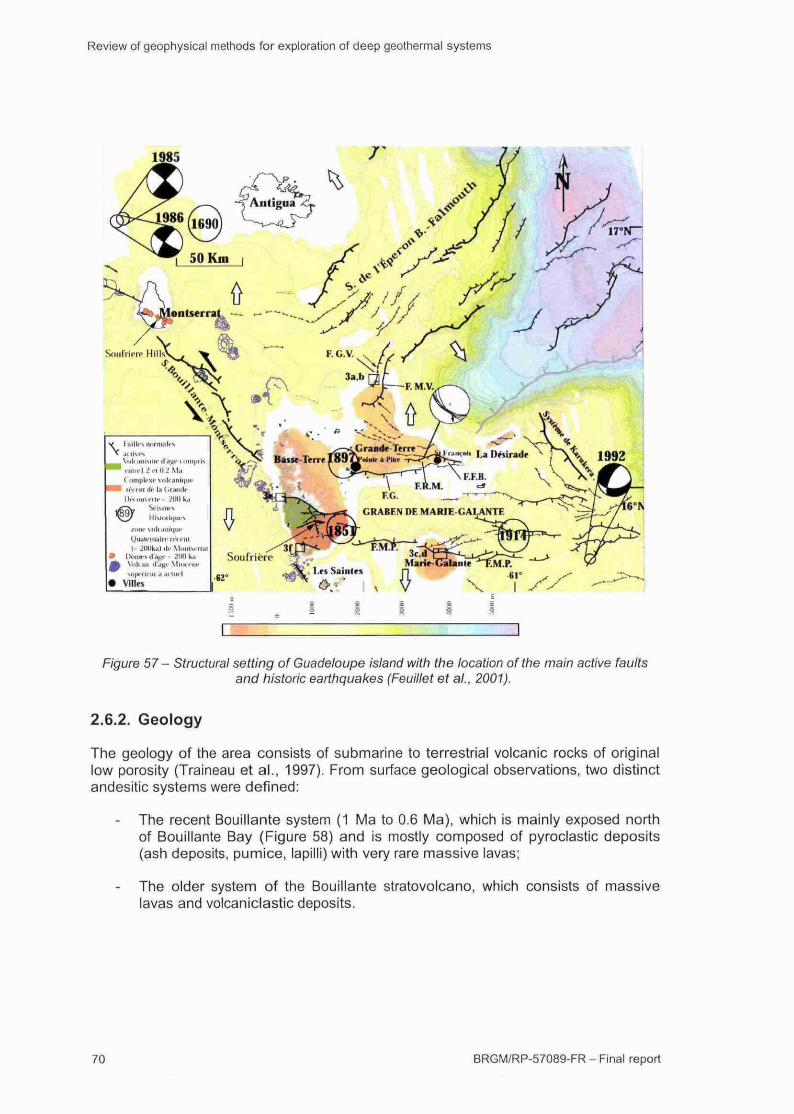
Review of geophysical methods for exploration of deep geothermal systems
F/jgure 57 - Structural setting of Guadeloupe island with the location of the main active faultsand historic earthquakes (Feuillet et al., 2001).
2.6.2. Geology
The geology of the area consists of submarine to terrestrial volcanic rocks of originallow porosity (Traineau et al., 1997). From surface geological observations, two distinctandesitic systems were defined:
The recent Bouillante system (1 Ma to 0.6 Ma), which is mainly exposed northof Bouillante Bay (Figure 58) and is mostly composed of pyroclastic deposits(ash deposits, pumice, lapilli) with very rare massive lavas;
- The older system of the Bouillante stratovolcano, which consists of massivelavas and volcaniclastic deposits.
70 BRGM/RP-57089-FR - Final report
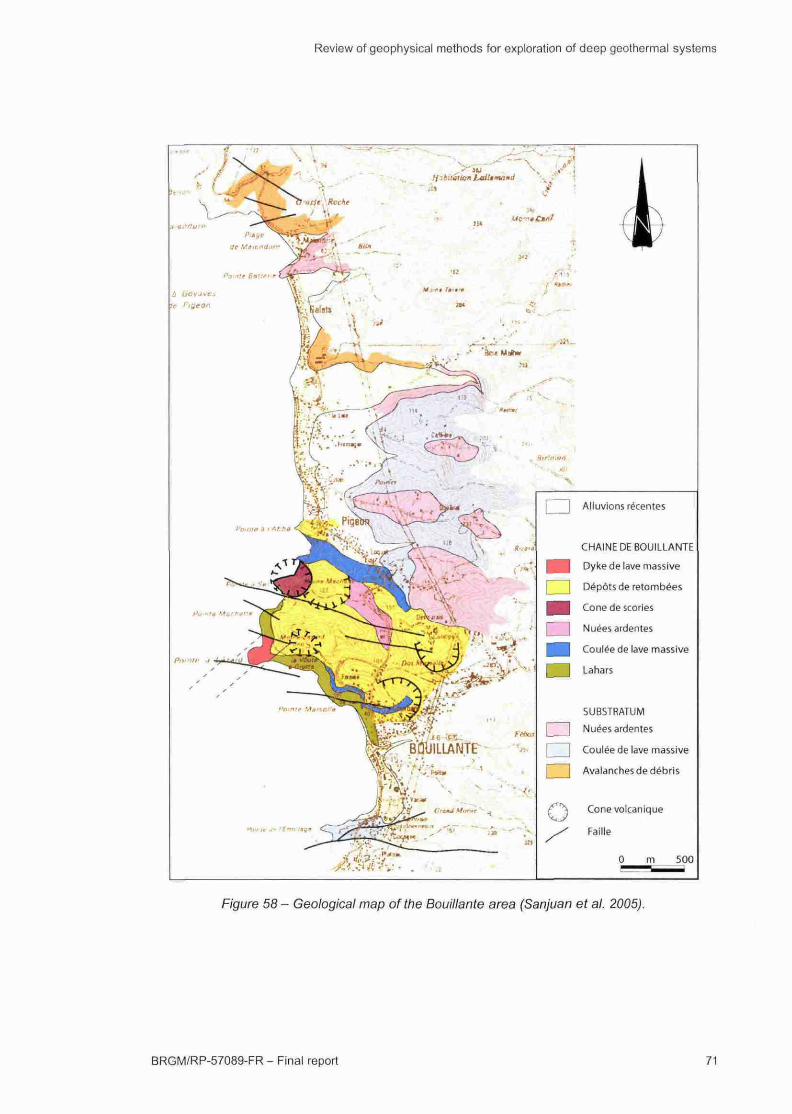
Review of geophysical methods for exploration of deep geothermal systems
CHAINE DE BOUILLANTE
1 ^ 1 Dyke de lave massive
I I Dépôts de retombées
^ J Cone de scories
[ ] Nuées ardentes
^ H Coulée de lave massive
Lahars
SUBSTRATUM
I I Nuées ardentes
I I Coulée de lave massive
I I Avalanches de débris
Cone volcanique
Figure 58 - Geological map of the Bouillante area (Sanjuan et ai. 2005).
BRGM/RP-57089-FR - Final report
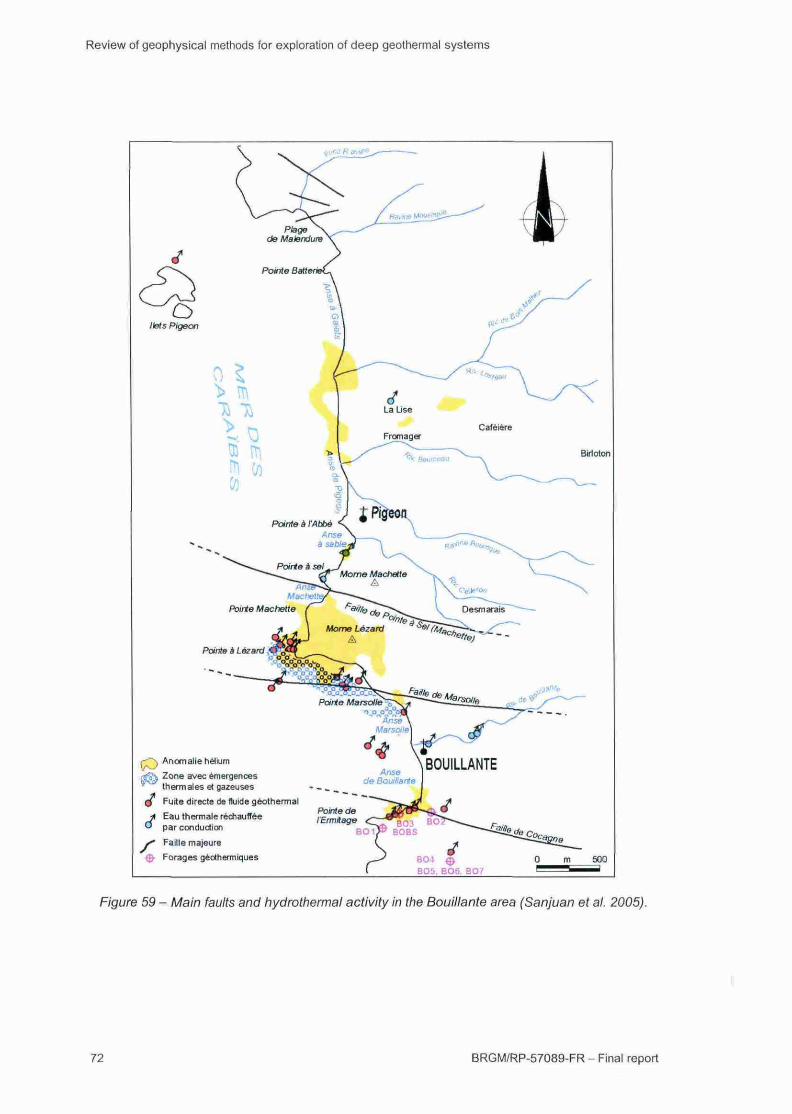
Review of geophysical methods for exploration of deep geothermal systems
O¡lets Pigeon
Pointe à Lézard
* taiO p a r
Anomalie hélium
Zone avec émergencesthermales et gazeuses - - „ _
Fuite directe de fluide géothermali- ... , - u «- Pointe deEau thermale réchauffée ¡-Ermitage
Birioton
par conduction
X" Faille majeure
ff> Forages géothermiques
Figure 59 - Main faults and hydrothermal activity in the Bouillante area (Sanjuan et ai. 2005).
72 BRGM/RP-57089-FR - Final report
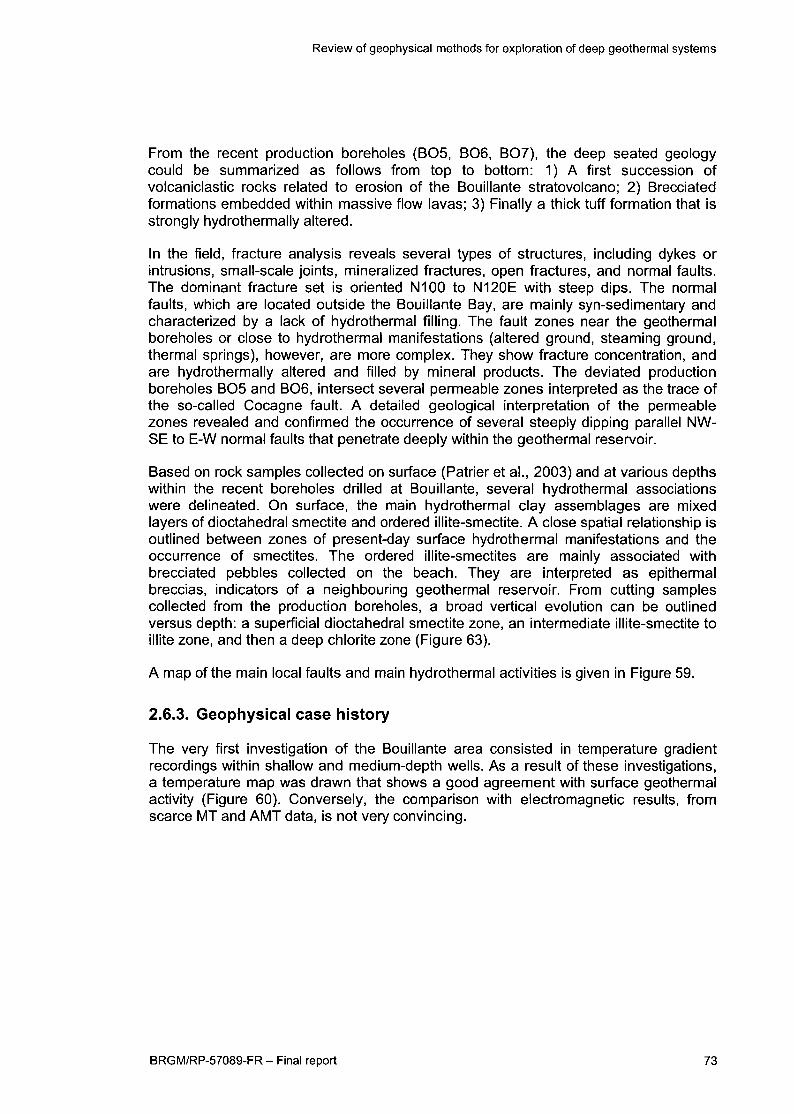
Review of geophysical methods for exploration of deep geothermal systems
From the recent production boreholes (B05, B06, B07), the deep seated geologycould be summarized as follows from top to bottom: 1) A first succession ofvolcaniclastic rocks related to erosion of the Bouillante stratovolcano; 2) Brecciatedformafions embedded within massive flow lavas; 3) Finally a thick tuff formafion that isstrongly hydrothermally altered.
In the field, fracture analysis reveals several types of structures, including dykes orintrusions, small-scale joints, mineralized fractures, open fractures, and normal faults.The dominant fracture set is oriented N100 to N120E with steep dips. The normalfaults, which are located outside the Bouillante Bay, are mainly syn-sedimentary andcharacterized by a lack of hydrothermal filling. The fault zones near the geothermalboreholes or close to hydrothermal manifestafions (altered ground, steaming ground,thermal springs), however, are more complex. They show fracture concentrafion, andare hydrothermally altered and filled by mineral products. The deviated producfionboreholes B05 and B06, intersect several permeable zones interpreted as the trace ofthe so-called Cocagne fault. A detailed geological interpretation of the permeablezones revealed and confirmed the occurrence of several steeply dipping parallel NW-SE to E-W normal faults that penetrate deeply within the geothermal reservoir.
Based on rock samples collected on surface (Patrier et al., 2003) and at various depthswithin the recent boreholes drilled at Bouillante, several hydrothermal associafionswere delineated. On surface, the main hydrothermal clay assemblages are mixedlayers of dioctahedral smectite and ordered illite-smectite. A close spafial relationship isoutlined between zones of present-day surface hydrothermal manifestations and theoccurrence of smectites. The ordered illite-smectites are mainly associated withbrecciated pebbles collected on the beach. They are Interpreted as epithermalbreccias, indicators of a neighbouring geothermal reservoir. From cuffing samplescollected from the producfion boreholes, a broad vertical evolution can be oufiinedversus depth: a superficial dioctahedral smectite zone, an intermediate illite-smectite toillite zone, and then a deep chlorite zone (Figure 63).
A map ofthe main local faults and main hydrothermal activifies is given in Figure 59.
2.6.3. Geophysical case history
The very first invesfigafion of the Bouillante area consisted in temperature gradientrecordings within shallow and medium-depth wells. As a result of these invesfigafions,a temperature map was drawn that shows a good agreement with surface geothermalacfivity (Figure 60). Conversely, the comparison with electromagnetic results, fromscarce MT and AMT data, is not very convincing.
BRGM/RP-57089-FR - Final report 73
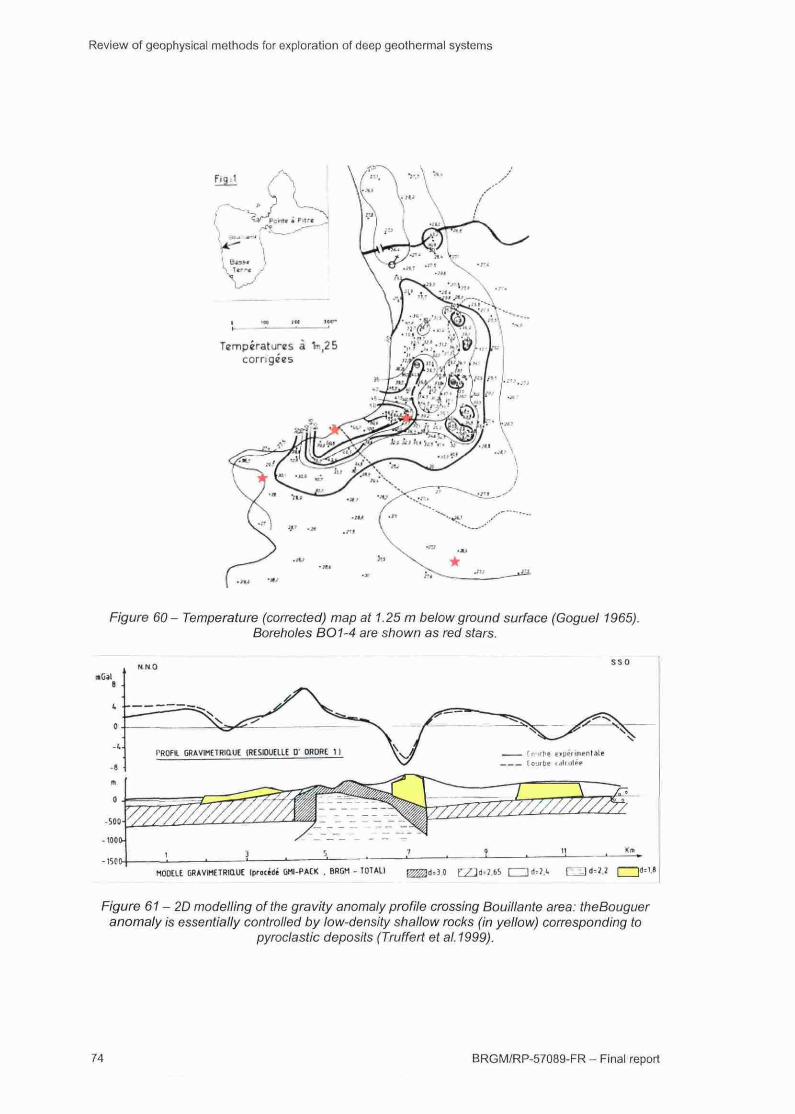
Review of geophysical methods for exploration of deep geothermal systems
Températures à V r25corrigées
Figure 60- Temperature (corrected) map at 1.25 m below ground surface (Goguel 1965).Boreholes BO1-4 are shown as red stars.
N.N.0 5 5 0
«Gal
PROFIL GfiAVIMETRIQUE (RESIDUELLE 0' ORDRE 1 ]
MODELE GRAVIMETRIQUE (protédí ÜHI-PACK . BRGM - TOTAL) ^ ^ d = 3 0 f / J d ^ . f c S f ]<t=?.t f f - ) d = 2 . ? | | ^
Figure 61-2D modelling of the gravity anomaly profile crossing Bouillante area: theBougueranomaly is essentially controlled by low-density shallow rocks (in yellow) corresponding to
pyroclastic deposits (Truffert et al. 1999).
74 BRGM/RP-57089-FR - Final report
Review of geophysical methods for exploration of deep geothermal systems
The Bouguer anomaly map of the Bouillante area is mainly controlled by a strongdensity contrast within the most superficial volcanic deposit, which masks the deeperstructures of interest for geothermal exploration. 2D modelling of a gravity profile
crossing the Bouillante area and constrained using data from geological mapping, isshown Figure 61. Recent, low-density pyroclastics are irregulariy distributed and causean anomaly of up to 10 mgals, which preclude confident interprétafion at greater depth.
Of the recent investigafions, magnetics and geoelectrics provide the most interestingresults. Shallow-penetration seismics, helpful for constraining the structural patternoffshore, provide no information about the reservoir itself and its results are thereforenot discussed here.
Low magnetic areas are observed at the location where the hotter geothermal activityoccurs, while highly magnefic areas that correlate with high-resistivity areas correspondto younger volcanic relief. The hypotheses of a de-magnefizafion caused by thermalalteration or hydrothermal weathering are envisaged for explaining these weakmagnetic anomalies (Figure 62).
DC-resisfivity imaging using a dipole-dipole configurafion with a spacing of 200 to400 m has been applied along a 8 km profile crossing the Bouillante area. Its purposewas the further characterizing of new potential areas of interest, previously revealed bygeology and geochemistry to the north of the present-day exploitation. The resistivitycross-secfion presented in Figure 62 is the result of a 2D inversion on which the seaside effect has been reduced by modelling (earth model at 10 ohm.m) andmeasurements using electrodes close to the borehole B04-B07 were removed(Debeglia and Bourgeois, 2007). It shows various features in good agreement with theknown geology and geothermal characterisfics:
Electrically conducfive anomalies at the locafion of geothermal activity andhelium anomalies that correlate with the producing wells B02, B04 and B06,as well as with some ofthe main known faults;
Electrically resistive anomalies correlated to the younger volcanic structures,which appear essenfially resisfive because of low permeability and weakweathering, and partially correlate with the non-productive B07 well.
Figure 63 compares the vertical reslsfivity distribufion resulfing from the abovepresented cross-section, with the clay and temperature data from boreholes B02 andB04 to 7. From top to bottom, four zones are defined:
- A superficial resisfive zone (up to 70 m depth in B04) that is attributed to theweakly altered formafion where ionic conducfion should dominate. This lastproposal is supported by the fact that lower resistivities are observed at B02(located at sea level where saline intrusion occurs) than at B04 (90 m a.s. I.where meteoric water Is expected).
- A superficial smectite zone occurs down to 250-300 m depth in B04-7 and ischaracterized by temperatures below 200°C and a reslsfivity below 2 ohm.m.
BRGM/RP-57089-FR - Final report 75
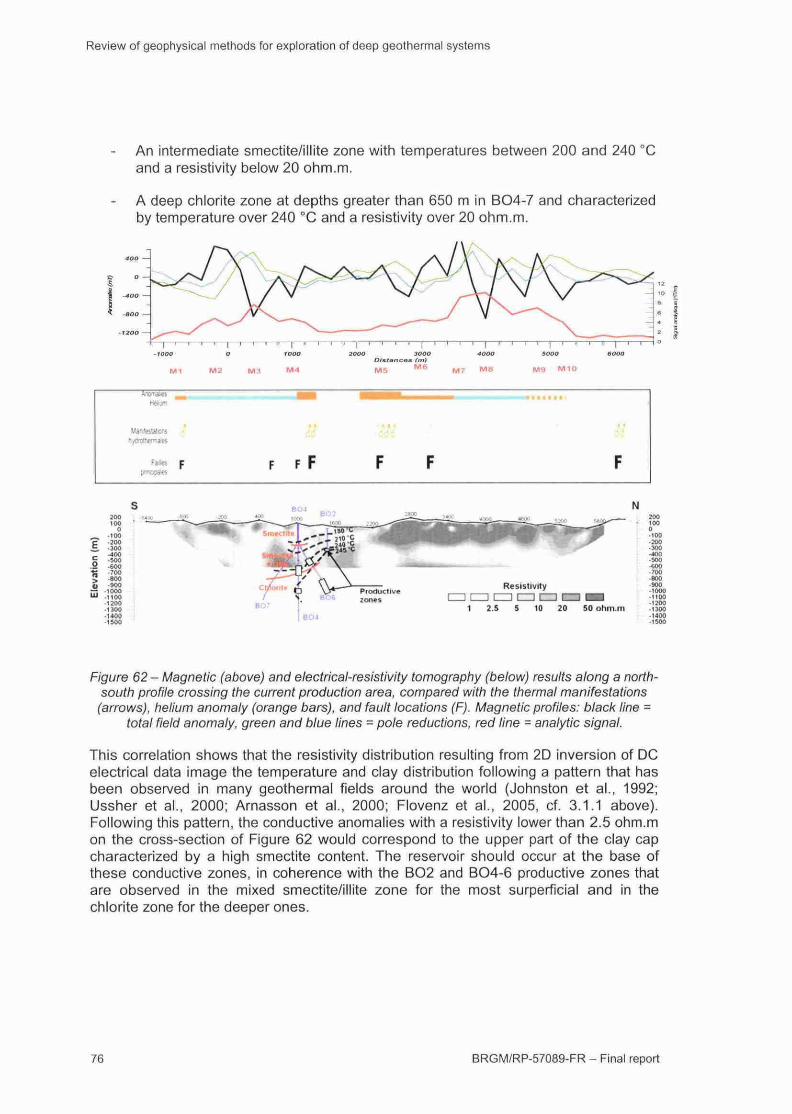
Review of geophysical methods for exploration of deep geothermal systems
An intermediate smectite/illite zone with temperatures between 200 and 240 °Cand a resistivity below 20 ohm.m.
A deep chlorite zone at depths greater than 650 m in BO4-7 and characterizedby temperature over 240 °C and a resistivity over 20 ohm.m.
'»?-1300-1400-1500
ResistivityCH CD CD HD CD CZJ E&a
1 2.5 5 10 20 50 ohm.mBOi
•600•TOO-800-900• 10OO-MOD
•1300-1400• IK»
Figure 62 - Magnetic (above) and electrical-resistivity tomography (below) results along a north-south profile crossing the current production area, compared with the thermal manifestations(arrows), helium anomaly (orange bars), and fault locations (F). Magnetic profiles: black line =
total field anomaly, green and blue lines = pole reductions, red line = analytic signal.
This correlation shows that the resistivity distribution resulting from 2D inversion of DCelectrical data image the temperature and clay distribution following a pattern that hasbeen observed in many geothermal fields around the world (Johnston et al., 1992;Ussher et al., 2000; Arnasson et al., 2000; Flovenz et al., 2005, cf. 3.1.1 above).Following this pattern, the conductive anomalies with a resistivity lower than 2.5 ohm.mon the cross-section of Figure 62 would correspond to the upper part of the clay capcharacterized by a high smectite content. The reservoir should occur at the base ofthese conductive zones, in coherence with the BO2 and BO4-6 productive zones thatare observed in the mixed smectite/illite zone for the most superficial and in thechlorite zone for the deeper ones.
BRGM/RP-57089-FR - Final report
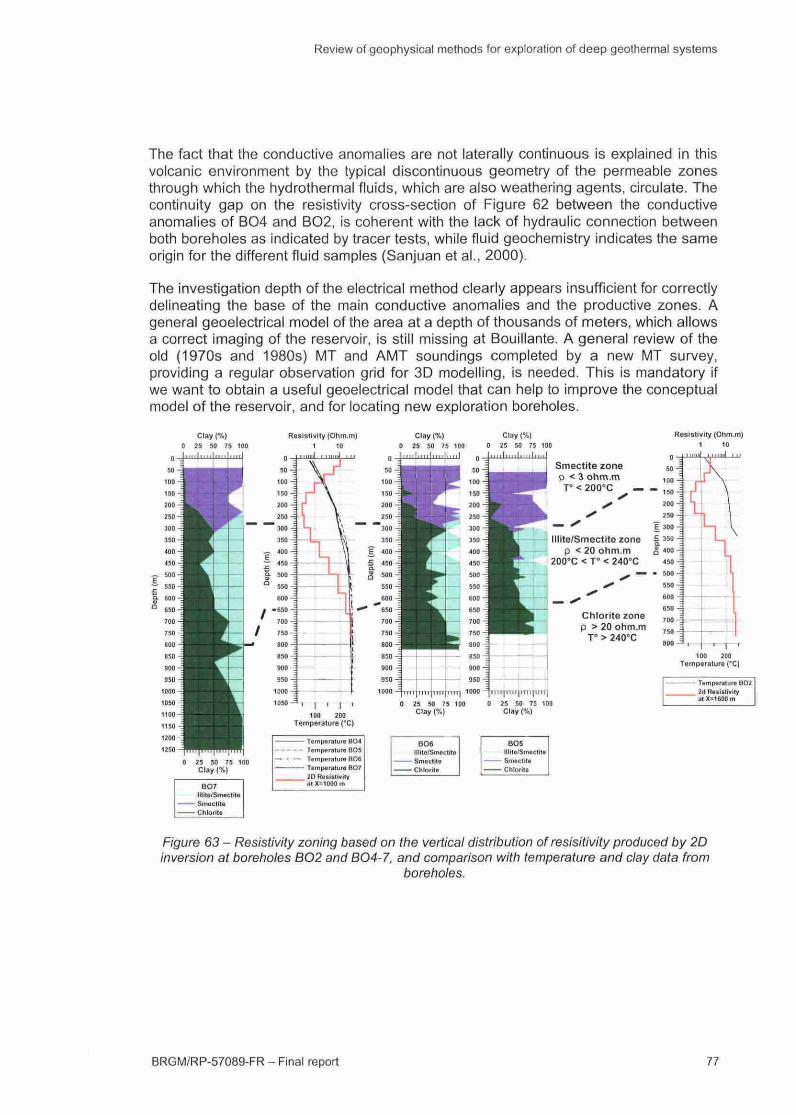
Review of geophysical methods for exploration of deep geothermal systems
The fact that the conductive anomalies are not laterally continuous is explained in thisvolcanic environment by the typical discontinuous geometry of the permeable zonesthrough which the hydrothermal fluids, which are also weathering agents, circulate. Thecontinuity gap on the resistivity cross-section of Figure 62 between the conductiveanomalies of BO4 and BO2, is coherent with the lack of hydraulic connection betweenboth boreholes as indicated by tracer tests, while fluid geochemistry indicates the sameorigin for the different fluid samples (Sanjuan et al., 2000).
The investigation depth of the electrical method clearly appears insufficient for correctlydelineating the base of the main conductive anomalies and the productive zones. Ageneral geoelectrical model of the area at a depth of thousands of meters, which allowsa correct imaging of the reservoir, is still missing at Bouillante. A general review of theold (1970s and 1980s) MT and AMT soundings completed by a new MT survey,providing a regular observation grid for 3D modelling, is needed. This is mandatory ifwe want to obtain a useful geoelectrical model that can help to improve the conceptualmodel of the reservoir, and for locating new exploration boreholes.
Clay (%)D 25 50 75 100
Resistivity (Ohm.m| Clay(%)25 50 75
Resistivity {Ohm.m)
Smectite zonep < 3 ohm.mT° <200°C
Illite/Smectite zonep < 20 ohm.m
200°C < T < 240°C
Chlorite zonep > 20 ohm.m
T > 240°C
100 ZOOTemperature (°CJ
Temperature BOZZd ResistivityalX=1600m
Figure 63 - Resistivity zoning based on the vertical distribution of resisttivity produced by 2Dinversion at boreholes BO2 and BO4-7, and comparison with temperature and clay data from
boreholes.
BRGM/RP-57089-FR - Final report 77
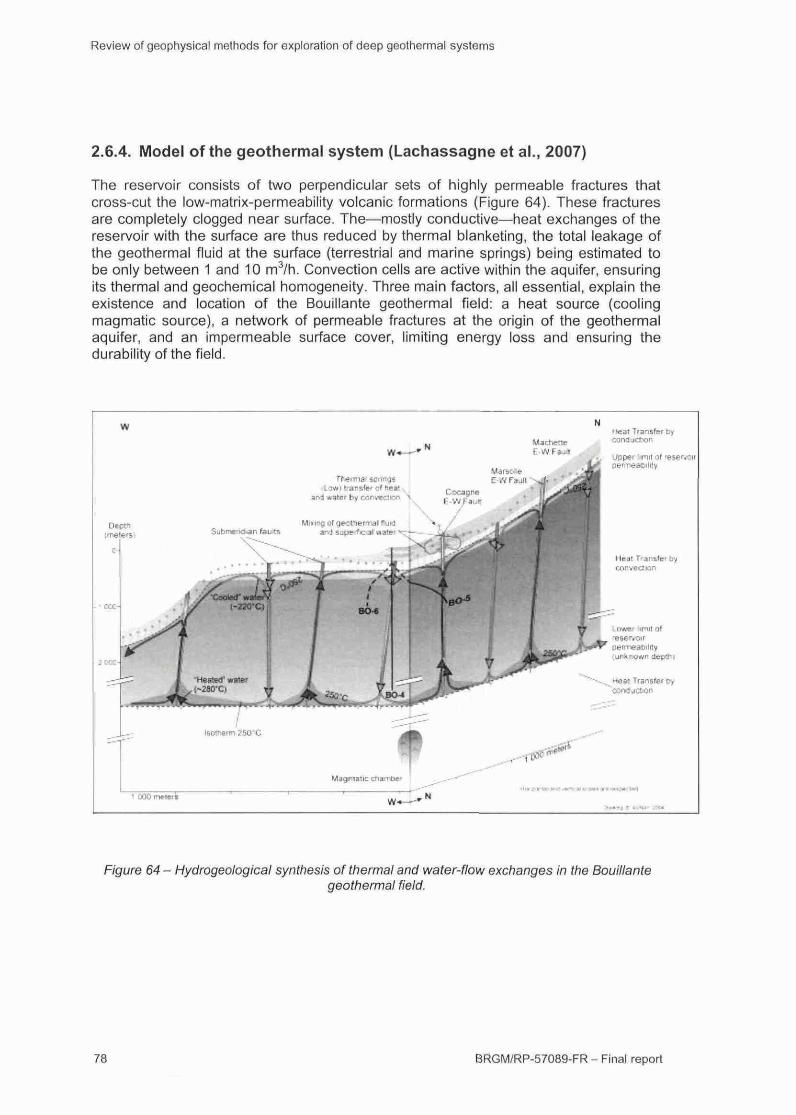
Review of geophysical methods for exploration of deep geothermal systems
2.6.4. Model of the geothermal system (Lachassagne et al., 2007)
The reservoir consists of two perpendicular sets of highly permeable fractures thatcross-cut the low-matrix-permeability volcanic formations (Figure 64). These fracturesare completely clogged near surface. The—mostly conductive—heat exchanges of thereservoir with the surface are thus reduced by thermal blanketing, the total leakage ofthe geothermal fluid at the surface (terrestrial and marine springs) being estimated tobe only between 1 and 10 m3/h. Convection cells are active within the aquifer, ensuringits thermal and geochemical homogeneity. Three main factors, all essential, explain theexistence and location of the Bouillante geothermal field: a heat source (coolingmagmatic source), a network of permeable fractures at the origin of the geothermalaquifer, and an impermeable surface cover, limiting energy loss and ensuring thedurability of the field.
w ransfer by
•, Uppef 'mi l of reservo«
Oeotn
Figure 64 - Hydrogeological synthesis of thermal and water-flow exchanges in the Bouillantegeothermal field.
78 BRGM/RP-57089-FR - Final report
Review of geophysical methods for exploration of deep geothermal systems
2.7. FABIANSEBESTYEN-NAGYSZENAS
2.7.1. High-enthalpy geothermal reservoirs in Hungary
In 1985, a heavy steam and water eruption occurred in the hydrocarbon explorafionwell Fáb-4. The source of the blow-out was located at a depth of 3800-4000 m inTriassic carbonates. The temperature was 202 °C at a depth of 4426 m b.s.l. At the
latest at that fime, a discussion of the existence of high-enthalpy reservoirs started InHungary (cf. Stegena et al., 1992, Rumpler 1987). Since then, several authors havebeen recording areas and regions that host potenfial high-enthalpy reservoirs (Stegenaetal., 1992, Árpási 2000).
These authors suggested aspects for the selecfion of areas with potential high-enthalpygeothermal reservoirs in the Pannonian Basin. These special geothermal reservoirsmay be formed in that part of the country with high heat flow where remarkablesecondary porosity occurs in the basement rocks due to faulfing or karstification.Another criterion Is that the temperatures must be higher than 150 °C.
Following the selection criteria by several authors, a sketch map has been constructedfor the potential high-enthalpy regions in Hungary (Figure 65). The basis therefore arethousands of hydrocarbon- and water-explorafion wells, as well as hundreds of seismicprofiles.
First invesfigafions for high-enthalpy reservoirs were carried out at theFábiánsebestyén-Nagyszénás site. These reservoirs are to be investigated in moredetail in the course of ongoing research projects. Therefore, it appears to bereasonable to compile the collected data and to analyse them.
According to Kujbus (2005) and Árpási and Zili (2002), a pilot project is being carriedout by MOL (Magyar Olaj - Hungarian Oil Company) in the Fábiánsebestyén-Nagyszénás area aiming at the exploitation of high-enthalpy reservoirs. For that, long-term producfion tests are planned (Árpási et al., 2003). A series of accompanyingresearch reports have been published (Pátzay et al., 2003, Árpási et al., 2003, Árpásiand Unk 2003, Árpási et al., 2000, Nemeth 1999, Nemesi et al., 1996). Between 1980and 1995, many publicafions appeared containing also a major amount of geothermallyrelevant data also for the Fábiánsebestyén-Nagyszénás area (e.g., Dôvényi et al.,1983; Rumpler et al., 1987; Stegena et al., 1992 and 1994; Nagy et al., 1992). Thesedata are presented hereafter.
2.7.2. Geological setting
The Fábiánsebestyén-Nagyszénás area is located in the Pannonian Basin which is partof the Great Hungarian Platform. It can be allocated to the Békés Basin forming a sub-basin (Figure 66).
The Tertiary infilling of the basin is 2500 to 3500 m thick. Cretaceous, Triassic,Permian and Precambrian rocks are found underneath the Tertiary schluff/siltstone,sands and clays. The structure ofthe underground is shown on Figure 67.
BRGM/RP-57089-FR - Final report 79
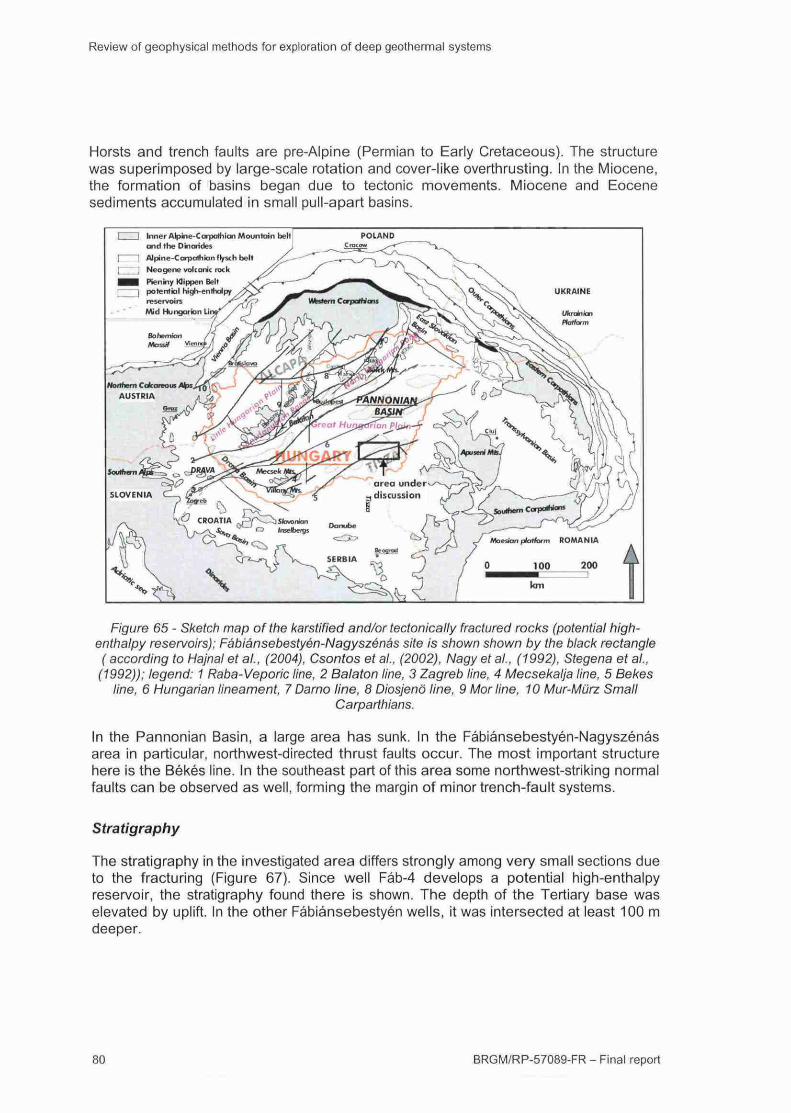
Review of geophysical methods for exploration of deep geothermal systems
Horsts and trench faults are pre-Alpine (Permian to Early Cretaceous). The structurewas superimposed by large-scale rotation and cover-like overthrusting. In the Miocene,the formation of basins began due to tectonic movements. Miocene and Eocenesediments accumulated in small pull-apart basins.
I ) Inner Alpine-Carpathian Mountain beltand the D •tari des
I I Alpine-Ccvpatfiian ftysth belt
| , Neo gene volcanic rock^ ^ H Pienriy Klippen Belt| | potential high-enthalpy
reservoirs' ' Mid Hungarian Li
POLAND
UKRAINE
Ukrainianffofform
Figure 65 - Sketch map of the karstified and/or tectonically fractured rocks (potential high-enthaipy reservoirs); Fábiánsebestyén-Nagyszénás site is shown shown by the black rectangle( according to Hajnal et at., (2004), Csontos et al., (2002), Nagy et al., (1992), Stegena et al.,
(1992)); legend: 1 Raba-Veporic line, 2 Balaton line, 3 Zagreb line, 4 Mecsekalja line, 5 Bekesline, 6 Hungarian lineament, 7 Darno line, 8 Diosjenö line, 9 Mor line, 10 Mur-Mürz Small
Carparthians.
In the Pannonian Basin, a large area has sunk. In the Fábiánsebestyén-Nagyszénásarea in particular, northwest-directed thrust faults occur. The most important structurehere is the Békés line. In the southeast part of this area some northwest-striking normalfaults can be observed as well, forming the margin of minor trench-fault systems.
Stratigraphy
The stratigraphy in the investigated area differs strongly among very small sections dueto the fracturing (Figure 67). Since well Fáb-4 develops a potential high-enthalpyreservoir, the stratigraphy found there is shown. The depth of the Tertiary base waselevated by uplift. In the other Fábiánsebestyén wells, it was intersected at least 100 mdeeper.
BRGM/RP-57089-FR - Final report
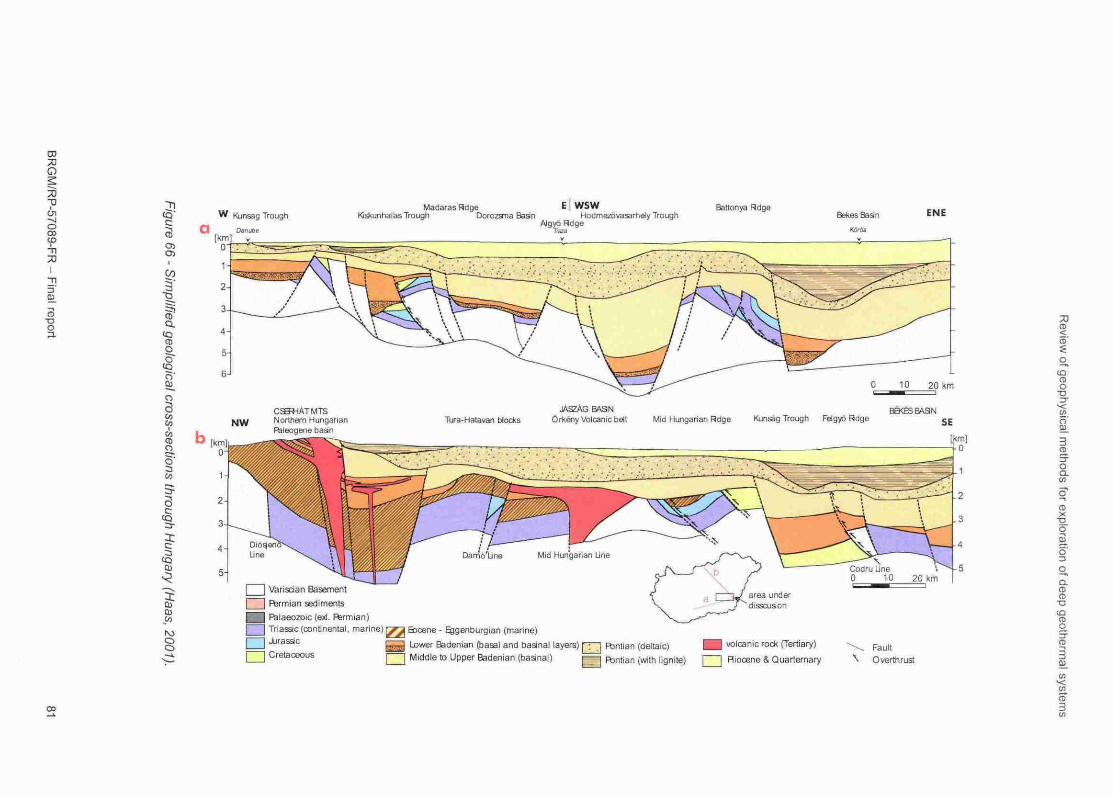
CD
O
~pein•-JoCOCD
73I
3
3ic3
ta
1"8
i
ICo
i
W Kunsag Trough
Cl Danube[km]
MadarasRdge E W S WWsfcunhalas Trough Dorozsna Basin Hodma;ovasarhely Trouqh
•• iRdge
Battonya RdgeBekes Basin
Kurds
CESÍHÁTMTSNorthern HungarianF^leoqene bfian
BA9N BÔ<ÉSB^3NTura-Halavan blocks Orkény Volcanic bell Mid Hungarian Rdge Kunsag Trough Felgyö Rdge
I I Varisciart Basement
[ | Fermian sediments
WÊÊ Falaeozoic (exj. Ffermian)| 1 Triassic (continental, marine) r^^i Bjcene- ^genburgian (marine)
I I ^rasac y ^ Lower Badenian (basal and basinal layers) r y - [ Fbntian (deltaic) ^ H volcanic rock (Tertiary) --^^ F a u ! t
• C r e t a c e o u s \^J Middle to Upper Badenian (basnal) ra Fbntian (with lignite) f I Hiocene & Quartemary \ Overthrusî
I
II
O
Í
I
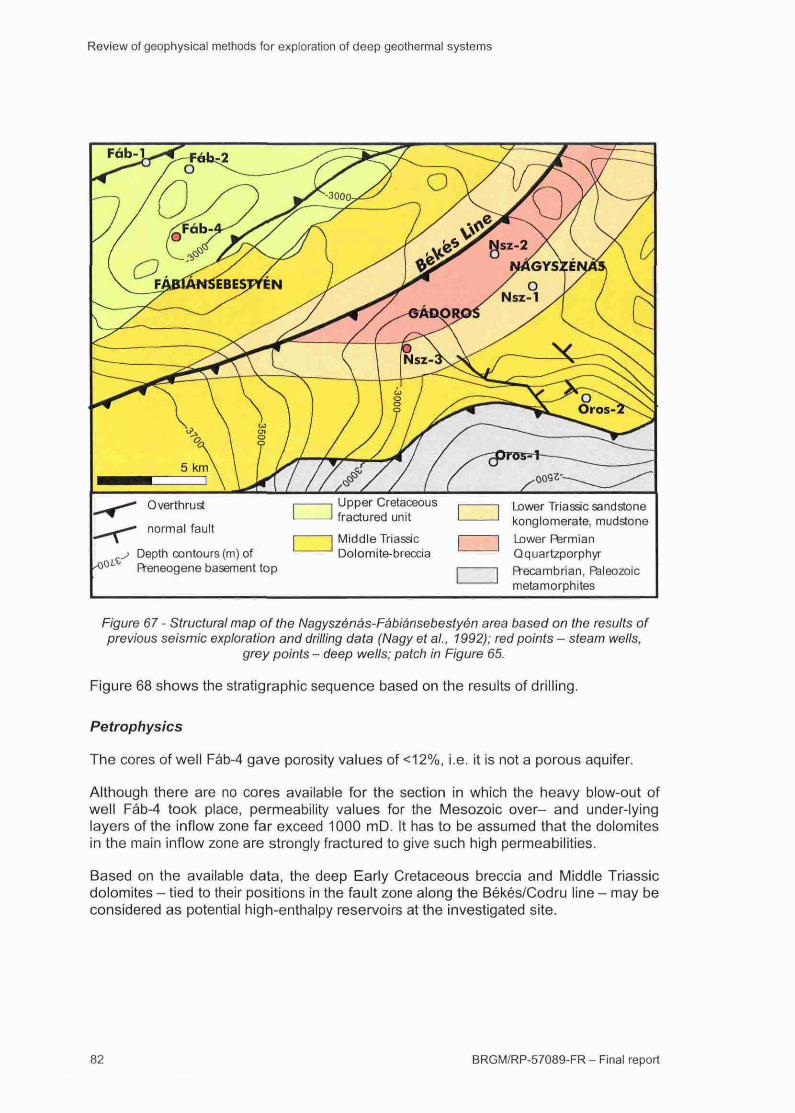
Review of geophysical methods for exploration of deep geothermal systems
OFÁBlANSEBESTYEN
Overthrust
normal fault
Depth contours (m) ofReneogene basement top
Upper Cretaceousfractured unit
Middle TriassicDo I omite-breccia
Lower Triassic sandstonekonglomerate, mudstone
Lower FtermianQquartzporphyrRecambrian, Faleozoicmetamorph ¡tes
Figure 67 - Structural map of the Nagyszénás-Fábiánsebestyén area based on the results ofprevious seismic exploration and drilling data (Nagy et al., 1992); red points - steam wells,
grey points - deep wells; patch in Figure 65.
Figure 68 shows the stratigraphie sequence based on the results of drilling.
Petrophysics
The cores of well Fáb-4 gave porosity values of <12%, i.e. it is not a porous aquifer.
Although there are no cores available for the section in which the heavy blow-out ofwell Fáb-4 took place, permeability values for the Mesozoic over- and under-lyinglayers of the inflow zone far exceed 1000 mD. It has to be assumed that the dolomitesin the main inflow zone are strongly fractured to give such high permeabilities.
Based on the available data, the deep Early Cretaceous breccia and Middle Triassicdolomites - tied to their positions in the fault zone along the Békés/Codru line - may beconsidered as potential high-enthalpy reservoirs at the investigated site.
82 BRGM/RP-57089-FR - Final report
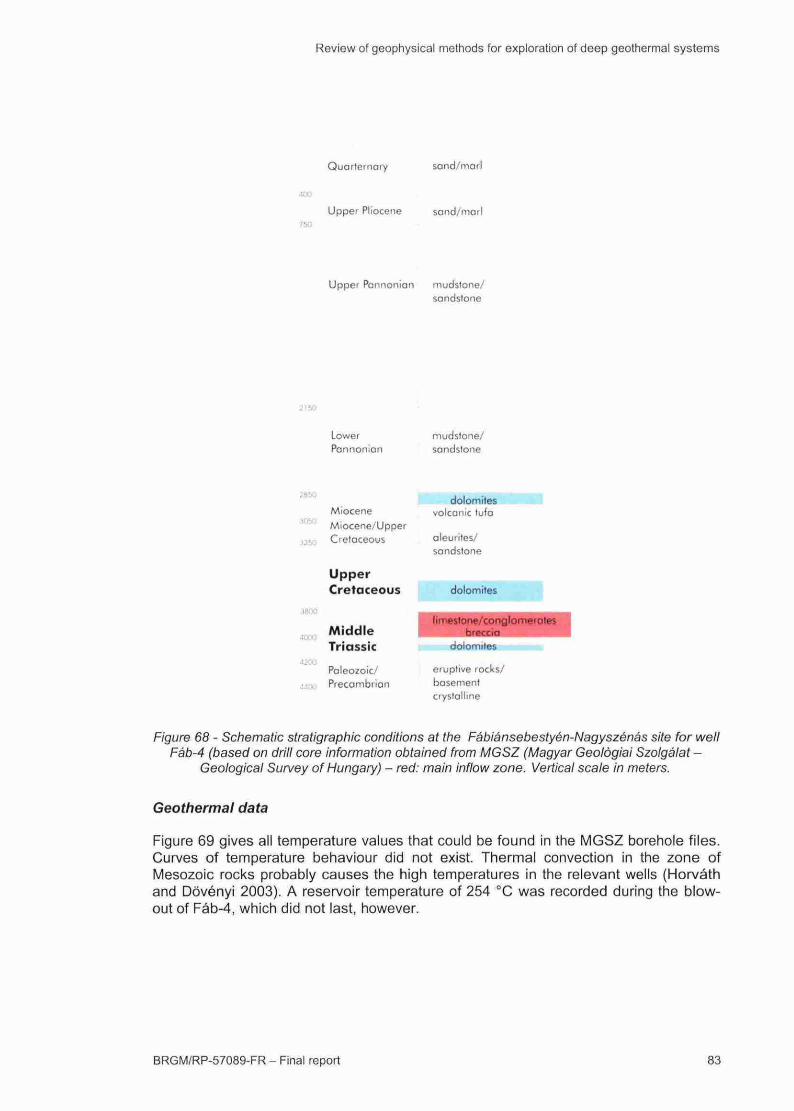
Review of geophysical methods for exploration of deep geothermal systems
750
Quaternary sand/marl
Upper Pliocene sand/marl
Upper Pannonian mudsione/sandstone
2150
2850
3QSO
3350
39QO
4200
440Û
LowerPon non ion
MioceneMiocene/UpperCretaceous
UpperCretaceous
Triassk
Paleozoic/Precambrian
mudstone/sandstone
dolomitesvolcanic tufa
aleurites/sandstone
dolomites
^limestone/conglomerotes 1W breccia 1
dolomites
eruptive rocks/basementcrystalline
Figure 68 - Schematic stratigraphie conditions at the Fábiánsebestyén-Nagyszénás site for wellFáb-4 (based on drill core information obtained from MGSZ (Magyar Geologiai Szolgálat -
Geological Survey of Hungary) - red: main inflow zone. Vertical scale in meters.
Geothermal data
Figure 69 gives all temperature values that could be found in the MGSZ borehole files.Curves of temperature behaviour did not exist. Thermal convection in the zone ofMesozoic rocks probably causes the high temperatures in the relevant wells (Horváthand Dovényi 2003). A reservoir temperature of 254 °C was recorded during the blow-out of Fáb-4, which did not last, however.
BRGM/RP-57089-FR - Final report
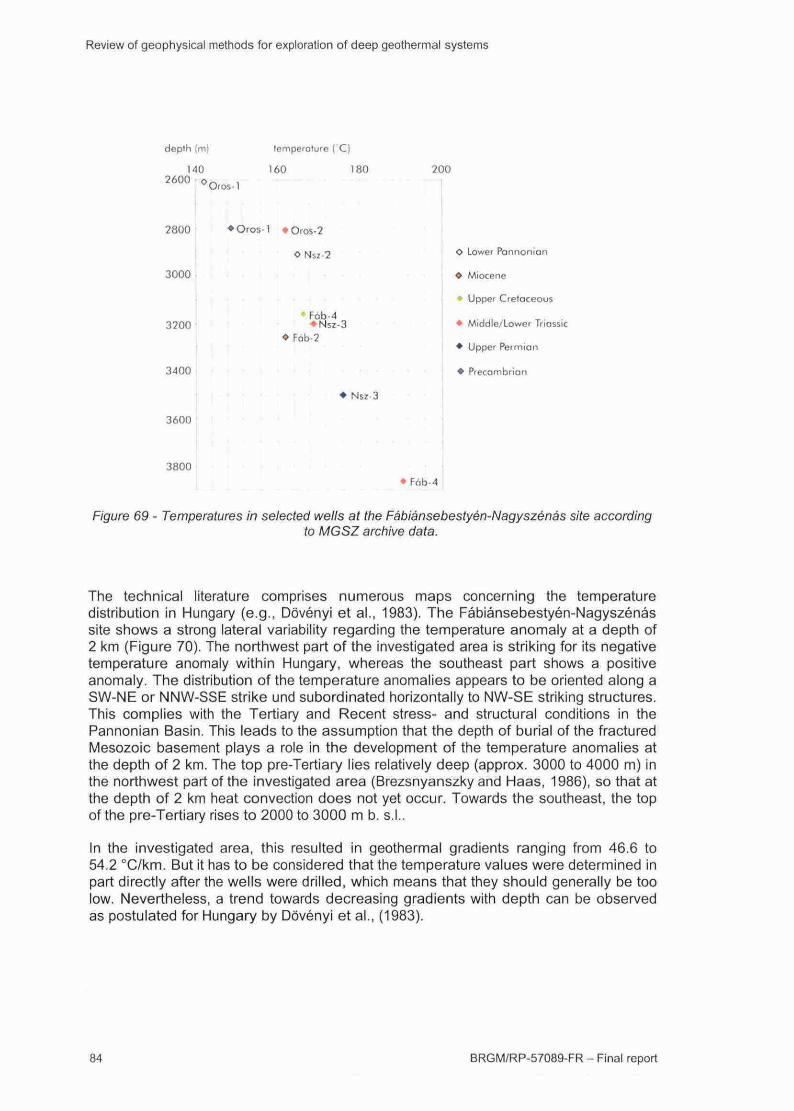
Review of geophysical methods for exploration of deep geothermal systems
depth (m)
1402600 o
temperature ( C)
160 J8J0 200
2800
3000
3200
3400
3600
3800
Ofos-1
•Oros 1 • Oros-2
• Fáb-4• Nsz-3
• Fób-2
Nsz-3
• Fáb-4
O Lower Pannonian
• Miocene
• Upper Cretaceous
• Middle/Lower Tnossic
• Upper Permian
• Precambrian
Figure 69 - Temperatures in selected wells at the Fábiánsebestyén-Nagyszénás site accordingto MGSZ archive data.
The technical literature comprises numerous maps concerning the temperaturedistribution in Hungary (e.g., Dovényi et al., 1983). The Fábiánsebestyén-Nagyszénássite shows a strong lateral variability regarding the temperature anomaly at a depth of2 km (Figure 70). The northwest part of the investigated area is striking for its negativetemperature anomaly within Hungary, whereas the southeast part shows a positiveanomaly. The distribution of the temperature anomalies appears to be oriented along aSW-NE or NNW-SSE strike und subordinated horizontally to NW-SE striking structures.This complies with the Tertiary and Recent stress- and structural conditions in thePannonian Basin. This leads to the assumption that the depth of burial of the fracturedMesozoic basement plays a role in the development of the temperature anomalies atthe depth of 2 km. The top pre-Tertiary lies relatively deep (approx. 3000 to 4000 m) inthe northwest part of the investigated area (Brezsnyanszky and Haas, 1986), so that atthe depth of 2 km heat convection does not yet occur. Towards the southeast, the topof the pre-Tertiary rises to 2000 to 3000 m b. s.l..
In the investigated area, this resulted in geothermal gradients ranging from 46.6 to54.2 °C/km. But it has to be considered that the temperature values were determined inpart directly after the wells were drilled, which means that they should generally be toolow. Nevertheless, a trend towards decreasing gradients with depth can be observedas postulated for Hungary by Dovényi et al., (1983).
BRGM/RP-57089-FR - Final report
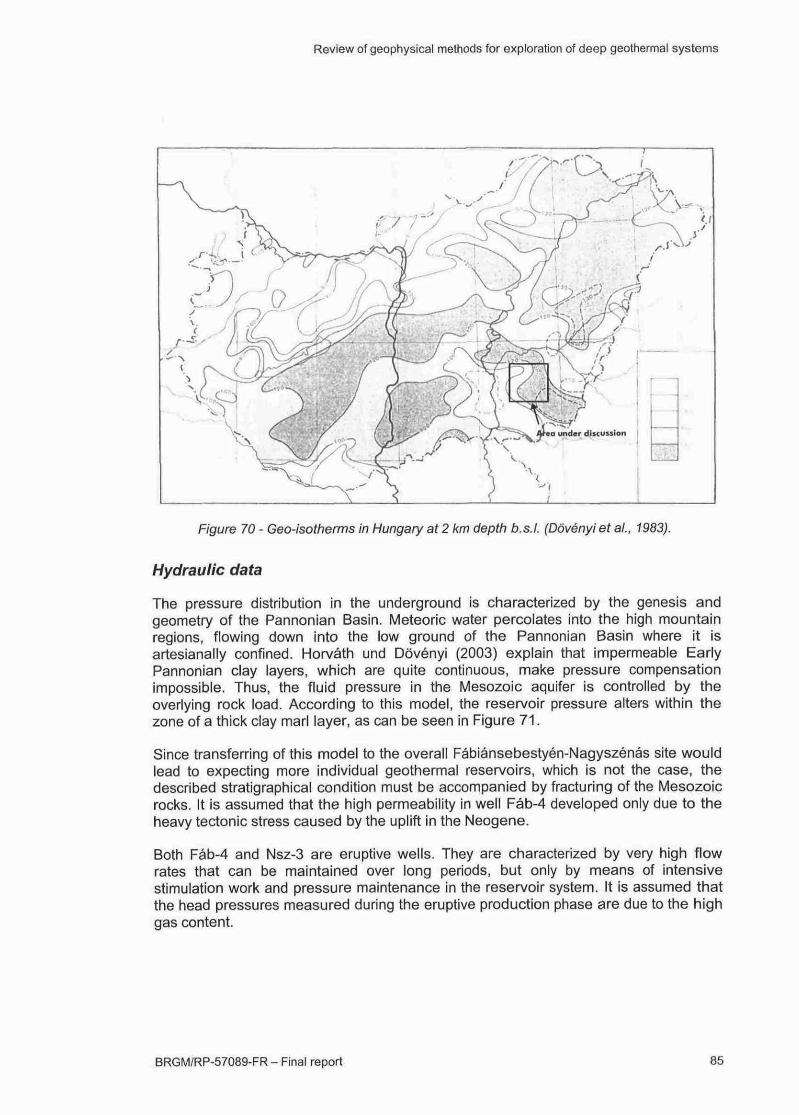
Review of geophysical methods for exploration of deep geothermal systems
V
Figure 70 - Geo-isotherms in Hungary at 2 km depth b.s.l. (Dovényi et al., 1983).
Hydraulic data
The pressure distribution in the underground is characterized by the genesis andgeometry of the Pannonian Basin. Meteoric water percolates into the high mountainregions, flowing down into the low ground of the Pannonian Basin where it isartesianally confined. Horváth und Dovényi (2003) explain that impermeable EarlyPannonian clay layers, which are quite continuous, make pressure compensationimpossible. Thus, the fluid pressure in the Mesozoic aquifer is controlled by theoverlying rock load. According to this model, the reservoir pressure alters within thezone of a thick clay marl layer, as can be seen in Figure 71.
Since transferring of this model to the overall Fábiánsebestyén-Nagyszénás site wouldlead to expecting more individual geothermal reservoirs, which is not the case, thedescribed stratigraphical condition must be accompanied by fracturing of the Mesozoicrocks. It is assumed that the high permeability in well Fáb-4 developed only due to theheavy tectonic stress caused by the uplift in the Neogene.
Both Fáb-4 and Nsz-3 are eruptive wells. They are characterized by very high flowrates that can be maintained over long periods, but only by means of intensivestimulation work and pressure maintenance in the reservoir system. It is assumed thatthe head pressures measured during the eruptive production phase are due to the highgas content.
BRGM/RP-57089-FR - Final report S5
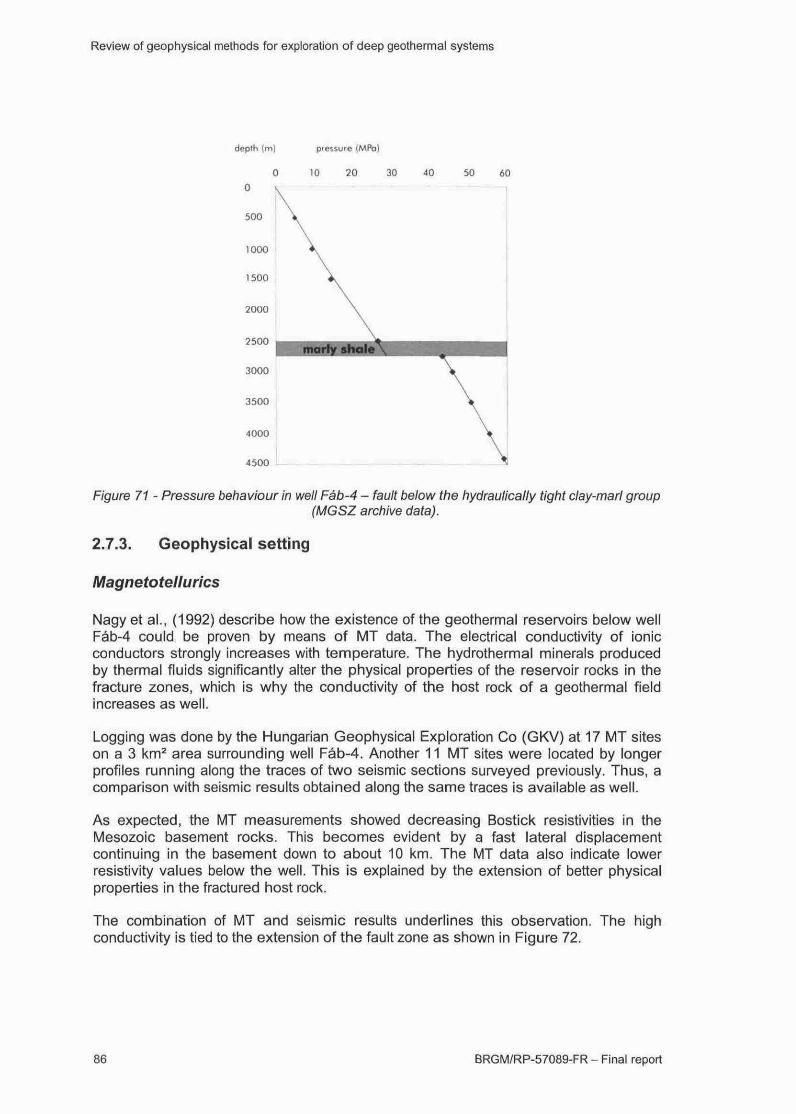
Review of geophysical methods for exploration of deep geothermal systems
depth (m) pressure (MPo)
10 20 30 50 60
Figure 71 - Pressure behaviour in well Fáb-4 - fault below the hydraulicaily tight clay-marl group(MGSZ archive data).
2.7.3. Geophysical setting
Magnetotellurics
Nagy et al., (1992) describe how the existence of the geothermal reservoirs below wellFáb-4 could be proven by means of MT data. The electrical conductivity of ionicconductors strongly increases with temperature. The hydrothermal minerals producedby thermal fluids significantly alter the physical properties of the reservoir rocks in thefracture zones, which is why the conductivity of the host rock of a geothermal fieldincreases as well.
Logging was done by the Hungarian Geophysical Exploration Co (GKV) at 17 MT siteson a 3 km2 area surrounding well Fáb-4. Another 11 MT sites were located by longerprofiles running along the traces of two seismic sections surveyed previously. Thus, acomparison with seismic results obtained along the same traces is available as well.
As expected, the MT measurements showed decreasing Bostick resistivities in theMesozoic basement rocks. This becomes evident by a fast lateral displacementcontinuing in the basement down to about 10 km. The MT data also indicate lowerresistivity values below the well. This is explained by the extension of better physicalproperties in the fractured host rock.
The combination of MT and seismic results underlines this observation. The highconductivity is tied to the extension of the fault zone as shown in Figure 72.
BRGM/RP-57089-FR - Final report
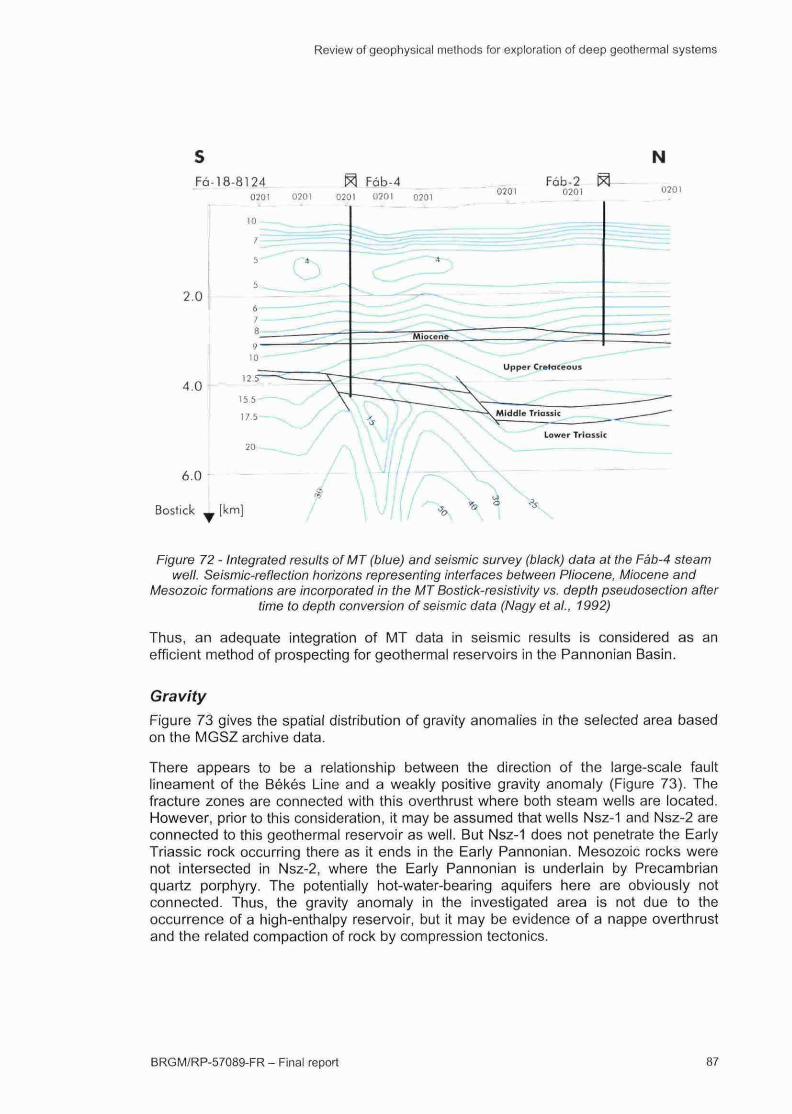
Review of geophysical methods for exploration of deep geothermal systems
NFá-18-8124_
0201 0201
^ Fc.b-4 _0201 020t 0201 0201
Fáb-20201 0201
Bostick _ [km]
Figure 72 - Integrated results of MT (blue) and seismic survey (black) data at the Fáb-4 steamwell. Seismic-reflection horizons representing interfaces between Pliocene, Miocene and
Mesozoic formations are incorporated in the MT Bostick-resistivity vs. depth pseudosection aftertime to depth conversion of seismic data (Nagy et al., 1992)
Thus, an adequate integration of MT data in seismic results is considered as anefficient method of prospecting for geothermal reservoirs in the Pannonian Basin.
GravityFigure 73 gives the spatial distribution of gravity anomalies in the selected area basedon the MGSZ archive data.
There appears to be a relationship between the direction of the large-scale faultlineament of the Békés Line and a weakly positive gravity anomaly (Figure 73). Thefracture zones are connected with this overthrust where both steam wells are located.However, prior to this consideration, it may be assumed that wells Nsz-1 and Nsz-2 areconnected to this geothermal reservoir as well. But Nsz-1 does not penetrate the EarlyTriassic rock occurring there as it ends in the Early Pannonian. Mesozoic rocks werenot intersected in Nsz-2, where the Early Pannonian is underlain by Precambrianquartz porphyry. The potentially hot-water-bearing aquifers here are obviously notconnected. Thus, the gravity anomaly in the investigated area is not due to theoccurrence of a high-enthalpy reservoir, but it may be evidence of a nappe overthrustand the related compaction of rock by compression tectonics.
BRGM/RP-57089-FR - Final report 87
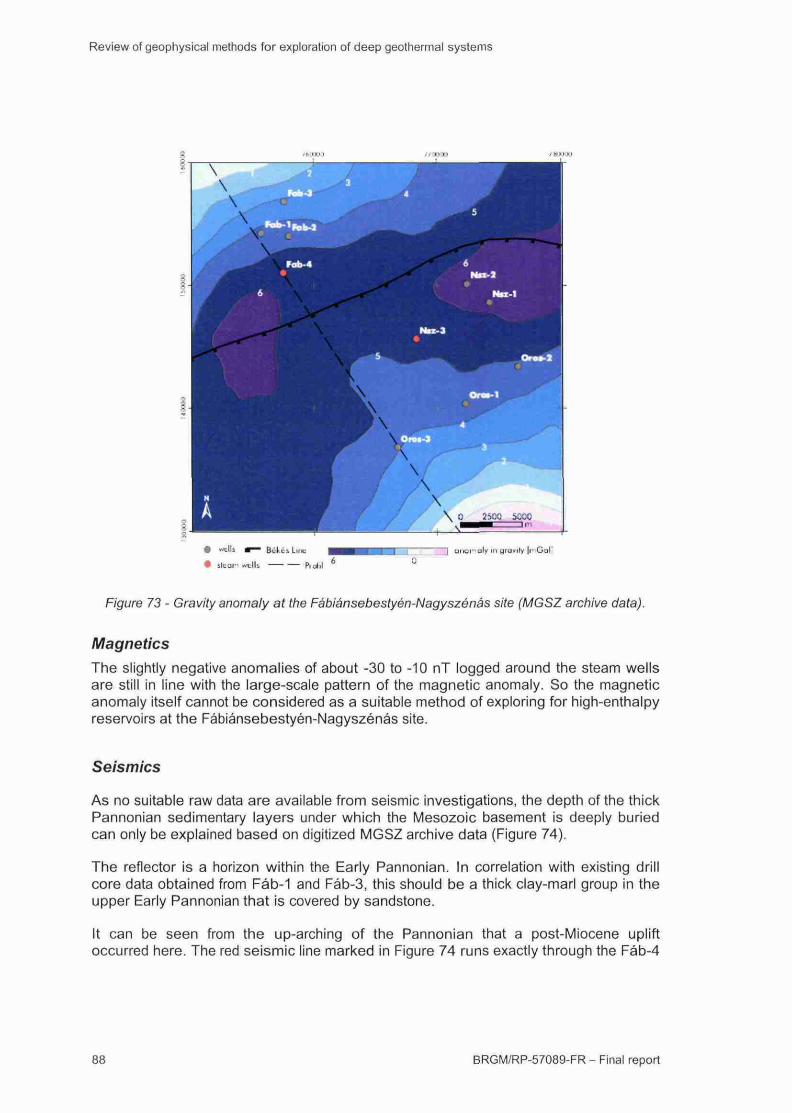
Review of geophysical methods for exploration of deep geothermal systems
ft of il
Figure 73 - Gravity anomaly at the Fábiánsebestyén-Nagyszénás site (MGSZ archive data).
MagneticsThe slightly negative anomalies of about -30 to -10 nT logged around the steam wellsare still in line with the large-scale pattern of the magnetic anomaly. So the magneticanomaly itself cannot be considered as a suitable method of exploring for high-enthalpyreservoirs at the Fábiánsebestyén-Nagyszénás site.
Seismics
As no suitable raw data are available from seismic investigations, the depth of the thickPannonian sedimentary layers under which the Mesozoic basement is deeply buriedcan only be explained based on digitized MGSZ archive data (Figure 74).
The reflector is a horizon within the Early Pannonian. In correlation with existing drillcore data obtained from Fáb-1 and Fáb-3, this should be a thick clay-marl group in theupper Early Pannonian that is covered by sandstone.
It can be seen from the up-arching of the Pannonian that a post-Miocene upliftoccurred here. The red seismic line marked in Figure 74 runs exactly through the Fáb-4
88 BRGM/RP-57089-FR - Final report
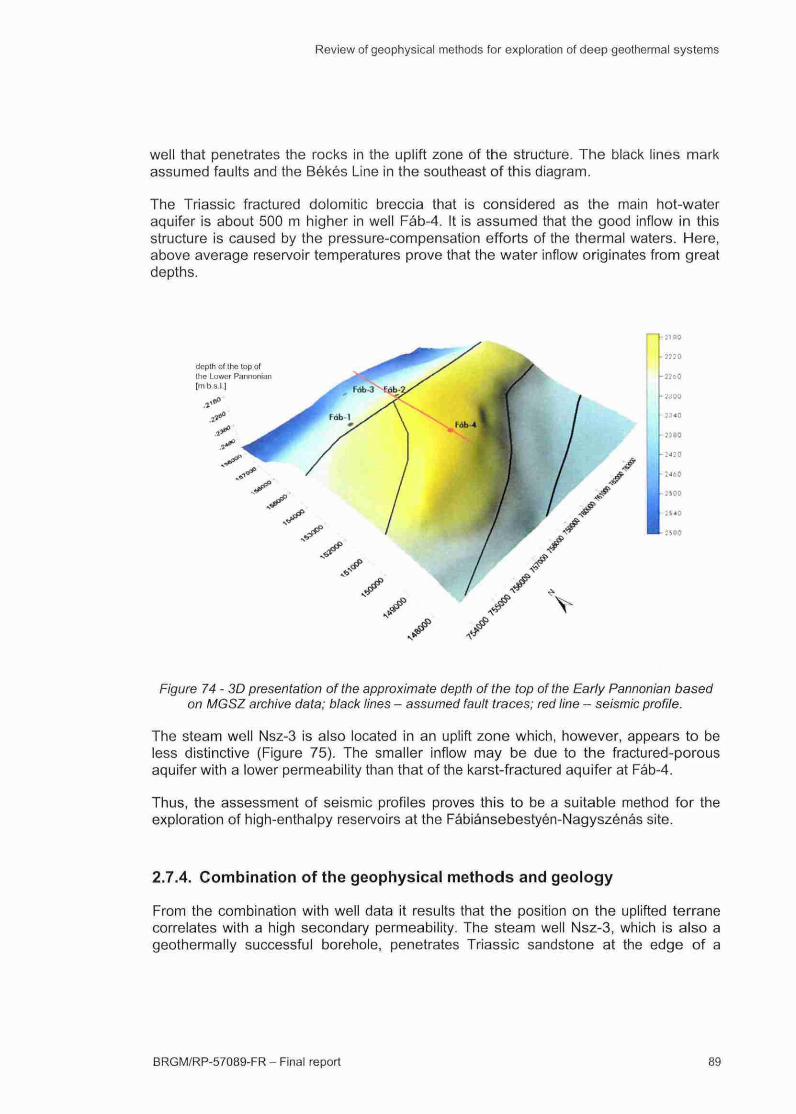
Review of geophysical methods for exploration of deep geothermal systems
well that penetrates the rocks in the uplift zone of the structure. The black lines markassumed faults and the Békés Line in the southeast of this diagram.
The Triassic fractured dolomitic breccia that is considered as the main hot-wateraquifer is about 500 m higher in well Fáb-4. It is assumed that the good inflow in thisstructure is caused by the pressure-compensation efforts of the thermal waters. Here,above average reservoir temperatures prove that the water inflow originates from greatdepths.
Figure 74 - 3D presentation of the approximate depth of the top of the Early Pannonian basedon MGSZ archive data; black lines - assumed fault traces; red line - seismic profile.
The steam well Nsz-3 is also located in an uplift zone which, however, appears to beless distinctive (Figure 75). The smaller inflow may be due to the fractured-porousaquifer with a lower permeability than that of the karst-fractured aquifer at Fáb-4.
Thus, the assessment of seismic profiles proves this to be a suitable method for theexploration of high-enthalpy reservoirs at the Fábiánsebestyén-Nagyszénás site.
2.7.4. Combination of the geophysical methods and geology
From the combination with well data it results that the position on the uplifted terranecorrelates with a high secondary permeability. The steam well Nsz-3, which is also ageothermally successful borehole, penetrates Triassic sandstone at the edge of a
BRGM/RP-57089-FR - Final report
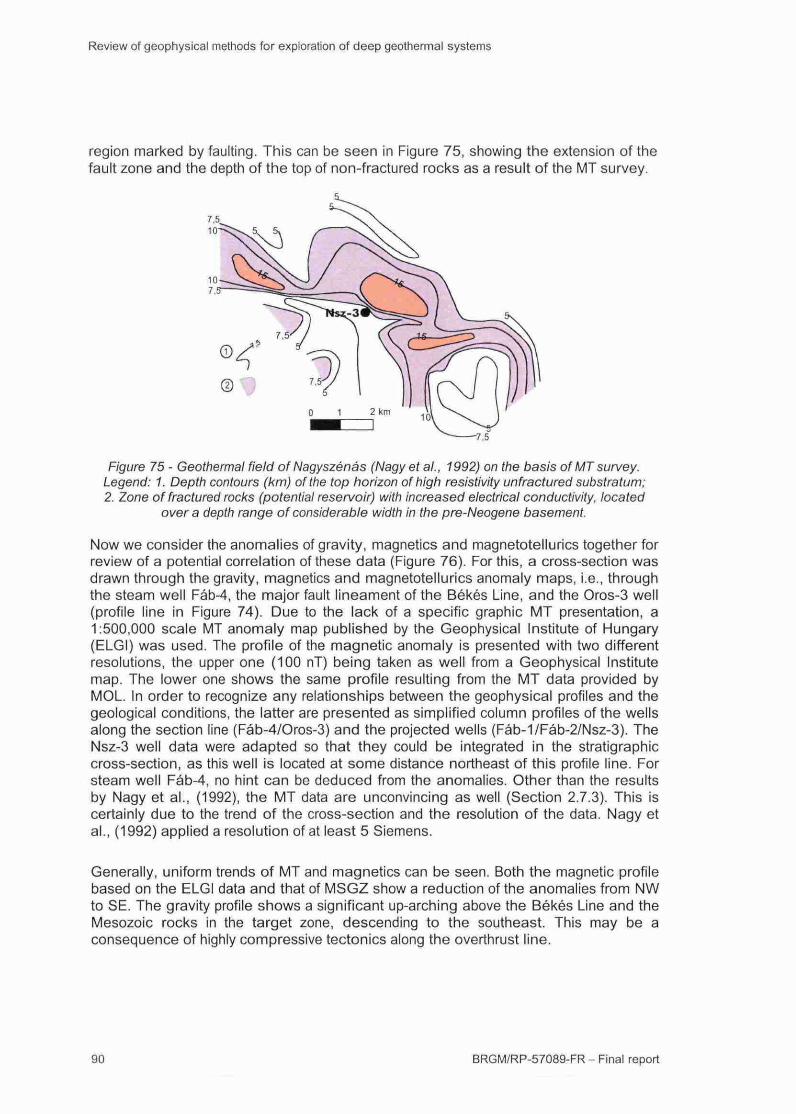
Review of geophysical methods for exploration of deep geothermal systems
region marked by faulting. This can be seen in Figure 75, showing the extension of thefault zone and the depth of the top of non-fractured rocks as a result of the MT survey.
Figure 75- Geothermal field of Nagyszénás (Nagyetal., 1992) on the basis of MT survey.Legend: 1. Depth contours (km) of the top horizon of high resistivity unfractured substratum;2. Zone of fractured rocks (potential reservoir) with increased electrical conductivity, located
over a depth range of considerable width in the pre-Neogene basement.
Now we consider the anomalies of gravity, magnetics and magnetotellurics together forreview of a potential correlation of these data {Figure 76). For this, a cross-section wasdrawn through the gravity, magnetics and magnetotellurics anomaly maps, i.e., throughthe steam well Fáb-4, the major fault lineament of the Békés Line, and the Oros-3 well(profile line in Figure 74). Due to the lack of a specific graphic MT presentation, a1:500,000 scale MT anomaly map published by the Geophysical Institute of Hungary(ELGI) was used. The profile of the magnetic anomaly is presented with two differentresolutions, the upper one (100 nT) being taken as well from a Geophysical Institutemap. The lower one shows the same profile resulting from the MT data provided byMOL. In order to recognize any relationships between the geophysical profiles and thegeological conditions, the latter are presented as simplified column profiles of the wellsalong the section line (Fáb-4/Oros-3) and the projected wells (Fáb-1/Fáb-2/Nsz-3). TheNsz-3 well data were adapted so that they could be integrated in the stratigraphiecross-section, as this well is located at some distance northeast of this profile line. Forsteam well Fáb-4, no hint can be deduced from the anomalies. Other than the resultsby Nagy et al., (1992), the MT data are unconvincing as well (Section 2.7.3). This iscertainly due to the trend of the cross-section and the resolution of the data. Nagy etal., (1992) applied a resolution of at least 5 Siemens.
Generally, uniform trends of MT and magnetics can be seen. Both the magnetic profilebased on the ELGI data and that of MSGZ show a reduction of the anomalies from NWto SE. The gravity profile shows a significant up-arching above the Békés Line and theMesozoic rocks in the target zone, descending to the southeast. This may be aconsequence of highly compressive tectonics along the overthrust line.
BRGM/RP-57089-FR - Final report
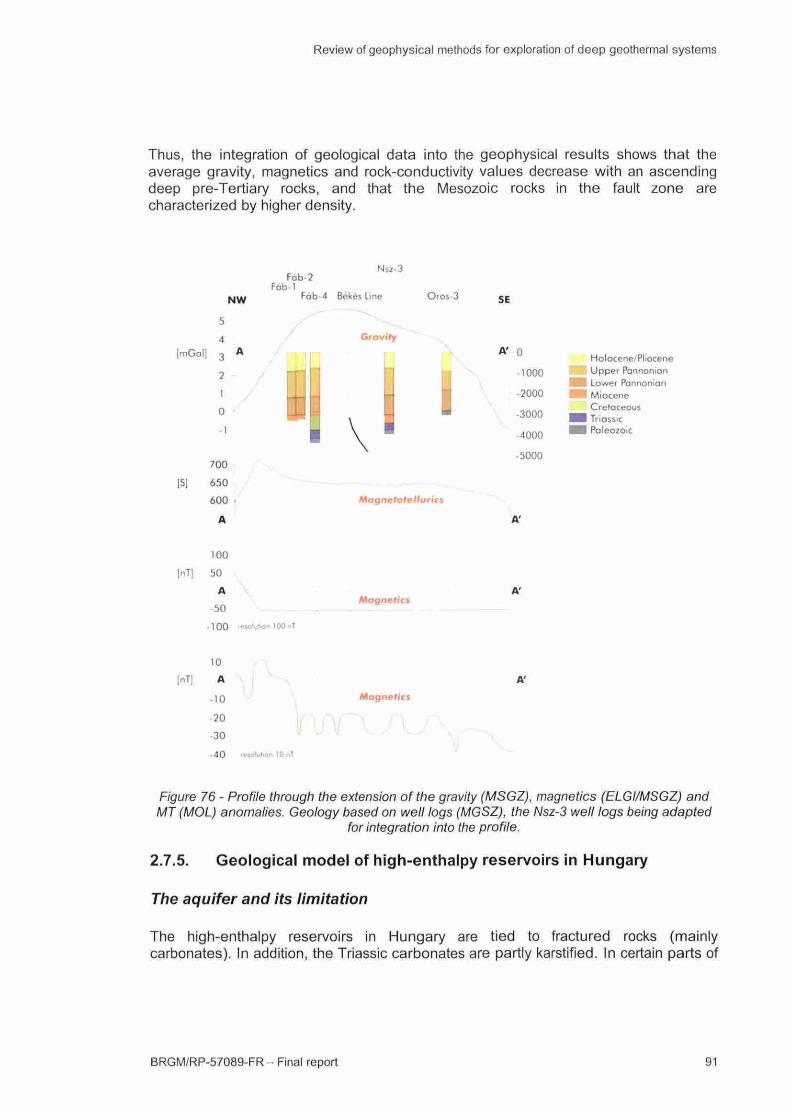
Review of geophysical methods for exploration of deep geotherma! systems
Thus, the integration of geological data into the geophysical results shows that theaverage gravity, magnetics and rock-conductivity values decrease with an ascendingdeep pre-Tertiary rocks, and that the Mesozoic rocks in the fault zone arecharacterized by higher density.
Nsjt-3
mGol
S]
nT]
nT]
54
3
*
1
0
-1
700
650
600
A
100
50
A
-50
0 0 0
10
A
-10
•20
-30
-40
MW
A
/
/
f
\
\\\J
'^solu
Fob -2Fob 1
Fób-4
/
>' u n/ mm
II•11*"̂—-—-
on 100 "T
\
in rii j
ion lOnT
Békés Line Oros-3
Gravity ~ " - ^
ß\Mognefofef/urfcs
Magnetics
Magnetics
SE
A' 0
X -1ooo\ -2000
"\ -3000
•4000
-5000
A'
K
A'
'—--,
Holocene/PlioceneUpper PonnonianLower PonnonianMioceneCretaceousTripssicPaleozoic
Figure 76 - Profile through the extension of the gravity (MSGZ), magnetics (ELGI/MSGZ) andMT (MOL) anomalies. Geology based on well logs (MGSZ), the Nsz-3 well logs being adapted
for integration into the profile.
2.7.5. Geological model of high-enthalpy reservoirs in Hungary
The aquifer and its ¡imitation
The high-enthalpy reservoirs in Hungary are tied to fractured rocks (mainlycarbonates). In addition, the Triassic carbonates are partly karstified. In certain parts of
BRGM/RP-57089-FR - Final report 91
Review of geophysical methods for exploration of deep geothermal systems
Hungary, they are found at the surface (e.g. the karst at Aggletek), but in southernHungary these rocks lie mainly at depths below 2 km. The carbonates are underiain byEariy Triassic and/or Permian silt- and claystones, containing sandstones. Along withthe limestones, the aquifer may include thin subordinate Permian, Triassic and
Miocene sandstone and conglomerate. The inflows in well Nsz-3 originate preciselyfrom these layers.
Below the aquifer, the basement consist of metamorphic and magmatic rocks.
The overiying rocks contain mainly Miocene conglomerate/sandstone and siltstone, aswell as Pannonian clay- and silt-stones, and clayey and limy mari.
Aquifer characteristics
The aquifer consists of karstified and fractured limestone or dolomite and subordinatefractured sandstone. Based on the assumed weighfing, only the carbonates aredescribed hereafter. Their surface karst at Bükk and Aggtelek, and the generally heavymud losses in wells show that they are fractured and karstified.
However, the deeper underground in Hungary is strongly faulted (Arpasi et al., 2000;Haas, 2001; Badahawy et al., 2001; Márton and Fodor, 2003;) and locally so complexthat a communicafion between wells drilled in different blocks Is hardly possible.However, the block boundaries form the best paths for ascending and circulafing deepwaters.
The deep waters themselves show salinifies from 1 to 30 g/l, the main componentsbeing sodium, chloride and HCO3. The gas contents of the deep waters are locally veryhigh (4 to 14 m^ of gas per cubic metre of fluid).
Other than the aquifer, both the under- and the over-lying rocks are characterized byhigher clay contents in the magmafic and metamorphic rocks, and the maris.
Formation of the high-enthalpy reservoirs in Hungary
The high-enthalpy reservoirs formed in Hungary are located mainly In karstified andfractured Triassic carbonates.
The salinifies of the formation waters range from 1 to 30 g/l, which indicates that theseare mixed waters composed of low-saline waters (<1 g/l), probably coeval withformafion of the limestones and descending with them, and of ascending deep watersflowing in from the metamorphic basement.
The waters are collected high up on the mountains, flowing down into the southernparts of the Basin below the Pannonian layers. The aquitards there (clayey mari, limymari, and silt- and clay-stone) prevent the waters from ascending, pressurecompensation making them artesian. These covering layers maintained their effect Inspite of subsequent, mulfiple tectonical events.
92 BRGM/RP-57089-FR - Final report
Review of geophysical methods for exploration of deep geothermal systems
Fracturing, in particular of the competent carbonate rocks, provided improved water
routing and inflow of deep waters. The convection of these fluids resulted In increasedtemperatures at the reservoir top. However, tectonical activity led to the formation ofuplifted fault blocks and graben, subdividing the reservoir into several smaller partialreservoirs. Along the main NE-SW striking fault zones, this improved the hydraulicroufing for ascending deep waters. According to the pressure heads, the characterisficsof the high-enthalpy reservoirs are particulariy favourable within areas of antiforms .These structures also form potenfial hydrocarbon traps, thus commonly being thetarget of oil-and-gas exploration (cf. Fáb-4).
All this led to the escape of deep waters by means of an outburst when drilling into theaquifer, as happened with the Fáb-4 well.
Assuming that the model of reservoir formation postulated here Is correct, thegeophysical methods listed above will help In idenfifying high-enthalpy reservoirs InHungary.
2.7.6. Proving a reservoir by means of geophysical methods
Seismic methods are amongst the best tools for mapping the extension and depth ofthe fractured and karstified Triassic carbonates. The target horizon should be locatedhere within the region of fault zones that are marked by major backfilling. Furthermore,anfiforms are particulariy suitable structural features as well.
Gravimetric invesfigafions are less suitable, as here areas can be mapped roughly onthe basis of block boundaries and main faults (backfilling of rocks with differentdensity), but no further indices can be obtained for the occurrence itself of reservoirs.Even magnetic investigafions did not lead to any differentiated statements.
Nagy et al., (1992) describe how the existence of a geothermal reservoir below Fáb-4could be proven by MT. The electrical conductivity of ionic conductors increasesstrongly with temperature. The hydrothermal mineral assemblages produced bythermal fluids significanfiy alter the physical properties of reservoir rock in the fracturezones, thus increasing the conductivity ofthe host rock of a geothermal field as well.
Accordingly, seismic data appear to be suitable for proving the presence of high-enthalpy reservoirs in Hungary within the context of MT logs. More in-depthinvesfigafions appear to be a reasonable investment.
BRGM/RP-57089-FR - Final report 93

Review of geophysical methods for exploration of deep geothermal systems
3. State of the art of surface geophysics appliedto geothermal exploration
Feasibility and performance of the main methods applied in the selected sites selectedin the framework of the l-GET project are discussed and summarized in the presentsecfion. It concerns reslsfivity methods (direct current electrics, TEM, EM), active andpassive seismics, gravity, magnefism and well-logging.
3.1. RESISTIVITY METHODS
Geothermal systems are good targets for electrical and electromagnefic (EM) methodssince they have significanfiy lower electrical resistivity than their environment. Inthermal areas, the electrical resistivity is substanfially different from and generally lowerthan in areas with colder subsurface temperatures. The reslsfivity is affected by: 1) Thevertically ascending, hot and mineralized (hydrothermal) waters or vapours that havetheir origin in the mix of descending surface waters and ascending deep waters; and ii)The presence of hydrothermal alteration products consisting notably of electricallyconductive clays. Intrusions of more-or-less molten magma have themselves a verylow intrinsic reslsfivity at temperatures above approximately 800 °C (Bartel andJacobson, 1987).
The electrical resistivity of porous media within a hydrogeological system is a functionof matrix resistivity, fluid resistivity and saturation, porosity, and temperature. If there isno clay or matrix conductance, the resistivity of a rock is controlled by the resistivity ofthe saturating fluid. This is expressed by the well known empirical relafionship betweenresistivity (p), porosity {q>), water saturation {S and fluid resistivity {pw) proposed byArchie (1942):
p =ap (eq. 1)
where a, n and m are empirical constants (approximately 0.6 to 1 .6 for a and n, m = nfor Sw >25%). The rock characteristics may be described by the formation factor, Fsuch as F = a Pw(p "".
In order to explain their observafions on shaly sand, Waxman and Smith (1968)proposed a parallel resistor model and developed a quantitative relationship such as:
1/p = 1/Fp +1/ps (eq. 2)
where ps denotes the surface resistivity which has been shown to be inverselyproportional to the cafion exchange capacity, CEC, of the clay mineral involved (Revilet al., 1998). The CEC differs from one mineral to another: smectite has CEC of 0.8 to2.0 meq/g, while chlorite and kaolinite have a CEC 10 to 100 times lower (0.02 to
BRGM/RP-57089-FR - Final report 95
Review of geophysical methods for exploration of deep geothermal systems
0.08 meq/g). Therefore, for clay-rich rocks where pore water has a low salinity, thereslsfivity will be Inversely proportional to the CEC of clays.
Because conduction within electrolytes Is by ionic processes, electrolyte resistivity isalso directly related to viscosity, which decreases with temperature. There is an inverseexponenfial dependence of reslsfivity with temperature of the form:
P=Poe^''' (eq.3)
where £ is an acfivation energy (commonly about 0.2 eV in water and for saturatedrocks), R is Boltzman's constant (0.8617 x 10"'' eV/°K), T is temperature (°K) and po Isthe resistivity at theoretically infinite temperature.
Llera et al. (1990) tabulated decreases In laboratory measurements of resistivity Involcanic rocks by factors of 5 to 40 (commonly 6 to 10), for a temperature Increasefrom 30 to 120 °C. Revil et al. (1998) also showed on the basis of data from variouslittérature sources that temperature dependence of surface conductivity in the range 40to 200 °C is generally higher than the temperature dependence ofthe fluid reslsfivity.
3.1.1. Resistivity model of a geothermal reservoir
Geothermal systems with alteration-zoning patterns controlled by temperature havebeen observed woridwide. The effectiveness of the clay mineral associafion as ageothermometer as collected from different site studies in the literature, is reported byHarvey and Browne (2000).
Temperature is the major control on clay mineralogy. A typical resistivity model with analterafion-zoning pattern is illustrated In Figure 77. Below the unaltered and coolshallow part, the ground is characterized by alteration of smectite and zeolites, whichare both electrically conductive and form at temperatures above 70 °C. At highertemperatures, the less conducfive clay minerals chlorite (in basalfic rocks) or illite (Inacidic rocks), are interiayered with smectite. The proportion of chlorite or illite increaseswith temperature, especially above 180 °C. At 220-240 °C the zeolites and smecfitedisappear, and pure chlorite or illite usually appear at temperatures of over 240 °C,together with other high-temperature alterafion minerals (epidote, etc.) In the propyllficalterafion assemblage (Wright et al., 1985; Ussher et al., 2000).
The correlation of temperature/clay zoning and resistivity distribution at depth has beenobserved on numerous sites in different settings woridwide (Arnasson et al., 2000;Anderson et al., 2000; Gunderson et al., 2000; Ussher et al., 2000). In geothermalareas where the permeability is high and alterafion pervasive, this conceptual modelwill apply. Departure from this scheme might be suspected in case of an irregularpermeability distribution, and independent of whether the system can achieveequilibrium between fluid and rocks.
Based on various experiments in Iceland, Flovenz et al. (2005) proposed a generalresistivity structure for the basalfic crust (cf. 2.5.2, above, and Figure 49) which is oneof the better argued illustrations of this zoning model. A clear corrélafion between
96 BRGM/RP-57089-FR - Final report
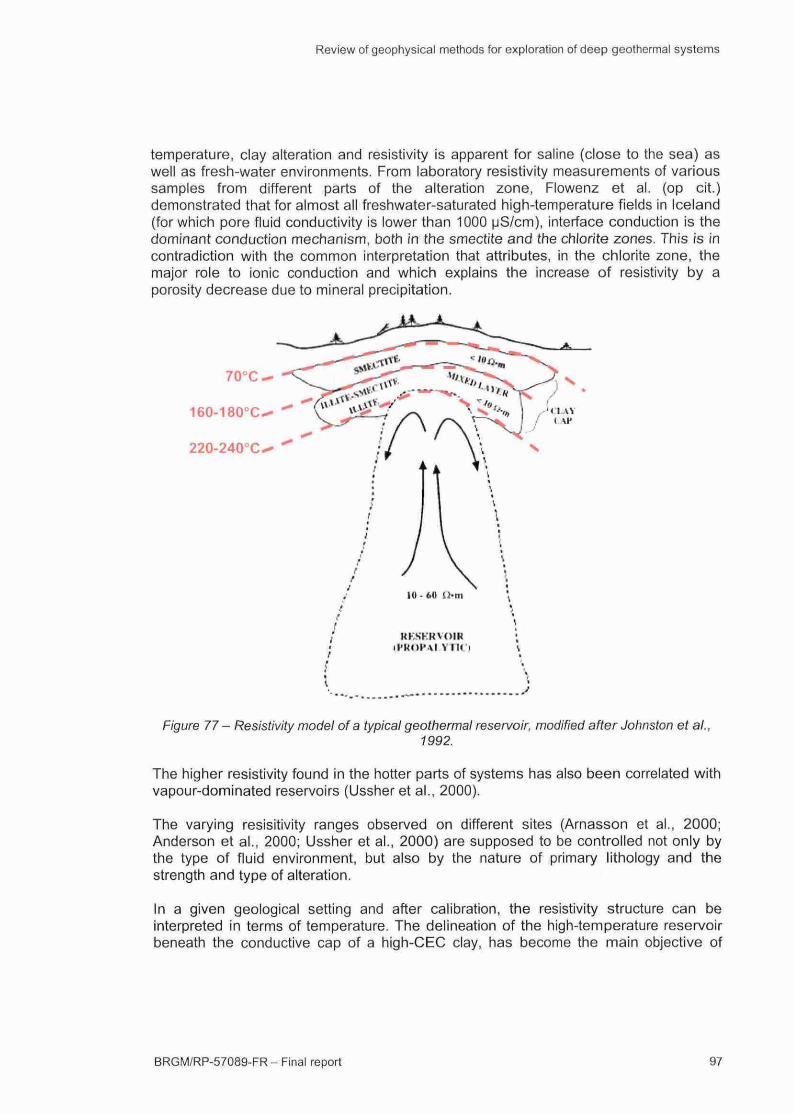
Review of geophysical methods for exploration of deep geothermal systems
temperature, clay alteration and resistivity is apparent for saline (close to the sea) aswell as fresh-water environments. From laboratory resistivity measurements of varioussamples from different parts of the alteration zone, Flowenz et al. (op cit.)demonstrated that for almost all freshwater-saturated high-temperature fields in Iceland(for which pore fluid conductivity is lower than 1000 uS/cm), interface conduction is thedominant conduction mechanism, both in the smectite and the chlorite zones. This is incontradiction with the common interpretation that attributes, in the chlorite zone, themajor role to ionic conduction and which explains the increase of resistivity by aporosity decrease due to mineral precipitation.
Figure 77 - Resistivity model of a typical geothermal reservoir, modified after Johnston et al.,1992.
The higher resistivity found in the hotter parts of systems has also been correlated withvapour-dominated reservoirs (Ussher et al., 2000).
The varying resisitivity ranges observed on different sites (Arnasson et al., 2000;Anderson et al., 2000; Ussher et al., 2000) are supposed to be controlled not only bythe type of fluid environment, but also by the nature of primary lithology and thestrength and type of alteration.
In a given geological setting and after calibration, the resistivity structure can beinterpreted in terms of temperature. The delineation of the high-temperature reservoirbeneath the conductive cap of a high-CEC clay, has become the main objective of
BRGM/RP-57089-FR - Final report
Review of geophysical methods for exploration of deep geothermal systems
geophysical explorafion of geothermal systems (Ussher et al., 2000). While goodpermeability can never be guaranteed, the success rate of exploration wells centred ona resisfivity target is likely to be higher than in many other locations within the prospectarea (Anderson et al., 2000). As a conclusion to their numerical evaluafion of the EMmethod in geothermal explorafion, Pellerin et al. (1996) postulated that the large low-resistivity clay cap creates a target that is well suited for EM methods, but also makeselectrical détecfion ofthe underlying reservoir a challenge.
3.1.2. DC electrical methods
As for other resistivity methods of geophysical explorafion, the purpose of electricalsurveys is to determine the subsurface resistivity distribution from measurements onthe ground surface, but now using a direct current. The resisfivity measurements aregenerally made by injecting current into the ground through two electrodes (CI and C2)and measuring the resulfing voltage difference at two potential electrodes (PI and P2).From the current / and the voltage V, an apparent resistivity Pa Is calculated as:
Pa = K'V/l (eq.4)
where K is the geometric factor that depends on the arrangement of the fourelectrodes.
DC electrical methods have been used with success in geothermal exploration for along fime, with different electrode configurations and methods. They were mainly usedfor dellneafing the contours of geothermal system and/or the clay cap at shallow depth,i.e. less than 500 m (Risk, 1986; Allis,1990). Within a flat tabular environment. VerticalElectrical Sounding, VES, and 1D modelling inversion may be applied with success,while more generally 2D data sets are measured along profiles that enable modelling,or inverting the 2D resistivity distribufion complexity ofthe geothermal system at depth.
Hengill and Bouillante (cf. 2.5.2 and 2.6.3, above) are good examples of the ability ofthe DC resistivity method to image the resistivity distribution of a typical geothermalsystem. At Hengill, VES and "head on" profiles were combined in a 2D global data setthat was inverted to a highly detailed resistivity section showing a good correlation withalterafion mineralogy (Figure 46). The Bouillante example is a clear démonstrafion ofthe too limited invesfigafion depth of a dipole-dipole secfion. The producfive zoneswithin the chlorite zone at a depth of 600 to 1000 m are at the limit of, or significanfiydeeper than, the maximum invesfigafion depth ofthe method (Figure 61).
3.1.3. Transient Electromagnetic Method (TEM)
The TEM method is an electromagnetic method well suited to exploration for low-resistivity zones, such as geothermal systems. The basic principles can be found In thepublicafions of Fitterman (1989), Spies and Frischknecht (1991), or McNeill (1994). Tosummarize, the TEM method uses a cable laid out on the ground as a transmitter loop(Tx). A square current is generated inside the Tx loop. When the current is switchedoff, the variafion in the primary magnefic field Bp induces a circulafion of eddy currents
98 BRGM/RP-57089-FR - Final report
Review of geophysical methods for exploration of deep geothermal systems
in the ground. The eddy currents diffuse into the ground with a shape that can be
imagined as "smoke rings". They generate a secondary decaying magnefic field Bsmeasured at the surface by a receiver coil (Rx) when the current remains switched off.The variafions in amplitude of Bs with time are linked to the changes of resistivity withdepth. TDEM is a sounding method and is preferentially suited to a ID layered earth (2and 3-D cases are seldom considered at the interpretation phase, and then only forsimple cases such as spheres, round patches etc.).
The main advantages are a good sensifivity to variations In conducfivity, a good lateralresolufion, and a depth of penetrafion generally equal or superior to the length of theside of the Tx loop. In the field and particulariy on dry ground, a significant advantageof TEM in comparison with the DC electrical method resides in the fact that no
electrodes are used for transmitfing electrical current into the ground.
Because they have proven to be more downward focused, have better resolution atdepth, and have a better set-up efficiency in the open field than DC-methods, TEM
soundings have been extensively used since the 1980s for geothermal explorafion inIceland (Arnasson et al., 2000; Flovenz and Karisdotfir, 2000).
Since they measure the magnefic field, TEM soundings are less affected than galvanicmethods by superficial conductive anomalies and can thus be efficienfiy used forcorrecfing the galvanic distortion produced on MT soundings by electrical charges atthe boundary of superficial inhomogeneifies. Hence, TEM data acquired at the samelocafion as MT soundings provide an efficient remedy for the so-called MT stafic shift(Pellerin and Howmann, 1990).
3.1.4. Magnetotelluric (MT) method
The magnetotelluric (MT) method is a way of determining the electrical resisfivitydistribufion of the subsurface using naturally occurring electromagnefic fields.Interactions between the solar wind and the earth's magnetosphere mainly cause the
signal with frequencies lower than 10 Hz, while frequencies higher than 1 Hz mainlyhave their origin in electromagnefic meteorological activity, such as lightningdischarges. Orthogonal components of the electrical field (Ex, Ey) and of the magneficfield {Hx, Hy, Hz) are measured simultaneously at the surface of the earth. Assumingplane waves, these parameters are then transformed in the frequency domain in orderto calculate the earth apparent resistivity for different frequencies or periods using theCagniard formula:
p JT)^0.2T^ (eq.5)a I, J Hj(T)^
where resisfivity, Pa is expressed in ohm.m, period, T in s, electric field Ei in mV/km,magnetic field, Hj In nT, with i,j = xy or yx.
The invesfigafion depth may be evaluated using the skin penetrafion p (km), which is a
function ofthe period 7(s) and the subsurface resistivity p (ohm.m) such as :
BRGM/RP-57089-FR - Final report 99
Review of geophysical methods for exploration of deep geothermal systems
p = ^10pT «O.sVpT (eq. 6)27T
The theory of applying the MT method can be found in numerous papers and books(e.g., Vozoff, 1991; Simpson and Barh, 2005).
The typical potenfial goals of an MT survey are the rather superficial, highly conducfive,caprock and its underiying propilytic reservoir in agreement with the above discussedmodel, but also a deeper molten heat source. As a conclusion to their numericalevaluation of the EM method in geothermal exploration, Pellerin et al., (1996) foundthat the EM anomaly from a deep conducfive reservoir overiain by a larger, moreconductive, clay cap, is caused by the presence of electric charges at the conductivityboundaries, rather than by electromagnefic inducfion. They then deem that the 2Dinterprétafion of high-quality, densely spaced, MT data is the best method of reservoirdétecfion, even though the expected anomaly is small compared to the electricalvariation expected in a structure like a clay cap. Experimenys by Kajiwara et al. (2000)in the Mori geothermal field (Japan), however, tend to prove that TEM has a betterresolution than MT.
The MT surveys carried out in southern Tuscany, which were undertaken primarily forgeothermal and deep crustal exploration, provide an interesting overview of theprogress of methodology and of the current state of the art. For a long time, MTsurveys encountered significant difficulties that mainly stemmed from three factors: 1)the high level of electromagnefic signals from industrial and cultural sources thatinterfere with the natural fields used in the method; 2) the presence of very conductiveshallow formafions and hence the necessity to acquire data over long periods; and 3)the naturally occurring structural complexity commonly found in these areas, whichrequires two- or three-dimensional MT modelling for interprétafion purposes, thussignificanfiy increasing the amount of effort required by modelling.
Since the inifial single-site or close-reference sounding configurafion used in theLarderello area before 1991, a specific methodology was developed using remotereferences for removing noise from the railway near the studied area (Fiordelisi et al.,2000, 2005; Volpi et al., 2004). A reference was set up on Capraia or Sardinia Islands,beyond the influence of the electrical-train noise. Specific robust processing using 2Dsmoothing was developed for removing such noise correlated in the area of interestand for managing magnefic oufiiers (Larsen et al; 1996). Comparison of single-site andremote-reference processing is presented in Figure 78.
2D inversion and modelling are common (Fiordelisi et al., 2000, 2005). More recenfiy inthe Travale area, Manzella et al. (2006) applied a neural network inversion (ANN,Spichak and Popova, 2000) in order to get an idea of the 3D distribufion of resisfivity,after applying the Bostick transformation to the apparent resistivity determinantcalculated at each site for all frequencies (Figure 14). À more complete 3D inversionusing a Bayesian approach (Spichak, 2005) that can incorporate the geologicalconstraints is planned (Manzella et al., 2006).
1 00 BRGM/RP-57089-FR - Final report
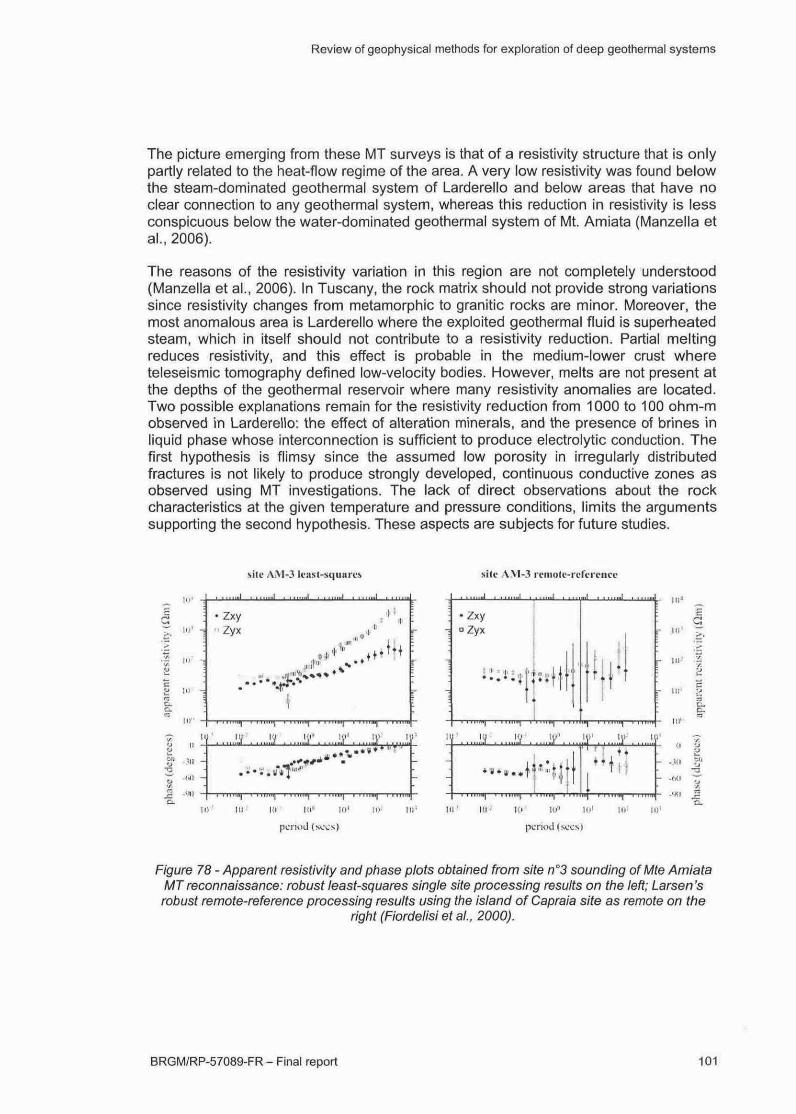
Review of geophysical methods for exploration of deep geothermal systems
The picture emerging from these MT surveys is that of a resistivity structure that is onlypartly related to the heat-flow regime of the area. A very low resistivity was found belowthe steam-dominated geothermal system of Larderello and below areas that have noclear connection to any geothermal system, whereas this reduction ¡n resistivity is lessconspicuous below the water-dominated geothermal system of Mt. Amiata (Manzella etal., 2006).
The reasons of the resistivity variation in this region are not completely understood(Manzella et al., 2006). In Tuscany, the rock matrix should not provide strong variationssince resistivity changes from metamorphic to granitic rocks are minor. Moreover, themost anomalous area is Larderello where the exploited geothermal fluid is superheatedsteam, which in itself should not contribute to a resistivity reduction. Partial meltingreduces resistivity, and this effect is probable in the medium-lower crust whereteleseismic tomography defined low-velocity bodies. However, melts are not present atthe depths of the geothermal reservoir where many resistivity anomalies are located.Two possible explanations remain for the resistivity reduction from 1000 to 100 ohm-mobserved in Larderello: the effect of alteration minerals, and the presence of brines inliquid phase whose interconnection is sufficient to produce electrolytic conduction. Thefirst hypothesis is flimsy since the assumed low porosity in irregularly distributedfractures is not likely to produce strongly developed, continuous conductive zones asobserved using MT investigations. The lack of direct observations about the rockcharacteristics at the given temperature and pressure conditions, limits the argumentssupporting the second hypothesis. These aspects are subjects for future studies.
util)
1SI1
u
zL>
C^Ci.
ID' T::
n:- -
ID" -
1
• Zxy11 Zyx
*
i
site AM-3
i . .
•if1
*
1 ' '
leaM-ü<
1 , . .
uur
INll
111*1 ™
.....
es
• *'
• • f
...i
*
'"1
-
—
sile AM-3 remote-reference
I 1 1 . I L.j.i.-.J
ZxyZyx
! / • '
t>11
Ht
•o
II
-HI --
-Ml -
LU m• " • uj a
*
ii" il"
•
:.'[' |. * * • • • '
iT '
-
-
1 Ï
: : « ; » : *
III I d l d : > | ( i <
period (sees)
r m'
;,:/ y ,...±\>' ¡ y .
'« • * • i
in '
- -Ml
- - i S f l
ni1 m- m
period (sees)
Figure 78 - Apparent resistivity and phase plots obtained from site n°3 sounding ofMte AmiataMT reconnaissance: robust least-squares single site processing results on the ¡eft; Larsen 'srobust remote-reference processing results using the island of Capraia site as remote on the
right (Fiordelisi et ai, 2000).
BRGM/RP-57089-FR - Final report 101
Review of geophysical methods for exploration of deep geothermal systems
A clearer image of a typical geothermal system has however been produced on thebasis of a MT survey as illustrated by the profile south of Hengill (see 2.5.2 and Figure52; Oskoi et al., 2004) or the 3D investigation of the Ogiri and Shiramizugoe fields InJapan (Uchlda et al., 2005). The cross-section of Figure 52 shows a complex resistivitydistribution characterizing the complete geothermal system from a shallow conductiveclay cap down to the deep conductive magmatic Intrusion, through intermediatereservoir zones.
In order to provide a surface tool for temperature model estimation, prediction andmonitoring, Spichak et al., 2007 proposed an electromagnetic geothermometer basedon neuronet analysis of measured MT and temperature data. They demonstrated thefeasibility of temperature estlmafions within a 12% relative error, on the basis on MTsoundings at the BIshek site (northern Tien Shan) and using at least 6 to 8 temperaturelogs for calibration.
An alternafive to the method Is the use of a controlled EM-field source for ensuring asufficient strength of the MT signal. However, the compromise between the distance toobserve between the measurement and the source (In order to assume plane waves)and the always limited power source, limit the use of CSAMT (Controlled SourceAudio-Magnetotelluric Method) to higher frequencies and thus to invesfigationsshallower than 1000 to 1500 m.
3.2. SEISMIC METHODS
Seismic methods are based on the propagafion of elasfic waves created by an artificialsource (dynamite, vibrating machine, etc.), or by natural phenomena such asearthquakes and micro-tremors. In geothermal exploration they are used primarily fordefining the structural setfing, but also for direct characterizafion of the reservoir sincethe parameters of elastic propagation (compressional velocity,Vp, shear velocity, Vs),and wave frequencies are related to lithology, fracturing, temperature, fluid content,pressure and saturafion.
As a general rule, when rock fractures the temperature and fluid content increase, andthe Vp velocity and Vp/Vs rafio decrease. A steam-dominated system (relatively hightemperature, low pressure and low fluid saturation) would be characterized by lower Vpand Vp/Vs than a liquid-dominated system (relatively low temperature, pressure andhigh fluid saturation). Attenuation of P waves is also expected as an effect of a steam-liquid mixed system and may be used as an indicator for steam.
3.2.1. Active seismics
Among surface geophysical exploration methods, reflecfion seismics provide the bestgeometrical resolufion of horizontal and weakly dipping layers or structures, and henceare Invaluable In characterizing sedimentary reservoirs. It was thus used for oilexplorafion In the sedimentary basins of northern Germany, Poland and Hungary. AtGross- Shoenebeck, attempts were made to re-process the oil-industry seismic linecrossing the prospect In order to provide structural Information for 3D geological
1 02 BRGM/RP-57089-FR - Final report
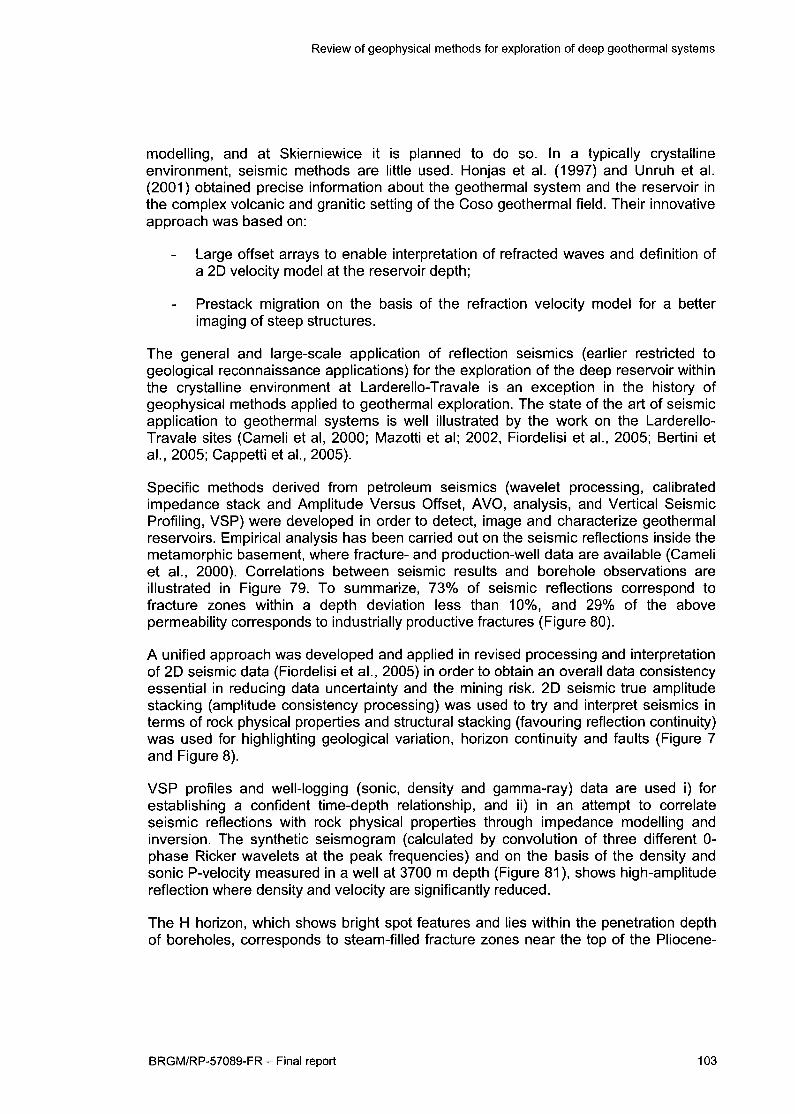
Review of geophysical methods for exploration of deep geothermal systems
modelling, and at Skierniewice it is planned to do so. In a typically crystallineenvironment, seismic methods are litfie used. Honjas et al. (1997) and Unruh et al.(2001) obtained precise information about the geothermal system and the reservoir in
the complex volcanic and granific setfing ofthe Coso geothermal field. Their innovativeapproach was based on:
Large offset arrays to enable interpretation of refracted waves and definition ofa 2D velocity model at the resen/oir depth;
Prestack migration on the basis of the refraction velocity model for a better
imaging of steep structures.
The general and large-scale applicafion of reflection seismics (eariier restricted togeological reconnaissance applicafions) for the explorafion of the deep reservoir withinthe crystalline environment at Larderello-Travale is an exception in the history ofgeophysical methods applied to geothermal exploration. The state ofthe art of seismic
applicafion to geothermal systems is well illustrated by the work on the Larderello-Travale sites (Cameli et al, 2000; Mazotfi et al; 2002, Fiordelisi et al., 2005; Bertini etal., 2005; Cappetfi et al., 2005).
Specific methods derived from petroleum seismics (wavelet processing, calibratedimpedance stack and Amplitude Versus Offset, AVO, analysis, and Vertical SeismicProfiling, VSP) were developed in order to detect, image and characterize geothermalreservoirs. Empirical analysis has been carried out on the seismic reflecfions inside themetamorphic basement, where fracture- and producfion-well data are available (Cameliet al., 2000). Correlafions between seismic results and borehole observafions areillustrated in Figure 79. To summarize, 73% of seismic reflecfions correspond tofracture zones within a depth deviafion less than 10%, and 29% of the abovepermeability corresponds to industrially producfive fractures (Figure 80).
A unified approach was developed and applied in revised processing and Interprétafionof 2D seismic data (Fiordelisi et al., 2005) in order to obtain an overall data consistencyessenfial in reducing data uncertainty and the mining risk. 2D seismic true amplitudestacking (amplitude consistency processing) was used to try and interpret seismics interms of rock physical properties and structural stacking (favouring reflection confinuity)was used for highlighting geological variafion, horizon confinuity and faults (Figure 7and Figure 8).
VSP profiles and well-logging (sonic, density and gamma-ray) data are used i) forestablishing a confident fime-depth relafionship, and li) in an attempt to correlateseismic refiecfions with rock physical properties through impedance modelling andinversion. The synthetic seismogram (calculated by convolufion of three different 0-phase Ricker wavelets at the peak frequencies) and on the basis of the density andsonic P-velocity measured in a well at 3700 m depth (Figure 81 ), shows high-amplitudereflection where density and velocity are significanfiy reduced.
The H horizon, which shows bright spot features and lies within the penetrafion depthof boreholes, corresponds to steam-filled fracture zones near the top of the Pliocene-
BRGM/RP-57089-FR - Final report 1 03
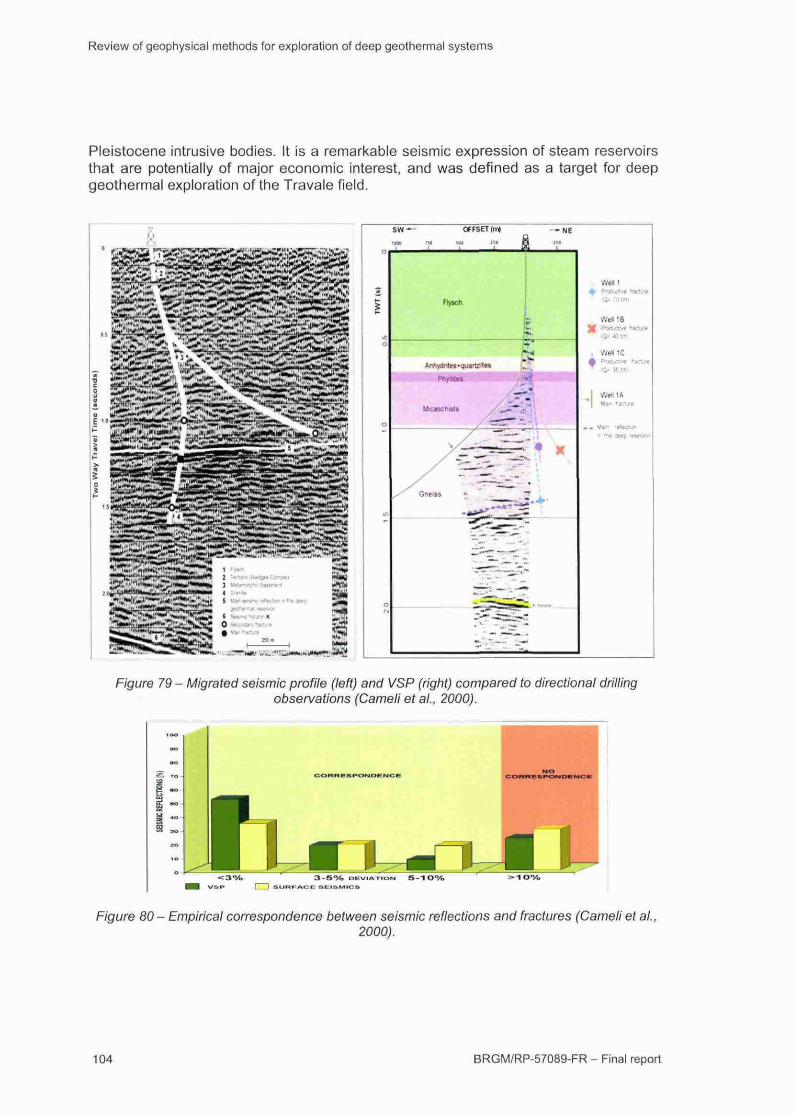
Review of geophysical methods for exploration of deep geothermal systems
Pleistocene intrusive bodies. It is a remarkable seismic expression of steam reservoirsthat are potentially of major economic interest, and was defined as a target for deepgeothermal exploration of the Travale field.
F/gure 79 - Migrated seismic profile (ten) and VSP (right) compared to directional drillingobservations (Cameli et al., 2000).
3 - 5 % DEVIATION S-1D%
Figure 80 - Empirical correspondence between seismic reflections and fractures (Cameli et al.2000).
104 BRGM/RP-57089-FR - Fina! report
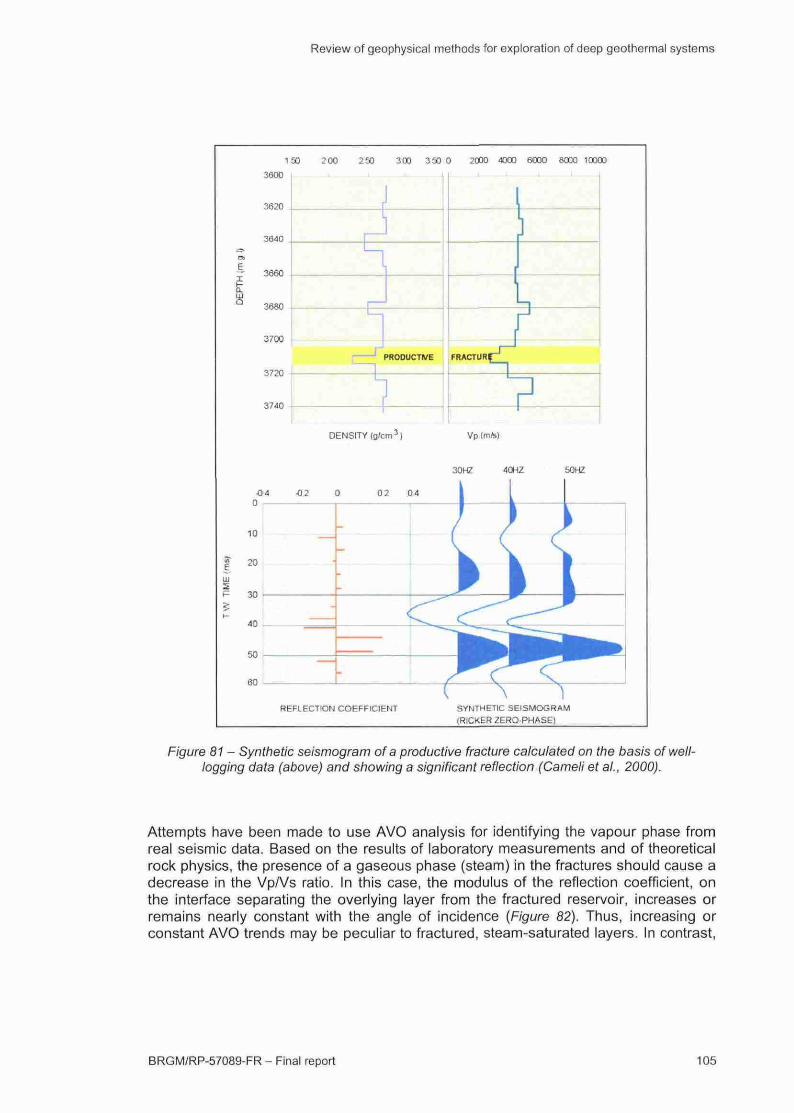
Review of geophysical methods for exploration of deep geothermal systems
150 200 250 300 350 0 2000 4000 6000 9030 100033600
3620
3640
3660
3680
3700
3720
3740
; PRODUCTVE
• )
1
FRACTURE
•04 •02
DENSITY fg/cm3)
0 2
Vp (m/s)
30 HZ 4QHZ 50HZ
10
20
30
50 —
60
REFLECTION COEFFICIENT SYNTHETIC SEI SMOG RAM(RICKER ZERO-PHASE)
Figure 81 - Synthetic seismogram of a productive fracture calculated on the basis of well-logging data (above) and showing a significant reflection (Cameli et al., 2000).
Attempts have been made to use AVO analysis for identifying the vapour phase fromreal seismic data. Based on the results of laboratory measurements and of theoreticalrock physics, the presence of a gaseous phase (steam) in the fractures should cause adecrease in the Vp/Vs ratio. In this case, the modulus of the reflection coefficient, onthe interface separating the overlying layer from the fractured reservoir, increases orremains nearly constant with the angle of incidence {Figure 82). Thus, increasing orconstant AVO trends may be peculiar to fractured, steam-saturated layers. In contrast,
BRGM/RP-57089-FR - Final report 105
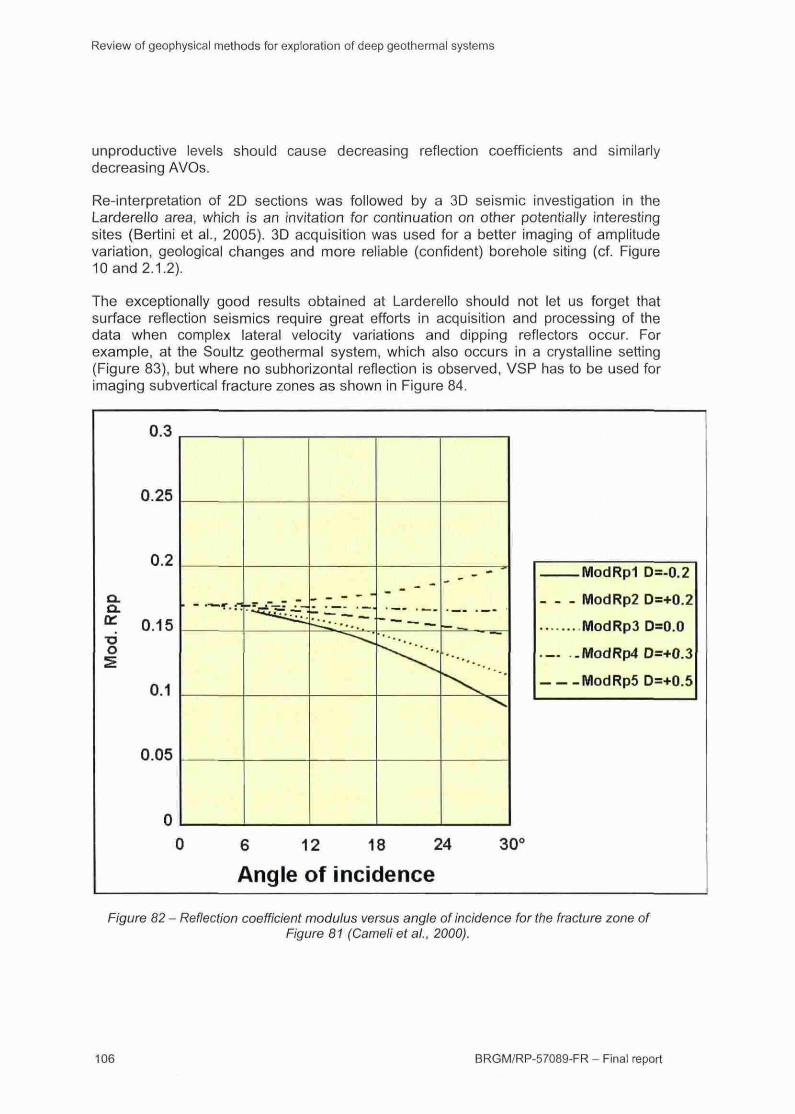
Review of geophysical methods for exploration of deep geothermal systems
unproductive levels should cause decreasing reflection coefficients and similarlydecreasing AVOs.
Re-interpretation of 2D sections was followed by a 3D seismic investigation in theLarderello area, which is an invitation for continuation on other potentially interestingsites (Bertini et al., 2005). 3D acquisition was used for a better imaging of amplitudevariation, geological changes and more reliable (confident) borehole siting (cf. Figure10 and 2.1.2).
The exceptionally good results obtained at Larderello should not let us forget thatsurface reflection seismics require great efforts in acquisition and processing of thedata when complex lateral velocity variations and dipping reflectors occur. Forexample, at the Soultz geothermal system, which also occurs in a crystalline setting(Figure 83), but where no subhorizontal reflection is observed, VSP has to be used forimaging subvertical fracture zones as shown in Figure 84.
Q.
o
0.3
0.25
0.2
0.15
0.1
0.05
0
— .^. — —
ModRpi D=-0.2
ModRp2D=+0.2
ModRp3 D=0.0
.— -ModRp4 D=+0.3
ModRp5 D=+0.5
6 12 18 24
Angle of incidence30<
Figure 82 - Reflection coefficient modulus versus angle of incidence for the fracture zone ofFigure 81 (Cameli et al., 2000).
106 BRGM/RP-57089-FR - Final report
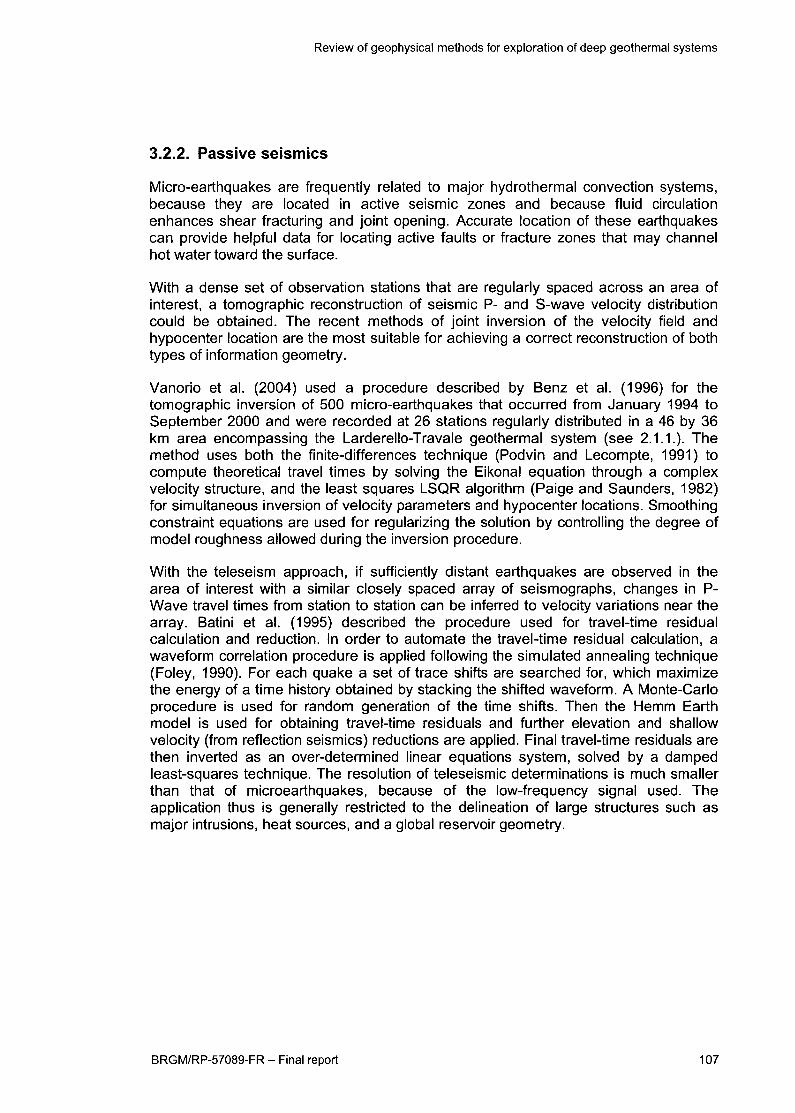
Review of geophysical methods for exploration of deep geothermal systems
3.2.2. Passive seismics
Micro-earthquakes are frequently related to major hydrothermal convection systems,because they are located in acfive seismic zones and because fluid circulafionenhances shear fracturing and joint opening. Accurate locafion of these earthquakescan provide helpful data for locating active faults or fracture zones that may channelhot water toward the surface.
With a dense set of observation stations that are regularly spaced across an area ofinterest, a tomographic reconstrucfion of seismic P- and S-wave velocity distribufioncould be obtained. The recent methods of joint inversion of the velocity field andhypocenter location are the most suitable for achieving a correct reconstruction of bothtypes of informafion geometry.
Vanorio et al. (2004) used a procedure described by Benz et al. (1996) for thetomographic inversion of 500 micro-earthquakes that occurred from January 1994 toSeptember 2000 and were recorded at 26 stafions regulariy distributed in a 46 by 36km area encompassing the Larderello-Travale geothermal system (see 2.1.1.). Themethod uses both the finite-differences technique (Podvin and Lecompte, 1991) tocompute theorefical travel times by solving the Eikonal equafion through a complexvelocity structure, and the least squares LSQR algorithm (Paige and Saunders, 1982)for simultaneous inversion of velocity parameters and hypocenter locafions. Smoothing
constraint equafions are used for regularizing the solufion by controlling the degree ofmodel roughness allowed during the inversion procedure.
With the teleseism approach, if sufficiently distant earthquakes are observed in thearea of interest with a similar closely spaced array of seismographs, changes in P-Wave travel times from station to station can be inferred to velocity variations near thearray. Bafini et al. (1995) described the procedure used for travel-fime residualcalculafion and reduction. In order to automate the travel-time residual calculafion, a
waveform correlation procedure Is applied following the simulated annealing technique(Foley, 1990). For each quake a set of trace shifts are searched for, which maximizethe energy of a time history obtained by stacking the shifted waveform. A Monte-Carloprocedure is used for random générafion of the fime shifts. Then the Hemm Earthmodel is used for obtaining travel-fime residuals and further elevafion and shallowvelocity (from reflecfion seismics) reducfions are applied. Final travel-fime residuals arethen inverted as an over-determined linear equations system, solved by a dampedleast-squares technique. The resolufion of teleseismic determinafions is much smallerthan that of microearthquakes, because of the low-frequency signal used. Theapplicafion thus is generally restricted to the delineafion of large structures such asmajor intrusions, heat sources, and a global reservoir geometry.
BRGM/RP-57089-FR - Final report 1 07
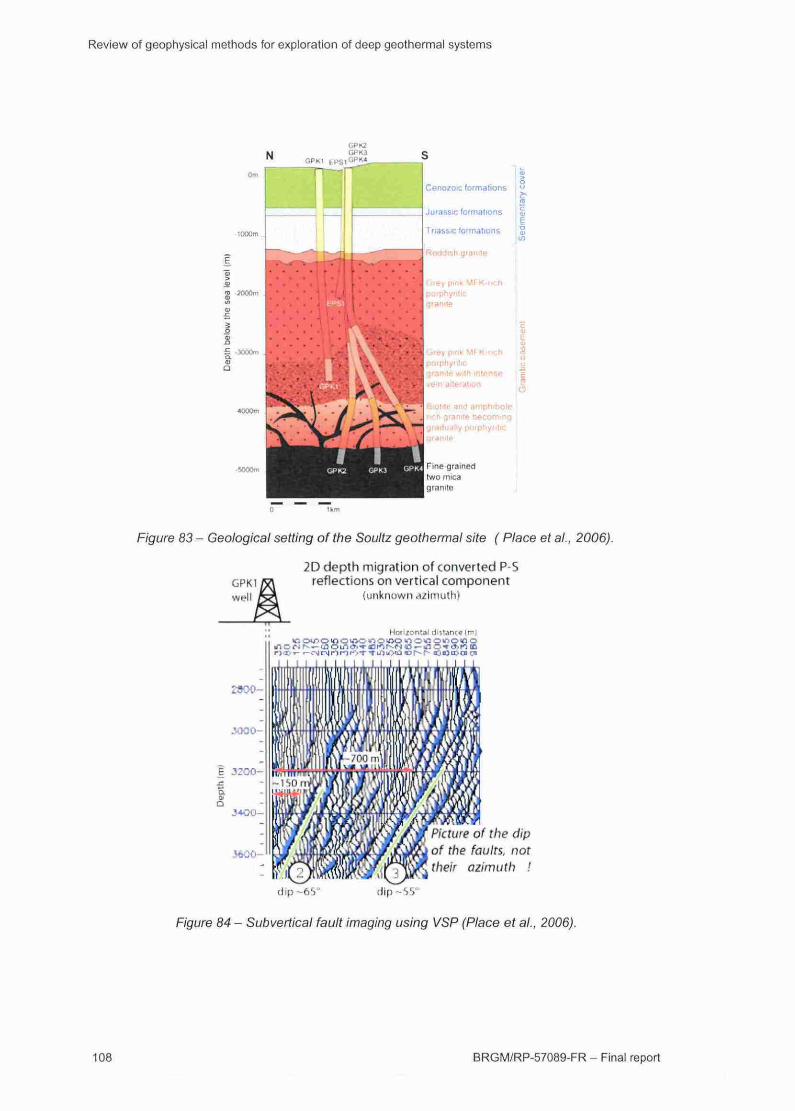
Review of geophysical methods for exploration of deep geothermal systems
Cenoioic formatons
Jurassic formations
Triasse formations
oddish grande
rey pink MFK-ncliliphyrilican lie
MFK-nchrphyriticimte with intense?m altération
otile and amphiboleh granite Becoming3dually porphyJilican tie
Tine-grainedtwo micagramle
Figure 83 - Geological setting of the Soultz geothermal site ( Place et al., 2006).
GPKl
2D depth migration of converted P-Sreflections on vertical component
iunknuwn azimuth)
Hanrontal dînante Imi
2SO0-
MQO-
E 32O0-
Picture of the dipof the faults, nottheir azimuth !
dip~6S" dlp^SS"
Figure 84 - Subvertical fault imaging using VSP (Place et al., 2006).
108 BRGM/RP-57089-FR - Fina! report
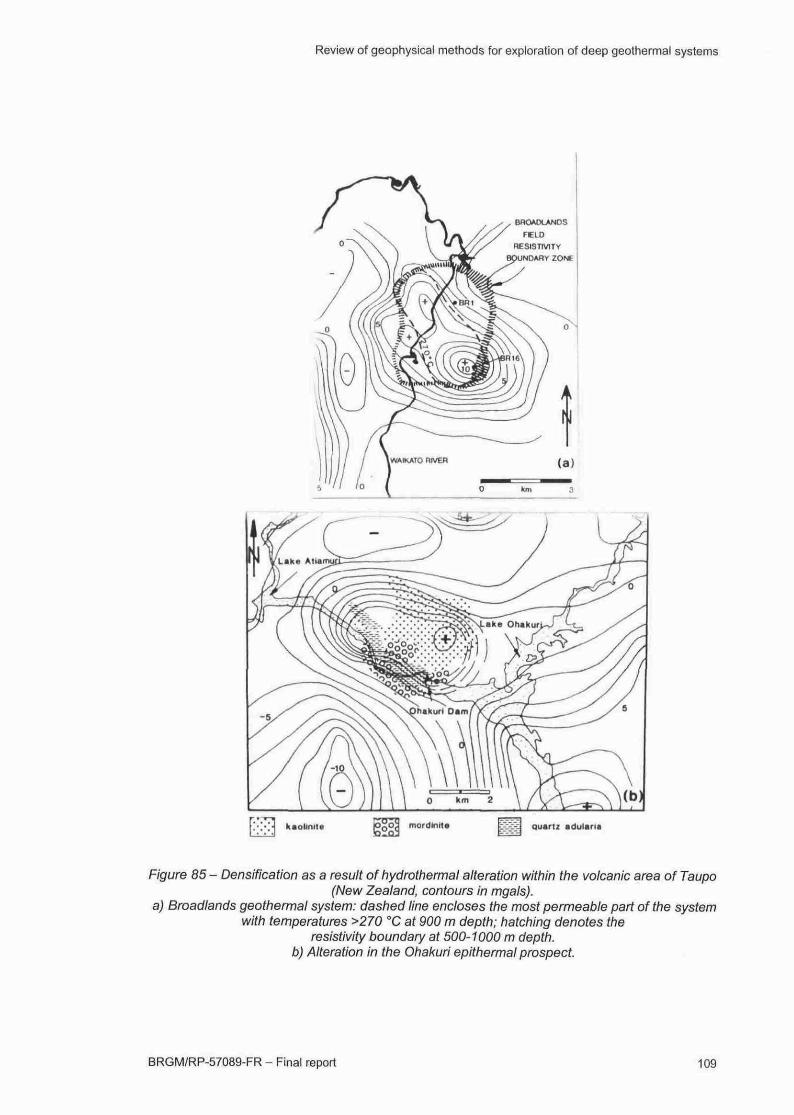
Review of geophysical methods for exploration of deep geothermal systems
BROADLANDS
FELDRESISTIVITY'UNOARY ZONE
quartz adularía
Figure 85 - Densification as a result of hydrothermal alteration within the volcanic area of Taupo(New Zealand, contours in mgals).
a) Broadlands geothermal system: dashed line encloses the most permeable part of the systemwith temperatures >270 °C at 900 m depth; hatching denotes the
resistivity boundary at 500-1000 m depth,b) Alteration in the Ohakuri epithermal prospect.
BRGM/RP-57089-FR- Final report
Review of geophysical methods for exploration of deep geothermal systems
3.3. GRAVITY
The gravity geophysical exploration method studies anomalies of the earth'sgravitafional field that are caused by underground density variations. The Bouguermodel is usually used for presenting gravity data after correction for elevation, lafitude,relief and tidal effects. Bouguer anomalies are thus expected to correspond tounderground geological formations or structures that have significant density contrastwith their environment. Detail on the method can be found In numerous books and
scientific papers (e.g., Parasnis, 1996)
Varying gravity anomalies can be associated with a geothermal system and be thetarget of gravity surveys associated to geothermal explorafion. Allls (1990) reports thatgravity-high anomalies of the order of mgals may occur as a result of mineralprecipitation, especially In low-density, high-porosity host rocks. Densification of porousrock Is the result of silicate or calcite deposits and greenschlst metamorphism:denslficafion ranges from 0.3 to 0.5 depending on the minerals, ft is amplified in case ofepidote or sulphide deposits. At Broadlands and Ohakuri (Figure 85), a denslficafion of0.4 was measured In boreholes In breccia, Ignimbrite and rhyolitic lava, whose initialporosity varies between 1.8 and 2.5 with a porosity of 20-50%. In relatively dense hostrocks, he also observed conversely that local fracturing, alteration and late-stageleaching may actually cause gravity-low anomalies of several mgals.
Geothermal reservoirs may develop In a porous medium that Is pooriy or not scaled,and weakly to unmetamorphosed, which may appear as negafive gravity anomalies asfor instance In the Primavera caldera (Alatorre-Zamora and Campos-Enriquez, 1991)filled with low-density tuff, rhyolite and sediments.
Intrusion of dense quartz diorite in a less dense andesitic environment producespositive gravity anomalies at Mt St-Helens (Williams et al., 1987) and In the Kahara-Talaga Bodas geothermal field (Tripp et al., 2002). Conversely, a low-density, moltenmagma In a dense solidified crystalline basement, such as at Larderello (cf. Figure 6),generates a negative anomaly.
Lithological variations, which can be very significant as for example In a volcanicenvironment between dense massive basalt or andésite lavas (d = 2500 - 2900 kg/m^)and pyroclasfic formafions (d = 1700 - 2100 kg/m^), may also be at the origin ofsignificant gravity anomalies. These variations, when superficial, Irregulariy distributedand not controlling the geothermal system, can Interfere and mask the deeper signal ofinterest as it is the case at Bouillante (cf. Figure 61).
Since the sources of gravity anomalies are numerous and variable, since oppositeresponses can be observed for the same feature as it is the case for intrusions,Interpretation of gravity data Is never easy and unequivocal. In addlfion, directinformafion about the reservoir is rarely obtained. However, the method Is extensivelyused on most prospects as it can:
- Provide significant information on the structures controlling the setting of thegeothermal system,
1 1 0 BRGM/RP-57089-FR - Final report
Review of geophysical methods for exploration of deep geothermal systems
- Generally contribute to the Interprétafion of the deeper and major geologicalfeatures by correlation with the results from other methods and using modelingconstraints, such as density determination on core samples and calibration onboreholes data.
3.4. MAGNETIC METHOD
The magnefic method of applied geophysics alms at measuring the anomalies of theearth's magnetic field produced by variations In the intensity of magnetization ofunderground rock formafions and structures. Measurements may be made on theearth's surface, or above it, at a certain height, in the case of airborne surveys.
The magnetlzafion of rocks Is partly due to induction by the magnetizing forceassociated to the earth's field and partly to their remanent magnetization. The Inducedintensity depends primarily upon the magnetic susceptibility as well as on themagnetizing force and the remanent intensity upon the geological history ofthe rock.
Within a geothermal system, one can observe magnefic anomalies related to:
High magnetic suscepfibility of rocks (mainly basic rocks) due to their highcontent of magnetic minerals and particulariy of magnéfite;
Remanent magnetlzafion acquired in cooling from high temperatures. Itsorientation reflects that of the geomagnefic field prevalent at the place and fimeof cooling;
Chemical processes in the transformation of magnetite alter the initial rockcontent: transformation of magnetite to pyrite or to hematite as a result of theaction by hydrothermal fluids causes demagnefizafion anomalies (Wright et al.,1985)
Magnetite destrucfion by hydrothermal weathering Is observed In various geothermalfields around the worid such as Taupo in New-Zealand and OIkaria In Kenya. AtWarekel In New-Zealand, a significant decrease of magnefic susceptibility at depthsgreater than 1 km has been observed on core samples (Allls, 1990). De-magnetizationat depth or on the surface Is often well correlated with major hot-fluid circulation oremergence, as It Is the case at Bouillante (cf. Figure 62).
Magnetic maps are commonly used as a help In defining the structure of a geothermalfield. The magnetic gradient of the high-senslfivlty airborne survey performed at DixieValley Is shown in Figure 86.
Magnetic surveys may also be used for estimating the base depth of the magneficsources that correspond to the depth at which their magnefization disappears becauseof heafing. For a uniform mineralogy, this depth defines an Isothermal surface, calledCurie Isotherm (Bhattacharrya et al., 1975; Okubo et al., 1985). For magnetite andpyrrhofite, the Curie temperature Is respectively 580 and 320 °C. Practically, assumingthat the magnetic signal Is not affected by lithology, anomalies are Interpreted in terms
BRGM/RP-57089-FR - Final report 1 1 1
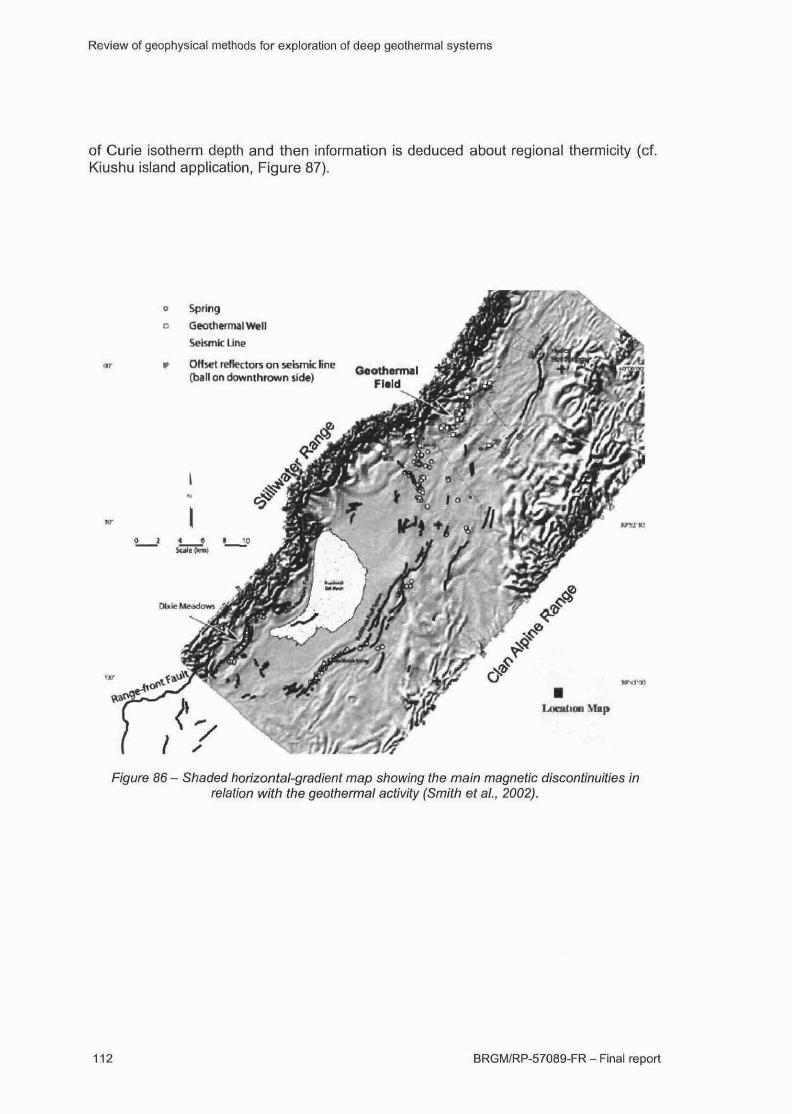
Review of geophysical methods for exploration of deep geothermal systems
of Curie isotherm depth and then information is deduced about regional thermicity (cf.Kiushu island application, Figure 87).
Spring
CeoihemulWell
SeJsmkc Une
OHset reflectors on sefamk fine[ball on downthrown side)
Figure 86 - Shaded horizontal-gradient map showing the main magnetic discontinuities inrelation with the geothermal activity (Smith et ai, 2002).
112 BRGM/RP-57089-FR - Final report
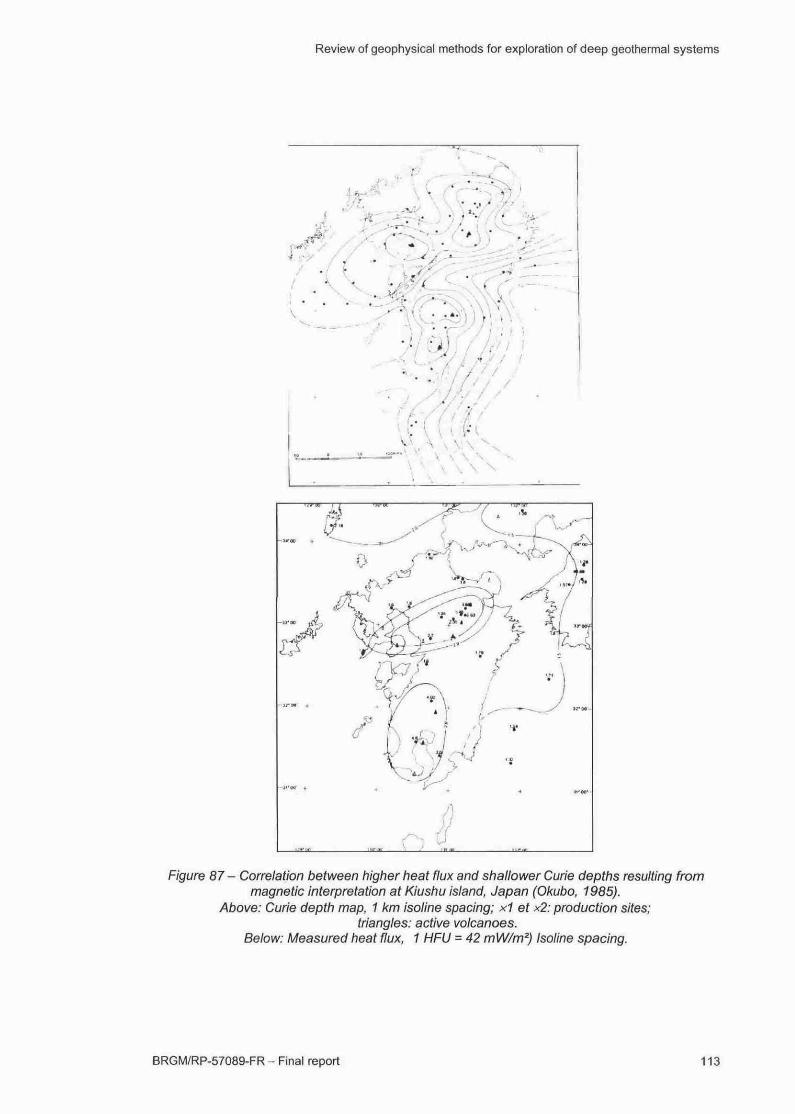
Review of geophysical methods for exploration of deep geothermal systems
Figure 87- Correlation between higher heat flux and shallower Curie depths resulting frommagnetic interpretation at Kiushu island, Japan (Okubo, 1985).
Above: Curie depth map, 1 km isoline spacing; x1 et x2: production sites;triangles: active volcanoes.
Below: Measured heat flux, 1 HFU = 42 mW/m2) Isoline spacing.
BRGM/RP-57089-FR - Final report 113
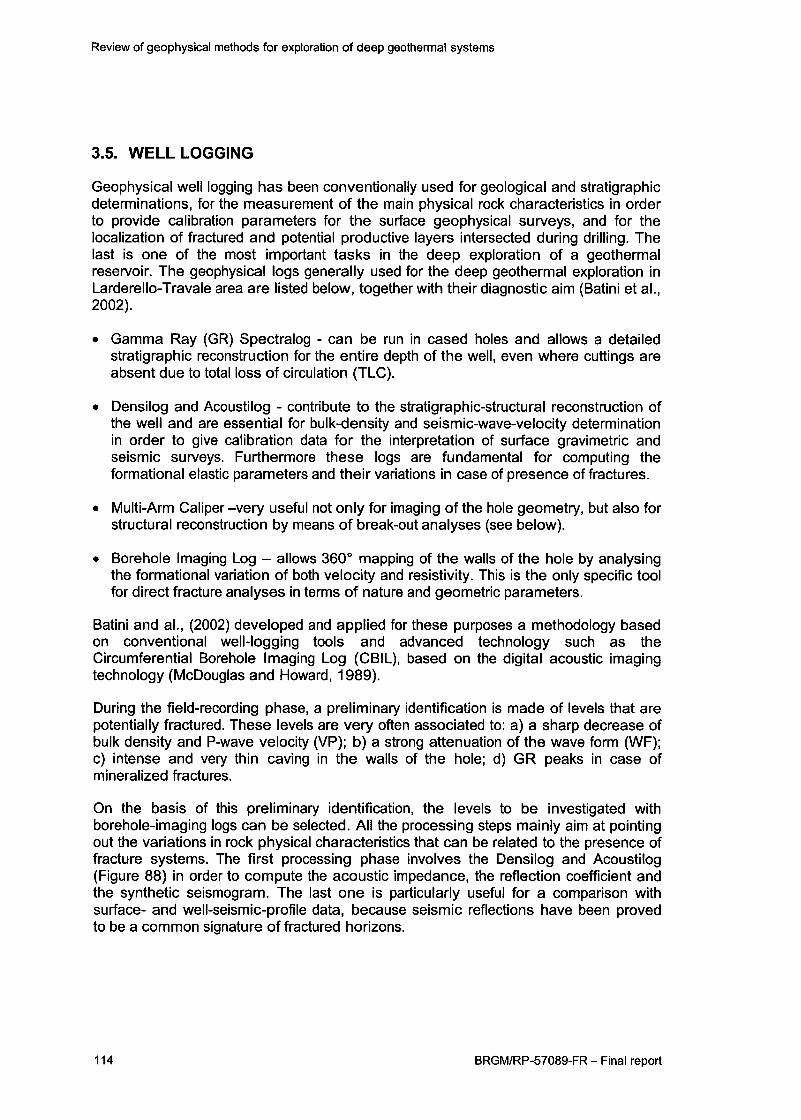
Review of geophysical methods for exploration of deep geothermal systems
3.5. WELL LOGGING
Geophysical well logging has been convenfionally used for geological and stratigraphiedeterminations, for the measurement of the main physical rock characterisfics In orderto provide calibration parameters for the surface geophysical surveys, and for thelocallzafion of fractured and potential productive layers Intersected during drilling. Thelast Is one of the most important tasks In the deep exploration of a geothermalreservoir. The geophysical logs generally used for the deep geothermal exploration InLarderello-Travale area are listed below, together with their diagnostic aim (Batini et al.,2002).
Gamma Ray (GR) Spectralog - can be run in cased holes and allows a detailedstratigraphie reconstruction for the entire depth of the well, even where cuttings areabsent due to total loss of circulation (TLC).
Densllog and Acoustllog - contribute to the strafigraphlc-structural reconstruction ofthe well and are essential for bulk-density and selsmlc-wave-veloclty determinationIn order to give calibration data for the Interpretation of surface gravimetric andseismic surveys. Furthermore these logs are fundamental for computing theformatlonal elasfic parameters and their variations In case of presence of fractures.
Multi-Arm Caliper -very useful not only for imaging of the hole geometry, but also forstructural reconstrucfion by means of break-out analyses (see below).
Borehole Imaging Log - allows 360° mapping of the walls of the hole by analysingthe formafional variafion of both velocity and resistivity. This Is the only specific toolfor direct fracture analyses In terms of nature and geometric parameters.
Batini and al., (2002) developed and applied for these purposes a methodology basedon conventional well-logging tools and advanced technology such as theCircumferential Borehole Imaging Log (CBIL), based on the digital acousfic imagingtechnology (McDouglas and Howard, 1989).
During the field-recording phase, a preliminary Idenfificafion Is made of levels that arepotenfially fractured. These levels are very often associated to: a) a sharp decrease ofbulk density and P-wave velocity (VP); b) a strong attenuafion of the wave form (WF);c) Intense and very thin caving In the walls of the hole; d) GR peaks In case ofmineralized fractures.
On the basis of this preliminary Idenfificafion, the levels to be Investigated withborehole-imaging logs can be selected. All the processing steps mainly aim at pointingout the variafions In rock physical characteristics that can be related to the presence offracture systems. The first processing phase involves the Densllog and Acousfilog(Figure 88) in order to compute the acoustic impedance, the reflection coefficient andthe synthefic seismogram. The last one Is particulariy useful for a comparison withsurface- and well-selsmic-profile data, because seismic reflecfions have been provedto be a common signature of fractured horizons.
1 1 4 BRGM/RP-57089-FR - Final report
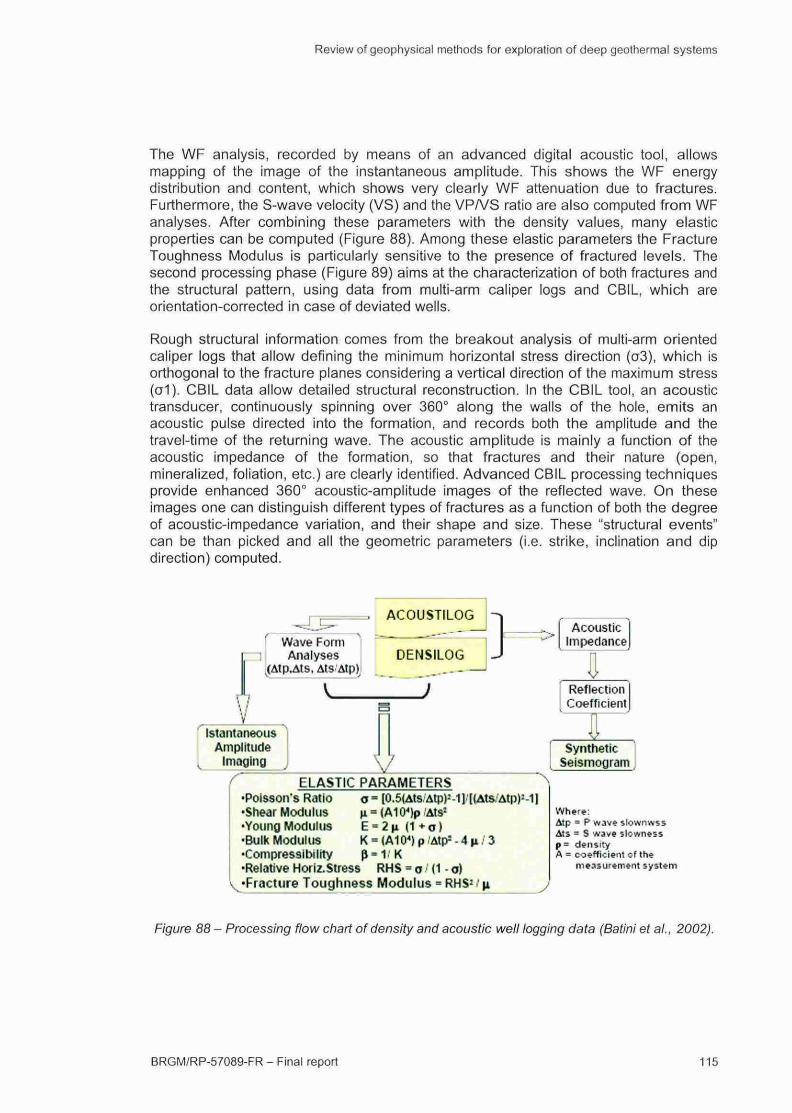
Review of geophysical methods for exploration of deep geothermal systems
The WF analysis, recorded by means of an advanced digital acoustic tool, allowsmapping of the image of the instantaneous amplitude. This shows the WF energydistribution and content, which shows very clearly WF attenuation due to fractures.Furthermore, the S-wave velocity (VS) and the VP/VS ratio are also computed from WFanalyses. After combining these parameters with the density values, many elasticproperties can be computed (Figure 88). Among these elastic parameters the FractureToughness Modulus is particularly sensitive to the presence of fractured levels. Thesecond processing phase (Figure 89) aims at the characterization of both fractures andthe structural pattern, using data from multi-arm caliper logs and CBIL, which areorientation-corrected in case of deviated wells.
Rough structural information comes from the breakout analysis of multi-arm orientedcaliper logs that allow defining the minimum horizontal stress direction (o3), which isorthogonal to the fracture planes considering a vertical direction of the maximum stress(o1). CBIL data allow detailed structural reconstruction. In the CBIL tool, an acoustictransducer, continuously spinning over 360° along the walls of the hole, emits anacoustic pulse directed into the formation, and records both the amplitude and thetravel-time of the returning wave. The acoustic amplitude is mainly a function of theacoustic impedance of the formation, so that fractures and their nature (open,mineralized, foliation, etc.) are clearly identified. Advanced CBIL processing techniquesprovide enhanced 360° acoustic-amplitude images of the reflected wave. On theseimages one can distinguish different types of fractures as a function of both the degreeof acoustic-impedance variation, and their shape and size. These "structural events"can be than picked and all the geometric parameters (i.e. strike, inclination and dipdirection) computed.
ACOUSTILOG
f Wave Form 'Analyses
(At p. At s. Ats'Atp)
Ï
DENSILOG
IstantaneousAmplitude
imaging
ELASTIC PARAMETERS•Poisson's Ratio•Shear Modulus•Young Modulus•Bulk Modulus•Compressibility•Relative Horiz.Stress
o = [0.5<Ats,Atp)MI [(Ats.Atp)MJ*i = (A10<)p Ats:
E = 2 \i (1 + o )K = <A10«) p 'Atp2 - 4 ¡i / 3ß = 1- K
RHS = a •" (1 • a)^•Fracture Toughness Modulus = RHS2 •' \i
AcousticImpedance
ReflectionCoefficient
SyntheticSeismogram
Where:Atp = P wave slownwssi t s = S wave slownessp= densityA = coefficient of the
measurement system
Figure 88 - Processing flow chart of density and acoustic well logging data (Batini et al., 2002).
BRGM/RP-57089-FR - Final report 115
Review of geophysical methods for exploration of deep geothermal systems
Multi-ArmsCALIPER
CircumferentialBorehole
Imaging Log
Break-outAnalyses
O3 direction
Acoustic Amplitude Imagingof the reflected wave
Enhanced 360° fractureand formation mapping
PICKING OF THE MAIN STRUCTURAL "EVENTS'
COMPUTATION OF THE FRACTURE ASSETS(Strike, Inclination and Dip direction)
Figure 89 - Processing flow chart for fracture analyses from well logging (Batini et al., 2002).
The final target is the search for and determination of reliable correlations between rockphysical characteristics of the fractures, and their nature, attitude and productivity. Forthis purpose, temperature and pressure (T&P) logs measured during drawdown,injection and production tests are compared with the well-logging approach. ENELGreen Power has developed its own instrumentation using innovative technology foroperating in the particular conditions prevailing in a geothermal environment. Thespecific temperature and pressure probe has the following operational limits: 316 °C(extreme conditions 400 °C) ±0.2 °C and 50 MPa ± 0.3%.
At Gross-Schönebeck, a full set of well-logging tools was applied to investigating theRotliegend series. Among them, significant output was provided by:
Spectral gamma-ray for identification of the different detrital formationsconstituting the Rotliegend series;
Fullbore Formation Micro Imager (FMI, Schlumberger™) for a better fracturedetection and characterization than with the acoustic borehole televiewer(ABF14) used before;
Reservoir Saturation Tool logs (RST, Schlumberger™) based on pulsed neutrontechnology for porosity and permeability determination, which were satisfactorilycorrelated with core-sample determination and compared with temperaturevariations measured during hydraulic injection and production tests.
116 BRGM/RP-57089-FR - Final report
Review of geophysical methods for exploration of deep geothermal systems
4. Summary of experience of applyinggeophysical tools to geothermal exploration in
the different selected sites
The main outputs of the different methods for exploration of the geothermal system ofthe sites selected as part of the l-GET project are summarized In annex 1 .
The table of annex 1 lists the main characteristics of each site (geology, depth,temperature and pressure of the target reservoir, fluid phase and salinity) and gives, foreach method discussed in this report, the main results obtained on each site. It is seenthat not much information is provided for the Gross-Schonebeck and Skierniewice
sites. This Is because their history of geophysical explorafion for geothermal purposesis sfill young. Conversely, Travale and Hengill, which have been studied for a long fime,give numerous and significant results.
The empirical relafion established at Larderello-Travale between the higher amplitudeof H-seismic reflection and most of the steam-filled productive fractures intersected byboreholes, demonstrates that reflecfion seismics is an efficient tool for characterizing afractured reservoir at depth, even in crystalline rock, in addlfion to its well-known abilityto characterize geometry and stratigraphy with high resolution. However, reflectionseismics require huge efforts for exploring areas where highly dipping reflectors existand where geological complexity causes laterally variant elasfic properties. Activeseismics were thus not applied at the three volcanic sites (Hengill, Milos andBouillante), where highly variable physical properties may limit the efficiency of thismethod.
Passive seismics generally provide relevant and deep information about the generalsetting of a geothermal system, which can be compared and correlated with resultsfrom other methods, but rarely provides significant data about the reservoir and itscharacterisfics. Where the density of observafion points is insufficient, geometricalresolufion may be poor, and without serious constraints about the surface seismic
velocity field the confidence level of the results may be low.
Applicafion of MT at Larderello was a challenge since industrial noise severely affectsthe signal-to-nolse ratio condifions, but a specific methodology was developed forovercoming these problems. Although significant resisifivity-distribufion anomalies areobserved in the Larderello-Travale area in relation with the geothermal system, themethod results were never sufficiently conclusive for using them for explorationborehole siting. The reason for this Is that the interprétafion of resistivity variations isnot unequivocal and the cause ofthe low reslsfivity anomalies observed In relation withthe deep reservoir is here not cleariy understood. Conversely, in Iceland a completeresistivity-distribution image from the conductive clay cap on surface to the deepconducfive magmafic intrusion, through the intermediate reservoir, was constructedfrom a MT profile.
BRGM/RP-57089-FR - Final report 1 1 7
Review of geophysical methods for exploration of deep geothermal systems
TDEM and, eariier, DC electrics were used in Iceland as convenfional geophysicaltools for geothermal exploration. These methods generally are used successfully fordellneafing the clay cap (which generally fixes the contour of the system) and forimaging the underiying reservoir, in agreement with the model of a geothermalreservoir where alteration mineralogy controls the resistivity distribution. But, as shownby the Bouillante case, penetrafion depth of DC electrics and TEM Is often insufficientfor a correct investigation of the whole reservoir geometry. There is thus a demand fora more penetrating method that allows delineating the reservoir base and potentiallythe even deeper heat source, in order to obtain an Image of the whole system that isuseful for a full understanding of its funcfioning and further reservoir management MTis generally applied in order to respond to this demand.
Gravity and magnetics always produce interesting information about the generalgeological and structural setting, or significantly contribute with other methods to thecharacterization of the deeper part of the geothermal system. Highly contrasted densityvariafion may interfere with the deeper signal and limit the efficiency of the methodunless heavy constraints can be used in interpretations.
Experimental analysis of the physical behaviour of core samples under reservoircondifions within the well defined condifions of a laboratory, and studies of rockproperties under real reservoir conditions from borehole measurements, can serve asmodels for obtaining a better understanding of the in situ phenomena, and for providinguseful guidelines and constraints for the interpretation of surface measurements.
1 1 8 BRGM/RP-57089-FR - Final report
Review of geophysical methods for exploration of deep geothermal systems
5. Conclusions
Geophysical case histories concerning six geothermal systems were reviewed as partof the l-GET Project. This provided valuable information on the feasibility andperformance of the different geophysical methods when applied to exploring deep,fractured geothermal reservoirs.
Gravity, magnefics and passive seismics, methods that were applied at almost all sites,consistenfiy produce valuable data on the general geological and structural setfing ofsuch reservoirs, or, in combinafion with other methods significanfiy contribute to thecharacterization of the deeper parts of a geothermal system. However, they generallydo not provide direct informafion on the reservoir and its hydraulic properties.
Direct current (DC) electrics and Transient electromagnefism (TEM) have too shallowpenetrafion depths and cannot correctly invesfigate the reservoir geometry as a whole.There is a demand for a more deeply penetrafing method that allows dellneafing thereservoir base and potenfially the even deeper heat source, in order to obtain an imageofthe whole system, useful for a full understanding of its funcfioning and for meaningfulreservoir management. Magnetotelluric (MT) soudings are generally applied in order torespond to this demand.
The Hengill and Larderello-Travale case histories show that 2D/3D modelling of MTdata obtained with appropriate methodology for noise mifigafion, high lateral resolufionand detailed static correction, make it possible to image a geothermal system at greatdepth.
The Larderello-Travale experience of reflecfion-seismics applicafion is a convincingdemonstration that, with consistent amplitude processing and 3D data acquislfion, thismethod is efficient for locating geothermal targets at great depth and this even in acrystalline-rock environment.
MT and reflection seismics thus appear as almost the best surface geophysicalmethods for providing useful informafion at the depths of interest and with sufficientgeometric resolufion. The Fabiansebestyen (Hungary) case history illustrates howreflection seismics and MT can correlate favourably for precisely delineating a fracturedand karstified limestone horizon hosfing conducfive and hot fluids in an altered fault
zone. However, reflecfion seismics find more difficulties and thus require greater effortsand higher costs where highly dipping reflectors exists and where geologicalcomplexity causes laterally variant elasfic properties. Applicafion of active seismics Involcanic setting is very few.
Relations between the hydraulic characteristics of the reservoir and the MT and
seismic responses are well established, but generally are not quantitatively evaluatedand thus will have to be invesfigated in more detail. Laboratory experiments underbetter controlled condifions on core samples and field measurements at the
BRGM/RP-57089-FR - Final report 119

Review of geophysical methods for exploration of deep geothermal systems
Intermediate scale of well-logging and borehole geophysics are necessary, and should
be used as models for a better understanding of in situ phenomena and in order tocheck, calibrate and constrain the interpretation of surface geophysical data.
1 20 BRGM/RP-57089-FR - Final report
Review of geophysical methods for exploration of deep geothermal systems
6. References
Alatorre-Zamora M.A., Campos-Enriquez J.O. (1991) - La Primavera caldera (Mexico):Structure inferred from gravity and hydrogeological considerations. Geophysics, 56, p.992-1002.
Allls R.G. (1990) - Geophysical anomalies over epithermal systems. J. GeochemicalExploration, 36, p. 339-374.
Anderson E., Crosby D., Ussher G. (2000) - Bulls-eye! - Simple resistivity imaging to reliablylocate the geothermal reservoir. Proc. Worid Geothermal Congress 2000, Kyushu-Tohoku, Japan, May 28-june 10, 2000, p. 909-914.
Archie G.E. (1942) - The electrical conductivity log as an aid in determining some reservoircharacteristics. Transaction of the Society of Petroleum Engineers of the AmericanInstitute of Mining. Metallurgical and Petroleum Engineers. 146: p. 54-62.
Arnason, K., Haraldsson, G.I., Johnsen, G. V, Thorbergsson, G. Hersir, G.P., Saemundsson,
Georgsson, L.S. and Snorrason, S.P. (1986) - Nesjavellir; A geological and geophysicalsun/ey 1985. Orkustofnun report OS-86017/JHD-02 96p. (in Icelandic).
Arnason K., Haraldsson, G.I., Johnsen, G.V., Thorbergsson, G., Hersir, G.P., Saemundsson, K.,Georgsson, L.S., Rognvaldsson, S.Th. and Snorrason, S.P. (1987) - NesjavelliOIkelduhalsr; A geological and geophysical sun/ey 1986. Orkustofnun report 08-86018/JHD-02 112p. (in Icelandic).
Arnason K., Karisdottir R., Eysteinsson H., Flovenz O.G. (2000) - The resistivity structure ofhigh temperature geothermal systems in Iceland. Proc. Worid Geoth. Cong. Kyushu-Tohoku, Japan, p. 923-928.
Arnason K. Magnusson LP. (2001) - Geothermal activity in the Hengill area. Results fromresistivity mapping. Orkustofnun report, in Icelandic with English abstract, OS-2001/091,250 p., (2001).
Árpási, M., Unk, J. (2003) - Proposal on multipurpose utilizafion of geothermal fluids with highcontent of dissolved gas and surface temperature higher than 100°C.- Proceedings EGCSzeged (Hungary), 25-30.5.2003, paper P-7-04: 1-14.
Árpási, M., Gyenese, 1., Megyery, M. (2003) - Hydrodynamic tests in well-pairs producinggeothermal energy, Proceedings EGC Szeged (Hungary), 25-30.5.2003, paper 0-1 -05: 1-6.
Árpási, M.,Szili, G. (2002) - Geothermal development in Hungary in (1996-2001) years (situationand objectives), www.geothermie.de/iganews/no47/geothermal_developmentJn_hungary.htm.
Árpási, M., Lorberer, A., Pap. A. (2000) - High Pressure and temperature (geopressured)geothermal reservoirs in Hungary.- Proceedings WGC 2000, Kyushu, Japan, 28.5.-10.6.,2511-2514.
BRGM/RP-57089-FR - Final report 1 21
Review of geophysical methods for exploration of deep geothermal systems
Badahawy, A., Horvath, F., Toth, L. (2001) - Source parameters and tectonic interpretation ofrecent earthquakes (1995-1997) in the Pannonian basin.- Journal of Geodynamics, 31:87-103.
Baldi, P., Bellani, 8., Ceccarelli, A., Fiordelisi, A., Squarci, P., Taffi L. (1995) - Geothermalanomalies and structural features of southern Tuscany. World Geothermal CongressProceedings, Florence, pp. 1287-1291
Baltassat, J.M., Fabriol H. (2009) with the collaboration of R. Bertani, C. Giolito, A. Fiordelisi, H-G. Holl, B. Kepinska, A. Manzella, D. Mendrinos, M. Pussak, M; Wolfgramm - IntegratedGeophysical exploration technologies for deep fractured geothermal system (l-GET) -Inventory of available data in the selected European sites, BRGM Report RP-55381-FR.
Baltrusch S,, Klarner S (1993) - Rotliegend-Grâben in NE-Brandenburg. Z dt geol Ges 144: 173-186*
Bartel, L.C., Jacobson, R.D., 1987. - Results of a controlled-source audio-frequency
magnetotelluric survey at the Puhimau thermal area, Kilauea Volcano, Hawaii.Geophysics 52, 665-677.
Batini F., Fiordelisi A., Graziano F., Nafi Toksoz M., 1995 - Earthquake tomography in theLarderello geothermal area. Proc. Worid Geotherm. Congr. 1995, Florence, vol. 2, pp.817-820.
Batini F., Bertani R., Ciulli B., Fiordelisi A., Valenti P., 2002 - Geophysical well-logging - Acontribution to the fracture characterization. 27th workshop on Geothermal Reservoirengineering, Stanford University, California, January 28-30 2002.
BenzH.M., Chouet B.A., Dawson P.B., Lahr J.C, Page R.A., Hole, J.A.(1 996) -Threedimensional P and S wave velocity structure ofthe Redoubt Volcano, Alaska, J.Geophys. Res., 101, 8111-8128.
Bertani R., Bertini G., Casini M., Ciuffi S., Dini I., Fiordelisi A., Perticone I., Spinelli E. (2006) -Travale test site data collection. l-GET internal report.
Bertani, R., Bertini, G., Cappetfi, G., Fiordelisi, A., Marocco, B.M. (2005) - An Update oftheLarderello-Travale/Radicondoli Deep Geothermal System, Proceedings ofthe WoridGeothermal Congress 2005.
Bertini, G., Casini, M., Ciulli, B., Ciuffi, S., Fiordelisi, A. (2005) - Data Revision and Upgrading ofthe Structural Model ofthe Travale Geothermal Field (Italy), Proceedings ofthe WoridGeothermal Congress 2005.
Benek, R., Kramer, W., McCann, T., Scheck, M., Negendank, J.F.W., Korich, D., Huebscher,H.-D., Bayer, U. (1996) - Permo-Carboniferous magmatism ofthe Northeast GermanBasin, Tectonophysics, 266, 379-404.
Bhattacharrya B.K. et al., (1975) - Analysis of magnetic anomalies over Yellowstone NafionalPark: mapping of Curie-point isothermal surface for geothermal reconnaissance. Journ.Geophys. Res., 80, p. 4461-4465.
1 22 BRGM/RP-57089-FR - Final report
Review of geophysical methods for exploration of deep geothermal systems
Bjornsson, A., Hersir, G.P., Bjornsson, G., (1986) - The Hengill High-Temperature Area in SW-Iceland. Regional Geophysical Survey. Geothermal Resources Council Transacfions, Vol.10, pp. 205-210.
Bodvarsson, G.S., Bjornsson S., Gunnarsson A., Gunnlaugsson, E., Sigurdsson, O.,Stefansson, V., Steingrimsson, B. (1990a) - The Nesjavellir Geothermal Field, Iceland.Part 1. Field Characteristics and Development of a three-Dimensional Numerical Model.Geotherm. Sci. and Tech., Vol. 2 (3), pp. 189-228.
Bouysse, P., Westercamp, D. (1990) - Subduction of Atlantic aseismic ridges and LateCenozoic evolufion ofthe Lesser Antilles Island Arc, Tectonophysics, 175, 349-380.
Brezsnyanszky, K., Haas, J. (1986) - Main features ofthe pre-Tertiary basement of Hungary.-Geologicky Sbornik. 37, 3: 297-303.
Bujakowski, W. Barbacki, P.A., Graczyk, S., Holojuch, G., Kepinska, B., Pajak, L., Pussak, M.,Sadowska, A. (2007) - Skierniewice site (Poland): Integration and evaluation ofexploration data. l-GET internal progress report.
Cameli, M.C., Ceccarelli, A., Dini, I., Mazzotti, A.. (2000) - Contribution ofthe seismic reflectionmethod to the location of deep fractured levels in the geothermal fields of SouthernTuscany (Central Italy). In Proc. Worid Geothermal Congress 2000, Kyushu-Tohoku,Japan, May 28-june 10, 1025-1029.
Cappetfi, G., Fiordelisi, A., Casini, M., Ciuffi, S., Mazotti, A. (2005) - A new deep explorationprogram and preliminary results of a 3D seismic survey in the Larderello-Travalegeothermal field (Italy), Proc. Worid Geothermal Congress 2005.
Clarke, J., Gamble, T.D., Goubau, W.M., Koch, R.H. (1983) - Remote referencemagnetotellurics: equipment and procedures. Geophysical Prospecfing, v. 31, p. 149-170.
Csontos, L., Benkovics, L., Bergerat, F., Mansy, J.L., Worum, G. (2002) - Tertiary deformationhistory from seismic section study and fault analysis in a former European Tethyanmargin (the Mecsek-Villany area, SW Hungary).- Tectonophysics, 357(1-4): 81-102.
Debeglia, N., Bourgeois, B., (2007) - Reconnaissance géophysique du site géothermique deBouillante - Interprétation du levé magnétique et compléments d'interprétation dupanneau électrique. Rapport BRGM/RP-xxxxx-FR, 87 p.
Dôvényi, P., Horvath, F., Liebe, P., Gálfi, J., Erki, I. (1983) - Geothermal conditions in Hungary.Geophysical Transactions, Vol. 29/1: 3-113.
Fabriol, H. (2000) - Champ géothermique de Bouillante : Synthèse des études géophysiques.Rapport BRGM RP50259-FR.
Fabriol, H., Bitri, A., Bourgeois, B., Debeglia, N., Center, A., Guennoc, P., Jousset, P., Miehe,J.M., Roig, J-Y, Thinon, I., Traîneau, H., Sanjuan, B., Truffert ,C. (2005) - Geophysicalmethods applied to the assessment ofthe Bouillante geothermal field. Proc. WGS2005,Antalya, Turkey, 24-29 April 2005.
BRGM/RP-57089-FR - Final report 123
Review of geophysical methods for exploration of deep geothermal systems
Feuillet, N., Manighetfi, I., Taponnier, P., Jacques, E. (2001) - Arc parallel extension andlocalization of volcanic complexes in Guadeloupe, Lesser Anfilles, J. Geoph. Res., 107,B12, Sect 2, 2331,2359.
Fitterman, D.V. (1989) - Detectability levels for central induction transient soundings.Geophysics, Vol. 54, N°1, p. 127-129.
Foley, J.E., Toksos, M.N., Bafini, F. (1990) -Three-dimensional inversion of teleseismic traveltimes for velocity structure in the Larderello Geothermal field, Italy. GeothermalResources Council Transacfion, 14, part II.
Fiordelisi, A., Mackie, R., Madden, T., Manzella, A.,Rieven, S., (1995) - Applicafion ofmagnetotelluric method using a remote-remote-reference system for characterising deepgeothermal system. Proc. of Worid Geothermal Congress, Vol. 2, pp. 893-898.
Fiordelisi, A., Manzella, A., Buonasorte, G., (2000) - MT Methodology in the détecfion of deep,water-dominated geothermal systems. Worid Geothermal Congress 2000, Kyushu-Tohoku, Japan. May 28-June 1 0, p. 1 1 21 -1 1 26.
Fiordelisi, A., MoffaU, J., Ogliani, F., Casini, M., Ciuffi, S., Romi, A., (2005) - Revisedprocessing and interpretation of reflection seismic data in the Travale geothermal area(Italy). Proc. Of Worid Geothermal Congress 2005.
Fiordelisi, A., Bertani, R. (2006) - Exploration of geothermal ressources in Italy, EngineWorkshop 6-7 November 2006.
Flovenz, O.G., Karisdottir, R., Saemundsson, K., (2000) - Geothermal Exploration inArskogsstrond, N-lceland. Proc. Worid Geothermal Congress 2000, Kyushu-Tohoku,Japan. May 28-June 10.
Flovenz, O.G., Karisdottir, R. (2000) - TEM-Resisfivity image of a geothermal field in N-lcelandand the relation of the resisfivity with lithology and temperature. Worid GeothermalCongress 2000, Kyushu-Tohoku, Japan. May 28-June 10.
Flovenz, O.G., Spangenberg, E., Kumlenkampf, J., Arnasson, K., Karisdottir, R. Huenges, E.(2005) - The role of electrical interface conduction in geothermal exploration. WoridGeothermal Congress 2005, Antalya, Turkey. April 24-29.
Franzson, H., Kristjánsson, R., Gunnarsson, G., Bjornsson, G., Hjartarson, A., Steingrimsson,B., Gunnlaugsson, E., Gislason, G. (2005) - The Hengill-Hellisheiôi Geothermal Field.Development of a Conceptual Geothermal Model, Proceedings Worid GeothermalCongress 2005 Antalya, Turkey, 24-29 April 2005.
Fytikas, M. (1977). "Geological and Geothermal Study of Milos Island", Geological andGeophysical Research, Vol. XVIII No 1, Institute of Geological and Mineral Exploration,Athens.
Gast R, and Gundlach T (2006) Permian strike slip and extensional tectonics in Lower Saxony,Germany. Int J Earth Sci 157(1): 41-55
1 24 BRGM/RP-57089-FR - Final report
Review of geophysical methods for exploration of deep geothermal systems
Giese, LB, Seibt, A, Wiersberg, T, Zimmer, M, Erzinger, J, Niedermann, S, Pekdeger, A (2001) -Geochemistry ofthe Formafion Fluids. Scienfific Report of GFZ Potsdam: STR02/14, p.146-166.
Gunderson, R., Gumming, W., Astra, D., Harvey, C, (2000) - Analysis of smectite clays ongeothermal drill cuttings by the methylene blue method for well site geothermometry andresistivity sounding correlation. Worid Geothermal Congress 2000, Kyushu-Tohoku,Japan. May 28-June 10.
Goguel, J. (1965) - Les recherches françaises d'énergie géothermique à la Guadeloupe.Rapport du symposium international de volcanologie, Nouvelle-Zélande, novembre 1965.
Gunnlaugsson, E. .Gislason, G. (2005) - Preparafion of a new power plant in the Hengillgeothermal area (Iceland), Proceedings Worid Geothermal Congress 2005 Antalya,Turkey, 24-29 April.
Haas, J. (ed., 2001) - Geology of Hungary.- Eótvós University Press Budapest, 1-317.
Hajnal, Z., Hegedüs, E., Keller, R., Fancsik, T, Kovás, A.C., Csabafi, R. (2004) - Low frequency3D-seismic survey of upper crustal magmafic intrusion in northeastern Pannonian basinof Hungary.- Tectonophysics, 388: 239-252.
Harvey C, Browne P. (2000) - Mixed-layer clays in geothermal systems and their effectivenessas mineral geothermometers. Worid Geothermal Congress 2000, Kyushu-Tohoku, Japan.May 28-June 10.
Hjalfi Franzson, Bjarni Reyr Kristjánsson, Gunnar Gunnarsson, Grimur Bjornsson, ArnarHjartarson, Benedikt Steingrimsson, Einar Gunnlaugsson, Gestur Gislason (2005) - TheHengill-Hellisheiôi Geothermal Field. Development of a Conceptual Geothermal Model,Proceedings Worid Geothermal Congress 2005 Antalya, Turkey, 24-29 April 2005.
Holl, H.-G., Moeck, I., Schandelmeier, H. (2005) - Characterisafion ofthe Tectono-SedimentaryEvolution of a Geothermal Reservoir - Implications for Exploitation (Southern PermianBasin, NE Germany). Extended Abstracts, Worid Geothermal Congress, Antalya, Turkey,ISBN 975 98332 04, ISO9660.
Honjas W., Pullammanappillil S.K., Lettis W.R., et al. (1997) - Predicfing shallow earth structurewithin the Dixie Valley georthermal field, Dixie Valley, Nevada, using a non-linear velocityoptimization scheme. In : Proceedings : Twenty-First Workshop on Geothermal ReservoirEngineering, Stanford University, Stanford California, January 27-29, 1997, SGP-TR-155,p. 153-160.
Horvath, F., Dovenyi, P. (2003) - Hungary. - In: Hurter, S., Schellschmidt, R. (ed): GeothermalAtlas of Europe., 45-46.
Huenges, E., Moeck, I. and the Geothermal Project Group (2007) - Directional drilling andstimulafion of a deep sedimentary geothermal reservoir. Scientific Drilling, Vol. 5, p. 47-49.
Johnston, J. M., Pellerin, L., Hohmann, G.W. (1992)- Evaluation of electromagnetic methodsfor geothermal reservoir detection. Geothermal ressources transactions, vol. 16, oct. 92.
BRGM/RP-57089-FR - Final report 1 25
Review of geophysical methods for exploration of deep geothermal systems
Jousset, P. (2006) - Sismologie large bande : méthodologie et applicafions, apport engéothermie haute enthalpie à Bouillante (Guadeloupe), Rapport BRGM/RP54701-FR,119 p., 58 ill.
Kajiwara, T., Mogi, T. Fomenko, E. (2000) - Three dimensional modeling of geoelectricalstructure based on MT and TDEM data in Mori geothermal field, Hokkaido, Japan, Proc.Worid Geothermal Congress 2000, Kyushu-Tohoku, Japan, May 28-june 10, p. 1313-1318.
Konig, H. and Meyer, W. (1988): Ergebnisbericht Finow 2.1 /Liebenwalde 1.1 - VEB KombinatGeophysik Leipzig, unpublished report.
Kujbus (2005): Complex Approach of Establishing a Geothermal Power Plant in Hungary.- WGC2005, Antalya, Turkey, 24.4./29.4.
Lachassagne, P., Maréchal, J.C, Sanjuan, B. (2007) - Hydrogeological synthesis oftheBouillante high energy geothermal field (Guadeloupe, French West Indies)
Larsen, J.C, Mackie, R.L., Manzella, A., Fiordelisi, A.,Rieven, 8. (1996) - Robust smoothmagnetotelluric transfer functions. Geophysical Journal International, 124, 801-819
Llera, F. J., Sato, M., Nakatsuka, K., Yokoyama, H., (1990) - Temperature dependence oftheelectrical resistivity of water saturated rocks. Geophysics, 56, 576-585.
McDouglas, J.G. and Howard, M.G. (1989), "Advances in borehole imaging with secondgeneration CBIL (Circumferential Borehole Imaging Log) borehole televiewerinstrumentation", 28'^ Annual Conference Proceedings, Ontario Petroleum Institute Inc.,Lamberth, Ontario, Canada, paper 12.
McNeill, D.J., (1994)- Principles and applicafion of time domain electromagnetic techniques forresistivity sounding. GEONICS, Technical Note TN-27
Manzella, A., (2004) - Resisfivity and heterogeneity of Earth crust in an active tectonic region.Southern Tuscany (Italy), Annals of Geophysics, 47, 107-118.
Manzella, A., Spichak, V., Pushkarev, P., Sileva, D., Oskooi, B., Ruggieri, G., Sizov, Y. (2006)-Deep fluid circulation in the Travale Geothermal area and its relation with testonicstructure investigated by magnetotelluric survey.
Mazotfi, A., Zamboni, E, Stucchi, E., Ciuffi, S. (2002)- Seismic characterisafion of geothermalreservoirs - a case study in western Tuscany, Italy, Expanded abstracts 64* EAGEConference and Technical Exhibition, Florence 27-30 May 2002.
Marion, E., Fodor, L., (2003) - Tertiary paleomagnetic results and structural analysis from theTransdanubian Range (Hungray): rotafional disfintegration ofthe Alcapa unit.-Tectonophysics, 363: 201-224.
Mendrinos (1988) - Modelling of Milos Geothermal Field in Greece, Master in EngineeringThesis, Department of Theoretical and Applied Mechanics, School of Engineering,University of Auckland, New Zealand.
1 26 BRGM/RP-57089-FR - Final report
Review of geophysical methods for exploration of deep geothermal systems
Mendrinos D. and Karytsas C (2006) - Milos site (Greece) : Integration and evaluation ofexploration data. I-Get internal report.
Mendrinos D., Choropanifis J. and Karytsas C (2009) - Milos site (Greece) : integration andevaluation of exploration data. Poster presented at the l-GET final conference " Geologyand Geophysics in Geothermal Exploration", 22-23 February, Postdam, Germany.
Moeck I, Backers T (2006) New ways in understanding borehole breakouts and wellborestability by fracture mechanics based numerical modelling. EAGE 68th Conference andExhibifion, 12-15 June 2006, extended abstracts volume, CD-ROM, P214, Vienna,Austria
Moeck, I., Schandelmeier, H.,Holl, H.G. (2007) - The stress regime in the Rotliegend ofthe NEGerman Basin: Implicafions from 3D structural modelling. Int J Earth Sciences(submitted).
Moeck, I., Holl, H.G., Schandelmeier, H. (2005) - 3D lithofacies model building ofthe Rofiiegendsediments ofthe NE German Basin. Extended Abstracts CD-ROM, AAPG Intemafional
Conference and Exhibifion, 11-14 September, Paris, France.
Nagy, Z., Landy, I., Pap, S., Rumpler, J. (1992) - Results of magnetotelluric exploration forgeothermal reservoirs in Hungary.- Acta-Geodaetica,-Geophysica-et-Montanistica-Hungarica, 27(1): 87-101.
Nemesi, L., Draskovits, P., Vero, L. (1996) - Some aspects ofthe invesfigafion for high enthalpygeothermal reservoirs in the Carpathian Basin.- Banyaszati es Kohaszati Lapok, Koolajes Foldgaz, 29, 6: 161-168.
Nemeth, G. (1999) - Nagy entalpiaju geotermikus rezervoar a pretercier medencealjzatban, aPannon-medencerendszer del-zalai almedencejeben (Translated Title: A high-enthalpygeothermal reservoir in the lower Tertiary sub-basin ofthe Pannonian Basin system).-Banyaszati es Kohaszati Lapok, Koolaj es Foldgaz, 32, 5: 102-107.
Oskooi, B., Pedersen, L.B., Smirnov, M., Arnason, K., Eysteinsson, H., Manzella, A. and theDGP Working Group (2005) - The deep geothermal structure of the Mid-Atlantic Ridgededuced from MT data in SW Iceland, Physics ofthe Earth and Planetary Interiors, 150,183-155.
Okubo, Y., Graf, R.J., Hansen, R.O., Ogawa, K. (1985) - Curie point depths ofthe Island ofKyushu and surrounding areas, Japan. Geophysics, 50, p. 481-494.
Paige, C C, and M. A. Saunders (1982), LSQR; An algorithm for sparse linear equations andsparse least squares Trans, Math. Software, 8, 43- 71 .
Pape, H., Causer, C, Iffland, J. (1999) - Permeability predicfion based on fractal pore-spacegeometry: Geophysics, vol. 64, no. 5, p. 1447-1460.
Patrier, P., Beaufort, D., Mas, A., Traîneau, H. (2003) - Surficial clay assemblage associatedwith the hydrothermal activity of Bouillante (Guadeloupe, FWI), J. Vole. Geotherm. Res.126, 143-156.
BRGM/RP-57089-FR - Final report 127
Review of geophysical methods for exploration of deep geothermal systems
Pátzay, G., Kármán, F. H., Pota, G. (2003) - Preliminary invesfigafions of scaling and corrosionin high entalpy geothermal wells in Hungary. - Geothermics, 32: 627-638.
Parasnis, D.S. (1996)- Principle of Applied Geophysics. Kluwer Academic Publishers.
Piske, J., Rasch, H.-J., Karnin, W.-D. and Baltrusch, S. (1992) Explorafionsatlas RotliegendesBrandenburg. - Erdol-Erdgas Gommern GmbH/BEB Ergas and Erdol GmbH, Hannover,unpublished report.
Place, J., Geraud, Y., Naville, C, Gerard, A., Schaming, M., Diraison, M., (2006) - Fracturenetwork in the Soultz granite: well seismics and analog field in Catalunia, EngineWorkshop 6-7 nov 2006.
Pellerin, L., Hohmann, G.-W. (1990) - Transient electromagnetic inversion : A remedy formagnetotelluric stafic shifts. Geophysics, 55, p. 1242-1250.
Pellerin, L., Johnston, J.M., Hohmann, G.-W. (1 996) - A numerical evaluafion of electromagneficmethods in geothermal exploration. Geophysics, 61, p. 121-130.
Podvin P. and Lecompte, I. (1991) - Finite difference computafion of travel fimes in verycontrasted velocity models: a massively parallel approach and its associated tools,Geophys. J. Int., 105, 271-284.
Revil, A., L. Cathles III, S. Losh, and J. Nunn (1998) - Electrical conductivity in shaly sands withgeophysical applicafions, J. Geophys. Res., 103(610), 23925-23936
Revil, A., Glover, P.W.J. (1998) - Nature of surface electrical conductivity in natural sands,sandstones and clays. Gephys. Res. Lett., 25 (5), 691-694.
Rieke, H., Kossow, D., McCann, T., Krawczyk, C, (2001) - Tectono-sedimentary evolufion ofthe northernmost margin ofthe NE German Basin between uppermost Carboniferous andLate Permian (Rotliegend): Geological Journal, v. 36, p. 19-38.
Risk, G.F. (1986) - Reconnaissance and follow-up resistivity surveying of New-Zealandgeothermal fields. Proc. 8th Geothermal Workshop.
Rumpler, J. (ed.) (1987) - Research for deep-seated high-enthalpy geothermal reservoirs inHungary (in Hungarian).- KFH Report, 201/86.
Saemundsson, K., (1967) - Vulkanismus und tectonic des Hengill gebietes in Sudwest-lsland.Acta Naturalia lslandica,Vol II, no. 7, (1967).
Sanjuan, B., Lasne, E., Brach, M., (2000) - Bouillante geothermal field (Guadeloupe, WestIndies): geochemical monitoring during a thermal sfimulafion operation. Proceedings 25thWorkshop on Geothermal Reservoir Engineering, Stanford, CÁ.
Sanjuan, B., Brach, M., Lasne, E, (2001) - Bouillante geothermal field: mixing and water/rockinteraction processes at 250°C. Proceedings, 10th International Symposium on WaterRock Interaction, WRI-10, Villasimius (Italy), 10-15 June 2001, Balkema Publishers, 2,911-914.
1 28 BRGM/RP-57089-FR - Final report
Review of geophysical methods for exploration of deep geothermal systems
Sanjuan B., Le Nindre Y-M, Roig J.Y., Menjoz A., Sbai A., Brach M., Lasne E., (2004) - Travauxde recherché lies au développement du champ géothermique de Bouillante(Guadeloupe), Rapport BRGM/RP-53446-FR, 170 p., 84 ill., 4 ann.
Sanjuan B., Traîneau H., Roig J.Y., Miehe J.M., Cofiche C, Lachassagne P., Maréchal J.C,Fabriol H., Brach M., (2005) - Reconnaissance du potential géothermique du secteurNord de Bouillante, en Guadeloupe, par des methods d'exploration de surface, RapportBRGM/RC-53634-FR, 120 p., 38 ill., 2 ann.
Simpson, F., Bahr, K. (2005)- Pracfical Magnetotellurics. Cambridge university Press.
Smith, R.P., Grauch, V.S., Blackwell, D.D. (2002) - Preliminary Results of a High-ResolutionAeromagnetic Survey to Identify Buried Faults at Dixie Valley, Nevada. INEEL ResearchPresented at the 2002 Annual GRC Meefing in Reno, Nevada.
Spichak, V.V., Popova, I.V. (2000) - "Artificial neural network inversion of MT - data in terms of3D earth macro - parameters", Geophysical Journal International, 42, 15-26.
Spichak, V. (2005) - Three-dimensional resistivity structure ofthe Minamikayabe geothermalzone revealed by Bayesian inversion of MT data, Proceedings Worid Geothermal
Congress, Antalya, Turkey, 24-29 April.
Spichak, v., Zakharova O., Rybin A. (2007) - Esfimation ofthe sub-surface temperature bymeans of Magnetotelluric sounding, Proceedings, 32 Workshop on Geothermal ReservoirEngineering, Stanford University, California, January 22-24.
Spies, B.R., Frischknecht, F.C, (1991) - Electromagnetic sounding. Chapter 5. InElectromagnefic methods in applied geophysics- vol. 2: applications, part A and B.,Nabighian, M. Editor, Society of Explorafion Geophysicists.
Stegena, I., Horvath, F., Landy, I., Nagy, Z., Rumpler, J. (1992) - High enthalpy geothermalreservoirs in Hungary. Foldtani Kózióny, 122/2-4: 195-208.
Stegena, L., Horvath, F., Landy, K., Nagy, Z., Rumpler, J. (1994) - High-temperature geothermalreservoir possibilifies in Hungary.- Terra-Nova, 6(3): 282-288.
Tanaka et al., (1999) - Curie point depth based on spectrum analysis ofthe magnefic anomalydata in East and Southeast Asia.
Traîneau, H., Sanjuan, B., Beaufort, D., Brach, M., Castaing, C, Córrela, H., Center, A.,Herbrich, B. (1997) - The Bouillante geothermal field (F.W.I.) revisited: new data on thefractured geothermal reservoir in light of a future stimulation experiment in a lowproductive well. Proceedings, 22d Workshop on Geothermal Reservoir Engineering,Stanford University, Stanford, CA, (1997), 97-104.
Tripp, A., Moore, J.N., Ussher, G. (2002) - Gravity Modeling ofthe Karaha-Telaga BodasGeothermal System, Indonesia. Proceedings Twenty-Seventh Workshop on GeothermalReservoir Engineering, Stanford University, Stanford California, January 28-30, 2002,SGP-TR-171.
Truffert, C (1999) - Etude gravimétrique de la région de Bouillante. Note BRGM-SGN/CMG/GS3D - CT/JB 99/17.
BRGM/RP-57089-FR - Final report 1 29
Review of geophysical methods for exploration of deep geothermal systems
Tsokas, G. (2000) - "The Milos Island Bouguer anomaly revisited by means of a complexattribute analysis and inferred source parameter estimates", Journal ofthe BalkanGeophysical Society, Vol. 3, No 4, November 2000, p. 77-86.
Tullnius, H., Córrela, H., Sigurdsson, O. (2000) - Stimulafing a high enthalpy well by thermalcracking. Proceedings,. Worid Geothermal Congress 2000, Kyushu-Tohoku, Japan,1884-1888.
Uchida T. (2005) - Three-dimensional magnetotelluric investigation in Geothermal fields inJapan and Indonesia. Proceedings Worid Geothermal Congress, Antalya, Turkey, 24-29April 2005.
Unruh J., Pullammanappillil S.K. et al. (2001) - New seismic imaging ofthe Coso geothermalfield. Eastern California. In : Proceedings Twenty-Sixth Workshop on GeothermalReservoir Engineering, Stanford University, Stanford California, January 29-31 , 2001 ,SGP-TR-168, p. 164-170.
Ussher, G., Harvey, C, Johnstone, R (2000) - Understanding the reslstivifies observed ingeothermal systems. Proc. Worid Geothermal Congress 2000, Kyushu-Tohoku, Japan,May 28-june 10, 2000, p. 1915-1920.
Vanorio T., De Matteis R., Zoilo A;, Bafini F., Fiordelisi A., Ciulli B. (2004) - The deep structureof the Larderello-Travale geothermal field from 3D microearthquake traveltimetomography, Geoph. Res. Letters, Vol. 31.
Volpi, G., Manzella, A., Fiordelisi, A. (2003) - Invesfigafion of geothermal structures bymagnetotelluric (MT): an example from the Monte Amiata area, Italy, Geothermics, 32 (2),131-145.
Vozoff, K. (1991) - The magnetotelluric method, in Electromagnetic methods in appliedgeophysics : M.N. Nabighian, Ed., Society of Explorafion Geophysicists, Tulsa,Oklahoma, vol. 2, part B, p. 641-71 1 .
Wanamaker, P.E., Hohmann, G.W., Ward, S.H. (1984) - Magnetotelluric responses of threedimensional bodies in layered earths. Geophysics, vol. 49, n°9, p. 151 7-1 533.
Wanamaker, P.E., Rose, P.E., Doerner, W.M. (2004) - Magnetotelluric surveying and monitoringat the Coso Geothermal area, California, in support ofthe enhanced geothermalconcept : survey parameters and initial results. Proceedings Twenty-Ninth Workshop onGeothermal Reservoir Engineering, Stanford University, Stanford California, January 26-28, 2004, SGP-TR-175, p. 287-294.
Waxman, M.H.,Smits, L.J.M. (1968)- Electrical conducfivifies in oil-bearing shaly sands, Soc.PeLEng. J. 8, 107-122.
Williams, D.L., Abrams, G.A., Finn, C. (1987) - Evidence from gravity data for an intrusivecomplex beneath Mt. St. Helens. J. Geophysical Research, B, Solid Earth and Planets,
92, no. 10, p. 10207-10222.
Wohlenberg ,J., Ochmann, N., Hollnack, D., Schleper, S. (1989) - Seismologische Erkundungder Geothermischen Lagerstatte Milos, Griechenland, CEC Contract No EN3G-0015-D(B), EUR 12450 DE.
1 30 BRGM/RP-57089-FR - Final report
Review of geophysical methods for exploration of deep geothermal systems
Wright, P.M., Stanley, H.W., Howard, P.R. (1985) - State-of-the-art geophysical exploration forgeothermal ressources. Geophysics, Vol. 50, n° 12, p. 2666-2699.
Ziegler PA, Dazes P (2005) Crustal Evolution of Western and Central Europe. In: D. Gee and R.A. Stephenson (Es.), Europe Lithosphère Dynamics. Memoirs of the Geological Society(London)
Ziegler PA (1988) Evolution ofthe ArcticNorth Atlantic and the Western Tethys, AAPG Memoir43, pp. 1-198.
Zonge, K.L. (1992) - Introducfion to TEM, Zonge Engineering and Research organizafionTechnical note. Extracted from Practical Geophysics II, Northwest Mining Association,1992.
Zonge, K.L., Hughes, L.J. (1991) - Controlled Source Audio-Frequency Magnetotellurics, inElectromagnetic methods in applied geophysics,: M.N. Nabighian, Ed. Society ofExplorafion Geophysicists, Tulsa, Oklahoma, vol. 2, part B, p. 641-671 .
BRGM/RP-57089-FR - Final report 1 31


Review of geophysical methods for exploration of deep geothermal systems
Annex 1
Summary of European geothermal sitecharacteristics and geophysical applications
BRGM/RP-57089-FR - Final report 1 33

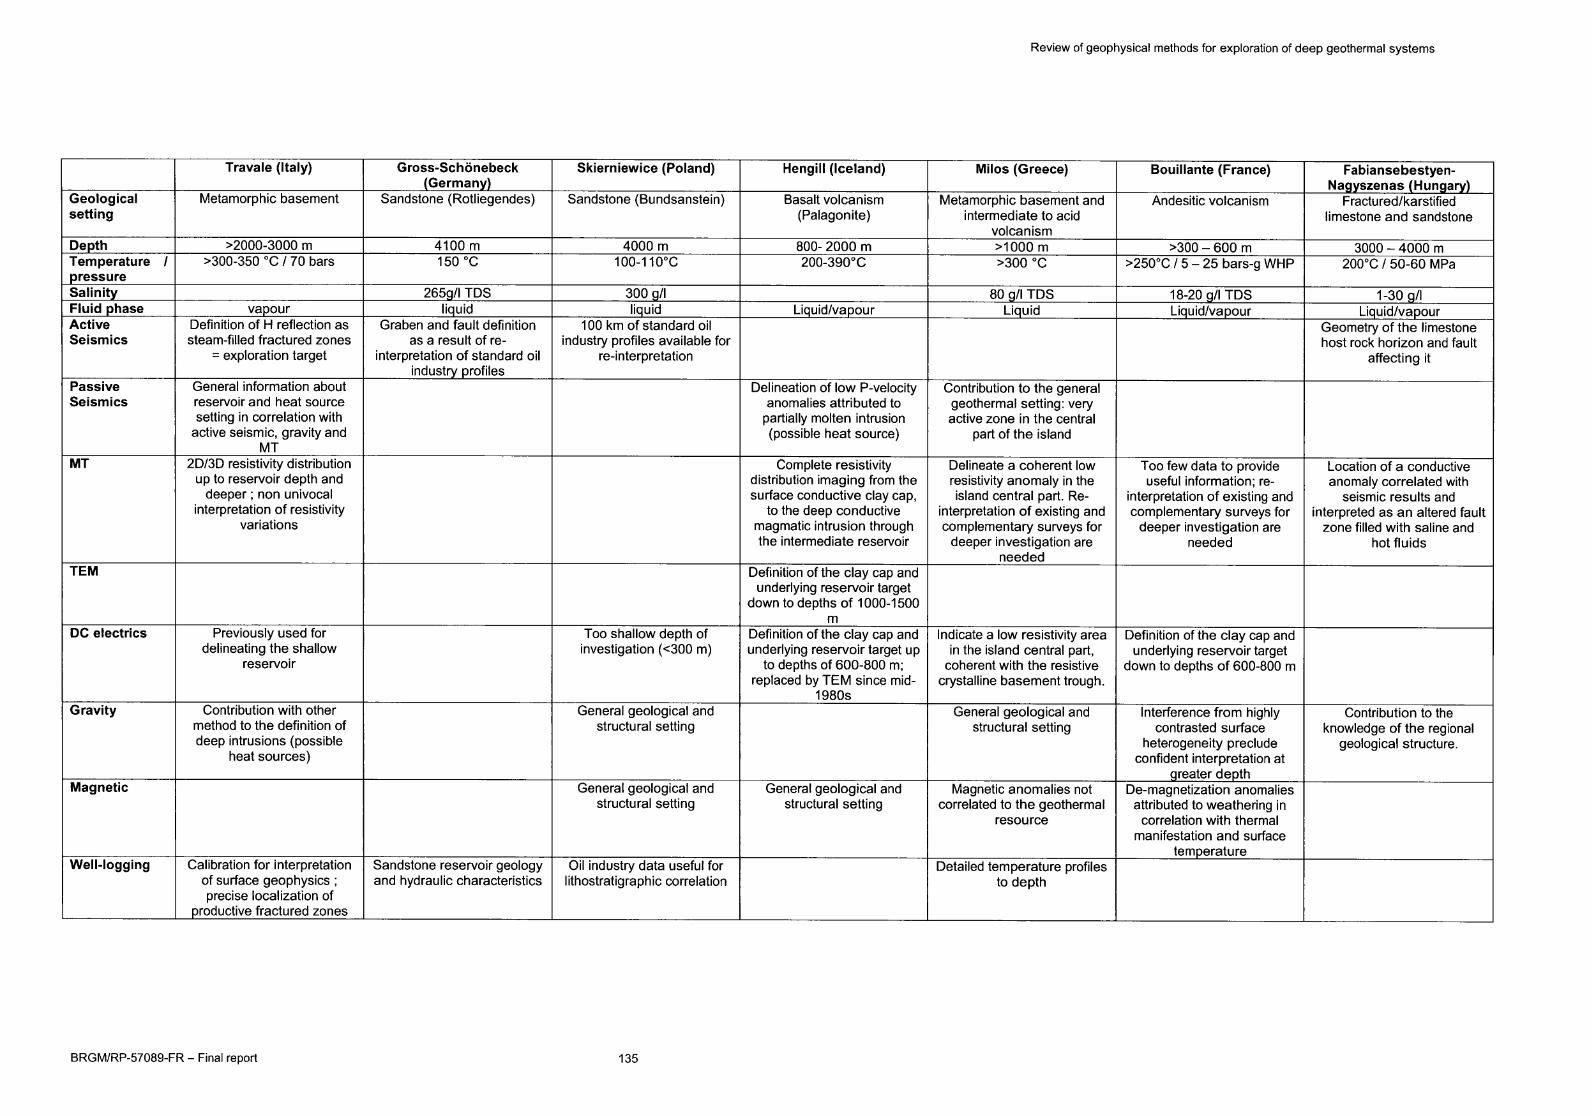
Review of geophysical methods for exploration of deep geothermal systems
Travale (Italy) Gross-Schonebeck
(Germany)Skierniewice (Poland) Hengill (Iceland) Milos (Greece) Bouillante (France) Fabiansebestyen-
Nagyszenas (Hungary)
Geologicalsetting
Metamorphic basement Sandstone (Rofiiegendes) Sandstone (Bundsanstein) Basalt volcanism
(Palagonite)Metamorphic basement and
intermediate to acid
volcanism
Andesific volcanism Fractured/karstified
limestone and sandstone
Depth >2000-3000 m 4100 m 4000 m 800- 2000 m >1000 m >300 - 600 m 3000 - 4000 m
Temperature /
pressure
>300-350 "C 1 70 bars 150 °C 100-110°C 200-390°C >300 °C >250°C / 5 - 25 bars-g WHP 200°C / 50-60 MPa
Salinity 265g/l TDS 300 g/l 80 g/l TDS 18-20 q/l TDS 1-30 g/l
Fluid phase vapour liquid liquid Liquid/vapour Liquid Liquid/vapour Liquid/vapourActive
Seismics
Definition of H reflection as
steam-filled fractured zones
= exploration target
Graben and fault définifion
as a result of re-
interpretafion of standard oilindustry profiles
100 km of standard oil
industry profiles available forre-interpretation
Geometry of the limestonehost rock horizon and fault
affecting it
Passive
Seismics
General information about
reservoir and heat source
setting in corrélafion withactive seismic, gravity and
MT
Delineation of low P-velocityanomalies attributed to
partially molten intrusion(possible heat source)
Contribution to the generalgeothermal setting: veryactive zone in the central
part of the island
MT 2D/3D resistivity distributionup to reservoir depth anddeeper ; non univocal
interpretation of resistivityvariations
Complete resistivitydistribution imaging from thesurface conductive clay cap,
to the deep conductive
magmatic intrusion throughthe intermediate reservoir
Delineate a coherent low
resistivity anomaly in theisland central part. Re-
interpretation of existing andcomplementary surveys fordeeper investigation are
needed
Too few data to provideuseful information; re-
interpretation of existing and
complementary surveys fordeeper investigation are
needed
Location of a conductive
anomaly correlated withseismic results and
interpreted as an altered faultzone filled with saline and
hot fluids
TEM Definition of the clay cap andunderiying reservoir target
down to depths of 1000-1500m
DC electrics Previously used fordelineafing the shallow
reservoir
Too shallow depth ofinvestigation (<300 m)
Definition ofthe clay cap andunderiying reservoir target up
to depths of 600-800 m;replaced by TEM since mid-
1980s
Indicate a low resistivity areain the island central part,coherent with the resistive
crystalline basement trough.
Definition of the clay cap and
underiying reservoir targetdown to depths of 600-800 m
Gravity Contribution with other
method to the definition of
deep intrusions (possibleheat sources)
General geological andstructural setting
General geological andstructural setting
Interference from highlycontrasted surface
heterogeneity precludeconfident interpretation at
greater depth
Contribution to the
knowledge of the regionalgeological structure.
Magnetic General geological andstructural setting
General geological andstructural setting
Magnefic anomalies notcorrelated to the geothermal
resource
De-magnetizafion anomaliesattributed to weathering incorrélafion with thermal
manifestation and surface
temperature
Well-logging Calibration for interpretationof surface geophysics ;precise localization of
productive fractured zones
Sandstone reservoir geologyand hydraulic characteristics
Oil industry data useful forlithostratigraphic correlation
Detailed temperature profilesto depth
BRGM/RP-57089-FR - Final report 135


Geoscience for a sustainable Earth
Scientific and Technical CentreDevelopment Planning and Natural Risks Division
3, avenue Claude-Guillemin - BP 3600945060 Orléans Cedex 2 - France - Tel.: +33 (0)2 38 64 34 34


