aspects of geophysical exploration for groundwater using vertical electrical sounding (ves) in parts...
TRANSCRIPT
*Corresponding author: Email: imoism@gmail
JASEM ISSN 1119-8362
All rights reserved
J. Appl. Sci. Environ. Manage. March 2014 Vol. 18 (1) 19-25
Full-text Available Online at www.ajol.info and www.bioline.org.br/ja
Aspects of Geophysical Exploration for Groundwater Using Vertical Electrical
Sounding (VES) in Parts of University of Benin, Benin City, Edo State
*1IMOUKHUEDE M. IDEHAI; AYIBAWARI O. EGAI
Department Of Geology, University Of Benin, Benin City, Nigeria
KEYWORDS: Vertical Electrical Sounding (VES), Hydrogeological Parameters, Aquifer
ABSTRACT.: A geophysical survey using vertical electrical sounding (VES) was undertaken
within the University of Benin (Ugbowo Campus) in an attempt to ascertain aspects of the
hydrogeological parameters for groundwater exploitation. Six (6) vertical electrical soundings
with electrode spacing of 215m AB/2 were occupied along the traverse, with the aid of
ABEM SAS 1000 Terrameter set. The data were interpreted using the IXID and 3-D field-
map computer softwares. The subsurface stratigraphy is as follows; (262.43-784.7Ωm);
topsoil, (205.65-3666.4Ωm); wet laterite, (44.017-2201Ωm); anomalous soil, (601.03-
1450Ωm); clayed/silty sand, (2712.38-11741Ωm); dry sand, and (2909.7-12423Ωm); as
aquifer. The results reveal depth to water table ranges of 31.2-65.5m. The range of values of
minimum thickness of the aquifer across the VES is from 45-63m. VES 3 is the shallowest
and may be the cheapest to drill and install a borehole. VES 6 with a inferred depth of 63-
65.5m, will probably be the best area to site a borehole in spite of the expected cost
imperatives. The area shows slight spatial variations and plausibly attests to natural
inhomogeneity, anthropogenic interplay in the course of the development of the area via
construction, and very marginal susceptibility to contamination from the health centre and
hostels within the study area. Furthermore, the results conformed to those of previous writers
who described the aquifer as sandy and highly prolific. © JASEM
http://dx.doi.org/10.4314/jasem.v18i1.3
Introduction:
Earth masses have electrical properties. The electrical
resistivity of different geological materials is a
function of a number of factors, which include
variations in water contents, dissolved ions in water
and material make-up. Resistivity investigations can
thus be used to identify zones with different electrical
properties. The Schlumberger resistivity method has
over the years proved useful in delineation of
groundwater and aquifer characteristics due to its
better depth interpretation. Previous investigators
such as Van Overmeeren, (1989), McNeil, (1990),
and Atakpo and Akpoborie, (2008), have buttressed
this. However, it is possible for different rock types to
have the same range of resistivity (Ezomo, and
Akujieze, 2010), this usually make electrical
resistivity data ambiguous to interpret. The
operational efficiency of six points per decade in
subsurface geophysical study in groundwater
exploration has been documented arising from
theoretical approach to electrical resistivity (Ezomo,
2010). Electrical resistivity methods involve the
measurement of the apparent resistivity. Given
expansion and population growth in the university,
there is the need to proactively map outs areas of
optimal groundwater supply for exploitation. This
forms the main thrust of this investigation, which
attempts to delineate the appropriate aquifer area with
a view to producing a blueprint to siting high yield
boreholes in the area in view of its concomitant
benefits.
Description of the Study Area: The area of
investigation lies within longitude 5.620E and latitude
6.40N approximately 350km SW of Abuja. University
of Benin has a human population of over 40,000. The
Ugbowo Campus in Benin City of Edo State lies
within the tropical rain forest and has two distinct
seasons (wet; April to October, and dry; November to
March). The study area lies within the Benin
Formation (Fig 1-3) which extends from the west
across the whole of the Niger Delta area and
southward beyond the present coastline. It consists of
over 90% sandstone with shale intercalations. It is
coarse grained, gravelly, locally fine grained, poorly
sorted, sub-angular to well- rounded and bears lignite
streaks and wood fragment. It is a continental deposit
of probably upper deltaic depositional environment.
Various structural units (point bars, channels fills,
natural levees, back swamp deposit, ox-bow fills) are
identifiable within the formation, indicating a
Aspects of Geophysical Exploration 20
IMOUKHUEDE M. IDEHAI; AYIBAWARI O. EGAI
variability of the shallow water depositional medium.
In the subsurface, it is of Oligocene age in the north
and becoming progressively younger southward. In
general, it ranges from Miocene to Recent. The
thickness is variable but generally exceeds 2Km. In
terms of hydrogeological potentials; Offodile, (2002)
described the Benin Formation as the most aquiferous
formation in Southern Nigeria. It has transmissivity
of 880-30,000M2/day 1.53-3.16×10
-3-storage
coefficient average porosity is 30%. Akujieze, (2004)
investigated the Benin Formation and reported
unconfined to semi confined aquifers in certain
places. Etu-Efeotor, and Akpokodje, (1990),
identified three major aquifers therein.
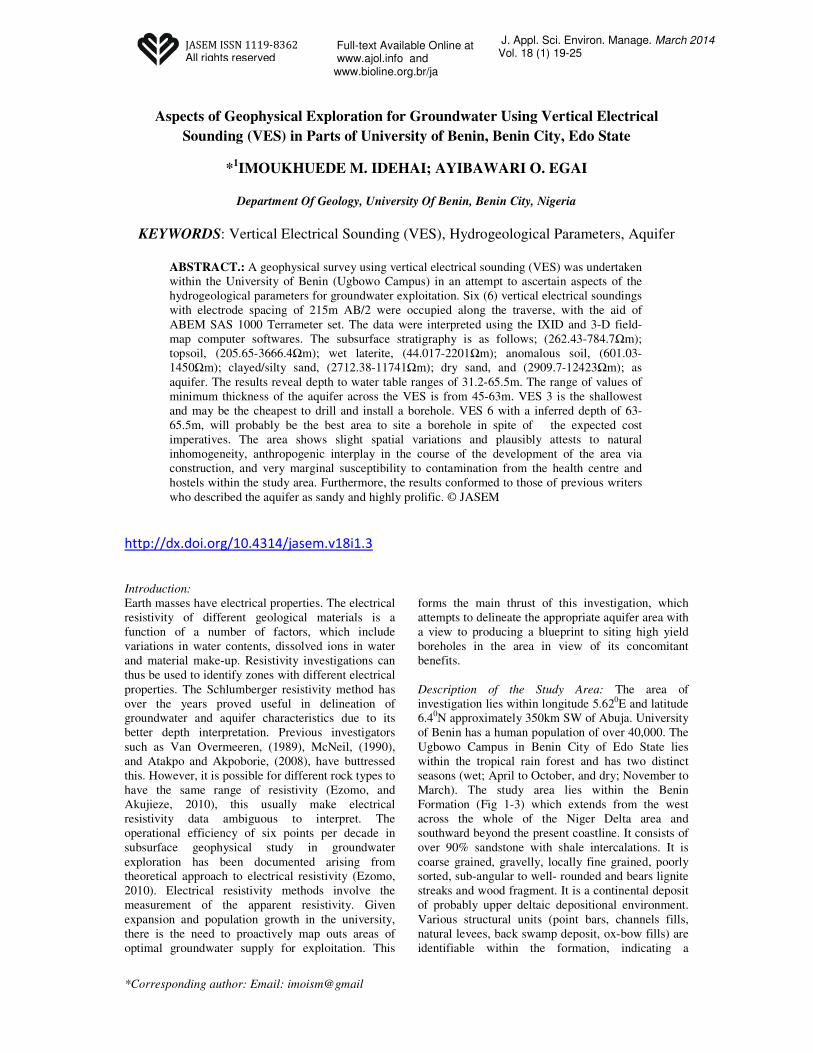
Fig.1: Geological Map of Edo State Showing Benin City and other Locations (Nigerian Geological Survey
Agency, 2006)
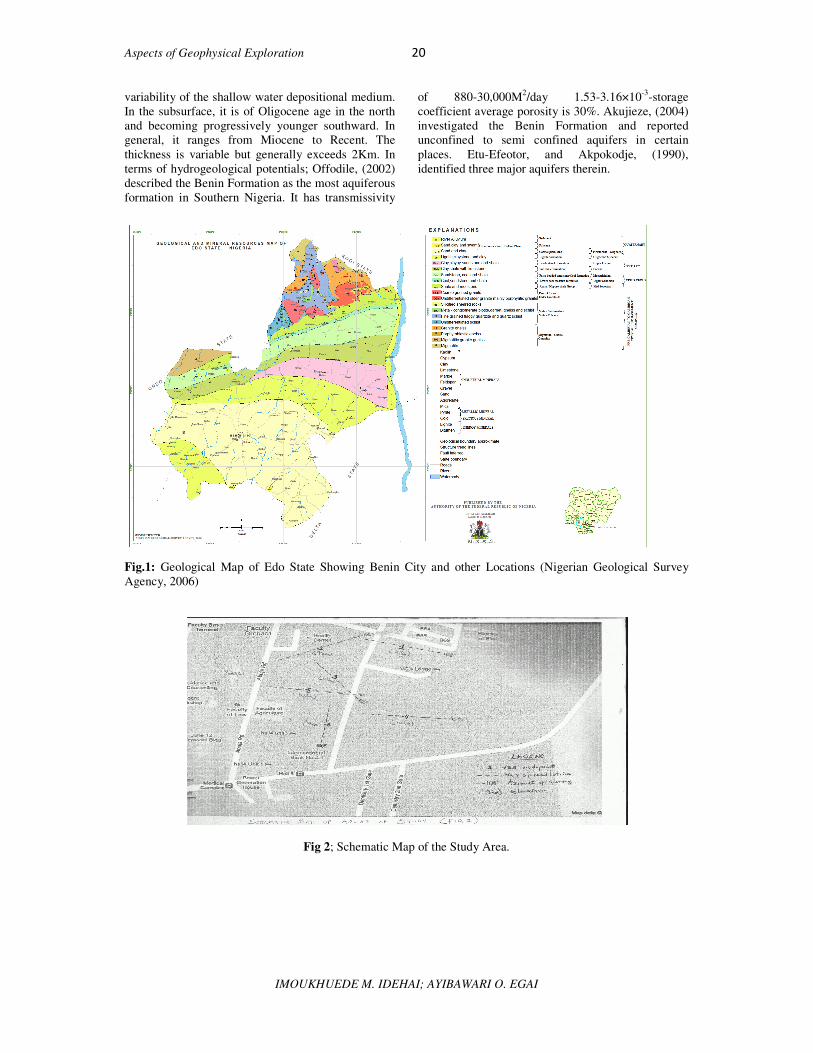
Fig 2; Schematic Map of the Study Area.
Aspects of Geophysical Exploration 21
IMOUKHUEDE M. IDEHAI; AYIBAWARI O. EGAI
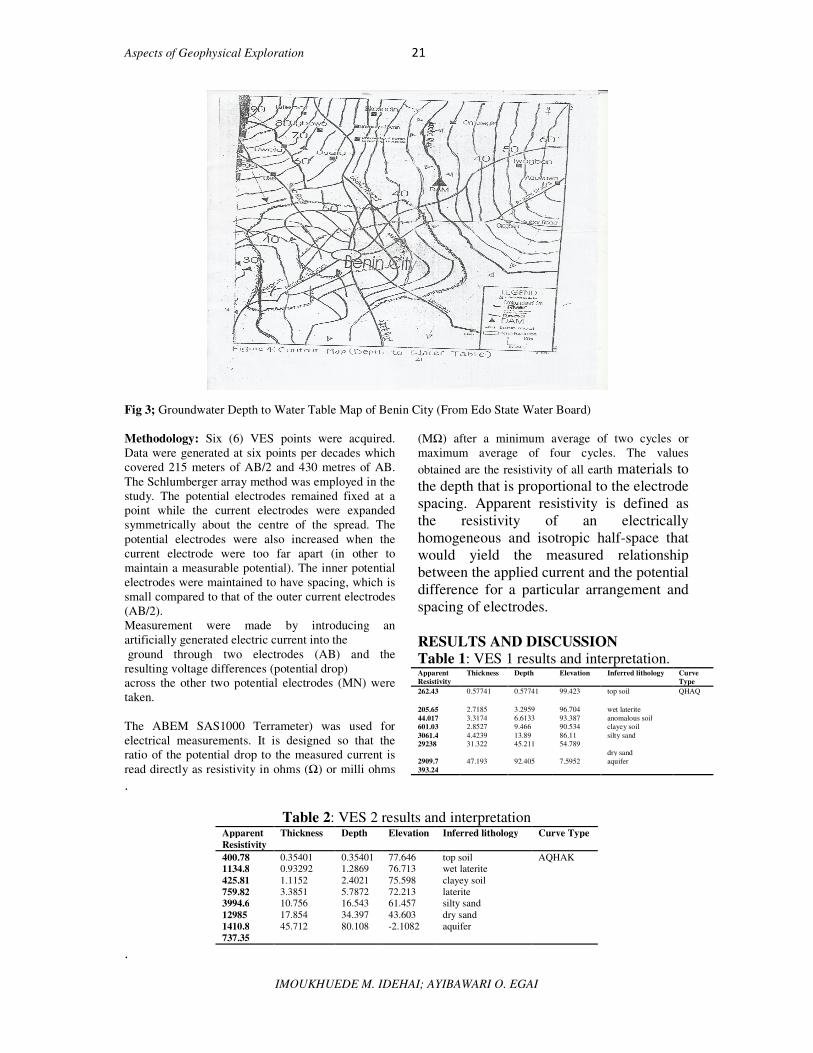
Fig 3; Groundwater Depth to Water Table Map of Benin City (From Edo State Water Board)
Methodology: Six (6) VES points were acquired.
Data were generated at six points per decades which
covered 215 meters of AB/2 and 430 metres of AB.
The Schlumberger array method was employed in the
study. The potential electrodes remained fixed at a
point while the current electrodes were expanded
symmetrically about the centre of the spread. The
potential electrodes were also increased when the
current electrode were too far apart (in other to
maintain a measurable potential). The inner potential
electrodes were maintained to have spacing, which is
small compared to that of the outer current electrodes
(AB/2).
Measurement were made by introducing an
artificially generated electric current into the
ground through two electrodes (AB) and the
resulting voltage differences (potential drop)
across the other two potential electrodes (MN) were
taken.
The ABEM SAS1000 Terrameter) was used for
electrical measurements. It is designed so that the
ratio of the potential drop to the measured current is
read directly as resistivity in ohms (Ω) or milli ohms
(MΩ) after a minimum average of two cycles or
maximum average of four cycles. The values
obtained are the resistivity of all earth materials to
the depth that is proportional to the electrode
spacing. Apparent resistivity is defined as
the resistivity of an electrically
homogeneous and isotropic half-space that
would yield the measured relationship
between the applied current and the potential
difference for a particular arrangement and
spacing of electrodes.
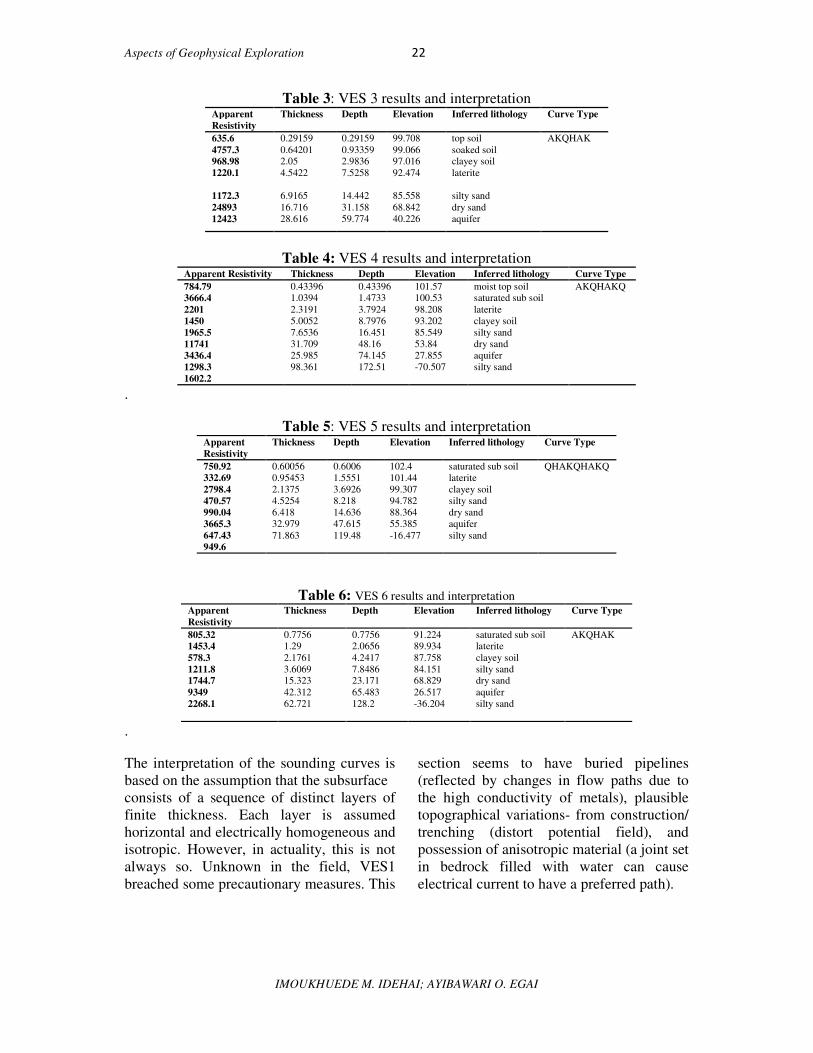
RESULTS AND DISCUSSION
Table 1: VES 1 results and interpretation. Apparent
Resistivity
Thickness Depth Elevation Inferred lithology Curve
Type
262.43 0.57741 0.57741 99.423 top soil QHAQ
205.65 2.7185 3.2959 96.704 wet laterite
44.017 3.3174 6.6133 93.387 anomalous soil
601.03 2.8527 9.466 90.534 clayey soil
3061.4 4.4239 13.89 86.11 silty sand
29238 31.322 45.211 54.789
dry sand
2909.7 47.193 92.405 7.5952 aquifer
393.24
.
Table 2: VES 2 results and interpretation Apparent
Resistivity
Thickness Depth Elevation Inferred lithology Curve Type
400.78 0.35401 0.35401 77.646 top soil AQHAK
1134.8 0.93292 1.2869 76.713 wet laterite
425.81 1.1152 2.4021 75.598 clayey soil
759.82 3.3851 5.7872 72.213 laterite
3994.6 10.756 16.543 61.457 silty sand
12985 17.854 34.397 43.603 dry sand
1410.8 45.712 80.108 -2.1082 aquifer
737.35
.
Aspects of Geophysical Exploration 22
IMOUKHUEDE M. IDEHAI; AYIBAWARI O. EGAI
Table 3: VES 3 results and interpretation Apparent
Resistivity
Thickness Depth Elevation Inferred lithology Curve Type
635.6 0.29159 0.29159 99.708 top soil AKQHAK
4757.3 0.64201 0.93359 99.066 soaked soil
968.98 2.05 2.9836 97.016 clayey soil
1220.1 4.5422 7.5258 92.474 laterite
1172.3 6.9165 14.442 85.558 silty sand
24893 16.716 31.158 68.842 dry sand
12423 28.616 59.774 40.226 aquifer
Table 4: VES 4 results and interpretation Apparent Resistivity Thickness Depth Elevation Inferred lithology Curve Type
784.79 0.43396 0.43396 101.57 moist top soil AKQHAKQ
3666.4 1.0394 1.4733 100.53 saturated sub soil
2201 2.3191 3.7924 98.208 laterite
1450 5.0052 8.7976 93.202 clayey soil
1965.5 7.6536 16.451 85.549 silty sand
11741 31.709 48.16 53.84 dry sand
3436.4 25.985 74.145 27.855 aquifer
1298.3 98.361 172.51 -70.507 silty sand
1602.2
.
Table 5: VES 5 results and interpretation Apparent
Resistivity
Thickness Depth Elevation Inferred lithology Curve Type
750.92 0.60056 0.6006 102.4 saturated sub soil QHAKQHAKQ
332.69 0.95453 1.5551 101.44 laterite
2798.4 2.1375 3.6926 99.307 clayey soil
470.57 4.5254 8.218 94.782 silty sand
990.04 6.418 14.636 88.364 dry sand
3665.3 32.979 47.615 55.385 aquifer
647.43 71.863 119.48 -16.477 silty sand
949.6
Table 6: VES 6 results and interpretation Apparent
Resistivity
Thickness Depth Elevation Inferred lithology Curve Type
805.32 0.7756 0.7756 91.224 saturated sub soil AKQHAK
1453.4 1.29 2.0656 89.934 laterite
578.3 2.1761 4.2417 87.758 clayey soil
1211.8 3.6069 7.8486 84.151 silty sand
1744.7 15.323 23.171 68.829 dry sand
9349 42.312 65.483 26.517 aquifer
2268.1 62.721 128.2 -36.204 silty sand
.
The interpretation of the sounding curves is
based on the assumption that the subsurface
consists of a sequence of distinct layers of
finite thickness. Each layer is assumed
horizontal and electrically homogeneous and
isotropic. However, in actuality, this is not
always so. Unknown in the field, VES1
breached some precautionary measures. This
section seems to have buried pipelines
(reflected by changes in flow paths due to
the high conductivity of metals), plausible
topographical variations- from construction/
trenching (distort potential field), and
possession of anisotropic material (a joint set
in bedrock filled with water can cause
electrical current to have a preferred path).
Aspects of Geophysical Exploration 23
IMOUKHUEDE M. IDEHAI; AYIBAWARI O. EGAI
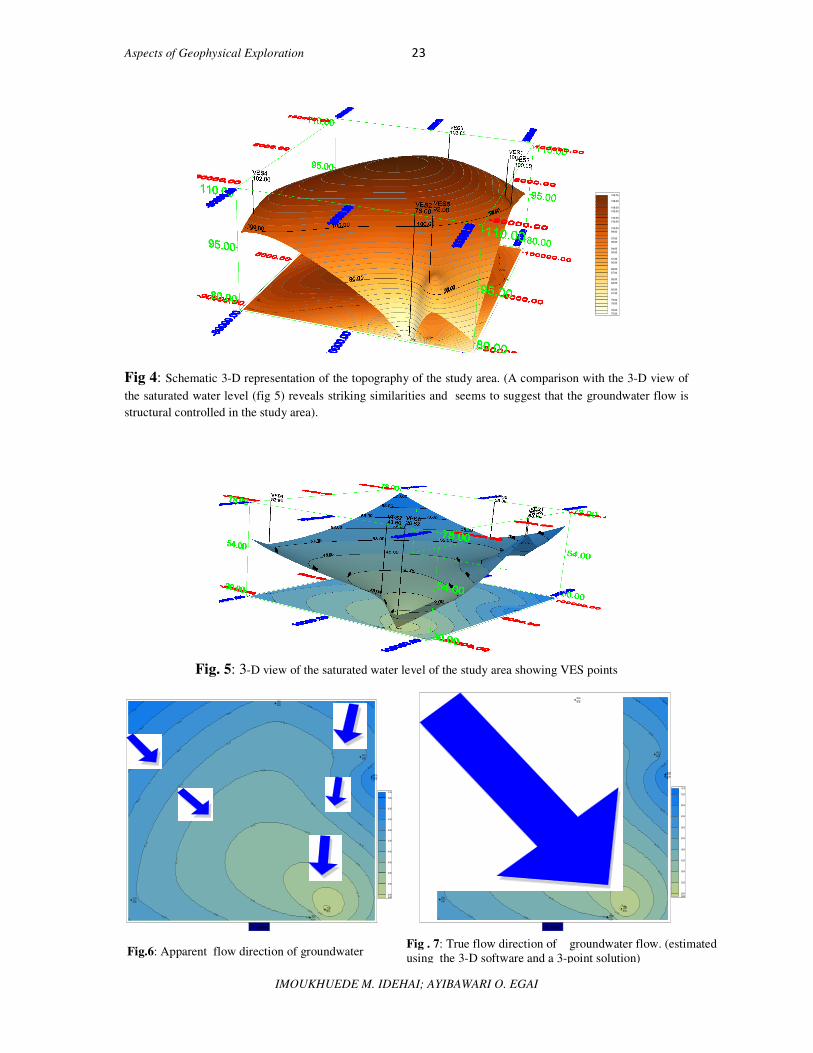
Fig 4: Schematic 3-D representation of the topography of the study area. (A comparison with the 3-D view of
the saturated water level (fig 5) reveals striking similarities and seems to suggest that the groundwater flow is
structural controlled in the study area).
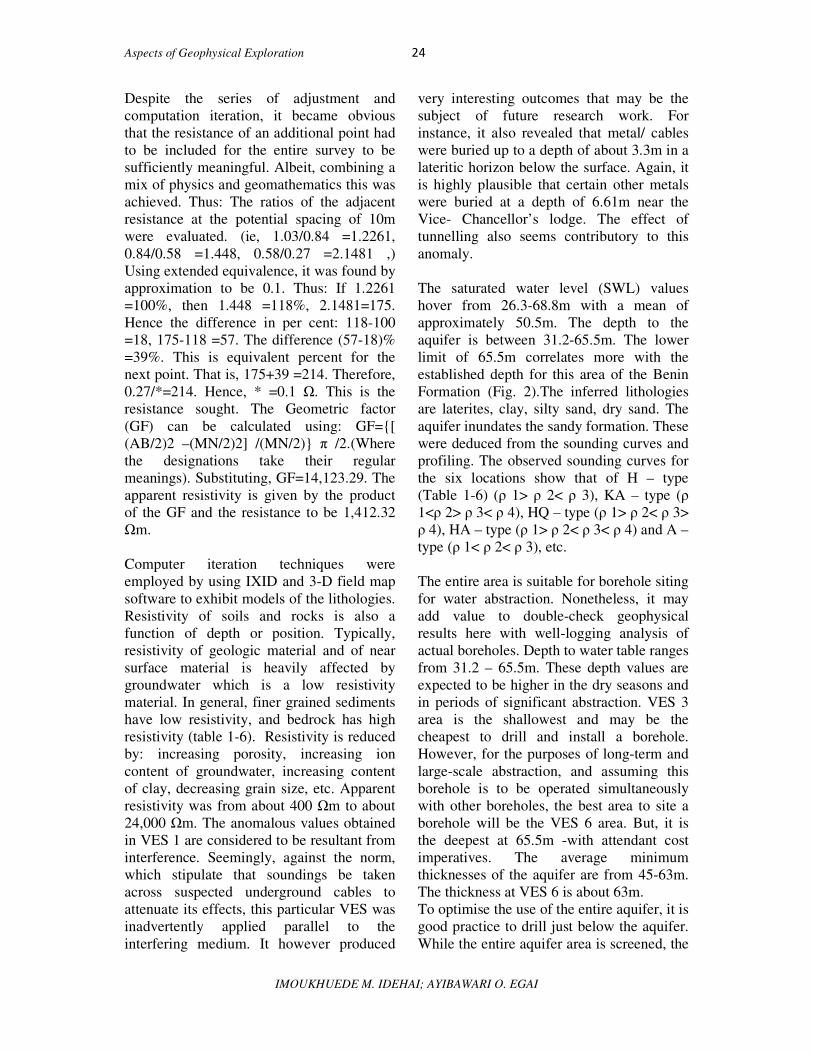
Fig. 5: 3-D view of the saturated water level of the study area showing VES points
109.76
108.00
106.00
105.00
103.00
102.00
100.00
99.00
97.00
96.00
94.00
93.00
91.00
90.00
88.00
87.00
85.00
84.00
82.00
81.00
79.00
78.00
76.00
75.00
33.00
38.0 0
38.0
0
43.00
43 .00
43.00
43 .0 0
43 .00
48 .00
48.0
0
48.00
48.00
48 .0 0
48.00
53 .00
53.0
0
53.0 0
53.00
53.00
53.0
0
53.00
58.0
0
58 .00
58 .0 0
58.00
58 .0 0
63.0063
.0 0
63.00
63 .00
68 .00
73.00
VES1
54.79
VES2
43.60
VES3
68.84
VES4
53.84
VES5
55.38
VES6
26.52
75.76
73.00
68.00
63.00
58.00
53.00
48.00
43.00
38.00
33.00
28.0026.80
Series1
28.00
33.0 038.0043.00
43 .00
43 .00
43 .0 0
43 .00
48 .00
4 8. 0
0
48 .0 0
48.00
48.0 0
48 .00
53 .00
53.0
0
53.0 0
53.00
53.0 0
53. 0
0
58.0
0
58.0 0
58.00
58 .0 0
58 .00
58 .00
63 .0063.00
63.00
63 .00
68 .00
68.00
68 .00
73.00
VES1
54.79
VES2
43.60
VES3
68.84
VES4
53.84
VES5
55.38
VES6
26.52
75.76
73.00
68.00
63.00
58.00
53.00
48.00
43.00
38.00
33.00
28.0026.80
Series1
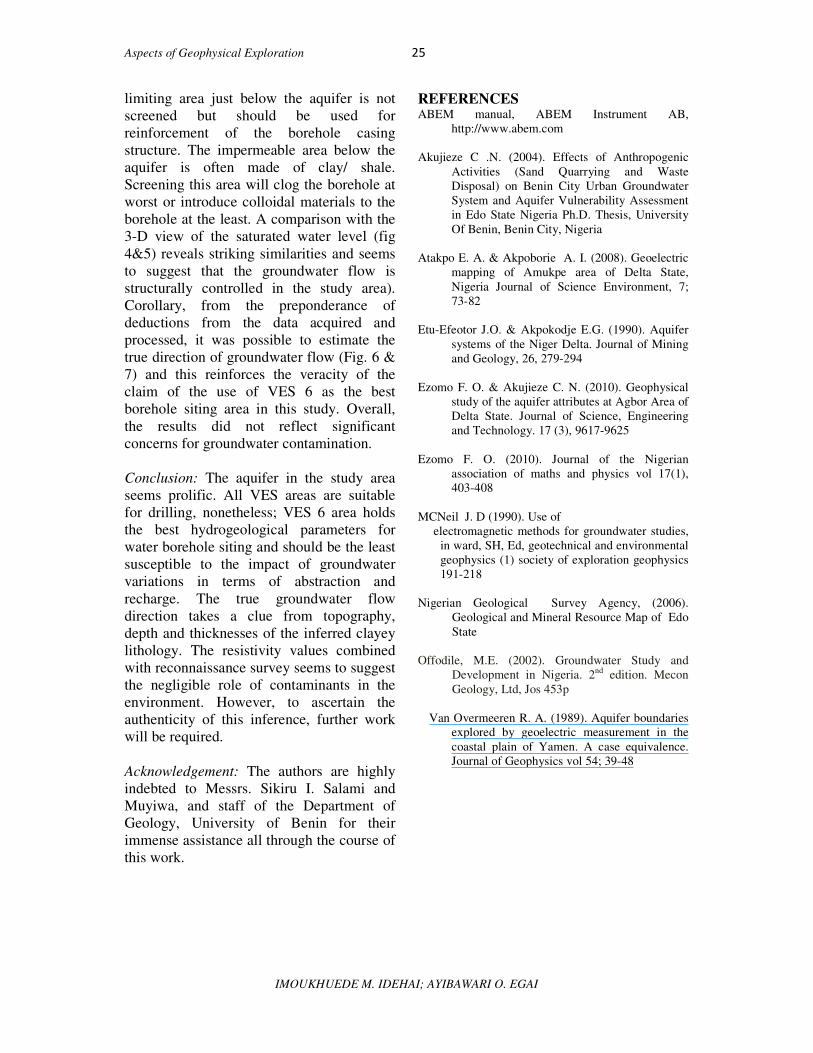
Fig.6: Apparent flow direction of groundwater Fig . 7: True flow direction of groundwater flow. (estimated
using the 3-D software and a 3-point solution)
Aspects of Geophysical Exploration 24
IMOUKHUEDE M. IDEHAI; AYIBAWARI O. EGAI
Despite the series of adjustment and
computation iteration, it became obvious
that the resistance of an additional point had
to be included for the entire survey to be
sufficiently meaningful. Albeit, combining a
mix of physics and geomathematics this was
achieved. Thus: The ratios of the adjacent
resistance at the potential spacing of 10m
were evaluated. (ie, 1.03/0.84 =1.2261,
0.84/0.58 =1.448, 0.58/0.27 =2.1481 ,)
Using extended equivalence, it was found by
approximation to be 0.1. Thus: If 1.2261
=100%, then 1.448 =118%, 2.1481=175.
Hence the difference in per cent: 118-100
=18, 175-118 =57. The difference (57-18)%
=39%. This is equivalent percent for the
next point. That is, 175+39 =214. Therefore,
0.27/*=214. Hence, * =0.1 Ω. This is the
resistance sought. The Geometric factor
(GF) can be calculated using: GF=[
(AB/2)2 –(MN/2)2] /(MN/2) π /2.(Where
the designations take their regular
meanings). Substituting, GF=14,123.29. The
apparent resistivity is given by the product
of the GF and the resistance to be 1,412.32
Ωm.
Computer iteration techniques were
employed by using IXID and 3-D field map
software to exhibit models of the lithologies.
Resistivity of soils and rocks is also a
function of depth or position. Typically,
resistivity of geologic material and of near
surface material is heavily affected by
groundwater which is a low resistivity
material. In general, finer grained sediments
have low resistivity, and bedrock has high
resistivity (table 1-6). Resistivity is reduced
by: increasing porosity, increasing ion
content of groundwater, increasing content
of clay, decreasing grain size, etc. Apparent
resistivity was from about 400 Ωm to about
24,000 Ωm. The anomalous values obtained
in VES 1 are considered to be resultant from
interference. Seemingly, against the norm,
which stipulate that soundings be taken
across suspected underground cables to
attenuate its effects, this particular VES was
inadvertently applied parallel to the
interfering medium. It however produced
very interesting outcomes that may be the
subject of future research work. For
instance, it also revealed that metal/ cables
were buried up to a depth of about 3.3m in a
lateritic horizon below the surface. Again, it
is highly plausible that certain other metals
were buried at a depth of 6.61m near the
Vice- Chancellor’s lodge. The effect of
tunnelling also seems contributory to this
anomaly.
The saturated water level (SWL) values
hover from 26.3-68.8m with a mean of
approximately 50.5m. The depth to the
aquifer is between 31.2-65.5m. The lower
limit of 65.5m correlates more with the
established depth for this area of the Benin
Formation (Fig. 2).The inferred lithologies
are laterites, clay, silty sand, dry sand. The
aquifer inundates the sandy formation. These
were deduced from the sounding curves and
profiling. The observed sounding curves for
the six locations show that of H – type
(Table 1-6) (ρ 1> ρ 2< ρ 3), KA – type (ρ
1<ρ 2> ρ 3< ρ 4), HQ – type (ρ 1> ρ 2< ρ 3>
ρ 4), HA – type (ρ 1> ρ 2< ρ 3< ρ 4) and A –
type (ρ 1< ρ 2< ρ 3), etc.
The entire area is suitable for borehole siting
for water abstraction. Nonetheless, it may
add value to double-check geophysical
results here with well-logging analysis of
actual boreholes. Depth to water table ranges
from 31.2 – 65.5m. These depth values are
expected to be higher in the dry seasons and
in periods of significant abstraction. VES 3
area is the shallowest and may be the
cheapest to drill and install a borehole.
However, for the purposes of long-term and
large-scale abstraction, and assuming this
borehole is to be operated simultaneously
with other boreholes, the best area to site a
borehole will be the VES 6 area. But, it is
the deepest at 65.5m -with attendant cost
imperatives. The average minimum
thicknesses of the aquifer are from 45-63m.
The thickness at VES 6 is about 63m.
To optimise the use of the entire aquifer, it is
good practice to drill just below the aquifer.
While the entire aquifer area is screened, the
Aspects of Geophysical Exploration 25
IMOUKHUEDE M. IDEHAI; AYIBAWARI O. EGAI
limiting area just below the aquifer is not
screened but should be used for
reinforcement of the borehole casing
structure. The impermeable area below the
aquifer is often made of clay/ shale.
Screening this area will clog the borehole at
worst or introduce colloidal materials to the
borehole at the least. A comparison with the
3-D view of the saturated water level (fig
4&5) reveals striking similarities and seems
to suggest that the groundwater flow is
structurally controlled in the study area).
Corollary, from the preponderance of
deductions from the data acquired and
processed, it was possible to estimate the
true direction of groundwater flow (Fig. 6 &
7) and this reinforces the veracity of the
claim of the use of VES 6 as the best
borehole siting area in this study. Overall,
the results did not reflect significant
concerns for groundwater contamination.
Conclusion: The aquifer in the study area
seems prolific. All VES areas are suitable
for drilling, nonetheless; VES 6 area holds
the best hydrogeological parameters for
water borehole siting and should be the least
susceptible to the impact of groundwater
variations in terms of abstraction and
recharge. The true groundwater flow
direction takes a clue from topography,
depth and thicknesses of the inferred clayey
lithology. The resistivity values combined
with reconnaissance survey seems to suggest
the negligible role of contaminants in the
environment. However, to ascertain the
authenticity of this inference, further work
will be required.
Acknowledgement: The authors are highly
indebted to Messrs. Sikiru I. Salami and
Muyiwa, and staff of the Department of
Geology, University of Benin for their
immense assistance all through the course of
this work.
REFERENCES ABEM manual, ABEM Instrument AB,
http://www.abem.com
Akujieze C .N. (2004). Effects of Anthropogenic
Activities (Sand Quarrying and Waste
Disposal) on Benin City Urban Groundwater
System and Aquifer Vulnerability Assessment
in Edo State Nigeria Ph.D. Thesis, University
Of Benin, Benin City, Nigeria
Atakpo E. A. & Akpoborie A. I. (2008). Geoelectric
mapping of Amukpe area of Delta State,
Nigeria Journal of Science Environment, 7;
73-82
Etu-Efeotor J.O. & Akpokodje E.G. (1990). Aquifer
systems of the Niger Delta. Journal of Mining
and Geology, 26, 279-294
Ezomo F. O. & Akujieze C. N. (2010). Geophysical
study of the aquifer attributes at Agbor Area of
Delta State. Journal of Science, Engineering
and Technology. 17 (3), 9617-9625
Ezomo F. O. (2010). Journal of the Nigerian
association of maths and physics vol 17(1),
403-408
MCNeil J. D (1990). Use of
electromagnetic methods for groundwater studies,
in ward, SH, Ed, geotechnical and environmental
geophysics (1) society of exploration geophysics
191-218
Nigerian Geological Survey Agency, (2006).
Geological and Mineral Resource Map of Edo
State
Offodile, M.E. (2002). Groundwater Study and
Development in Nigeria. 2nd edition. Mecon
Geology, Ltd, Jos 453p
Van Overmeeren R. A. (1989). Aquifer boundaries
explored by geoelectric measurement in the
coastal plain of Yamen. A case equivalence.
Journal of Geophysics vol 54; 39-48