fifth edition of the global biodiversity outlook: … document is being circulated in the form and...
TRANSCRIPT
CBD
Distr.
GENERAL
CBD/SBSTTA/21/INF/17
1 December 2017
ENGLISH ONLY
SUBSIDIARY BODY ON SCIENTIFIC,
TECHNICAL AND TECHNOLOGICAL ADVICE
Twenty-first meeting
Montreal, Canada, 11-14 December 2017
Item 7 of the provisional agenda*
REMOTE SENSING ENABLED ESSENTIAL BIODIVERSITY VARIABLES
Note by the Executive Secretary
1. The Executive Secretary is circulating herewith, for the information of participants in the twenty-
first meeting of the Subsidiary Body on Scientific, Technical and Technological Advice, a note on
Essential Biodiversity Variable with a strong potential for measurement using satellite remote sensing
observations. The note has been prepared by the Group on Earth Observations Biodiversity Observation
Network.
2. The present note is relevant to the deliberations of the Subsidiary Body on Scientific, Technical
and Technological Advice, in particular in the context of the facilitation of biodiversity monitoring and
underpinning indicators relevant to the Strategic Plan for Biodiversity 2011-2020 and future editions the
Global Biodiversity Outlook.
3. The document is being circulated in the form and language in which it was received by the
Secretariat.
* CBD/SBSTTA/21/1.
CBD/SBSTTA/21/INF/17
Page 2
REMOTE SENSING ENABLED ESSENTIAL BIODIVERSITY VARIABLES
EXECUTIVE SUMMARY
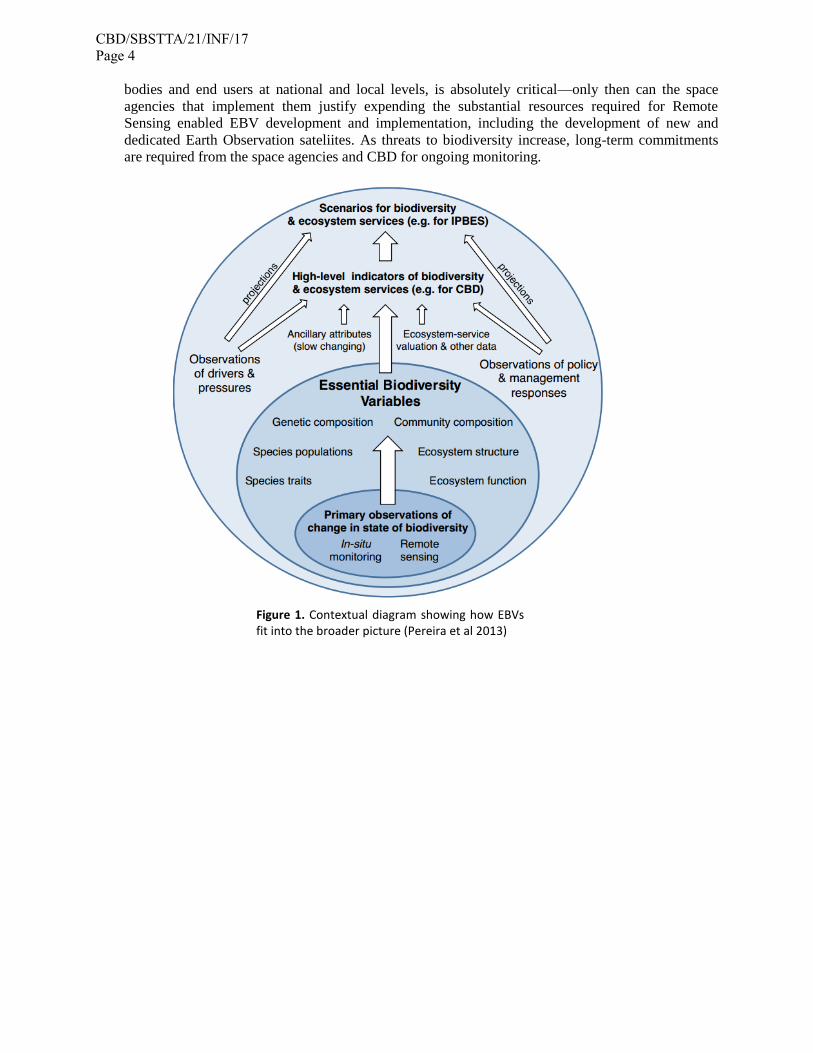
Essential Biodiversity Variable (EBVs) are defined as the key variables required to observe, understand,
report on change in the state of biodiversity as well as to inform policy. They sit as a layer between raw
biodiversity observations and the biodiversity indicators used for reporting (Figure 1 in main text), such
as the indicators measuring progress towards the CBD Aichi Targets. A subset of EBVs have strong
potential for measurement using satellite remote sensing observations. Because of this potential these
EBVs, referred to here as Remote Sensing enabled EBVs, have some special characteristics (being
spatially contiguous, regular temporal updating, consistent definitions) that make them easier to
implement than EBVs that can be measured only through in situ observation. This makes Remote Sensing
enabled EBVs especially valuable for monitoring change in biodiversity, as described below for the
candidate Remote Sensing enabled EBVs.
The Group on Earth Observation Biodiversity Observations Network (GEO BON) established in the
summer of 2017 a Task Force dedicated to Remote Sensing enabled Essential Biodiversity Variables.
This note is a product of the Remote Sensing Task Force of GEO BON and has the following purposes:
1) To explain the basic concepts behind the Essential Biodiversity Variables (EBVs) and their utility
for assisting Parties to the CBD in national monitoring and reporting
2) To describe the current thinking and concensus about a subset of EBVs, called Remote Sensing
enabled EBVs, for which satellite remote sensing can play a key role, and suggest pathways to
getting these implemented by space agencies and other interested organisations.
3) To create an opportunity for feedback from the biodiversity community, including Parties to the
Convention on Biological Diversity, on this list of Remote Sensing enabled EBVs
4) To communicate the user needs for Remote Sensing Enabled EBVs to the major space and other
implementing agencies funding biodiversity monitoring through satellite remote sensing, in
particular via the CEOS (Committee on Earth Observation Satellites) http://www.ceos.org/.
Demonstrating the value of these Remote Sensing enabled EBVs, especially to policy bodies and end
users at national and local levels, is absolutely critical—only then can CEOS, and its constituent space
agencies such as NASA and ESA, justify expending resources required for RS-EBV development
and implementation. As threats to biodiversity increase, long-term commitments can be secured from
the space and other implementing agencies for ongoing monitoring of biodiversity. The CBD SBSTTA is
kindly requested to endorse the concept of Remote Sensing enabled EBVs, as well as the further
development by GEOBON of a priority short list of remote sensing enabled EBVS, to ensure a continuing
and future funding stream from the space and other implementing agencies.
CBD/SBSTTA/21/INF/17
Page 3
I. REMOTE SENSING ENABLED ESSENTIAL BIODIVERSITY
VARIABLES
1. Essential Biodiversity Variable (EBVs) are defined as the key variables required to observe,
understand, and report on change in the state of biodiversity, and inform policy decisions. They sit as
a layer between raw biodiversity observations and the biodiversity indicators used for reporting
(Figure 1), such as the indicators measuring progress towards the CBD Aichi Targets. They provide
key guidance to the observation system in terms of what it should measure, and their intermediate
position between observations and indicators isolates those indicators from changes in observation
technology. In addition, EBVs can support the development of new indicators as new needs for
reporting and target monitoring are further developed.
2. The purpose of this information note is fourfold:
To explain the basic concepts behind the Essential Biodiversity Variables (EBVs) and their
utility for assisting Parties to the CBD in national monitoring and reporting
To describe the current thinking and concensus about a subset of EBVs, called Remote Sensing
enabled EBVs, for which satellite remote sensing can play a key role, and suggest pathways to
getting these implemented by space agencies and other interested organisations.
To create an opportunity for feedback from the biodiversity community, including Parties to the
Convention on Biological Diversity, on this list of Remote Sensing enabled EBVs
To communicate the user needs for Remote Sensing Enabled EBVs to the major space and other
implementing agencies funding biodiversity monitoring through satellite remote sensing, in
particular via the CEOS (Committee on Earth Observation Satellites) http://www.ceos.org/.
The CBD SBSTTA is critical to endorsing the concept of Remote Sensing enabled EBVs and
further development by GEOBON of a priority short list of remote sensing enabled EBVS to
ensure a continuing and future funding stream from the space and other implementing agencies.
3. Satellite remote sensing (RS) can play a crucial role in the operational production of EBVs,
particularly for a subset of EBVs which we denote by Remote Sensing enabled EBVs. Largely, this
is because the global and periodic nature of satellite remote sensing greatly simplifies the acquisition
of the needed observations, making RS an ideal method for understanding change in biodiversity
from the local scale (e.g. protected areas) to the national and global scale. In fact, remote sensing is
the only method suitable for periodic national and global monitoring and reporting on the state of
biodiversity as it yields information that is spatially contiguous over the entire earth (all communities
and ecosystems) as well as regular time updates allows comparison with baseline conditions of
biodiversity.
4. The advantage of the Parties to the Convention on Biodiversity supporting Remote Sensing enabled
EBVs is that their monitoring and reporting requirements can be standardized, that the availability of
global products could lower the cost of the Parties monitoring and reporting requirements, and that
the Remote Sensing enabled EBVS higher would be spatially contiguous and available continuously
allowing regular reporting.
5. This list of Remote Sensing enabled EBVs has been produced during 3 expert workshops attended
by over 100 different experts in biodiversity and remote sensing, held under the auspices of GEO
BON. This list will be updated based on comments received from SBSTTA to ensure there is good
alignment with CBD needs. With the CBD feedback, as well as through ongoing consideration by
experts in remote sensing and biodiversity under the leadership of the GEOBON Secretariat
supported by the GEOBON Task Force on Remote Sensing, a short list of priority EBVs that can be
retrieved from remote sensing will be finalized for consideration by CEOS and the space agencies
for funding. Demonstrating the value of these Remote Sensing enabled EBVs, especially to policy
CBD/SBSTTA/21/INF/17
Page 4
bodies and end users at national and local levels, is absolutely critical—only then can the space
agencies that implement them justify expending the substantial resources required for Remote
Sensing enabled EBV development and implementation, including the development of new and
dedicated Earth Observation sateliites. As threats to biodiversity increase, long-term commitments
are required from the space agencies and CBD for ongoing monitoring.
Figure 1. Contextual diagram showing how EBVs fit into the broader picture (Pereira et al 2013)
CBD/SBSTTA/21/INF/17
Page 5
II. BACKGROUND
6. Following the general consensus developed at workshops and conference discussions, EBVs tend to
fall into six classes (Pereira et al. 2013; Table 1), and the EBV concept is rapidly maturing: GEO
BON released a development strategy document in October 2015 and there are an increasing number
of scientific and policy articles published on them, some of which have focused on assessing the
opportunities and approach for national applications.
7. The EBV concept was inspired by the Essential Climate Variables (ECVs) developed during the last
decade by the Global Climate Observing System (GCOS), which has been extraordinarily successful
in defining research agendas as well as data requirements for climate observations from space. A
particular accomplishment of GCOS has been the identification of approximately 50 Essential
Climate Variables (ECVs), defined as the set of observations needed to generate global climate
products that support climate policy, particularly the United Nations Framework Convention on
Climate Change. Because most of these ECVs can be derived from satellite-based remote sensing
(RS) instruments, GCOS worked with CEOS (the Committee on Earth Observation Satellites, a
coordinating body composed of governmental space agencies) to document these in detail. The
consensus led to the major space agencies of Europe and the USA preferentially funding the
development of bespoke variables from remote sensing for climate monitoring. The expenditure runs
into the hundreds of millions of dollars – an effort which can be replicated for biodiversity with the
endorsement of the CBD. For example, a resulting GCOS document was a key input into the
European Space Agency’s Climate Change Initiative, a EUR150M activity supporting the
observations and products needed to generate the RS-based ECVs (http://cci.esa.int/). ESA’s Climate
Change Initiative was a huge step forward for monitoring climate as now implemented by the
Climate change Service of the European Copernicus Program
(http://www.copernicus.eu/main/climate-change), and is a good model for the biodiversity
community to follow as they develop EBVs.
8. Like ECVs, a subset of EBVs have strong potential for measurement using satellite remote sensing
observations. Because of this potential these EBVs, referred to here as Remote Sensing enabled
EBVs, have some special characteristics (being spatially contiguous, regular temporal updating,
consistent definitions) that make them easier to implement than EBVs that can be measured only
through in situ observation. The Remote Sensing enabled EBVs measurements can be direct or
indirect, the latter meaning that they need to be combined with additional abiotic data and in situ data
as well as often specialized biodiversity modelling tools. This makes Remote Sensing enabled EBVs
especially valuable for monitoring change in biodiversity, as described below for the candidate
Remote Sensing enabled EBVs. In particular, they are characterised by global, periodic observations
(e.g. daily, bi-monthly, annual) that are spatially contiguous; also, the number of data providers is
fewer (primarily national space agencies), which makes coordination easier, and many of the
observations already exist or are in an advanced stage of planning. Additionally, Remote Sensing
enabled EBVs can often help fill the unavoidable spatial and temporal gaps left by in situ
observations. Finally, the remote sensing used to retrieve the biodiversity variables is free and open –
many in situ observations continue to be unavailable, or only available under restricted conditions.
9. Given the success of the Essential Climate Variable concept, its impact on the availability of ECVs
derived from satellite measurements, the ongoing development of EBVs, and the characteristics of
Remote Sensing enabled EBVs, an Remote Sensing enabled EBVs development approach has been
suggested that is analogous to that used for ECVs (Skidmore et al. 2015). That approach is
explained in more detail here.
CBD/SBSTTA/21/INF/17
Page 6
III. CANDIDATE REMOTE SENSING ENABLED EBVS
10. The Group on Earth Observation Biodiversity Observations Network (GEO BON) established in the
summer of 2017 a task force dedicated to Remote Sensing enabled Essential Biodiversity Variables,
whose main objectives are:
Define, and update, a priority list of EBVs that can be generated from remote sensing
Coordinate EBVs from remote sensing between users and space agencies using GEOBON as a
hub
Coordinate and manage EBV data initiatives between Working Groups and national and
regional biodiversity observation networks (BONs)
Generate EBV products from satellite remote sensing.
Ensuring EBVs derived from remote sensing find their way into the GEO (BON) Data Portal
Link EBV data and analyses from WGs and BONs activity to the broader community.
Standardize work-flows for generating EBVs from EO (in coordination with CEOS)
Define how private-public partnerships may be integrated into global earth observation
networks for biodiversity
This note is a product of the Remote Sensing Task Force of GEO BON.
11. Using the EBV framework as a baseline (Pereira et al. 2013) three GEO BON workshops were held
to discuss current and future satellite missions and their ability to provide observations useful for
generating EBVs, attended by more than 100 scientists, policy makers, industry and government
representatives as well as from the key space agencies. The goal was to create a list of candidate
Remote Sensing enabled EBVs by carefully considering, amongst others, factors such as ability to
meet policy needs, priority, feasibility, implementation status, spatial resolution and temporal
frequency. That list, subsequently updated as additional information becomes available, is in Table 1.
Note that inclusion in the list does not imply that RS measurements alone can be used to generate
every EBV; for example, in situ data are needed to validate and calibrate RS products and in the case
of species distribution and species abundance, remote sensing is useful for a limited number of
species.
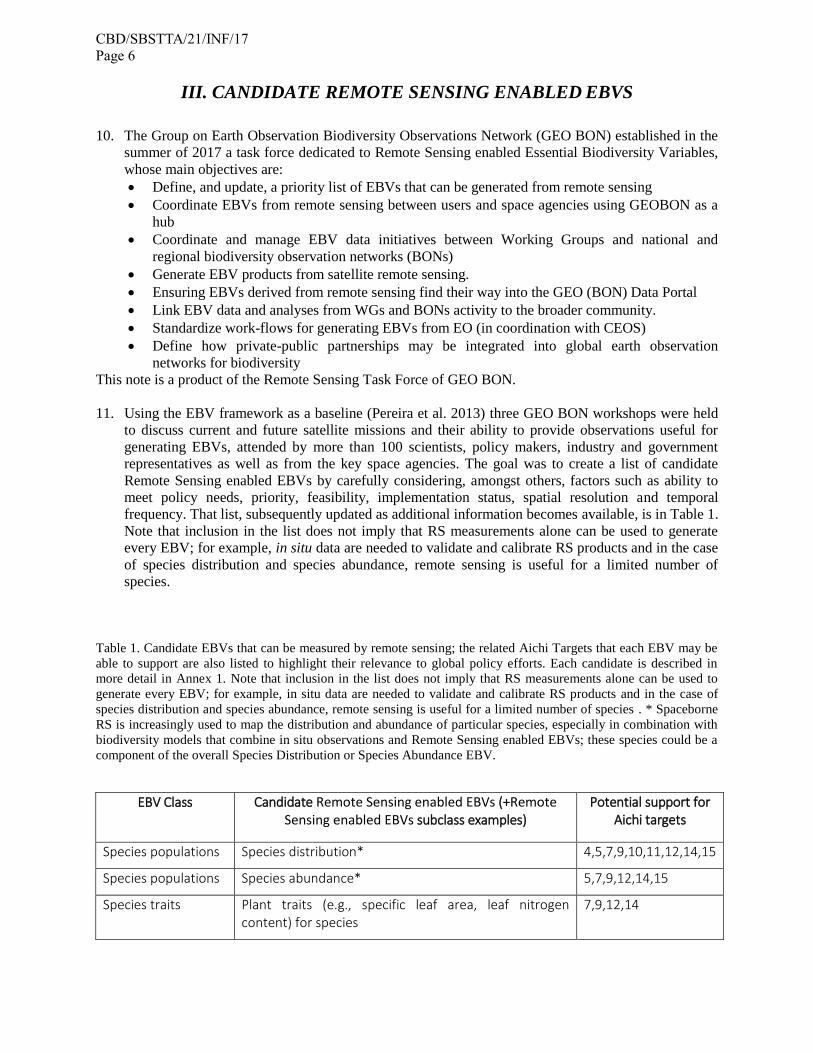
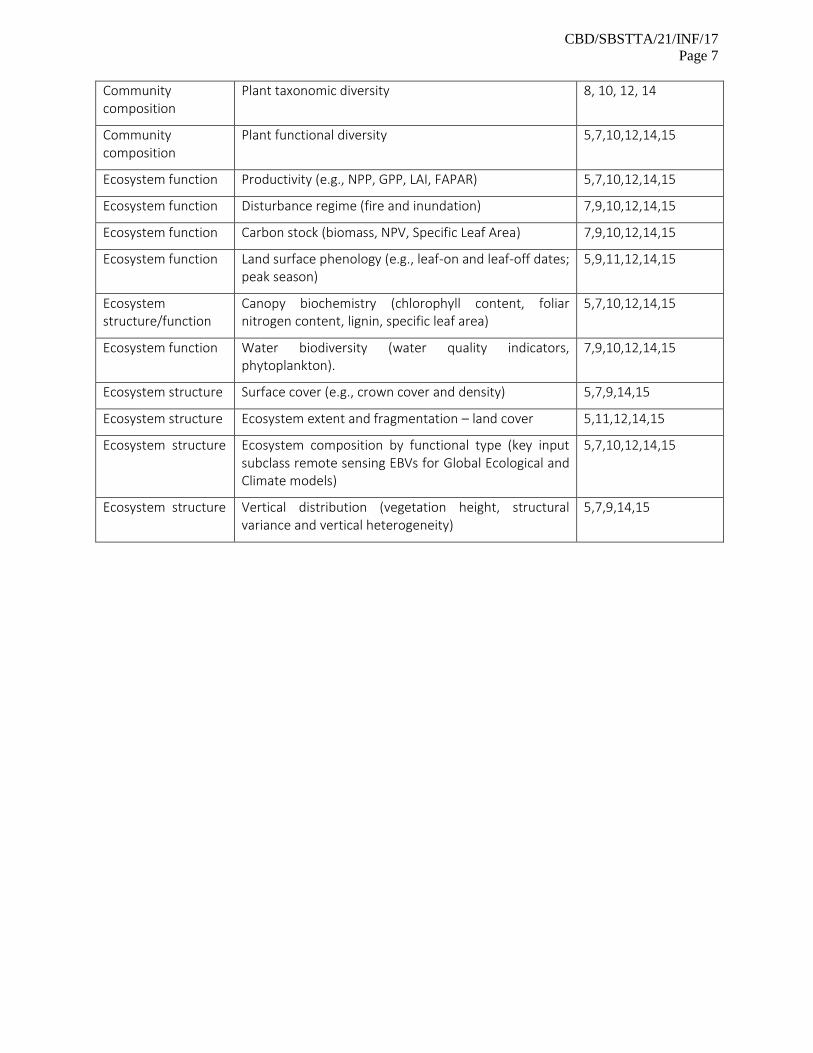
Table 1. Candidate EBVs that can be measured by remote sensing; the related Aichi Targets that each EBV may be
able to support are also listed to highlight their relevance to global policy efforts. Each candidate is described in
more detail in Annex 1. Note that inclusion in the list does not imply that RS measurements alone can be used to
generate every EBV; for example, in situ data are needed to validate and calibrate RS products and in the case of
species distribution and species abundance, remote sensing is useful for a limited number of species . * Spaceborne
RS is increasingly used to map the distribution and abundance of particular species, especially in combination with
biodiversity models that combine in situ observations and Remote Sensing enabled EBVs; these species could be a
component of the overall Species Distribution or Species Abundance EBV.
EBV Class Candidate Remote Sensing enabled EBVs (+Remote Sensing enabled EBVs subclass examples)
Potential support for Aichi targets
Species populations Species distribution* 4,5,7,9,10,11,12,14,15
Species populations Species abundance* 5,7,9,12,14,15
Species traits Plant traits (e.g., specific leaf area, leaf nitrogen content) for species
7,9,12,14
CBD/SBSTTA/21/INF/17
Page 7
Community composition
Plant taxonomic diversity 8, 10, 12, 14
Community composition
Plant functional diversity 5,7,10,12,14,15
Ecosystem function Productivity (e.g., NPP, GPP, LAI, FAPAR) 5,7,10,12,14,15
Ecosystem function Disturbance regime (fire and inundation) 7,9,10,12,14,15
Ecosystem function Carbon stock (biomass, NPV, Specific Leaf Area) 7,9,10,12,14,15
Ecosystem function Land surface phenology (e.g., leaf-on and leaf-off dates; peak season)
5,9,11,12,14,15
Ecosystem structure/function
Canopy biochemistry (chlorophyll content, foliar nitrogen content, lignin, specific leaf area)
5,7,10,12,14,15
Ecosystem function Water biodiversity (water quality indicators, phytoplankton).
7,9,10,12,14,15
Ecosystem structure Surface cover (e.g., crown cover and density) 5,7,9,14,15
Ecosystem structure Ecosystem extent and fragmentation – land cover 5,11,12,14,15
Ecosystem structure Ecosystem composition by functional type (key input subclass remote sensing EBVs for Global Ecological and Climate models)
5,7,10,12,14,15
Ecosystem structure Vertical distribution (vegetation height, structural variance and vertical heterogeneity)
5,7,9,14,15
CBD/SBSTTA/21/INF/17
Page 8
IV. TAKING REMOTE SENSING ENABLES EBVS FROM CONCEPT TO
IMPLEMENTATION
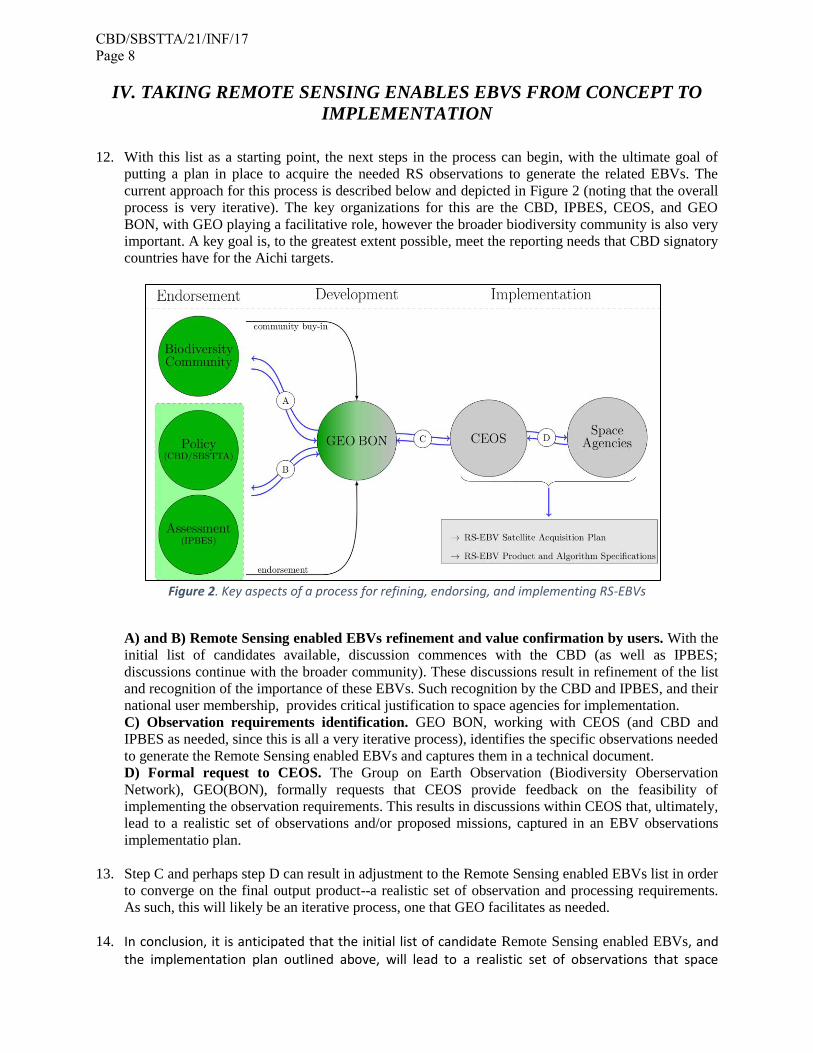
12. With this list as a starting point, the next steps in the process can begin, with the ultimate goal of
putting a plan in place to acquire the needed RS observations to generate the related EBVs. The
current approach for this process is described below and depicted in Figure 2 (noting that the overall
process is very iterative). The key organizations for this are the CBD, IPBES, CEOS, and GEO
BON, with GEO playing a facilitative role, however the broader biodiversity community is also very
important. A key goal is, to the greatest extent possible, meet the reporting needs that CBD signatory
countries have for the Aichi targets.
Figure 2. Key aspects of a process for refining, endorsing, and implementing RS-EBVs
A) and B) Remote Sensing enabled EBVs refinement and value confirmation by users. With the
initial list of candidates available, discussion commences with the CBD (as well as IPBES;
discussions continue with the broader community). These discussions result in refinement of the list
and recognition of the importance of these EBVs. Such recognition by the CBD and IPBES, and their
national user membership, provides critical justification to space agencies for implementation.
C) Observation requirements identification. GEO BON, working with CEOS (and CBD and
IPBES as needed, since this is all a very iterative process), identifies the specific observations needed
to generate the Remote Sensing enabled EBVs and captures them in a technical document.
D) Formal request to CEOS. The Group on Earth Observation (Biodiversity Oberservation
Network), GEO(BON), formally requests that CEOS provide feedback on the feasibility of
implementing the observation requirements. This results in discussions within CEOS that, ultimately,
lead to a realistic set of observations and/or proposed missions, captured in an EBV observations
implementatio plan.
13. Step C and perhaps step D can result in adjustment to the Remote Sensing enabled EBVs list in order
to converge on the final output product--a realistic set of observation and processing requirements.
As such, this will likely be an iterative process, one that GEO facilitates as needed.
14. In conclusion, it is anticipated that the initial list of candidate Remote Sensing enabled EBVs, and the implementation plan outlined above, will lead to a realistic set of observations that space
CBD/SBSTTA/21/INF/17
Page 9
agencies can provide and, ultimately, useful EBV products that can support biodiversity indicators of the national members of CBD, IPBES, as well as the biodiversity and conservation communities.
REFERENCES
Pereira, H.M., Ferrier, S., Walters, M., Geller, G.N., Jongman, R.H.G., Scholes R.J. et al. (2013).
Essential biodiversity variables. Science 339: 277–278.
Pettorelli, N, Schulte to Buhne, H. et al. (2017). Satellite remote sensing of ecosystem fucntions:
opportunities, challenges and way forward. Remote Sensing in Ecology and Conservation
DOI: 10.1002/rse2.59
Skidmore, A.K., Pettorelli, N., et al. (2015) Agree on biodiversity metrics to track from space. Nature,
523: 403-405.
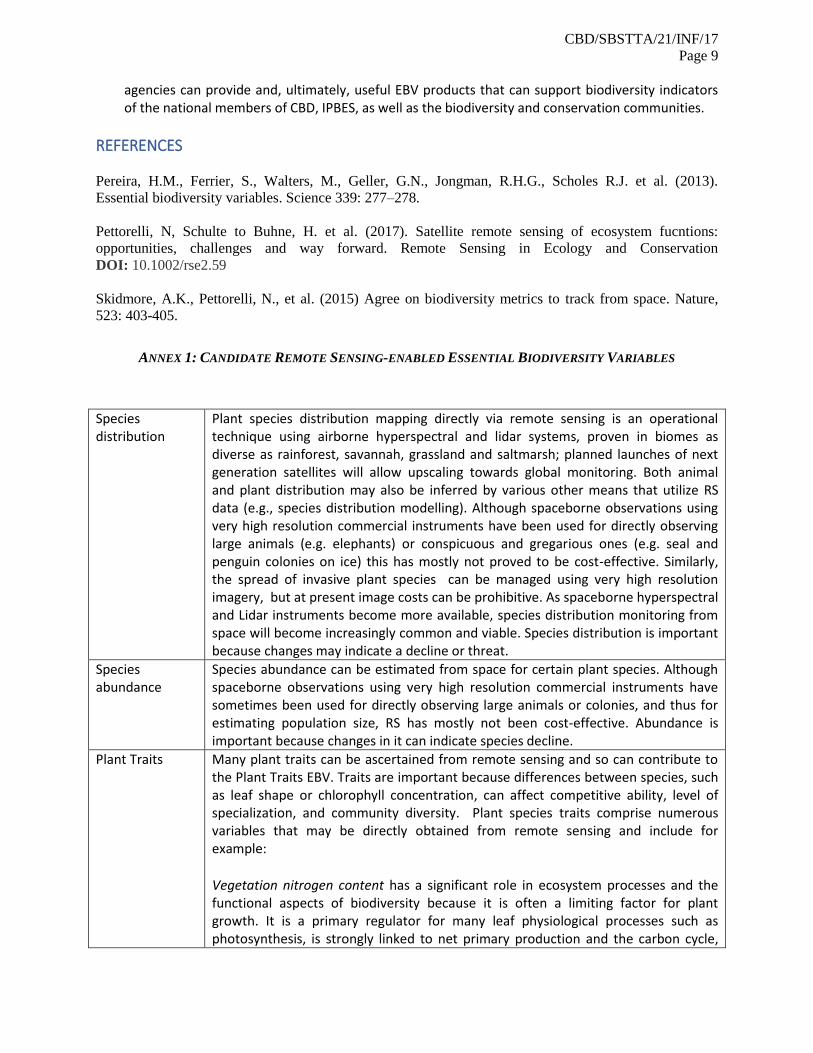
ANNEX 1: CANDIDATE REMOTE SENSING-ENABLED ESSENTIAL BIODIVERSITY VARIABLES
Species distribution
Plant species distribution mapping directly via remote sensing is an operational technique using airborne hyperspectral and lidar systems, proven in biomes as diverse as rainforest, savannah, grassland and saltmarsh; planned launches of next generation satellites will allow upscaling towards global monitoring. Both animal and plant distribution may also be inferred by various other means that utilize RS data (e.g., species distribution modelling). Although spaceborne observations using very high resolution commercial instruments have been used for directly observing large animals (e.g. elephants) or conspicuous and gregarious ones (e.g. seal and penguin colonies on ice) this has mostly not proved to be cost-effective. Similarly, the spread of invasive plant species can be managed using very high resolution imagery, but at present image costs can be prohibitive. As spaceborne hyperspectral and Lidar instruments become more available, species distribution monitoring from space will become increasingly common and viable. Species distribution is important because changes may indicate a decline or threat.
Species abundance
Species abundance can be estimated from space for certain plant species. Although spaceborne observations using very high resolution commercial instruments have sometimes been used for directly observing large animals or colonies, and thus for estimating population size, RS has mostly not been cost-effective. Abundance is important because changes in it can indicate species decline.
Plant Traits Many plant traits can be ascertained from remote sensing and so can contribute to the Plant Traits EBV. Traits are important because differences between species, such as leaf shape or chlorophyll concentration, can affect competitive ability, level of specialization, and community diversity. Plant species traits comprise numerous variables that may be directly obtained from remote sensing and include for example:
Vegetation nitrogen content has a significant role in ecosystem processes and the functional aspects of biodiversity because it is often a limiting factor for plant growth. It is a primary regulator for many leaf physiological processes such as photosynthesis, is strongly linked to net primary production and the carbon cycle,
CBD/SBSTTA/21/INF/17
Page 10
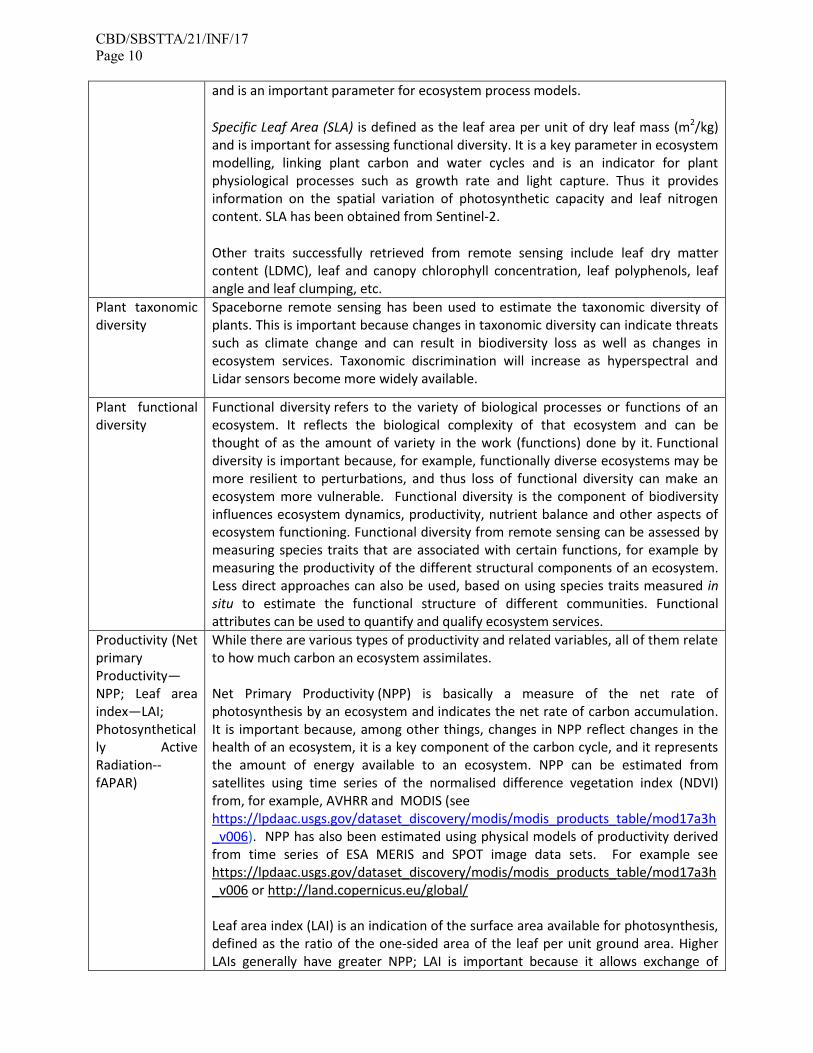
and is an important parameter for ecosystem process models.
Specific Leaf Area (SLA) is defined as the leaf area per unit of dry leaf mass (m2/kg) and is important for assessing functional diversity. It is a key parameter in ecosystem modelling, linking plant carbon and water cycles and is an indicator for plant physiological processes such as growth rate and light capture. Thus it provides information on the spatial variation of photosynthetic capacity and leaf nitrogen content. SLA has been obtained from Sentinel-2.
Other traits successfully retrieved from remote sensing include leaf dry matter content (LDMC), leaf and canopy chlorophyll concentration, leaf polyphenols, leaf angle and leaf clumping, etc.
Plant taxonomic diversity
Spaceborne remote sensing has been used to estimate the taxonomic diversity of plants. This is important because changes in taxonomic diversity can indicate threats such as climate change and can result in biodiversity loss as well as changes in ecosystem services. Taxonomic discrimination will increase as hyperspectral and Lidar sensors become more widely available.
Plant functional diversity
Functional diversity refers to the variety of biological processes or functions of an ecosystem. It reflects the biological complexity of that ecosystem and can be thought of as the amount of variety in the work (functions) done by it. Functional diversity is important because, for example, functionally diverse ecosystems may be more resilient to perturbations, and thus loss of functional diversity can make an ecosystem more vulnerable. Functional diversity is the component of biodiversity influences ecosystem dynamics, productivity, nutrient balance and other aspects of ecosystem functioning. Functional diversity from remote sensing can be assessed by measuring species traits that are associated with certain functions, for example by measuring the productivity of the different structural components of an ecosystem. Less direct approaches can also be used, based on using species traits measured in situ to estimate the functional structure of different communities. Functional attributes can be used to quantify and qualify ecosystem services.
Productivity (Net primary Productivity—NPP; Leaf area index—LAI; Photosynthetically Active Radiation-- fAPAR)
While there are various types of productivity and related variables, all of them relate to how much carbon an ecosystem assimilates. Net Primary Productivity (NPP) is basically a measure of the net rate of photosynthesis by an ecosystem and indicates the net rate of carbon accumulation. It is important because, among other things, changes in NPP reflect changes in the health of an ecosystem, it is a key component of the carbon cycle, and it represents the amount of energy available to an ecosystem. NPP can be estimated from satellites using time series of the normalised difference vegetation index (NDVI) from, for example, AVHRR and MODIS (see https://lpdaac.usgs.gov/dataset_discovery/modis/modis_products_table/mod17a3h_v006). NPP has also been estimated using physical models of productivity derived from time series of ESA MERIS and SPOT image data sets. For example see https://lpdaac.usgs.gov/dataset_discovery/modis/modis_products_table/mod17a3h_v006 or http://land.copernicus.eu/global/ Leaf area index (LAI) is an indication of the surface area available for photosynthesis, defined as the ratio of the one-sided area of the leaf per unit ground area. Higher LAIs generally have greater NPP; LAI is important because it allows exchange of
CBD/SBSTTA/21/INF/17
Page 11
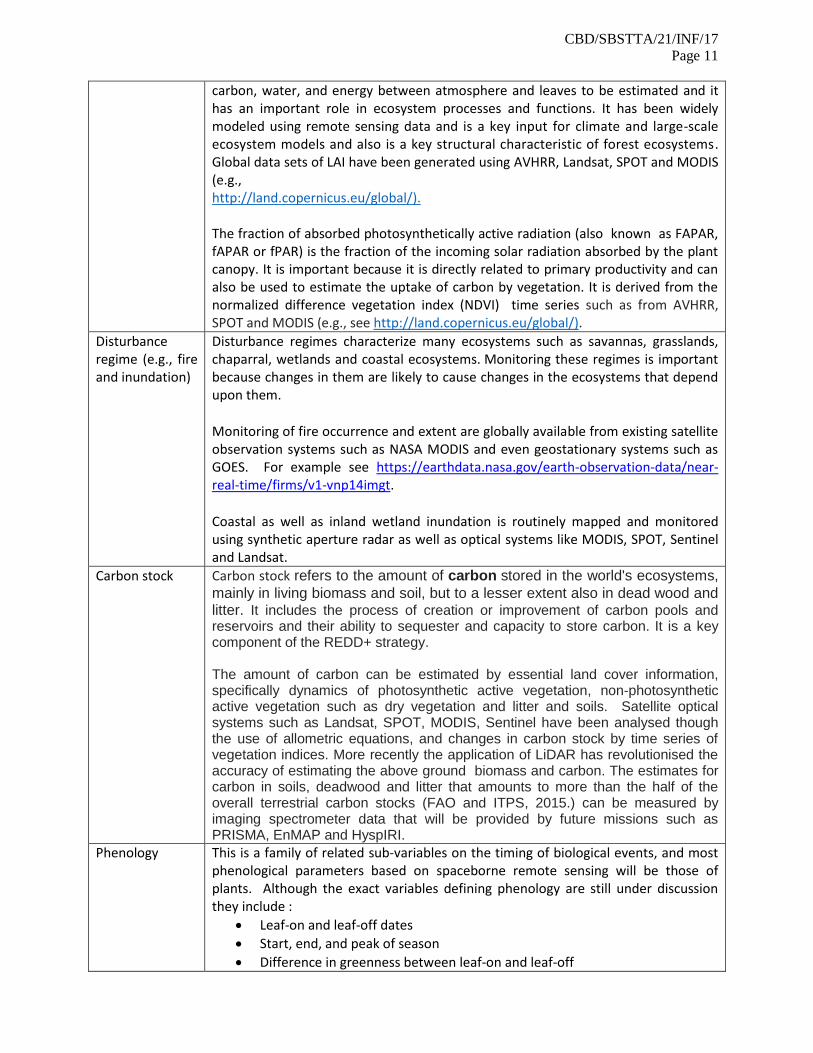
carbon, water, and energy between atmosphere and leaves to be estimated and it has an important role in ecosystem processes and functions. It has been widely modeled using remote sensing data and is a key input for climate and large-scale ecosystem models and also is a key structural characteristic of forest ecosystems. Global data sets of LAI have been generated using AVHRR, Landsat, SPOT and MODIS (e.g., http://land.copernicus.eu/global/). The fraction of absorbed photosynthetically active radiation (also known as FAPAR, fAPAR or fPAR) is the fraction of the incoming solar radiation absorbed by the plant canopy. It is important because it is directly related to primary productivity and can also be used to estimate the uptake of carbon by vegetation. It is derived from the normalized difference vegetation index (NDVI) time series such as from AVHRR, SPOT and MODIS (e.g., see http://land.copernicus.eu/global/).
Disturbance regime (e.g., fire and inundation)
Disturbance regimes characterize many ecosystems such as savannas, grasslands, chaparral, wetlands and coastal ecosystems. Monitoring these regimes is important because changes in them are likely to cause changes in the ecosystems that depend upon them.
Monitoring of fire occurrence and extent are globally available from existing satellite observation systems such as NASA MODIS and even geostationary systems such as GOES. For example see https://earthdata.nasa.gov/earth-observation-data/near-real-time/firms/v1-vnp14imgt.
Coastal as well as inland wetland inundation is routinely mapped and monitored using synthetic aperture radar as well as optical systems like MODIS, SPOT, Sentinel and Landsat.
Carbon stock Carbon stock refers to the amount of carbon stored in the world's ecosystems,
mainly in living biomass and soil, but to a lesser extent also in dead wood and litter. It includes the process of creation or improvement of carbon pools and reservoirs and their ability to sequester and capacity to store carbon. It is a key component of the REDD+ strategy. The amount of carbon can be estimated by essential land cover information, specifically dynamics of photosynthetic active vegetation, non-photosynthetic active vegetation such as dry vegetation and litter and soils. Satellite optical systems such as Landsat, SPOT, MODIS, Sentinel have been analysed though the use of allometric equations, and changes in carbon stock by time series of vegetation indices. More recently the application of LiDAR has revolutionised the accuracy of estimating the above ground biomass and carbon. The estimates for carbon in soils, deadwood and litter that amounts to more than the half of the overall terrestrial carbon stocks (FAO and ITPS, 2015.) can be measured by imaging spectrometer data that will be provided by future missions such as PRISMA, EnMAP and HyspIRI.
Phenology This is a family of related sub-variables on the timing of biological events, and most phenological parameters based on spaceborne remote sensing will be those of plants. Although the exact variables defining phenology are still under discussion they include :
Leaf-on and leaf-off dates
Start, end, and peak of season
Difference in greenness between leaf-on and leaf-off
CBD/SBSTTA/21/INF/17
Page 12
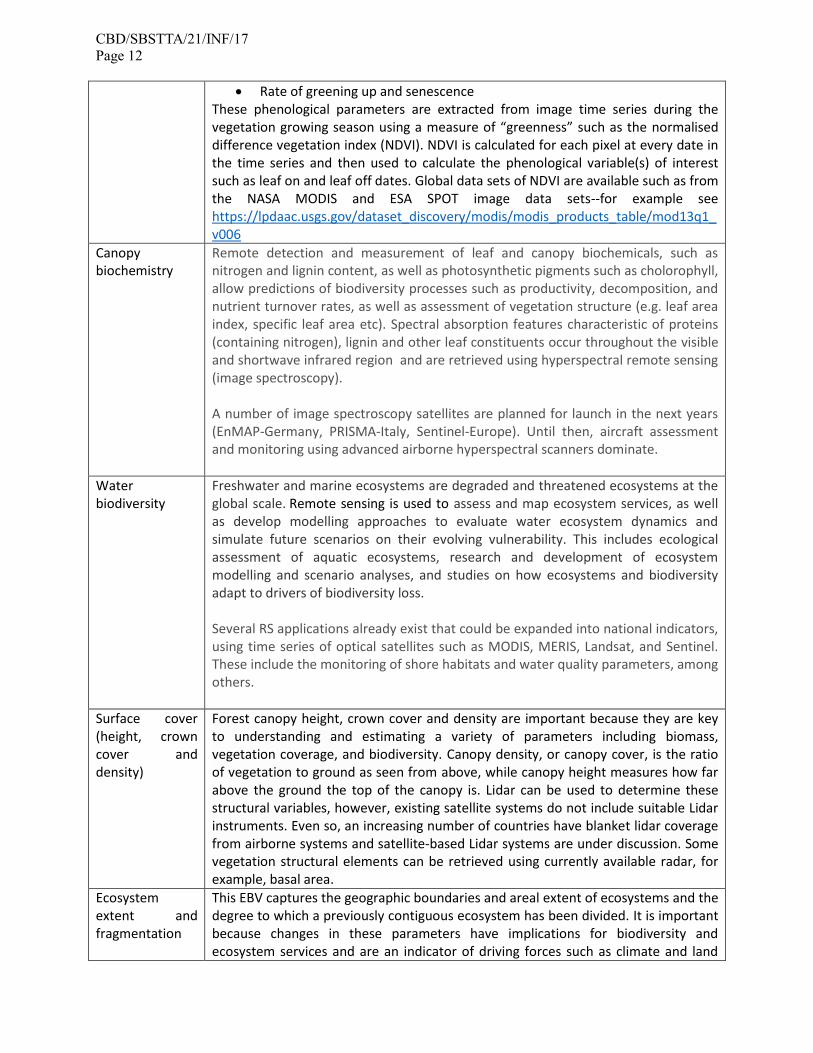
Rate of greening up and senescence These phenological parameters are extracted from image time series during the vegetation growing season using a measure of “greenness” such as the normalised difference vegetation index (NDVI). NDVI is calculated for each pixel at every date in the time series and then used to calculate the phenological variable(s) of interest such as leaf on and leaf off dates. Global data sets of NDVI are available such as from the NASA MODIS and ESA SPOT image data sets--for example see https://lpdaac.usgs.gov/dataset_discovery/modis/modis_products_table/mod13q1_v006
Canopy biochemistry
Remote detection and measurement of leaf and canopy biochemicals, such as nitrogen and lignin content, as well as photosynthetic pigments such as cholorophyll, allow predictions of biodiversity processes such as productivity, decomposition, and nutrient turnover rates, as well as assessment of vegetation structure (e.g. leaf area index, specific leaf area etc). Spectral absorption features characteristic of proteins (containing nitrogen), lignin and other leaf constituents occur throughout the visible and shortwave infrared region and are retrieved using hyperspectral remote sensing (image spectroscopy). A number of image spectroscopy satellites are planned for launch in the next years (EnMAP-Germany, PRISMA-Italy, Sentinel-Europe). Until then, aircraft assessment and monitoring using advanced airborne hyperspectral scanners dominate.
Water biodiversity
Freshwater and marine ecosystems are degraded and threatened ecosystems at the global scale. Remote sensing is used to assess and map ecosystem services, as well as develop modelling approaches to evaluate water ecosystem dynamics and simulate future scenarios on their evolving vulnerability. This includes ecological assessment of aquatic ecosystems, research and development of ecosystem modelling and scenario analyses, and studies on how ecosystems and biodiversity adapt to drivers of biodiversity loss. Several RS applications already exist that could be expanded into national indicators, using time series of optical satellites such as MODIS, MERIS, Landsat, and Sentinel. These include the monitoring of shore habitats and water quality parameters, among others.
Surface cover (height, crown cover and density)
Forest canopy height, crown cover and density are important because they are key to understanding and estimating a variety of parameters including biomass, vegetation coverage, and biodiversity. Canopy density, or canopy cover, is the ratio of vegetation to ground as seen from above, while canopy height measures how far above the ground the top of the canopy is. Lidar can be used to determine these structural variables, however, existing satellite systems do not include suitable Lidar instruments. Even so, an increasing number of countries have blanket lidar coverage from airborne systems and satellite-based Lidar systems are under discussion. Some vegetation structural elements can be retrieved using currently available radar, for example, basal area.
Ecosystem extent and fragmentation
This EBV captures the geographic boundaries and areal extent of ecosystems and the degree to which a previously contiguous ecosystem has been divided. It is important because changes in these parameters have implications for biodiversity and ecosystem services and are an indicator of driving forces such as climate and land
CBD/SBSTTA/21/INF/17
Page 13
use change.
Ecosystem extent indicates the physical boundaries and areal size of an ecosystem, which may change, for example, as the climate changes or due to human activites such as a forest being converted to cropland. Satellite remote sensing is commonly used to map land cover, which can correspond to ecosystems if the land cover classes are selected accordingly. There are limits to the ability to discriminate between different ecosystem types from space, though as hyperspectral and Lidar instruments, for example, become more widely available discrimination capabilities will increase. Combining satellite RS with other types of datasets, such as soils and elevation models, also increase ecosystem discrimination capabilities, for example, see http://rmgsc.cr.usgs.gov/outgoing/ecosystems/Global/.
Fragmentation is the level of discontinuity in a once-continuous ecosystem, a highly fragmented ecosystem thus being composed of small patches. Fragmentaton is important because it can directly affect both the distribution and abundance of species as well as a variety of ecosystem functions. Satellite remote sensing is commonly used to estimate fragmentation through spatial statistics and techniques such as FragStats, wavelets and Fourier analysis.
Ecosystem composition by functional type
Ecosystem functional types are vegetation units with similar functional characteristics of productivity as measured over time. It is an inherently remote sensing based methodology with examples generated using NOAA-AVHRR, MODIS and Landsat. These approaches use the seasonal dynamics of spectral indices related to ecosystem dynamics such as primary production, radiative balance, thermal exchange and/or water exchange. Functional attributes can be used to quantify and qualify ecosystem services.
Vertical distribution of vegetation
LiDAR is an emerging remote sensing technology eminently suited to assessing and monitoring the vertical distribution of vegetation – including remote sensing enabled EBV sub-classes such as vegetation height structural variance and vertical heterogeneity.
The imminent launch of the NASA GEDI LiDAR on the space station, is a significant upgrade in the quality of imagery earlier available from the ICESAT-GLAS LiDAR used amongst other applications for global forest height mapping and monitoing at 1 km2. GEDI will allow global ecosystem dynamics monitoring at high resolution.
ANNEX 2: LIST OF EXPERTS
Many scientific experts have contributed to the discussion and formulation of remote sensing enabled
Essential Biodiversity Variables, including:
Andrew Skidmore, University of Twente, Netherlands & Macquarie University, Australia
Marc Paganini, ESA
Gary Geller, NASA
Miguel Fernandez, iDIV, Germany
Henrique Pereira, iDiv, Germany
Martin Wegmann, University of Wuerzburg, Germany
CBD/SBSTTA/21/INF/17
Page 14
Mike Gill, Polar Knowledge Canada, Canada
Nicholas C Coops, University of British Columbia, Canada.
Matthew Hansen, University of Maryland, USA.
Richard Lucas, University of New South Wales, Australia.
Brian O’ Connor UNEP-WCMC, United Kingdom
Marc Paganini European Space Agency, Italy
Michael E. Schaepman University of Zurich, Switzerland
Woody Turner NASA, USA.
Tiejun Wang, University of Twente, The Netherlands.
Nathalie Pettorelli, Zoological Society of London, United Kingdom
Allison Leidner, NASA, USA
Sander Mucher, ALTERRA, the Netherlands
Ruth Sonnenschein, EURAC, Germany
Walter Jetz, USA
Alan Belward, JRC, Italy
Terry Dawson, University of Dundee, UK
Rob Jongman, Jongman Consulting, the Netherlands
Pieter Kempeneers, VITO, Belgium
Petteri Vehervaara, Finland
Andreas Mueller, DLR, Germany
Uta Heiden, DLR, Germany
Moses Cho, CSIR, South Africa
Eren Turak, New South Wales government, Australia
Raymond Kokaly, USGS, USA
Johannes Penner, Natural History Museum Berlin & University of Freiburg, Germany
Dirk Schmeller, UFZ, Germany
Simon Ferrier, CSIRO, Australia
Fernando Camacho, NASA
Domingo Alcaraz Segura, UB
Ben Somers, U Leuven
Ruben van der Kerkchove, VITO
Angela Lausch, UFZ,Germany
Daniel Kissling, UvA, Netherlands
Petteri Vihervaara, Finland
Laetitia Navarro, iDiv/GEO BON, Germany
Steven Briggs, ESA, Italy
Jan Kees Vis, Unilever, Netherlands
Hannes Feilhauer, FAU, Germany
Joost Van den Abeele, BELSPRO, Belgium
Frank Muller Karger, CEOS Marine, USA
Néstor Fernández, iDiv/GEO BON, Germany
Ilse Geijzendorffer, France
Robert Hoft CBD USA
Mike Gill, GEO BON, Canada
Jonathon Ross, Geosciences Australia CEOS
Martin Herold, Wageningen University, Netherlands
Roshanak Darvishzadeh, ITC/UT, Netherlands
Abebe Ali, ITC/UT, Netherlands
Elnaz Neinavaz, ITC/UT, Netherlands
__________