fat tax, subsidy or both? the role of information and ...1 fat tax, subsidy or both? the role of...
TRANSCRIPT

Munich Personal RePEc Archive
Fat tax, subsidy or both? The role of
information and children’s pester power
in food choice
Papoutsi, Georgia and Nayga, Rodolfo and Lazaridis,
Panagiotis and Drichoutis, Andreas
Agricultural University of Athens, University of Arkansas
17 December 2013
Online at https://mpra.ub.uni-muenchen.de/61686/
MPRA Paper No. 61686, posted 30 Jan 2015 08:39 UTC

1
Fat tax, subsidy or both? The role of information and children’s
pester power in food choice
Georgia S. Papoutsia,*, Rodolfo M. Nayga, Jrb, Panagiotis Lazaridisa and Andreas C.
Drichoutisa
a Dept. of Agricultural Economics and Rural Development, Agricultural University of
Athens, Iera Odos 75, Athens, 11855, Greece
b Dept. of Agricultural Economics and Agribusiness, University of Arkansas,
Fayetteville, AR 72701, USA; adjunct professor, Norwegian Agricultural Economics
Research Institute & Korea University
Abstract: Using a discrete choice experiment with real economic incentives, this
paper studies how food fiscal policies and external influences (such as pestering and
information) can affect parental choice of food for their child. Using pairs of a parent
and child, the experimental design varies the food prices of healthier and unhealthier
alternatives of food products for children as part of specific food fiscal policies. We
then examine the interplay of children’s pester power as well as information about the
fiscal policies. The results from our lab experiment suggest that (a) implementing a fat
tax and a subsidy simultaneously can shift parental behavior to healthier food
products to a greater degree than a fat tax or a subsidy alone, (b) providing
information regarding the food fiscal policies can further increase the impact of the
intervention, and (c) child pestering is one of the causes of the moderate effectiveness
of the policies as it strongly affects parents in making unhealthier choices.
Keywords: Choice experiment; Fat tax; Subsidy; Information; Pester power
JEL codes: C9; D12; I10
Acknowledgments: The authors would like to thank Dr. Mary Yannakoulia for her
valuable help with the nutritional/health aspects of the experiment. All remaining
errors are solely our own. This work was partly supported by the National Research
Foundation of Korea (NRF-2011-330-B00074).
*Corresponding author. Tel.: +30-210-5294726; fax: +30-210-5294786; email:

2
1 Introduction
Overconsumption and excessive intake of sugar and fats along with sedentary
lifestyles have been partly blamed for the worldwide obesity prevalence trend.
Individual food choices are influenced by a wide variety of biological and
environmental variables. Biological variables include hunger, taste, and appetite,
while environmental variables include economic determinants (cost, availability, and
income), social determinants (socio-cultural status, meal patterns, peer and social
networks), psychological determinants (mood, stress, guilt) and perceived nutrition
determinants (knowledge about food, beliefs, attitudes) (The European Food
Information Council (EUFIC), 2005). Individuals place different levels of importance
on each of these dimensions.
However, when transferring this framework from adults to children, an additional
dimension must be taken into account. The food environment created by parents for
children likely plays a more important role. This is because although adults have the
freedom to make their own choices regarding energy intake and expenditure, the
child’s choice set is limited by the environment created by their parents (Barlow and
Dietz, 1998). In this respect, Cawley (2006) stresses that parental control and bounded
rationality are of great importance for childhood obesity. Thus, nudging parents
toward healthier behavior could play an important role in helping children develop
healthy eating habits at a young age. This is very important given the evidence that
habits are formed early on in life and are retained throughout adulthood (Kelder et al.,
1994; Resnicow et al., 1988; Singer et al., 1995). Therefore, interventions that focus
on parental food choice behavior may help in this regard.
Due to the substantial negative externalities for society involving increasing obesity
rates, several governments worldwide have intervened with various policies with the
goal of influencing dietary habits. These include but are not limited to fiscal (OECD,
2012), marketing/informational (Beaudoin et al., 2007; Maes et al., 2012), and
educational policies (Cross-Government Obesity Unit, 2008; New York City
Department of Health and Mental Hygiene, 2008) that aim to encourage people to
make healthier food choices. In the respective literature, fiscal policies (i.e., those that
limit access and provide price incentives and disincentives) have received great
attention with respect to their effectiveness in improving dietary patterns (Thow et al.,

3
2010). Generally, three types of price strategies have been applied: increasing
unhealthy food prices (fat tax), decreasing healthy food prices (often called a thin
subsidy) and a combination of both (Waterlander et al., 2012).
However, the literature provides contradictory results on the efficacy of these policies
as a health intervention tool. In fact, although fiscal policies may encourage people to
make healthier choices, they may not be sufficient in themselves to alter long-term
overall purchasing behavior. This is because any reduction in purchases of taxed
products may be offset by the consumption of calories from other sources (Fletcher et
al., 2010). The results from a number of studies suggest that increasing the price of a
good through taxation or decreasing its price through subsidy could be an effective
means of shifting food consumption away from unhealthy food toward healthier
alternatives, not only among adults (Andreyeva et al., 2010; Dong and Lin, 2009;
Epstein et al., 2012; French, 2003; Goldman et al., 2011; Powell and Chaloupka,
2009; Waterlander et al., 2012) but also among young children and adolescents
(French et al., 2001; French et al., 2003; Hannan et al., 2002).
The evidence on the effectiveness of health related food price incentives and
disincentives is from three sources: natural experiments, controlled trials of price
changes in closed environments, and modeling studies (Mytton et al., 2012). To our
knowledge, there are only a handful of studies that performed controlled experiments
over food purchases under different fiscal policies, and these studies have several
caveats. For example, two such studies (Epstein et al., 2010; Nederkoorn et al., 2011)
lack enforcement of real monetary incentives because both the purchases and the
budget for the purchases were hypothetical. An additional set of studies (Epstein et
al., 2006; Epstein et al., 2007) lacks sufficient statistical power because they
employed small sample sizes (10 and 47 couples of mother-child). Our emphasis on
experimental economics research is based on the fact that causal knowledge requires
controlled variation. The laboratory can mimic real-world markets and simultaneously
allow tight control of decision environments in ways that are hard to duplicate using
naturally occurring settings, and hence, it can isolate factors that affect human
behavior.
Our aim in this study is to identify some factors, either inside or outside the home
environment, that can either weaken or enhance the expected outcomes of fiscal
policies on food choices, through a controlled laboratory experiment. First, our

4
experiment contributes to the literature by providing an empirical examination of
parent choices between healthier and unhealthier alternatives in regard to food
products for their children under different fiscal pricing policies. While nutritional
considerations are the most important determinants of parental food purchasing
decisions, the preferences of their children are the second most important determinant
of parental food choice (Spungin, 2004). Thus, we also evaluate how factors such as
the provision of information on fiscal policies and child pestering may influence
parental food choices.
While there is an extensive literature on the impact of information on demand for
food, there is scant literature on the causal effect of information on the effectiveness
of food fiscal policies. It is well established that information can help consumers
better evaluate the value of goods and services they are interested in, resulting in more
appropriate purchases. It can also significantly help buyers to choose which market to
participate in, and it can affect the elasticity of demand (Johnson and Myatt, 2006;
Lewis, 2011; Tadelis and Zettelmeyer, 2011). Ashraf et al. (2013) examined
information and subsidy as complements in health interventions and found that
information can significantly increase the impact of price subsidies on purchases of
healthy products (the impact of price subsidies was 60% larger among the informed
households).
In addition to our knowledge, this is the first study to examine children’s power
(commonly referred to as “pester power” or “pestering”) to influence parents’
purchasing behavior (Gunter and Furnham, 1999; McNeal and Mindy, 2003; Nicholls
and Cullen, 2004) in the context of a lab experiment on real food choices. Thus, we
contribute to the behavioral economics and health economics literature by examining
how fiscal policies and external influences (such as pestering and information) can
affect food choice behavior. Food shopping usually constitutes the first experience
children in the Western world have of consumer activity, often in conjunction with
their parents (Cook, 2003). More recent research has also observed that children are
active participants and influencers in the food decision-making process (Carey et al.,
2008) and that the parent-child conflict is fairly high in supermarket shopping
environments (Nicholls and Cullen, 2004). A recent survey examined children’s
pester power in the supermarket environment through intercept interviews and
concluded that parents often purchase the food that their children demand while in

5
supermarkets despite the fact that the majority of the children’s requests are unhealthy
(Campbell et al., 2014).
The question we ask in this paper is whether certain factors can have a moderating
role on the monetary incentives that food fiscal policies create with respect to parental
food choice behavior. We examined these effects through the recruitment of 189
parent-child pairs in a controlled laboratory choice experiment in which we created an
experimental market with real food products in which parents actually had the
opportunity to purchase products presented under different pricing schemes. Our
sample consisted of four within-subjects treatments and four between-subjects
treatments. In the within-subjects treatments, each participant faced 12 food choice
tasks.1 In each choice task, we displayed two food-for-children products, of the same
brand and size, with different levels of healthiness (percentage of sugar and fat) and a
no-buy option. The participants (parents) chose their preferred alternative in each
choice task. Between choice tasks, the prices varied according to a base level (which
was selected to reflect the average of market prices) and three different fiscal policies
levels (i.e., fat tax, subsidy, fat tax and subsidy at the same time). To induce real
economic incentives, one of the choice tasks was randomly drawn as binding at the
end of the experiment, and the participant had to buy the food product chosen in the
binding task or leave with no product if s/he had chosen the no-buy option. In addition
to the within-subjects treatments, there were four between-subjects treatments. The
control treatment was as described above. The second treatment (the information
treatment) was similar to the control treatment but with the addition of information
regarding the food fiscal policies.2 The third treatment (the pester treatment) was
similar to the control treatment, but now the parent chose together with their child in
each choice task. The fourth treatment was similar to the pester treatment except that
1 To cover up the aim of the study and preclude subjects from potentially succumbing to experimenter demand effects, two additional non-food categories were added to the list of choice tasks. We used stationery products (colored markers, pens/pencils) as decoy products. Consequently, participants faced 20 choice tasks in total (12 food- and 8 stationery-choice tasks). 2 The word tax or subsidy, especially as they relate to food, includes a normative message rather than just giving plain information regarding the direction of the price change (upwards or downwards). More generally, when fiscal policies are applied, the purchasing behaviour cannot be explained solely in terms of a price effect. The nature of the intervention itself could also influence consumer preferences (Hilton et al., 2014). The announcement of the implementation of a specific policy to participants reflects the nutritional content of the product subject to this policy, i.e., a fat tax for product “X” means that the “X” product is probably unhealthy, and this is why it is being taxed. However, this is exactly what this study attempts to examine. We provided information about the price change at the time of purchase to remind participants about the healthiness of each product alternative.

6
we also offered information to the participants about the food fiscal policies (pester
plus information treatment).
Our results make three substantive contributions to the literature. We find that the
fiscal policy intervention by itself has a moderate effect on parental food choices. In
particular, we find that a fat tax or a subsidy can increase healthier choices and that
the simultaneous implementation of both a fat tax and a subsidy can further improve
healthier choices among parents. Our second result is that when information regarding
the applied food fiscal policies is available, healthier choices can increase the impact
of the intervention even further. Therefore, it appears that the lack of proper provision
of information is one of the causes of the policy’s moderate effectiveness. Third, we
find that child pestering strongly affects parents in making unhealthier choices.
The rest of the article proceeds as follows: First, we present the design of the
experiment and the experimental procedures as well as information about our sample
and products used in the study (section 2). Section 3 illustrates the results drawn from
the descriptive and econometric analysis. Section 4 concludes with the importance
and the implications of the findings.
2 Experiment
2.1 Experimental Design
Table 1 exhibits the four within- and four between-subjects treatments of our
experiment, along with the number of parent-child pairs that participated in each
treatment. Each cell in the table represents a between-subjects treatment. Within each
cell, the four within-subjects treatments are listed that correspond to the price
variations induced by each of the four fiscal policies: (1) a baseline scenario of market
prices, (2) a fat tax, (3) a subsidy, and (4) a fat tax and subsidy applied simultaneously
(the “Both” treatment). The between-subjects treatments vary the decision
environment (the parent goes through the choice tasks with or without the presence of
the child, which corresponds to the “Pester” and “No Pester” treatments) and
information provision (whereby the parent is provided with information about the
fiscal policies or not, hereafter referred to as the “Info” and “No Info” treatments). All

7
sessions were conducted by a single experimenter, i.e., one of the authors, and the
experiment was conducted using the z-Tree software (Fischbacher, 2007).
Table 1. Experimental design
No information for
fiscal policy
Information for fiscal
policy
Pester power
47 Market price, Fat tax,
Subsidy, Both
47 Market price, Fat tax,
Subsidy, Both
No Pester power
47 Market price, Fat tax,
Subsidy, Both
48 Market price, Fat tax,
Subsidy, Both
2.1.1 The role of food fiscal policies
Our experiment allows us to study the role of food fiscal policies as a tool that can
influence healthier food purchasing behavior. We varied within subjects the posted
prices of the products according to four within-subjects treatments. The market price
(MP) treatment was always displayed first to create a common reference point to all
subjects so that comparisons can be made with respect to fiscal policy treatments. In
this treatment, the healthier and unhealthier versions of a product on any given choice
task were set to the same level. The price level was set to the average value of market
prices we found in major supermarket chains a few days prior to the experiment.
Participants were explicitly told that in the first round, they will see the products in
their average market price (the average price was the same within a product category
but, naturally, varied between product categories). After the MP treatment, the three
food fiscal policies (three treatments) followed in random order to avoid order effects.
The only thing that was varied in these treatments was prices for the products (see
Table 2). One of the treatments imposed a fat tax on the price of the unhealthier
product (as judged by the fat or sugar content) while keeping the price of the healthier
product constant at market price (FT treatment). An additional treatment imposed a
subsidy on the price of the healthier product, keeping the price of the unhealthier
product constant at the market price (SB treatment). The third treatment combined a
fat tax on the price of the unhealthier product with a subsidy on the healthier product
(BO treatment). The full list of choice tasks displayed in the four within-subjects
treatments is listed in Appendix A.

8
Table 2. Overview of the within-subjects treatments
Treatment Description
Control Treatment Prices are set to the average value of market prices of major supermarket chains prior to the experiment. The prices of the healthier and unhealthier alternatives are equal.
Fat tax (FT) Treatment
Fat tax on the unhealthier alternative (25% increase on the market price)
Subsidy (SB) Treatment
Subsidy on the healthier alternative (25% decrease on the market price)
Both (BO) Treatment
Fat tax on the unhealthier alternative and subsidy on the healthier alternative at the same time (a 25% increase in the market price of the unhealthier product and a 25% decrease in the market price of the healthier product)
2.1.2 The role of provision of information
Our rationale for including a (between-subjects) provision of information treatment
was that information regarding the price change can signal the relation of a price
change with the healthiness of a product. This in turn can potentially alter purchase
behavior. Such information provision can be enacted using several methods, including
mass media, governmental/community-level agent announcements and informative
labels on the shelves next to the price. In the context of our laboratory experiment, a
labeling scheme was deemed more realistic when combined with a hypothetical
governmental announcement. The design tries to mimic the real process of
implementing a food policy. In Denmark in 2011, the media announced the
implementation of a fat tax on products with high fat content to address rising obesity
rates among the Danish and the relatively lower life expectancy. We adopted this
procedure because we wanted the results of this experiment to be more relevant for
policy makers. Thus, during the experiment, subjects were asked to imagine a case in
which the health minister was about to implement a policy to address alarming obesity
rates among children in the country (see Appendix B). However, we also added one
more element. We made taxes more salient in terms of the visibility of the applied tax.
Therefore, in the information treatment, subjects were informed of the actual reason
for which a price change occurred (e.g., implementation of a fat tax or a subsidy or
both) using a descriptive label on the top of the screen. We conducted this study in
Greece, where, as in many other European countries, sales tax is applied to all food
products (in contrast to many states in the US, where food and non-alcoholic

9
beverages are exempt from sales tax), and the sales tax is included in the posted price
depicted on the sales tag (that is, one uniform final price is displayed). Therefore, the
information treatment simulates an environment in which the consumer is informed of
the price change of the product at the point of purchase through an informative tag. In
the no-information treatment, subjects were not informed of the actual reason for the
price increase/decrease.
2.1.3 The role of children’s pester power
Our second between-subjects treatment examined the effect of parents making joint
decisions with their child. While a parent may rationally choose to purchase a
healthier product for their child, going to the supermarket with their child could
adversely affect purchase decisions if the parent decides to give in to the child’s
demands (which are likely motivated by factors other than nutrition). To vary the
child’s ability to potentially pester the parents on their choices (hereafter referred to as
pester treatments), we allowed children in half of the sessions to participate in the
experiment with their parent by letting the child sit next to his/her parent.
In the no-pester treatments, the parent-child pair entered the lab together; however,
the child stayed in the lobby of the lab and had no knowledge of what happened in the
main area of the lab where the experiment took place and where the products were on
display. Parents were told that the child will be kept engaged in the lab’s lobby, where
the child could watch cartoons or draw using paper and colored pencils. The child was
told that s/he could watch cartoons or engage in drawing and that her/his parent was
going to sit close by and within eye-contact distance. All the children were therefore
restricted to being in the lab lobby, and none was allowed in the lab. Hence, parents
decided on their own during the experiment without any external influence from the
child, and the child did not participate in the experiment at all.
On the other hand, in the pester treatments, the parent-child pairs entered the main
area of the lab together. The experimenter then instructed both the child and the parent
to take a good look at the products in the exhibition shelf. They then sat together in
front of the computer. Because there were no other distractions in the lab, the parent-
child pairs were focused on the experiment and the choices they had to make. The
child and the parent could freely communicate and discuss the choice options they had

10
to make.3 In addition, the experimenter indeed observed that there were interactions
between each parent-child pair.4 The children regularly expressed their opinion when
the choice alternatives appeared on the computer screen. The experimenter also
observed that in several cases in the pester treatments, the parents tried to convince
their child to choose the healthier alternative but that at the end, the child’s nagging
caused the parents to give in to their child’s demands.
2.2 Participants
A random sample of families (one adult who is the primary grocery shopper and
makes the household meal decisions and one child) from the general population of
Athens, Greece was recruited by a market recruitment research company. The
research company ensured that the interested families met the following study criteria:
(1) the child in the family was between the ages of 6 and 10 (if there was more than 1
child in the family in this particular age range, the company randomly picked one
child)5 and (2) the family consumed the products used in the study moderately or
more often.6 Subjects were offered a fixed fee of 30€ per family to participate in a
“preference survey for snack and stationery products for children” conducted in the
experimental economics laboratory of the Agricultural University of Athens. A total
of 189 families participated in the experiment.7 Subjects participated in one of the
four between-subjects treatments, and they were randomly assigned to a time slot
between July 2012 and September 2012. Experimental sessions were split between
morning (97 sessions) and afternoon (92 sessions) snack time hours, i.e., from 9:00-
3 We observed that, in the pester treatments, all the children interacted with their parent. None of the children interacted with their parents in the No-Pester treatments. 4The experimenter systematically recorded on a sheet of paper whether the pair interacted in any way that signalled coordination in the choice made by the parent. This behaviour occurred in every single interaction. 5 We chose this specific age range because, on the one hand, children of this age range have almost no pocket money and are totally dependent on what their parents purchase for them, while, on the other hand, they are old enough to accompany parents at the supermarket. 6 Parents were screened for consumption patterns from a large list of food and stationery products, which included the products used in our study, so that we would avoid any prior associations with the aims of the study. 7 A total of 195 parent-child pairs were recruited by the research company. Four of them did not show up. Two more pairs were excluded from all further analysis because, on one occasion, the parent refused to let us take anthropometric measurements from both the chid and the parent; on the other occasion the child entered the lab while his mother was making choices for the experiment despite several warnings that the child should remain in the lab’s lobby.

11
13:00 and 16:00-20:00 each day of the week except Sundays.8 Each parent-child pair
participated in only one treatment/session. All subjects were given a short orientation
and training before the experiment begun.
2.3 Experimental procedures
Each experimental session consisted of four tasks. It included a real choice
experiment (RCE), a manipulation check questionnaire, a socio-demographic
questionnaire and anthropometric measurements. In each session, a single parent-child
pair participated, which lasted approximately 40 minutes. Depending on the treatment,
the child could have an active role in the choice experiment or not.
In the RCE task, participants faced different choice tasks for which they had to choose
between two (similar) products of the same brand (e.g., cheese) differentiated by their
healthiness status (healthier vs. unhealthier alternative) and price (three levels). The
healthiness or unhealthiness status was not explicitly labeled as such. Choices also
included a no-buy option in the event that subjects did not prefer any of the products.9
The experiment was conducted as follows: First, each parent was assigned a unique
ID number to guarantee his/her anonymity, and s/he was informed that their fixed
participation fee of 30€ would be given to them at the end of the experiment.10 In
addition, subjects could examine the products offered for sale in a display section in
the lab. They were given a sufficient amount of time to see and inspect all products.
Subjects were then seated in front of a computer, and they were informed that they
would go through 20 choice tasks displaying various combinations of the products on
display in the lab.11 They were also informed that when they complete all choice
8 Lunch and dinner time in Greece are usually later than in other parts of Europe and North America. Lunch is usually served between 13:30 and 15:00, while dinner is served between 20:00 and 21:30. Two parent-child pairs participated in the experiment at 14:00 and 14:45 because they were late and early. 9 According to Louviere and Street (2000), it is not realistic to force participants to choose one of the available options, and therefore including a no-buy option is to be preferred. 10 The fixed fee of 30€ per family reflects the opportunity cost of time of 2 people commuting from their residence to the university lab to participate in the experiment (round trip tickets for public transportation at the time of the experiment cost 5.60€ for 2 persons). This leaves the parent-child pair with approximately 25€ of net income, which is comparable to what professional research companies use to compensate subjects in the surveys they undertake. Furthermore, because the fixed fee of 30€ did not vary across treatments, it should not explain the differences in observed behavior between treatments. 11 Note that only 12 of 20 choice tasks involved food items. Eight choice tasks involved decoy stationery products.

12
tasks, one of these would be chosen as binding, and they would have to purchase the
product of their choice at the indicated price. The price of the product would be
deducted from their participation fee. To determine the binding round, subjects had to
draw a number from a jar with folded papers listing numbers from one to twenty (as
many as the choice tasks). To make sure parents were choosing food products for their
child, they were explicitly told that the binding product would be opened and given to
their child right away, to be consumed while s/he was filling out a socio-demographic
questionnaire.12 We emphasized to subjects that actual payment would occur for the
binding choice task and that they should evaluate each choice task carefully because
all tasks were equally likely to become binding. Subjects were also told that choosing
the “none of these” option (i.e., the no-buy option) is an acceptable choice and that, if
they had chosen the no-buy option in a binding task, no purchase would be made and
they would keep their full endowment. The exact instructions given to the participants
are displayed in Appendix B.
To confirm that our experiment worked well, i.e., that there was no experimenter
demand effects and participants adhered to the experimental instructions, we
incorporated a manipulation check questionnaire right after the choice experiment was
finished (see Appendix C for more details).13 The socio-demographic questionnaire,
which elicited parental perceptions about their child’s weight status, family dietary
habits, and family socio-demographics, was filled out by the parents.
Each session concluded with anthropometric measurements of the parent and the
child. Physical measurements of body weight and height were obtained from all
children and their parents (light summer clothing, no shoes). Body weight was
measured on a leveled platform scale with a beam and movable weights, and body
height was measured with a wall-mounted stadiometer, to the nearest 0.5 kg and 0.5
cm, respectively. Body Mass Index (BMI) was computed as weight (in kilograms)
12 In many cases, when the binding product was a food product, it was consumed by the child while the parent was filling in the questionnaire. In a few cases in which the questionnaire was filled out before the child had the chance to fully consume the food product (this only happened with the cheese sticks, for which the package included 6 pieces individually wrapped), we did let the children take the rest of the product home. However, the participants were not informed of this beforehand. 13 The results of the manipulation check questionnaire reinforced the validity of our experimental results. All subjects in the information treatment responded that their responses were based on the information given at the beginning of the session along with what s/he and/or their child wanted and were not based on what they thought the experimenter wanted from them. All subjects in the No-Info treatment responded that the purpose of the study was to examine consumption patterns for food and/or stationery products for children.

13
divided by height (in meters squared), and it was used to classify participants as either
normal-weight, overweight or obese (Cole et al., 2000; Cole et al., 2007; WHO,
1995).
2.4 Products and choice tasks
The food products chosen were products commonly purchased by Greek families as
snacks for children. In each product category (choco milk beverage, cheese, and
yogurt), there were two products of the same size and weight that differed only on the
basis of percentage of calories, fat and sugar, and so it was easy for parents to
distinguish between the healthier and the unhealthier alternatives (for example, all
healthier products carried nutritional claims such as “free”, “2%”, “light”). However,
we did not explicitly mention to the participants if a product would be considered
more or less healthy. We also did not label any of the products as such. Each choice
task depicted the alternative products using photo stimuli. To mute any brand effects,
we chose products of the same brand in each product category; that is, each pair of
healthier and unhealthier products were of the same brand. One week before the
official start of the experiment, the experimenter visited the supermarkets of the four
largest chain stores in the city and collected price information for the products of the
experiment. The average of these prices was used in the baseline control (market
price) treatment, and prices for the other within-subjects treatments varied
accordingly.14
Furthermore, we purposely chose products for which the healthier and unhealthier
alternatives in each choice task were packages of different colors. The visual elements
of a brand, such as the colors and illustrations, are the first elements understood and
memorized by children rather than the specific name of the brand (Kapferer, 1985;
Richard, 1990). In a study conducted with children from 6 to 11 years old, who were
asked to draw the cornflakes packages they knew, Rossiter (1976) indicated that
14 The products were: milko vs. milko free, babybel vs. babybel light, delta yogurt vs. delta yogurt 2%. The dairy product category was chosen for our experiment because there are only small price differences among the healthier and less healthy options. For well known attributes such as fat and calories, dairy manufacturers in Greece no longer price their “healthier” products more expensive than their “regular” ones. The Greek dairy market is not an exception. Rao et. al.,(2013) conducted a systematic review and meta-analysis of prices of healthier versus less healthy options within a single food category and concluded that in the case of dairy products, the price differences are very small ($0.004). In addition, the purpose of the control treatment was to give a common reference point to participants so that comparisons can be made with respect to the fiscal policy treatments.

14
children more easily retained the visual elements of the brand rather than the brand
name itself. Rossiter (1976) concludes that, while the brand name is an important
recognition sign, it is intimately associated with children’s age and to the development
of their verbal memory. In addition, Burros (2005) concludes that television
advertisements largely influence the food preferences of children under 12 years of
age. The products used in the experiment were commonly advertised during
children’s TV programs. Thus, we spent a great deal of time and were careful in
choosing the specific products for our experiment (illustrating pictures of the products
can be found in Appendix D).
To cover up the aim of the study and preclude subjects from potentially succumbing
to experimenter demand effects, two additional non-food categories were added to the
list of choice tasks. We used stationery products (colored markers, pens/pencils) as
decoy products. The prices of the decoy products in the market price (baseline)
treatment were the average of the range of prices observed in the same supermarkets
we surveyed for the food items. Decoy products were selected so that their price range
lied between the lowest and the highest price of the market prices of food products, to
avoid exposing subjects to any irrelevant price anchors. Prices did not change for the
decoy products under the fat tax, subsidy and both treatments because the fiscal
policies were irrelevant for stationery products.
In all, the real choice experiment incorporated 20 different choice tasks [4 within-
subjects treatments (MP, FT, SB and BO) 5 product categories (3 food and 2 non-
food)]. The choice tasks pertaining to the stationery products will not be further
analyzed. Appendix D displays the sample choice screens from the market price
treatment. In the rest of the within-subjects treatments, prices were adjusted
accordingly.
3 Results
3.1 Descriptive analysis
Before proceeding with testing our hypotheses, insights can be gained by looking at
some descriptive statistics. We first explore whether randomization to treatment

15
worked by testing whether the observable characteristic are balanced across the
between-subjects treatments (see Table 3).
With respect to the socio-economic status of families, results indicate that our
between-subjects treatments do not differ in terms of parent/children age and gender,
income level, education level, working status, family geographical location residence
and marital status. Furthermore, given that parent-children pairs would have different
compositions (i.e., father-son, father-daughter, mother-son, and mother-daughter), a
question that might arise is whether the proportions of parent-child gender
combinations differ across the treatments. We cannot reject the null of no difference
between treatments (Pearson’s χ2 =10.85, p-value=0.29). We also classified
individuals according to parental weight status using Body Mass Index (WHO, 1995).
The results of whether the distribution of weight status differs between treatments do
not reject the null hypothesis, and we obtain a similar null effect if we use the raw
BMI measurements instead of the BMI categories. As far as child’s weight status is
concerned, we used the International Obesity Task Force (IOTF) cut offs (Cole et al.,
2000) to categorize children into weight categories, and this does not differ
significantly between treatments. None of our results changes when we use Centers
for Disease Control (CDC) cut offs (CDC, 2009) because the distribution of weight
categories did not significantly change. The results from the use of the raw BMI
(instead of BMI categories) support the above tests.
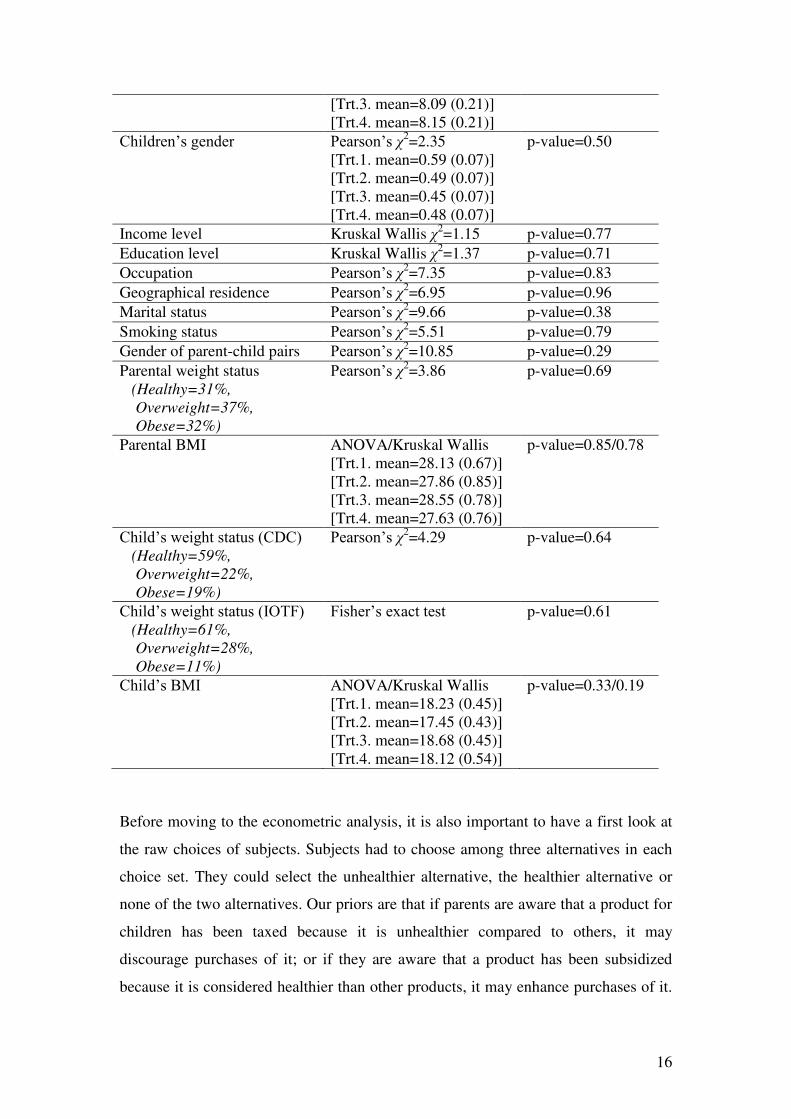
Table 3. Test statistics comparing the between-subjects treatments and means of the
characteristics (standard deviation in parenthesis) for each treatment.
Observable Characteristics Tests
Parents’ age ANOVA [Trt.1. mean=41.21 (0.72)] [Trt.2. mean=40.91 (0.72)] [Trt.3. mean=39.55 (0.60)] [Trt.4. mean=40.25 (0.91)]
p-value=0.41
Parents’ gender Pearson’s χ2=2.51 [Trt.1. mean=0.53 (0.07)] [Trt.2. mean=0.57 (0.07)] [Trt.3. mean=0.45 (0.07)] [Trt.4. mean=0.44 (0.07)]
p-value=0.47
Children’s age ANOVA [Trt.1. mean=8.32 (0.21)] [Trt.2. mean=8.11 (0.18)]
p-value=0.86
16
[Trt.3. mean=8.09 (0.21)] [Trt.4. mean=8.15 (0.21)]
Children’s gender Pearson’s χ2=2.35 [Trt.1. mean=0.59 (0.07)] [Trt.2. mean=0.49 (0.07)] [Trt.3. mean=0.45 (0.07)] [Trt.4. mean=0.48 (0.07)]
p-value=0.50
Income level Kruskal Wallis χ2=1.15 p-value=0.77
Education level Kruskal Wallis χ2=1.37 p-value=0.71
Occupation Pearson’s χ2=7.35 p-value=0.83
Geographical residence Pearson’s χ2=6.95 p-value=0.96
Marital status Pearson’s χ2=9.66 p-value=0.38
Smoking status Pearson’s χ2=5.51 p-value=0.79
Gender of parent-child pairs Pearson’s χ2=10.85 p-value=0.29
Parental weight status (Healthy=31%,
Overweight=37%,
Obese=32%)
Pearson’s χ2=3.86 p-value=0.69
Parental BMI ANOVA/Kruskal Wallis [Trt.1. mean=28.13 (0.67)] [Trt.2. mean=27.86 (0.85)] [Trt.3. mean=28.55 (0.78)] [Trt.4. mean=27.63 (0.76)]
p-value=0.85/0.78
Child’s weight status (CDC) (Healthy=59%,
Overweight=22%,
Obese=19%)
Pearson’s χ2=4.29 p-value=0.64
Child’s weight status (IOTF) (Healthy=61%,
Overweight=28%,
Obese=11%)
Fisher’s exact test p-value=0.61
Child’s BMI ANOVA/Kruskal Wallis [Trt.1. mean=18.23 (0.45)] [Trt.2. mean=17.45 (0.43)] [Trt.3. mean=18.68 (0.45)] [Trt.4. mean=18.12 (0.54)]
p-value=0.33/0.19
Before moving to the econometric analysis, it is also important to have a first look at
the raw choices of subjects. Subjects had to choose among three alternatives in each
choice set. They could select the unhealthier alternative, the healthier alternative or
none of the two alternatives. Our priors are that if parents are aware that a product for
children has been taxed because it is unhealthier compared to others, it may
discourage purchases of it; or if they are aware that a product has been subsidized
because it is considered healthier than other products, it may enhance purchases of it.

17
Overall, we expect that when information is provided about products for which the
price has been changed according to some fiscal policy, the purchasing behavior of
parents would shift to healthier product choices. This hypothesis is confirmed by a
proportions test when we test for differences in choices when information about fiscal
policies is provided. For example, while 36% of choices are allocated to the healthier
alternative in the “No Pester - No Info” treatment, the proportion rises to 72% in the
“No pester - Info” treatment. This difference is statistically significant when we test
using a proportions test (p-value<0.001). Similar behavior is observed in the “Pester”
treatments, in which the choices shift from 21% to 58% to the healthier alternative
when information about fiscal policies is provided. This is clear-cut evidence that
communicating the nature of the fiscal policy has a positive and significant effect on
healthier choices because, in both cases, the percentage of healthier choices more than
doubles. In fact, from the observed interactions recorded by the experimenter between
parent-child pairs, the provision of information seems to have given parents an
argument to present to their children that would support their parental choice of the
healthier alternative.
On the other hand, children’s pester power has a negative effect on healthier choices.
In the “No Info” treatment, which allows the child to be able to communicate
preferences to the parent, results in a significant decline in healthier purchases from
36% to 21% (p-value<0.001). Similarly, in the “Info” treatment, healthier choices
decline from 72% to 58% (p-value<0.001) when children can exercise pester power.
In summary, we find that information about fiscal policies and pester power can have
opposite effects. The proportion of healthier choices increases when information is
provided and children cannot exercise their pester power.
To illustrate this further, Figure 1 graphs the proportion of healthier and unhealthier
choices by treatment. The graphs ignore non-choices given the low number
throughout our experiment (only 20 choices were non-choices of the 2268 choices
that the 189 subjects made in our experiment).

18
0 20 40 60 80 100Percent
Pester – Info
Pester – No Info
No Pester – Info
No Pester – No Info
Healthier vs. unhealthier choices by treatment
Unhealthier choice Healthier choice
Figure 1. Healthier and unhealthier choices by (between-subjects) treatments
To examine the effect of specific fiscal policies (i.e., fat tax, subsidy or both) on
healthier choices, Figure 2 displays the proportions of healthier and unhealthier
choices by fiscal policy. The market price treatments are the benchmark (control
treatments). It is clear that a) imposing the fat tax or subsidy leads to increased
healthier choices and b) imposing the fat tax and subsidy at the same time can further
improve healthier choices. We should emphasize that healthier choices can reach as
high as 83% of all choices when a fat tax and a subsidy are combined, when subjects
receive information about fiscal policies, and when children cannot exercise pester
power. In the case in which information about fiscal policies is provided and there is
pester power, healthier choices fall to 71%. Finally, it is important to mention that
even when information is not available and the child is present (the two factors that
favor unhealthier purchases), the combination of a fat tax and a subsidy produce the
largest percentage of healthier choices when compared with the other fiscal policies
(which amounts to 28%).

19
0 20 40 60 80 100Percent
Pester – Info
Pester – No Info
No Pester – Info
No Pester – No Info
Market prices
0 20 40 60 80 100Percent
Pester – Info
Pester – No Info
No Pester – Info
No Pester – No Info
Fat Tax
0 20 40 60 80 100Percent
Pester – Info
Pester – No Info
No Pester – Info
No Pester – No Info
Subsidy
0 20 40 60 80 100Percent
Pester – Info
Pester – No Info
No Pester – Info
No Pester – No Info
Fat tax & Subsidy
Unhealthier choice Healthier choice
Figure 2. Healthier and unhealthier choices by (within-subjects) treatments
We do not observe large differences in the purchasing behavior between the subgroup
of fathers and the subgroup of mothers (Figure 3). We hypothesized that fathers give
in to child nagging more easily than mothers, even when information regarding the
healthiness of a product is provided. However, the results do not support this
hypothesis.15
15 When splitting our sample into subsamples according to different weight household combinations
(i.e., parent of any weight status with normal weight child versus: (a) obese parents with obese children, (b) obese parents with overweight children and (c) overweight parents with overweight children; obese parents with obese children versus normal weight status parents with normal weight children; obese and overweight parents with obese and overweight children versus normal weight status parents with normal weight status children) to test if different subgroups behave differently among the within- and between- subjects treatments, the proportion tests indicate no significant differences. The linear probability models we estimated also did not produce statistically significant interaction terms.

20
0 20 40 60 80 100Percent
Pester – Info
Pester – No Info
No Pester – Info
No Pester – No Info
Healthier vs. unhealthier choices by treatment: Fathers
Unhealthier choice Healthier choice
0 20 40 60 80 100Percent
Pester – Info
Pester – No Info
No Pester – Info
No Pester – No Info
Healthier vs. unhealthier choices by treatment: Mothers
Unhealthier choice Healthier choice
Figure 3. Healthier vs. unhealthier choices: fathers and mothers subsamples
3.2 Econometric analysis
To check whether the insights gained from the descriptive analysis above hold under
the scrutiny of conditional analysis, we estimated a mixed logit model (also referred
to as the “random parameter logit model” or “mixed multinomial logit model”
(Hensher et al., 2005)). The mixed logit model solves three primary limitations of the
standard logit model. It allows for random taste variation, unrestricted substitution
pattern, and correlation in unobserved factors over time (Train, 2003). McFadden and
Train (2000) indicated that under mild regularity conditions, a mixed logit model can
calculate to any degree of accuracy any random utility model of discrete choice.
We assume that a sampled individual (n = 1,…, Ν) faces a choice among i alternatives
in each of s choice tasks. The utility associated with each alternative i, as evaluated by
each individual n in choice task s, is represented by the following model:
nis n nis nisU x (1)
where xnis is the full vector of explanatory variables that are observed by the analyst;
n is a vector of fixed and random coefficients across individuals parameters; and εnis
is an i.i.d. extreme value error term.
In our experiment, the participants were asked to make 12 choices between dairy
products offered at various pricing levels. The choices can be analyzed using the
following mixed logit model:
0 1 2 3 4 5ni+ +nis ni i ni nis
U ChocoMilk Cheese Price Info Pester (2)

21
where 0ni is the alternative specific constant (ASC) for alternative i; ChocoMilk and
Cheese are product dummies (Yoghurt is the excluded category); Price is the price of
the products; Info is a dummy variable for when information about the fiscal policies
are provided to subjects; and Pester is a dummy variable indicating the treatment for
which the parent-child pair choose together (allowing the child to exercise pester
power).
The coefficient 0ni captures parent sensitivity to the health attribute, and we model
this as a random parameter that is triangularly distributed.16 The coefficients of Info
and Pester, which capture consumer sensitivity to information provision and child
pester power, are modeled as random and triangularly distributed as well. The
parameters β1, β2, and β3 are non-random and capture consumer sensitivity toward
product category and price changes. Finally, the alternative-specific constant for the
“none-of-these” alternative is normalized to zero.
Table 4 displays the estimated coefficients of the parameters and respective standard
errors from the estimated model of equation (2) (the column labeled “mixed logit
(1)”). For comparison, a multinomial logit model is also displayed as well as a mixed
logit model for which only the alternative specific constants are modeled as random
(the column labeled “mixed logit (2)”). We can see that both the mixed logit models
(LL= -1127.017 and LL= -1126.947) are an improvement to the more restrictive
multinomial logit model (LL=-1394.050). Likelihood ratio tests indicate that the
mixed logit model (1) is to be preferred to the multinomial logit model (χ2=534.07, p-
value<0.001). A similar result is obtained when we compare the mixed logit model
(2) with the multinomial logit model (χ2=534.21, p-value<0.001). On the other hand,
the two mixed logit models do equally well (χ2=0.14, p-value=0.998). AIC values
support these conclusions. Note that the two mixed models are qualitatively and
quantitatively indistinguishable in terms of the estimated coefficients.17
16 We tried several other distributions for the random coefficients of our model such as the normal and the uniform distribution. Differences between models with different distributions for the random coefficients are negligible. We only report results from the models with triangular distribution because it is a limited distribution, and therefore, it does not imply that anyone has an unlimited willingness to pay (Alfnes et al., 2006). See Hensher and Greene (2003) for a discussion on the various distributions in mixed logit models. 17 We also estimated models that included a time of the session dummy (morning vs. afternoon sessions) to control for time-of-day differences. The dummy for time of the sessions was not statistically significant and of small magnitude. In addition, likelihood ratio tests indicate that the model with the time-of-day dummy does not significantly improve the fit of the model (χ2=0.928, p-

22
The alternative specific constants represent the utility of the alternatives (unhealthier-
healthier) at the base level, and the alternative with the highest utility on the base level
is the unhealthier alternative, namely, ASCU, which is significantly higher than the
healthier alternative (Wald test-statistic: χ2=46.69, p-value<0.001). The product
dummies have no effect on the utilities of the alternatives. Furthermore, the
coefficient of the Price variable for both the healthier and unhealthier alternatives is
negative, as one would normally expect.
The coefficient of the information variable for the healthier alternative is positive and
statistically significant at the 1% level, while for the unhealthier alternative, it is not
statistically significant and of small magnitude. This means that providing information
about fiscal policies affects the utility of the healthier alternative much more than the
utility of the unhealthier alternative. A similar pattern in terms of statistical
significance is observed for the child pester power coefficients. The pester power
dummy has a negative statistically significant effect for the healthier alternative but is
not significant and is of small magnitude for the unhealthier alternative.
value=0.629). Furthermore, we also estimated a mixed logit model that specifies the model so that error components in different choice sets from a given individual are correlated (correlated random parameters model). However, estimated covariances of random parameters were not statistically significant in this model indicating the absence of correlation between random parameters. In addition, AIC and Log-Likelihood measures indicated a worse fit than the model without correlated random parameters.

23
Table 4. Estimated parameters for the multinomial logit and mixed logit models
Multinomial logit Mixed logit (1) Mixed logit (2)
Variable Coefficient S.E. Variable Coefficient S.E. Variable Coefficient S.E.
ASCU 8.251*** 1.056 ASCU (R) 10.388*** 1.120 ASCU (R) 10.434*** 1.121
ASCH 7.040*** 1.054 ASCH (R) 8.197*** 1.121 ASCH (R) 8.196*** 1.125
ChocoMilk -1.621 1.052 ChocoMilk -1.235 1.060 ChocoMilk -1.237 1.060
Cheese 0.121 1.074 Cheese 1.566 1.099 Cheese 1.562 1.099
PriceU -2.178*** 0.179 PriceU -3.505*** 0.249 PriceU -3.504*** 0.249
PriceH -2.348*** 0.217 PriceH -3.756*** 0.294 PriceH -3.755*** 0.294
InfoU 0.970 0.631 InfoU (R) 0.662 0.703 InfoU 0.606 0.694
InfoH 2.683*** 0.632 InfoH (R) 3.803*** 0.742 InfoH 3.781*** 0.743
PesterU 0.061 0.456 PesterU (R) 0.210 0.540 PesterU 0.201 0.540
PesterH -0.673 0.459 PesterH (R) -1.239** 0.603 PesterH -1.238** 0.593
Log likelihood -1394.050 -1127.017 -1126.947
AIC 2808.100 2286.034 2277.894
N 2268
Note: ***, **, * denote statistical significance at the 1%, 5% and 10% level, respectively. (R): Denotes random coefficient for the respective variable.

24
Given that the estimates of the coefficients from the mixed logit model are hard to
interpret quantitatively, we also calculated the effect of changes in prices on the
choice probabilities for each of the alternatives and for each of the between-subjects
treatments (see Table 5). Because previous analysis indicated little in the way of a
product-specific effect, we pooled across the products in this table. The results from
the within-subjects treatments indicate that changing the food fiscal policy from a
basic level of market price to imposing a 25% fat tax increases choices of the
healthier alternative by 16.16% and decreases choices of the unhealthier alternative by
nearly 18%, ceteris paribus. The results from a corresponding subsidy of the healthier
alternative indicate a 14.5% increase in the probability of selecting the healthier
alternative and a 14% decrease in the unhealthier alternative, ceteris paribus. The
combined effect of a fat tax and a subsidy results in even larger changes. The results
from the between-subjects treatments indicate that the effect of fiscal policies is even
stronger in increasing the probability of selecting the healthier alternative when
combined with information. For example, when information regarding the policies is
provided, a 25% subsidization of the price results in a 49% increase in the healthier
choice share, and the equivalent fat tax imposed on the unhealthier alternative results
in a 50% increase in the healthier choice share. This indicates that the fiscal policies
are more effective if coupled with information carrying a normative messaging.
Our results also indicate that children can influence parents negatively in choosing the
healthier alternatives. We observe that even when both fiscal policies are applied (the
treatment for which we have the larger shares for the healthier alternatives) and
parents make choices together with their child, the probability of selecting healthier
products does not exceed 13%, ceteris paribus. However, based on the percentages
from the Pester – Info treatment, we can see an increase of up to 47% in healthier
choices when information is provided. When we compare differences between the
effectiveness of a fat tax and a subsidy, we conclude that these are rather small, at
least in the context of our experiment.
Table 5. Scenario of fiscal policies (25% increase – 25% decrease) and their effects
on choice probabilities (%) compared to the control (market price) treatment
MARKET
PRICE FAT TAX SUBSIDY BOTH
No Pester – No Info

25
U
BASELINE
-17.91 -14.01 -30.75
H 16.16 14.52 30.49
N 1.74 -0.51 0.26
No pester - Info
U -36.95 -48.96 -47.73 -55.82
H 38.08 49.97 48.96 57.02
N -1.13 -1.01 -1.23 -1.20
Pester – No Info
U 14.23 -1.95 2.92 -14.34
H -14.53 -1.10 -2.74 13.02
N 0.30 3.05 -0.18 1.32
Pester - Info
U -20.16 -35.79 -33.66 -46.10
H 21.15 36.47 34.80 47.14
N -0.99 -0.68 -1.14 -1.04
Note: H: Healthier alternative, U: Unhealthier alternative, N: None of these Fat Tax: 25% Increase in price of unhealthier alternatives from market price, SB: 25% decrease in price of healthier alternatives from market price, BO: Change in price from market price for both policies.
4 Conclusion
Given the rapid rise in obesity rates, especially among children, policymakers and
academics have proposed a large number of policy measures to halt or reverse this
trend. Some of the most well-known mechanisms are food fiscal policies, which may
be used to encourage consumers to adopt a healthier way of eating. In this paper, we
studied how food fiscal policies and external influences (such as pestering and
information) can affect parental choice of food for their child. This is important given
that adult eating habits are acquired during childhood (Birch, 1988; Kelder et al.,
1994; Lien et al., 2001). Thus, children are more likely to adopt healthier eating
behavior if they grow up under a healthy parental food “umbrella”. We focused on
parental food choices because young children’s choices are normally constrained by
what their parents provide them. In this study, we perceive food fiscal policies as a
promising incentive mechanism that could create a parental environment that supports

26
healthy eating in the family. However, specific factors that influence the effectiveness
of food fiscal policies have to be taken into account.
From an economics perspective, this study tries to simulate the choices parents face in
real world settings using a real choice experiment. Choice experiments are an
incentive-compatible method that is easy for consumers to understand. In our
experiment, subjects were tested in a “closed environment” as they could only choose
between three alternatives: a healthier and an unhealthier version of the same product
category, brand and size or the no-buy option. Although in real life, a far greater
number of options (brands, sizes, substitutes) are available in a grocery store, which
can create more complex substitution patterns resulting from fiscal policies, our
small-scale choice environment provides a clean illustration of the effects of these
policies.
In terms of policy making, our study illustrates that the magnitude of the effect of any
fiscal policy can be weakened or enhanced by several other factors. For example, our
study demonstrates the significant (negative) influence that children exert on parental
choice decisions (i.e., with pestering) in regard to healthier foods. On the other hand,
our findings suggest that if proper provision of information regarding the cause of the
price increase/decrease is provided (e.g., posted information tags regarding the
applied policy on the shelf close to the price), the effect of a food fiscal policy can be
enhanced. This finding implies that food fiscal policies are more effective if coupled
with information (that may carry normative messages) directly on the product so that
the policy becomes more salient at the time of purchase. Furthermore, our results
indicate that, although there is an impact on healthier choices after the implementation
of a fat tax or a subsidy, the simultaneous implementation of the fat tax and subsidy
can further encourage healthier choices.18
18 We acknowledge that a different experimental design in which the subject overall income is adjusted by a certain percent after a fat tax or a subsidy would have allowed us to control for income effects and would have given us the opportunity to present income adjusted results for the within-subjects treatments. Furthermore, experimenter demand and house money effects may be present as in many experiments. However, we did everything in our power (including anonymity and manipulation checks) to avoid these potential sources of bias. Even if the effects on the tendency to purchase unhealthier options are at the lower bounds, we are for the most part interested in the between-subjects comparisons of these effects. Thus, the pestering effect (which was identified on the basis of a between-subjects design) does not necessarily reflect a lower bound. As for the house money effect, although there is much evidence of the house money effect in bargaining games, it is not clear how these results would extend to market games and more importantly to market choice experiments. All in all, this paper’s purpose was to identify the factors that enhance or decrease food fiscal policy

27
Overall, one of the ways to gain public acceptance for a fiscal policy that involves
price increases is to convince consumers that revenues from the difference in the
payable price will be returned to them. This could be done with the implementation of
subsidies to products considered healthier, ensuring that food taxes are not regressive;
through educational programs related to healthy eating behavior among adults and
children; through public information campaigns and fitness equipment/parks available
to the public; as well as through funding of the public health system. For example,
Reger et al. (1999) reported that after a six-week mass media campaign and
implementation of media public relation strategies in East Virginia to encourage
consumers to switch from whole-fat milk (2%) to low-fat milk (1%), there was a 17%
rise in low-fat milk purchases. This effect lasted at least six months after the
intervention ended.
Given the context upon which this study was conducted (i.e., in Greece), future
research should test the robustness of our findings in other countries where parenting
styles, family structures, and eating culture might differ.
effectiveness. Thus, these caveats do not affect the between-subjects comparisons of the treatments and, hence, the results regarding the information and pestering treatments.

28
References
Alfnes, F., Guttormsen, A.G., Steine, G., Kolstad, K., 2006. Consumers' Willingness To Pay For The Color Of Salmon:A Choice Experiment With Real Economic Incentives. American Journal of Agricultural Economics 88(4), 1050-1061.
Andreyeva, T., Long, M.W., Brownell, K.D., 2010. The Impact of Food Prices on Consumption: A Systematic Review of Research on the Price Elasticity of Demand for Food. Am J Public Health 100(2), 216-222.
Ashraf, N., Jack, B.K., Kamenica, E., 2013. Information and subsidies: Complements or substitutes? Journal of Economic Behavior & Organization 88(C), 133-139.
Barlow, S.E., Dietz, W.H., 1998. Obesity Evaluation and Treatment: Expert Committee Recommendations. Pediatrics 102(3), e29.
Beaudoin, C.E., Fernandez, C., Wall, J.L., Farley, T.A., 2007. Promoting Healthy Eating and Physical Activity: Short-Term Effects of a Mass Media Campaign. American Journal of Preventive Medicine 32(3), 217-223.
Birch, L., 1988. Development of food acceptance patterns in the first years of life. Proceedings of the Nutrition Society 57(4), 617-624.
Burros, M., 2005, Federal Advisory Group Calls for Change in Food Marketing to Children. The New York Times, pp. C4.
Campbell, S., James, E.L., Stacey, F.G., Bowman, J., Chapman, K., Kelly, B., 2014. A mixed-method examination of food marketing directed towards children in Australian supermarkets. Health Promotion International 29(2), 267-277.
Carey, L., Shaw, D., Shiu, E., 2008. The impact of ethical concerns on family consumer decision-making. International Journal of Consumer Studies 32(5), 553–560.
Cawley, J., 2006. Markets and Childhood Obesity Policy. The Future of Children 16(1), 69-88.
CDC, 2009. How is childhood overweight and obesity measured? Cole, T., Bellizzi , M., Flegal, K., Dietz, W., 2000. Establishing a standard definition
for child overweight and obesity worldwide: international survey. BMJ 320(7244), 1240-1243.
Cole, T.J., Flegal, K.M., Nicholls, D., Jackson, A.A., 2007. Body mass index cut offs to define thinness in children and adolescents: international survey. British Medical Journal 335(7612), 194-197.
Cook, D.T., 2003. Spatial biographies of children’s consumption. Journal of Consumer Culture 3(2), 147–169.
Cross-Government Obesity Unit, 2008. Healthy weight, healthy lives: a cross government strategy for England, Department of Health and Department of Children Schools and Families.
Dong, D., Lin, B.-H., 2009. Fruit and vegetable consumption by low-income americans: Would a price reduction make a difference? Economic Research Report 70, U.S. Dept. of Agriculture, Economic Research Service, Washington, D.C.
Epstein, L., Dearing, K., Handley, E., Roemmich, J., Paluch, R., 2006. Relationship of mother and child food purchases as a function of price: a pilot study. Appetite 47(1), 115-118.
Epstein, L., Dearing, K., Paluch, R., Roemmich, J., Cho, D., 2007. Price and maternal obesity influence purchasing of low- and high-energy-dense foods. American Journal of Clinical Nutrition 86(4), 914-922.

29
Epstein, L., Jankowiak, N., Nederkoorn, C., Raynor, H., French, S., Finkelstein, E., 2012. Experimental research on the relation between food price changes and food-purchasing patterns: a targeted review. American Journal of Clinical Nutrition 95(4), 789-809.
Epstein, L.H., Dearing, K.K., Roba, L.G., Finkelstein, E.A., 2010. The influence of taxes and subsidies on energy purchased in an experimental purchasing study. Psychological Science 21(3), 406-414.
Fischbacher, U., 2007. z-tree: Zurich toolbox for ready-made economic experiments. Experimental Economics 10(2), 171-178.
Fletcher, J.M., Frisvold, D.E., Tefft, N., 2010. The effects of soft drink taxes on child and adolescent consumption and weight outcomes. Journal of Public Economics 94(11-12), 967-974.
French, S., A, Jeffery, R., W, Story, M., Breitlow, K., K, Baxter, J., S, Hannan, P., Snyder, M., P, 2001. Pricing and promotion effects on low-fat vending snack purchases: the CHIPS Study. American Journal of Public Health 91(1), 112-117.
French, S.A., 2003. Pricing Effects on Food Choices. Journal of Nutrition 133(3), 841S-843S.
French, S.A., Lin, B.-H., Guthrie, J.F., 2003. National trends in soft drink consumption among children and adolescents age 6 to 17 years: Prevalence, amounts, and sources, 1977/1978 to 1994/1998. Journal of the American Dietetic Association 103(10), 1326-1331.
Goldman, D.P., Lakdawalla, D., Zheng, Y., 2011. Food Prices and the Dynamics of Body Weight. In: M. Grossman, N.H. Mocan (Eds.). Economic Aspects of Obesity. University of Chicago Press, 65 - 90.
Gunter, B., Furnham, A., 1999. Children as Consumers: A Psychological Analysis of the Young People’s Market. Routledge, London.
Hannan, P., French, S., Story, M., Fulkerson, J., 2002. A pricing strategy to promote sales of lower fat foods in high school cafeterias: acceptability and sensitivity analysis. American Journal of Health Promotion 17(1), 1-6.
Hensher, D.A., Greene, W.H., 2003. The Mixed Logit model: The state of practice. Transportation 30(2), 133-176
Hensher, D.A., Rose, J.M., Greene, W.H., 2005. Applied Choice Analysis: A Primer. Cambridge: Cambridge University
Hilton, D., Charalambides, L., Demarque, C., Waroquier, L., Raux, C., 2014. A tax can nudge: The impact of an environmentally motivated bonus/malus fiscal system on transport preferences. JOurnal of Economic Phychology 42(C), 19-29.
Johnson, J.P., Myatt, D.P., 2006. On the Simple Economics of Advertising, Marketing, and Product Design. The American Economic Review 96(3), 756-784.
Kapferer, J.-N., 1985. Réfléchissez au nom de votre societé. Harvard L`Expansion nº38, 104-118.
Kelder, S.H., Perry, C.L., Klepp, K.I., Lytle, L.L., 1994. Longitudinal tracking of adolescent smoking, physical activity, and food choice behaviors. American Journal of Public Health 84(7), 1121-1126.
Lewis, G., 2011. Asymmetric Information, Adverse Selection and Online Disclosure: The Case of eBay Motors The American Economic Review 101(4), 1535-1546.

30
Lien, N., Lytle, L., Klepp, K., 2001. Stability in Consumption of Fruit, Vegetables and Sugary Foods in a Cohort from Age 14 to Age 21. Preventive Medicine 33(3), 217-226.
Louviere, J., Street, D., 2000. Stated-preference methods. In: D. Hensher, K. Button (Eds.). Handbook of Transport Modelling. Elsevier, Amsterdam, 132-143.
Maes, L., Cauwenberghe, E.V., Lippevelde, W.V., Spittaels, H., Pauw, E.D., Oppert, J.-M., Lenthe, F.J.V., Brug, J., Bourdeaudhuij, I.D., 2012. Effectiveness of workplace interventions in Europe promoting healthy eating: a systematic review. European Journal of Public Health 22(5), 677-683
McFadden, D., Train, K., 2000. Mixed MNL models for discrete response. Journal of Applied Econometrics 15(5), 447–470.
McNeal, J.U., Mindy, J.F., 2003. Children’s visual memory of packaging. Journal of Consumer Marketing 20(5), 400–427.
Mytton, O.T., Clarke, D., Rayner, M., 2012. Taxing unhealthy food and drinks to improve health. British Medical Journal 344:e2931.
Nederkoorn, C., Havermans, R., Giesen, J., Jansen, A., 2011. High tax on high energy dense foods and its effects on the purchase of calories in a supermarket. An experiment. Appetite 56(3), 760-765.
New York City Department of Health and Mental Hygiene, 2008. Board of health votes to require chain restaurants to display calorie information in New York City. Available at: www.nyc.gov/html/doh/html/pr2008/pr008-08.shtml, Accessed November 7, 2013.
Nicholls, A.J., Cullen, P., 2004. The child-parent purchase relationship:'pester power', human rights and retail ethics. Journal of Retailing and Consumer Services 11(2), 75-86.
OECD, 2012. http://www.oecd.org/health/49716427.pdf Powell, L.M., Chaloupka, F., 2009. Food prices and obesity: evidence and policy
implications for taxes and subsidies. Milbank Quarterly 87(1), 229–257. Rao, M., Afshin, A., Singh, G., Mozaffarian, D., 2013. Do healthier foods and diet
patterns cost more than less healthy options? A systematic review and meta-analysis. BMJ Open. 3(12), e004277.
Reger, B., Wootan, M., Booth-Butterfield, S., 1999. Using mass media to promote healthy eating: a community-based demonstration project. Preventive Medicine 29(5), 414–421.
Resnicow, K., Smith, M., Baranowski, T., Baranowski, J., Vaughan, R., Davis, M., 1988. 2-year tracking of children's fruit and vegetable intake. Journal of the American Dietetic Association 98(7), 785-789.
Richard, J.-F., 1990. La notion de représentation et les formes de représentations. In: C. Bonnet, R. Ghiglione, J-F. Richard (Eds.). Traité de Psychologie Cognitive: Le traitement de l’information symbolique, Paris: Dunod.
Rossiter, J.R., 1976. Visual and verbal memory in children's product information utilization. In: B.B. Anderson (Ed.). Advances in Consumer Research: Volume 4, Cincinnati, Ohio: Association for Consumer Research, 523-527
Singer, M.R., Moore, L.L., Garrahie, E.J., Ellison, R.C., 1995. The tracking of nutrient intake in young children: the Framingham Children's Study. American Journal of Public Health 85(12), 1673-1677.
Spungin, P., 2004. Parent power, not pester power. Young Consumers 5(3), 37-40. Tadelis, S., Zettelmeyer, F., 2011. Information Disclosure as a Matching Mechanism:
Theory and Evidence from a Field Experiment. Working papers SSRN: http://ssrn.com/abstract=1872465.

31
The European Food Information Council (EUFIC), 2005. The Determinants of Food Choice. EUFIC Review 04/2005, EUFIC.
Thow, A., Jan, S., Leeder, S., Swinburn, B., 2010. The effect of fiscal policy on diet, obesity and chronic disease: a systematic review. Bulletin of the World Health Organization 88(8), 609-614.
Train, K., 2003. Discrete Choice Methods with Simulation Cambridge: Cambridge University Press.
Waterlander, W., Steenhuis, I., De Boer, M., Schuit, A., Seidel, K.D., 2012. Introducing taxes, subsidies or both: The effects of various food pricing strategies in a web-based supermarket randomized trial. Preventive Medicine 54(5), 323–330.
WHO, 1995. Physical Status: The use and interpretation of anthropometry. Technical Report Series No. 854, Geneva.

32
Appendix A: Full list of choice tasks
Price of unhealthier alternative
Price of healthier
alternative
No-Buy Alternative
Product category
Choice task 1: 1.3 1.3 None of these
Choco Milk Beverage
Choice task 2: 1.62 1.3 None of these
Choice task 3: 1.3 0.98 None of these
Choice task 4: 1.62 0.98 None of these
Choice task 5: 2 2 None of these
Cheese Choice task 6: 2.5 2 None of these
Choice task 7: 2 1.5 None of these
Choice task 8: 2.5 1.5 None of these
Choice task 9: 1 1 None of these
Yogurt Choice task 10: 1.25 1 None of these
Choice task 11: 1 0.75 None of these
Choice task 12: 1.25 0.75 None of these
Choice task 13: 1.5 1.5 None of these
Decoy Markers
Choice task 14: 1.5 1.5 None of these
Choice task 15: 1.5 1.5 None of these
Choice task 16: 1.5 1.5 None of these Choice task 17: 1.2 1.2 None of these
Decoy Pencils
Choice task 18: 1.2 1.2 None of these
Choice task 19: 1.2 1.2 None of these
Choice task 20: 1.2 1.2 None of these
33
Appendix B: Experimental Instructions
[This is an English translation of the original instructions written in Greek. Text in
brackets was not shown to subjects.]
Thank you for taking the time to participate in this survey. This study is a preference
survey for snack and stationery products for children.
Υou have been randomly assigned a participant identity number (ID). You will use
this ID to identify yourself. The ID must be written on the computer screen and on all
papers handed in today. All information collected is strictly confidential and will only
be used for this specific project.
Your participation fee is 30€. You will receive a voucher with a value of 30€. The
voucher can be exchanged for money when you have completed all parts of the study.
During the study, you will be able to make real purchases if you wish to. I will give
you more details on this part later on. The cost of any purchases you make will be
deducted from the 30€ participation fee.
If you have any questions, you may ask the moderator.
[Depending on the treatment, the experimenter enters the computer lab with the parent
only or with the parent and the child together. Children that are not participating in the
real choice experiment in treatments 1 and 3 spend their time in the lobby of the
computer lab within eye-contact distance from their parents. These children can watch
cartoons or draw using paper and pencils.]
The first thing I want you to do is to examine all the products in this product display.
You can see 5 product categories: milk drink, cheese, yogurt, pencils and markers. As
you can see, the products within a product category are of the same size and of the
same brand.

34
[For treatments 2 and 4, for which fiscal policy information was made available, the
following paragraph was read to the participants while they were examining the
products:]
“As you can see, there are five product categories, and each category has two products
of the same size and brand but with different fat and sugar ingredient content. Now
imagine that the health minister makes the following announcement in the mass
media: Due to the alarming obesity prevalence rates among children in our country,
we decided to apply the following food fiscal policies on dairy products that are
commonly consumed by children. Beginning next week, we will impose 3 different
fiscal policies. The first, which is called the fat tax, will increase the price of the
product that is considered unhealthier by 25%; the second, which is called the
subsidy, will decrease the price of healthier products by 25%; and the third will
combine a fat tax with a subsidy, i.e., there will be a simultaneous increase in the
price of the unhealthier product of 25% and a 25% decrease in the price of the
healthier product.]
[Subject is then seated in front of a computer]
The products that were on display are going to appear on your screen in dyads. In
total, you will go through 20 choice tasks. Between tasks, different products will
appear, but you might also see the same products at various price levels. In each
choice task, you can choose between any of the two products, or you can choose the
no-buy option by selecting the “none of these” alternative.
When you complete all choice tasks, one of the choice tasks will be randomly selected
as a binding task, and you will have to purchase the product/alternative that you chose
in this choice task. The price of the purchased product will be deducted from your
participation fee. If you chose the “none of these” option in the binding choice task,
you will not purchase any product, and the full participation fee will be given to you.
The random draw for the binding task will be performed in front of you using this jar.
The jar contains folded papers listing numbers from one to twenty (as many as the
choice tasks). That is, each choice task has a one-out-of-twenty chance (5%) of being

35
binding. More importantly, all tasks are equally likely to be selected as binding.
Today, you will purchase at most one product. The purchased product will be given to
your child to be consumed while you participate in the second part of this survey,
which is a socio-demographic questionnaire.
Are there any questions?
[If there are no questions, the experimenter proceeds with starting the computerized
treatment, and the subject is instructed to proceed with the choice task.]

36
Appendix C: Manipulation Check Questionnaire
1. Did you enjoy participating?
2. Were you bored at any point?
3. Do you have an idea about what was the purpose of the experiment?
4. Did you choose based on the information provided to you at the beginning of the
experiment?
5. Did you respond based on what you think the experimenter wanted from you
because you think that the experimenter could see your answers?

37
Appendix D: Example decision tasks for the market price treatment.
[This is an English version of the original screens that appeared in Greek for the
market price treatment. Similar screens were displayed for the fat tax, subsidy and
both treatments with appropriate price adjustments.]
Choice Task 1
Price: 1.3€
Choose the left choice Choose the right choice
None of these
Confirm
Price: 1.3€
Choice Task 2
Price: 1€
Choose the left choice Choose the right choice
None of these
Confirm
Price: 1€
Choice Task 3
Price: 2€
Choose the left choice Choose the right choice
None of these
Confirm
Price: 2€

38
Choice Task 4
Price: 1.5€
Choose the left choice Choose the right choice
None of these
Confirm
Price: 1.5€
Choice Task 5
Price: 1.2€
Choose the left choice Choose the right choice
None of these
Confirm
Price: 1.2€