faculty salary analysis prepared for utk faculty senate
TRANSCRIPT

Faculty Salary Analysisprepared forUTK Faculty Senate
PREPARED BY K. BAKER AND L. J. GROSS FOR THE FACULTY SENATE
BUDGET AND PLANNING COMMITTEE – MARCH 2018
Objectives:
1. Provide a comparison of average faculty salaries for units and ranks across UTK faculty, along with salary ranges.
2. Provide a comparison of average faculty salaries at UTK to appropriate peer groups.
3. Provide a historical comparison of average salaries to UTK peer groups
Take-Homes from Last year:1. There has been considerable progress across much of UTK towards having faculty salaries that are
comparable to those at Top 25 institutions.
2. The progress has been very heterogeneous across UTK with some units/ranks advancing a great deal in this metric and others falling further behind.
3. The causes of the heterogeneity are not clear, given the consistency of salary enhancements across UTK over the past 10 years, nor is it clear whether the heterogeneity was intentional or not
Data at a GlanceCollege Cost to Ratio
Department increase to UTK Avg to
Rank Average Number Minimum Maximum Average Number Minimum Maximum RU/VH Avg RU/VH Avg
Agricultural Sciences & Natural Resources
Total
Professor 108,814 59 78,940 177,451 125,579 3,962 57,400 298,560 801,854 0.87
Associate Professor 82,623 23 67,774 96,601 91,985 1,867 47,338 168,129 179,379 0.90
Assistant Professor 70,851 25 61,364 78,122 79,969 1,964 40,000 142,114 192,846 0.89
All Ranks 94,315 107 106,036 7,793 1,174,079 0.89
Agricultural and Resource Economics
Professor 106,166 6 89,973 119,392 146,406 504 70,407 257,274 241,440 0.73
Associate Professor 82,189 1 82,189 82,189 103,704 180 60,092 167,197 21,515 0.79
Assistant Professor 72,075 3 69,599 75,483 89,505 211 51,113 142,114 52,290 0.81
All Ranks 93,541 10 124,403 895 315,245 0.75
UTK R1: Doctoral-Highest Research
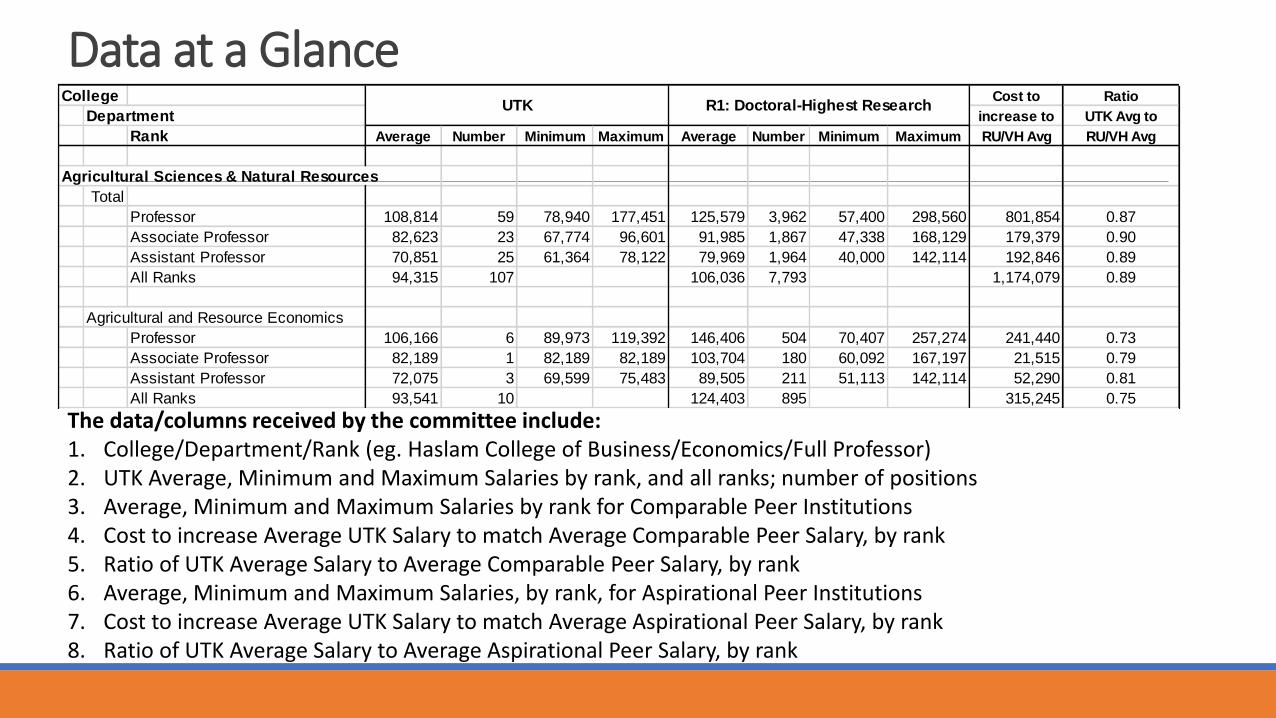
The data/columns received by the committee include:1. College/Department/Rank (eg. Haslam College of Business/Economics/Full Professor)2. UTK Average, Minimum and Maximum Salaries by rank, and all ranks; number of positions3. Average, Minimum and Maximum Salaries by rank for Comparable Peer Institutions4. Cost to increase Average UTK Salary to match Average Comparable Peer Salary, by rank5. Ratio of UTK Average Salary to Average Comparable Peer Salary, by rank6. Average, Minimum and Maximum Salaries, by rank, for Aspirational Peer Institutions7. Cost to increase Average UTK Salary to match Average Aspirational Peer Salary, by rank8. Ratio of UTK Average Salary to Average Aspirational Peer Salary, by rank
Data at a Glance
College Cost to Ratio
Department increase to UTK Avg to
Rank Average Number Minimum Maximum Average Number Minimum Maximum RU/VH Avg RU/VH Avg
Agricultural Sciences & Natural Resources
Total
Professor 108,814 59 78,940 177,451 125,579 3,962 57,400 298,560 801,854 0.87
Associate Professor 82,623 23 67,774 96,601 91,985 1,867 47,338 168,129 179,379 0.90
Assistant Professor 70,851 25 61,364 78,122 79,969 1,964 40,000 142,114 192,846 0.89
All Ranks 94,315 107 106,036 7,793 1,174,079 0.89
Agricultural and Resource Economics
Professor 106,166 6 89,973 119,392 146,406 504 70,407 257,274 241,440 0.73
Associate Professor 82,189 1 82,189 82,189 103,704 180 60,092 167,197 21,515 0.79
Assistant Professor 72,075 3 69,599 75,483 89,505 211 51,113 142,114 52,290 0.81
All Ranks 93,541 10 124,403 895 315,245 0.75
UTK R1: Doctoral-Highest ResearchCost to Ratio Cost to Ratio
increase to UTK Avg to increase to UTK Avg to
Average Number Minimum Maximum Comp Avg Comp Avg Average Number Minimum Maximum Aspr P Avg Aspr Avg
114,746 1,007 61,509 258,211 440,009 0.95 124,637 1,023 67,895 298,560 1,015,501 0.87
86,660 506 48,684 142,100 98,748 0.95 96,929 447 55,482 167,197 335,644 0.85
78,587 421 50,319 120,000 177,139 0.90 83,398 511 43,860 123,944 324,376 0.85
99,527 1,934 715,896 0.95 107,747 1,981 1,675,521 0.88
130,502 65 79,558 257,274 146,016 0.81 131,890 61 70,407 241,577 154,344 0.80
96,837 25 63,235 135,000 14,648 0.85 113,186 27 73,646 167,197 30,997 0.73
87,441 34 52,160 120,000 46,098 0.82 91,494 26 69,539 123,944 58,257 0.79
111,908 124 206,762 0.84 118,247 114 243,598 0.79
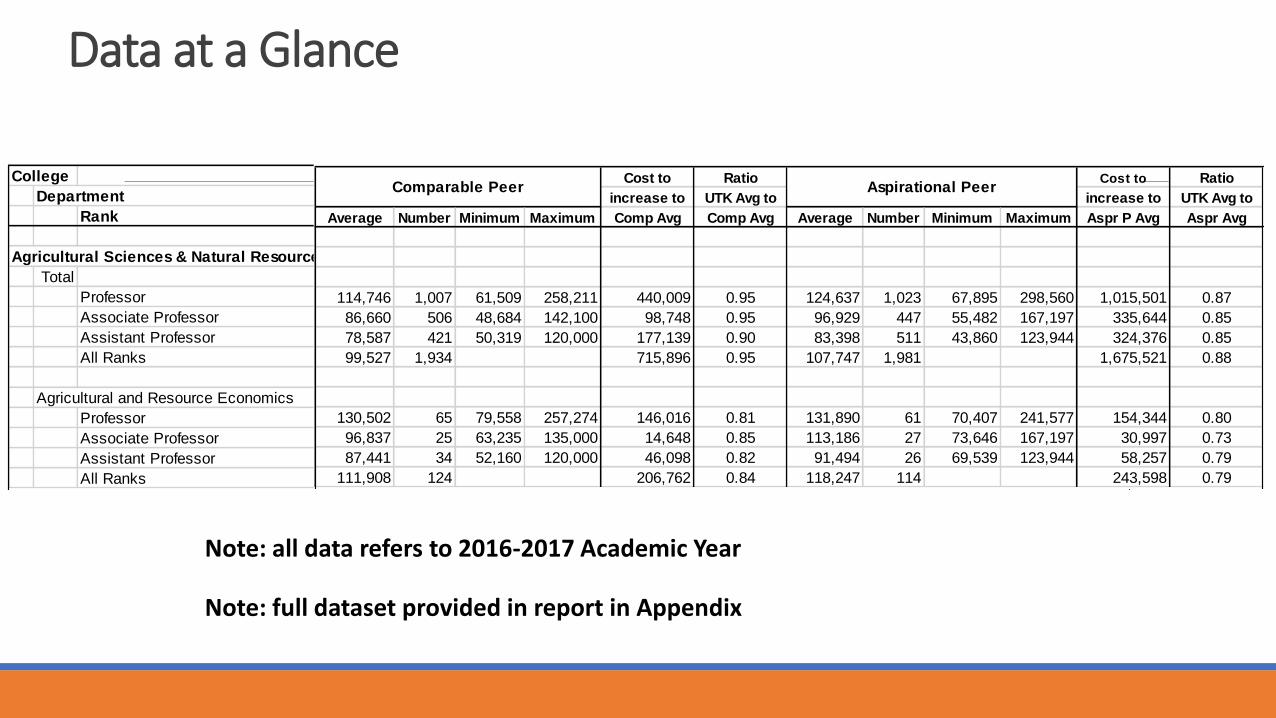
Comparable Peer Aspirational Peer
Note: all data refers to 2016-2017 Academic Year
Note: full dataset provided in report in Appendix
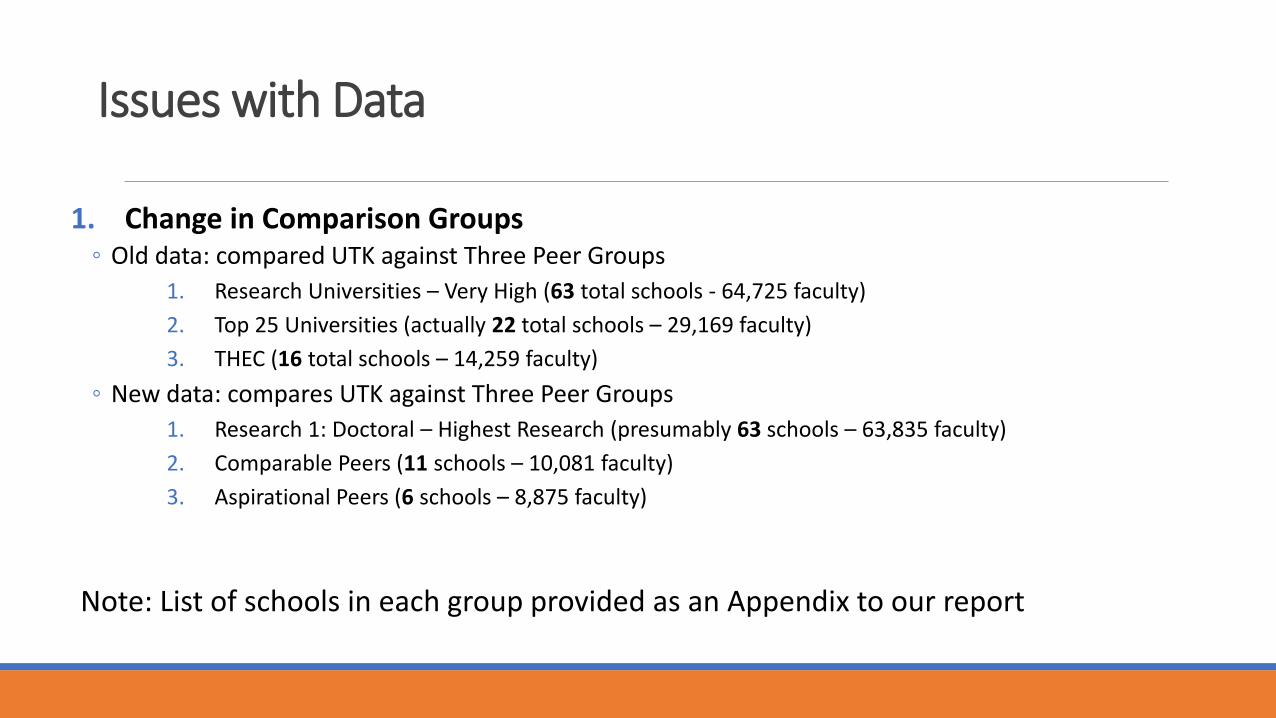
Issues with Data
1. Change in Comparison Groups◦ Old data: compared UTK against Three Peer Groups
1. Research Universities – Very High (63 total schools - 64,725 faculty)
2. Top 25 Universities (actually 22 total schools – 29,169 faculty)
3. THEC (16 total schools – 14,259 faculty)
◦ New data: compares UTK against Three Peer Groups
1. Research 1: Doctoral – Highest Research (presumably 63 schools – 63,835 faculty)
2. Comparable Peers (11 schools – 10,081 faculty)
3. Aspirational Peers (6 schools – 8,875 faculty)
Note: List of schools in each group provided as an Appendix to our report
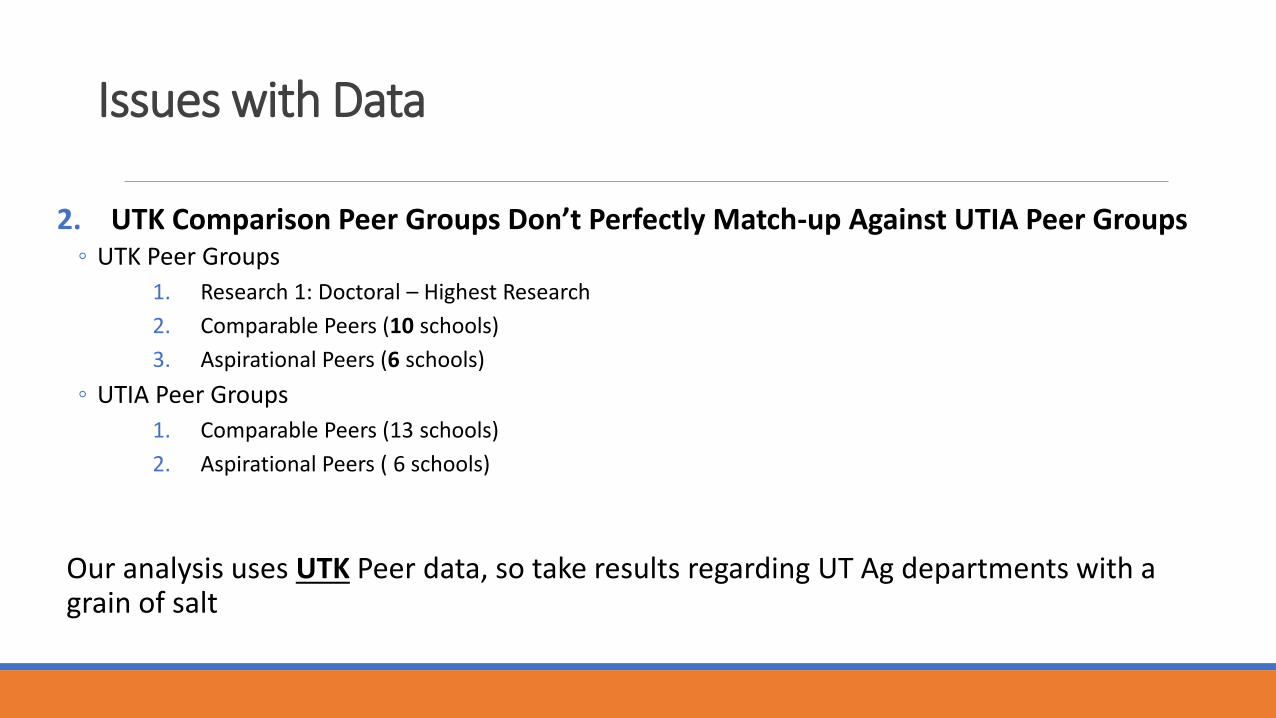
Issues with Data
2. UTK Comparison Peer Groups Don’t Perfectly Match-up Against UTIA Peer Groups◦ UTK Peer Groups
1. Research 1: Doctoral – Highest Research
2. Comparable Peers (10 schools)
3. Aspirational Peers (6 schools)
◦ UTIA Peer Groups
1. Comparable Peers (13 schools)
2. Aspirational Peers ( 6 schools)
Our analysis uses UTK Peer data, so take results regarding UT Ag departments with a grain of salt
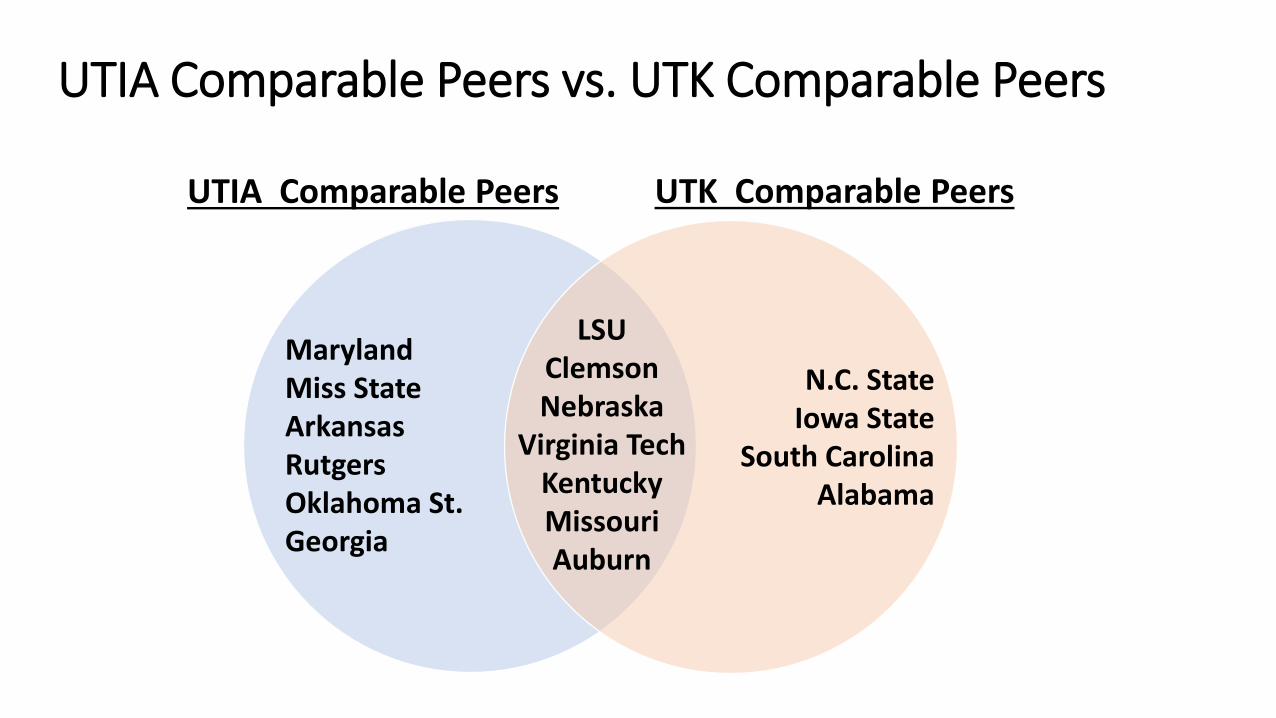
UTIA Comparable Peers vs. UTK Comparable Peers
LSUClemsonNebraska
Virginia TechKentuckyMissouriAuburn
MarylandMiss StateArkansasRutgersOklahoma St.Georgia
N.C. StateIowa State
South CarolinaAlabama
UTIA Comparable Peers UTK Comparable Peers
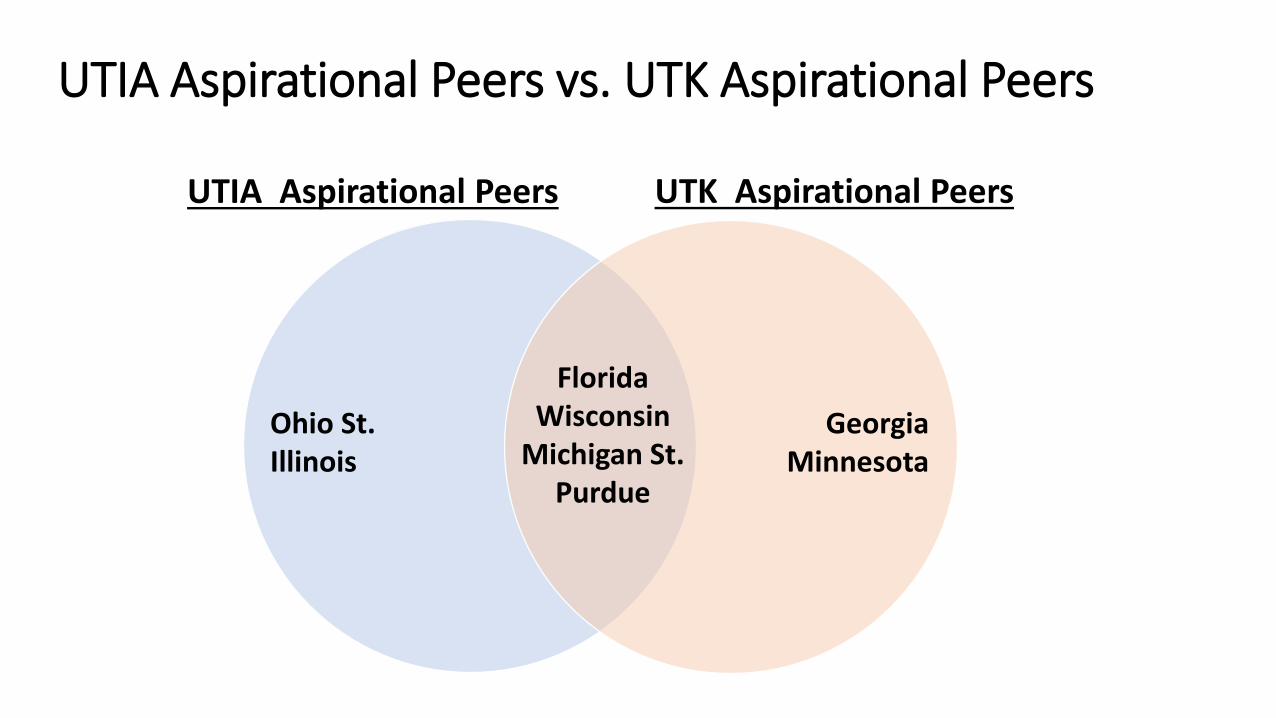
UTIA Aspirational Peers vs. UTK Aspirational Peers
FloridaWisconsin
Michigan St.Purdue
Ohio St.Illinois
GeorgiaMinnesota
UTIA Aspirational Peers UTK Aspirational Peers
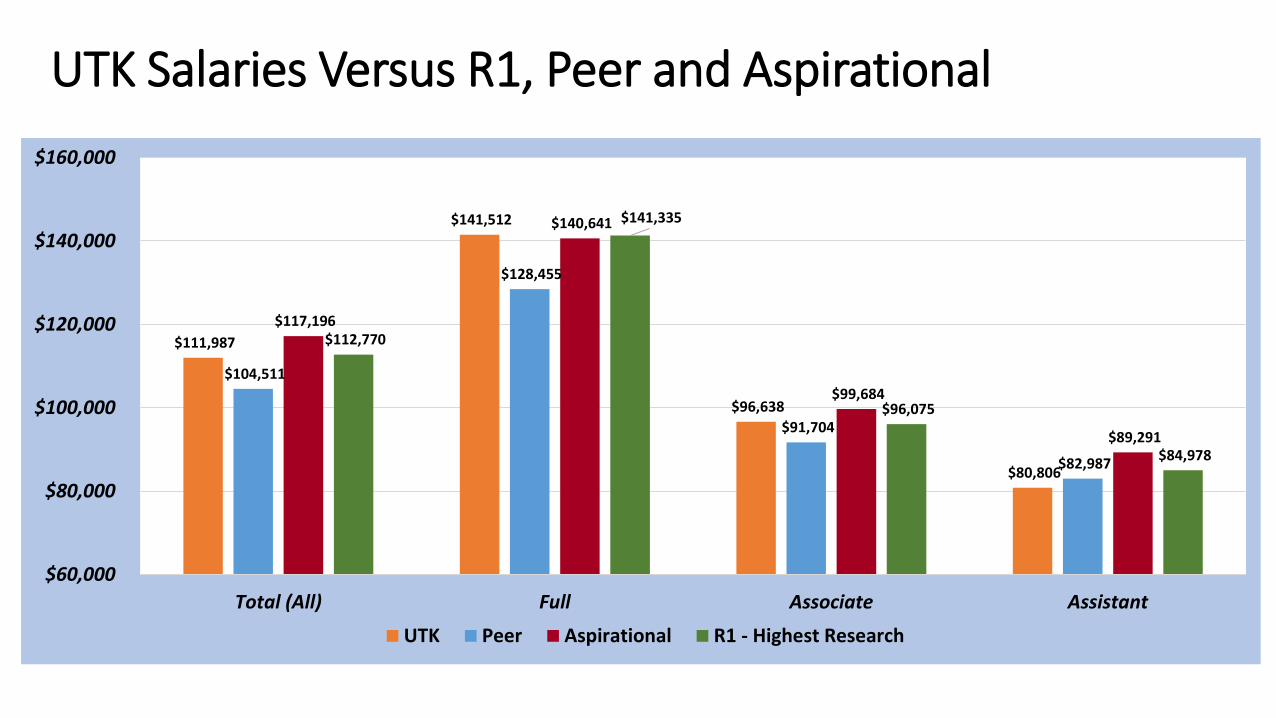
UTK Salaries Versus R1, Peer and Aspirational
$111,987
$141,512
$96,638
$80,806
$104,511
$128,455
$91,704
$82,987
$117,196
$140,641
$99,684
$89,291
$112,770
$141,335
$96,075
$84,978
$60,000
$80,000
$100,000
$120,000
$140,000
$160,000
Total (All) Full Associate Assistant
UTK Peer Aspirational R1 - Highest Research
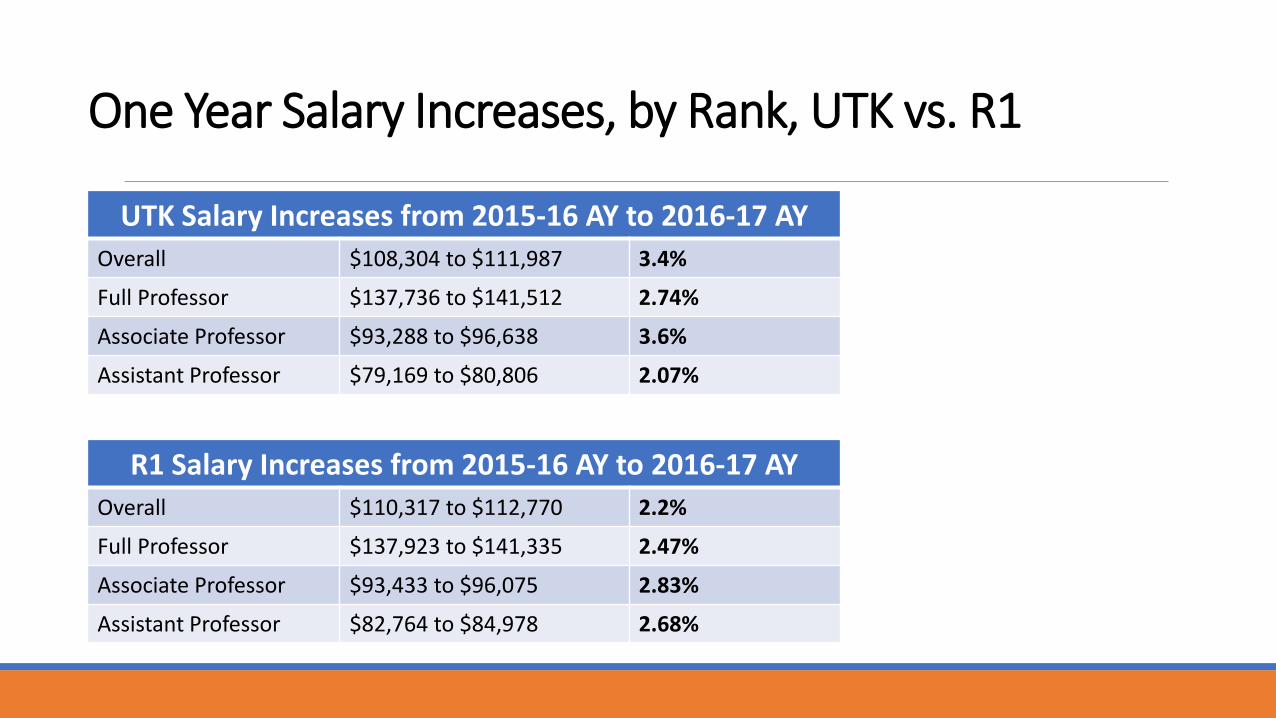
One Year Salary Increases, by Rank, UTK vs. R1
UTK Salary Increases from 2015-16 AY to 2016-17 AY
Overall $108,304 to $111,987 3.4%
Full Professor $137,736 to $141,512 2.74%
Associate Professor $93,288 to $96,638 3.6%
Assistant Professor $79,169 to $80,806 2.07%
R1 Salary Increases from 2015-16 AY to 2016-17 AY
Overall $110,317 to $112,770 2.2%
Full Professor $137,923 to $141,335 2.47%
Associate Professor $93,433 to $96,075 2.83%
Assistant Professor $82,764 to $84,978 2.68%
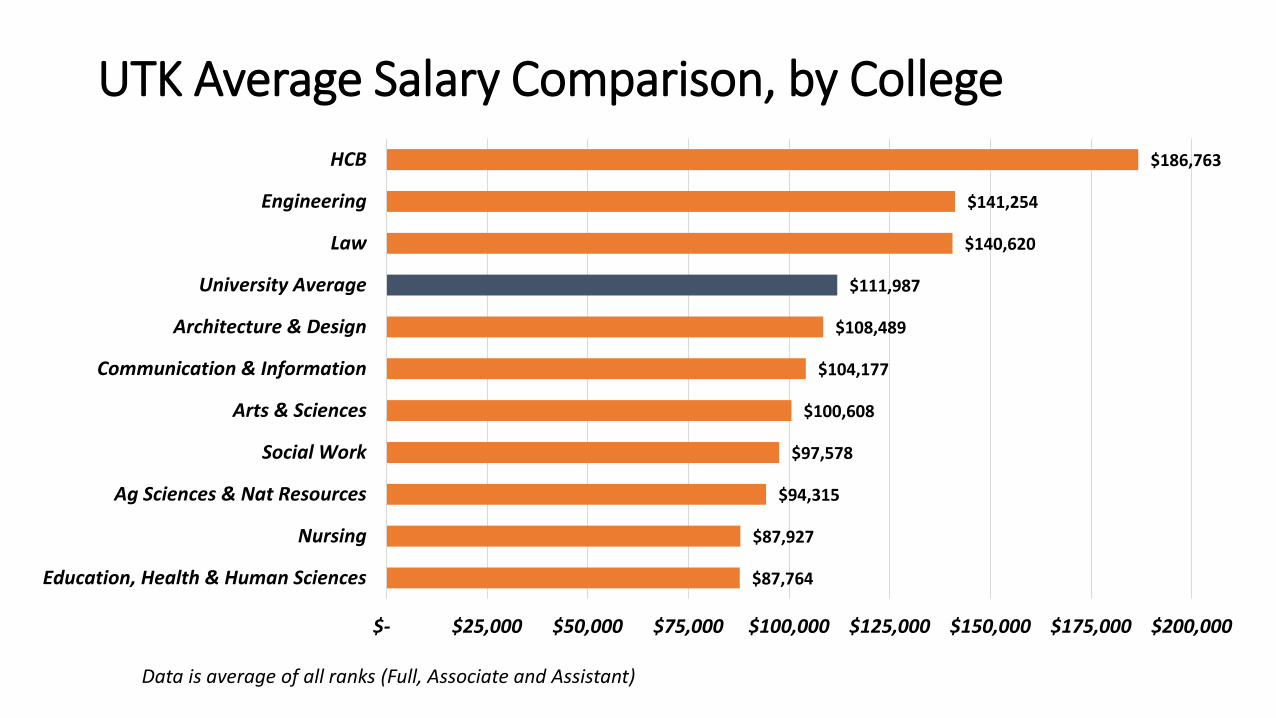
UTK Average Salary Comparison, by College
$87,764
$87,927
$94,315
$97,578
$100,608
$104,177
$108,489
$111,987
$140,620
$141,254
$186,763
$- $25,000 $50,000 $75,000 $100,000 $125,000 $150,000 $175,000 $200,000
Education, Health & Human Sciences
Nursing
Ag Sciences & Nat Resources
Social Work
Arts & Sciences
Communication & Information
Architecture & Design
University Average
Law
Engineering
HCB
Data is average of all ranks (Full, Associate and Assistant)
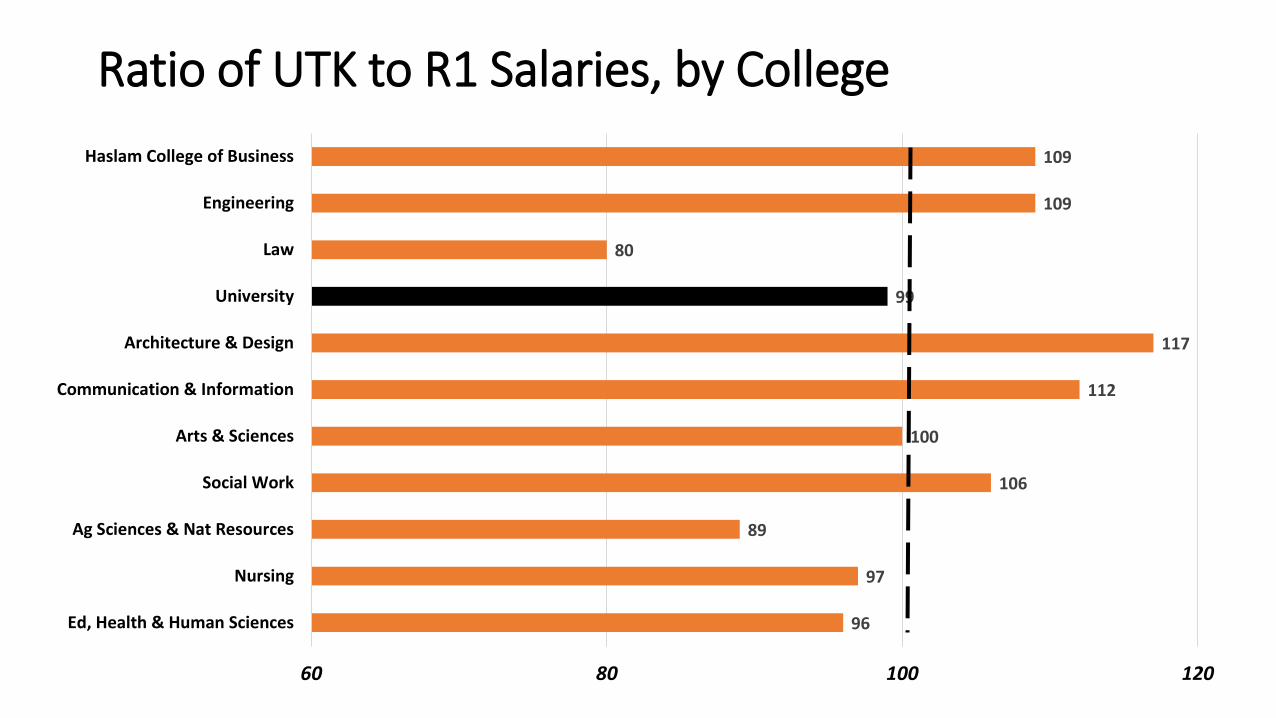
Ratio of UTK to R1 Salaries, by College
96
97
89
106
100
112
117
99
80
109
109
60 80 100 120
Ed, Health & Human Sciences
Nursing
Ag Sciences & Nat Resources
Social Work
Arts & Sciences
Communication & Information
Architecture & Design
University
Law
Engineering
Haslam College of Business
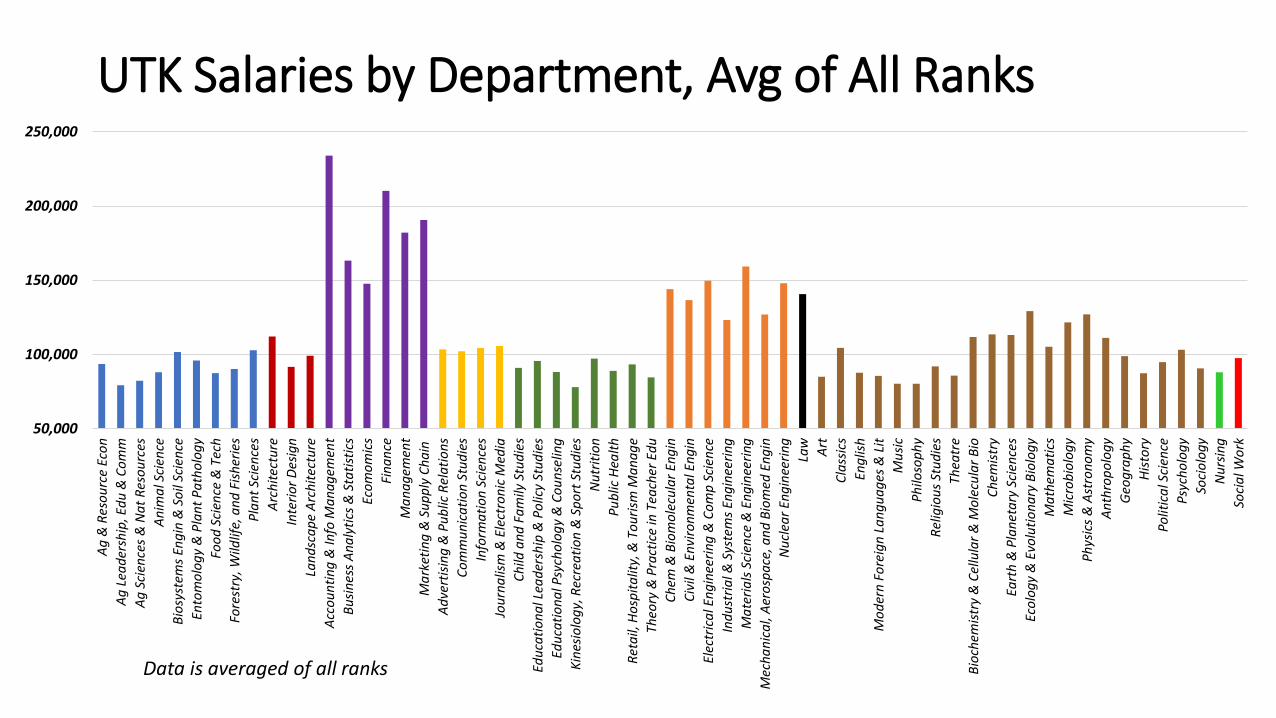
UTK Salaries by Department, Avg of All Ranks
50,000
100,000
150,000
200,000
250,000
Ag
& R
eso
urc
e Ec
on
Ag
Lea
der
ship
, Ed
u &
Co
mm
Ag
Sci
ence
s &
Na
t R
eso
urc
es
An
ima
l Sci
ence
Bio
syst
ems
Eng
in &
So
il Sc
ien
ce
Ento
mo
log
y &
Pla
nt
Pa
tho
log
y
Foo
d S
cien
ce &
Tec
h
Fore
stry
, Wild
life,
an
d F
ish
erie
s
Pla
nt
Scie
nce
s
Arc
hit
ectu
re
Inte
rio
r D
esig
n
Lan
dsc
ap
e A
rch
itec
ture
Acc
ou
nti
ng
& In
fo M
an
ag
emen
t
Bu
sin
ess
An
aly
tics
& S
tati
stic
s
Eco
mo
mic
s
Fin
an
ce
Ma
na
gem
ent
Ma
rket
ing
& S
up
ply
Ch
ain
Ad
vert
isin
g &
Pu
blic
Rel
ati
on
s
Co
mm
un
ica
tio
n S
tud
ies
Info
rma
tio
n S
cien
ces
Jou
rna
lism
& E
lect
ron
ic M
edia
Ch
ild a
nd
Fa
mily
Stu
die
s
Edu
cati
on
al L
ead
ersh
ip &
Po
licy
Stu
die
s
Edu
cati
on
al P
sych
olo
gy
& C
ou
nse
ling
Kin
esio
log
y, R
ecre
ati
on
& S
po
rt S
tud
ies
Nu
trit
ion
Pu
blic
Hea
lth
Ret
ail,
Ho
spit
alit
y, &
To
uri
sm M
an
ag
e
Theo
ry &
Pra
ctic
e in
Tea
cher
Ed
u
Ch
em &
Bio
mo
lecu
lar
Eng
in
Civ
il &
En
viro
nm
enta
l En
gin
Elec
tric
al E
ng
inee
rin
g &
Co
mp
Sci
ence
Ind
ust
ria
l & S
yste
ms
Eng
inee
rin
g
Ma
teri
als
Sci
ence
& E
ng
inee
rin
g
Mec
ha
nic
al,
Aer
osp
ace
, an
d B
iom
ed E
ng
in
Nu
clea
r En
gin
eeri
ng
Law
Art
Cla
ssic
s
Eng
lish
Mo
der
n F
ore
ign
La
ng
ua
ges
& L
it
Mu
sic
Ph
iloso
ph
y
Rel
igio
us
Stu
die
s
Thea
tre
Bio
chem
istr
y &
Cel
lula
r &
Mo
lecu
lar
Bio
Ch
emis
try
Eart
h &
Pla
net
ary
Sci
ence
s
Eco
log
y &
Evo
luti
on
ary
Bio
log
y
Ma
them
ati
cs
Mic
rob
iolo
gy
Ph
ysic
s &
Ast
ron
om
y
An
thro
po
log
y
Geo
gra
ph
y
His
tory
Po
litic
al S
cien
ce
Psy
cho
log
y
Soci
olo
gy
Nu
rsin
g
Soci
al W
ork
Data is averaged of all ranks
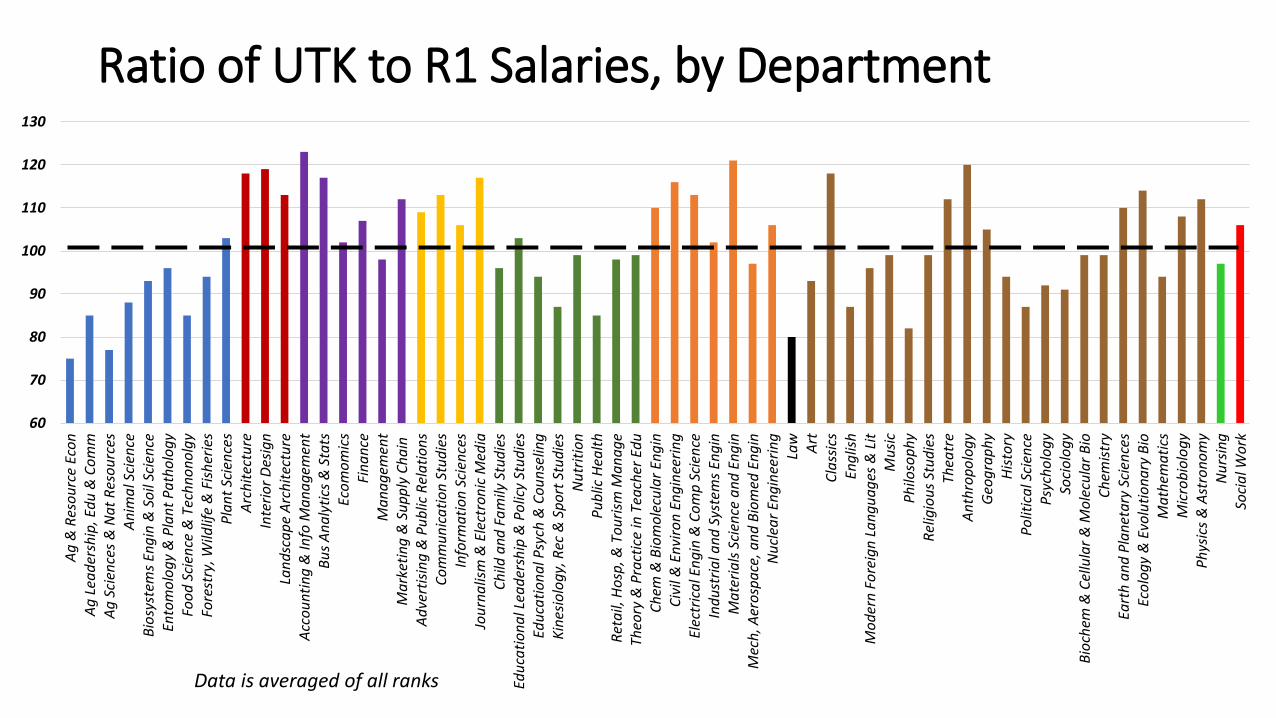
Ratio of UTK to R1 Salaries, by Department
60
70
80
90
100
110
120
130
Ag
& R
eso
urc
e Ec
on
Ag
Lea
der
ship
, Ed
u &
Co
mm
Ag
Sci
ence
s &
Na
t R
eso
urc
esA
nim
al S
cien
ceB
iosy
stem
s En
gin
& S
oil
Scie
nce
Ento
mo
log
y &
Pla
nt
Pa
tho
log
yFo
od
Sci
ence
& T
ech
no
no
lgy
Fore
stry
, Wild
life
& F
ish
erie
sP
lan
t Sc
ien
ces
Arc
hit
ectu
reIn
teri
or
Des
ign
Lan
dsc
ap
e A
rch
itec
ture
Acc
ou
nti
ng
& In
fo M
an
ag
emen
tB
us
An
aly
tics
& S
tats
Eco
mo
mic
sFi
na
nce
Ma
na
gem
ent
Ma
rket
ing
& S
up
ply
Ch
ain
Ad
vert
isin
g &
Pu
blic
Rel
ati
on
sC
om
mu
nic
ati
on
Stu
die
sIn
form
ati
on
Sci
ence
sJo
urn
alis
m &
Ele
ctro
nic
Med
iaC
hild
an
d F
am
ily S
tud
ies
Edu
cati
on
al L
ead
ersh
ip &
Po
licy
Stu
die
sEd
uca
tio
na
l Psy
ch &
Co
un
selin
gK
ines
iolo
gy,
Rec
& S
po
rt S
tud
ies
Nu
trit
ion
Pu
blic
Hea
lth
Ret
ail,
Ho
sp, &
To
uri
sm M
an
ag
eTh
eory
& P
ract
ice
in T
each
er E
du
Ch
em &
Bio
mo
lecu
lar
Eng
inC
ivil
& E
nvi
ron
En
gin
eeri
ng
Elec
tric
al E
ng
in &
Co
mp
Sci
ence
Ind
ust
ria
l an
d S
yste
ms
Eng
inM
ate
ria
ls S
cien
ce a
nd
En
gin
Mec
h, A
ero
spa
ce, a
nd
Bio
med
En
gin
Nu
clea
r En
gin
eeri
ng
Law
Art
Cla
ssic
sEn
glis
hM
od
ern
Fo
reig
n L
an
gu
ag
es &
Lit
Mu
sic
Ph
iloso
ph
yR
elig
iou
s St
ud
ies
Thea
tre
An
thro
po
log
yG
eog
rap
hy
His
tory
Po
litic
al S
cien
ceP
sych
olo
gy
Soci
olo
gy
Bio
chem
& C
ellu
lar
& M
ole
cula
r B
ioC
hem
istr
yEa
rth
an
d P
lan
eta
ry S
cien
ces
Eco
log
y &
Evo
luti
on
ary
Bio
Ma
them
ati
csM
icro
bio
log
yP
hys
ics
& A
stro
no
my
Nu
rsin
gSo
cia
l Wo
rk
Data is averaged of all ranks
Take-Homes:• The change in peer groups from those used in previous years is of concern due to the
great reduction in number of comparison institutions, associated large reduction in number of faculty in the comparison groups, and the biases inherent in making unit/rank comparisons using such limited data. We recommend that for the purposes of faculty salary comparisons, the UTK administration focus on comparisons to the larger group of R1 and not on the “officially designated” peer groups.
• The overall average salary of UTK faculty has significantly improved over the past decade, relative to R1, and this improvement continued over the past year during which the average UTK salary increased by 3.4% and the overall R1 average salary increased by 2.2%.
• There is tremendous variation across UTK in how different Colleges and Departments compare to R1 peers. Whether the heterogeneity of progress over the past was planned or unintentional is not clear. While lifting average salaries for every unit relative to peer institutions may have been a goal, in the metrics analyzed here it has not been realized.