fy17 faculty salary equity analysis - executive summary
TRANSCRIPT

PURPOSE
Institutional Research, Planning and
Effectiveness conducts the Salary
Equity Study annually to assess
potential salary differences by
gender or minority status for CSU
tenured and tenure-track faculty. It
is just one of many salary studies
completed throughout the year. It
is not intended to assess the salary
of any individual faculty.
METHODOLOGY
Two regression models at each rank
(one for gender and one for
minority status) are used. They were
developed, by the Salary Equity
Committee for use from FY17
through FY19.
VARIABLES
Dependent
The models use a logarithm of the 9-
month salary as the dependent variable.
The salaries for 12-month contracts are
converted at 0.75 for standardization.
Independent
Gender
Minority Status
Years in Rank
Department
The full salary equity results can be accessed online at: http://www.ir.colostate.edu/data-reports/faculty/salary-equity/
FY19 Faculty Salary Equity StudyExecutive Summary
FY19 single year analysis, key findings: No statistically significant between-group differences in salary were identified at any rank by gender or
minority status.
FY15-FY19 change over time analysis, key findings: In FY15, FY16 and FY17, the salary gap for female Full Professors was statistically significant but has narrowed
and is no longer statistically significant. In FY15, female Full Professors earned 92.2% of what their male
colleagues earned; by FY19, this increased to 97%.
Over the last five years, there were no statistically significant differences in salary by gender for Assistant or
Associate Professors
In FY16 and FY17, the salary gap for minority Associate Professors was statistically significant but has narrowed
and is no longer statistically significant. In FY17, minority Associate Professors earned 94.6% of what their non-
minority colleagues earned; by FY19, this increased to 98.9%.
Over the last five years, there were no statistically significant differences in salary by minority status for
Assistant or Full Professors

FY19 Faculty Salary Equity Analysis
Contents
Background .......................................................................................................... 1
Methodology ......................................................................................................... 1
Population ........................................................................................................... 1
Data Fidelity ........................................................................................................ 1
Dependent Variable ............................................................................................ 1
Independent Variables ........................................................................................ 1
Analysis Technique .............................................................................. 1
FY19 Results ................................................................................................ 3
Trends Over Time ........................................................................................ 7
Discussion ............................................................................................... 8
Appendix A Regression Models .................................................................... 9
Appendix B ................................................................................................ 20

FY19 Faculty Salary Equity Analysis 1
Background In the summer of 2015, with the full involvement of the President’s Commission on Women and Gender Equity (PCWGE), the Standing Committee on the Status of Women Faculty (SCSWF) and Faculty Council, a Salary Equity Committee was formed to look at salary equity issues, including best practices and an equitable salary model for use through FY19. In addition to members of the PCWGE and SCSWF, the Committee included experts both internal and external to CSU, including representatives from CSU’s Office of
Human Resources (HR); the Office of Institutional Research, Planning and Effectiveness (IRP&E); and faculty members with subject matter expertise. Using the methodology selected by the Committee, the current analysis assesses the association of gender and minority status with tenured and tenure- track faculty salaries at CSU. A separate report about the Committee’s process is available on the IRP&E web site.
It is important to note that, although the models reflect best practices in the analysis of salary equity, there is
unexplained variance. Therefore, any between-group differences by gender or minority status do not confirm the existence or absence of salary inequities; as discussed at length by the Committee, there are many potential reasons for group differences.
The models do not address the salary of any specific individual faculty member. The assessment of individual salary equity is completed through a separate exercise in which in-depth attempts are made to understand individual performance and salary. That exercise is completed annually.
Methodology
Population
Tenured and tenure-track faculty with active appointments in academic departments or the Library are included for the current analysis.
Faculty on transitional appointments are excluded; those on sabbatical are included. Department Heads are included. Assistant Deans, Associate Deans and Deans are excluded from the population as is one faculty member who also serves as a Senior Associate Athletic Director.
Data Fidelity In preparation for this analysis, multiple efforts were made to address data fidelity. Faculty were invited to review their demographic data through the self-service HR application. Further, demographic data and the other independent variables included in the salary equity analysis, are accessible through an online portal hosted by IRP&E. This portal was created in response to faculty feedback in FY17. Faculty were urged to correct their data as necessary with HR or IRP&E. Additionally, Curriculum Vitae reviews
were also completed and individual faculty were contacted via phone and/or email if questions still remained (especially related to time in rank).
Dependent Variable
The dependent variable for each regression model is the logarithm of the 9-month salary. The 9-month salary is calculated for 12-month contracts at a 0.75 conversion. The standardized salaries are then subjected to a logarithmic transformation.
Independent Variables
1. Gender: Categorical (female, male)
2. Minority Status: Categorical (minority, non-minority) with minority defined as self-reported Black/ African American, Latino/a, Asian, American Indian/Alaska Native, Native Hawaiian/Pacific Islander, Two or More Races/Ethnicity. Non-minority is defined as White or Unreported.
3. Years in Current Rank (including appointments at accredited institutions prior to CSU): a. Assistant Professor years
in rank (linear) b. Associate Professor years
in rank (linear and quadratic)
c. Full Professor years in rank (linear, quadratic and cubic)
4. Department: Categorical (yes, no) for each academic department at CSU and the Library
The current models do not include any variables related to performance because of data collection and validation issues.
Analysis Technique
A separate regression model for each rank is used to assess how much salary variance is related to each of the above independent variables. The models were selected after significant deliberation of best practices in salary equity analysis at other institutions and the current availability of accurate data.
The Committee decided that insufficient counts prohibited the inclusion of an interaction effect in the statistical analysis. The gender models exclude the minority status variable and vice versa.
The relationship between the log salary (dependent variable) and years in rank (independent variable) differs by rank and is therefore represented differently.

FY19 Faculty Salary Equity Analysis
2 FY19 Faculty Salary Equity Analysis
The relationship for Assistant Professors is linear and increasing; as years in rank increase so does log salary (Appendix B, Figure 1).
The relationship for Associate Professors
is quadratic2; it increases to a point but then decreases slightly (Appendix B, Figure 2).
The relationship for Full Professors is
cubic3; it increases more quickly immediately after appointment and again in later years with a relative plateau in between (Appendix B, Figure 3).
The significance of the model results are expressed in terms of the p value metric; lower values are more significant, with a significance level set at the standard of p < 0.05. Regression coefficients are shown in Appendix A.
1 The logarithmic transformation helps to better approximate a normal distribution in order to meet the assumptions of the statistical analysis. It also
aids in the interpretation of the model coefficients for categorical variables (e.g., gender or minority status) by representing percentage differences in
salary. For example, under this transformation, a positive 0.05 independent variable coefficient corresponds to a +5% difference in salary between
groups.
2 A quadratic function is stated as f(x) = ax2 + bx + c where the resulting graph is a basic “U” shape.
3 A cubic function is stated as f(x)=ax3+bx2+cx+d where the resulting graph is a basic “S” shape.

FY19 Faculty Salary Equity Analysis 3
FY19 Results
Descriptive Statistics
Demographic frequency counts by college and rank are displayed in Table 1. The study included a total of 1,061 faculty.
Overall, females account for 39% of faculty included in the current study; minority faculty account for 20%. There are
lower numbers of female and minority faculty in Science, Technology, Engineering and Math (STEM) than male and non-minority
faculty. This is especially true at the Full Professor rank. This distribution reflects larger societal patterns.
Table 1
Demographic Frequency Counts by College and Rank
College Rank Female Male Minority Non-Min. Grand Total
Agricultural Sciences
Assistant Professor 10 17 7 20 27
Associate Professor 11 16 6 21 27
Professor 9 42 3 48 51
Business
Assistant Professor 5 11 5 11 16
Associate Professor 8 14 6 16 22
Professor 6 18 1 23 24
Engineering,Walter Scott, Jr.
Assistant Professor 8 22 13 17 30
Associate Professor 8 23 10 21 31
Professor 4 52 12 44 56
Health and Human Sciences
Assistant Professor 27 11 14 24 38
Associate Professor 19 15 7 27 34
Professor 26 14 2 38 40
Liberal Arts
Assistant Professor 36 39 20 55 75
Associate Professor 40 40 18 62 80
Professor 31 52 12 71 83
Libraries
Assistant Professor 3
3 3
Associate Professor 7 1 1 7 8
Professor 3
3 3
Natural Resources
Assistant Professor 6 12 2 16 18
Associate Professor 12 12
24 24
Professor 7 24 7 24 31
Natural Sciences
Assistant Professor 7 30 10 27 37
Associate Professor 17 20 9 28 37
Professor 29 67 21 75 96
Veterinary Medicine
Assistant Professor 20 12 9 23 32
Associate Professor 31 29 8 52 60
Professor 21 57 6 72 78
Grand Total 411 650 209 852 1061

FY19 Faculty Salary Equity Analysis
4 FY19 Faculty Salary Equity Analysis
Table 2 displays the interquartile salary range for each department by rank. Generally, the lower salaries are in the library and
liberal arts/humanities departments and the higher salaries are located in STEM departments. Combined with the faculty counts in
Table 1, it is clear that female and/or minority faculty are more heavily concentrated in lower paying departments. Therefore, in
order to isolate the impact of gender or minority status, department is statistically controlled for in the regression models.
Table 2
Interquartile Salary Range by Department
Department
25th Percentile 50th Percentile 75th Percentile
Assistant Prof.
Associate Prof. Professor
Assistant Prof.
Associate Prof. Professor
Assistant Prof.
Associate Prof. Professor
Accounting $174,862 $139,701 $185,000 $178,602 $141,116 $187,848 $183,500
Ag and Resource Econ $83,821 $100,169 $108,300 $89,022 $101,860 $112,791 $93,103 $102,480 $135,527
Animal Sciences $80,565 $87,180 $100,703 $83,760 $91,060 $116,250 $86,833 $97,631 $157,058
Anthropology $64,457 $74,568 $88,214 $67,000 $76,792 $96,047 $72,500 $78,949 $107,706
Art and Art History $60,988 $63,477 $77,183 $63,343 $68,136 $80,013 $63,400 $69,170 $91,207
Atmospheric Science $102,700 $122,650 $148,000 $107,150 $124,000 $167,600 $127,150 $195,143
Bioag Sci and Pest $83,500 $98,776 $83,610 $113,685 $83,620 $145,847
Biochem and Molecular Bio $80,600 $89,525 $107,900 $85,200 $95,250 $115,500 $97,900 $139,975
Biology $81,621 $89,345 $101,429 $82,250 $91,050 $113,240 $83,894 $92,454 $129,957
Biomedical Sciences $85,308 $89,374 $116,089 $88,150 $90,896 $134,476 $90,010 $94,562 $150,040
Chemical and Biological Eng $97,000 $115,900 $130,300 $99,700 $117,200 $148,500 $122,000 $165,500
Chemistry $86,000 $101,614 $118,076 $88,070 $109,327 $124,878 $91,202 $113,530 $146,061
Civil and Environmental Eng $92,800 $110,000 $137,800 $94,350 $116,500 $148,300 $95,150 $118,700 $169,600
Clinical Sciences $87,544 $96,105 $115,386 $90,015 $99,301 $125,263 $92,717 $102,594 $139,892
Communication Studies $68,465 $78,638 $85,571 $68,546 $79,135 $100,962 $72,325 $80,179 $107,981
Computer Information Systems
$144,742 $144,962 $150,827 $146,684 $165,794 $160,801 $164,432
Computer Science $108,083 $114,650 $132,500 $110,700 $119,325 $138,640 $113,197 $141,593
Construction Management $76,238 $84,218 $79,948 $88,708 $86,057 $97,215
Design and Merchandising $73,584 $81,988 $99,164 $76,348 $83,059 $106,952 $84,937 $129,004
Economics $94,926 $106,007 $113,997 $95,420 $106,204 $124,863 $113,266 $158,226
Ecosystem Sci and Sus $73,000 $82,067 $102,882 $75,294 $82,649 $121,579 $83,891 $146,008
Electrical and Computer Eng $97,375 $113,200 $142,600 $98,800 $115,300 $154,600 $100,900 $117,550 $184,700
English $62,604 $74,811 $84,056 $65,549 $76,049 $87,674 $67,704 $82,591 $96,106
Environ and Rad Health $86,763 $99,268 $115,769 $93,269 $102,210 $126,954 $100,971 $113,284 $153,569
Ethnic Studies $65,500 $74,725 $90,426 $66,000 $76,917 $91,828 $80,339
Finance and Real Estate $165,654 $133,168 $147,942 $182,956 $161,000 $173,393 $184,228 $177,317 $224,552
Fish, Wildlife and Conserv $77,100 $82,249 $95,529 $77,100 $84,910 $105,825 $77,100 $88,521 $122,489
Food Sci and Human Nutrition $81,127 $90,892 $85,554 $97,190 $94,576 $138,900

FY19 Faculty Salary Equity Analysis 5
Table 2 (cont.)
Interquartile Salary Range by Department
Department
25th Percentile 50th Percentile 75th Percentile
Assistant Prof.
Associate Prof.
Professor Assistant
Prof. Associate
Prof. Professor
Assistant Prof.
Associate Prof.
Professor
Forest & Rangeland $74,095 $82,988 $91,309 $74,413 $82,988 $96,856 $75,083 $121,470
Geosciences $75,469 $80,771 $107,888 $76,884 $83,439 $118,749 $79,480 $98,755 $126,674
Health and Exercise Science $76,603 $85,060 $106,240 $77,621 $87,459 $122,965 $78,500 $134,181
History $61,508 $71,643 $83,060 $62,636 $75,512 $86,181 $63,500 $103,006
Horticulture and Landscape $78,000 $82,168 $105,924 $78,500 $90,290 $108,370 $100,078 $138,203
Human Dev and Family $74,052 $86,829 $95,889 $75,750 $89,769 $108,847 $93,235 $127,085
Human Dim of Nat Res $70,252 $85,776 $89,500 $71,379 $88,773 $98,220 $76,347 $90,219 $119,070
Journalism and Media $63,500 $71,292 $86,689 $65,890 $76,259 $104,427 $67,306 $80,831 $109,663
Languages, Literatures and $61,334 $64,213 $82,976 $62,565 $64,257 $89,624 $67,682 $92,653
Library $41,640 $48,588 $61,214 $41,640 $54,572 $63,389 $67,489
Management $141,143 $128,032 $161,955 $142,723 $148,166 $186,289 $165,025 $190,655
Marketing $151,848 $147,441 $159,748 $153,602 $162,323 $161,584 $167,582 $169,475
Mathematics $79,436 $88,160 $101,984 $81,741 $91,998 $110,163 $82,760 $93,717 $147,858
Mechanical Engineering $95,000 $112,800 $137,650 $97,100 $116,900 $147,600 $98,675 $120,500 $175,725
Micro, Immunology and Path $84,956 $93,136 $110,665 $86,690 $96,314 $116,890 $90,000 $99,314 $139,553
Occupational Therapy $75,172 $88,602 $109,113 $76,948 $89,744 $112,500 $79,552 $92,298
Philosophy $65,481 $69,850 $78,605 $67,000 $83,024 $79,000 $103,148 $114,281
Physics $76,475 $93,811 $112,400 $77,530 $99,320 $117,075 $82,302 $105,905 $125,426
Political Science $67,747 $78,019 $100,755 $69,644 $82,897 $112,580 $71,554 $115,317
Psychology $74,000 $86,238 $100,604 $77,180 $88,494 $107,381 $90,164 $120,888
School of Education $71,109 $78,270 $96,138 $71,977 $82,485 $101,829 $76,600 $85,909 $103,542
School of Mus, Thea, Dance $59,734 $64,356 $77,950 $61,321 $66,489 $82,334 $62,824 $75,713 $105,312
School of Social Work $66,411 $67,909 $72,115
Sociology $66,375 $78,536 $100,944 $68,277 $79,702 $106,512 $69,763 $80,379 $139,939
Soil and Crop Sciences $83,755 $74,517 $113,060 $88,690 $85,430 $132,040 $90,000 $93,100 $141,345
Statistics $90,516 $125,916 $92,990 $131,120 $93,917 $146,590

6 FY19 Faculty Salary Equity Analysis
Model Statistics
At the institutional level, each of the
models is statistically significant
indicating the variables of
department, years in current rank and
either gender or minority status are
significantly associated with salary.
Tables 3 and 4 show the regression
model results by rank.
The second column, the adjusted R
squared, is the percentage of salary
variance that is explained by each
model. The salary variance explained
by the models is inversely related to
rank. However, all of the models are
highly significant indicating a good fit
to the data (p = 0.0000).
Use of the log salary as the
dependent variable (instead of 9-
month salary) allows for an
interpretation of the salary of one
group as a percentage of another
group. The third column of Table 3
displays female faculty salary as a
percent of male while the third
column in Table 4 displays the salary
for minority faculty as a percentage
of non-minority faculty. The salary
difference by gender is largest at the
Full Professor rank (3.0%) and by
minority status at the Full Professor
rank (1.4%).
The fourth column in Tables 3 and 4
provides the p value for the gender
or minority status coefficients after
controlling for department and years
in rank. None of the between-group
differences are statistically significant
(p > .05).
Table 3
Between-Group Salary Differences by Gender (after controlling for years in rank and department)
Rank
Gender Models
Salary Variance Explained (Adjusted R Squared)
Female Salary as a Percent of Male Significance Level (p value)
Assistant Professor 96.4% 99.8% 0.747
Associate Professor 85.1% 99.9% 0.929
Full Professor 61.2% 97.0% 0.079
Table 4
Between-Group Salary Differences by Minority Status (after controlling for years in rank and department)
Rank
Minority Status Models
Salary Variance Explained (Adjusted R Squared)
Minority Salary as a Percent of Non-Minority Significance Level (p value)
Assistant Professor 96.4% 99.3% 0.319
Associate Professor 85.1% 98.9% 0.431
Full Professor 61.0% 101.4% 0.534
FY19 Faculty Salary Equity Analysis

FY19 Faculty Salary Equity Analysis 7
Trends over Time
Descriptive Statistics
In this section, the FY18 results are
reiterated and shown with a retroactive
analysis for FY15-19 using the FY19
population parameters and modeling
methods.
Table 5 displays the demographic
frequency counts by rank and year for
tenured/tenure-track faculty. Overall,
the number of female and minority
faculty has increased from FY15 to FY19
and each of these subgroups has increased
as a proportion of the total.
However, this finding is not consistent
at each rank. At the Assistant
Professor rank, females have declined
slightly as a percent of the rank total.
The same is true for females at the
Full Professor rank.
Table 5
Demographic Frequency Counts by Rank and Year
Rank Fiscal Year Female Male Minority Non-Minority Total
Assistant Professor
FY15 108 116 55 169 225
FY16 111 115 57 169 227
FY17 113 138 56 195 251
FY18 120 140 62 198 260
FY19 122 154 80 196 276
Associate Professor
FY15 163 217 72 308 380
FY16 162 206 69 299 368
FY17 154 207 69 292 361
FY18 149 203 72 280 352
FY19 153 170 65 258 323
Full Professor
FY15 113 299 49 363 412
FY16 117 308 54 371 425
FY17 127 303 55 375 430
FY18 131 302 54 379 433
FY19 136 326 64 398 462
Total
FY15 384 632 176 840 1017
FY16 390 629 180 839 1020
FY17 394 648 180 862 1042
FY18 400 645 188 857 1045
FY19 411 650 209 852 1061

8 FY19 Faculty Salary Equity Analysis
Model Statistics
As shown in Table 6, over the last five years, there have been two ranks with statistically significant between-group differences.
Female Full Professors have, in three of the last five years, had a statistically significantly lower average salary than their male
counterparts after controlling for department and years in rank. Minority Associate Professors have, in two of five years, had
a statistically significantly lower average salary than their non-minority counterparts after controlling for department and years
in rank. In each of these situations, the gap has narrowed and is no longer statistically significant and continues to narrow.
Table 6
Regression Results by Rank and Year
Rank and
Fiscal Year
Gender Minority Status
Salary Variance Explained
Female Salary as a Percent of Male
Gender Difference (pvalue)
Salary Variance Explained
Minority Salary as a Percent of Non-Minority
Minority Difference (pvalue)
(Adjusted R2) (Adjusted R2)
Assistant
Professor
FY15 94.2% 99.2% 0.395 94.2% 100.1% 0.962
FY16 93.2% 98.6% 0.147 93.2% 98.3% 0.121
FY17 95.2% 98.8% 0.160 95.2% 98.5% 0.100
FY18 96.4% 99.3% 0.371 96.4% 99.6% 0.618
FY19 96.4% 99.8% 0.747 96.4% 99.3% 0.319
Associate Professor
FY15 82.6% 99.8% 0.845 82.8% 97.2% 0.067
FY16 82.7% 100.3% 0.801 83.2% 95.2% 0.002
FY17 80.4% 99.9% 0.933 81.3% 94.6% < 0.001
FY18 84.9% 98.2% 0.109 84.9% 97.8% 0.117
FY19 85.1% 99.9% 0.929 85.1% 98.9% 0.431
Full Professor
FY15 53.7% 92.2% < 0.001 52.0% 103.9% 0.169
FY16 55.3% 93.6% 0.001 54.1% 102.7% 0.300
FY17 59.5% 95.1% 0.006 58.8% 102.9% 0.241
FY18 59.2% 96.6% 0.056 58.8% 101.9% 0.458
FY19 61.2% 97.0% 0.079 61.0% 101.4% 0.534
Shaded cells indicate statistically significant results.
Discussion
The current analysis represents best
practices in salary analysis as
recommended by the Salary Equity
Committee in 2015. Although there are
no statistically significant between-
group differences found in FY19, salary
equity is an issue that continues to be
central to the institution’s goal of being
the best place to work and learn.
Assessment of salary equity is ongoing
and not accomplished with any single
analysis. The current study may best be
interpreted in conjunction with salary
and utilization analyses completed by
the Office of Equal Opportunity and
the Office of Institutional Research,
Planning, and Effectiveness.
Faculty are encouraged to review
their HR data through either the HR
self-service portal or with their
departmental HR liaison.
Please contact the Office of
Institutional Research, Planning, and
Effectiveness with any questions or
comments related to the current
analysis.
FY19 Faculty Salary Equity Analysis

FY19 Faculty Salary Equity Analysis 9
Appendix A Regression Models Each of the six tables below display the regression model coefficients for each rank by gender or minority status. All
variables are categorical (0 = no, 1 = yes) except the constant and the years in rank (linear, quadratic and cubic). The
equation for each model can be derived as follows: log salary = constant + b1x1 + b2x2 + b3x3 + b4x4…
Because of the categorical nature of the department variables, all but one will equal zero so the equations can be
shortened to the following (where female = 1 and male = 0; minority = 1 and non-minority = 0)
Full Professor
Log Salary = 11.652+(gender*-0.030)+(department coefficient)+(fullyrs*0.021)+(fullyrs2*-0.001)+( 9.248E-6)
Log Salary = 11.642+(minority*0.014)+(department coefficient)+(fullyrs*0.022)+(fullyrs2*-0.001)+( 9.172E-6)
Associate Professor
Log Salary = 11.467+(gender*-0.001)+(department coefficient)+(assocyrs*0.001)+(assocyrs2*.000)
Log Salary = 11.468+(minority*-0.011)+(department coefficient)+(assocyrs*0.001)+(assocyrs2*.000)
Assistant Professor
Log Salary = 11.472+(gender*-.002)+(department coefficient)+(assistyrs*0.004)
Log Salary = 11.474+(minority*-0.007)+(department coefficient)+(assistyrs*0.004)

Appendix A Model Coefficients
Professor by Gender
Unstandardized Coefficients
Standardized Coefficients
t Sig. B Std. Error Beta
(Constant) 11.652 0.031 375.394 0.000
FULLF -0.030 0.017 -0.058 -1.764 0.079
Accounting 0.452 0.089 0.154 5.092 0.000
Agricultural and Resource Economics
-0.056 0.053 -0.035 -1.058 0.291
Animal Sciences -0.045 0.053 -0.028 -0.846 0.398
Anthropology -0.242 0.061 -0.126 -3.936 0.000
Art and Art History -0.446 0.071 -0.196 -6.312 0.000
Atmospheric Science 0.273 0.053 0.169 5.126 0.000
Bioagricultural Sciences and Pest Management
-0.067 0.049 -0.047 -1.385 0.167
Biochemistry and Molecular Biology
-0.059 0.055 -0.034 -1.058 0.291
Biology -0.042 0.044 -0.033 -0.941 0.347
Biomedical Sciences 0.021 0.048 0.015 0.438 0.662
Chemical and Biological Engineering
0.170 0.062 0.088 2.754 0.006
Chemistry 0.051 0.050 0.034 1.019 0.309
Civil and Environmental Engineering
0.181 0.047 0.137 3.859 0.000
Communication Studies -0.237 0.065 -0.114 -3.626 0.000
Computer Information Systems 0.191 0.079 0.075 2.435 0.015
Computer Science 0.108 0.047 0.079 2.291 0.022
Construction Management 0.185 0.149 0.037 1.244 0.214
Design and Merchandising -0.126 0.072 -0.056 -1.761 0.079
Economics 0.033 0.056 0.020 0.601 0.548
Ecosystem Science and Sustainability
-0.024 0.065 -0.012 -0.370 0.711
Electrical and Computer Engineering
0.183 0.046 0.138 3.956 0.000
English -0.295 0.051 -0.200 -5.846 0.000
Environmental and Radiological Health Sciences
0.036 0.053 0.023 0.684 0.494
Ethnic Studies -0.249 0.107 -0.070 -2.324 0.021
Finance and Real Estate 0.289 0.071 0.127 4.069 0.000
Fish, Wildlife and Conservation Biology
-0.207 0.056 -0.122 -3.723 0.000
Food Science and Human Nutrition
-0.185 0.071 -0.082 -2.604 0.010
FY19 Faculty Salary Equity Analysis

FY19 Faculty Salary Equity Analysis 11
Professor by Gender
Unstandardized Coefficients
Standardized Coefficients
t Sig. B Std. Error Beta
Forest & Rangeland Stewardship -0.186 0.071 -0.082 -2.625 0.009
Geosciences -0.097 0.071 -0.043 -1.376 0.169
Health and Exercise Science -0.027 0.065 -0.013 -0.412 0.680
History -0.312 0.065 -0.150 -4.771 0.000
Horticulture and Landscape Architecture
-0.085 0.055 -0.050 -1.542 0.124
Human Development and Family Studies
-0.097 0.052 -0.063 -1.863 0.063
Human Dimensions of Natural Resources
-0.212 0.066 -0.102 -3.206 0.001
Journalism and Media Communication
-0.242 0.071 -0.106 -3.427 0.001
Languages, Literatures and Cultures
-0.378 0.078 -0.149 -4.852 0.000
Library -0.598 0.089 -0.204 -6.679 0.000
Management 0.368 0.058 0.204 6.325 0.000
Marketing 0.226 0.078 0.089 2.903 0.004
Mathematics -0.045 0.050 -0.030 -0.906 0.366
Mechanical Engineering 0.228 0.055 0.134 4.121 0.000
Microbiology, Immunology and Pathology
0.003 0.040 0.003 0.074 0.941
Occupational Therapy -0.013 0.089 -0.005 -0.149 0.882
Philosophy -0.303 0.063 -0.157 -4.826 0.000
Physics -0.093 0.063 -0.048 -1.480 0.140
Political Science -0.156 0.058 -0.087 -2.675 0.008
Psychology -0.092 0.044 -0.076 -2.101 0.036
School of Education -0.174 0.056 -0.102 -3.104 0.002
School of Music, Theatre and Dance
-0.338 0.061 -0.176 -5.521 0.000
Sociology -0.113 0.072 -0.050 -1.567 0.118
Soil and Crop Sciences -0.004 0.055 -0.002 -0.073 0.942
Statistics 0.096 0.061 0.050 1.573 0.116
FULLYRS 0.021 0.005 0.791 4.531 0.000
FULLYRS2 -0.001 0.000 -0.929 -2.418 0.016
FULLYRS3 9.248E-06 0.000 0.360 1.499 0.135

Associate Professor Gender
Unstandardized Coefficients
Standardized Coefficients
t Sig. B Std. Error Beta
(Constant) 11.467 0.022 512.963 0.000
ASSOCF -0.001 0.011 -0.002 -0.089 0.929
Accounting 0.437 0.055 0.186 7.924 0.000
Agricultural and Resource Economics
0.041 0.039 0.026 1.063 0.289
Animal Sciences -0.037 0.038 -0.024 -0.961 0.337
Anthropology -0.221 0.044 -0.121 -5.050 0.000
Art and Art History -0.322 0.033 -0.259 -9.897 0.000
Atmospheric Science 0.265 0.044 0.145 6.052 0.000
Bioagricultural Sciences and Pest Management
-0.011 0.090 -0.003 -0.124 0.901
Biochemistry and Molecular Biology
-0.017 0.048 -0.008 -0.361 0.719
Biology -0.052 0.044 -0.028 -1.190 0.235
Biomedical Sciences -0.007 0.039 -0.005 -0.192 0.848
Chemical and Biological Engineering
0.214 0.044 0.117 4.883 0.000
Chemistry 0.119 0.044 0.065 2.732 0.007
Civil and Environmental Engineering
0.203 0.035 0.148 5.765 0.000
Clinical Sciences 0.046 0.028 0.048 1.645 0.101
Communication Studies -0.187 0.048 -0.091 -3.902 0.000
Computer Information Systems 0.516 0.054 0.219 9.487 0.000
Computer Science 0.222 0.065 0.077 3.427 0.001
Construction Management -0.067 0.041 -0.040 -1.643 0.102
Design and Merchandising -0.142 0.065 -0.049 -2.196 0.029
Economics 0.127 0.044 0.069 2.913 0.004
Ecosystem Science and Sustainability
-0.144 0.044 -0.079 -3.298 0.001
Electrical and Computer Engineering
0.185 0.044 0.101 4.190 0.000
English -0.205 0.033 -0.165 -6.312 0.000
Environmental and Radiological Health Sciences
0.095 0.032 0.083 2.987 0.003
Ethnic Studies -0.213 0.048 -0.104 -4.464 0.000
Finance and Real Estate 0.489 0.044 0.267 11.230 0.000
Fish, Wildlife and Conservation Biology
-0.116 0.044 -0.064 -2.669 0.008
Food Science and Human Nutrition
-0.095 0.035 -0.069 -2.734 0.007
FY19 Faculty Salary Equity Analysis

FY19 Faculty Salary Equity Analysis 13
Associate Professor Gender
Unstandardized Coefficients
Standardized Coefficients
t Sig. B Std. Error Beta
Food Science and Human Nutrition
-0.095 0.035 -0.069 -2.734 0.007
Forest & Rangeland Stewardship -0.141 0.054 -0.060 -2.608 0.010
Geosciences -0.064 0.039 -0.042 -1.672 0.096
Health and Exercise Science -0.098 0.054 -0.042 -1.804 0.072
History -0.231 0.065 -0.080 -3.577 0.000
Horticulture and Landscape Architecture
-0.050 0.038 -0.032 -1.313 0.190
Human Development and Family Studies
-0.061 0.048 -0.030 -1.270 0.205
Human Dimensions of Natural Resources
-0.071 0.048 -0.035 -1.497 0.136
Journalism and Media Communication
-0.228 0.044 -0.125 -5.243 0.000
Languages, Literatures and Cultures
-0.358 0.038 -0.231 -9.366 0.000
Library -0.520 0.036 -0.358 -14.277 0.000
Management 0.443 0.038 0.285 11.588 0.000
Marketing 0.508 0.048 0.249 10.644 0.000
Mathematics -0.047 0.037 -0.033 -1.296 0.196
Mechanical Engineering 0.207 0.039 0.133 5.362 0.000
Occupational Therapy -0.051 0.044 -0.028 -1.183 0.238
Philosophy -0.128 0.048 -0.063 -2.667 0.008
Physics 0.067 0.044 0.036 1.514 0.131
Political Science -0.148 0.054 -0.063 -2.739 0.007
Psychology -0.061 0.038 -0.039 -1.588 0.114
School of Education -0.148 0.048 -0.072 -3.086 0.002
School of Music, Theatre and Dance
-0.310 0.030 -0.279 -10.183 0.000
School of Social Work -0.139 0.090 -0.034 -1.549 0.122
Sociology -0.185 0.044 -0.101 -4.240 0.000
Soil and Crop Sciences -0.116 0.044 -0.063 -2.641 0.009
Statistics 0.096 0.090 0.024 1.073 0.284
ASSOCYRS 0.001 0.002 0.042 0.783 0.434
ASSOCYRS2 0.000 0.000 -0.127 -2.434 0.016
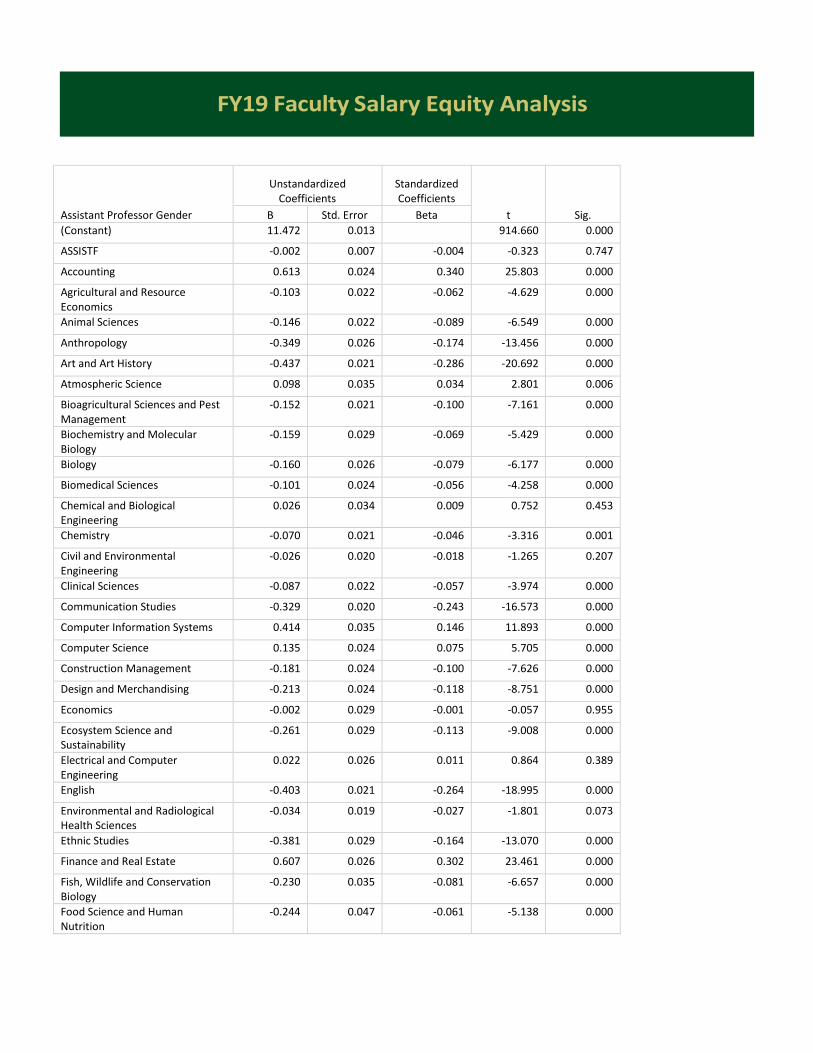
Assistant Professor Gender
Unstandardized Coefficients
Standardized Coefficients
t Sig. B Std. Error Beta
(Constant) 11.472 0.013 914.660 0.000
ASSISTF -0.002 0.007 -0.004 -0.323 0.747
Accounting 0.613 0.024 0.340 25.803 0.000
Agricultural and Resource Economics
-0.103 0.022 -0.062 -4.629 0.000
Animal Sciences -0.146 0.022 -0.089 -6.549 0.000
Anthropology -0.349 0.026 -0.174 -13.456 0.000
Art and Art History -0.437 0.021 -0.286 -20.692 0.000
Atmospheric Science 0.098 0.035 0.034 2.801 0.006
Bioagricultural Sciences and Pest Management
-0.152 0.021 -0.100 -7.161 0.000
Biochemistry and Molecular Biology
-0.159 0.029 -0.069 -5.429 0.000
Biology -0.160 0.026 -0.079 -6.177 0.000
Biomedical Sciences -0.101 0.024 -0.056 -4.258 0.000
Chemical and Biological Engineering
0.026 0.034 0.009 0.752 0.453
Chemistry -0.070 0.021 -0.046 -3.316 0.001
Civil and Environmental Engineering
-0.026 0.020 -0.018 -1.265 0.207
Clinical Sciences -0.087 0.022 -0.057 -3.974 0.000
Communication Studies -0.329 0.020 -0.243 -16.573 0.000
Computer Information Systems 0.414 0.035 0.146 11.893 0.000
Computer Science 0.135 0.024 0.075 5.705 0.000
Construction Management -0.181 0.024 -0.100 -7.626 0.000
Design and Merchandising -0.213 0.024 -0.118 -8.751 0.000
Economics -0.002 0.029 -0.001 -0.057 0.955
Ecosystem Science and Sustainability
-0.261 0.029 -0.113 -9.008 0.000
Electrical and Computer Engineering
0.022 0.026 0.011 0.864 0.389
English -0.403 0.021 -0.264 -18.995 0.000
Environmental and Radiological Health Sciences
-0.034 0.019 -0.027 -1.801 0.073
Ethnic Studies -0.381 0.029 -0.164 -13.070 0.000
Finance and Real Estate 0.607 0.026 0.302 23.461 0.000
Fish, Wildlife and Conservation Biology
-0.230 0.035 -0.081 -6.657 0.000
Food Science and Human Nutrition
-0.244 0.047 -0.061 -5.138 0.000
FY19 Faculty Salary Equity Analysis

FY19 Faculty Salary Equity Analysis 15
Assistant Professor Gender
Unstandardized Coefficients
Standardized Coefficients
t Sig. B Std. Error Beta
Food Science and Human Nutrition
-0.244 0.047 -0.061 -5.138 0.000
Forest & Rangeland Stewardship -0.264 0.024 -0.146 -11.109 0.000
Geosciences -0.223 0.026 -0.111 -8.643 0.000
Health and Exercise Science -0.219 0.022 -0.133 -9.803 0.000
History -0.420 0.021 -0.275 -19.682 0.000
Horticulture and Landscape Architecture
-0.202 0.029 -0.087 -6.971 0.000
Human Development and Family Studies
-0.247 0.029 -0.107 -8.399 0.000
Human Dimensions of Natural Resources
-0.292 0.026 -0.145 -11.179 0.000
Journalism and Media Communication
-0.386 0.022 -0.234 -17.204 0.000
Languages, Literatures and Cultures
-0.436 0.029 -0.188 -15.044 0.000
Library -0.839 0.029 -0.362 -28.477 0.000
Management 0.398 0.029 0.172 13.702 0.000
Marketing 0.465 0.035 0.164 13.491 0.000
Mathematics -0.180 0.022 -0.109 -8.087 0.000
Microbiology, Immunology and Pathology
-0.107 0.019 -0.084 -5.636 0.000
Occupational Therapy -0.235 0.026 -0.117 -8.938 0.000
Philosophy -0.341 0.029 -0.147 -11.760 0.000
Physics -0.206 0.024 -0.114 -8.657 0.000
Political Science -0.329 0.024 -0.183 -13.867 0.000
Psychology -0.234 0.029 -0.101 -8.085 0.000
School of Education -0.283 0.020 -0.197 -13.813 0.000
School of Music, Theatre and Dance
-0.459 0.018 -0.389 -25.516 0.000
School of Social Work -0.335 0.023 -0.203 -14.628 0.000
Sociology -0.348 0.022 -0.211 -15.629 0.000
Soil and Crop Sciences -0.105 0.024 -0.058 -4.421 0.000
Statistics -0.049 0.026 -0.024 -1.878 0.062
ASSTYRS 0.004 0.001 0.038 3.165 0.002

Professor Minority
Unstandardized Coefficients
Standardized Coefficients
t Sig. B Std. Error Beta
(Constant) 11.642 0.031 375.743 0.000
FULLMIN 0.014 0.023 0.021 0.623 0.534
Accounting 0.451 0.089 0.154 5.061 0.000
Agricultural and Resource Economics
-0.055 0.053 -0.034 -1.029 0.304
Animal Sciences -0.040 0.053 -0.025 -0.755 0.451
Anthropology -0.251 0.061 -0.130 -4.084 0.000
Art and Art History -0.445 0.071 -0.196 -6.284 0.000
Atmospheric Science 0.277 0.053 0.171 5.184 0.000
Bioagricultural Sciences and Pest Management
-0.068 0.049 -0.048 -1.383 0.168
Biochemistry and Molecular Biology
-0.063 0.056 -0.037 -1.135 0.257
Biology -0.047 0.044 -0.037 -1.051 0.294
Biomedical Sciences 0.015 0.049 0.011 0.314 0.753
Chemical and Biological Engineering
0.176 0.062 0.091 2.834 0.005
Chemistry 0.045 0.050 0.031 0.896 0.371
Civil and Environmental Engineering
0.185 0.047 0.139 3.913 0.000
Communication Studies -0.239 0.066 -0.115 -3.627 0.000
Computer Information Systems
0.193 0.079 0.076 2.445 0.015
Computer Science 0.107 0.048 0.078 2.232 0.026
Construction Management 0.191 0.150 0.038 1.278 0.202
Design and Merchandising -0.149 0.071 -0.066 -2.107 0.036
Economics 0.030 0.056 0.018 0.535 0.593
Ecosystem Science and Sustainability
-0.026 0.066 -0.012 -0.393 0.694
Electrical and Computer Engineering
0.178 0.047 0.134 3.748 0.000
English -0.311 0.050 -0.210 -6.215 0.000
Environmental and Radiological Health Sciences
0.035 0.053 0.022 0.660 0.510
Ethnic Studies -0.269 0.110 -0.075 -2.459 0.014
Finance and Real Estate 0.288 0.071 0.127 4.041 0.000
Fish, Wildlife and Conservation Biology
-0.208 0.056 -0.122 -3.714 0.000
Food Science and Human Nutrition
-0.198 0.071 -0.087 -2.782 0.006
FY19 Faculty Salary Equity Analysis

FY19 Faculty Salary Equity Analysis 17
Professor Minority
Unstandardized Coefficients
Standardized Coefficients
t Sig. B Std. Error Beta
Forest & Rangeland Stewardship
-0.199 0.072 -0.087 -2.763 0.006
Geosciences -0.102 0.071 -0.045 -1.446 0.149
Health and Exercise Science -0.029 0.065 -0.014 -0.438 0.662
History -0.313 0.066 -0.151 -4.779 0.000
Horticulture and Landscape Architecture
-0.088 0.056 -0.052 -1.585 0.114
Human Development and Family Studies
-0.111 0.051 -0.072 -2.149 0.032
Human Dimensions of Natural Resources
-0.211 0.066 -0.102 -3.180 0.002
Journalism and Media Communication
-0.246 0.071 -0.108 -3.475 0.001
Languages, Literatures and Cultures
-0.400 0.081 -0.158 -4.936 0.000
Library -0.619 0.089 -0.212 -6.966 0.000
Management 0.364 0.058 0.202 6.250 0.000
Marketing 0.225 0.078 0.089 2.883 0.004
Mathematics -0.049 0.050 -0.033 -0.977 0.329
Mechanical Engineering 0.232 0.056 0.136 4.171 0.000
Microbiology, Immunology and Pathology
0.001 0.040 0.001 0.018 0.986
Occupational Therapy -0.026 0.089 -0.009 -0.295 0.768
Philosophy -0.307 0.063 -0.159 -4.870 0.000
Physics -0.090 0.063 -0.047 -1.431 0.153
Political Science -0.157 0.059 -0.087 -2.685 0.008
Psychology -0.105 0.044 -0.086 -2.385 0.018
School of Education -0.189 0.056 -0.111 -3.390 0.001
School of Music, Theatre and Dance
-0.337 0.061 -0.175 -5.479 0.000
Sociology -0.117 0.073 -0.051 -1.606 0.109
Soil and Crop Sciences -0.001 0.055 -0.001 -0.024 0.981
Statistics 0.093 0.061 0.048 1.515 0.131
FULLYRS 0.022 0.005 0.798 4.547 0.000
FULLYRS2 -0.001 0.000 -0.924 -2.394 0.017
FULLYRS3 9.172E-06 0.000 0.357 1.479 0.140

Associate Professor Minority
Unstandardized Coefficients
Standardized Coefficients
t Sig. B Std. Error Beta
(Constant) 11.468 0.021 541.847 0.000
ASSOCMIN -0.011 0.014 -0.020 -0.789 0.431
Accounting 0.444 0.056 0.189 7.963 0.000
Agricultural and Resource Economics
0.042 0.038 0.027 1.086 0.278
Animal Sciences -0.033 0.039 -0.021 -0.861 0.390
Anthropology -0.222 0.043 -0.121 -5.102 0.000
Art and Art History -0.322 0.032 -0.259 -9.920 0.000
Atmospheric Science 0.266 0.044 0.146 6.095 0.000
Bioagricultural Sciences and Pest Management
-0.012 0.090 -0.003 -0.134 0.893
Biochemistry and Molecular Biology
-0.010 0.049 -0.005 -0.205 0.837
Biology -0.049 0.044 -0.027 -1.118 0.265
Biomedical Sciences -0.008 0.038 -0.005 -0.202 0.840
Chemical and Biological Engineering
0.217 0.044 0.119 4.956 0.000
Chemistry 0.118 0.044 0.065 2.716 0.007
Civil and Environmental Engineering
0.203 0.035 0.148 5.807 0.000
Clinical Sciences 0.046 0.028 0.048 1.664 0.097
Communication Studies -0.185 0.048 -0.091 -3.876 0.000
Computer Information Systems
0.516 0.054 0.219 9.563 0.000
Computer Science 0.226 0.065 0.079 3.489 0.001
Construction Management -0.064 0.041 -0.038 -1.576 0.116
Design and Merchandising -0.133 0.066 -0.046 -2.015 0.045
Economics 0.133 0.044 0.073 3.015 0.003
Ecosystem Science and Sustainability
-0.145 0.044 -0.079 -3.335 0.001
Electrical and Computer Engineering
0.193 0.045 0.106 4.334 0.000
English -0.204 0.033 -0.164 -6.282 0.000
Environmental and Radiological Health Sciences
0.097 0.032 0.084 3.044 0.003
Ethnic Studies -0.203 0.049 -0.099 -4.114 0.000
Finance and Real Estate 0.493 0.044 0.269 11.288 0.000
Fish, Wildlife and Conservation Biology
-0.118 0.044 -0.064 -2.700 0.007
Food Science and Human Nutrition
-0.094 0.035 -0.069 -2.697 0.007
FY19 Faculty Salary Equity Analysis

FY19 Faculty Salary Equity Analysis 19
Associate Professor Minority
Unstandardized Coefficients
Standardized Coefficients
t Sig. B Std. Error Beta
Forest & Rangeland Stewardship
-0.143 0.054 -0.061 -2.634 0.009
Geosciences -0.065 0.038 -0.042 -1.693 0.092
Health and Exercise Science -0.099 0.054 -0.042 -1.828 0.069
History -0.232 0.065 -0.081 -3.594 0.000
Horticulture and Landscape Architecture
-0.050 0.038 -0.032 -1.304 0.193
Human Development and Family Studies
-0.063 0.048 -0.031 -1.310 0.191
Human Dimensions of Natural Resources
-0.072 0.048 -0.035 -1.517 0.130
Journalism and Media Communication
-0.227 0.043 -0.124 -5.222 0.000
Languages, Literatures and Cultures
-0.354 0.038 -0.228 -9.221 0.000
Library -0.520 0.036 -0.358 -14.335 0.000
Management 0.445 0.038 0.287 11.650 0.000
Marketing 0.507 0.048 0.248 10.634 0.000
Mathematics -0.047 0.036 -0.032 -1.288 0.199
Mechanical Engineering 0.209 0.038 0.135 5.475 0.000
Occupational Therapy -0.052 0.043 -0.029 -1.205 0.229
Philosophy -0.126 0.048 -0.062 -2.645 0.009
Physics 0.069 0.044 0.038 1.567 0.118
Political Science -0.146 0.054 -0.062 -2.706 0.007
Psychology -0.060 0.038 -0.039 -1.570 0.118
School of Education -0.146 0.048 -0.071 -3.051 0.003
School of Music, Theatre and Dance
-0.310 0.030 -0.280 -10.253 0.000
School of Social Work -0.141 0.090 -0.035 -1.572 0.117
Sociology -0.186 0.044 -0.102 -4.278 0.000
Soil and Crop Sciences -0.114 0.044 -0.062 -2.611 0.010
Statistics 0.095 0.089 0.023 1.058 0.291
ASSOCYRS 0.001 0.002 0.041 0.763 0.446
ASSOCYRS2 0.000 0.000 -0.128 -2.449 0.015

Assistant Professor Minority
Unstandardized Coefficients
Standardized Coefficients
t Sig. B Std. Error Beta
(Constant) 11.474 0.013 898.135 0.000
ASSISTMIN -0.007 0.007 -0.013 -0.999 0.319
Accounting 0.610 0.024 0.338 25.540 0.000
Agricultural and Resource Economics
-0.106 0.022 -0.064 -4.725 0.000
Animal Sciences -0.148 0.022 -0.090 -6.640 0.000
Anthropology -0.353 0.026 -0.175 -13.573 0.000
Art and Art History -0.439 0.021 -0.287 -20.749 0.000
Atmospheric Science 0.096 0.034 0.034 2.803 0.006
Bioagricultural Sciences and Pest Management
-0.151 0.021 -0.099 -7.134 0.000
Biochemistry and Molecular Biology
-0.160 0.029 -0.069 -5.471 0.000
Biology -0.161 0.026 -0.080 -6.233 0.000
Biomedical Sciences -0.100 0.024 -0.055 -4.211 0.000
Chemical and Biological Engineering
0.027 0.034 0.009 0.782 0.435
Chemistry -0.072 0.021 -0.047 -3.386 0.001
Civil and Environmental Engineering
-0.026 0.020 -0.018 -1.305 0.193
Clinical Sciences -0.090 0.021 -0.059 -4.256 0.000
Communication Studies -0.332 0.020 -0.245 -17.003 0.000
Computer Information Systems
0.417 0.035 0.147 12.042 0.000
Computer Science 0.135 0.024 0.075 5.709 0.000
Construction Management -0.183 0.024 -0.101 -7.690 0.000
Design and Merchandising -0.215 0.024 -0.119 -9.060 0.000
Economics -0.003 0.029 -0.001 -0.088 0.930
Ecosystem Science and Sustainability
-0.264 0.029 -0.114 -9.076 0.000
Electrical and Computer Engineering
0.023 0.026 0.012 0.903 0.367
English -0.405 0.021 -0.265 -19.107 0.000
Environmental and Radiological Health Sciences
-0.037 0.019 -0.029 -1.963 0.051
Ethnic Studies -0.378 0.029 -0.163 -12.951 0.000
Finance and Real Estate 0.608 0.026 0.302 23.577 0.000
Fish, Wildlife and Conservation Biology
-0.230 0.034 -0.081 -6.683 0.000
Food Science and Human Nutrition
-0.242 0.047 -0.060 -5.117 0.000
FY19 Faculty Salary Equity Analysis

FY19 Faculty Salary Equity Analysis 21
Assistant Professor Minority
Unstandardized Coefficients
Standardized Coefficients
t Sig. B Std. Error Beta
Forest & Rangeland Stewardship
-0.267 0.024 -0.148 -11.169 0.000
Geosciences -0.226 0.026 -0.113 -8.722 0.000
Health and Exercise Science -0.220 0.022 -0.134 -9.912 0.000
History -0.423 0.021 -0.277 -20.029 0.000
Horticulture and Landscape Architecture
-0.205 0.029 -0.088 -7.043 0.000
Human Development and Family Studies
-0.250 0.029 -0.108 -8.633 0.000
Human Dimensions of Natural Resources
-0.295 0.026 -0.147 -11.386 0.000
Journalism and Media Communication
-0.387 0.022 -0.235 -17.418 0.000
Languages, Literatures and Cultures
-0.435 0.029 -0.188 -15.009 0.000
Library -0.844 0.029 -0.364 -29.010 0.000
Management 0.394 0.029 0.170 13.555 0.000
Marketing 0.465 0.034 0.164 13.535 0.000
Mathematics -0.182 0.022 -0.110 -8.154 0.000
Microbiology, Immunology and Pathology
-0.109 0.019 -0.085 -5.748 0.000
Occupational Therapy -0.237 0.026 -0.118 -9.119 0.000
Philosophy -0.342 0.029 -0.148 -11.817 0.000
Physics -0.206 0.024 -0.114 -8.681 0.000
Political Science -0.331 0.024 -0.184 -13.930 0.000
Psychology -0.235 0.029 -0.102 -8.134 0.000
School of Education -0.282 0.020 -0.197 -13.912 0.000
School of Music, Theatre and Dance
-0.461 0.018 -0.391 -25.638 0.000
School of Social Work -0.338 0.022 -0.205 -15.166 0.000
Sociology -0.349 0.022 -0.212 -15.705 0.000
Soil and Crop Sciences -0.108 0.024 -0.060 -4.542 0.000
Statistics -0.050 0.026 -0.025 -1.930 0.055
ASSTYRS 0.004 0.001 0.038 3.172 0.002

Appendix B Relationship between Log Salary and Years in Rank
Figure 1.
Figure 2.
Figure 3.
FY19 Faculty Salary Equity Analysis