investor presentation february 2018 - deep industries industries ltd... · fy13 fy14 fy15 fy16 fy17...
TRANSCRIPT
DEEP Industries LimitedInvestor Presentation – February 2018

This presentation and the accompanying slides (the “Presentation”), which have been prepared by Deep Industries Ltd(the “Company”), have been prepared solely for information purposes and do not constitute any offer,recommendation or invitation to purchase or subscribe for any securities, and shall not form the basis or be relied on inconnection with any contract or binding commitment whatsoever. No offering of securities of the Company will bemade except by means of a statutory offering document containing detailed information about the Company.
This Presentation has been prepared by the Company based on information and data which the Company considersreliable, but the Company makes no representation or warranty, express or implied, whatsoever, and no reliance shallbe placed on, the truth, accuracy, completeness, fairness and reasonableness of the contents of this Presentation. ThisPresentation may not be all inclusive and may not contain all of the information that you may consider material. Anyliability in respect of the contents of, or any omission from, this Presentation is expressly excluded.
This presentation contains certain forward looking statements concerning the Company’s future business prospectsand business profitability, which are subject to a number of risks and uncertainties and the actual results couldmaterially differ from those in such forward looking statements. The risks and uncertainties relating to thesestatements include, but are not limited to, risks and uncertainties regarding fluctuations in earnings, our ability tomanage growth, competition (both domestic and international), economic growth in India and abroad, ability to attractand retain highly skilled professionals, time and cost over runs on contracts, our ability to manage our internationaloperations, government policies and actions regulations, interest and other fiscal costs generally prevailing in theeconomy. The Company does not undertake to make any announcement in case any of these forward lookingstatements become materially incorrect in future or update any forward looking statements made from time to time byor on behalf of the Company.
2
Safe Harbor

Performance Snapshot
3
4
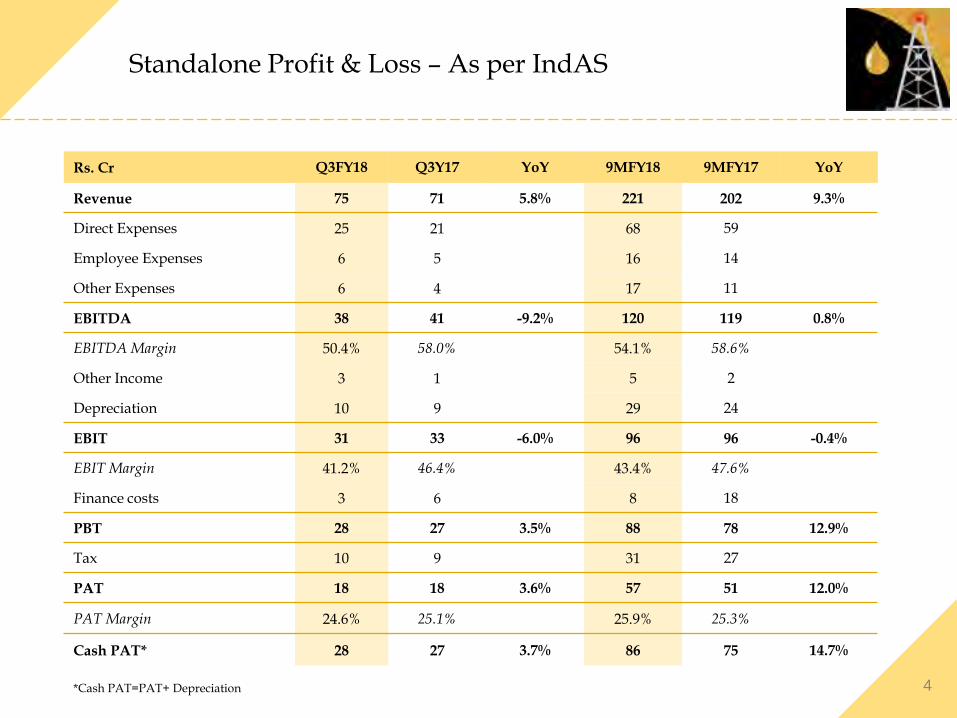
Standalone Profit & Loss – As per IndAS
Rs. Cr Q3FY18 Q3Y17 YoY 9MFY18 9MFY17 YoY
Revenue 75 71 5.8% 221 202 9.3%
Direct Expenses 25 21 68 59
Employee Expenses 6 5 16 14
Other Expenses 6 4 17 11
EBITDA 38 41 -9.2% 120 119 0.8%
EBITDA Margin 50.4% 58.0% 54.1% 58.6%
Other Income 3 1 5 2
Depreciation 10 9 29 24
EBIT 31 33 -6.0% 96 96 -0.4%
EBIT Margin 41.2% 46.4% 43.4% 47.6%
Finance costs 3 6 8 18
PBT 28 27 3.5% 88 78 12.9%
Tax 10 9 31 27
PAT 18 18 3.6% 57 51 12.0%
PAT Margin 24.6% 25.1% 25.9% 25.3%
Cash PAT* 28 27 3.7% 86 75 14.7%
*Cash PAT=PAT+ Depreciation
5
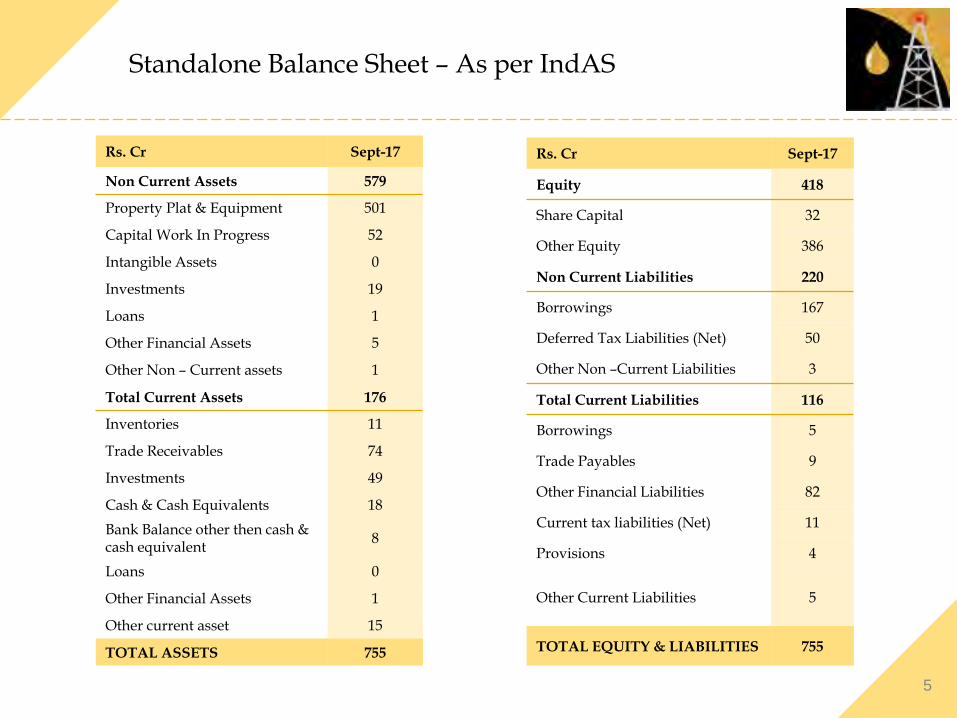
Standalone Balance Sheet – As per IndAS
Rs. Cr Sept-17
Equity 418
Share Capital 32
Other Equity 386
Non Current Liabilities 220
Borrowings 167
Deferred Tax Liabilities (Net) 50
Other Non –Current Liabilities 3
Total Current Liabilities 116
Borrowings 5
Trade Payables 9
Other Financial Liabilities 82
Current tax liabilities (Net) 11
Provisions 4
Other Current Liabilities 5
TOTAL EQUITY & LIABILITIES 755
Rs. Cr Sept-17
Non Current Assets 579
Property Plat & Equipment 501
Capital Work In Progress 52
Intangible Assets 0
Investments 19
Loans 1
Other Financial Assets 5
Other Non – Current assets 1
Total Current Assets 176
Inventories 11
Trade Receivables 74
Investments 49
Cash & Cash Equivalents 18
Bank Balance other then cash & cash equivalent
8
Loans 0
Other Financial Assets 1
Other current asset 15
TOTAL ASSETS 755

6
Growth over the Years
277
169
10191
221
FY16
+45%
9MFY18FY17FY14 FY15
120
156
96
5552
FY14
+44%
FY16 9MFY18FY17FY15
EBITDA (Rs Crs)Revenue (Rs Crs)
54.156.156.954.357.4
9MFY18FY16FY14 FY17FY15
EBITDA Margin (%) PAT (Rs Crs)
57
74
41
2120
FY16 FY17FY15FY14
+55%
9MFY18
9MFY18 financials are as per IndAS
7
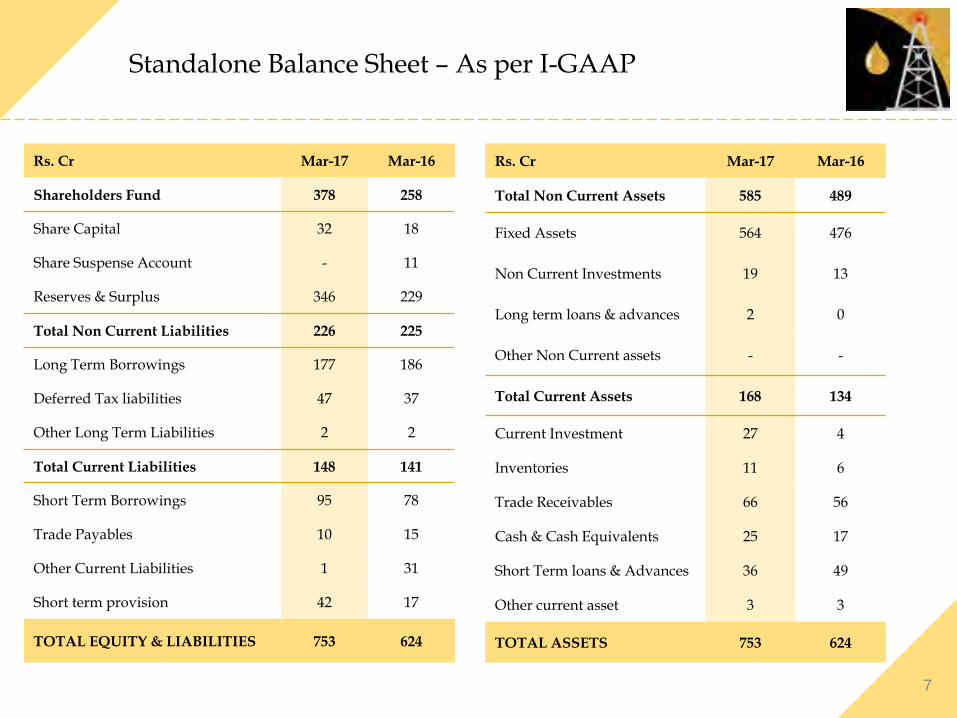
Standalone Balance Sheet – As per I-GAAP
Rs. Cr Mar-17 Mar-16
Shareholders Fund 378 258
Share Capital 32 18
Share Suspense Account - 11
Reserves & Surplus 346 229
Total Non Current Liabilities 226 225
Long Term Borrowings 177 186
Deferred Tax liabilities 47 37
Other Long Term Liabilities 2 2
Total Current Liabilities 148 141
Short Term Borrowings 95 78
Trade Payables 10 15
Other Current Liabilities 1 31
Short term provision 42 17
TOTAL EQUITY & LIABILITIES 753 624
Rs. Cr Mar-17 Mar-16
Total Non Current Assets 585 489
Fixed Assets 564 476
Non Current Investments 19 13
Long term loans & advances 2 0
Other Non Current assets - -
Total Current Assets 168 134
Current Investment 27 4
Inventories 11 6
Trade Receivables 66 56
Cash & Cash Equivalents 25 17
Short Term loans & Advances 36 49
Other current asset 3 3
TOTAL ASSETS 753 624

Historical Profit & Loss
Rs. Cr FY13 FY14 FY15 FY16 FY17
Revenue 65 91 101 169 277
Direct Expenses 16 22 24 40 84
Employee Expenses 7 9 13 14 20
Other Expenses 6 7 9 18 17
EBITDA 36 52 55 96 156
EBITDA Margin 55.2% 57.4% 54.3% 56.9% 56.1%
Other Income 2 1 1 1 8
Depreciation 10 12 12 20 34
EBIT 28 41 44 77 130
EBIT Margin 42.5% 45.5% 43.6% 45.3% 47.0%
Finance costs 6 9 11 15 22
PBT 21 33 33 62 108
Tax 9 13 12 21 34
PAT 12 20 21 41 74
PAT Margin 18.7% 22.1% 21.0% 24.2% 26.7%
Cash PAT 22 32 33 61 108
Cash PAT=PAT+ Depreciation
9
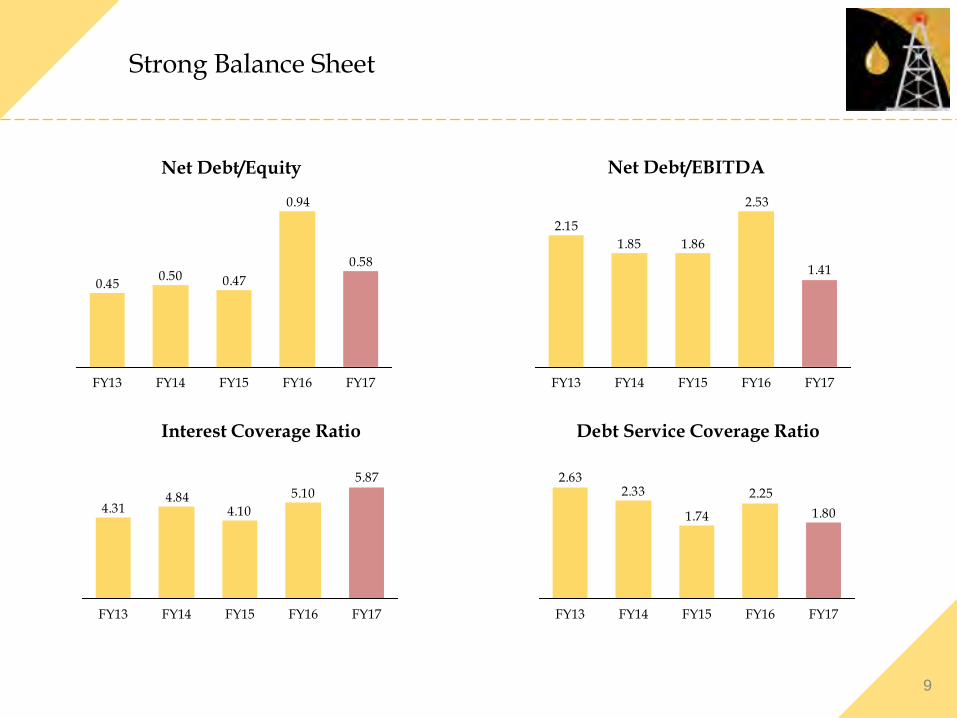
Strong Balance Sheet
0.58
0.94
0.470.500.45
FY16 FY17FY15FY14FY13
1.41
2.53
1.861.85
2.15
FY17FY13 FY14 FY16FY15
Net Debt/EBITDANet Debt/Equity
5.875.10
4.104.84
4.31
FY13 FY16FY15FY14 FY17
Interest Coverage Ratio
1.80
2.25
1.74
2.332.63
FY13 FY15FY14 FY17FY16
Debt Service Coverage Ratio
10
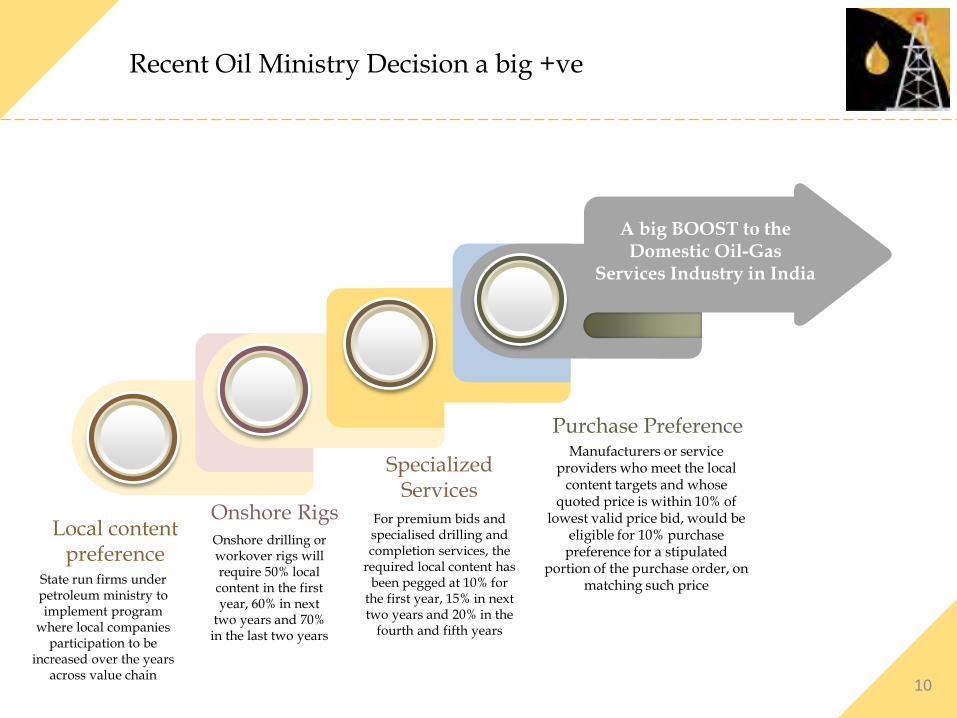
Recent Oil Ministry Decision a big +ve
Local content preference
Onshore RigsOnshore drilling or workover rigs will require 50% local content in the first year, 60% in next
two years and 70% in the last two years
Specialized Services
For premium bids and specialised drilling and completion services, the
required local content has been pegged at 10% for
the first year, 15% in next two years and 20% in the
fourth and fifth years
Purchase PreferenceManufacturers or service
providers who meet the local content targets and whose
quoted price is within 10% of lowest valid price bid, would be
eligible for 10% purchase preference for a stipulated
portion of the purchase order, on matching such price
A big BOOST to the Domestic Oil-Gas
Services Industry in India
State run firms under petroleum ministry to implement program
where local companies participation to be
increased over the years across value chain
11
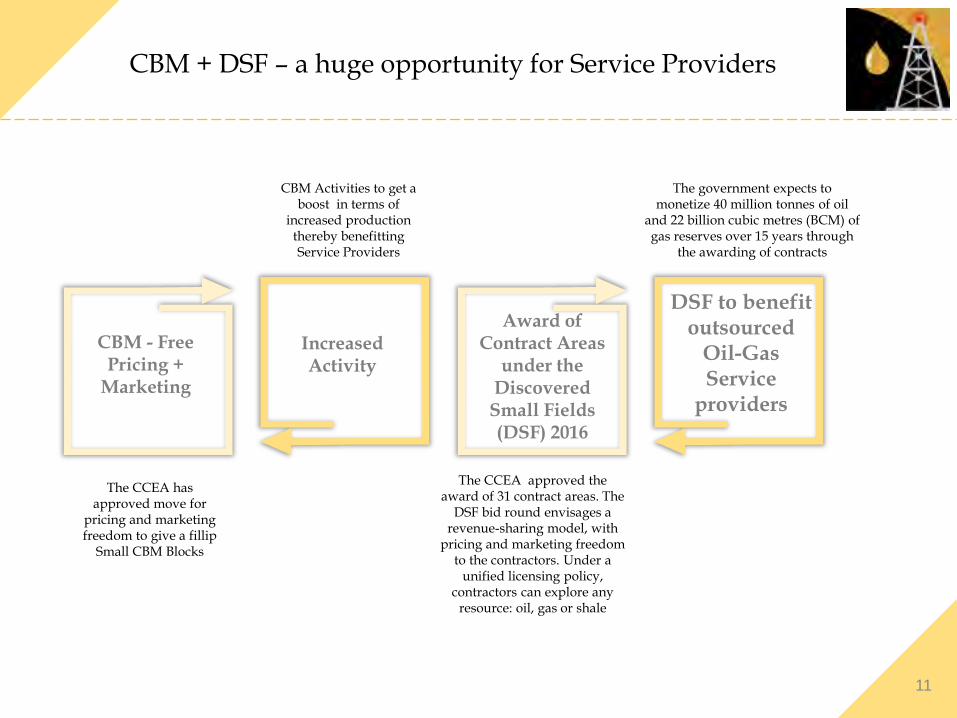
CBM + DSF – a huge opportunity for Service Providers
Increased Activity
DSF to benefit outsourced
Oil-Gas Service
providers
CBM - Free Pricing +
Marketing
Award of Contract Areas
under the Discovered
Small Fields (DSF) 2016
CBM Activities to get a boost in terms of
increased production thereby benefitting Service Providers
The government expects to monetize 40 million tonnes of oil
and 22 billion cubic metres (BCM) of gas reserves over 15 years through
the awarding of contracts
The CCEA has approved move for
pricing and marketing freedom to give a fillip
Small CBM Blocks
The CCEA approved the award of 31 contract areas. The
DSF bid round envisages a revenue-sharing model, with
pricing and marketing freedom to the contractors. Under a
unified licensing policy, contractors can explore any
resource: oil, gas or shale

About Us
13
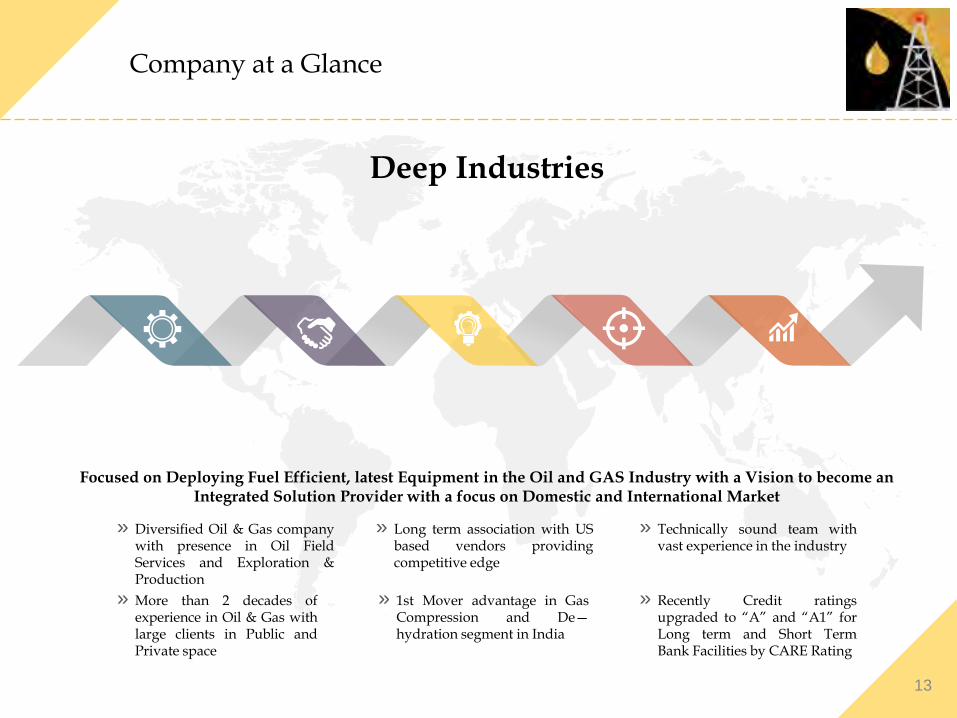
Company at a Glance
» More than 2 decades ofexperience in Oil & Gas withlarge clients in Public andPrivate space
» Long term association with USbased vendors providingcompetitive edge
» Diversified Oil & Gas companywith presence in Oil FieldServices and Exploration &Production
» Technically sound team withvast experience in the industry
» Recently Credit ratingsupgraded to “A” and “A1” forLong term and Short TermBank Facilities by CARE Rating
» 1st Mover advantage in GasCompression and De—hydration segment in India
Focused on Deploying Fuel Efficient, latest Equipment in the Oil and GAS Industry with a Vision to become an Integrated Solution Provider with a focus on Domestic and International Market
Deep Industries

14
Management Team
Chairman & MD
First generation promoter with over 21 years experience in Oil & Gas industry.
Paras Savla
Managing Director
MBA from Bentley College, USA, has over 18 years of experience in execution of projects inthe oil and gas sector
Rupesh Savla
Executive Director
MBA from Swinburne University of Technology, Australia with over 14 years experience, is instrumental in the Work Over Rig and Drilling Rig Activities
Dharen Savla
Director.ED & CEO for PEPL
Over 20 years of experience in exploration and development of conventional & unconventional hydro carbon resources. Past assignments include ONGC, Essar & Reliance Industries
Premsingh Sawhney
CFO
Holds CA degree from The Institute of Chartered Accounts of India. He has about 11 years of work experience of which he has been associated with our company for over 7 years .
Rohan Shah
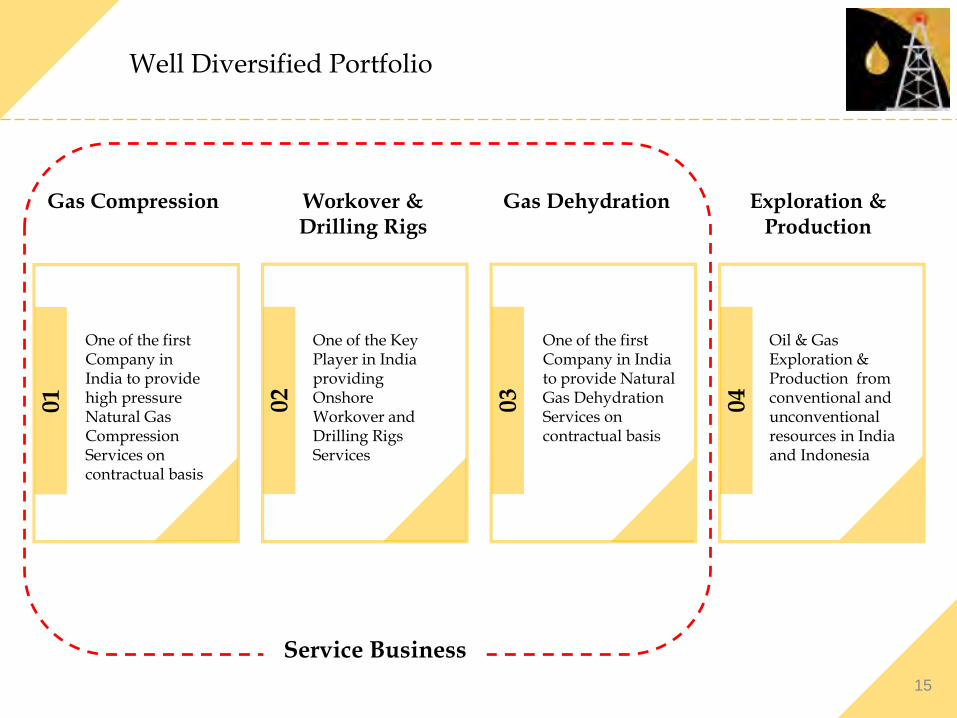
Well Diversified Portfolio01
One of the first Company in India to provide high pressure Natural Gas Compression Services on contractual basis
Gas Compression
02
One of the Key Player in India providing Onshore Workover and Drilling Rigs Services
One of the first Company in India to provide Natural Gas Dehydration Services on contractual basis
Oil & Gas Exploration & Production from conventional and unconventional resources in India and Indonesia
04
03
Exploration & Production
Gas DehydrationWorkover & Drilling Rigs
15
Service Business
16
Long Term Client Relationships
…a testimony of our capabilities
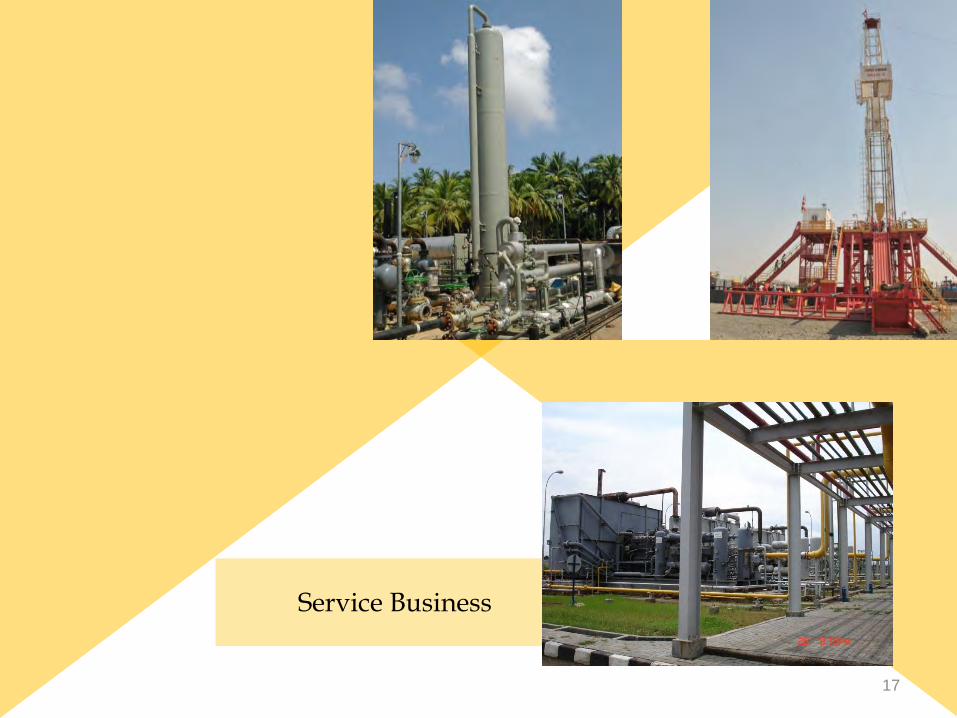
Service Business
17
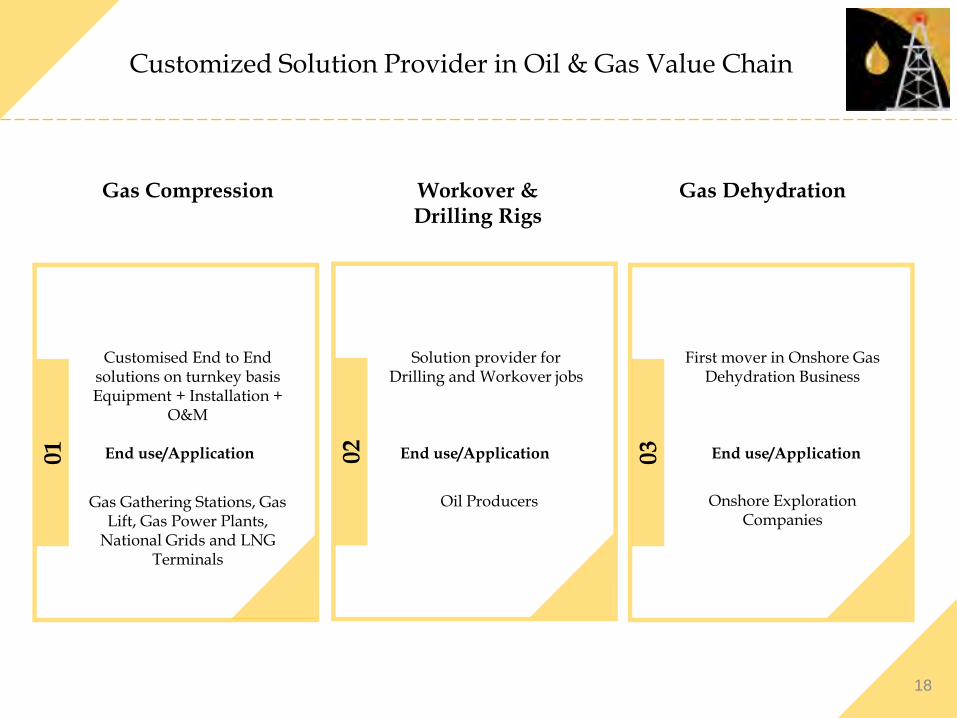
Customized Solution Provider in Oil & Gas Value Chain
Customised End to End solutions on turnkey basis Equipment + Installation +
O&M
Gas Gathering Stations, Gas Lift, Gas Power Plants,
National Grids and LNG Terminals
Gas Compression
Solution provider for Drilling and Workover jobs
Oil Producers
Workover & Drilling Rigs
First mover in Onshore Gas Dehydration Business
Onshore Exploration Companies
Gas Dehydration
01 02
03
18
End use/Application End use/Application End use/Application

19
Gas Compression Division
20
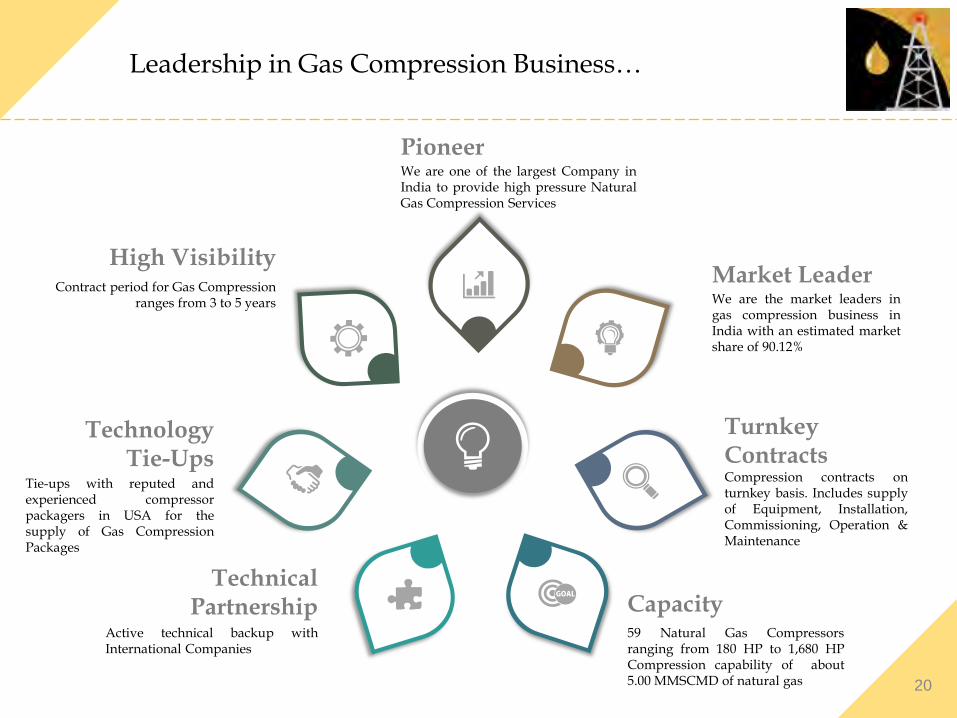
Leadership in Gas Compression Business…
PioneerWe are one of the largest Company inIndia to provide high pressure NaturalGas Compression Services
Market LeaderWe are the market leaders ingas compression business inIndia with an estimated marketshare of 90.12%
High VisibilityContract period for Gas Compression
ranges from 3 to 5 years
Turnkey ContractsCompression contracts onturnkey basis. Includes supplyof Equipment, Installation,Commissioning, Operation &Maintenance
Technical Partnership
Active technical backup withInternational Companies
Capacity59 Natural Gas Compressorsranging from 180 HP to 1,680 HPCompression capability of about5.00 MMSCMD of natural gas
Technology Tie-Ups
Tie-ups with reputed andexperienced compressorpackagers in USA for thesupply of Gas CompressionPackages

21
…In A Growing Market with Varied Applications…
Boil of Gas
Artificial Gas Lift
During transportation of Gas through pipeline, there ispressure loss. Compression of Natural Gas is required toboost the pressure to ensure that Natural Gas flowsthrough pipeline
Distribution
Due to heat entering the cryogenic tank during storageand transportation, a part of the LNG in the tankcontinuously evaporates creating a gas called Boil-Off Gas(BOG). We compress the said Natural Gas to ensurerecovery of same.
Reduce Loss of Evaporation
Artificial gas lift is used so that Oil production from Wellcan be enhanced. Can be used in mature, depleted fields,where the reservoir can no longer produce under itsnatural energy. Gas compression is used to inject gas intoWells.
Enhanced Oil Recovery
Gas Transportation
Gas Based Power PlantIn gas-turbine power plants, Natural Gas is used as fuel todrive turbines. These turbines are in turn connected togenerators which actually produce the electricity. GasCompression is used to boost pressure of Natural Gaswhich is used as fuel.
Power Generation
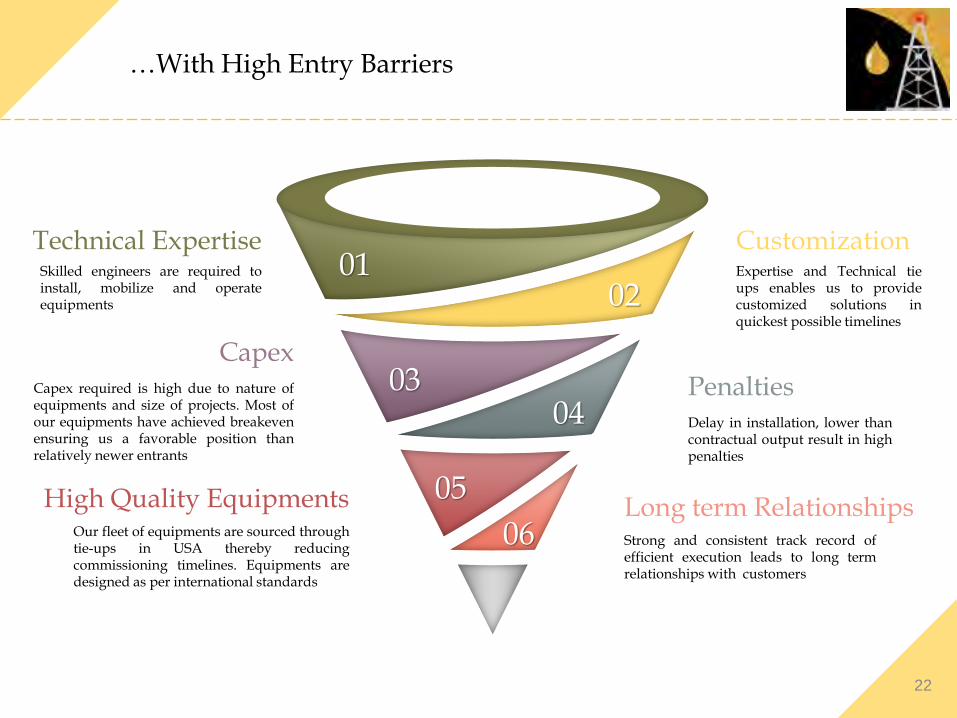
…With High Entry Barriers
0102
0304
05
06
CustomizationExpertise and Technical tieups enables us to providecustomized solutions inquickest possible timelines
PenaltiesDelay in installation, lower thancontractual output result in highpenalties
Long term RelationshipsStrong and consistent track record ofefficient execution leads to long termrelationships with customers
High Quality Equipments Our fleet of equipments are sourced throughtie-ups in USA thereby reducingcommissioning timelines. Equipments aredesigned as per international standards
CapexCapex required is high due to nature ofequipments and size of projects. Most ofour equipments have achieved breakevenensuring us a favorable position thanrelatively newer entrants
Technical ExpertiseSkilled engineers are required toinstall, mobilize and operateequipments
22

23
Rigs Division

24
Capitalising on Technology & Innovation
▪ Owns & Operates 9 Workover Rigs with
capacity rangaing from 30T to 100T, 2
Drilling Rig with capacity of 1000Hp & 1
coring Rig.
Assets & Capacities
▪ Successfully served long term contracts
with PSUs since last decade
Clients
▪ Build a diversified team which has
required skill set to carry out planning
and execution of large size project.
Capabilities
▪ Provided complete solutions related to
Exploration & Production of
hydrocarbons
▪ Developed cost effective solutions which
result in substantial savings to Clients
Expertise
▪ Focus will be to expand in Onshore
Drilling Business as there is a significant
opportunity in the Industry.
Focus
Leading Solution provider for Coring, Air Drilling, Work over and Drilling Rig Services to Oil & Gas companies in India

Growth Drivers
Benign Raw Material Prices
Low crude prices, soft metal prices and availability of skilled labor improves margin profile significantly
India has a stated policy of increasing energy reserves where the PSU’s contribute significantly.
Government’s Energy Push
Onshore Drilling Opportunity
Investments in Onshore drilling is low compared to offshore
Competition is low with the exit of few key players making the segment an attractive play for serious long term contenders
Low Competition
01
02
03
04
25
26
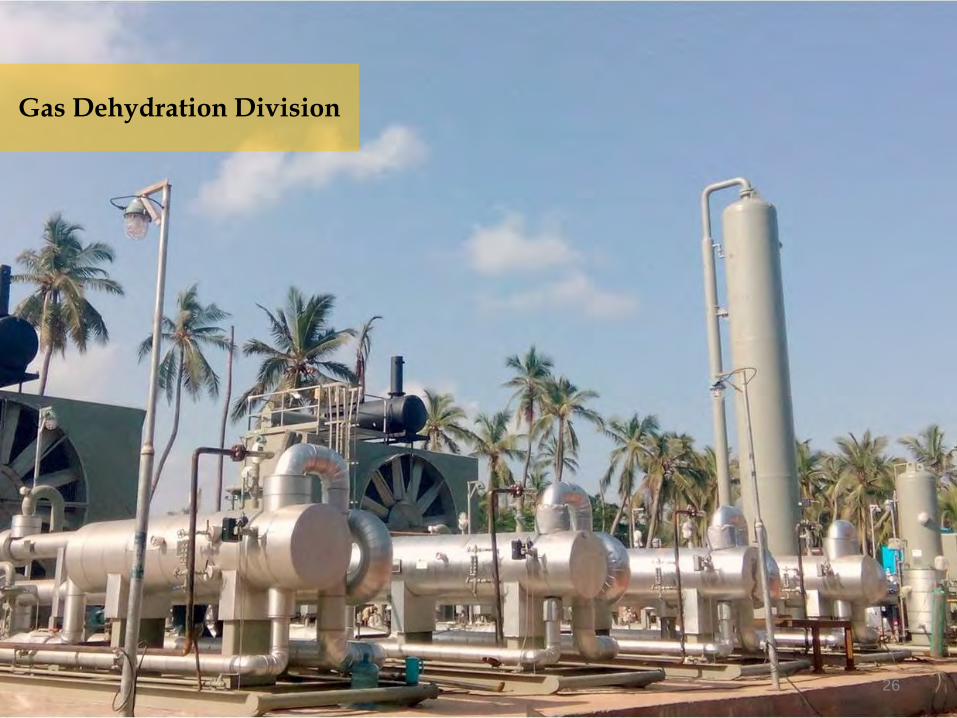
Gas Dehydration Division
27
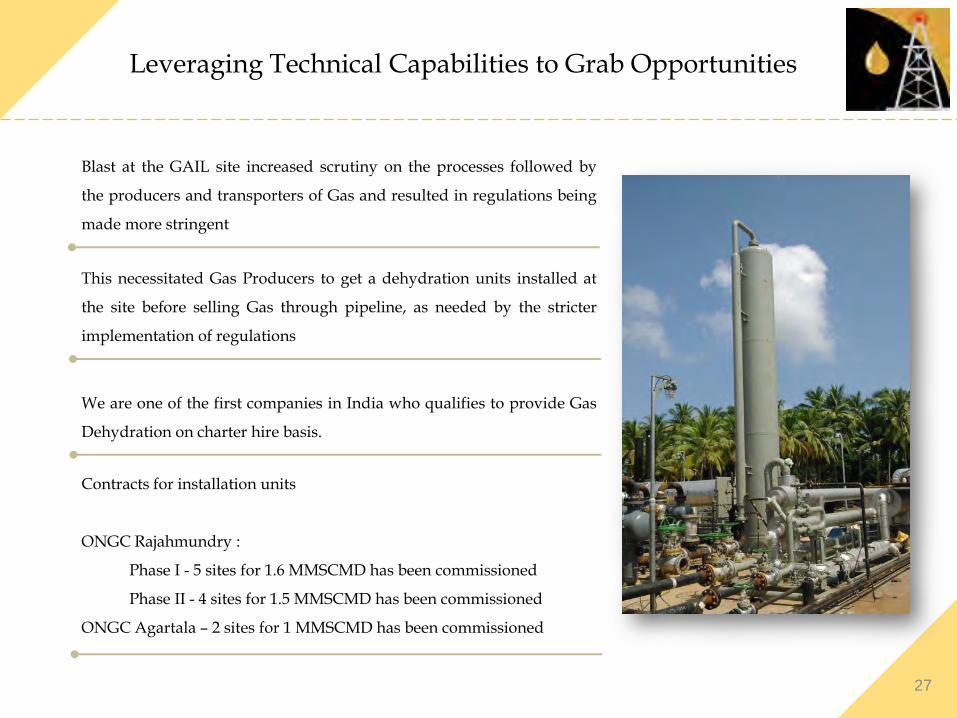
Leveraging Technical Capabilities to Grab Opportunities
Blast at the GAIL site increased scrutiny on the processes followed by
the producers and transporters of Gas and resulted in regulations being
made more stringent
This necessitated Gas Producers to get a dehydration units installed at
the site before selling Gas through pipeline, as needed by the stricter
implementation of regulations
We are one of the first companies in India who qualifies to provide Gas
Dehydration on charter hire basis.
Contracts for installation units
ONGC Rajahmundry :
Phase I - 5 sites for 1.6 MMSCMD has been commissioned
Phase II - 4 sites for 1.5 MMSCMD has been commissioned
ONGC Agartala – 2 sites for 1 MMSCMD has been commissioned
28
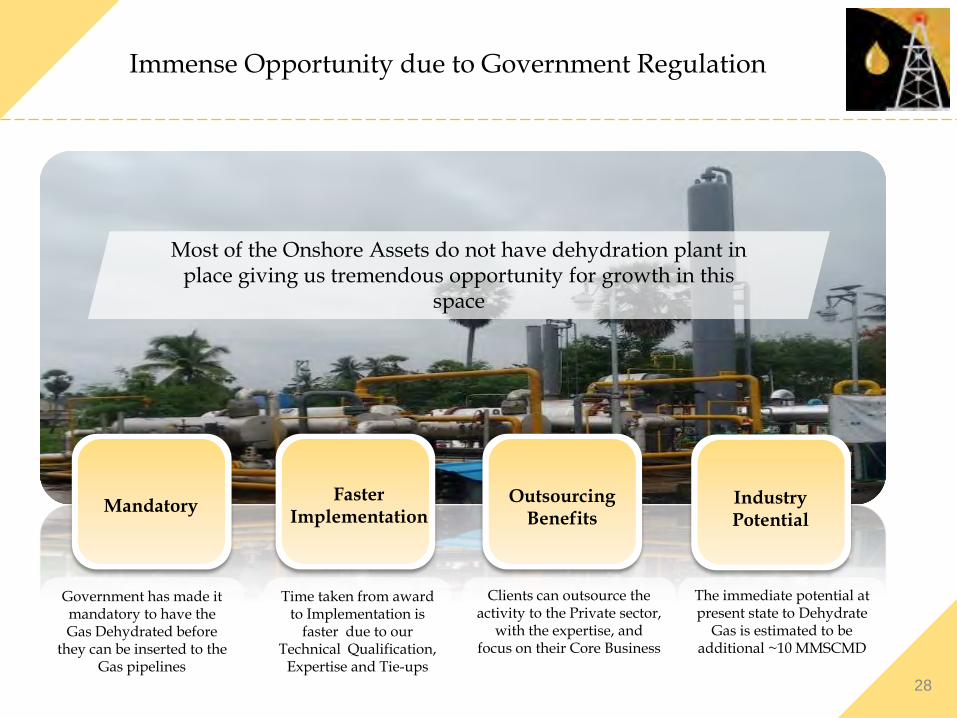
Immense Opportunity due to Government Regulation
Time taken from award to Implementation is
faster due to our Technical Qualification,
Expertise and Tie-ups
Clients can outsource the activity to the Private sector,
with the expertise, and focus on their Core Business
Government has made it mandatory to have the Gas Dehydrated before
they can be inserted to the Gas pipelines
Mandatory
The immediate potential at present state to Dehydrate
Gas is estimated to be additional ~10 MMSCMD
Faster Implementation
Outsourcing Benefits
Industry Potential
Most of the Onshore Assets do not have dehydration plant in place giving us tremendous opportunity for growth in this
space
29
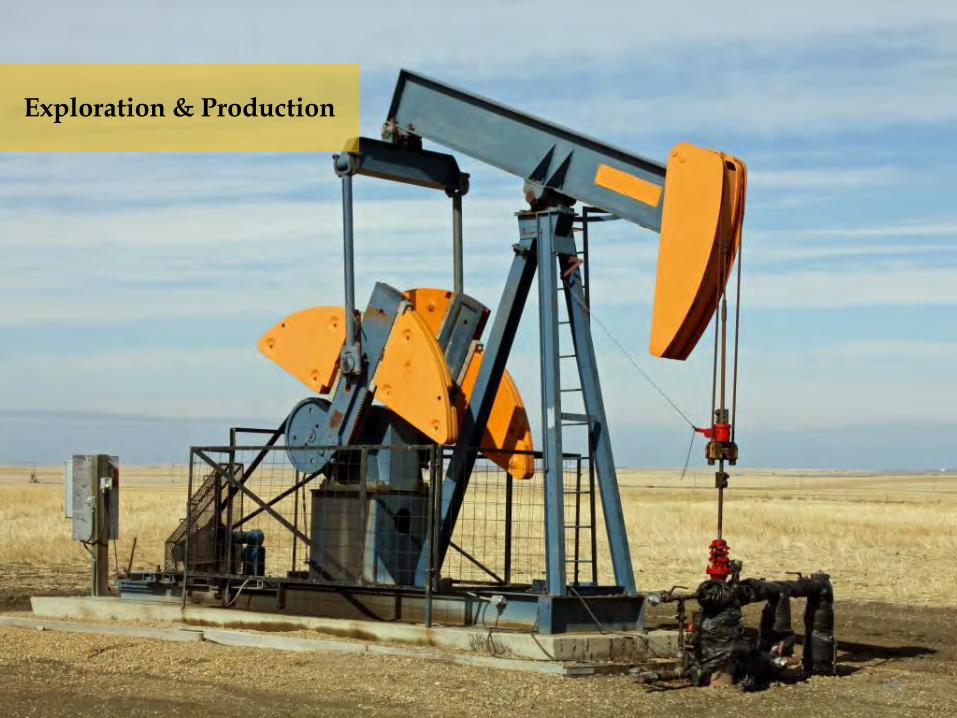
Exploration & Production

30
Exploration & Production Portfolio
Diversified into Oil & Gas exploration in 2006-07 seeing theopportunity in the space and unconventional energy being thefuture and thus is in the league of producers, service providersand technology providers
Out of 9 blocks - 4 blocks are in development phase, 1 block inappraisal phase and rest in exploration phase. These include 1CBM block acquired by our subsidiary company
The total acreage operated by the company is over 6,865 sq km.
Reservoir Type India Indonesia Total
Oil & Gas 5,199 sq. km - 5,199 sq. km
CBM 670 sq. km 996 sq. km 1,666 sq. km
Total Acreage holding:
Maps not to scale. All data, information, and maps are provided "as is" without warranty or any representation of accuracy, timeliness or completeness
NK-CBM-2001/1
Acreage : 340 Sq.
km
Marginal Gas fieldsTotal Acreage: 100 sq. km
VN-ONN-2010/1Acreage: 3776 sq. km
SR-ONN-2005/IAcreage: 789 sq. km
SR-CBM-2005/IIIAcreage: 330 sq. km
CB-ONN-2010/3Acreage: 534 sq. km
Business Potential
31

32
Growing Market Potential
In 2005, India natural gas compressionservices market was valued at USD88.51 Mn and this is projected to reachUSD 139.29 Mn by 2021
Gas Compression
There lies a vacuum in onshore rigsbusiness with few experienced playersexiting the marketThe Company has been aggressivelygrowing its Rigs business
Workover & Drilling Rigs
Government has made it mandatory tohave the Gas dehydrated before theycan be inserted to the gas pipelinesWe are one of the first companies toenter the gas dehydration servicesbusiness
Gas Dehydration
The North Karanpura CBM blockwhich has been awarded to oursubsidiay, PEPL, is in the developmentphase and , as per our expectation gasproduction will start in the 2 years.
Exploration and Production

33
Certificates….
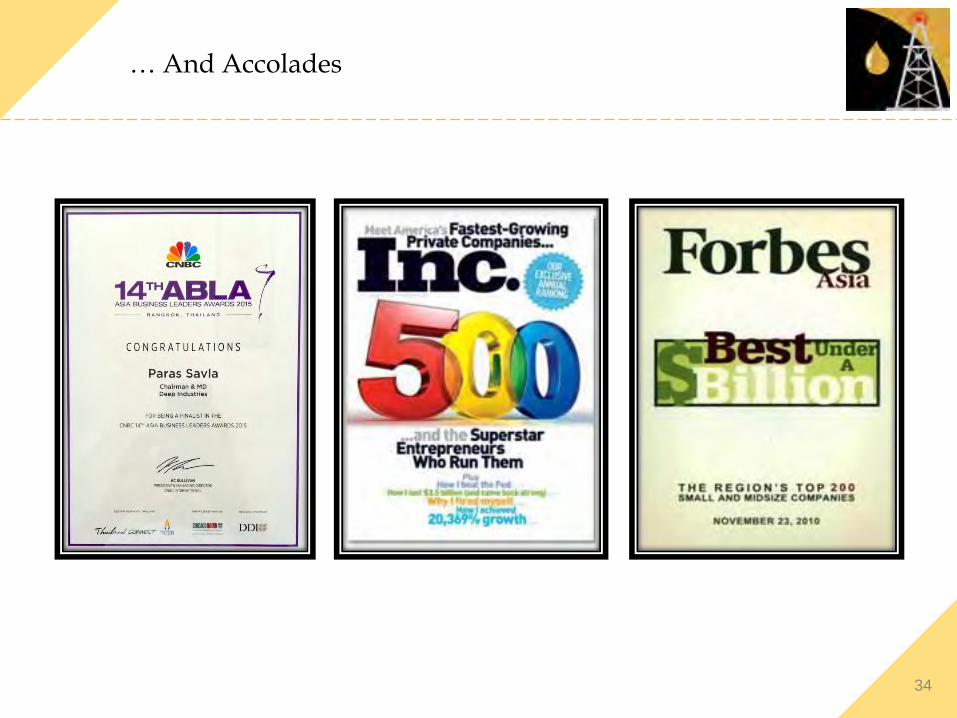
… And Accolades
34
35
For further information, please contact:
Company : Investor Relations Advisors :
Deep Industries LtdCIN: L63090GJ1991PLC014833Mr. Rohan Shah, [email protected]
www.deepindustries.com
Strategic Growth Advisors Pvt. Ltd.CIN: U74140MH2010PTC204285Mr. Shogun Jain / Mr. Pratik R. [email protected] / [email protected]+91 77383 77756 / +91 97692 60769www.sgapl.net