ezt-toim-12-2010-last-english.pdf Англи
TRANSCRIPT

8/7/2019 EZT-Toim-12-2010-last-English.pdf Англи
http://slidepdf.com/reader/full/ezt-toim-12-2010-last-englishpdf- 1/50
ECONOMIC REVIEW /December 2010/ NDIC 1
1. EXECUTIVE SUMMARY
Current macroeconomic indicators
Main activities occurred in social and economic sectors of Mongolia during 2010
Business-enabling environment reform year
Government of Mongolia, by Resolution No. 377 dated December 30th
of 2010, has
declared year 2010 as the “Business-enabling environment reform year” with the purpose of
supporting activities of business owners, lowering state participation in business activities to an
appropriate level and providing favorable legal and regulatory conditions.
In this regard, 101 licenses and approvals were cancelled and decision was made to
transfer authority to grant 10 licenses to professional non-governmental organizations on
contract basis. By doing so, Government of Mongolia has dissolved 35 percent of 337 licenses
for conducting business activities which is more than one third of total number. For instance,
signatures of 118 officials were needed to construct one building before, but it was cut down to
56. It reduced around 480 days an enterprise spent to collect the signatures to 180 days.
12.2009 12.2010
GDP growth (percentage) -1.3 6.1
Industrial sector growth (percentage) -3.2 10.0
Budget deficit (MNT billion) -342.6 3.5
Unemployment (thousand people) 38.0 38.2
Inflation (percentage) 4.2 13
Foreign trade turnover (USD million) 4023.1 6177.1
Foreign trade balance (USD million) -252.3 -378.7
MONGOLIAN ECONOMIC REVIEW
DECEMBER 2010
Үнäэсний хөãжил, шинэтãэлийн хороо

8/7/2019 EZT-Toim-12-2010-last-English.pdf Англи
http://slidepdf.com/reader/full/ezt-toim-12-2010-last-englishpdf- 2/50
ECONOMIC REVIEW /December 2010/ NDIC 2
Thus, in response to the government policy to annul some licenses to conduct business
activities, a draft law on amending „law on licenses for business activities‟ along with related 20
or so draft laws were discussed and submitted to the State Great Khural for approval.
Development Bank
Development Bank of Mongolia was established by the Government and its article of
association was adopted. The Bank ‟s main responsibility is to provide financial service in the
strategically important sectors. The Bank shall provide medium to long-term financing to the
selected sectors, shall extend its cooperation with the international development banks and
organizations and utilize domestic and foreign capital into the economic circulation. By investing
in large projects to be implemented by the government of Mongolia through Development Bank,
every MNT 100 billion could contribute 1 percent of growth for the economy.
A draft law on Development Bank was discussed at the cabinet meeting of Mongolian
government and it was decided to submit the draft to the parliament upon reflecting changes
based on suggestions from the cabinet members. Government of Mongolia will provide loan
guarantee on behalf of the Development Bank and the Bank will directly finance beneficial
projects.
Infrastructure and heavy industrial factories that are to be established with investment
from the Development Bank will play important part to intensify the development of the nation,
to improve processing industrial sector, to substitute import products, to refine structure of gross
domestic products, and to increase diversification of the economy. The Development Bank,
hundred percent state-owned entity, will form its capital with allocation from state budget as well
as from certain amount of government stakes in legal entities holding mining licenses on
strategically important mineral deposits.
UN applauded National report
Mongolia has prepared National report of Mongolia on situation of human rights and UN
Human Rights Council on November 2-4th
, 2010 discussed and confirmed the report. United
Nations considered that the report covers all the necessary information and that difficulties
Mongolia are facing in protecting human rights were all covered. They also applauded that close
collaboration with civil society organizations and non-governmental organizations was utilized
when preparing the report. The announcement of the moratorium of death penalty in Mongolia
was also welcomed.
Erdenes-Tavantolgoi share-holding company was established.
It was established as a subsidiary company of “Erdenes MGL” company and financing
needed to form registered capital is to be funded from the capital of Erdenes MGL LLC. Step-
by-step actions are planned to be implemented after the establishment to give 10 percent of the

8/7/2019 EZT-Toim-12-2010-last-English.pdf Англи
http://slidepdf.com/reader/full/ezt-toim-12-2010-last-englishpdf- 3/50
ECONOMIC REVIEW /December 2010/ NDIC 3
company‟s stakes to Mongolian citizens, to sell another 10 percent to the national enterprises at a
nominal price and to sell up to 30 percent of stakes in an initial public offering through national
and international stock exchanges. 50 percent of all stakes are to be retained by the government.
Civil registration and Human Development Fund
Revised civil registration covered 1.151.236 /one million one hundred fifty one thousand
two hundred and thirty six/ citizens that account for 61 percent of total population.First phase of motherland allowance or share was organized to distribute MNT 70000
from February 1st, 2010 and to handout remaining MNT 50000 from August 1
st, 2010. Progress
of allocating motherland allowance and share from the Human Development Fund is currently at
94.6 percent.
Arrangement was made to allow students to pay their tuition with Human Development
Fund allowance. University and college students are responsible for their tuition between
September to December, 2010 during 2010-2011 school year, but starting from the first quarter
of 2011, remaining tuition amount is arranged to be deducted from Human Development Fund.
Positive outcome emerged from cooperation with IMF
Government of Mongolia has implemented International Monetary Fund‟s “Stand-by”
program since April 2009 to stabilize the economy. During the period of cooperation between
the Government of Mongolia and IMF, not only did fiscal and financial situation get stable, but
budget deficit also got reduced and balance of payments was improved. Concrete outcomes were
achieved through actions executed by the Government of Mongolia within the framework of
“stand-by” program such as increase of foreign currency reserves, deceleration of rise of
inflation and stabilization of economic situation.
10 million livestock loss due to dzud and outbreak of highly infectious livestock diseases
Weather in winter and spring of 2010 severely worsened and 90 percent of the territorywas covered under snow. Around 10 million heads of livestock was lost due to temperaturegoing down to -40 Celsius, as a result, damages worth tens of thousands of billion MNToccurred. Around 1800 herder families lost all their livestock and carrion of livestock wascleaned up and destroyed. Aid worth MNT 75 billion was given by the state.
Within the framework of actions to prevent foot and mouth disease occurred during Apriland May of 2010, 1.6 million heads of livestock were vaccinated including all cows in Dornodand Sukhbaatar aimags, cows in two bordering soums of Khentii aimag and all large and small
cattle in soums of Dornogovi and Umnugovi aimags bordering Chinese territory. Due to the wideand quick spread of highly infectious foot and mouth diseases in Dornod and Sukhbaatar aimags,local administrative units, enterprises and citizens were announced with highly-preparedsituation alert and quarantine was set.
“Newcastle”, a contagious avian disease, broke out in territory of 13 th khoroo, Tuul
county at Khan-Uul district of the capital city. Thanks to government of Mongolia ‟s prompt

8/7/2019 EZT-Toim-12-2010-last-English.pdf Англи
http://slidepdf.com/reader/full/ezt-toim-12-2010-last-englishpdf- 4/50
ECONOMIC REVIEW /December 2010/ NDIC 4
order of MNT 125 million for actions to be taken to arrest the spread of disease, outspread was
stopped without wide epidemic.
Population and housing census was organized
National census of population and housing was organized throughout the country
between 11-17th of November, 2010. The census covered Mongolian citizens living in Mongolia,
professionals and their families working in diplomatic missions in foreign countries andinternational organizations, citizens working and studying abroad for more than 6 months,
foreign citizens residing in Mongolia for long term and stateless people. A total number of
714,784 families and 2,650,673 people filled out the questionnaire forms during the census.
Filled-out questionnaire and internet survey answers will be combined and preliminary report
including the number of registered families, population, their age, sex and housing condition will
be ready in February of 2011. Final report is scheduled to be submitted to National commission
on census within July of 2011.
Atar III campaign was successfully implemented and food campaign started
Within the framework of “Atar III campaign” 2010 /cultivation campaign/ initiated by
Mr. Bayar, former Prime minister of Mongolia, a total of 355.1 thousand tonnes of grain, of
which 345.5 tonnes of wheat, 168 thousand tonnes of potato, 90.3 thousand tonnes of vegetable,
4.3 thousand tonnes of barley, 4.3 thousand tonnes of oat and 32.3 thousand tonnes of fodder
plants were harvested. Therefore, it became possible to provide 100 percent of domestic demand
of wheat and potato and 60 percent of vegetable with domestic supply.
Government of Mongolia has decided to continue the „Atar III campaign‟ as food
campaign to couple intensified livestock breeding with farming in order to ensure supply, quality
and safety of food products.
Issue of great debt was completely solved
During the official visit to Russia by Prime Minister of Mongolia, Mr. S.Batbold, parties
agreed to discount 97.8 percent of remaining great debt amount of USD 172 million and to make
payment once worth USD 3.8 million to Russia. Moreover, parties decided to establish joint
“Dornod-Uran” company of which Mongolian side would own 51 percent share.

8/7/2019 EZT-Toim-12-2010-last-English.pdf Англи
http://slidepdf.com/reader/full/ezt-toim-12-2010-last-englishpdf- 5/50
ECONOMIC REVIEW /December 2010/ NDIC 5
2. ECONOMIC GROWTH
REAL ECONOMIC GROWTH
Gross domestic product
In 2010, real GDP increased 7.6 percent in the first quarter and 3.4 percent in the secondquarter; however, the growth rate accelerated to reach 8.4 percent in the third quarter.
Preliminary estimate of GDP growth last year was 6.1 percent year on year basis reaching MNT
4154.0 billion. GDP in real terms was positively affected by the increase of 6.3 percent growth
of mining and extractive industrial sector, 11.3 percent growth of processing industrial sector,
15.6 percent growth of construction sector and 23.4 percent growth of wholesale and retail trade.
However, due to the wintering, climate hardship and its severity, unnatural loss of livestock
increased which resulted in 16.8 percent contraction of agriculture sector.
Graph 1. Share of sectors providing real GDP growth /percentage/
Agricultural sector
As a result of high degree of unnatural loss of big cattle, supplies of livestock products
such as meat, milk, wool and cashmere decreased. Especially, high level of unnatural loss of
goats has led to sharp drop in supply of cashmere which is the main product of cattle-breeding
sector. State Great Khural of Mongolia had approved and begun implementing “National
Mongolian Livestock Program” in order to protect livestock from natural hazard and to improve
livelihood of herders. It necessitates further needs to organize implementation of this program
and to promptly take actions to re-stock herders. Moreover, it is important to organize transfer of
herder families who lost their livestock completely to different sectors in which demand and
need of workforce are strong.

8/7/2019 EZT-Toim-12-2010-last-English.pdf Англи
http://slidepdf.com/reader/full/ezt-toim-12-2010-last-englishpdf- 6/50
ECONOMIC REVIEW /December 2010/ NDIC 6
In terms of farming sector, Atar-III national campaign, “Cultivation campaign”, was
organized. Within the framework of the program, a total area of 312.2 thousand hectares was
cultivated in 2010 and as a result, 355.1 thousand tonnes of grain, 168 thousand tonnes of potato,
and 82.3 thousand tonnes of vegetable were harvested. It supplied 100 percent of domestic
demand of wheat and potato and 60 percent of domestic vegetable demand. Total cultivated area
in 2010 is an increase of 11.4 percent compared to last year and cyclic cultivation territory
reached 584 thousand hectares in total with the addition of 255.3 thousand hectares of land from
fallow land as well as rested land.
Government of Mongolia has decided to implement “Khalkh river” project in the eastern
region in order to further intensify development of farming sector. It is the first step to develop
cattle-breeding sector and farming sector in the eastern region as independent, environmentally-
friendly and export-oriented animal husbandry and farming sector. Furthermore, the project will
ensure food security in the region and supply ecologically pure products to the world market.
Moreover, a draft of “Law on exchange market for agricultural products and raw
materials” is formulated with the purpose of utilizing agriculture-based products into economiccycle, implementing standards for preparing, transporting, and storing raw materials and
providing pre-condition for manufacturers to be supplied regularly with seasonal raw materials.
Industrial and construction sector
Industrial sector saw strong growth in 2010 and preliminary estimates of 2010 stated that
surplus value of the sector has reached MNT 1196.5 billion year on year which is a 7.7 percent
increase from last year. Coal exploration, in 2010, has increased 91.8 percent, petroleum
exploration increased 16.7 percent and iron ore production also increased 2.3 times. As a result,
value of mining sector reached MNT 756.4 billion increasing by 6.3 percent compared to 2009.
Exploration capacity of newly-established Ovoot Tolgoi, Ukhaa Khudag, and Khushuut coal
mines expanded and coal production is increasing. Also, capacity of iron ore mines such as
Tumurtei, Bayangol, Tayannuur, Kharangat, Elstei and Tumurtolgoi enlarged as well.
Exploration of petroleum reached 2.2 million barrels in 2010 due to the intensification of
petroleum mining works in Tamsag and Dornogovi basins.
Surplus values produced in processing industrial sector increased by 11.3 percent year on
year, reaching MNT 260.7 billion. Food production enlarged the most and production of grain,
flour, milk and dairy products increased as well.
Surplus value of construction sector reached MNT 59.8 billion due to the 15.6 percentrise from year 2009. 25.6 percent increase or MNT 71.4 billion in construction assembly and
overhaul maintenance and 30.3 percent rise or MNT 75.9 billion increase in domestic
companies‟ perfor med work largely affected above-mentioned positive impacts.
8/7/2019 EZT-Toim-12-2010-last-English.pdf Англи
http://slidepdf.com/reader/full/ezt-toim-12-2010-last-englishpdf- 7/50
ECONOMIC REVIEW /December 2010/ NDIC 7
Services sector
Surplus value of services sector reached MNT 1687.4 billion year on year which was an
increase of 4.6 percent compared to the same time last year. Although wholesale and retail trade
sector saw deficit in 2009, it regained its growth in 2010 and surplus value went up by 23.4
percent. Boost of surplus value in this sector was largely due to the 62.4 percent increase of turnover in wholesale and retail trade sector from last year, 53.3 percent increase in imported
product amount and 34.4 percent increase of enterprises conducting activities in this sector which
reaching 5058.
Increased frequency of mining exploration activities and start of construction and
development works of Oyutolgoi project resulted in increase of transported freight for import
which in turn affected surplus value of transportation sector to increase by 9.1 percent. Overall
transported freight amount reached 29.4 million tonnes in 2010 which is 18.7 percent increase
from last year‟s amount.
Value-added tax income increased by 77.1 percent, excise tax income went up by 61
percent and foreign trade tax income increased by 66.7 percent. These affected taxation income
to be 54.2 percent higher than last year at current year price.
Conclusion
Economy of the nation had diminished by 1.3 percent in 2009 due to financial and
economic difficulties, but economy started to regain its stability and recovery from the beginning
of 2010 and real GDP saw 6.1 percent growth. Processing industry and trade sectors experienced
the highest growth rates in 2010 recovering from previous year‟s deficit. Moreover, considerable
increase of taxation income also affected GDP growth positively. Further large planneddevelopment works in mining and infrastructure sectors are projected to bring economic growth
to high level in the medium term.
Product sales of industrial sector
Amount of industrial sector products sold reached MNT 4468.2 billion at current year
price as of 2010. Products worth MNT 3062.6 billion or 68.5 percent of total was traded in
foreign markets.
Share of mining and exploiting industry in total amount of sale reached 70.6 percent
which is an addition of 4.7 points compared to the same time last year. Likewise, share of
processing industry also increased to 21 percent due to high growth of mining sector, seeing
growth of 3.7 points while share of energy production for heating and electricity and water
supply sectors took up 8.4 percent which is 1 point drop from last year.

8/7/2019 EZT-Toim-12-2010-last-English.pdf Англи
http://slidepdf.com/reader/full/ezt-toim-12-2010-last-englishpdf- 8/50
ECONOMIC REVIEW /December 2010/ NDIC 8
Graph 2. Sales pattern on industrial sector products / as of 2010, percentage/
It shows that the reason the share
of mining and exploiting industry
increased in sales pattern was because
coal and iron ore export had increased
sharply and market prices of mining
commodities had gone up in the worldmarket.
If we look at the breakdown of
industrial products exported to and sold in
the international markets, 100 percent of
mined petroleum products, 92.9 percent
of metal ore production, 89.4 percent of
coal production, 64.2 percent of knitting sector production, 47.1 percent of iron factory
production and 4.2 percent of food products were sold in foreign markets.
Workforce in industrial sector was 54289 as of December, 2010 which was after the
positive growth of 3.3 percent of 1715 workers compared to the same time of the previous year.
Labor productivity in industrial sector at current year price reached MNT 36.5 million.
That was an increase of MNT 1.9 million in 2010 or in other words, 5.5 percent growth. On the
other hand, labor productivity in mining and exploiting industry had increased by MNT 0.1
million or 0.2 percent while it had gone up by MNT 2.0 million or 8.3 percent in processing
industry and MNT 0.8 million or 5.5 percent in electricity, heating and energy production and
water supply sectors.
Future trend
Taking into consideration of preliminary estimate as of the end of 2010, industrial sector had
expanded compared to last year, but growth speed had decelerated during the last few months of
2010. It was due to the fact that stabilization of economy and increased production of industrial
sector occurred in the 4th
quarter of 2009. Production of industrial sector is estimated to
experience stable growth in 2011.
Following factors are projected to result in such growth:
Mining sector growth: Production of main mining commodities such as coal, petroleumand iron ore are projected to increase sharply.
Processing industry growth: Processing industry as a whole, specially food production,
construction material and iron production is forecast to grow.

8/7/2019 EZT-Toim-12-2010-last-English.pdf Англи
http://slidepdf.com/reader/full/ezt-toim-12-2010-last-englishpdf- 9/50
ECONOMIC REVIEW /December 2010/ NDIC 9
Infrastructure and construction: Infrastructure construction and development works at
Oyutolgoi project and other large mining deposits are going to intensify and as a result, it
will drive up growth construction sector as well as demand for electricity and heating.
Although industrial sector had experienced growth in 2010, production of some main
commodities of mining sector declined. For instance, gold production decreased by 38.4 percent,
zinc concentrate production declined by 20.4 percent and it had negative impact on growth of
mining sector. Moreover, 34.2 percent decline of meat production and 48 percent decrease of
combed cashmere production negatively affected processing industry‟s growth.
Conclusion
In analyzing the data from the end of 2010, production growth in mining, exploiting
industry and processing industrial sectors affected total production of industrial sector to increase
by 10 percent compared to the previous year. Moreover, further forecasted increase of
production in the above sectors is projected to not only provide industrial sector growth, but also
to steadily improve overall economic growth.
Fiscal development and preliminary performance in 2010
Preliminary estimate suggested that total fiscal income of Mongolia in 2010 reached
MNT 3069.9 billion which was MNT 374 billion or 13.9 percent more than planned amount. It
was also MNT 1076.9 billion or 54 percent higher than the same time in 2009. Following factors
mainly affected in this growth.
Copper and gold prices in global market were relatively higher than expected amount
Taxation and Customs Authorities intensely organized actions to collect tax debts of
enterprises and accumulated income.
Total foreign trade turnover in 2010 was increased by 53.5 percent or USD 2154 million
compared to the previous year.
Within the assistance provided by the USA to countries in financial and economic crisis,
MNT 14.5 billion worth of monetary support was offered to Mongolia for financing
social welfare expenses. They all contributed to surplus of planned fiscal income.

8/7/2019 EZT-Toim-12-2010-last-English.pdf Англи
http://slidepdf.com/reader/full/ezt-toim-12-2010-last-englishpdf- 10/50
ECONOMIC REVIEW /December 2010/ NDIC 10
Table 1. Fiscal income plan, performance
same time current year PERCENT DIFFER.
last year Plan Plan Performance (4 : 3) (4 - 3)
1 2 3 4 5 6
( MNT billion )
TOTAL AMOUN T OF INCOME AND GRANTS 1 993,0 2 695,9 2 695,9 3 069,9 113,9 374,0
CURRENT INCOME 1 965,5 2 668,3 2 668,3 3 027,3 113,5 359,0
TAXATION INCOME 1 615,3 2 321,4 2 321,4 2 673,6 115,2 352,2
Income tax 520,0 808,6 808,6 974,0 120,5 165,4
Income tax of business entities and organizations 205,4 309,3 309,3 390,6 126,3 81,3
Personal income tax 128,1 149,8 149,8 160,2 107,0 10,5
Price increase tax of some products 186,5 349,5 349,5 423,2 121,1 73,6
Social insurance premium, fee 257,3 280,8 280,8 321,7 114,5 40,8
Property tax 11,0 11,6 11,6 13,6 117,1 2,0
Domestic goods and services tax 508,7 764,3 764,3 863,5 113,0 99,2
Foreign trade income 116,0 165,3 165,3 193,3 117,0 28,1
Other taxes 202,3 290,8 290,8 307,5 105,8 16,7
NON-TAX REVENUE 350,3 346,9 346,9 353,7 102,0 6,8PROPERTY INCOME 3,0 5,6 5,6 8,0 142,7 2,4
ASSISTANCE INCOME 24,5 22,0 22,0 34,6 0,0 12,6
BUDGET
2010BUDGET INCOME
Preliminary budget performance estimate in 2010 found that national fiscal expenditure
amount reached MNT 3066.4 billion that was a cost cutting worth MNT 107.8 billion.
Fiscal and monetary policies were integrated with each other in order to stabilize and
expand the economy against financial and economic crisis. Loan amount worth MNT 30
billion was financed from the state budget to support small and medium enterprises while
subsidies worth MNT 12.6 billion for price differentiation was provided from the statebudget as well.
Human Development Fund financed MNT 305.1 billion for cash transfers to citizens and
MNT 10.9 billion for part of citizens‟ health insurance premiums for which the state is
responsible for. 94.5 percent or, in other words, MNT 489.9 billion of planned expenses
for social insurance fund were executed.
Moreover, MNT 80 billion worth of loan was provided from government bond sources
for implementing housing program for civil servants. Another MNT 10.2 billion worth of
loan was financed through „Farming support fund‟ to assist farmers. Subsidies equal to
MNT 12.3 billion and loan financing equal to MNT 7.1 billion were financed from
„Employment support fund‟ in order to increase employment and support small and
medium enterprises.
State budget contributed MNT 170.7 billion worth of subsidy to social insurance fund,

8/7/2019 EZT-Toim-12-2010-last-English.pdf Англи
http://slidepdf.com/reader/full/ezt-toim-12-2010-last-englishpdf- 11/50
ECONOMIC REVIEW /December 2010/ NDIC 11
MNT 36.5 billion worth of subsidy to energy cost deficit and MNT 760 million to
political parties with a seat in the parliament.
Table 2. Fiscal expenditure plan, performance
same time current year PERCENT DIFFER.
last year Plan Plan Performance (4 : 3) (4 - 3)1 2 3 4 5 6
( MNT billion )
AMOUNT OF EXPENSE AND NET LENDING 2,321.6 3,174.2 3,174.2 3,066.4 96.6 -107.8
CURRENT EXPENDITURE 1,792.1 2,359.6 2,359.6 2,251.6 95.4 -108.0
Expenditure for goods and services 969.5 1,190.2 1,190.2 1,166.9 98.0 -23.4
Wage and salary 578.9 653.3 653.3 650.6 99.6 -2.7
Social insurance premium 54.7 63.2 63.2 61.7 97.7 -1.4
Other expense for goods and services 390.7 536.9 536.9 516.3 96.2 -20.6
Lending service fee 29.0 55.0 55.0 41.9 76.3 -13.0
Subsidy and transfer 793.6 1,114.4 1,114.4 1,042.8 93.6 -71.6
Property expense 457.9 654.1 654.1 567.6 86.8 -86.5
With internal source 431.6 615.8 615.8 554.4 90.0 -61.5
With external source 26.4 38.2 38.2 13.2 34.5 -25.0
NET REPAYABLE LENDING 71.6 160.5 160.5 247.2 154.1 86.8
CURRENT BALANCE 173.4 308.7 308.7 775.7 251.3 467.0
TOTAL BALANCE -328.6 -478.3 -478.3 3.5 (0.7) 481.7
BUDGET
2010BUDGET EXPENDITURE
Total balance for 2010 budget was planned to be in deficit equal to MNT 478.3 billion,
but due to above-mentioned factors, total balance, as in preliminary performance estimate, is
projected to be in surplus of MNT 3.5 billion.
January 2011 trend of fiscal development
Total fiscal income and grants in January, 2011 is expected to be around MNT 90 billion
while state budget income and repayable net lending amount is forecast to be around MNT 260
billion.
Some factors that may affect fiscal income and expense
Increase of inflation growth and speed
Price increase of raw materials and commodities (imported petroleum and food products)
Risks concerning delay and postpone of large projects‟ execution Fluctuation of currency exchange rate (appreciation and depreciation)
“Fiscal stability law”, which was approved by the State Great Khural, specifies that
certain fiscal policy and management principles must be adhered to when formulating
and approving medium-term budget framework, executing, reporting and approving

8/7/2019 EZT-Toim-12-2010-last-English.pdf Англи
http://slidepdf.com/reader/full/ezt-toim-12-2010-last-englishpdf- 12/50
ECONOMIC REVIEW /December 2010/ NDIC 12
fiscal performance, developing and adopting budget draft as well as amending approved
budget. Law stated that special requirement for specific reasons shall be adhered to in
accordance with different phases and these stages are pointed out for each of the special
requirements. Following is the brief summary of these special prerequisites and different
phases that they concern to.
Fiscal year / Special requirements 2011 budgetframework,
annual budget
2012 budgetframework,
annual budget
2013 budgetframework,
annual budget
Fiscal income to be calculated with adjusted
regulation
Adhered Adhered Adhered
Adjusted fiscal balance shall have budget
deficit or budget surplus of no more than
two percent compared to gross domestic
product of the same fiscal year.
Not adhered Not adhered Adhered
Growth rate of fiscal expense in a certainyear shall be no more than the growth rate
of non-minerals sectors‟ gross domestic
products or average growth rate of non-
minerals sectors‟ gross domestic products
from continuous 12 years before that year
or whichever is greater.
Not adhered Not adhered Adhered
Remaining national debt evaluated in
current value shall be no more than 40
percent of gross domestic product
calculated at current year price
Adhered
/It can be 50 percent in
accordance with the law,but 10 percent,
exceeding the stated 40
percent, shall only be
utilized for providing
loan guarantee to
Development Bank /
Adhered
/It can be 60 percent in
accordance with thelaw, but 20 percent,
exceeding 40 percent,
shall only be utilized
for providing loan
guarantee to
Development Bank /
Adhered
/It can be 50 percent
in accordance withthe law, but 10
percent, exceeding
the stated 40 percent,
shall only be utilized
for providing loan
guarantee to
Development Bank /
8/7/2019 EZT-Toim-12-2010-last-English.pdf Англи
http://slidepdf.com/reader/full/ezt-toim-12-2010-last-englishpdf- 13/50
ECONOMIC REVIEW /December 2010/ NDIC 13
3. EMPLOYMENT AND UNEMPLOYMENT
Level of unemployment
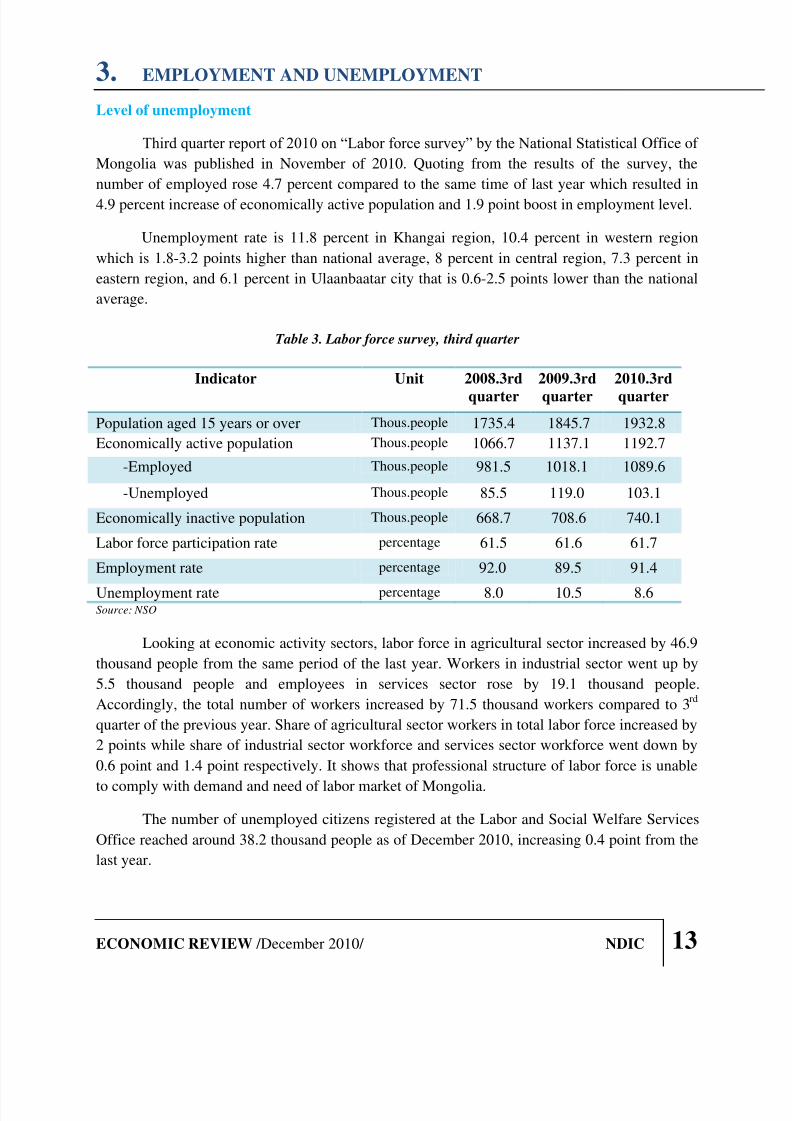
Third quarter report of 2010 on “Labor force survey” by the National Statistical Office of
Mongolia was published in November of 2010. Quoting from the results of the survey, the
number of employed rose 4.7 percent compared to the same time of last year which resulted in
4.9 percent increase of economically active population and 1.9 point boost in employment level.
Unemployment rate is 11.8 percent in Khangai region, 10.4 percent in western region
which is 1.8-3.2 points higher than national average, 8 percent in central region, 7.3 percent in
eastern region, and 6.1 percent in Ulaanbaatar city that is 0.6-2.5 points lower than the national
average.
Table 3. Labor force survey, third quarter
Indicator Unit 2008.3rd
quarter
2009.3rd
quarter
2010.3rd
quarter
Population aged 15 years or over Thous.people 1735.4 1845.7 1932.8
Economically active population Thous.people 1066.7 1137.1 1192.7
-Employed Thous.people 981.5 1018.1 1089.6
-Unemployed Thous.people 85.5 119.0 103.1
Economically inactive population Thous.people 668.7 708.6 740.1
Labor force participation rate percentage 61.5 61.6 61.7
Employment rate percentage 92.0 89.5 91.4
Unemployment rate percentage 8.0 10.5 8.6Source: NSO
Looking at economic activity sectors, labor force in agricultural sector increased by 46.9
thousand people from the same period of the last year. Workers in industrial sector went up by
5.5 thousand people and employees in services sector rose by 19.1 thousand people.
Accordingly, the total number of workers increased by 71.5 thousand workers compared to 3rd
quarter of the previous year. Share of agricultural sector workers in total labor force increased by
2 points while share of industrial sector workforce and services sector workforce went down by
0.6 point and 1.4 point respectively. It shows that professional structure of labor force is unable
to comply with demand and need of labor market of Mongolia.
The number of unemployed citizens registered at the Labor and Social Welfare Services
Office reached around 38.2 thousand people as of December 2010, increasing 0.4 point from the
last year.

8/7/2019 EZT-Toim-12-2010-last-English.pdf Англи
http://slidepdf.com/reader/full/ezt-toim-12-2010-last-englishpdf- 14/50
ECONOMIC REVIEW /December 2010/ NDIC 14
Table 4. Unemployment rate
Indicator Unit December
2009
December
2010
Unemployed registered at Labor and social
welfare services office
person 38077 38250
Newly-registered unemployed person 75569 64328
Number of people who found jobs through
unemployment registration
person 51700 46335
Number of workplaces ordered* person 57996 61413
Number of people involved in vocational training* person 22568 18085
Number of people involved in public works* person 50064 47754
Source: NSO
Of the total unemployed citizens registered at Labor and social welfare services office, 24
percent falls within 16-24 years of age bracket whereas 34 percent falls within 25-34 years of
age, 24.3 percent includes people between 35-44 years of age and 17.7 percent covers citizens
between 45-59 years old. 82.3 percent of total unemployed people were between 25-44 years of
age, in other words, majority of the unemployed are people during their prime years of
employment. Therefore, it can be concluded that skills of people in their working age can not
quite accommodate labor market demands.
Government of Mongolia put efforts to increase workplaces through „Business-enabling
environment reform year‟. Actions were taken to support investments aimed at boosting
employment and to mediate jobless citizens to workplaces offered by employers according to
labor market demand and needs. Moreover, they were engaged in vocational trainings and new
job places were created through financing of small loans. Close collaboration with employers,
temporary vocational training institutions, public and non-governmental organizations was made
use of.
Various types of services were offered to people wishing self-employment, small
enterprises just starting their businesses. At national level, services including professional advice,
information service on projects and programs, small loan service and incubator services were put
forward through 12 business incubator centers, 27 business development support centers and 23
training centers for business establishment. In 2010, 26.1 thousand people took part in trainings
dedicated for business start-up and business skills. Around 7 thousand people obtained
consultancy and information services.

8/7/2019 EZT-Toim-12-2010-last-English.pdf Англи
http://slidepdf.com/reader/full/ezt-toim-12-2010-last-englishpdf- 15/50
ECONOMIC REVIEW /December 2010/ NDIC 15
Moreover, as a result of actions organized to provide temporary workplaces to citizens
this year, around 47.7 thousand people participated in public works. Temporary jobs included
improving local roads, fields and buildings, planting trees, gardening, fixing and paving road,
drilling well, preparing wooden fuel by cleaning forests, restoring forests, cleaning flood dams
and garbage, repairing dam, ditch, trench, doing spring sowing, harvesting, hay-making, snow
cleaning, rebuilding stockyards in aimags experiencing harsh winter, sweeping roads, delivering
forage for cattle, cleaning up homesteads and destroying carrion of livestock.
Employment support fund financed MNT 11.9 billion worth of small loans to 2.8
thousand informal employees, 3.2 thousand unemployed citizens and 124 enterprises through
Khas bank, Savings bank, Khan bank and non-banking financial institutions such as Unench-
Itgel, Landorf finance, Cap Mon and ABTS. As a result, 15.9 thousand citizens acquired new
workplaces. 70 percent of newly-established workplaces through loans were created with loan
through Khan bank whereas 27.7 percent of jobs were established due to loans provided through
Khas bank. The remaining percentage was launched with lending through other banks and non-
banking financial institutions.
In addition, the Government of Mongolia also implemented targeted sub-programs like„Herders‟ employment support program‟ and „Students‟ employment support campaign‟.
New version of „Herders‟ employment support program‟ was approved with joint decree
by Minister for Social Welfare and Labor together with Minister for Food, Agriculture and Light
Industry. The program was implemented in 15 aimags starting from 3rd quarter of 2010. For the
implementation of the program, 267 herder families of 12 aimags were involved in purchasing
livestock to improve breed and grade of their livestock and selling of 9039 heads of cattle was
organized for that purpose.
In connection to sub-program on Students‟ employment support program, Labor andSocial Welfare Service Office in cooperation with Labor department of capital city implemented
part-time jobs for students. Authorities successfully organized mediation between students and
part-time jobs, involving them in public works, providing information and advice and
cooperating through “Students‟ labor exchange” under Labor department of capital city.
Enterprises and organizations requested 22.6 thousand workplaces within Students‟ employment
support program and students were mediated to 21.3 thousand workplaces.
On the job training programs at factories were implemented in order to provide local
training programs for vocational workers with same professions as specialists receiving from
abroad, to employ Mongolian workers in development projects in road, construction and miningsectors and factory buildings. Through the implementation of this program, 3.1 thousand citizens
studied 19 professions at 86 enterprises operating in mining, road, construction and local
development sectors.

8/7/2019 EZT-Toim-12-2010-last-English.pdf Англи
http://slidepdf.com/reader/full/ezt-toim-12-2010-last-englishpdf- 16/50
ECONOMIC REVIEW /December 2010/ NDIC 16
Training for one thousand workers during the first phase of the plan was financed through
investment by Oyutolgoi LLC. Trainings focused on occupations that have high demand in the
labor market such as concrete armature finishers, assembler, plumber, welder, electrician, heavy
machinery serviceman, heavy machinery and equipment operator for road construction,
electrician for railway and mines and mining machinists.
Government has paid special attention to, through business-enabling environment reform
year, create new employment by supporting investment aimed at increasing workplaces, toinvolve unemployed citizens in repeated trainings to instruct new vocations, and to provide
seasonal and permanent workplaces to citizens.
Future trend
Several measures have been planned to be implemented throughout the country next year
as the government of Mongolia declared year 2011 as “Employment support year”. These
include:
-Supporting agriculture, farming, livestock breeding and processing industries throughinvestment, loan and tax policies in order to expand the labor market and to absorb workforce,
-Rationally determining scope of employment promotion policy and improving outcome,
-Preparing highly-skilled workforce that meets labor market demand and need as well as
providing jobs and workplaces,
-Supporting sustainability of workplaces through protecting labor rights and developing
productivity as well as skills and abilities,
-Implementing employment policy that is directed at maturing social partnership,
-Supporting informal workers, small and medium manufacturers with loan services,training, consultancy service and business incubator services,
- Organizing activities, both at central and local levels, to protect herders from risks,
improving business development skills, enhancing income and improving business organization.
As such, a number of activities are planned to be executed.

8/7/2019 EZT-Toim-12-2010-last-English.pdf Англи
http://slidepdf.com/reader/full/ezt-toim-12-2010-last-englishpdf- 17/50
ECONOMIC REVIEW /December 2010/ NDIC 17
4. INFLATION
Inflation level
2010 socio-economic guideline stated an objective to keep the price increase of goods
and services within one digit number, but due to unexpected and unexpected and unclear
conditions, internal and external factors, inflation rate was 13 percent at the of 2010. For
instance, inflation rate had been extending from the start of the year to reach the highest level of
13.1 percent in May. However, it was relatively stable until November 2010 when it increased by
2.4 percent in December, thus reaching 13 percent on average at the end of the year.
Graph 3. Inflation level in 2010 /start of the year/
December 2010 saw the highest price increase. Looking at seasonal fluctuation of
inflation, it can be seen that inflation level has been changing since 2000.
Graph 4. Monthly inflation effect

8/7/2019 EZT-Toim-12-2010-last-English.pdf Англи
http://slidepdf.com/reader/full/ezt-toim-12-2010-last-englishpdf- 18/50
ECONOMIC REVIEW /December 2010/ NDIC 18
From the graph above, it can be observed that inflation level had tendency to increase
higher than the usual level during the first month of winter and spring, but seasonal impact
played higher role during the middle of the year during last few years.
Taking a glance at the structure of inflation, price increase of food products were the
main reason for the enlargement of a general price index. /Graph-5/
Graph 5. Inflation structure
Price increase of meat was the most influencing factor among food products. It is because
meat group alone takes up 16 percent of family consumption. In other words, meat and meat
products occupy the largest share in consumer basket of goods. Due to consequence of dzud
during 2010, supply of meat sharplydropped causing shortage of meat
reserve.
Mongolia imported 70 percent of
food products and goods. Out of 287
types of products in basket of goods, 158
sorts of goods were imported and their
share in total basket was 30 percent.
During 2010, main importpartners of Mongolia also experienced
high prince increase. 80 percent of
import are traded from Russia, China,
South Korea, the USA and Japan.

8/7/2019 EZT-Toim-12-2010-last-English.pdf Англи
http://slidepdf.com/reader/full/ezt-toim-12-2010-last-englishpdf- 19/50
ECONOMIC REVIEW /December 2010/ NDIC 19
Table 5. Inflation of main import partners in 2010
I II III IV V VI VII VIII IX X XI XII
USA 2.6 2.1 2.3 2.2 2 1.1 1.2 1.1 1.1 1.2 1.1 1.5
Russia 8 7.2 6.5 6 6 5.8 5.5 6.1 7 7.5 8.1 8.8
China 1.5 2.7 2.4 2.8 3.1 2.9 3.3 3.5 3.6 4.4 5.1 4.6
South
Korea
3.07 2.69 2.31 2.57 2.66 2.58 2.6 2.6 3.6 4.1 3.3 3.5
Japan -1.3 -1.1 -1.1 -1.2 -0.9 -0.7 -0.9 -0.9 -0.6 0.2 0.1 0.0
Looking from the table, Russia, which supplied one third of Mongolia‟s import, saw 8.8
percent of inflation in 2010 while China, which supplied 30.1 percent of import to Mongolia,experienced 4.6 percent of inflation that had not been the case during the last few years.
Although Mongolian currency appreciated by MNT 200 against US dollar in 2010, reaching
MNT 1258.17 at the end of the year, price of imported goods and services went up because of
high level of inflation rate continuing in neighboring countries.
It showed that food, apparel and textile groups contributed the largest share for inflation
in 2010. For instance, 13 percent inflation rate in 2010 can be explained due to 57.9 percent price
increase of food group and 12.7 percent price increase of apparel and textile groups.
Graph 7. Inflation structure

8/7/2019 EZT-Toim-12-2010-last-English.pdf Англи
http://slidepdf.com/reader/full/ezt-toim-12-2010-last-englishpdf- 20/50
ECONOMIC REVIEW /December 2010/ NDIC 20
From the graph above, it can be observed that housing, water, electricity and fuel group
prices took up 10.7 percent of inflation in 2010 while education service group contributed 8.0
percent.
During the high inflation level of 2008, non-food group price and food group price
excluding meat and flour sharply increased to be responsible for 90 percent of total inflation rate.
Likewise, in 2010, price increase of meat and meat products occupied 50 percent of inflation and
other 13 units composed 6.6 points.
Moreover, the rise of non-food group price compared to the end of 2009 indicated that
economy is recovering and production was picking up. On the other hand, money supply
increased by 62.5 percent and domestic net lending went upward by 25.3 percent. As a result,
loan amount awarded to enterprises and citizens reached MNT 3.3 trillion and total market value
increased 2.2 times. It illustrates the expansion of Mongolian economy.
In conclusion, inflation level reached 13 percent due to the following factors of 2010
such as recovery of economy, cash transfer of MNT 120 thousand from the government to every
citizen, harsh wintering in many aimags because of climate difficulty, cost increase of electricityand heating supply, remaining high price of cashmere, high economic growth rate of China
coupled with high inflation rate, export embargo by Russia on wheat as a result of harvest lost
because of high heat and drought.
There are other internal and external risks concerning price increase of goods and
services in addition to high economic growth in 2010.
Internal factors: There are many unclear and complicated to anticipate conditions such as
political decision, climate severity, and currency exchange shock and etc.
1. Motherland allowance – Human Development Fund, established in order to equallydistribute income from mineral and mining sectors, allocated MNT 120 thousand to every
citizen of Mongolia in 2010. Decision was made to continue the cash transfer with
monthly handout of MNT 21 thousand to people in 2011 which will accumulate to
around MNT 500 billion. Such increase of cash in people‟s hands, as a result, is possible
to drive up the demand of goods and services. Moreover, sudden increase of herders‟
income might also result in less interest to sell and trade their livestock which in turn
affects meat supply negatively to drive up the price of meat.
2. Climate severity – Due to the consequence of dzud occurring in the majority of territory,
10.3 million heads of livestock was lost in 2010. It dropped supply of meat and drove up
the price of meat. Likewise, such condition of climate difficulty has a risk of repeating in
2011 as well.
3. Electricity and heating cost – The Energy Regulatory Authority of Mongolia increased
electricity cost by 17.35 percent and heating cost by 14.5 percent in 2010. Energy sector
is still experiencing deficit so talks have been held to implement further electricity cost
adjustment and even privatize energy sector through phased liberalization of prices. Price
8/7/2019 EZT-Toim-12-2010-last-English.pdf Англи
http://slidepdf.com/reader/full/ezt-toim-12-2010-last-englishpdf- 21/50
ECONOMIC REVIEW /December 2010/ NDIC 21
increase of basic goods has tendency to escalate enterprises‟ current expenses and affect
prices of goods and services.
4. Investment growth – Steady growth of economy and increase of investment on one hand
drives up domestic demand, but on the other hand, it enlarges importation of equipment,
machinery and construction materials. As a result, increased weight load of transportation
volume on ports may affect supply of other sectors‟ goods and products negatively
raising their prices.
5. Pressure to increase salary and pension – Political parties promised to greatly increase
salary and pension during parliamentary election in 2008. Since 2011 is the preceding
year before the next selection, government may receive pressure and stress from
politicians as well as labor unions demanding increase of wages and old-age retirement
allowances.
External risks: The World Economic Forum has conducted risk response survey among 580
leaders and decision makers and assessed possible global risks and their impacts in Global Risks
Report. The survey evaluated 37 types of risks that the world is facing globally and named 6
risks out of the list that were seen as having the biggest chance of occurring and being possible to
cause the largest damage. They are:
1. Climate change
2. Economic disparity
3. Global governance failures
4. Financial crisis
5. Extreme commodity price volatility
6. Geopolitical conflict
Looking from above, external risks might affect the economy and inflation such as
environment and climate change, as a result, a shortage of food products as well as jumpingprices of petroleum and fuel.

8/7/2019 EZT-Toim-12-2010-last-English.pdf Англи
http://slidepdf.com/reader/full/ezt-toim-12-2010-last-englishpdf- 22/50
ECONOMIC REVIEW /December 2010/ NDIC 22
5. FOREIGN TRADE
Foreign trade
Foreign trade of the nation increased sharply owing to positive internal and external
effects on the economy. Total foreign trade turnover increased 53 percent compared to the same
time of the previous year, reaching USD 6.2 billion for the first time. Mongolia last year traded
with world‟s 132 countries, but trade with Russia, Japan, South Korea and Germany experienced
the largest deficit. Therefore, emphasis should be paid to improve trade and economic relations
with above-mentioned countries and effort to keep the trade balanced with these countries should
be emphasized. However, trade with China, Canada and United Kingdom saw trade surplus.
Graph 8. Foreign trade / First 9 months between 2005-2010, thousand USD/
Source: General Customs office, International merchandise trade statistics
Observing from the export structure of Mongolia in 2010, 98 percent of the products
consisted of goods with no technology absorption and low level of technology absorption. The
fact that exportation of mining commodities, which have no technology-absorbed and have low
level of processing, is increasing every year is making both export income of Mongolia and the
overall economy vulnerable.
Government of Mongolia adopted government decree No. 6 dated January 8 th, 2010 to
increase capacity and efficiency of “Gashuun sukhait” and “Shivee khuren” border points. Its
purpose was to boost circulation of foreign trade goods, especially coal export, and to resolve
issues and challenges citizens and business entities were facing when crossing national borders.
As a result, 10.9 million tonnes of coal were exported as of 3 rd quarter of 2010 which was 2.2

8/7/2019 EZT-Toim-12-2010-last-English.pdf Англи
http://slidepdf.com/reader/full/ezt-toim-12-2010-last-englishpdf- 23/50
ECONOMIC REVIEW /December 2010/ NDIC 23
times larger than the amount same time last year. Such additional export capacity brought in as
much export income as copper concentrate export in money terms.
Import of cars and transportation vehicles almost doubled from the same time of last
year. Such increase can be linked to improvement of income and purchasing power of citizens.
Foreign direct investment in mining, transportation and services sector increased 4 fold as the
first half of the year. Moreover, economy quickly recovered to grow 6.2 percent during the first 3
quarters.
Increase of investment in mining sector and exploitation and transportation capacity was
sharply boosting up export of mining sector commodities. For instance, export of iron ore, in
relation to the amount it was at the same time last year, increased by 2.2 times whereas demand
of petroleum products jumped and its import increased 1.3 times as industrial and transportation
sectors intensely recovered.
Although export growth of processed and unprocessed skins and hides did not have a
large impact on total export sum, but it actually increased 36 percent from last year which was a
positive influence on skin and hide sector of the economy.
Graph 9. Export structure of Mongolia, by technology classification / percentage/

8/7/2019 EZT-Toim-12-2010-last-English.pdf Англи
http://slidepdf.com/reader/full/ezt-toim-12-2010-last-englishpdf- 24/50
ECONOMIC REVIEW /December 2010/ NDIC 24
Graph 10. Import structure /2006-2010,percentage /
Future trend of foreign trade
Coal export was firmly increasing from the beginning of the year and such trend
was expected to continue to make coal the main export product of the country.
In relation to the increase of investment in mining, transportation and hotel sectors,
import of equipment, machinery, mechanisms and construction materials is
projected to grow up.
Economy is fast growing and population income and purchasing power are
advancing; therefore, import of passenger cars and consumer goods is looking to
increase as a result.
Price increase of main trade goods of Mongolia such as coal, copper concentrate
and petroleum are forecast to heighten foreign trade turnover.

8/7/2019 EZT-Toim-12-2010-last-English.pdf Англи
http://slidepdf.com/reader/full/ezt-toim-12-2010-last-englishpdf- 25/50
ECONOMIC REVIEW /December 2010/ NDIC 25
6. BANKING AND FINANCE
Banking system
Deposits in commercial banks’ current and savings accounts rising steadily
Deposits in current and savings accounts of commercial banks have risen steadily for the
first 3 quarters of the year. Two things should be noted relating to this rise. Firstly, the proportion
of current account deposits has grown substantially in relation to sources of commercial bank
funds. At the end of last year, it stood at 20.3 of the total fund, and current account deposits now
represent a quarter of the total fund. Secondly, the amount of savings deposits in MNT is
increasing as MNT appreciates against other currencies. Savings deposits in foreign currencies
grew 14.7% year on year, meanwhile savings deposits in MNT grew by 51% during the same
period.
Current and savings deposits, which make up the most of bank funds, are increasingsteadily; however, the main source of bank funds remains to be short-term.
Potential risks in the retail banks’ loan portfolio are slowing down the growth of loan
operations.
As of September 30th, the average weighted interest on securities issued by the central
bank was 11.1%, while the average rate offered by commercial banks on their savings account
was 11.8%. Even though the total loan amount was rising, the loan operations were slowing
down. The policy by the central bank was affecting the loan operations, but potential risks in the
banks‟ loan portfolio may be affecting the loan operations as well.
The macroeconomic environment is stabilising and it is having a positive impact on
increasing domestic demand; however, the purchasing securities of the central bank by
commercial banks, even with lower interest rate than savings rate, didn‟t subside. As of the third
quarter this year, the total amount of central bank securities purchased by commercial banks was
85% higher than the same period last year. If we look at this in terms of banks‟ assets; the central
bank securities represented 12.5% of the assets in the third quarter this year, and the
corresponding number for the same period last year was 8.8%. This is an indication that there is
a potential risk in the market that may hamper the loan operations.
The retail banks are being cautious to increase the loans operations due to the potentialrisk in the market, but we have seen a positive development in the past few months, a decrease in
past-due loans. However, there is no significant decrease in non-performing loans, alerting banks
to be cautious in terms of issuing loans.

8/7/2019 EZT-Toim-12-2010-last-English.pdf Англи
http://slidepdf.com/reader/full/ezt-toim-12-2010-last-englishpdf- 26/50
ECONOMIC REVIEW /December 2010/ NDIC 26
The current economic environment demands the Bank of Mongolia to stick with its
current policy measures; and we don‟t see any significant changes coming in the loan operations
in the near future as the potential market risk remains within the banking sector.
Exchange rate
In 2009, the world industrial output fell by 0.6% and the developed nations‟ economy
shrank by 3.4%; but in 2010, the world economy started recovering and the world industrialoutput rose by 5%. As the world economy recovered, the consumption was rising and demand
for raw materials was increasing; at the same time, the capacity of our mining companies have
risen along with the improvement in transportation, resulting in a sharp increase in production of
mining sector. For instance, export volume of coal increased 2.3 times to 16.6 million tonnes and
export volume of iron ore increased 2.2 times to 3.5 million tonnes.
Inflow of foreign currencies has increased dramatically due to a huge growth in export in
2010; as a result, the foreign exchange reserve has shot well above 2 billion dollars.
As of January 1st, 2010, 1 USD was equal to MNT 1455.7, however, due to increase in
inflow of foreign currency our MNT has appreciated and 1 USD depreciated by about 200 MNT
by the end of year, equalling to 1258.17 MNT.
There is a large movement in exchange rates at international levels as well. Analysts have
noted that some large economies have introduced a protectionist policy, devaluing their currency
in order to support their domestic producers and increase their exports as high levels of
unemployment persisted.
Graphic 10. Net Foreign Exchange
Reserve

8/7/2019 EZT-Toim-12-2010-last-English.pdf Англи
http://slidepdf.com/reader/full/ezt-toim-12-2010-last-englishpdf- 27/50
ECONOMIC REVIEW /December 2010/ NDIC 27
Graph 11. Currency rate fluctuation, by location
Source. Bloomberg Business week
Graphic 12. The list of currencies, which appreciated most against the USD in 2010
The last edition of Bloomberg Business Week Magazine for 2010 has listed the
currencies which appreciated and depreciated most against the USD in 2010. The Mongolian
tugrug is the most appreciated currency against the USD in 2010 according to this list.

8/7/2019 EZT-Toim-12-2010-last-English.pdf Англи
http://slidepdf.com/reader/full/ezt-toim-12-2010-last-englishpdf- 28/50
ECONOMIC REVIEW /December 2010/ NDIC 28
We have seen lots of worldwide movements in exchange rates in 2010. There was
tendency for Asian currencies to gain strength. There are cases where new money and
investment to the economy have a negative impact on other sectors of the economy, possibly
even triggering some sectors to collapse. Netherlands discovered oil in the North Sea in 1959 and
as a result oil production and export of oil grew. However, it had a negative impact on the
economy as exports of other sectors in the economy dropped and unemployment rose due to the
stronger currency. As the currency becomes stronger against other currencies, the tradable goods
by the manufacturing sector become less competitive and the manufacturing sector declines; this
is called Dutch disease. Export of tulips, the main export of Netherlands before the oil
production started, collapsed and the economy became unbalanced (lopsided).
Additionally, if the growth rate in income per capita of resource-rich nations is lower
than the growth rate of those without natural resources, then that country is called to have a
“resource curse”.
As investment in mining sector increases and mining process accelerates; we need to take
preventive measures to avoid Dutch disease and resource curse, and study the possible effects of
a stronger currency. Stronger tugrug makes imported goods cheaper, and could help consumersby reducing the price level (at least creating an environment not to increase the price level). Our
consumer basket consists of 287 kinds of goods and services, out of which 158 are imported and
their weight on the basket is 30%.
We have seen from above graph that the tugrug was the most appreciated currency in
2010. We expect to see further appreciation in 2011, as revenue from main exports is expected to
increase by 40% and foreign exchange reserve is expected to increase by 72% to 3.6 billion
dollars. It is forecasted that tugrug will appreciate by about 3% against the USD due to increased
inflow of foreign currency, making 1 USD equal to 1222 MNT.
This 3% appreciation of tugrug could create an environment for 1% decrease in price
level, as imported goods represent 30% of our consumer basket; in which case it will be
beneficial for consumers.
On the other hand, appreciation of tugrug could hurt domestic producers by making our
exports less competitive. Especially, processing sector is vulnerable and its output could drop.
The possible effects of 10% appreciation of tugrug has been calculated on sectors producing
tradeable goods by using 55x55 balance between sectors.

8/7/2019 EZT-Toim-12-2010-last-English.pdf Англи
http://slidepdf.com/reader/full/ezt-toim-12-2010-last-englishpdf- 29/50
ECONOMIC REVIEW /December 2010/ NDIC 29
Industries Effect of 10% appreciation of MNT
Leather processing and production of leather goods and
shoes
-402.7%
Manufacturing of clothes, processing of fur -89.6%
Textile -24.3%
Iron ore mining -14.5%Oil and natural gas production -11.3%
Other minerals mining -8.1%
Milk and milk products production -6.9%
Meat, fish, fruit, vegetable, fat and oil processing -1.8%
Financial market
Mongolian securities market
64.5 million shares worth MNT 62.9 billion of 136 companies were traded through 253
transactions at Mongolian Stock Exchange in 2010. In addition, 3000 units of government bond
equaling MNT 30 billion were also traded to make the total trade turnover worth MNT 92.9
billion.
67.7 percent or MNT 62.9 billion of total transaction turnover was transferred through
share trades while 32.3 percent or MNT 30 billion belong to trade transaction of bonds.
In comparison with indicator from 2009, a total amount of share trading increased by
171.1 percent or amount equal to MNT 39.7 billion.
Table 7. Comparison of transaction amount conducted in 2010 and 2009
Offering types
Transaction amount Change
2009 2010 Total
amount
Percentage
Government bond - 30.0 - -
Share (Total amount in MNT
billion ) 23.2 62.9 + 39.7 +171.1%
Share (number in millions) 89.9 64.5 -25.4 -28.3%
Company bond - - - -

8/7/2019 EZT-Toim-12-2010-last-English.pdf Англи
http://slidepdf.com/reader/full/ezt-toim-12-2010-last-englishpdf- 30/50
ECONOMIC REVIEW /December 2010/ NDIC 30
Share trading
Average daily share trading was 255 thousand shares which were equal to MNT 248.5
million. Following are the list of companies whose shares increased in value during the reporting
period, sorted from the highest to the lowest. They are ADUUNCHULUUN Shareholding
company/SC/(1539.3%), BAYAN TEEG (1455.8%), UB BOOK SC (1128.4%), SILICAT
(700%), SHARIN GOL (519.1%), MOGOIN GOL SC (499%), SUU SC (438.1%),
TAVANTOLGOI (326.7%), GOVIIN UNDUR (320%), MONIT BULIGAAR (304.7%),SHIVEE OVOO SC (293.9%), CHANDMANI TAL (266.7%), APU (215.9%), BAGANUUR
(200%).
Graph 14. Graph of shares actively traded
Source: Mongolian Stock Exchange
Bond trading
3799th equity transaction of Mongolian Stock Exchange on September 17th of 2010
concluded transactions of 3000 units of government normal bond in total, amounting to MNT 30
billion. Bonds were traded based on their interest rates. Traded government bonds include 1500
bonds with 7.5 percent interest rate with a term of 365 days, 700 bonds with 7.2 percent interest
rate, 800 bonds with 7.29 percent interest rate, 1500 bonds with 7.8 percent interest rate with a
term of 546 days, 1117 bonds with 7.79 percent interest rate, 383 bonds with 7.8 percent interest
rate each. Thus, with differentiated interest rates on bonds, MNT 44.2 million was saved from
the interest rate payment on government bonds.

8/7/2019 EZT-Toim-12-2010-last-English.pdf Англи
http://slidepdf.com/reader/full/ezt-toim-12-2010-last-englishpdf- 31/50
ECONOMIC REVIEW /December 2010/ NDIC 31
Market capitalization
Total market capitalization, compared to 2009, increased 2.2 times or MNT 753.2 billion
and reached MNT 1 trillion 373.9 billion. Companies with the highest market value are Tavan
tolgoi SC /MNT 303.3 billion/, Baganuur SC /MNT 220.2 billion/, Shivee ovoo SC /MNT 174.4
billion/, APU SC /MNT 147.8 billion/, MTsKh SC /MNT 90.5 billion/, Sharin gol SC /MNT
75.9 billion/ and Govi SC /MNT 43.7 billion/.
Graph 15. Market capitalization /MNT billion /
ТОP-20 index
During the reporting period, highest point of TOP-20 index reached 15039.97 units while
the lowest point was 6144.28 units. Therefore, average point of TOP-20 index was 10582.80
units. TOP-20 index dated December 31st, 2010, in comparison with the same date in 2009,
increased by 8569.9 units, in other words, it was multiplied by 2.4 times reaching 14759.81
units.
TOP-20 index had risen steadily since the beginning of 2010 and reached 15039.97 units
on September 8th
, 2010 which was the highest point in the history of Mongolian Stock Exchange
market.
Such growth was mainly contributed by appreciation of share value of companies in the
TOP-20 index basket including Sharin gol /519.1 percent/, Mogoin gol /499 percent/, Shivee
ovoo /324.2 percent/, Tavan tolgoi /326.7 percent/, APU /215.9 percent/, Baganuur /200 percent/,
Talkh chikher /85 percent/, Nako fuel /64.1 percent/, Khukh Gan /57.1 percent/, Makh impex
/56.5 percent/, BDSec /56.3 percent/ and Mongolia Telecom /52.8 percent/.

8/7/2019 EZT-Toim-12-2010-last-English.pdf Англи
http://slidepdf.com/reader/full/ezt-toim-12-2010-last-englishpdf- 32/50
ECONOMIC REVIEW /December 2010/ NDIC 32
Conclusion
Equity prices of companies registered at Mongolian Stock Exchange had considerable
growth in the first quarter of 2010. It was closely related to the release of end-of-the-year
financial reports published by companies and announcement of scheduled dates for meetings to
distribute dividends. For instance, APU SC had operated with a profit of MNT 8.06 billion, of
which MNT 1.4 billion was decided to be allocated to the shareholders as dividends. This
decision drove up the rate of exchange by 136.51 percent in the first months of 2010.
Market demand declined from the middle of the second quarter and equity prices started
dropping. Investors, who wanted to get hold of the profit which was gained through price
difference of shares during the previous months, sold their shares in large quantity. It inflated the
supply of shares and affected the prices to decrease. Moreover, dividends of shareholding
companies like Govi and State Department Store were relatively lower than deposit rates offered
by the commercial banks. It affected equity rates to some extent as well.
However, during the latter part of the year, it can be observed from the main indicators of stock market such as graph of market capitalization and TOP-20 index that shares listed in stock
exchange still kept their growth.
Another reason overall stock market was increasing in 2010 was that foreign investors
were very much interested in Mongolian Stock Exchange. As of 2010, transactions executed by
foreign enterprises and entities made up 70 percent of total transaction amount which was quite a
large share. Especially, shares of mining companies were experiencing sharp escalation.
Therefore, it can be concluded that international and national investors were very much
interested in Mongolian mining sector.
The fact that activities are being implemented to reform management and organizational
structure of Mongolian Stock Exchange shows that government started paying attention on
developing capital market. Thereby, London Stock Exchange is agreed to operate Mongolian
Stock Exchange by providing management and organizational services.

8/7/2019 EZT-Toim-12-2010-last-English.pdf Англи
http://slidepdf.com/reader/full/ezt-toim-12-2010-last-englishpdf- 33/50
ECONOMIC REVIEW /December 2010/ NDIC 33
7. GLOBAL ECONOMIC SITUATION
CHINA
Abstract
Although Chinese economy has kept its high growth in 2010 due to the government
measures taken to fight the crises, sharp increase of investment in real estate, expansion of loan
from financial institutions, and an increase of consumer price led to economic overheat.
In 2010, the gross domestic product (GDP) of China grew by 10.3%, highest in 3 years,
and it reached 39.7 trillion RMB (5.87 trillion USD) in 2005‟s money.
Consumer price index reached to 5.9% in last month, which was 2.9 percentage points
higher than the central bank‟s target rate of 3%. The dramatic increase of the consumer goods
was a main factor to accelerate inflation rate. China, the world's third largest economy and
second largest exporter, directed its policy toward keeping its economic growth through
increasing domestic consumption and investment in recent years.
The new policy has diminished motivation to carry out economic reform and structural
changes through keeping traditional economic policy and created inflationary pressure. But on
the other hand, it was important to protect domestic markets when the foreign trade profit was
increasing and its currency, RMB (more commonly known as Yuan) was gaining strength fast; to
create employment through promoting manufacturing and infrastructural investments; and to
reduce the reliance on export-driven growth by increasing the domestic consumption.
China‟s 12th five-year socioeconomic plan was approved in 2010, and will start to be
implemented from 2011; and it has covered many structural problems that need to be tackled
urgently.
As China‟s influence increases, not just in the world economy, but in politics and
decision making processes; the country is shifting its focus to its defense, high technology and
information technology industries.
There are new economic players, which are newly emerging economies led by so-called
BRIC or Brazil, Russia, India and China; and now they have a strong geopolitical influence onkey industries such as international trade, transportation, communication, energy and mining.
This is a clear sign that the global balance power is shifting fast to the emerging economies.
GDP growth

8/7/2019 EZT-Toim-12-2010-last-English.pdf Англи
http://slidepdf.com/reader/full/ezt-toim-12-2010-last-englishpdf- 34/50
ECONOMIC REVIEW /December 2010/ NDIC 34
In 2010, GDP grew to 39.79 trillion RMB, a 10.3% increase compared to a year earlier as
a result of increases in investment, consumption and export – 3 major forces moving the Chinese
economy according to the preliminary report. The growth rate was 1.1 percentage points higher
than the year before. If we look at the quarterly annualized growth rate, it was 11.9% in the first
quarter, 10.3% in the second, 9.6% in the third and 9.8% in the last quarter of 2010.
Graph 16. GDP growth /%/
If we look at the GDP growth by sector: there was 4.3% rise in agriculture, 12.2%
increase in manufacturing and processing, and 9.5% growth in service sector. The high growth in
the service industry is due to the government policy and the growth in the agriculture is
decreasing year after year.
The contribution of investment to the GDP growth was 5.6 percentage points, and the
contribution of private consumption was 3.9 percentage points; representing 92% of the total
growth together. Meanwhile, the net exports represented 7.9% of the total growth in GDP, 0.8percentage point of the growth.
Inflation rate
Inflation rate, measured as the change in consumer price index (CPI), reached 3.3% for
the year due to rise in consumer goods and excessive money supply. If we look at the inflation
rates by category: the highest rate of 7.2% for food, 1.6% for alcohol and tobacco, 3.2% for
medical care and other goods.
By the end of December, the CPI rate had reached 4.5%, creating an inflationary pressure
on the central bank to raise its base rate by 0.5%.
This high inflation rate is hitting the poor and those living on low income hard; as a result
the central bank is tightening its monetary policy in 2011.

8/7/2019 EZT-Toim-12-2010-last-English.pdf Англи
http://slidepdf.com/reader/full/ezt-toim-12-2010-last-englishpdf- 35/50
ECONOMIC REVIEW /December 2010/ NDIC 35
Graph 17. Inflation rate, CPI /%/
Foreign trade
Both exports and imports rose and China is still experiencing a trade surplus. However
imports rose faster than exports, resulting in a smaller trade surplus in 2010. The total trade rose
to 2.978 trillion US dollars, an increase of 34.7% from a year ago. Out of which, exports
accounted for 1.577 trillion US dollars and import accounted for 1.394 trillion dollars, making a
trade surplus of 183.1 billion US dollars, 6.4% lower than the year 2009.
The profit from Chinese foreign trade is increasing, and RMB is gaining strength against
the USD and other major currencies due to increased inflow of money to the country. In January
2010, 1 USD equaled to 6.82 RMB, but in September it was depreciated to 6.74 RMB. The
exchange rate went further down to 6.5 in December, signaling the RMB will continue to
appreciate against other currencies. The fast appreciation of RMB, without the consideration of
the supply side, is creating a potential risk to make China lose its status of „exporting country‟
and hence creating a higher unemployment.
Money supply
Central bank has raised the banks‟ reserve requirement, 19% for 6 large banks and 16%
for rural small and medium sized financial institutions, as it tries to tighten the money supply to
relieve the inflationary pressure and to reduce banks lending as the proportion of non-performing
loans have increased.
Additionally, the People‟s Bank of China (PBC) has raised its base rate twice in 2010,
first increase since 2008. The money supply grew steadily; loans and savings amount declined in
2010. By the end of December, the broad money supply (M2) reached 72.6 trillion RMB: narrow
money supply (M1) of 26.7 trillion RMB, and currency in circulation (M0) of 4.5 trillion RMB.

8/7/2019 EZT-Toim-12-2010-last-English.pdf Англи
http://slidepdf.com/reader/full/ezt-toim-12-2010-last-englishpdf- 36/50
ECONOMIC REVIEW /December 2010/ NDIC 36
By the end of December, the broad money supply (M2) increased by 19.7% from the same
period a year earlier, while narrow money supply (M1) increased by 21.2%.
The loans outstanding grew by 7.9% from the beginning of the year to 47.9 trillion RMB.
In 2010, banks and financial institutions have issued new loans worth 7.95 trillion RMB, which
is 1.65 trillion RMB lower than the previous year. Even so, it still surpassed the limit of 7.5
trillion RMB set by the government, triggering the faster change in interest-rate policy and
increase of the amount of the reserve requirement for banks and financial institutions.
The foreign exchange reserve of China stood at 2.84 trillion USD by the end of 2010, an
18.7% increase from 2009.
Graph 18. Growth in net foreign exchange reserve /billion USD/
Budget
Graph 19. Budget /billion RMB/
For the year of 2010,
the budget revenue reached
8.3 trillion RMB, which is
1.45 trillion RMB or 21.3%
higher than the year before.
Budget expense totaled 8.95
trillion RMB, a 1.32 trillion
RMB or 17.4% increase
from 2009. Budget deficit of
China is therefore 650 billion
RMB now, equal to 1.6% of
the GDP.

8/7/2019 EZT-Toim-12-2010-last-English.pdf Англи
http://slidepdf.com/reader/full/ezt-toim-12-2010-last-englishpdf- 37/50
ECONOMIC REVIEW /December 2010/ NDIC 37
Forecasting for 2011 year
After the analysis of China‟s economy in 2010, the following forecast for the macro-
economic indicators of China can be made. The economy will grow slower in the first half of
2011, and grow faster at the second half by accounting the seasonal effects on the economy; and
its GDP is predicted to grow by 9.5%.The contributions to the GDP growth are expected to be
5.2% for investment, 4.0% for consumption and 0.6% for net exports.
There is a high probability that the central bank raises its base interest rate and reserve
requirement as the inflationary pressure increases. This change from expansionary monetary
policy to contractionary monetary policy may reduce the systematic risk, such as reducing the
inflation rate and the total loans being issued; but in the long-term it will have little effect.
The central bank has raised its base rate again, by 0.25 percentage point on February 9th
,
2011 and this could increase the inflow of money to the country therefore risks further
appreciation of RMB against the USD.
The economy is increasing relying on overseas for the supplies of raw materials and it
could push up the inflation rate. For example, China‟s dependence on exported oil products are
illustrated by the fact that 54% of the oil products it needed came from overseas in 2010.
Considering the possible price increases of coal, oil, copper and food, the inflation rate
for 2011 is predicted to be around 4%.
Global economic situation and prospects in 2011
However, global economy is getting rid of financial economic crisis of 2008-2009,
problems such as high unemployment, austerity policy and currency high risk which are pressure
on the recovery.
The recovery of the world economy has started to lose momentum since the middle of
2010, and all indicators point at weaker global economic growth, according to a new United
Nations report. The UN expects that the world economy will expand by 3.1 percent in 2011 and
3.5 percent in 2012 - far from sufficient to enable recovering the jobs lost because of the crisis.
In the World Economic Situation and Prospects 2011 (WESP), the United Nations
emphasizes that the outlook remains uncertain and surrounded by serious downside risks. The
cooperative spirit among major economies is waning, which has debilitated the effectiveness of
responses to the crisis. Uncoordinated monetary responses, in particular, have become a source
of turbulence and uncertainty in financial markets. The recovery may suffer further setbacks if
some of the downside risks materialize, in which case, a double-dip recession is looming for
Europe, Japan and the United States. WESP 2011 says that in the short run, more fiscal stimulus
will be needed to reinvigorate the recovery, but that it will need to be better coordinated with
monetary policies and re-oriented to provide stronger support to employment generation and

8/7/2019 EZT-Toim-12-2010-last-English.pdf Англи
http://slidepdf.com/reader/full/ezt-toim-12-2010-last-englishpdf- 38/50
ECONOMIC REVIEW /December 2010/ NDIC 38
facilitate a sustainable rebalancing of the global economy. This cannot be done without better
international policy coordination.
Among developed economies, the United States has been on the mend from its longest
and deepest recession since World War II. Yet, the pace of recovery has been the weakest in the
country‟s post-recession experience. At 2.6 per cent in 2010, growth is expected to moderate
further to 2.2 per cent in 2011 before improving slightly to 2.8 per cent in 2012, according to the
report. This pace will not make much of a dent in unemployment rates, and recovering the jobslost during the crisis would take at least another four years.
The growth prospects for Europe and Japan are even dimmer, the report says. Assuming
continued and albeit moderate recovery in Germany, GDP growth in the Euro area is forecast to
virtually stagnate at 1.3 per cent in 2011 and 1.7 per cent in 2012. Growth in 2010 was 1.6
percent.
Some countries in Europe will see even less growth, especially where drastic fiscal
austerity and continued high unemployment rates are draining domestic demand. This is
especially the case in Greece, Ireland, Portugal and Spain, which are entrapped in sovereign debtdistress. Their economies will either remain in recession or stagnate in the near term. Japan‟s
initially strong rebound, fuelled by net export growth, started to falter in the course of 2010.
Challenged by persistent deflation and elevated public debt, the economy is expected to grow by
a meager 1.1 per cent in 2011 and 1.4 per cent in 2012.
Among the economies in transition, GDP of the Commonwealth of Independent States
(CIS) and Georgia rebounded by about 4 per cent on average in 2010, up from the deep
contraction of more than 7 percent in 2009. In 2011 and 2012, the pace of recovery in South-
Eastern Europe is expected to be rather slow.
Developing countries continue to drive the global recovery, but their output growth is
also expected to moderate to 6.0 per cent during 2011-2012, down from 7.0 per cent in 2010,
because of the slowdown in the advanced countries and phasing out of stimulus measures.
Developing Asia, led by China and India, continues to show the strongest growth performance,
but some moderation (to around 7 percent) is expected in 2011 and 2012.
Growth in Latin America is projected to remain relatively strong at around 4.0 percent,
though less robust than the GDP growth of 5.6 percent estimated for 2010. Brazil, the engine of
regional growth, continues with strong domestic demand to boost export growth of neighboring
countries. The sub-region also benefits from strengthened economic ties with the emerging
economies in Asia.
The economic recovery in the Middle East and other countries in Western Asia is also
expected to moderate from 5.5 percent in 2010 to 4.7 percent in 2011 and 4.4 percent in 2012. At
this pace, the average annual output growth will be lower than the pre-crisis rate.

8/7/2019 EZT-Toim-12-2010-last-English.pdf Англи
http://slidepdf.com/reader/full/ezt-toim-12-2010-last-englishpdf- 39/50
ECONOMIC REVIEW /December 2010/ NDIC 39
Economic recovery has been solid in most of Africa. The rebound is expected to push
through at about 5 percent per year in 2011 and 2012, but this is well below potential and
conditions vary across the region. The economies in East Africa are showing strong growth, but
several of the poorest countries, especially those in the Sahel, have suffered from droughts and
conditions of insecurity, which is causing hunger and hampering the recovery of their
economies.
Annual percentage change
Changed from United Nations
forecast of June 2010
2010 2011 2012 2010 2011
World output 3.6 3.1 3.5 0.6 -0.1
Үүнээс:
Developed countries 2.3 1.9 2.3 0.4 -0.2
Euro zone 1.6 1.3 1.7 0.7 -0.2
Japan 2.7 1.1 1.4 1.4 -0.2
United
Kingdom
1.8 2.1 2.6 0.7 -0.2
United States 2.6 2.2 2.8 0.7 -0.2
Economics in transition 3.8 4.0 4.2 -0.1 0.6
Russian
Federation
3.9 3.7 3.9 -0.4 0.7
Developing economies 7.1 6.0 6.1 1.2 0.2
Africa 4.7 5.0 5.1 0.0 -0.3
Nigeria 7.1 6.5 5.8 0.6 -0.5
South Africa 2.6 3.2 3.2 -0.1 -0.3
East, South Asia 8.4 7.1. 7.3 1.3 0.2
China 10.1 8.9 9.0 0.9 0.1
India 8.4 8.2 8.4 0.5 0.1
Western Asia 5.5 4.7 4.4 1.3 0.6
Israel 4.0 3.5 3.0 1.1 0.4
Turkey 7.4 4.6 5.0 3.9 1.3
Latin America and the
Caribbean
Brazil 7.6 4.5 5.2 1.8 -1.1
Mexico 5.0 3.4 3.5 1.5 0.6
Of which:
Least developed
countries
5.2 5.5 5.7 -0.4 -0.1
Memorandum items:
World trade 10.5 6.6 6.5 .. ..
World output growth
with PPP-based weights
4.5 4.0 4.4 0.6 0.0

8/7/2019 EZT-Toim-12-2010-last-English.pdf Англи
http://slidepdf.com/reader/full/ezt-toim-12-2010-last-englishpdf- 40/50
ECONOMIC REVIEW /December 2010/ NDIC 40
High unemployment is the Achilles heel for the recovery
The UN report says that the lack of employment growth is the weakest link of the
economic recovery. Between 2007 and the end of 2009, at least 30 million jobs were lost
worldwide as a result of the global financial crisis. As more governments embark on fiscal
austerity, the prospects for a fast recovery of employment look even gloomier.
In 2010, employment conditions in the United States seemed to be improving earlier inthe year, but started to falter later as the recovery decelerated and state and local governments
started to lay off workers. The unemployment rate may increase to 10 percent in early 2011, up
from 9.6 percent in the third quarter of 2010. All projections indicate that it will take several
years for the unemployment rate to return to its pre-crisis level.
In the Euro area, despite improvements in Germany‟s job market, the average
unemployment rate has continued to drift upward, reaching 10.1 percent in 2010, from 7.5
percent before the crisis. In Spain, the unemployment rate more than doubled to 20.5 percent. It
also increased dramatically in Ireland, reaching 14.9 percent in 2010, and other countries in the
region. WESP predicts that unemployment in Europe will decline at a snail‟s pace. In Japan,labor market conditions improved marginally during 2010, but the unemployment rate is
expected to remain above 5 percent in 2011.
Worldwide, unemployment and underemployment rates are very high among young
people (aged 15 to 24). At the end of 2009, with an estimated 81 million unemployed young
people, the global youth unemployment rate stood at 13.0 percent -- a 0.9 percentage point
increase from 2008.
High unemployment will constrain household consumption recovery, which in turn will
drag output growth. WESP points out that below-potential output growth, in turn, will constrain
employment growth. The longer this vicious cycle lasts, the higher the risk of “cyclical”
unemployment becoming “structural”, further impairing long term economic growth potential.
The UN report also provides evidence that workers in developing countries and
economies in transition have also been severely affected by the crisis, though the impact in terms
of job losses emerged later and was much more short-lived than in developed countries. Indeed,
employment started to rebound from the second half of 2009 and, by the end of the first quarter
of 2010, unemployment rates had already fallen back to pre-crisis levels in a number of
developing countries. Yet, despite the rebound in employment in parts of the world, the global
economy still needs to create at least another 22 million new jobs in order to return to the pre-
crisis level of global employment. At the current speed of the recovery, this would take at least
five years to achieve.

8/7/2019 EZT-Toim-12-2010-last-English.pdf Англи
http://slidepdf.com/reader/full/ezt-toim-12-2010-last-englishpdf- 41/50
ECONOMIC REVIEW /December 2010/ NDIC 41
Increased exchange rate instability
WESP 2011 says that a much weaker recovery of the world economy is far from a remote
possibility. Besides the lack of job creation, especially in advanced economies, volatility in
currency markets is generating additional macroeconomic uncertainty which could further
jeopardize the recovery. In a more pessimistic scenario of greater uncertainty and no change in
policies, the UN predicts that Europe could well see a double-dip recession, while the economies
of the United States and Japan might virtually stagnate and possibly also fall back into recessionduring 2011. This would also significantly lower growth prospects for developing countries (by
almost 1 percentage point).
Tensions over currencies have emerged in part as a result of uncoordinated expansionary
monetary policies, essentially consisting of more money printing. The stronger quantitative
easing in the United States has put downward pressure on the dollar, causing ripples in currency
markets worldwide. The quantitative easing is to lower interest rates and stimulate investment.
The UN says this will not be very effective as long as financial systems are still clogged and
hence not channeling much money to finance productive investments. Instead, more capital is
flowing to emerging and other developing countries, in search of higher profitability. As a resultof these developments, the Euro and the yen have appreciated against the dollar, as have the
currencies of emerging market economies. This has led to interventions in currency markets and
introduction of capital controls in a number of markets. The report says that heightened tensions
over currency and trade could well trigger renewed turmoil in financial markets, jeopardizing the
recovery.
Five challenges for sustainable recovery
These potentially damaging spillover effects of national policies once again highlight the
need for strengthened international policy coordination, according to the report. Unfortunately,during 2010, the cooperative spirit among policymakers in the major economies has been
waning. “Avoiding a double-dip recession and moving towards a more balanced and sustainable
global recovery would require addressing at least five related major policy challenges”, said Rob
Vos, who led the team of UN economists that prepared the report.
The first is to provide additional fiscal stimulus, by using the ample fiscal space that,
according to WESP 2011, is still available in many countries. Such fiscal action should be
adequately coordinated among the major economies to ensure a reinvigoration of global growth
that will also provide external demand for those economies which have exhausted their fiscal
space. The present shift towards severe fiscal austerity measures in developed economies couldwell trigger a spiral of pro-cyclical fiscal adjustment, the UN report argues, with the result that
that fiscal consolidation will turn out to be self-defeating on a global scale.

8/7/2019 EZT-Toim-12-2010-last-English.pdf Англи
http://slidepdf.com/reader/full/ezt-toim-12-2010-last-englishpdf- 42/50
ECONOMIC REVIEW /December 2010/ NDIC 42
The second challenge is to redesign fiscal stimulus and other economic policies to lend a
stronger orientation towards measures that directly support job growth, reduce income inequality
and strengthen sustainable production capacity on the supply side.
The third challenge, the UN report stresses, is to find greater synergy between fiscal and
monetary stimulus, while counteracting damaging international spillover effects in the form of
increased currency tensions and volatile short-term capital flows. This will require reaching
agreement about the magnitude, speed and timing of quantitative easing policies within a broaderframework of targets to redress the global imbalances. It will also require deeper reforms of
financial regulation, including for managing cross-border capital flows, and in the global reserve
system, reducing dependence on the US dollar.
The fourth challenge is to ensure that sufficient and stable development finance is made
available for developing countries with limited fiscal space and large developmental deficits,
including resources for achieving the Millennium Development Goals and investing in
sustainable and resilient growth.
The fifth challenge is to find ways to come to credible and effective policy coordinationamong major economies. The UN report says it is urgent in this regard to make the G20
framework for sustainable global rebalancing more specific and concrete. In this sense,
establishing concrete “current-account target zones” could be a meaningful way forward, if it is
part of a broader package aiming at addressing all of these challenges.
Different growth between advanced and emerging economies
Two-speed recovery to dominate 2011, with growth remaining slow in advanced
economies
In emerging economies, challenge for some is to manage possible overheating and capitalflows
Number of countries in Europe face tough and long macroeconomic adjustment
In an assessment of the global economy at the end of 2010, and the prospects for 2011,
the IMF‟s Chief Economist, Oliver Blanchard, said that countries should continue to focus on
rebalancing their economies in the coming year, including structural measures and exchange rate
adjustments. “Without this economic rebalancing, there will be no healthy recovery. The central
role of the Group of Twenty (G-20) advanced and emerging market economies in helping during
the global crisis and the need for continued cooperation to build on the recovery, as well as the
prospects for both Europe and low-income countries” he told.
Emerging market countries were affected by the crisis through both trade and financial
channels. The turnaround in trade has been nearly as sharp as the earlier collapse. But while trade
has not yet fully recovered, most emerging market countries have been able to increase domestic
demand so as to return to high growth. In turn, their good performance has led capital flows to

8/7/2019 EZT-Toim-12-2010-last-English.pdf Англи
http://slidepdf.com/reader/full/ezt-toim-12-2010-last-englishpdf- 43/50
ECONOMIC REVIEW /December 2010/ NDIC 43
come back, in some cases, with much force. For many of these countries, the challenges are now
how to avoid overheating and how to handle capital flows.
In many advanced economies, the crisis damage was much deeper. The financial system
was badly broken. Securitization has to be reinvented. In many of these countries, markets are
still uncertain about the true health of banks and financial intermediation is not working well.
Combine this with the need to correct past excesses, from low saving to excess housing
investment and the result is a slow recovery, barely strong enough to decrease unemployment.
Fore-mentioned, rebalancing economy is significant to growth. Because developing
countries growth pre-crisis is genesis from high domestic demand, consumption, purchase, and
high housing investment. It was impossible to last for long time and countries still face to
support by budget policy because domestic demand needs to provide by other sources. However,
it was efficient step, it can‟t be continued further. So these countries should b e based on external
demand, otherwise, export. Similarly, newly developing economies should not be based on
demands or needs and they need to stimulate domestic demand and decrease export dependency.
Therefore, collaboration of G-20 and developing countries becomes main key to supportrecovery after financial economic crisis.
Major economies outlook in 2011
US economic outlook
Many economists believe that US economy will continue to grow around 3.5 percent in
2011, led by pickup in consumer and business spending. The extension of Bush-era rate cuts will
add moderately to GDP growth, while at the same time as increasing the budget deficit. US
economy grew just less than 3 percent and unemployment hovered just below 10 percent for the
year 2010, while stock markets recorded good gains with the S&P 500 rose about 12 percent, the
Dow gained more than 10 percent and Nasdaq advanced around 16 percent.
Graph 20. Consolidated index for stock exchanges in American continent
/December 2009 to December 2010 /
PCE is contributing between
0.7 percent and 2 percent to overall
growth. The component has gained
for five consecutive quarters and is
expected to grow around 1.9 percentin 2011.
On the other side, financial contagion
from Europe, budget problems at
state and local governments, and

8/7/2019 EZT-Toim-12-2010-last-English.pdf Англи
http://slidepdf.com/reader/full/ezt-toim-12-2010-last-englishpdf- 44/50

8/7/2019 EZT-Toim-12-2010-last-English.pdf Англи
http://slidepdf.com/reader/full/ezt-toim-12-2010-last-englishpdf- 45/50
ECONOMIC REVIEW /December 2010/ NDIC 45
Housing sector is the one area need to improve a lot as it has been dragging the economy
for the four straight years. But in third quarter residential investment constituted its lowest
proportion of overall economic activity suggest that any further contract in the sector will show
minimal impact on the growth.
The simple truth is that the economy is not strong enough to support a decent recovery in
housing demand. The unemployment rate remains high, income growth remains low. It may take
years for excess housing inventory to be weeded out, but eventually those vacant homes will be
filled up and construction activity will need to rise.
Asian economies outlook 2011
India economic and market outlook
Indian policy makers have been boosting growth at the cost of macro stability risks,
reflected in high inflation, a widening current account deficit and tight inter-bank liquidity due to
low deposit growth.
Japan 1.5 -0.3 2.3 5.0
Australia 3.5 3.0 -2.3 5.1
New Zealand 3.2 5.5 -4.4 5.8
Newly Industrialized Asian
Economies
4.5 2.7 6.9 3.7
Korea 4.5 3.4 2.9 3.3
Taiwan Province of China
4.4 1.5 9.5 4.9
Hong Kong SAR 4.7 3.0 8.3 4.1
Singapore 4.5 2.4 18.4 2.2
Developing Asia 8.4 4.2 3.0 …
China 9.6 2.7 5.1 4.0
India 8.4 6.7 -3.1 …
ASEAN-5 5.4 4.4 2.4 …
Indonesia 6.2 5.5 0.1 7.0
Thailand 4.0 2.8 2.5 1.4
Philippines 4.5 4.0 3.4 7.2
Malaysia 5.3 2.1 13.8 3.2
Vietnam 6.8 8.0 -8.1 5.0
Other Developing Asia 4.6 9.6 -1.3 …

8/7/2019 EZT-Toim-12-2010-last-English.pdf Англи
http://slidepdf.com/reader/full/ezt-toim-12-2010-last-englishpdf- 46/50
ECONOMIC REVIEW /December 2010/ NDIC 46
Graph 21. Consolidated index for stock exchanges in American continent
/December 2009 to December 2010 /
WPI headline inflation and
non-food inflation have moderated to
7.5 percent yoy and 7.9 percent yoy in
November 2010 from the peaks of 11
percent yoy and 8.9 percent (in April2010) respectively. Monthly trade
deficit narrowed to 7.1 percent of
GDP, annualized in November, from
the peak of 10.8 percent of GDP,
annualized in August 2010.
Inter-bank liquidity should also
improve over the next three months as recent aggressive deposit rate hikes will help improve
deposit growth. Private sector capital expenditure has been accelerating over the last 10 months
and it will soon begin to reflect in the form of commissioned capacity.
Overall macro conditions will remain vulnerable over the next 4-5 months. Inflation,
while moderating, will remain above the RBI‟s comfort zone; while we believe the current
account deficit will also stay relatively high. Recent optimism in the developed world growth
outlook has increased the risk of a potential rise in crude oil prices to $110-120/bbl. Similarly,
there is additional risk of pass through of agricultural and commodity prices.
India‟s policy favors a change in mix of growth from consumption to capital spending.
An improving global growth environment could be the trigger for higher-than anticipated capital
expenditure. They favor cape proxies such as industrials, materials and property over
consumption sectors.
Euro area economies outlook in 2011
Tax hikes, salary cuts and redundancies in the public sector, curbs on public investment,
no pension increases, cuts in welfare spending – these are all elements of the austerity measures
planned in Greece, Ireland, Portugal and Spain in 2011. The Irish consolidation program alone is
set to account for around 9% of GDP in the period leading up to 2014. In terms of GDP,
achieving this sort of consolidation volume in Germany would involve raising VAT from19% to
around 45%.
Concern that consolidation could deal a severe blow to economic activity in these
countries is not surprising. Given that the less debt-burdened euro-zone countries are also
planning to don hair-shirts, the question arises as to how the EMU recovery will progress in
general. Will the upward or the downward forces gain the upper hand in Europe in 2011?
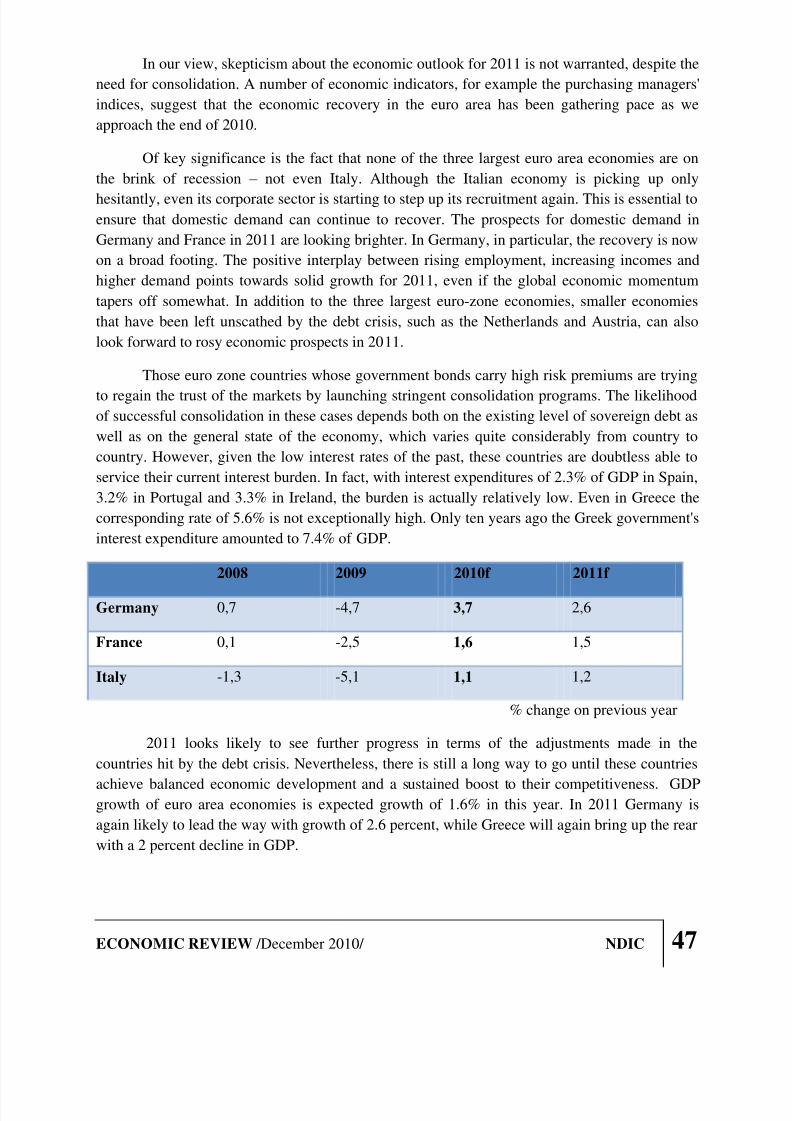
8/7/2019 EZT-Toim-12-2010-last-English.pdf Англи
http://slidepdf.com/reader/full/ezt-toim-12-2010-last-englishpdf- 47/50
ECONOMIC REVIEW /December 2010/ NDIC 47
In our view, skepticism about the economic outlook for 2011 is not warranted, despite the
need for consolidation. A number of economic indicators, for example the purchasing managers'
indices, suggest that the economic recovery in the euro area has been gathering pace as we
approach the end of 2010.
Of key significance is the fact that none of the three largest euro area economies are on
the brink of recession – not even Italy. Although the Italian economy is picking up only
hesitantly, even its corporate sector is starting to step up its recruitment again. This is essential toensure that domestic demand can continue to recover. The prospects for domestic demand in
Germany and France in 2011 are looking brighter. In Germany, in particular, the recovery is now
on a broad footing. The positive interplay between rising employment, increasing incomes and
higher demand points towards solid growth for 2011, even if the global economic momentum
tapers off somewhat. In addition to the three largest euro-zone economies, smaller economies
that have been left unscathed by the debt crisis, such as the Netherlands and Austria, can also
look forward to rosy economic prospects in 2011.
Those euro zone countries whose government bonds carry high risk premiums are trying
to regain the trust of the markets by launching stringent consolidation programs. The likelihoodof successful consolidation in these cases depends both on the existing level of sovereign debt as
well as on the general state of the economy, which varies quite considerably from country to
country. However, given the low interest rates of the past, these countries are doubtless able to
service their current interest burden. In fact, with interest expenditures of 2.3% of GDP in Spain,
3.2% in Portugal and 3.3% in Ireland, the burden is actually relatively low. Even in Greece the
corresponding rate of 5.6% is not exceptionally high. Only ten years ago the Greek government's
interest expenditure amounted to 7.4% of GDP.
2008 2009 2010f 2011f
Germany 0,7 -4,7 3,7 2,6
France 0,1 -2,5 1,6 1,5
Italy -1,3 -5,1 1,1 1,2
% change on previous year
2011 looks likely to see further progress in terms of the adjustments made in the
countries hit by the debt crisis. Nevertheless, there is still a long way to go until these countries
achieve balanced economic development and a sustained boost to their competitiveness. GDPgrowth of euro area economies is expected growth of 1.6% in this year. In 2011 Germany is
again likely to lead the way with growth of 2.6 percent, while Greece will again bring up the rear
with a 2 percent decline in GDP.

8/7/2019 EZT-Toim-12-2010-last-English.pdf Англи
http://slidepdf.com/reader/full/ezt-toim-12-2010-last-englishpdf- 48/50
ECONOMIC REVIEW /December 2010/ NDIC 48
Graph 22. Consolidated index for stock exchanges in European continent
/December 2009 to December 2010 /

8/7/2019 EZT-Toim-12-2010-last-English.pdf Англи
http://slidepdf.com/reader/full/ezt-toim-12-2010-last-englishpdf- 49/50
ECONOMIC REVIEW /December 2010/ NDIC 49
8. CONCLUSION
Taking into account of current situation and further trend of socio-economic sector of
Mongolia in 2010, reports of influencing policies and actions implemented by the government of
Mongolia and their outcome and preliminary findings, it can be concluded that action plan for
combating against financial crisis were successfully executed and national economy has entered
a phase to recover and even intensive growth stage. Government of Mongolia, in 2010, directed
its focus to provide economic growth, create workplaces in large quantity, develop capital
market, increase financial and investment sources, improve its conditions, establishing basis for
rapid economic development and provide sustainability of socio-economic development of the
country. For instance, 2010 was declared as the Business-enabling environment reform year and
many challenges and difficulties enterprises face when starting new business and conducting
business activities were eliminated and favorable business environment was improved to certain
level. Moreover, Development Bank of Mongolia was established in order to increase sources of
financing for strategically important large projects and programs directed at rapid development
of economy. Furthermore, Fiscal Stability Law was adopted to provide sustainable developmentof economy so that it would be possible to maintain economic growth and prevent from risks.
Positive progress and improvement occurred in the national economy in 2010 in
comparison with 2009. This year real economic growth increased by 6.1 percent compared to
2009 and currency rate of MNT against USD was relatively stable in comparison with other
global currencies with slight appreciation. Foreign currency reserve increased 1.8 times to attain
USD 2091.2 million. In addition, many encouraging economic indicators were observed such as
fast development of national capital market and doubling of market capitalization. “Life vein” of
the economy, banking and financial sectors‟ activities advanced the level of 2009 which created
advantages for escalation of production and services and activation of economy. MNT depositsat commercial banks in 2010 increased by 51 percent, foreign currency deposit went up by 14.7
percent and lending by commercial banks increased by 22.9 percent as well.
A number of internal and external factors also made the growth of economy possible. For
instance, global economy stabilized while economic growth in some big developing countries
saw quick acceleration. It drove up the demand of our country‟s main export products and as a
result of high market price and increased demand, it provided favorable condition for economic
growth and development. Although several positive parameters have occurred in social and
economic sectors in 2010, a number of risks were also present that threatened to slow down the
economic growth rate and to unbalance macroeconomic stability. Furthermore, there is noguarantee that these risks would not happen again. Just to name a few impacts from welfare
policies because of political promises, we can point out price increase of basic goods and
services due to cash handout, burden of interest rate and fee on small and medium enterprises as
well as risks to limit economic growth and negatively affect the economic development.
Moreover, some external risks can also occur as global economy recovered and developing

8/7/2019 EZT-Toim-12-2010-last-English.pdf Англи
http://slidepdf.com/reader/full/ezt-toim-12-2010-last-englishpdf- 50/50
countries, especially our neighbor China, are experiencing very rapid growth. It is leading to
overheat of the economy and is driving up the goods and services costs. It, in turn, would swell
the inflation and could even negatively affect economic growth of the nation. Loss of millions of
heads of livestock in 2010 due to harsh winter and dzud which has not occurred that severely
during the last several years resulted in risks and obstacles on the economy. Since we cannot
manage or influence natural phenomena, it reminds us that we need to take actions to prevent
further risks of dzud.
Promising indicators prevailed socio-economic situation in general this year such as
economy returned to the path of growth and population income advanced to certain level.
Therefore, we need to continue our efforts including establishment of the Development Bank to
increase its role and impact on the overall economy, prompt initiation of large project without
lapse of time to intensify the economy, construct infrastructure projects like railway, auto road
and power station, creation of workplaces in large number to improve population income
substantially, improvement of capital and financial markets even more and reaching international
standards.
--oo0oo--