expectations and experiences in the context of product ... · jaeger-erben, melanie and hipp,...
TRANSCRIPT
1/2018
All the rage or take it easy?
Expectations and experiences in the
context of product lifetimes
Descriptive analysis of a representative online survey in
Germany in 2017
Melanie Jaeger-Erben and Tamina Hipp
Zentrum Technik und Gesellschaft/ Center for Technology and Society, TU Berlin
Obsolescence Research Group (Ed.)
1/2018
Imprint
Editor:
Obsolescence Research Group / OHA
(Long title: BMBF Junior Research Group
"Obsolescence as a Challenge for Sustainability
- Causes and Alternatives)
Authors: Melanie Jaeger-Erben and Tamina Hipp
Members of the research group (alphabetically): Christian
Dickenhorst (associated)
Tamina Hipp
Florian Hofmann
Melanie Jaeger-Erben
Max Marwede
Marina Proske
Eduard Wagner
Janis Winzer
Kontakt
Dr. Melanie Jaeger-Erben
Head of the BMBF research
group "Obsolescence as a
Challenge for Sustainability -
Causes and Alternatives"
TU Berlin, Zentrum Technik und
Gesellschaft
Cite as:
Jaeger-Erben, Melanie and Hipp, Tamina (2018). All the rage or take it easy -
Expectations and experiences in the context of longevity in electronic devices.
Descriptive analysis of a representative online survey in Germany. Obsolescence
Research Group (Ed.), OHA texts 1/2018.
14.03.2018
This report is based on research funded by the Federal Ministry of Education and Research in the
context of Social-Ecological Research (SOEF). It is a joint project between the Center for
Technology and Society and the Research Center for Microperipheric Technologies (both TU
Berlin) and the Fraunhofer Institute for Reliability and Micro-integration. The authors have the
sole responsibility for the content of this PUBLICATION.
3
OHA-Texte 01/2018
CONTENT
1. Research questions and study design ................................................................................. 4
2. Characteristics of the participants ...................................................................................... 4
3. Purchase, use and end of use of smart phones and washing machines ............................. 6
4. Experiences and expectations with useful lives of products............................................. 11
5. Failures, defects and repair .............................................................................................. 15
6. Responsibility for (too short) product lifetimes ................................................................ 18
4
OHA-Texte 01/2018
1. Research questions and study design
What expectations do consumers have on the use and lifetime of daily used electronic devices such as
smart phones and washing machines? What role do longevity-relevant criteria play in buying the
devices? How do consumers promote the longevity of products during use, for example through
adequate care and maintenance? These and other questions formed the background of a
representative online survey (CAWI) in Germany with 2.000 participants (aged 14-66 years) in July and
August 20171. The survey was commissioned by the Center for Technology and Society (BMBF Research
Group "Obsolescence as a challenge for sustainability - causes and alternatives") and carried out by
respondi AG.
The questionnaire contained 44 questions on consumer-related attitudes and behavior towards
washing machine and smartphone-use, practical knowledge concerning electronic products, the
perception of responsibility for products and a number of attitudes around production and
consumption.
This document presents a first, descriptive presentation of the results.
2. Characteristics of the participants
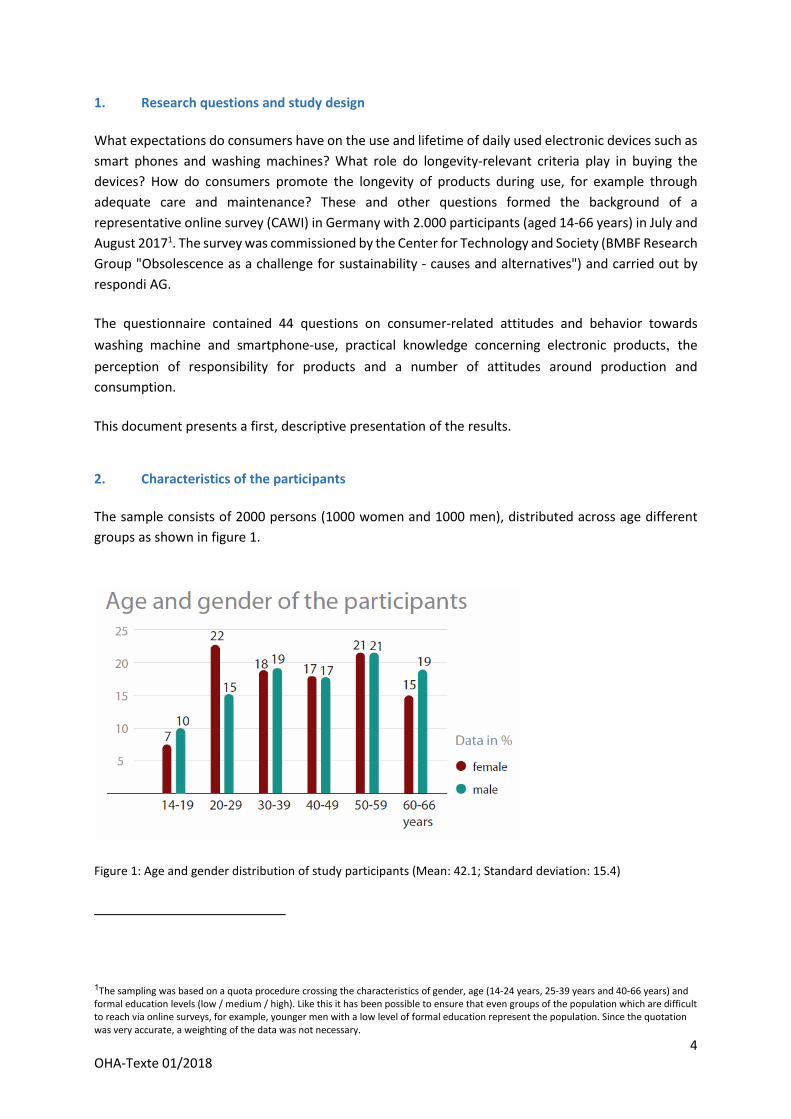
The sample consists of 2000 persons (1000 women and 1000 men), distributed across age different
groups as shown in figure 1.
Figure 1: Age and gender distribution of study participants (Mean: 42.1; Standard deviation: 15.4)
1The sampling was based on a quota procedure crossing the characteristics of gender, age (14-24 years, 25-39 years and 40-66 years) and
formal education levels (low / medium / high). Like this it has been possible to ensure that even groups of the population which are difficult
to reach via online surveys, for example, younger men with a low level of formal education represent the population. Since the quotation
was very accurate, a weighting of the data was not necessary.
5
OHA-Texte 01/2018
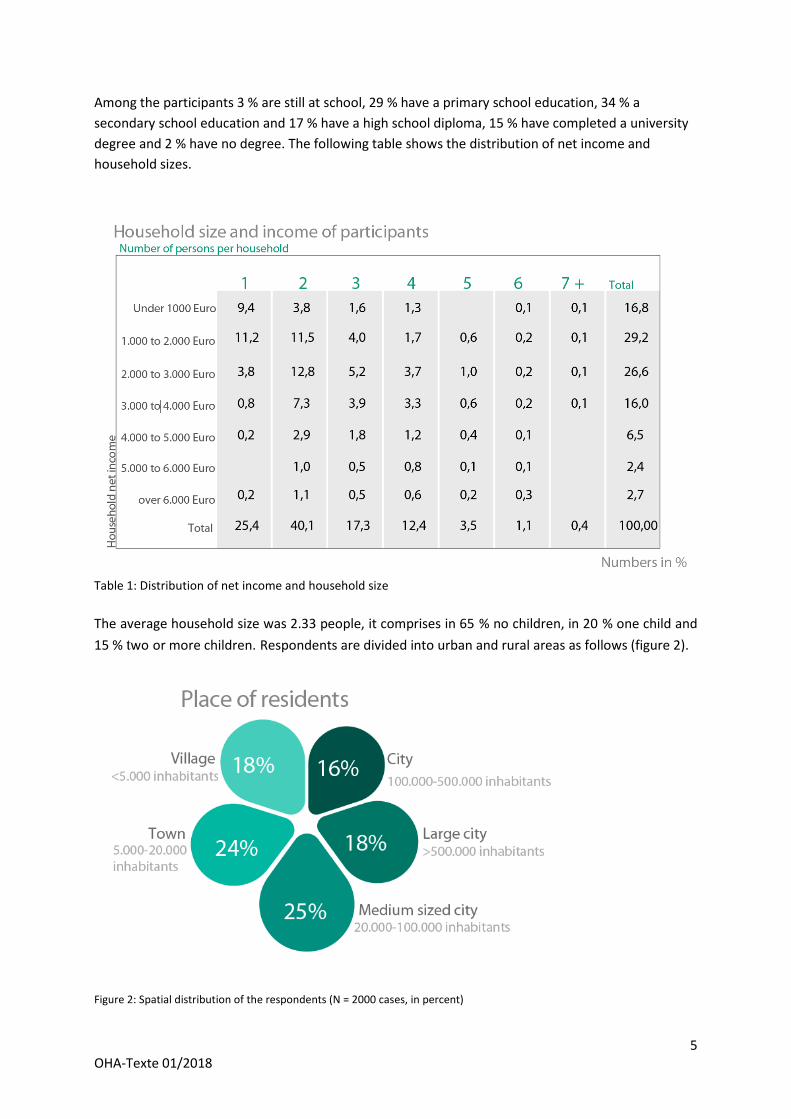
Among the participants 3 % are still at school, 29 % have a primary school education, 34 % a
secondary school education and 17 % have a high school diploma, 15 % have completed a university
degree and 2 % have no degree. The following table shows the distribution of net income and
household sizes.
Table 1: Distribution of net income and household size
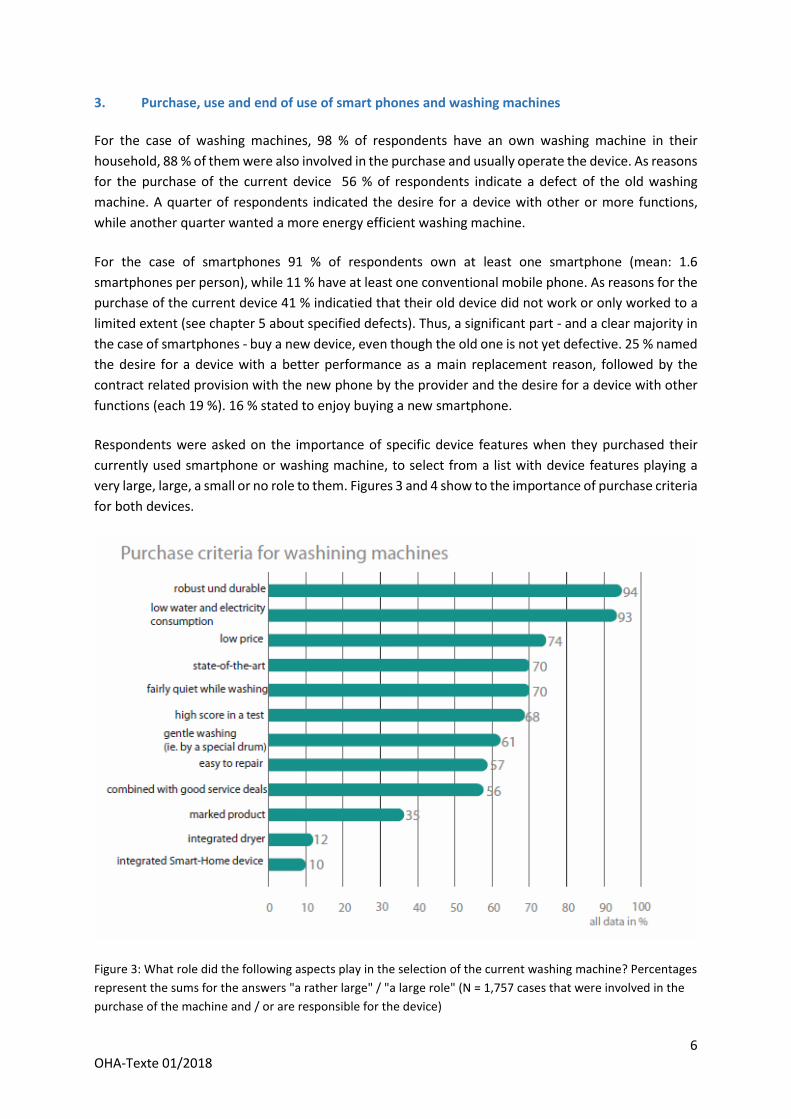
The average household size was 2.33 people, it comprises in 65 % no children, in 20 % one child and
15 % two or more children. Respondents are divided into urban and rural areas as follows (figure 2).
Figure 2: Spatial distribution of the respondents (N = 2000 cases, in percent)
6
OHA-Texte 01/2018
3. Purchase, use and end of use of smart phones and washing machines
For the case of washing machines, 98 % of respondents have an own washing machine in their
household, 88 % of them were also involved in the purchase and usually operate the device. As reasons
for the purchase of the current device 56 % of respondents indicate a defect of the old washing
machine. A quarter of respondents indicated the desire for a device with other or more functions,
while another quarter wanted a more energy efficient washing machine.
For the case of smartphones 91 % of respondents own at least one smartphone (mean: 1.6
smartphones per person), while 11 % have at least one conventional mobile phone. As reasons for the
purchase of the current device 41 % indicatied that their old device did not work or only worked to a
limited extent (see chapter 5 about specified defects). Thus, a significant part - and a clear majority in
the case of smartphones - buy a new device, even though the old one is not yet defective. 25 % named
the desire for a device with a better performance as a main replacement reason, followed by the
contract related provision with the new phone by the provider and the desire for a device with other
functions (each 19 %). 16 % stated to enjoy buying a new smartphone.
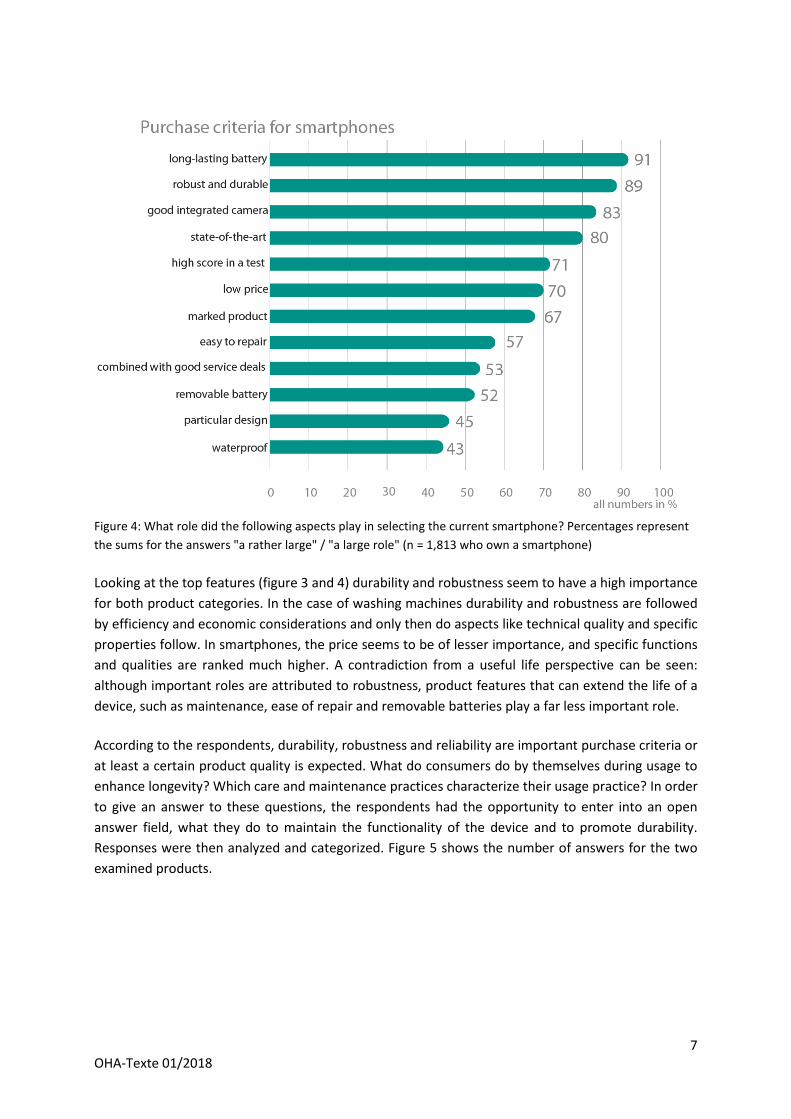
Respondents were asked on the importance of specific device features when they purchased their
currently used smartphone or washing machine, to select from a list with device features playing a
very large, large, a small or no role to them. Figures 3 and 4 show to the importance of purchase criteria
for both devices.
Figure 3: What role did the following aspects play in the selection of the current washing machine? Percentages
represent the sums for the answers "a rather large" / "a large role" (N = 1,757 cases that were involved in the
purchase of the machine and / or are responsible for the device)
7
OHA-Texte 01/2018
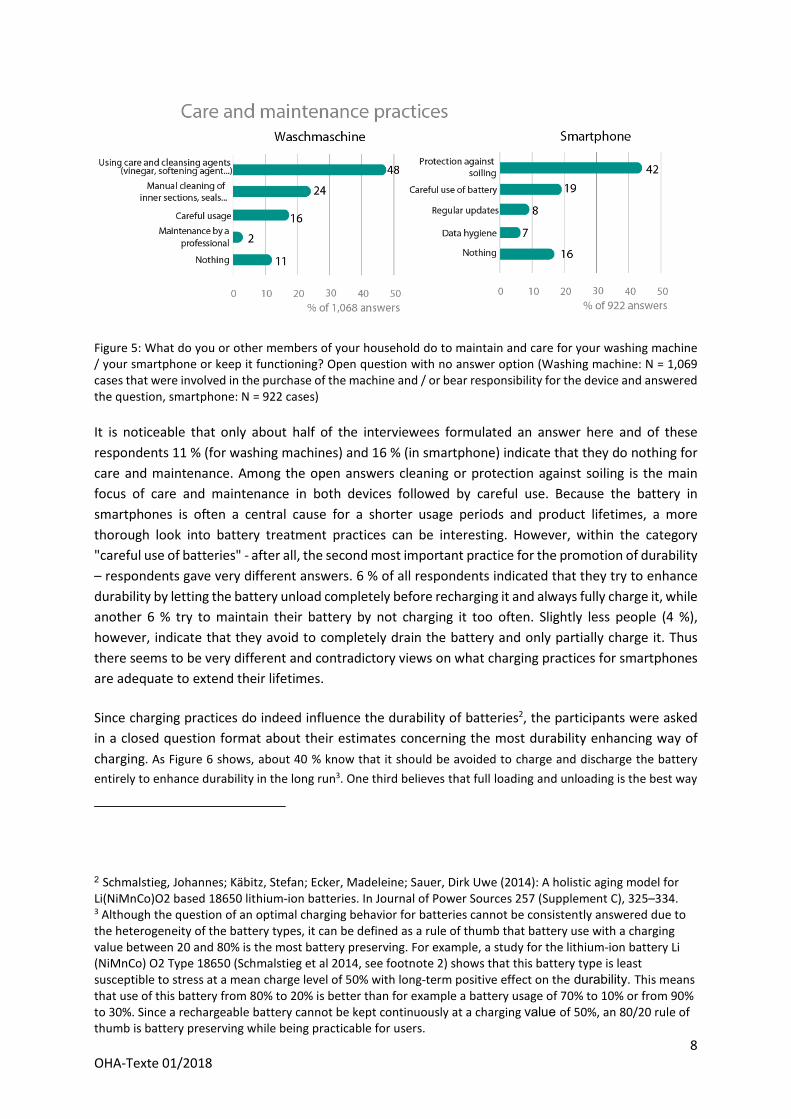
Figure 4: What role did the following aspects play in selecting the current smartphone? Percentages represent
the sums for the answers "a rather large" / "a large role" (n = 1,813 who own a smartphone)
Looking at the top features (figure 3 and 4) durability and robustness seem to have a high importance
for both product categories. In the case of washing machines durability and robustness are followed
by efficiency and economic considerations and only then do aspects like technical quality and specific
properties follow. In smartphones, the price seems to be of lesser importance, and specific functions
and qualities are ranked much higher. A contradiction from a useful life perspective can be seen:
although important roles are attributed to robustness, product features that can extend the life of a
device, such as maintenance, ease of repair and removable batteries play a far less important role.
According to the respondents, durability, robustness and reliability are important purchase criteria or
at least a certain product quality is expected. What do consumers do by themselves during usage to
enhance longevity? Which care and maintenance practices characterize their usage practice? In order
to give an answer to these questions, the respondents had the opportunity to enter into an open
answer field, what they do to maintain the functionality of the device and to promote durability.
Responses were then analyzed and categorized. Figure 5 shows the number of answers for the two
examined products.
8
OHA-Texte 01/2018
Figure 5: What do you or other members of your household do to maintain and care for your washing machine
/ your smartphone or keep it functioning? Open question with no answer option (Washing machine: N = 1,069
cases that were involved in the purchase of the machine and / or bear responsibility for the device and answered
the question, smartphone: N = 922 cases)
It is noticeable that only about half of the interviewees formulated an answer here and of these
respondents 11 % (for washing machines) and 16 % (in smartphone) indicate that they do nothing for
care and maintenance. Among the open answers cleaning or protection against soiling is the main
focus of care and maintenance in both devices followed by careful use. Because the battery in
smartphones is often a central cause for a shorter usage periods and product lifetimes, a more
thorough look into battery treatment practices can be interesting. However, within the category
"careful use of batteries" - after all, the second most important practice for the promotion of durability
– respondents gave very different answers. 6 % of all respondents indicated that they try to enhance
durability by letting the battery unload completely before recharging it and always fully charge it, while
another 6 % try to maintain their battery by not charging it too often. Slightly less people (4 %),
however, indicate that they avoid to completely drain the battery and only partially charge it. Thus
there seems to be very different and contradictory views on what charging practices for smartphones
are adequate to extend their lifetimes.
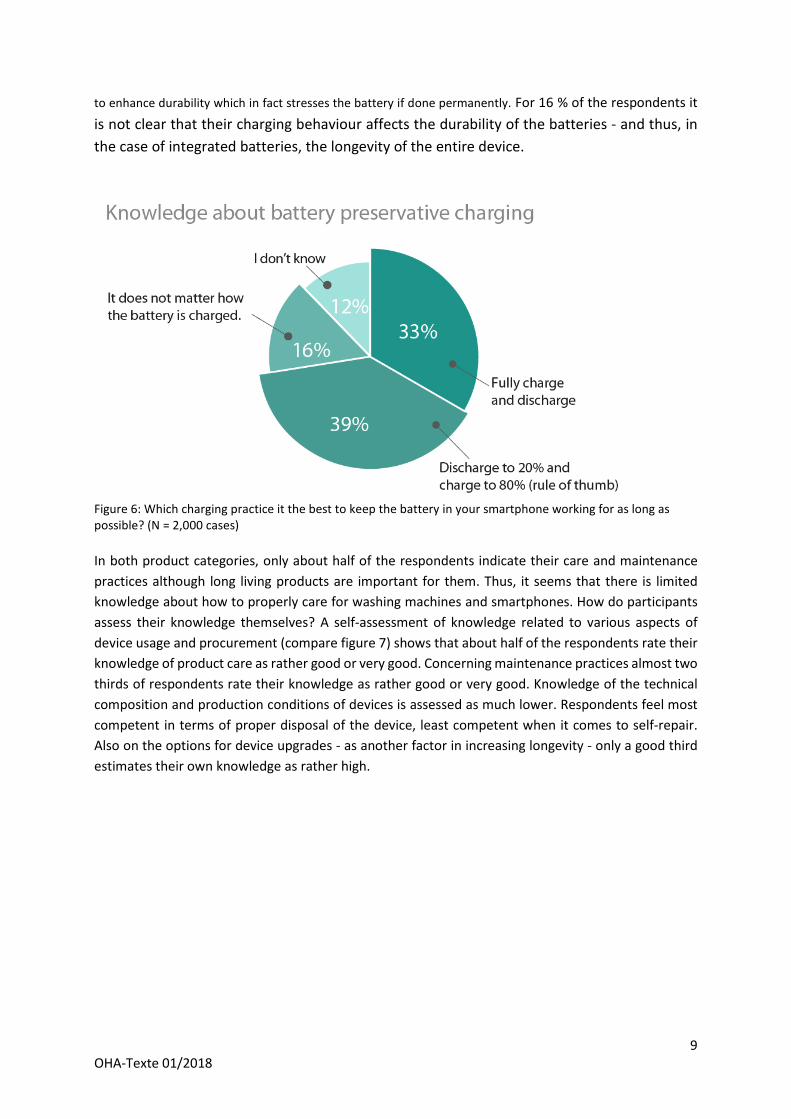
Since charging practices do indeed influence the durability of batteries2, the participants were asked
in a closed question format about their estimates concerning the most durability enhancing way of
charging. As Figure 6 shows, about 40 % know that it should be avoided to charge and discharge the battery
entirely to enhance durability in the long run3. One third believes that full loading and unloading is the best way
2 Schmalstieg, Johannes; Käbitz, Stefan; Ecker, Madeleine; Sauer, Dirk Uwe (2014): A holistic aging model for
Li(NiMnCo)O2 based 18650 lithium-ion batteries. In Journal of Power Sources 257 (Supplement C), 325–334. 3 Although the question of an optimal charging behavior for batteries cannot be consistently answered due to
the heterogeneity of the battery types, it can be defined as a rule of thumb that battery use with a charging
value between 20 and 80% is the most battery preserving. For example, a study for the lithium-ion battery Li
(NiMnCo) O2 Type 18650 (Schmalstieg et al 2014, see footnote 2) shows that this battery type is least
susceptible to stress at a mean charge level of 50% with long-term positive effect on the durability. This means
that use of this battery from 80% to 20% is better than for example a battery usage of 70% to 10% or from 90%
to 30%. Since a rechargeable battery cannot be kept continuously at a charging value of 50%, an 80/20 rule of
thumb is battery preserving while being practicable for users.
9
OHA-Texte 01/2018
to enhance durability which in fact stresses the battery if done permanently. For 16 % of the respondents it
is not clear that their charging behaviour affects the durability of the batteries - and thus, in
the case of integrated batteries, the longevity of the entire device.
Figure 6: Which charging practice it the best to keep the battery in your smartphone working for as long as
possible? (N = 2,000 cases)
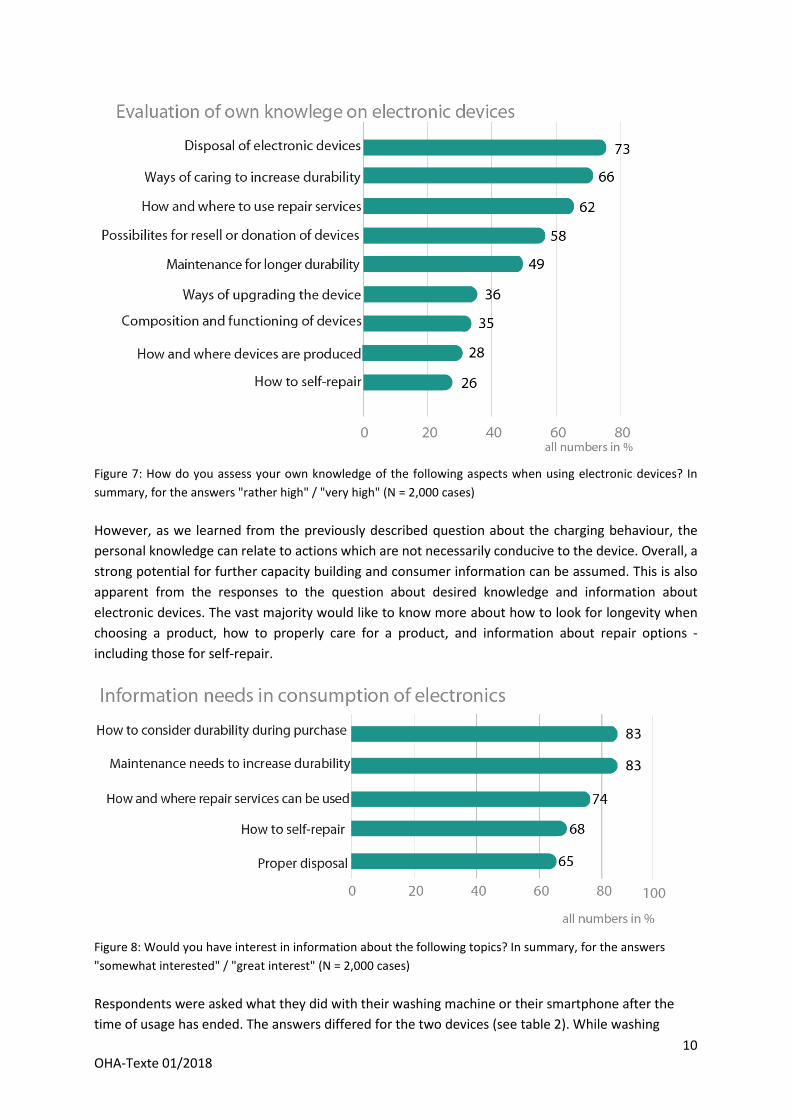
In both product categories, only about half of the respondents indicate their care and maintenance
practices although long living products are important for them. Thus, it seems that there is limited
knowledge about how to properly care for washing machines and smartphones. How do participants
assess their knowledge themselves? A self-assessment of knowledge related to various aspects of
device usage and procurement (compare figure 7) shows that about half of the respondents rate their
knowledge of product care as rather good or very good. Concerning maintenance practices almost two
thirds of respondents rate their knowledge as rather good or very good. Knowledge of the technical
composition and production conditions of devices is assessed as much lower. Respondents feel most
competent in terms of proper disposal of the device, least competent when it comes to self-repair.
Also on the options for device upgrades - as another factor in increasing longevity - only a good third
estimates their own knowledge as rather high.
10
OHA-Texte 01/2018
Figure 7: How do you assess your own knowledge of the following aspects when using electronic devices? In
summary, for the answers "rather high" / "very high" (N = 2,000 cases)
However, as we learned from the previously described question about the charging behaviour, the
personal knowledge can relate to actions which are not necessarily conducive to the device. Overall, a
strong potential for further capacity building and consumer information can be assumed. This is also
apparent from the responses to the question about desired knowledge and information about
electronic devices. The vast majority would like to know more about how to look for longevity when
choosing a product, how to properly care for a product, and information about repair options -
including those for self-repair.
Figure 8: Would you have interest in information about the following topics? In summary, for the answers
"somewhat interested" / "great interest" (N = 2,000 cases)
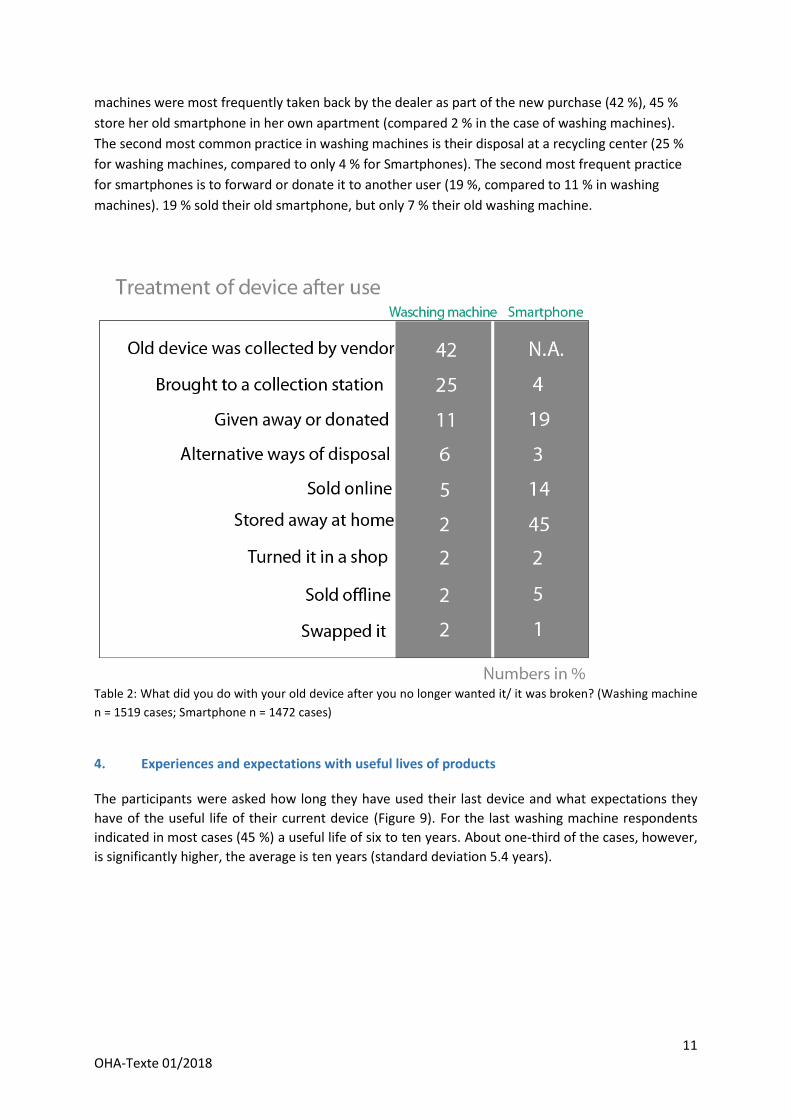
Respondents were asked what they did with their washing machine or their smartphone after the
time of usage has ended. The answers differed for the two devices (see table 2). While washing
11
OHA-Texte 01/2018
machines were most frequently taken back by the dealer as part of the new purchase (42 %), 45 %
store her old smartphone in her own apartment (compared 2 % in the case of washing machines).
The second most common practice in washing machines is their disposal at a recycling center (25 %
for washing machines, compared to only 4 % for Smartphones). The second most frequent practice
for smartphones is to forward or donate it to another user (19 %, compared to 11 % in washing
machines). 19 % sold their old smartphone, but only 7 % their old washing machine.
Table 2: What did you do with your old device after you no longer wanted it/ it was broken? (Washing machine
n = 1519 cases; Smartphone n = 1472 cases)
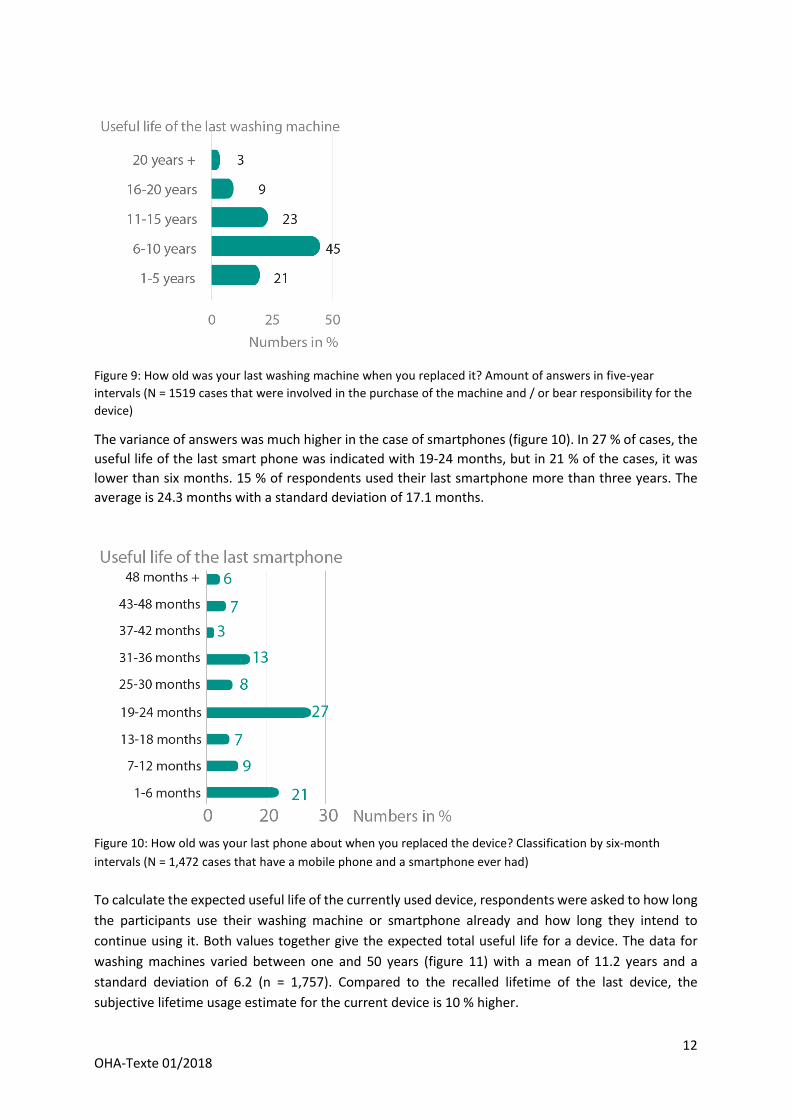
4. Experiences and expectations with useful lives of products
The participants were asked how long they have used their last device and what expectations they
have of the useful life of their current device (Figure 9). For the last washing machine respondents
indicated in most cases (45 %) a useful life of six to ten years. About one-third of the cases, however,
is significantly higher, the average is ten years (standard deviation 5.4 years).
12
OHA-Texte 01/2018
Figure 9: How old was your last washing machine when you replaced it? Amount of answers in five-year
intervals (N = 1519 cases that were involved in the purchase of the machine and / or bear responsibility for the
device)
The variance of answers was much higher in the case of smartphones (figure 10). In 27 % of cases, the
useful life of the last smart phone was indicated with 19-24 months, but in 21 % of the cases, it was
lower than six months. 15 % of respondents used their last smartphone more than three years. The
average is 24.3 months with a standard deviation of 17.1 months.
Figure 10: How old was your last phone about when you replaced the device? Classification by six-month
intervals (N = 1,472 cases that have a mobile phone and a smartphone ever had)
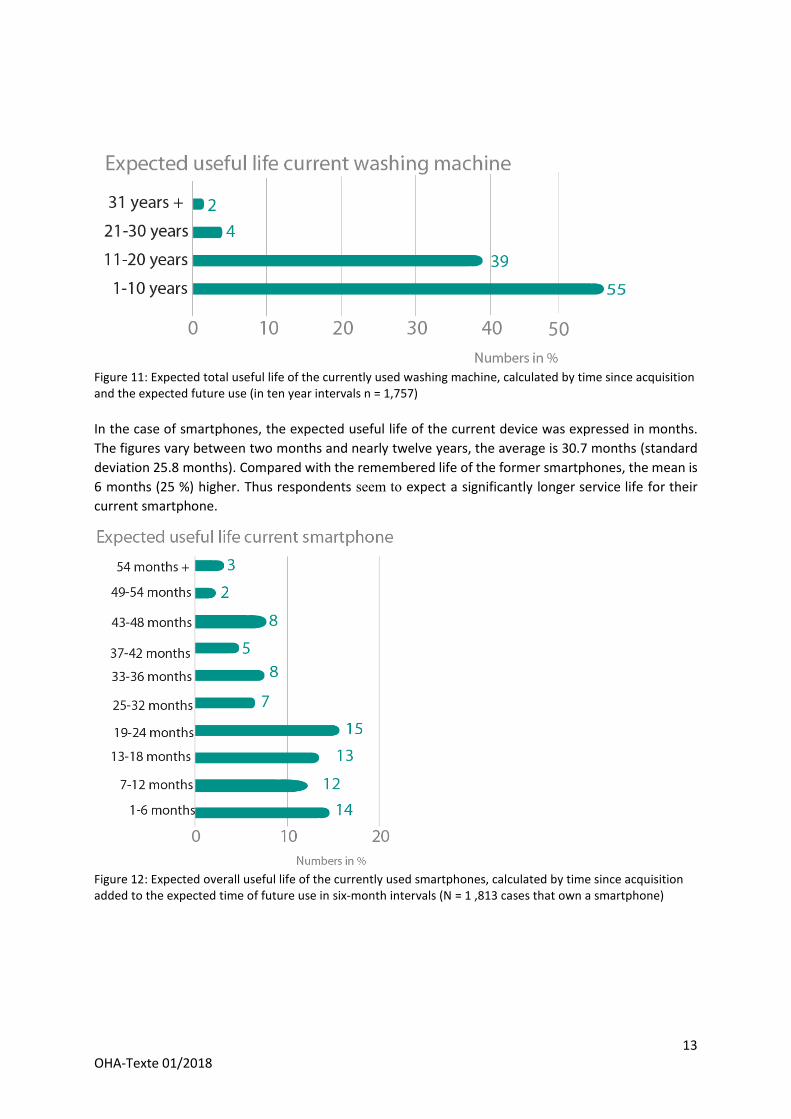
To calculate the expected useful life of the currently used device, respondents were asked to how long
the participants use their washing machine or smartphone already and how long they intend to
continue using it. Both values together give the expected total useful life for a device. The data for
washing machines varied between one and 50 years (figure 11) with a mean of 11.2 years and a
standard deviation of 6.2 (n = 1,757). Compared to the recalled lifetime of the last device, the
subjective lifetime usage estimate for the current device is 10 % higher.
13
OHA-Texte 01/2018
Figure 11: Expected total useful life of the currently used washing machine, calculated by time since acquisition
and the expected future use (in ten year intervals n = 1,757)
In the case of smartphones, the expected useful life of the current device was expressed in months.
The figures vary between two months and nearly twelve years, the average is 30.7 months (standard
deviation 25.8 months). Compared with the remembered life of the former smartphones, the mean is
6 months (25 %) higher. Thus respondents seem to expect a significantly longer service life for their
current smartphone.
Figure 12: Expected overall useful life of the currently used smartphones, calculated by time since acquisition
added to the expected time of future use in six-month intervals (N = 1 ,813 cases that own a smartphone)
14
OHA-Texte 01/2018
der erwartete zukünftige Nutzung (Was schätzen Sie, wie lange werden Sie das Gerät noch in etwa nutzen?) in
nach Sechs-Monats-Intervallen (N=1.2954 Fälle, die ein Smartphone besitzen)
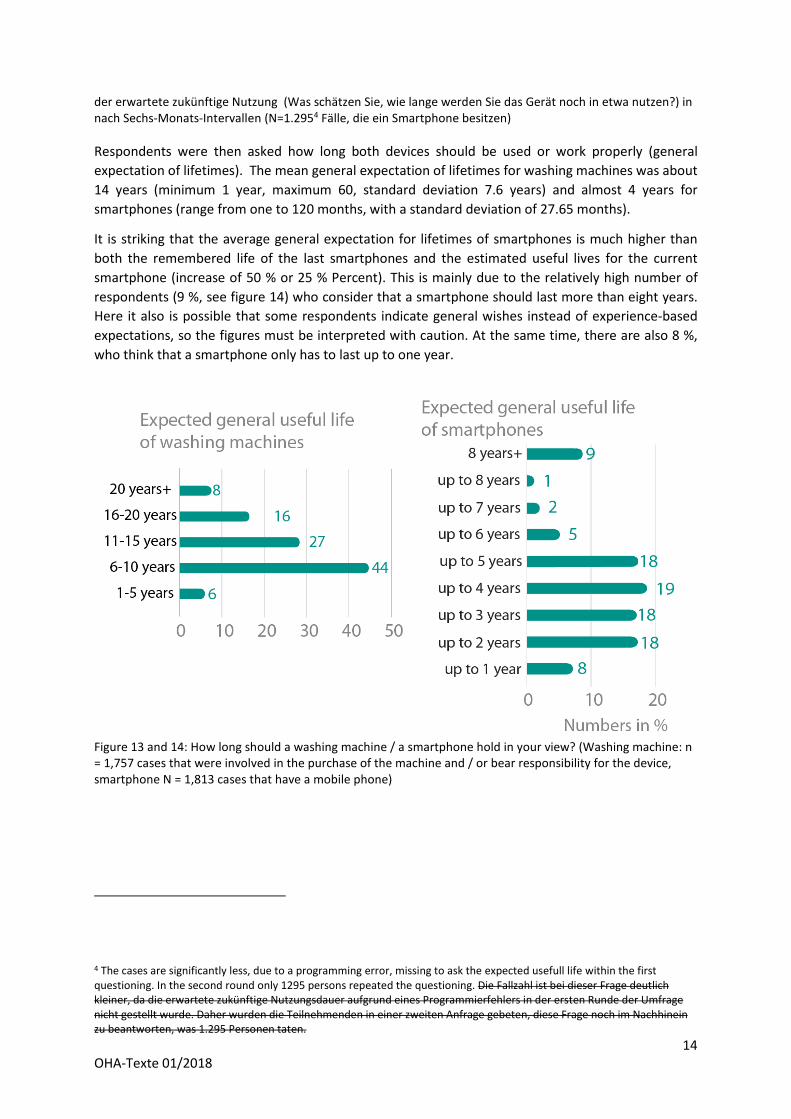
Respondents were then asked how long both devices should be used or work properly (general
expectation of lifetimes). The mean general expectation of lifetimes for washing machines was about
14 years (minimum 1 year, maximum 60, standard deviation 7.6 years) and almost 4 years for
smartphones (range from one to 120 months, with a standard deviation of 27.65 months).
It is striking that the average general expectation for lifetimes of smartphones is much higher than
both the remembered life of the last smartphones and the estimated useful lives for the current
smartphone (increase of 50 % or 25 % Percent). This is mainly due to the relatively high number of
respondents (9 %, see figure 14) who consider that a smartphone should last more than eight years.
Here it also is possible that some respondents indicate general wishes instead of experience-based
expectations, so the figures must be interpreted with caution. At the same time, there are also 8 %,
who think that a smartphone only has to last up to one year.
Figure 13 and 14: How long should a washing machine / a smartphone hold in your view? (Washing machine: n
= 1,757 cases that were involved in the purchase of the machine and / or bear responsibility for the device,
smartphone N = 1,813 cases that have a mobile phone)
4 The cases are significantly less, due to a programming error, missing to ask the expected usefull life within the first
questioning. In the second round only 1295 persons repeated the questioning. Die Fallzahl ist bei dieser Frage deutlich
kleiner, da die erwartete zukünftige Nutzungsdauer aufgrund eines Programmierfehlers in der ersten Runde der Umfrage
nicht gestellt wurde. Daher wurden die Teilnehmenden in einer zweiten Anfrage gebeten, diese Frage noch im Nachhinein
zu beantworten, was 1.295 Personen taten.
15
OHA-Texte 01/2018
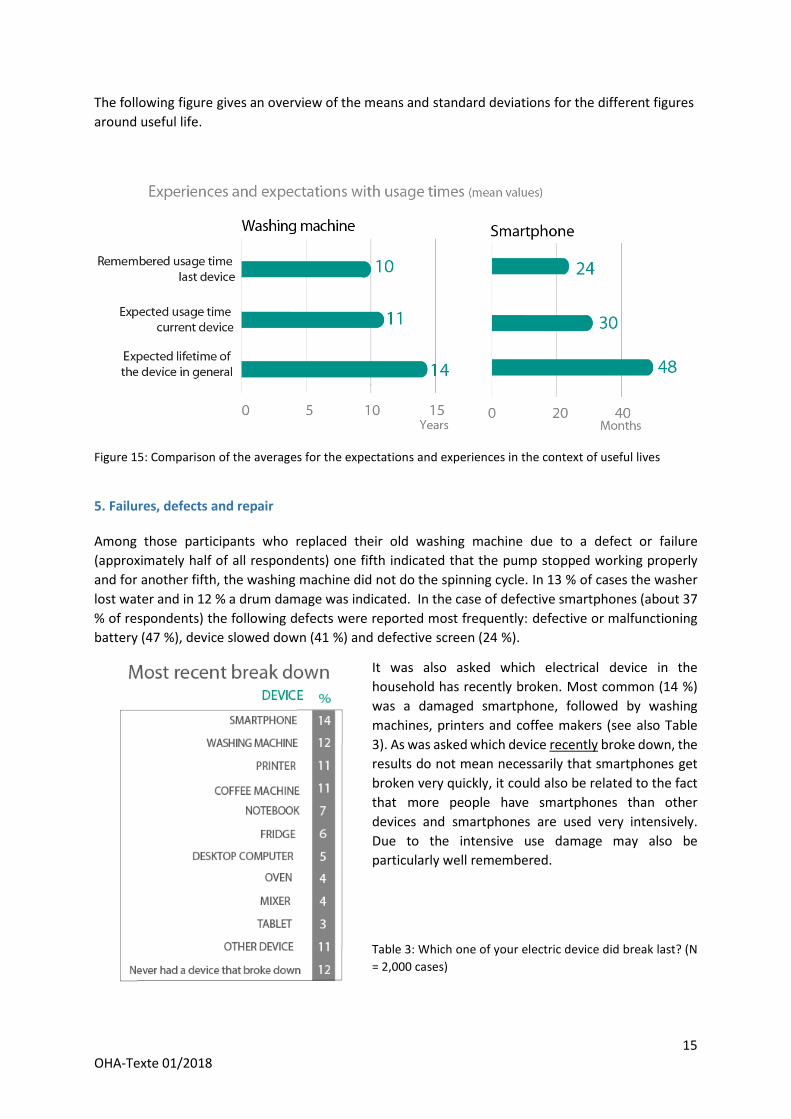
The following figure gives an overview of the means and standard deviations for the different figures
around useful life.
Figure 15: Comparison of the averages for the expectations and experiences in the context of useful lives
5. Failures, defects and repair
Among those participants who replaced their old washing machine due to a defect or failure
(approximately half of all respondents) one fifth indicated that the pump stopped working properly
and for another fifth, the washing machine did not do the spinning cycle. In 13 % of cases the washer
lost water and in 12 % a drum damage was indicated. In the case of defective smartphones (about 37
% of respondents) the following defects were reported most frequently: defective or malfunctioning
battery (47 %), device slowed down (41 %) and defective screen (24 %).
It was also asked which electrical device in the
household has recently broken. Most common (14 %)
was a damaged smartphone, followed by washing
machines, printers and coffee makers (see also Table
3). As was asked which device recently broke down, the
results do not mean necessarily that smartphones get
broken very quickly, it could also be related to the fact
that more people have smartphones than other
devices and smartphones are used very intensively.
Due to the intensive use damage may also be
particularly well remembered.
Table 3: Which one of your electric device did break last? (N
= 2,000 cases)
16
OHA-Texte 01/2018
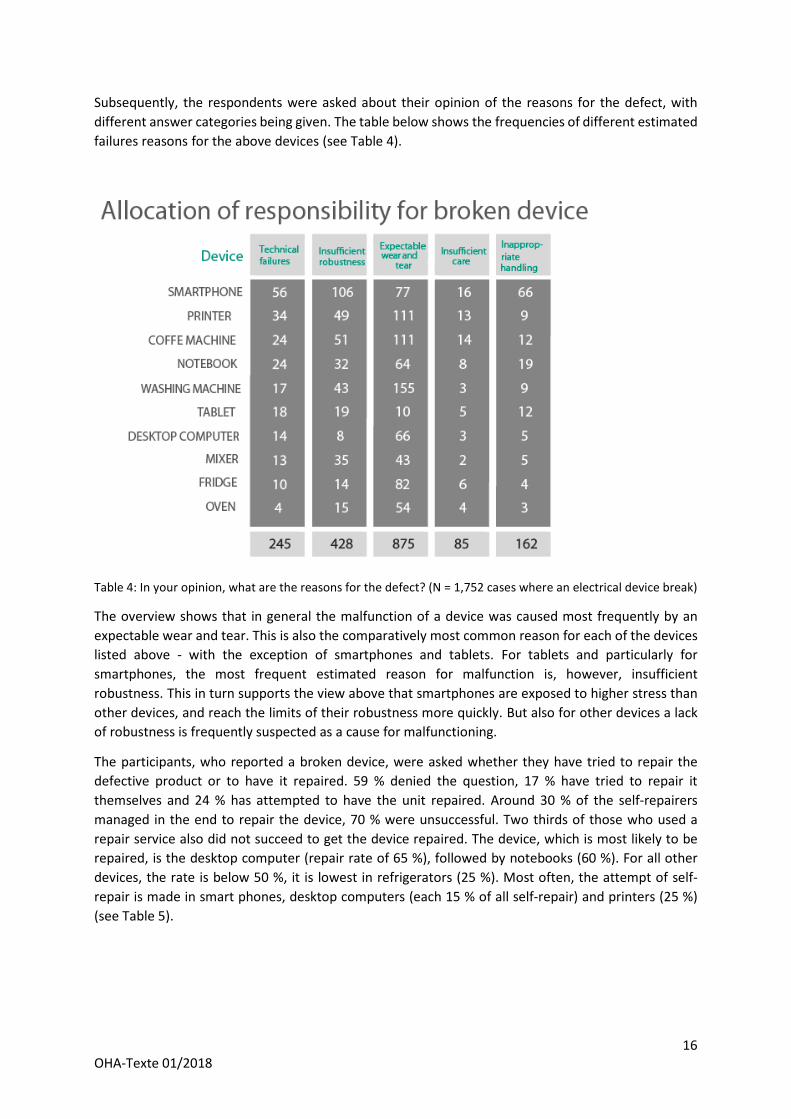
Subsequently, the respondents were asked about their opinion of the reasons for the defect, with
different answer categories being given. The table below shows the frequencies of different estimated
failures reasons for the above devices (see Table 4).
Table 4: In your opinion, what are the reasons for the defect? (N = 1,752 cases where an electrical device break)
The overview shows that in general the malfunction of a device was caused most frequently by an
expectable wear and tear. This is also the comparatively most common reason for each of the devices
listed above - with the exception of smartphones and tablets. For tablets and particularly for
smartphones, the most frequent estimated reason for malfunction is, however, insufficient
robustness. This in turn supports the view above that smartphones are exposed to higher stress than
other devices, and reach the limits of their robustness more quickly. But also for other devices a lack
of robustness is frequently suspected as a cause for malfunctioning.
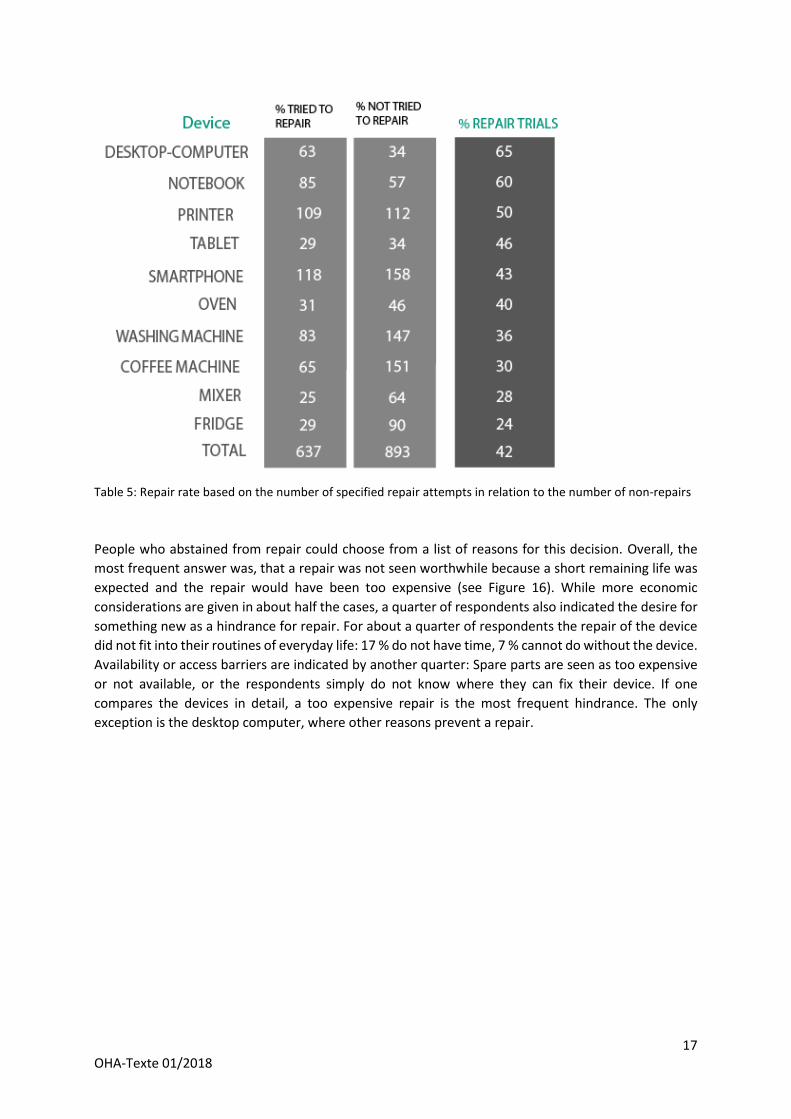
The participants, who reported a broken device, were asked whether they have tried to repair the
defective product or to have it repaired. 59 % denied the question, 17 % have tried to repair it
themselves and 24 % has attempted to have the unit repaired. Around 30 % of the self-repairers
managed in the end to repair the device, 70 % were unsuccessful. Two thirds of those who used a
repair service also did not succeed to get the device repaired. The device, which is most likely to be
repaired, is the desktop computer (repair rate of 65 %), followed by notebooks (60 %). For all other
devices, the rate is below 50 %, it is lowest in refrigerators (25 %). Most often, the attempt of self-
repair is made in smart phones, desktop computers (each 15 % of all self-repair) and printers (25 %)
(see Table 5).
17
OHA-Texte 01/2018
Table 5: Repair rate based on the number of specified repair attempts in relation to the number of non-repairs
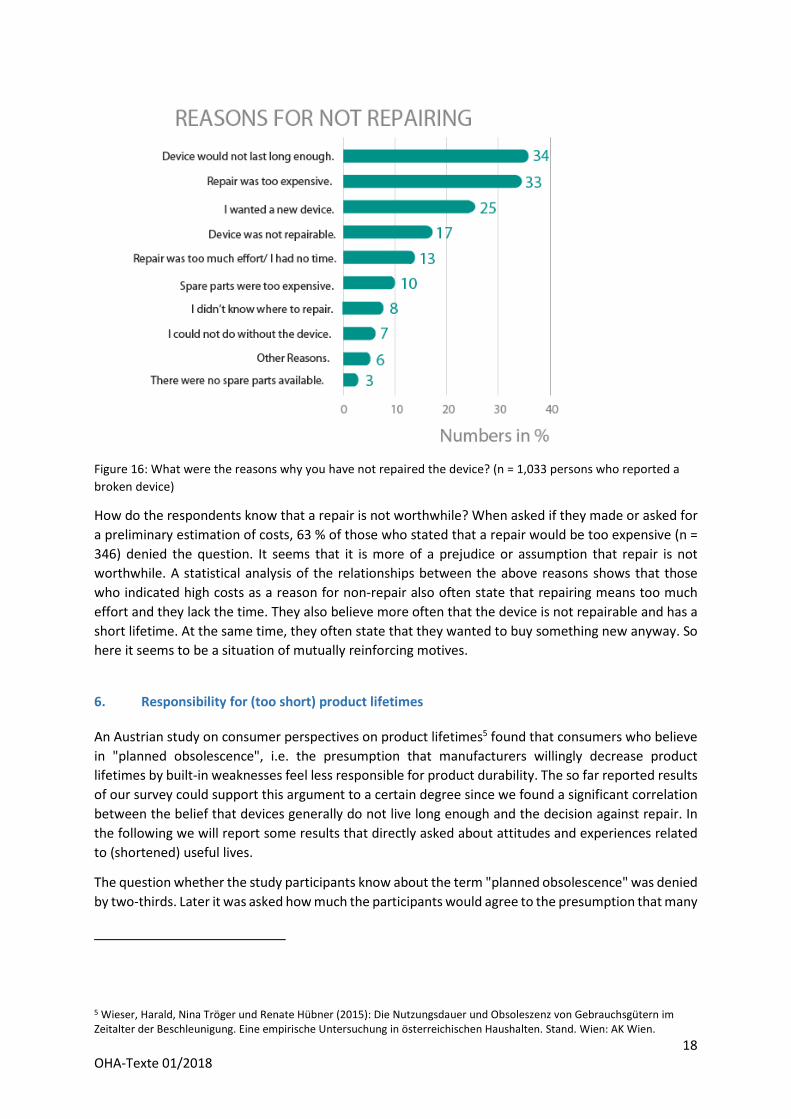
People who abstained from repair could choose from a list of reasons for this decision. Overall, the
most frequent answer was, that a repair was not seen worthwhile because a short remaining life was
expected and the repair would have been too expensive (see Figure 16). While more economic
considerations are given in about half the cases, a quarter of respondents also indicated the desire for
something new as a hindrance for repair. For about a quarter of respondents the repair of the device
did not fit into their routines of everyday life: 17 % do not have time, 7 % cannot do without the device.
Availability or access barriers are indicated by another quarter: Spare parts are seen as too expensive
or not available, or the respondents simply do not know where they can fix their device. If one
compares the devices in detail, a too expensive repair is the most frequent hindrance. The only
exception is the desktop computer, where other reasons prevent a repair.
18
OHA-Texte 01/2018
Figure 16: What were the reasons why you have not repaired the device? (n = 1,033 persons who reported a
broken device)
How do the respondents know that a repair is not worthwhile? When asked if they made or asked for
a preliminary estimation of costs, 63 % of those who stated that a repair would be too expensive (n =
346) denied the question. It seems that it is more of a prejudice or assumption that repair is not
worthwhile. A statistical analysis of the relationships between the above reasons shows that those
who indicated high costs as a reason for non-repair also often state that repairing means too much
effort and they lack the time. They also believe more often that the device is not repairable and has a
short lifetime. At the same time, they often state that they wanted to buy something new anyway. So
here it seems to be a situation of mutually reinforcing motives.
6. Responsibility for (too short) product lifetimes
An Austrian study on consumer perspectives on product lifetimes5 found that consumers who believe
in "planned obsolescence", i.e. the presumption that manufacturers willingly decrease product
lifetimes by built-in weaknesses feel less responsible for product durability. The so far reported results
of our survey could support this argument to a certain degree since we found a significant correlation
between the belief that devices generally do not live long enough and the decision against repair. In
the following we will report some results that directly asked about attitudes and experiences related
to (shortened) useful lives.
The question whether the study participants know about the term "planned obsolescence" was denied
by two-thirds. Later it was asked how much the participants would agree to the presumption that many
5 Wieser, Harald, Nina Tröger und Renate Hübner (2015): Die Nutzungsdauer und Obsoleszenz von Gebrauchsgütern im
Zeitalter der Beschleunigung. Eine empirische Untersuchung in österreichischen Haushalten. Stand. Wien: AK Wien.
19
OHA-Texte 01/2018
devices have in-built defects that causes malfunctions after the two-year warranty expired and 90 %
agreed to that. Thus, it seems that although the term planned obsolescence is not widely known, its
narrative belongs to the common mind-set. 22 % of respondents claimed to know the term and to
know what it means, the remaining twelve percent know the term as a concept, but not its meaning.
All persons who had indicated that they know the meaning were asked for an explanation in an open
question. A small portion (around 3%) indicated that the term refers to generally plan how long a
product can live. The majority of the respondents (about 92 %) see planned obsolescence as the
intention of manufacturers to design products that break early. In many cases "early" was equated
with a failure that soon follows the expiration date of the two-year-warranty. When asked how the
participants know the term, 65% said that they knew about it from the media, 19% know the term
from friends, 12 % from school or other educational institutions (and 11 % from their professional
context.
In order to explore attitudes and opinions around the lifetimes of product and the assumption or
delegation of responsibility, we asked about the degree of agreement to a series of statements. In the
following some results concerning the perceived role and responsibility of manufacturers will be
presented first. Nearly all respondents agreed with the statement that some manufacturers design
devices intentionally in a way that they break down after the warranty has expired (see. Figure 17).
How large the proportion of suspected manufacturers is, was not inquired here. In order to balance
this perception with their own experiences, the participants were asked if they ever had a device that
broke down within or shortly after the warranty has expired. To 61 % of respondents this has never
happened. In 15 % of the cases it was the smartphone that broke down too early, followed by washing
machines (5 %), televisions (3 %) and coffee machine (2 %). It is interesting here, that the strong
conviction, that some manufacturers deliberately limit the lifetimes to the two-year warranty (hold by
90 %) and deceive their customers (believed by 89 %) does not necessarily correspond with own
experiences. This may be due to the fact that the majority of respondents refer to experiences from
their social environment or the narratives around planned obsolescence presented by the media.
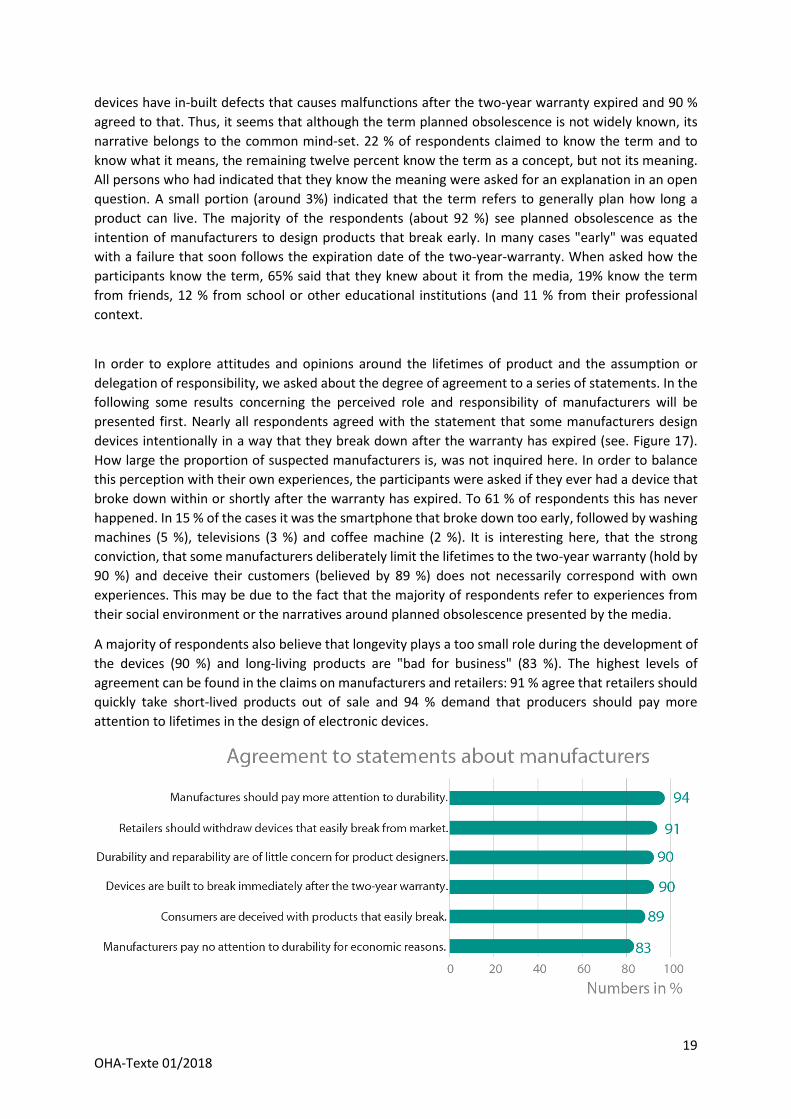
A majority of respondents also believe that longevity plays a too small role during the development of
the devices (90 %) and long-living products are "bad for business" (83 %). The highest levels of
agreement can be found in the claims on manufacturers and retailers: 91 % agree that retailers should
quickly take short-lived products out of sale and 94 % demand that producers should pay more
attention to lifetimes in the design of electronic devices.
20
OHA-Texte 01/2018
Figure 17: To what extent do you agree with the following statements or not? In summary, for the answers "I tend to agree"
and "I completely agree" (N = 2,000 cases)
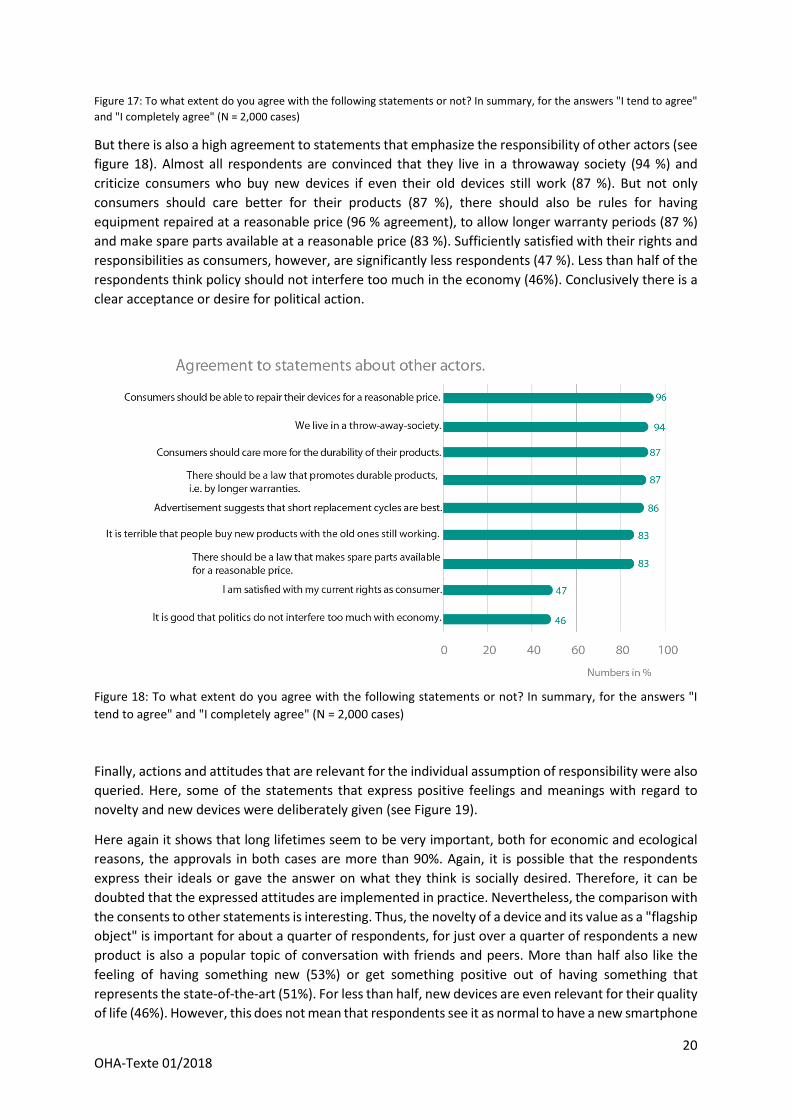
But there is also a high agreement to statements that emphasize the responsibility of other actors (see
figure 18). Almost all respondents are convinced that they live in a throwaway society (94 %) and
criticize consumers who buy new devices if even their old devices still work (87 %). But not only
consumers should care better for their products (87 %), there should also be rules for having
equipment repaired at a reasonable price (96 % agreement), to allow longer warranty periods (87 %)
and make spare parts available at a reasonable price (83 %). Sufficiently satisfied with their rights and
responsibilities as consumers, however, are significantly less respondents (47 %). Less than half of the
respondents think policy should not interfere too much in the economy (46%). Conclusively there is a
clear acceptance or desire for political action.
Figure 18: To what extent do you agree with the following statements or not? In summary, for the answers "I
tend to agree" and "I completely agree" (N = 2,000 cases)
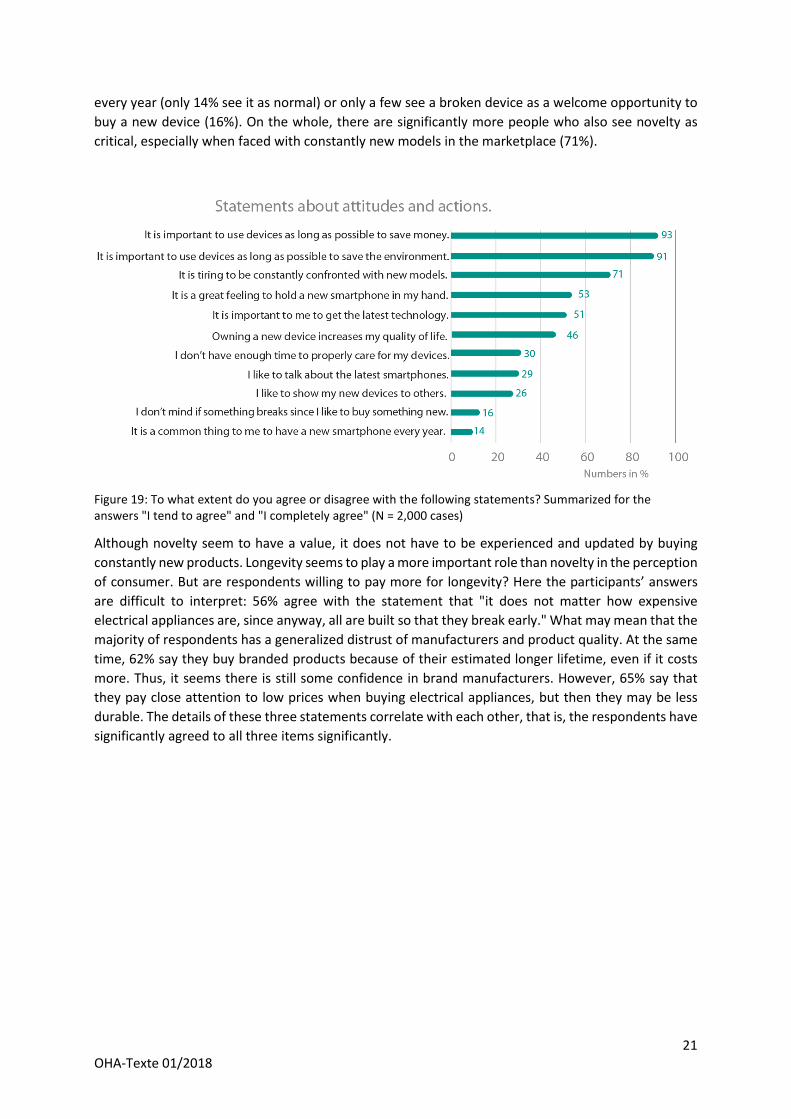
Finally, actions and attitudes that are relevant for the individual assumption of responsibility were also
queried. Here, some of the statements that express positive feelings and meanings with regard to
novelty and new devices were deliberately given (see Figure 19).
Here again it shows that long lifetimes seem to be very important, both for economic and ecological
reasons, the approvals in both cases are more than 90%. Again, it is possible that the respondents
express their ideals or gave the answer on what they think is socially desired. Therefore, it can be
doubted that the expressed attitudes are implemented in practice. Nevertheless, the comparison with
the consents to other statements is interesting. Thus, the novelty of a device and its value as a "flagship
object" is important for about a quarter of respondents, for just over a quarter of respondents a new
product is also a popular topic of conversation with friends and peers. More than half also like the
feeling of having something new (53%) or get something positive out of having something that
represents the state-of-the-art (51%). For less than half, new devices are even relevant for their quality
of life (46%). However, this does not mean that respondents see it as normal to have a new smartphone
21
OHA-Texte 01/2018
every year (only 14% see it as normal) or only a few see a broken device as a welcome opportunity to
buy a new device (16%). On the whole, there are significantly more people who also see novelty as
critical, especially when faced with constantly new models in the marketplace (71%).
Figure 19: To what extent do you agree or disagree with the following statements? Summarized for the
answers "I tend to agree" and "I completely agree" (N = 2,000 cases)
Although novelty seem to have a value, it does not have to be experienced and updated by buying
constantly new products. Longevity seems to play a more important role than novelty in the perception
of consumer. But are respondents willing to pay more for longevity? Here the participants’ answers
are difficult to interpret: 56% agree with the statement that "it does not matter how expensive
electrical appliances are, since anyway, all are built so that they break early." What may mean that the
majority of respondents has a generalized distrust of manufacturers and product quality. At the same
time, 62% say they buy branded products because of their estimated longer lifetime, even if it costs
more. Thus, it seems there is still some confidence in brand manufacturers. However, 65% say that
they pay close attention to low prices when buying electrical appliances, but then they may be less
durable. The details of these three statements correlate with each other, that is, the respondents have
significantly agreed to all three items significantly.
22
OHA-Texte 01/2018
OHA-TEXTE 1/2018