exhibitor software user‟s manual - omega … · 3 1. exhibitor software the exhibitor software is...
TRANSCRIPT

1
Exhibitor Software User‟s Manual
Exhibitor Software
V1.0.1 090908

2
Contents
1. Exhibitor Software
2. Installation
3. Using Exhibitor Program
3.1 Starting the Program
3.2 Logging in to the Program
3.3 System Set-Up
3.4 Loading Data File
3.4.1 Graph Window
3.4.2 Detail Window
3.4.3 Data Table Window
3.4.4 Alarm Table Window
3.4.5 Event Table Window
3.4.6 Memo Table Window
3.5 Real Time Display
3.5.1 Device Manager Window
3.5.2 Design Page Window
3.5.3 Real Time Record
3.5.4 Real Time View
3.5.5 Config
3.5.6 Display Window
3.5.7 Config Log Window
3.5.8 OPC Client Window
Appendix A – Language File
3
1. Exhibitor Software
The Exhibitor Software is a program for viewing and exporting both real-time and recorded data from
the recorder.
2. Installation
This program will run on Windows XP/2000 and later. It is not compatible with earlier versions of
Windows.
1. Insert the Exhibitor CD into the CD drive. The setup program should launch automatically if your
system is set to auto play CDs. If not, select the CD directory and run the setup.exe file.
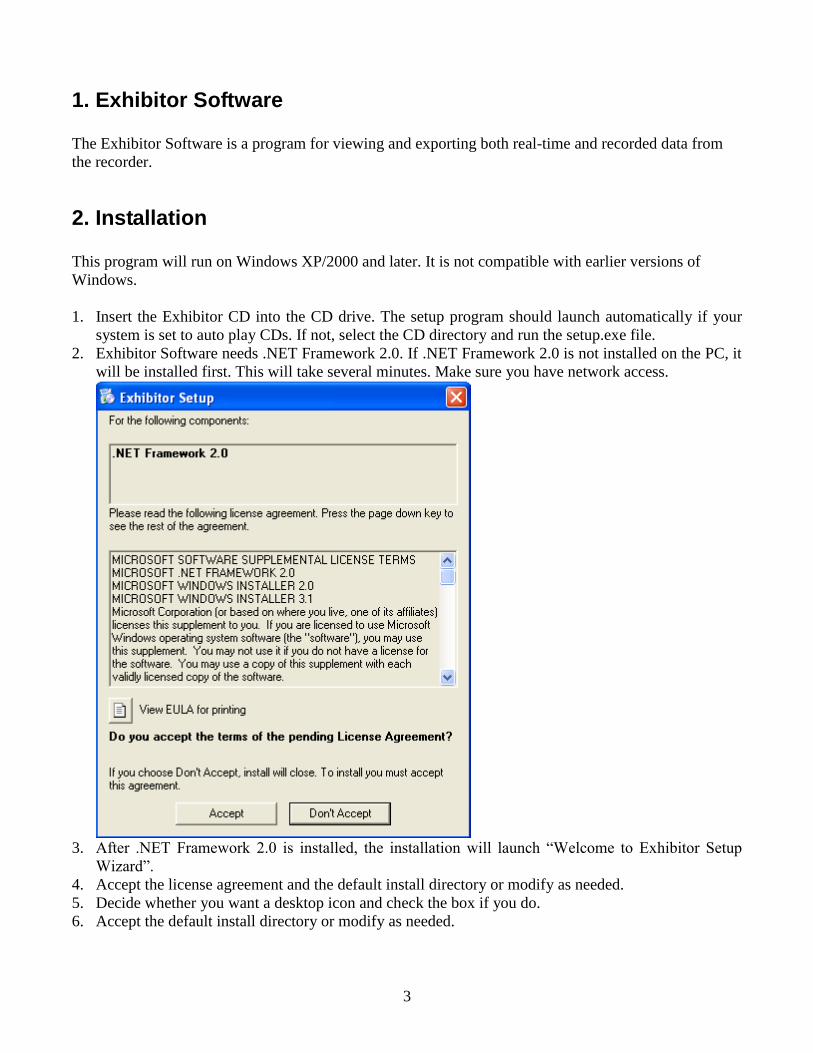
2. Exhibitor Software needs .NET Framework 2.0. If .NET Framework 2.0 is not installed on the PC, it
will be installed first. This will take several minutes. Make sure you have network access.
3. After .NET Framework 2.0 is installed, the installation will launch “Welcome to Exhibitor Setup
Wizard”.
4. Accept the license agreement and the default install directory or modify as needed.
5. Decide whether you want a desktop icon and check the box if you do.
6. Accept the default install directory or modify as needed.

4
3. Using Exhibitor Program
3.1 Starting the Program
The Exhibitor software has the following main features:
It can display information from existing data file in summarized, tabular and graphic formats.
It is capable of monitoring an external device (through the OPC server). The user can manage
different widgets.
It can export the data to Excel.
To start the program, click the desktop icon if installed (shown left), or use the Window‟s
Start menu. This will launch the main dialog.
If the master password is enabled, the main dialog starts in the Data, Graph page.

5
Otherwise, it starts in the Login page.
To enable the master password, please see Chapter 3.3 System Setup.
There are five major tabs in the workspace:
Login Login to the program
Data Show data in a file
Remote Show remote device values
Real Time View Show all widgets in a project file
Config FTP to the device and view Config file
The Data tab page has six sub tag pages:
Detail Shows each individual channel graph and summary of all channels
Graph Shows a graphic representation of the data
DataTable Shows all data points in a table
Alarm Shows all alarm points in a table
Event Shows all events in a table
Memo Shows all memos in a table
Remote tab page has three sub tab pages:
Device Manager Connects to multiple OPC server and displays all selected items
Design Page Creates different widgets and displays real time value
Real Time Record Creates record widget and records data point to a file

6
The pull-down menu items are:
File Allows the user to open a data file or exit the program
View View the Exhibitor log in file
Setup Allows the user to customize the program
Tool Connects to one OPC server and displays all items on it
Help Provides help file or information about the software
The icons from left to right are: New, Open File, Search and Log Off.
3.2 Logging in to the Program
The password option is disabled by default when the software is installed. The Login page is not
enabled. This option can be modified in the password dialog, which is explained in the next section
System Setup. The User can be added as well.
If the password option is enabled, the user has to login first. Otherwise, the program cannot do
anything.
If you want to change the password, check the check box when logging in.
The password change dialog will appear (as shown below).
When changing the password, the user id is grayed out. Type the new password and confirm it. If the
two don‟t match, you will have to try again.
7
3.3 System Set-Up
There are a number of items that can be set up before using the program, although these default to
useable options.
The Setup menu has the following options.
3.3.1 Language – The default is English. It is simple to add language files (see Appendix A).
If there is a language file in the Exhibitor installation directory that contains languages
besides English, these will be shown and the user can select the language.
3.3.2 Preferences –
3.3.2.1 Decimal Places – Determines how numeric data will be displayed. Default is 3.
3.3.2.2 Auto Scale – Determines if all data points will fit Y-Axes for all channels.
3.3.2.3 Remember Previous Directory – Determines if the program needs to remember
the directory when opening the data file.
3.3.2.4 Channel Label – Determines if the program will display the channel number or
channel engineering units for the buttons on the graph page.
3.3.3 Features – Allows the user to upgrade from the free demo (default) version to the Lite or
Full version. Select Update and enter your serial number in the spaces. Upgrades can be
purchased from your distributor. Use the pull-down menu Help – About to see what
feature you have.
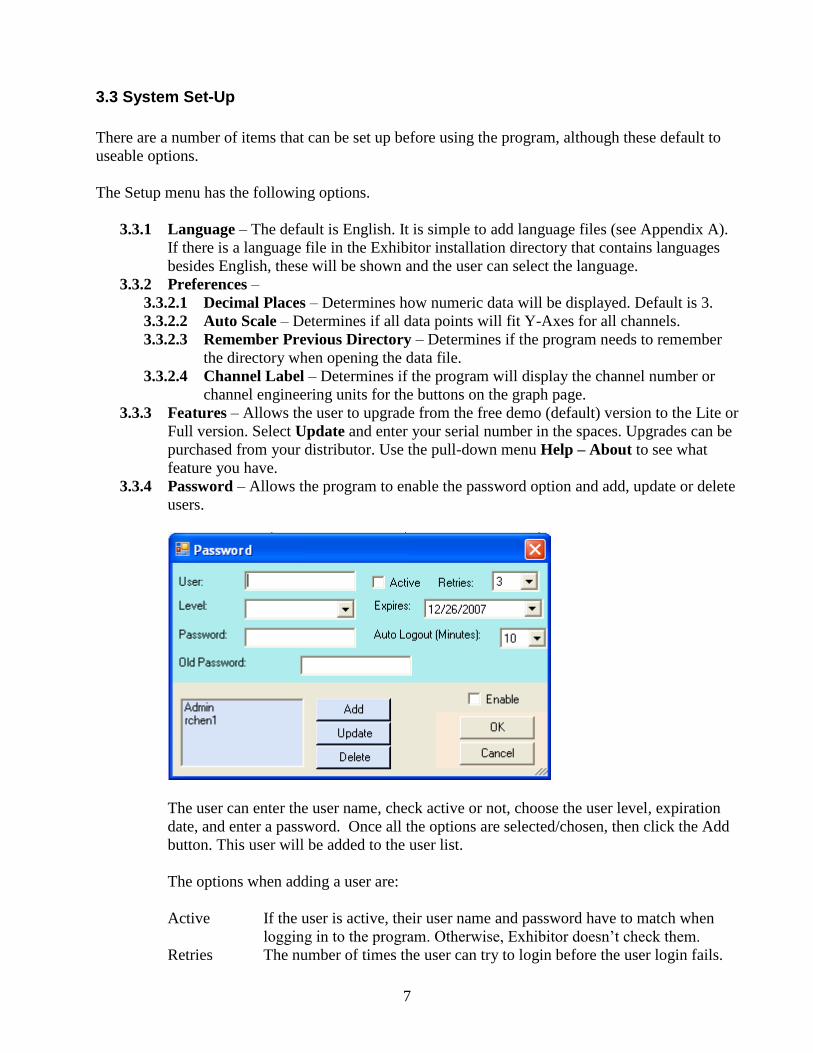
3.3.4 Password – Allows the program to enable the password option and add, update or delete
users.
The user can enter the user name, check active or not, choose the user level, expiration
date, and enter a password. Once all the options are selected/chosen, then click the Add
button. This user will be added to the user list.
The options when adding a user are:
Active If the user is active, their user name and password have to match when
logging in to the program. Otherwise, Exhibitor doesn‟t check them.
Retries The number of times the user can try to login before the user login fails.
8
Level There are three User Levels: User, Manager and Administrator
User: Cannot access setup. Can access all tabs except OPC Client,
Device Manager in Remote page. In the Design Page, the
user can view real time display, but cannot change the
widgets.
Manager: Access to everything except Password and Language.
Admin: Access everything.
Expires The user will expire on this date.
Password Enter the password to be used for this user.
Auto Logout The program will automatically logout the user after this amount of time.
Old Password The user needs to type the correct old password in order to change the
password.
Add Adds a user to the user list. The list box on the bottom left on the dialog
shows all users.
Update Modifies a user‟s password.
Delete Choose one of the users in the list box and click delete. That user will be
deleted from the list.
Enable Enables the password option. The check box is disabled if there is no user
in the list. After adding at least one user, the check box will be enabled.
After no mouse activity for 5 minutes, the user is automatically logged out.
If the user wants to login as a different user name, he/she can click the Log Off button. The
program goes to the login page and the user can re-login.
The Log Off button looks like: .
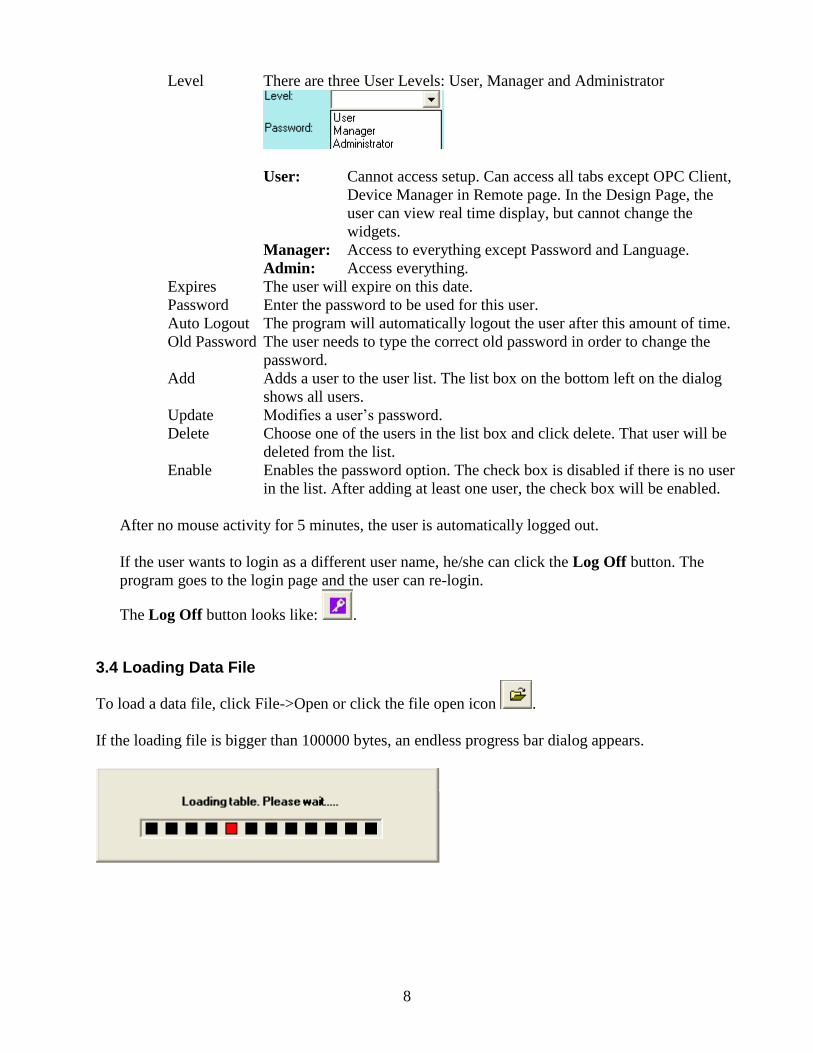
3.4 Loading Data File
To load a data file, click File->Open or click the file open icon .
If the loading file is bigger than 100000 bytes, an endless progress bar dialog appears.

9
There are six tab pages for loading data files.
Detail Shows each channel in different tag page and a summary table
Graph Shows all channels in one graph
DataTable Shows all data points in a table
Alarm Shows all alarm points in a table
Event Shows all events in a table
Memo Shows all memos in a table
3.4.1 Graph Window
In the example below, the file Sample.dat was loaded with the Auto Scale off.
There are eighteen channels (show below).

10
3.4.1.1 Graph Radio Buttons
There are a series of radio buttons along the left side of the Graph window. Each radio button
represents a channel with the correct color of that channel. Each channel has its own Y-Axes.
The maximum and minimum of the Y-Axes is defined in the configuration in the data file.
The configuration also defines the channel color and engineering unit. In the above example,
maximum of channel 1 is about 750 °F. Minimum is about -454 °F. Its color is white.
If you click the Chan 2 radio button, the graph changes as seen in the below dialog.
The color of the Y-Axes changes to red. The Maximum of channel 2 is 160 Seconds.
Minimum is 0 Seconds.
Each time a different radio button is selected, the graph will change accordingly.
3.4.1.2 Graph Buttons
The graphic area is fully interactive. Data can be zoomed and scrolled, the interaction
controlled by the icons above the graph.
- Select
This is the default cursor. It is used to scroll the trends horizontally and vertically by simply
right clicking in the graphics area. Traces can be scrolled individually by clicking and

11
dragging the individual vertical scales or together by clicking and dragging in the graphics
area.
- Stretch
Click this button to stretch (zoom) or shrink the graph along the x-axes (time) and y-axis
(scale). Traces can be zoomed individually by clicking and dragging the individual vertical
scales or together by clicking and dragging in the graphics area.
- Zoom In
Click this button to zoom in the graph.
- Zoom Out
Click this button to zoom out the graph.
- Zoom Window
Click this button to zoom to a user-defined window. When clicked, the cursor will turn into a
draw window tool. Draw a window around the area of interest by holding the right mouse
button and dragging the window. On release, the window area will fill the graphics screen.
- Zoom All
Click this button to fit all data into one screen.
- Cursor
Click this button to enable the cursor. Once enabled, right click anywhere on the graph and
select a channel to lock the cursor to that trace.

12
As the cursor is dragged along the time base, the cross-hairs will track the trace and the pop-
up box will show details about the point in the cross-hairs. The cursor will turn to the finger
pointer whenever the cursor can be dragged.
- Scroll to End
Click either the left or right scroll button to jump to the start or end of the data.
- Original Scale
Click this button to make the X and Y-axes to the original scale from when the data file was
loaded.
Click this button to show the print setup dialog.
The user can choose the printer, change orientation and margins. The default print page is the
current page. If the user wants to print all, he/she needs to input the total number of pages
he/she wants. The program will divide the whole loaded data file to be equal to that range
and print.

13
3.4.1.3 Channel Set Up
Right click the mouse anywhere on the graph to display a pop-up menu.
Select Setup from this menu and the Channel Setup dialog will appear.
The Channel Setup dialog allows the user to modify the properties of each channel.
Channel Selects a channel
Visible Turns the trace on or off for the selected channel
Marker Type Identifies the actual points recorded. The trace is extrapolated
between these points. The points can be marked by a square, circle
or diamond. The user can also select None for no marker.
Marker Size Adjusts the size of the marker on the points.
Line Type Identifies the trace type. It can be solid, dashed or dotted.
Line Thickness Adjusts the thickness of the trace.
Data Trace Color Changes the trace color for the selected channel.
Alarm Trace Color Changes the alarm trace color for the selected channel.

14
3.4.1.4 Graph Background Color
Right click the mouse anywhere on the graph to display the pop-up menu. Highlight
Background Color and there will be two menu items.
Choose “Select” to open the Color dialog, which allows the user to select a different
background color.
If “Save as Default” is selected, the selected background color will be saved to the registry.
The next time Exhibitor is run, the graph will use that color as the default background.
3.4.1.5 X-Axes Color
Right click the mouse anywhere on the graph to display the pop-up menu and highlight X-
Axes Color. Similar to Background Color, there are two menu options: Select and Save as
Default. Choosing “Select” will open the color dialog to allow the user to change the X-
Axes color. Choosing “Save as Default” will save the selected color to the registry to be
used next time the software is run.
3.4.1.6 Other Information
There is a scroll bar and two buttons under the trend graph.
Scroll Bar Scrolling the scroll bar will move the trend to the correct position.
For example, if the scroll bar is moved to 15% and the total data points for
each channel are 1000, the 150th
data point will be the 1st data on the screen.
15
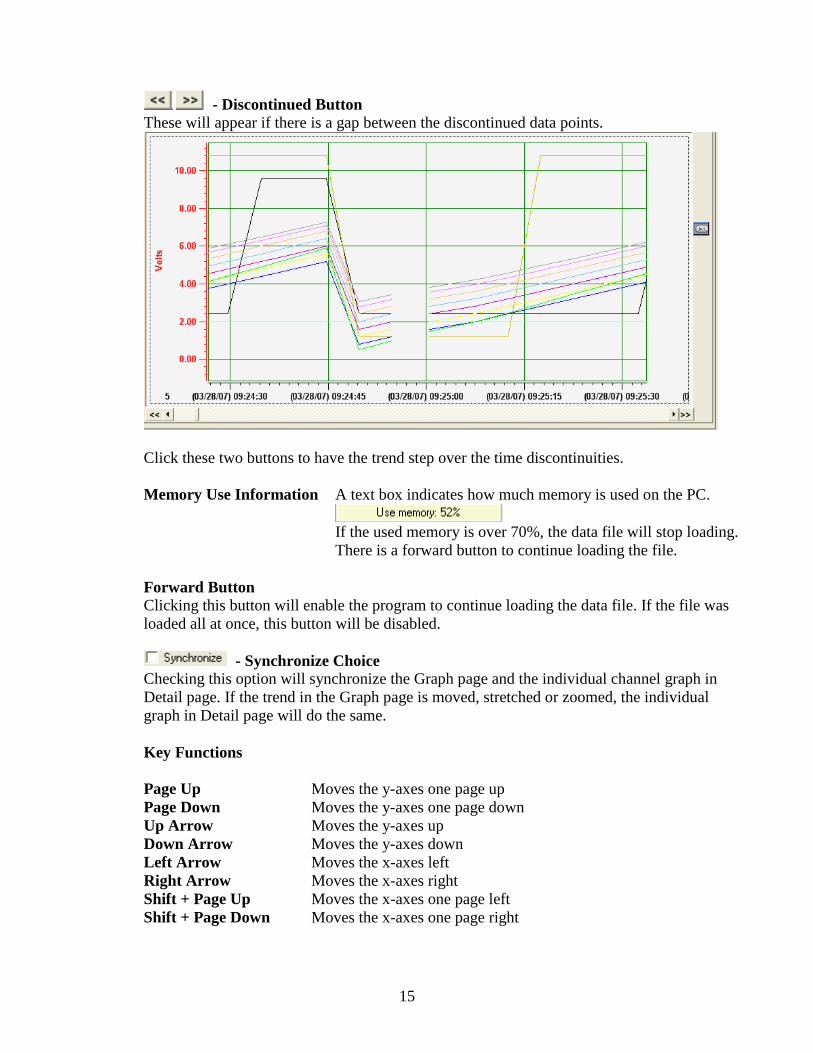
- Discontinued Button
These will appear if there is a gap between the discontinued data points.
Click these two buttons to have the trend step over the time discontinuities.
Memory Use Information A text box indicates how much memory is used on the PC.
If the used memory is over 70%, the data file will stop loading.
There is a forward button to continue loading the file.
Forward Button
Clicking this button will enable the program to continue loading the data file. If the file was
loaded all at once, this button will be disabled.
- Synchronize Choice
Checking this option will synchronize the Graph page and the individual channel graph in
Detail page. If the trend in the Graph page is moved, stretched or zoomed, the individual
graph in Detail page will do the same.
Key Functions
Page Up Moves the y-axes one page up
Page Down Moves the y-axes one page down
Up Arrow Moves the y-axes up
Down Arrow Moves the y-axes down
Left Arrow Moves the x-axes left
Right Arrow Moves the x-axes right
Shift + Page Up Moves the x-axes one page left
Shift + Page Down Moves the x-axes one page right
16
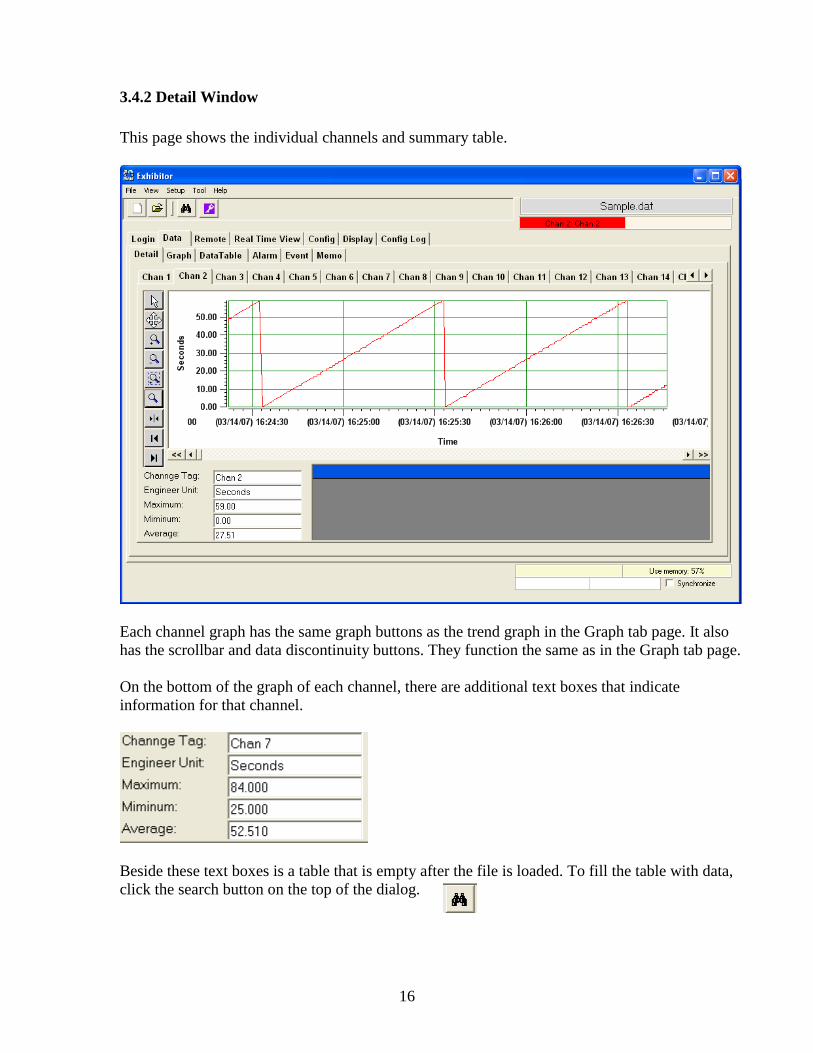
3.4.2 Detail Window
This page shows the individual channels and summary table.
Each channel graph has the same graph buttons as the trend graph in the Graph tab page. It also
has the scrollbar and data discontinuity buttons. They function the same as in the Graph tab page.
On the bottom of the graph of each channel, there are additional text boxes that indicate
information for that channel.
Beside these text boxes is a table that is empty after the file is loaded. To fill the table with data,
click the search button on the top of the dialog.

17
A search dialog will appear with the start time and end time for that channel.
Select a start date and end date and click OK. The table will be filled with all data points on that
channel between the specified start time and end time. The trend will be highlighted for all the
searched data points.

18
Clicking on any value cell will allow the user to add a message on that data point on the graph.
The summary table summarizes the information for all channels.

19
3.4.3 DataTable Window
The DataTable Window shows the time and value of every data sample on each channel. This
window is also used to export data directly into an Excel™ spreadsheet and save the table to a
.csv file. It can also be used to highlight a specific point on the graph.
3.4.3.1 Jumping to A Specific Point on The Graph
If you double click a value in any channel value column in the DataTable, the program will
highlight that point on the graphic window. The graph will be automatically scaled to show
the unique point highlighted by a rectangular box as shown below:
Move the cursor into the rectangle for precise information about the point.

20
The graph is synchronized with the DataTable as well. First, put the marker on a channel (For
example, channel 2).
Move the cursor to the second marker. The cursor will become a hand. Double click the
marker. The second row on the data table will be highlighted.
3.4.3.2 Creating Report
The Exhibitor has the ability to create custom reports to be exported to Excel™ directly. The
user can select the entire data set (beware of large files) or highlighted rows in the table or
choose specific dates and times using the filter. Also, the user can select what columns from
the table to export.

21
To export all data simply click the Excel™ button or Export button .
To select multiple rows from the DataTable, click the left edge of the starting row to export.
This will highlight the row. Then scroll to the last row to export and hold down the shift key,
and click the left edge of the last row. This will highlight all the rows between the start and
the end. Then click the Excel™ button or Export button. The spreadsheet will open
automatically if using Excel™ or you can open the exported file later if the Export button is
click.
The report can be further customized by selecting which columns to include in the report.
This is done via the Report dialog box.
The Include Columns check boxes determine which columns of the data table will be
exported to the spreadsheet. Simply select the data you want.
Below the Include Columns window is the Filter. This is yet another easy way to limit what
data is exported to the spreadsheet. You can filter data by Date or Time or Both simply by
checking the relative boxes as shown below.
The From: and To: data entry areas default to the start and end times of the data in the table
to be exported and can be edited by the user to specify an exact time frame for export. Once
all parameters are set, press the Excel™ button and the data will open in an Excel™
spreadsheet.

22
When exporting into Excel™, the user can select the desired Time Format in which the time
will be displayed in Excel.
There is also an option to view only an interval report. Select the desired interval.
Minute – View the first data point of every minute.
½ Hour – View the first data point of every half hour.
Hour – View the first data point of every hour.
Day – View the first data point of every day.
NOTE: You will need to have a valid copy of Excel™ on your PC. Otherwise use the
Export button to name a .CSV file for later use.
3.4.4 Alarm Table Window
The Alarm Table is for alarm points. If there are no alarms, the window will be empty.

23
3.4.5 Event Table Window
The Event Table is for events. If there are no events, the window will be empty.
3.4.6 Memo Table Window
The Memo Table is for memos. It shows all memos in the data file.
Each memo is plotted on the graph as a yellow folder image. Double-click any cell in the memo
row and a yellow rectangle will surround the correct yellow folder.

24
Double-click the yellow folder to see the content of the memo. If it is a message, a textbox will
display the memo.
If it is an image, it will be displayed in a graph.

25
3.5 Real Time Display
Exhibitor can display data through OPC.
Microsoft‟s COM is the key for communication between OPC clients and OPC servers. DCOM
permits OPC clients transparent access to OPC servers on remote computers. Default DCOM
settings vary from system to system. Generally, default DCOM settings on the server machine
restrict OPC client applications from accessing a remote OPC server.
If you have difficulty connecting the Exhibitor application to an OPC server, temporarily turn off
your computer‟s firewall. To do so, click the Control Panel -> Security Center->Windows Firewall.

26
There are four ways to see real time data within the program: Device Manager Window, Design
Page Window and Real Time View and OPC Client (under the Tools pull-down menu).
3.5.1 Device Manager Window
This window can show multiple servers (maximum 50). Each server can have multiple items
(maximum 100).
3.5.1.1 Add Server
1. Click the Add OPC Server button. The OPCServerBrowser will appear.
27
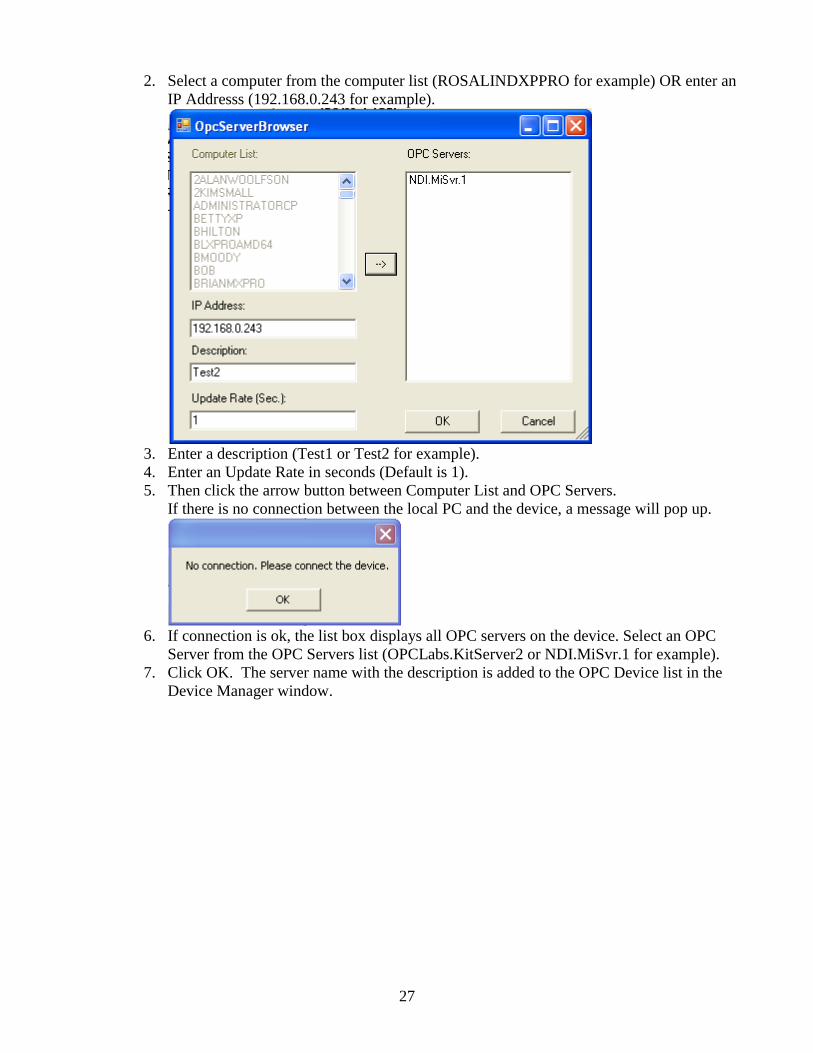
2. Select a computer from the computer list (ROSALINDXPPRO for example) OR enter an
IP Addresss (192.168.0.243 for example).
3. Enter a description (Test1 or Test2 for example).
4. Enter an Update Rate in seconds (Default is 1).
5. Then click the arrow button between Computer List and OPC Servers.
If there is no connection between the local PC and the device, a message will pop up.
6. If connection is ok, the list box displays all OPC servers on the device. Select an OPC
Server from the OPC Servers list (OPCLabs.KitServer2 or NDI.MiSvr.1 for example).
7. Click OK. The server name with the description is added to the OPC Device list in the
Device Manager window.

28
8. Double-click the server name or right click it and select Add Item from the menu to view
all OPC items under this server.
There are two other items in this menu.
Update Rate – Modifies the server update interval. The default is 1 second.
Delete Server – Deletes this server from the OPC Device list.
9. The Item List on the right side of the window will show all the items under this server.
Click any server to expand child nodes.

29
10. Select an item from the Item List and click the left arrow button between OPC Device
and Item List to add the item to the server in OPC Device list. If the root node in
the Item List tree is chosen, all children under the root are added to the server. Only the
added items are displayed to the user.
30
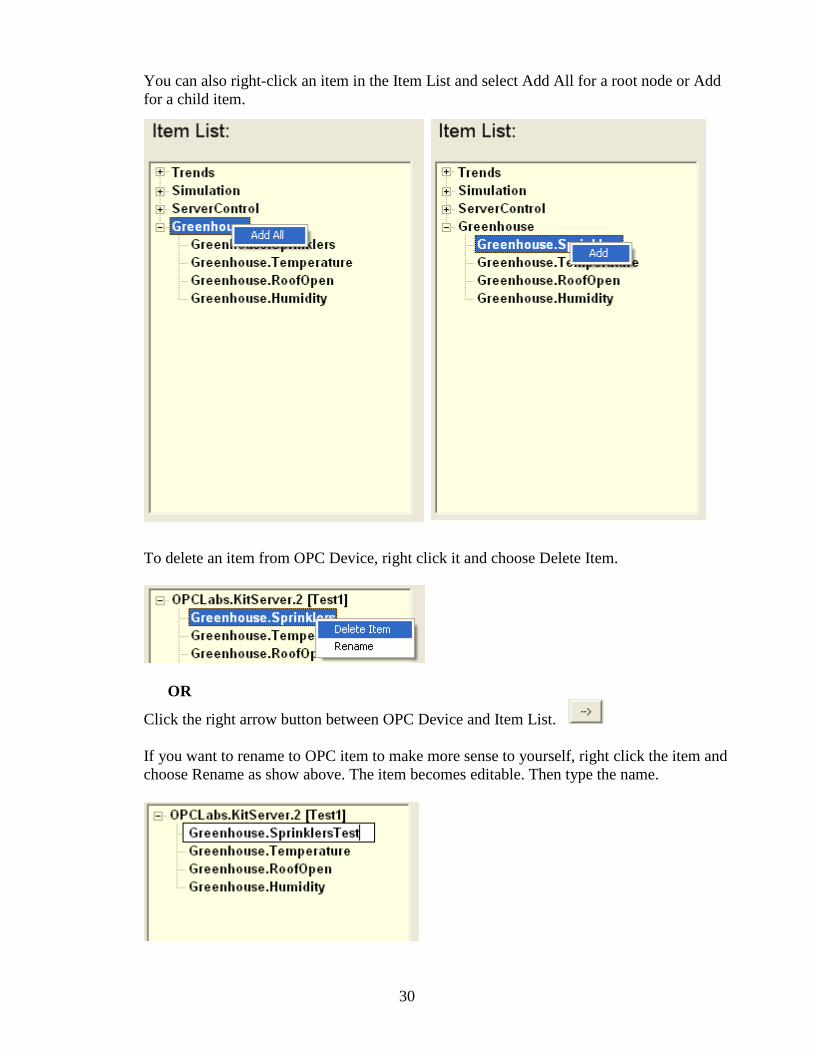
You can also right-click an item in the Item List and select Add All for a root node or Add
for a child item.
To delete an item from OPC Device, right click it and choose Delete Item.
OR
Click the right arrow button between OPC Device and Item List.
If you want to rename to OPC item to make more sense to yourself, right click the item and
choose Rename as show above. The item becomes editable. Then type the name.

31
When adding another server, previously selected servers will disappear from the list, but they
still exist. They are just hidden.
To view all added servers, click the View All button.
All added servers will be listed in the left window. Double-click any server to expand the
tree and show all children.
3.5.1.2 Running the Servers
1. Click the Run button. A table with the server and its selected items replaces the Item List
on the right side of the window.
2. Check the Show Live check box if it is unchecked. The default is unchecked. After
checking it, the table shows the real time value.
If you want to modify the OPC Device list, you have to click Stop button. The table is gone
and the Item List comes back.

32
3.5.1.3 Save OPC Device
The program can save all added OPC Device Servers and reload them. This saves time and
you don‟t have to go to the OPC Server Browser window to add servers and reconnect.
1. Click the Save button.
2. Select a Save in location
3. Enter a File name (e.g. dev2). The extension of the file is .dev.
4. Click Save.
The File name (e.g. dev2.dev) will be added to the OPC Device combo box.
33
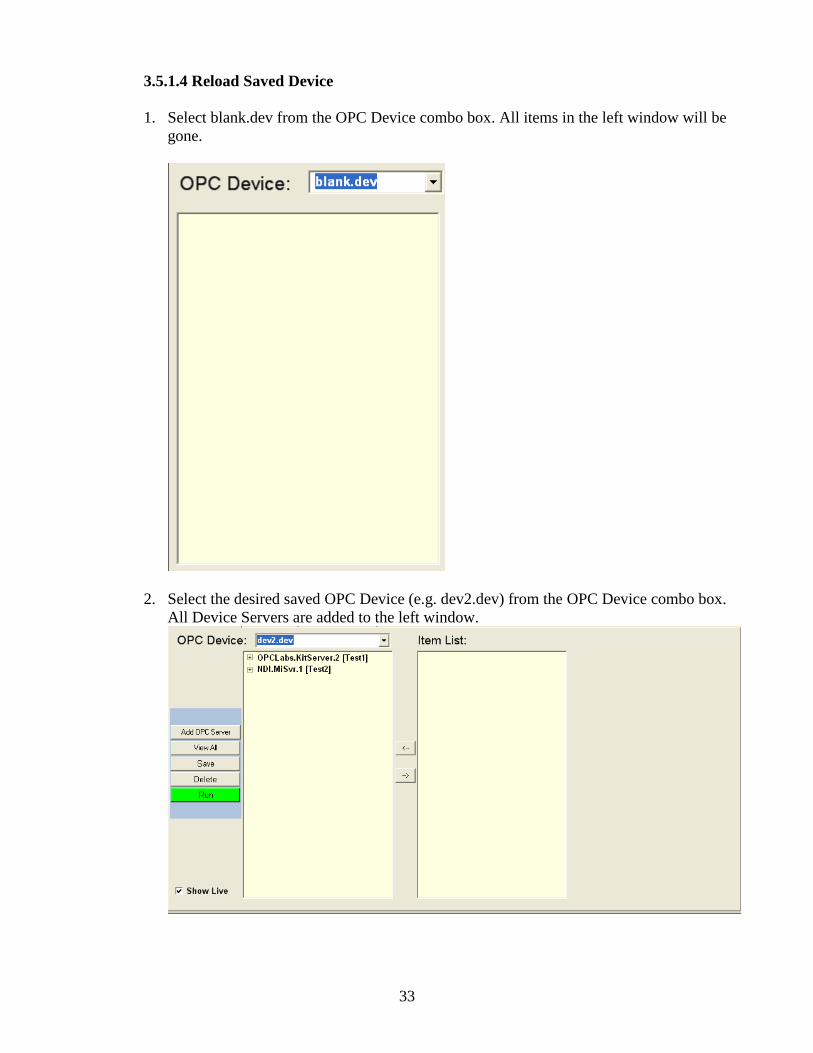
3.5.1.4 Reload Saved Device
1. Select blank.dev from the OPC Device combo box. All items in the left window will be
gone.
2. Select the desired saved OPC Device (e.g. dev2.dev) from the OPC Device combo box.
All Device Servers are added to the left window.

34
3.5.1.5 Delete Saved Device
1. Click the Delete button.
2. Select a file to delete from the list and then click OK.

35
3.5.2 Design Page Window
The user can customize different widget and show different OPC items. All OPC items are based
on Device Manager window.
3.5.2.1 Creating a Widget
1. Click the (Select a Control) combo box.
2. Select a widget type (Small Thermometer for example).
36
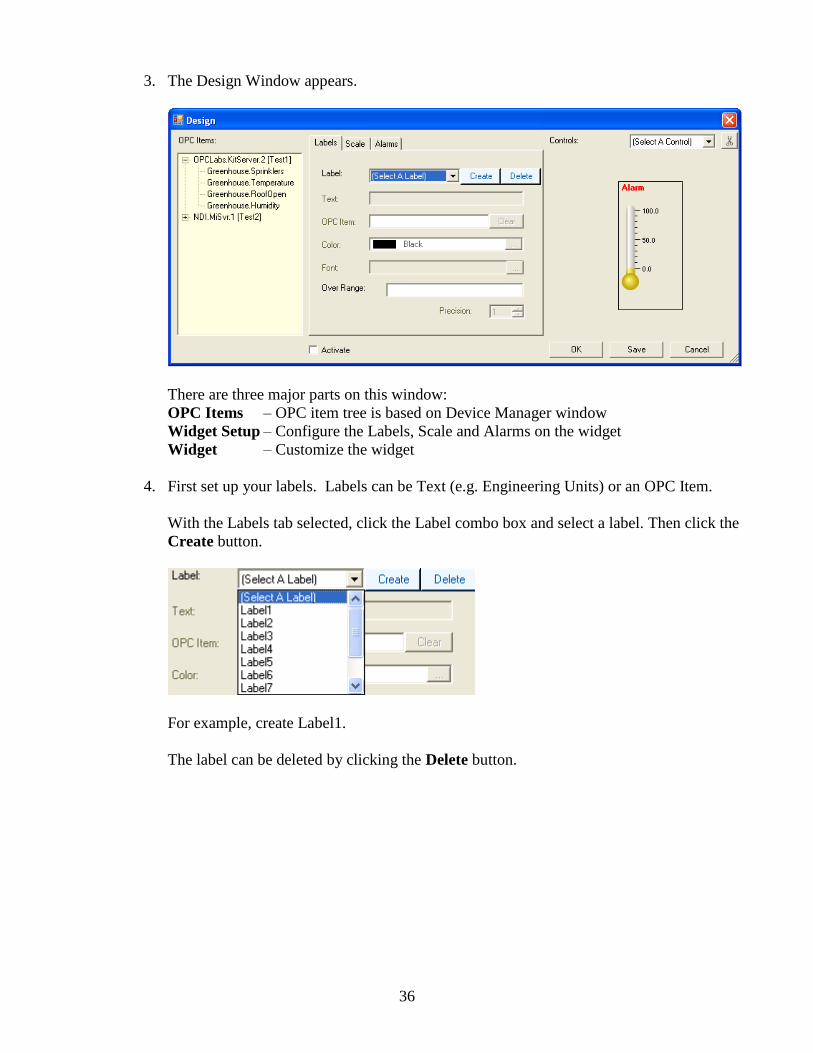
3. The Design Window appears.
There are three major parts on this window:
OPC Items – OPC item tree is based on Device Manager window
Widget Setup – Configure the Labels, Scale and Alarms on the widget
Widget – Customize the widget
4. First set up your labels. Labels can be Text (e.g. Engineering Units) or an OPC Item.
With the Labels tab selected, click the Label combo box and select a label. Then click the
Create button.
For example, create Label1.
The label can be deleted by clicking the Delete button.

37
All Labels are created on the top left corner on the widget.
If you put the mouse cursor over Label1 the cursor becomes a hand. Then you can drag
the label to move it to where you want.
To make Label1 Text, type text into the Text box and you will see Label1 change to the
text you typed in the widget on the right.
For more advanced details within a widget, you can add more Labels, which can indicate
titles or values such as max and min.
For instance, you can follow the same steps to create Label2, but instead of making the
label text, select an OPC Item from the list on the left to make the Label2 equal to that
OPC Item.

38
The example below shows Label2 assigned to the OPC Item ChannelEngUnit_02. This
label will continuously change as the value of ChannelEngUnit_02 changes.
5. Next select the Scale tab to configure the Scale, which actually assigns a value for the
widget.
To assign OPC item to the scale, click the OPC Item text box so the cursor is in there.
Then click any OPC item (ChannelValue_02 for example).
You can configure Min and Max by assigning a number or an OPC item. By default, they
are assigned by 0 and 100. To assign an OPC item, click the Use OPC Item check box.
Click in the Min or Max text box, and then select an OPC item.
You can also change the color of different divisions, the scale and the point.

39
6. Next select the Alarms tab to configure the Alarms.
There are two ways to configure alarm set points. By default, it is set by internal alarms.
That means that the alarm set point is configured by the device. This only applies to the
widget that its scale is assigned by ChannelCom* item. A red label Alarm appears on the
top of the widget if there is an alarm.
If you want to configure the set point yourself, uncheck Internal Alarm check box and
enter the numbers in the two Set Point text boxes.
7. Once you are done setting up the widget, check the Activate check box.
8. Click the OK button.
The configured widget is added to the main design page.
Double-click the widget to go back to the design window so you can change the
configurations.

40
Widget Types:
Thermometer (Small or Large)
Digital (Small or Large, type 1 or 2)
Bar (Small or Large)
Trend
Digital widgets do not have Min and Max. These two areas are disabled.
You can also choose Auto Precision for the scale value:
Or customize the precision yourself.
Bar widgets have scales with three value sections for alarms. They can be assigned different
colors.

41
The Trend widget has additional tabs to configure Channels, the Display and UpdateRate.
The created labels are movable and assigned to OPC items like other widgets.
The trend widget has eighteen channels by default. Each channel needs to be configured
separately.
To configure Channels click on the Channels tab.
42
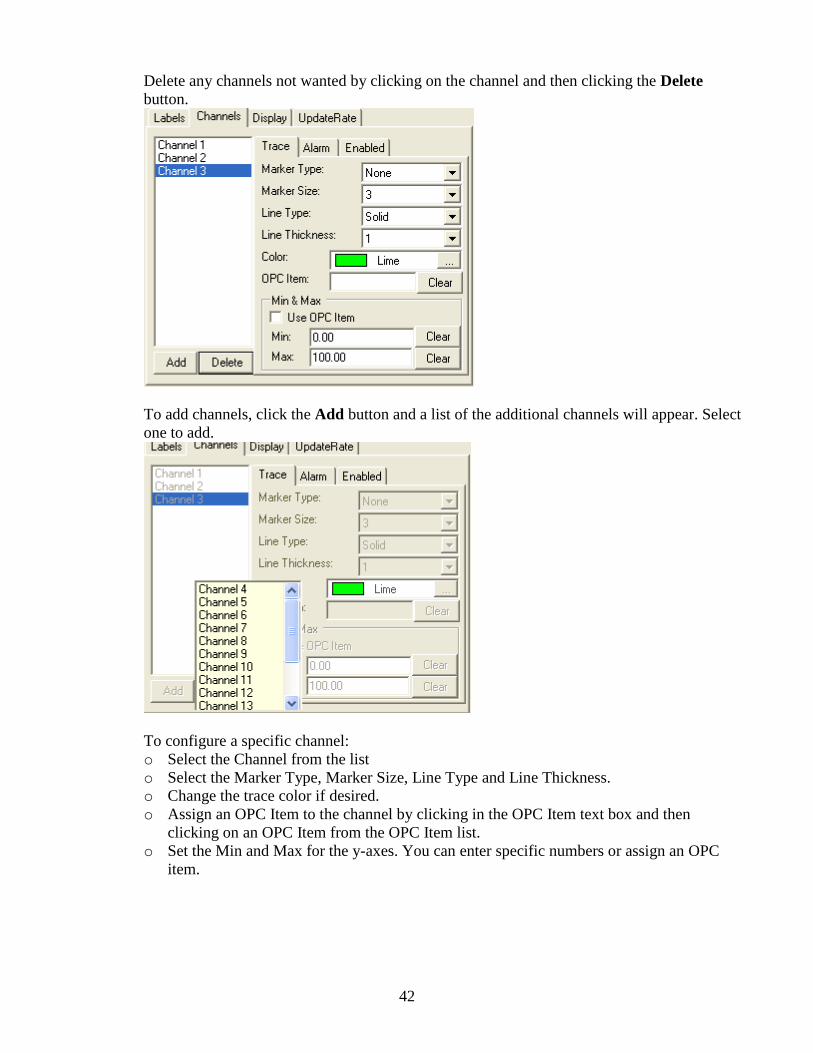
Delete any channels not wanted by clicking on the channel and then clicking the Delete
button.
To add channels, click the Add button and a list of the additional channels will appear. Select
one to add.
To configure a specific channel:
o Select the Channel from the list
o Select the Marker Type, Marker Size, Line Type and Line Thickness.
o Change the trace color if desired.
o Assign an OPC Item to the channel by clicking in the OPC Item text box and then
clicking on an OPC Item from the OPC Item list.
o Set the Min and Max for the y-axes. You can enter specific numbers or assign an OPC
item.

43
o Click on the Alarm tab. Configure the alarm set points and color. The alarm color is the
same as the channel trace color by default.
o Click on the Enabled tab. Unchecking the Enable check box makes the trace invisible.
Follow the same steps to configure additional channels.

44
To configure the Trend Display Setting, click on the Display tab.
Enter a name that will be the name of the trend graph.
There are three trend styles. The only difference is trend size.
Each channel has its own y-axes. You can let the trend only show one specific channel y-
axes:
OR rotate all channel y-axes at a specific time interval (10 seconds for example).

45
To configure the Trace Update Rate, click on the UpdateRate tab.
The Update Rate is set to 1 second by default.
Once the trend is configured make sure to check the Activate check box and click the OK
button. The trend will be added to the main Design Page window.

46
Once you have added all your widgets to the Design Page (an example with 6 widgets is
shown below), you can move these widgets around by putting the mouse cursor over a
widget and dragging the widget to a new location.
The main Design page has vertical and horizontal scroll bars, which can be used to see all
widgets.
All the widgets don‟t show any real value yet. You must click on the Run button on the
Device Manager or Design Page first. Once you hit Run, you will see real values in the
Design Page.

47
If there is no connection, an error message will pop up similar to the following:
There are some graph buttons on the top of the trend widget. They have the same
functionalities like the graph for the file open. To make these buttons work, click the red
Pause button.
After that, the trend stops displaying data and the graph buttons become enabled. Now you
can interact with the graph.
Click the green button to resume trending live data.
3.5.2.2 Save Widget Configuration
Exhibitor can save the widget configuration and reload it to save time.
1. Once a widget is created, click the Save button.
2. In the Save File dialog select a Save in location and File name (e.g. therm1).
3. Then click the Save button. The widget is saved with a .wgt extension.
4. The File name will then be listed in the Controls combo box.

48
To reload the saved File name, click in the Controls combo box and select .wgt file.
The widget will load into the Design Page like the following:
Widgets are saved in the installation directory. You can open Windows Explorer and go to
the directory to delete the file. Or you can select the file from the Controls combo box and
click the cut button.
3.5.2.3 Save Created Widgets On Design Page
All created widgets on the Design Page can be saved to a project file and reloaded later. This
saves a lot of time from having to recreate and reconfigure widgets.
1. Once you have created all your widgets and want to save the design, click the Save
button on the Design page to save the page as a Project.

49
2. In the Save File dialog select a Save in location and File name.
3. Then click the Save button. The Project is saved with a .prj extension.
4. The File name will then be added to the Project combo box.
You can empty the Design Page by selecting blank.prj from the Project combo box.

50
The Design Page will become the default empty page.
To reload a saved Project, select a Project from the Project list.
A Project dialog appears.
It has IP address for all the devices that are in the project.
The user can change the IP address by clicking the Edit IP button.
It is recommended that the user click the Test Connection button first before clicking
Connect.

51
If there is no connection between the PC and the device, a message will be displayed.
The Edit Project button will create all widgets in the project but no connection to the device.
The widgets will not show real time values.
Clicking the Connect button loads the project and connects to the devices in the project. All
widgets in the Project are loaded to the Design Page.
Projects are saved under the installation directory. They can be deleted from that directory or
by clicking the Delete Project button.
To delete a single widget from a Project, double-click it. The widget design dialog appears.
Click the Delete Control button.
This widget will be deleted from the Design Page.
3.5.2.4 Save Background Image
The user can add or delete a background image.
- Click this button to choose an image file. The background will change
accordingly.

52
- Click this button to delete the background image.
3.5.3 Real Time Record
The user can create record widgets and record data from different device.
1. Click the Record Widget button to create a record widget. A Record Widget dialog appears.

53
Either choose the data device from the first combo box or enter the IP to the four text
boxes on the top right.
Enter the description.
Enter the data chart update rate.
Choose record status: Manual or Auto.
Enter the record rate. It must be equal or greater than the data chart rate.
Select the channels that are going to record. Clicking the little blue button beside each
channel to change the channel color.
Decide whether or not to include Alarms.
To indicate the File Name to which to save, click the Browse button (…). Another
window will appear allowing you to chose a File Name that already exists or type in a
new File Name.
The following is a record widget example.
54
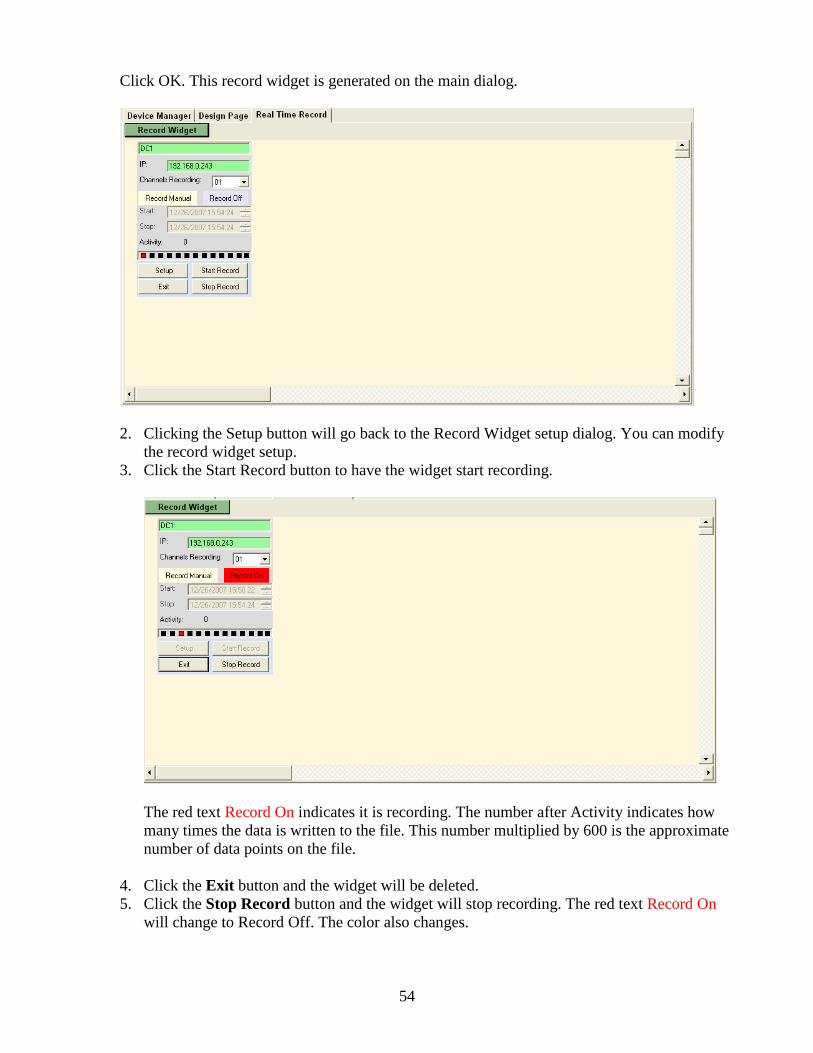
Click OK. This record widget is generated on the main dialog.
2. Clicking the Setup button will go back to the Record Widget setup dialog. You can modify
the record widget setup.
3. Click the Start Record button to have the widget start recording.
The red text Record On indicates it is recording. The number after Activity indicates how
many times the data is written to the file. This number multiplied by 600 is the approximate
number of data points on the file.
4. Click the Exit button and the widget will be deleted.
5. Click the Stop Record button and the widget will stop recording. The red text Record On
will change to Record Off. The color also changes.

55
6. Click the Open button on the top or click File -> Open to open the saved file.
All saved data is shown on the Data tab page.
Multi record widgets can be created to record data from different recorders.

56
3.5.4 Real Time View
The user can view project files on this page. It is almost the same as the Design Page except the
widget cannot be modified.
The user can also change the background image.
57
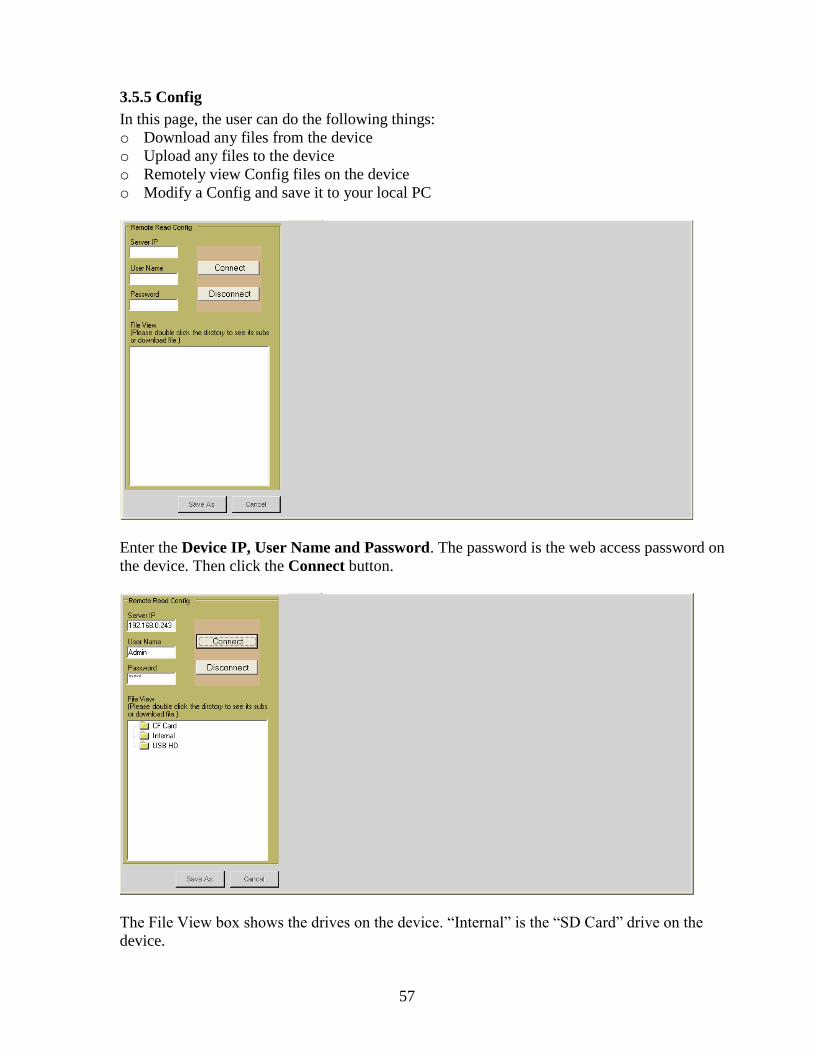
3.5.5 Config
In this page, the user can do the following things:
o Download any files from the device
o Upload any files to the device
o Remotely view Config files on the device
o Modify a Config and save it to your local PC
Enter the Device IP, User Name and Password. The password is the web access password on
the device. Then click the Connect button.
The File View box shows the drives on the device. “Internal” is the “SD Card” drive on the
device.

58
Double-click a drive and all files and directories under it will be displayed.
The yellow folder image indicates it is a folder. The text paper indicates it is a file.
3.5.5.1 Download File to Device
Right click any file to display a pop-up menu.
To download the file, click “Copy to Folder”. A browse window will appear.
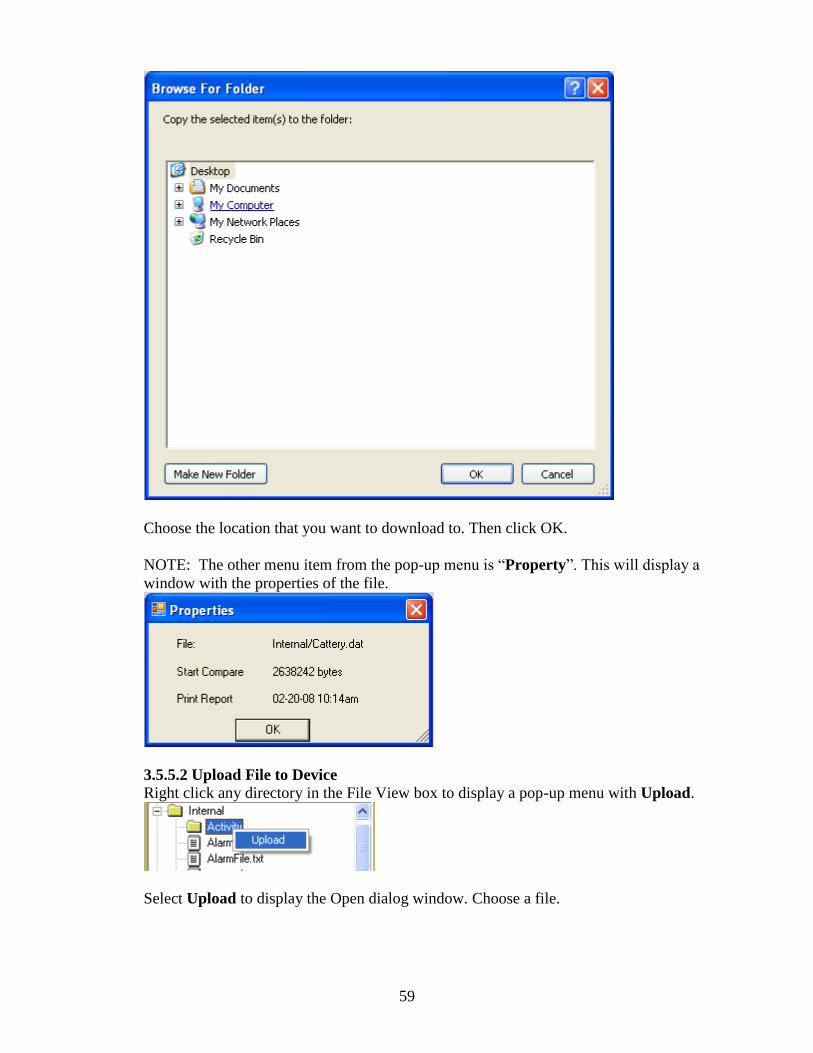
59
Choose the location that you want to download to. Then click OK.
NOTE: The other menu item from the pop-up menu is “Property”. This will display a
window with the properties of the file.
3.5.5.2 Upload File to Device
Right click any directory in the File View box to display a pop-up menu with Upload.
Select Upload to display the Open dialog window. Choose a file.
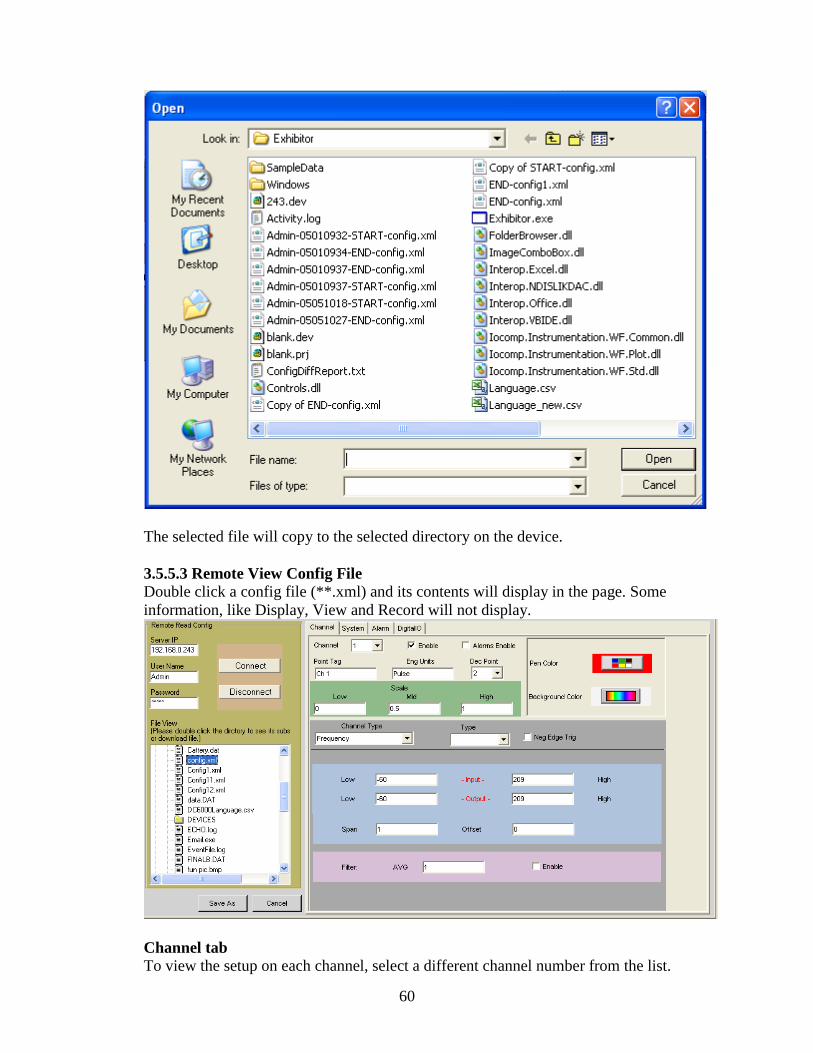
60
The selected file will copy to the selected directory on the device.
3.5.5.3 Remote View Config File
Double click a config file (**.xml) and its contents will display in the page. Some
information, like Display, View and Record will not display.
Channel tab
To view the setup on each channel, select a different channel number from the list.
61
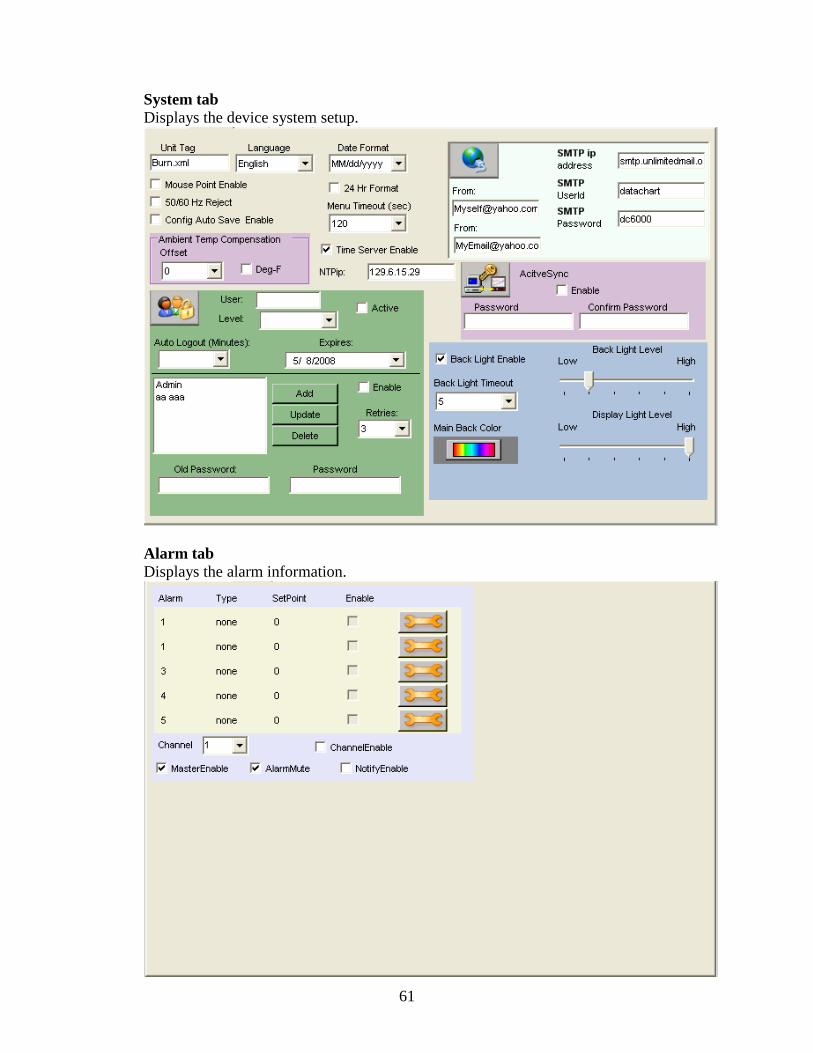
System tab
Displays the device system setup.
Alarm tab
Displays the alarm information.

62
Click the Setup button to display the individual alarm information.
Select a different channel to view that individual channel‟s alarm information.

63
There is Setup button on the bottom right. Click it to show Contact Setup information.
DigitalIO tab
Displays digital in and digital out information.
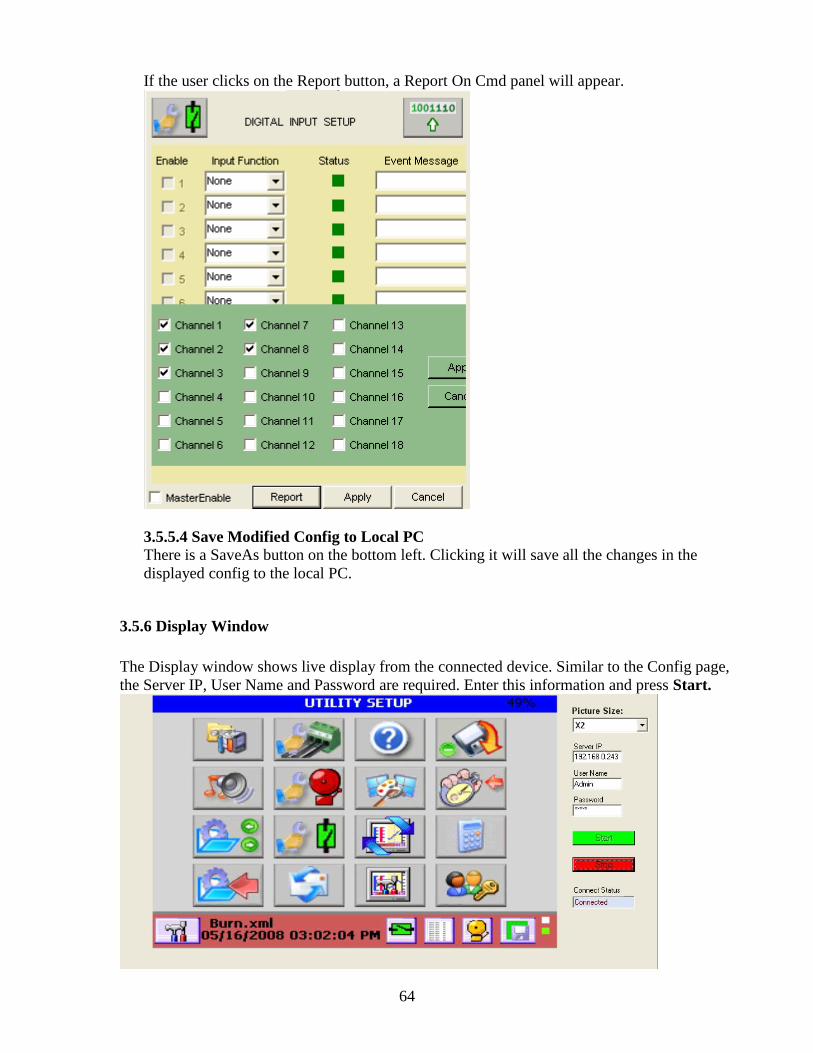
64
If the user clicks on the Report button, a Report On Cmd panel will appear.
3.5.5.4 Save Modified Config to Local PC
There is a SaveAs button on the bottom left. Clicking it will save all the changes in the
displayed config to the local PC.
3.5.6 Display Window
The Display window shows live display from the connected device. Similar to the Config page,
the Server IP, User Name and Password are required. Enter this information and press Start.

65
The user can change the size by selecting a different option from the Picture Size pull-down
box.
Press the Stop button to stop the live display.
3.5.7 Config Log Window
After the user logs into the device, he/she can change the configuration. After logging out, the
modified configuration is saved in the device. The user can use this page to view the changes.
The Server IP, User Name and Password are required. Press the GetLog button to get a listing of
all the LogOn activities.

66
Select a different login activity from the Login Users pull-down box.
If the config is changed, the activity box will list when the user logged in, when the config was
started, when the config was ended and when the user logged out (shown from bottom to top).
Click the Start Compare button to show the changes made.

67
There are three different symbols on the report.
<< = Before value and After value are changed.
<<- = After value is missing.
<<+ = New added item in After value.
Press the Print Report button to print the report to the printer.
3.5.8 OPC Client Window
Go to the Tool drop down and select OPC Client. This window can connect to one OPC server
and displays all items on it.
The following are the steps to view the items on a server.
1. Connect to a server
There are three ways to connect to a server:
Enter the machine‟s IP address that the server is on, and then click the combo box under
OPC Server. All OPC servers will be listed in the combo box. Then click the server that
you want to connect to.
68
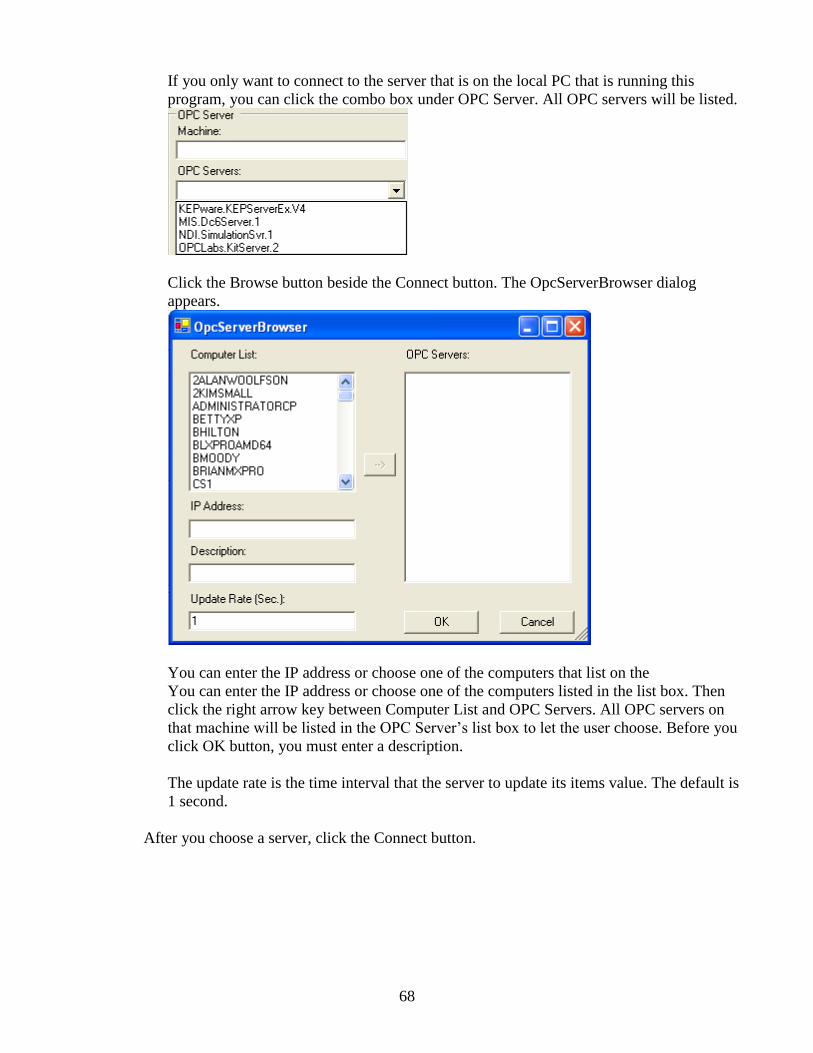
If you only want to connect to the server that is on the local PC that is running this
program, you can click the combo box under OPC Server. All OPC servers will be listed.
Click the Browse button beside the Connect button. The OpcServerBrowser dialog
appears.
You can enter the IP address or choose one of the computers that list on the
You can enter the IP address or choose one of the computers listed in the list box. Then
click the right arrow key between Computer List and OPC Servers. All OPC servers on
that machine will be listed in the OPC Server‟s list box to let the user choose. Before you
click OK button, you must enter a description.
The update rate is the time interval that the server to update its items value. The default is
1 second.
After you choose a server, click the Connect button.

69
2. Browse Items
On the Namespace group, click the Browse button. All servers and all items will be listed.
Click the server name to expand the tree.
3. Add Group
Add a group before subscribing. Click the Add Group button in OPC Groups.
4. Add OPC Items
Double-click any OPC item in the browse window in Namespace group. That item will be
added to the table below the browse window.

70
5. Subscribe The Items
Check the Subscribed checkbox. The table will display the real time values.
71
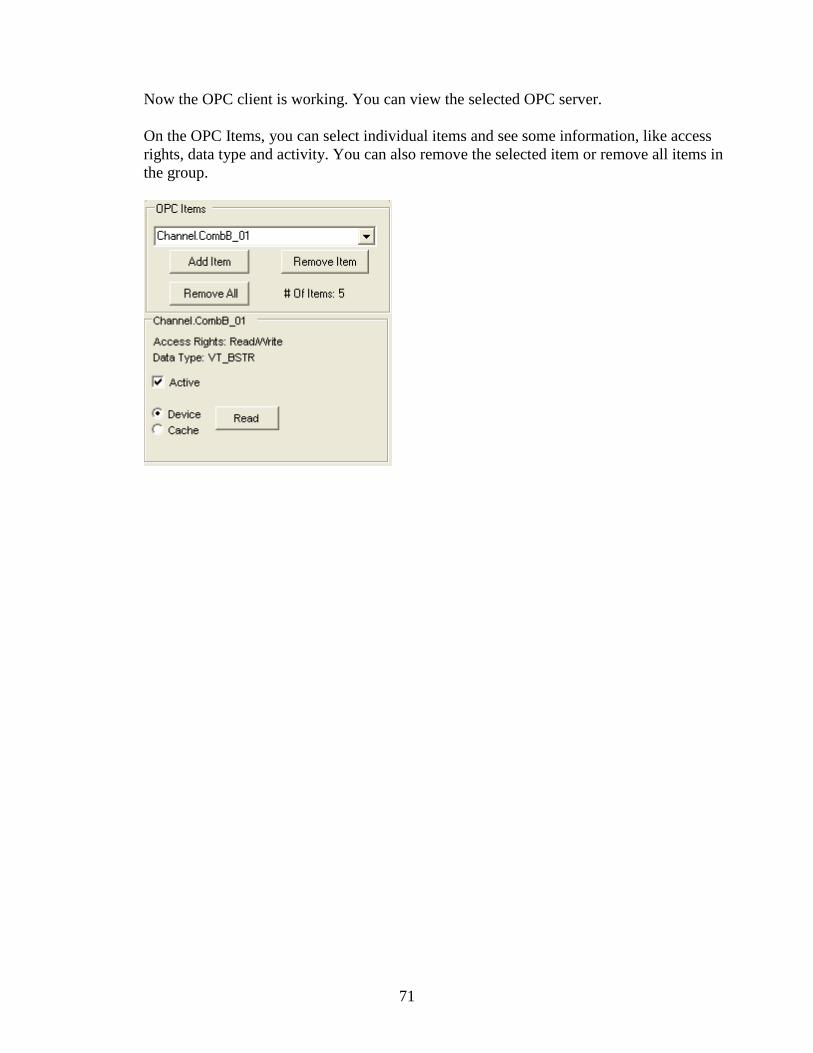
Now the OPC client is working. You can view the selected OPC server.
On the OPC Items, you can select individual items and see some information, like access
rights, data type and activity. You can also remove the selected item or remove all items in
the group.

72
Appendix A – Language File
Adding a language is a simple process. Exhibitor uses an Excel™ compatible file (Language.csv), that
resides in the Exhibitor program directory, to read all text that is displayed in the program. The first
column is the English word. To add a language, simply add a column and make sure the first entry in the
column is the language. When the Setup – Language option is chosen, the program reads the first row
of this spreadsheet and displays the languages available. (Make sure the language.csv file is closed.)
The image below shows the format and an example of the hypothetical language file. It has English,
German and Spanish. The letter „G‟ is added in front of the text for German and „S‟ is added for
Spanish. Selecting either German or Spanish from the Setup-Language menu will replace the English
text with the corresponding German or Spanish text. The edited file must reside in the program
directory.

It is the policy of OMEGA to comply with all worldwide safety and EMC/EMI regulations that apply. OMEGA is constantly pursuing certification of its products to theEuropean New Approach Directives. OMEGA will add the CE mark to every appropriate device upon certification.The information contained in this document is believed to be correct, but OMEGA Engineering, Inc. accepts no liability for any errors it contains, and reserves the right to alter specifications withoutnotice. WARNING: These products are not designed for use in, and should not be used for, human applications.
WARRANTY/DISCLAIMEROMEGA ENGINEERING, INC. warrants this unit to be free of defects in materials and workmanship for a period of 13 months from date of purchase.OMEGA’s WARRANTY adds an additional one (1) month grace period to the normal one (1) year product warranty to cover handling andshipping time. This ensures that OMEGA’s customers receive maximum coverage on each product.
If the unit malfunctions, it must be returned to the factory for evaluation. OMEGA’s Customer Service Department will issue an Authorized Return (AR)number immediately upon phone or written request. Upon examination by OMEGA, if the unit is found to be defective, it will be repaired or replacedat no charge. OMEGA’s WARRANTY does not apply to defects resulting from any action of the purchaser, including but not limited to mishandling,improper interfacing, operation outside of design limits, improper repair, or unauthorized modification. This WARRANTY is VOID if the unit showsevidence of having been tampered with or shows evidence of having been damaged as a result of excessive corrosion; or current, heat, moisture orvibration; improper specification; misapplication; misuse or other operating conditions outside of OMEGA’s control. Components which wear are notwarranted, including but not limited to contact points, fuses, and triacs.
OMEGA is pleased to offer suggestions on the use of its various products. However, OMEGA neither assumes responsibility for anyomissions or errors nor assumes liability for any damages that result from the use of its products in accordance with information providedby OMEGA, either verbal or written. OMEGA warrants only that the parts manufactured by it will be as specified and free of defects.OMEGA MAKES NO OTHER WARRANTIES OR REPRESENTATIONS OF ANY KIND WHATSOEVER, EXPRESS OR IMPLIED, EXCEPT THAT OFTITLE, AND ALL IMPLIED WARRANTIES INCLUDING ANY WARRANTY OF MERCHANTABILITY AND FITNESS FOR A PARTICULAR PURPOSEARE HEREBY DISCLAIMED. LIMITATION OF LIABILITY: The remedies of purchaser set forth herein are exclusive, and the total liability ofOMEGA with respect to this order, whether based on contract, warranty, negligence, indemnification, strict liability or otherwise, shall notexceed the purchase price of the component upon which liability is based. In no event shall OMEGA be liable for consequential, incidental orspecial damages.
CONDITIONS: Equipment sold by OMEGA is not intended to be used, nor shall it be used: (1) as a “Basic Component” under 10 CFR 21 (NRC), used inor with any nuclear installation or activity; or (2) in medical applications or used on humans. Should any Product(s) be used in or with any nuclearinstallation or activity, medical application, used on humans, or misused in any way, OMEGA assumes no responsibility as set forth in our basicWARRANTY/ DISCLAIMER language, and, additionally, purchaser will indemnify OMEGA and hold OMEGA harmless from any liability or damagewhatsoever arising out of the use of the Product(s) in such a manner.
Servicing North America:USA: One Omega Drive, Box 4047ISO 9001 Certified Stamford CT 06907-0047
Tel: (203) 359-1660 FAX: (203) 359-7700e-mail: [email protected]
Canada: 976 BergarLaval (Quebec) H7L 5A1, CanadaTel: (514) 856-6928 FAX: (514) 856-6886e-mail: [email protected]
For immediate technical or application assistance:USA and Canada: Sales Service: 1-800-826-6342 / 1-800-TC-OMEGA®
Customer Service: 1-800-622-2378 / 1-800-622-BEST®
Engineering Service: 1-800-872-9436 / 1-800-USA-WHEN®
TELEX: 996404 EASYLINK: 62968934 CABLE: OMEGA
Mexico: En Espanol: (001) 203-359-7803 e-mail:[email protected]: (001) 203-359-7807 [email protected]
OMEGAnet® Online Service Internet e-mailwww.omega.com [email protected]
Servicing Europe:Benelux: Postbus 8034, 1180 LA Amstelveen, The Netherlands
Tel: +31 (0)20 3472121 FAX: +31 (0)20 6434643Toll Free in Benelux: 0800 0993344e-mail: [email protected]
Czech Republic: Frystatska 184, 733 01 Karviná, Czech RepublicTel: +420 (0)59 6311899 FAX: +420 (0)59 6311114Toll Free: 0800-1-66342 e-mail: [email protected]
France: 11, rue Jacques Cartier, 78280 Guyancourt, FranceTel: +33 (0)1 61 37 2900 FAX: +33 (0)1 30 57 5427Toll Free in France: 0800 466 342e-mail: [email protected]
Germany/Austria: Daimlerstrasse 26, D-75392 Deckenpfronn, GermanyTel: +49 (0)7056 9398-0 FAX: +49 (0)7056 9398-29Toll Free in Germany: 0800 639 7678e-mail: [email protected]
United Kingdom: One Omega Drive, River Bend Technology CentreISO 9002 Certified Northbank, Irlam, Manchester
M44 5BD United Kingdom Tel: +44 (0)161 777 6611 FAX: +44 (0)161 777 6622Toll Free in United Kingdom: 0800-488-488e-mail: [email protected]
M-4699/0908
RETURN REQUESTS / INQUIRIESDirect all warranty and repair requests/inquiries to the OMEGA Customer Service Department. BEFORE RETURNING ANY PRODUCT(S) TOOMEGA, PURCHASER MUST OBTAIN AN AUTHORIZED RETURN (AR) NUMBER FROM OMEGA’S CUSTOMER SERVICE DEPARTMENT (IN ORDERTO AVOID PROCESSING DELAYS). The assigned AR number should then be marked on the outside of the return package and on anycorrespondence.The purchaser is responsible for shipping charges, freight, insurance and proper packaging to prevent breakage in transit.PATENT NOTICE: U. S. Pat. No. 6,074,089; 5,465,838 / Canada 2,228,333; 2,116,055 / UK GB 2,321,712 / Holland 1008153 / Israel 123052 / France 2 762 908 / EPO 0614194. Other patents pending.
FOR WARRANTY RETURNS, please have the following informationavailable BEFORE contacting OMEGA:1. Purchase Order number under which the product was PURCHASED,2. Model and serial number of the product under warranty, and3. Repair instructions and/or specific problems relative to the product.
FOR NON-WARRANTY REPAIRS, consult OMEGA for current repair charges.Have the following information available BEFORE contacting OMEGA:1. Purchase Order number to cover the COST of the repair,2. Model and serial number of the product, and3. Repair instructions and/or specific problems relative to the product.
OMEGA’s policy is to make running changes, not model changes, whenever an improvement is possible. This affords our customers the latest in technology andengineering.OMEGA is a registered trademark of OMEGA ENGINEERING, INC.© Copyright 2004 OMEGA ENGINEERING, INC. All rights reserved. This document may not be copied, photocopied, reproduced, translated, or reduced to any electronicmedium or machine-readable form, in whole or in part, without the prior written consent of OMEGA ENGINEERING, INC.