examining the relationship
TRANSCRIPT
A R T I C L E S
Examining the RelationshipBetween Learning OrganizationCharacteristics and ChangeAdaptation, Innovation, andOrganizational Performance
Constantine Kontoghiorghes, Susan M. Awbrey,Pamela L. Feurig
The main purpose of this exploratory study was to examine the relationshipbetween certain learning organization characteristics and change adaptation,innovation, and bottom-line organizational performance. The following learn-ing organization characteristics were found to be the strongest predictors ofrapid change adaptation, quick product or service introduction, and bottom-line organizational performance: open communications and informationsharing; risk taking and new idea promotion; and information, facts, time, andresource availability to perform one’s job in a professional manner.
Organizational leaders and theorists increasingly view learning as a key ele-ment in developing and maintaining competitive advantage (Armstrong &Foley, 2003; Baldwin, Danielson, & Wiggenhorn, 1997; DeGeus, 1988;Goh & Richards, 1997; Liedtka, 1996; Nonaka, 1991; Porth, McCall, &Bausch, 1999; Schein, 1993; Senge, 1990a; Slater & Narver, 1995; Stata,1989). Although organizational learning has been studied for decades(Argyris & Schön, 1978, 1996), a new emphasis on learning has arisen dueto rapid changes in the business climate, including uncertain market condi-tions, increasing complexity, changing demographics, and global competition(Altman & Iles, 1998; Peters, 1987; Probst & Buchel, 1997; Swain, 1999).The view that learning increases competitive advantage has stimulated inter-est in developing organizations that foster and promote learning. Learningorganizations are designed to increase competitiveness through generativelearning that is forward looking and reduces the major shocks of change,through close relationships with customers and other key constituents that
185HUMAN RESOURCE DEVELOPMENT QUARTERLY, vol. 16, no. 2, Summer 2005Copyright © 2005 Wiley Periodicals, Inc.
186 Kontoghiorghes, Awbrey, Feurig
allow for mutual adjustment, and through the ability to quickly reconfigureand reallocate resources based on environmental change (Slater & Narver,1995).
Recently, there has been a call to redefine the role of human resources inways that increase its strategic impact on organizational competitiveness andsuccess (Griego, Geroy, & Wright, 2000; Ulrich, 1997a, 1997b, 1999). Humanresource development (HRD) professionals are being asked to take a leader-ship role in transforming organizations in ways that foster and promote learn-ing. Creating a learning company requires an understanding of the learningorganization concept and its relationship to desired organizational outcomes.
Review of the Literature
We begin by examining the literature.Distinguishing Between Organizational Learning and Learning Organi-
zations. The terms organizational learning and learning organization have beenused interchangeably in the past (Ortenblad, 2001). As a result, confusion hasattended the use of these terms (Burgoyne, 1999; Kiechel, 1990). However,attempts have been made to clarify and distinguish the two concepts (Argyris,1999; Argyris & Schön, 1996; DiBella, 1995; Easterby-Smith & Araujo, 1999;Finger & Brand, 1999; Griego et al., 2000; Marquardt, 1996; Marsick &Watkins, 1994; West & Burnes, 2000; Yang, Watkins, & Marsick, 2004; Tsang,1997). Three normative distinctions between organizational learning and thelearning organization have been identified in the literature (Ortenblad, 2001).First, organizational learning is viewed as a process or set of activities, whereasthe learning organization is seen as a form of organization (Tsang, 1997). Sec-ond, some authors hold the view that learning takes place naturally in organi-zations, whereas it requires effort to develop a learning organization (Dodgson,1993). Third, the literature on organizational learning emerged from academicinquiry, while the literature on the learning organization developed primarilyfrom practice (Easterby-Smith, 1997). Finally, Ortenbald (2001) suggests thattwo additional factors should be added to the list to help differentiate the twoconcepts: distinctions based on who learns (Cook & Yanow, 1993; Jones,1995; Kim, 1993) and on the location of the knowledge (Blackler, 1995). Inorganizational learning, the focus is on individual learners, whereas in thelearning organization, it is on learners at the individual, group, and organiza-tional levels. In organizational learning, knowledge is viewed as residing inindividuals, while it is viewed as residing in individuals and in the organiza-tional memory in learning organizations.
Theoretical Influences. Based on their review of the literature, Altman andIles (1998) describe four theoretical streams of influence that have helped toshape the concept of the learning organization. The first is strategic manage-ment. Strategic management changed the focus from the external environmentto viewing internal resources, such as human potential and core competencies,

as key sources of competitive advantage (Barnes, 1991; Gagnon, 1999;Grant, 1991; Hamel & Prahalad, 1994). A second theoretical influence issystems theory, which supports the view that organizations are dynamic, opensystems (Ackoff, 1981; Forrester, 1968; Senge, 1990a). Psychological learn-ing theory, including the concept of learning levels (Argyris & Schön, 1978,1996; Swieringa & Wierdsma, 1992), is a third source of influence. Thestudy of organizational context, including the impact of structure and cultureon learning, emerged from organizational sociology as a fourth theoreticalinfluence.
Defining the Learning Organization. Since the term learning organizationwas popularized by Peter Senge in 1990, definitions have proliferated in theliterature (Calvert, Mobley, & Marshall, 1994; Campbell & Cairns, 1994;Coopey, 1995; Daft & Marcic, 1998; Jashapara, 1993; Loermans, 2002; McGill,Slocum, & Lei, 1993; Sankar, 2003). Three definitions that stress the powerof learning to transform vision into action are repeatedly cited:
[A learning organization] facilitates the learning of all its members andcontinuously transforms itself [Pedler, Burgoyne, & Boydell, 1991, p. 1].
[A learning organization is] where people continually expand their capacityto create results they truly desire, where new and expansive patterns ofthinking are nurtured, where collective aspiration is set free, and wherepeople are continually learning how to learn together [Senge, 1990a, p. 3].
[A learning organization is] skilled at creating, acquiring and transferringknowledge, and at modifying its behavior to reflect new knowledge andinsights [Garvin, 1993, p. 80].
Nevertheless, reviews of the literature reveal a lack of clarity regarding thelearning organization concept. Ortenblad (2002) notes that only a few authors(Argyris, 1999; DiBella, 1995; Easterby-Smith & Araujo, 1999) have attemptedto create learning organization typologies. In his survey of the literature andpractitioner beliefs, Ortenblad (2002) identified four perspectives used tounderstand what a learning organizations is—that is, its ontology: organiza-tional learning, learning at work, learning climate, and learning structure. Healso identifies some examples of mixed understandings that take a more holis-tic view and involve more than one of the perspectives (Pedler, Burgoyne, &Boydell, 1991; Watkins & Marsick, 1993). Moilanen (2001) also notes themore holistic perspective evident in the work of Mayo and Lank (1994) andof Senge (1990a, 1990b).
DiBella (1995) identified three orientations in the literature that relate tohow learning organizations can be achieved. The first is the normativeorientation that views learning as happening only under certain conditions. Inthis orientation, a learning organization is determined by an internal set of
Learning Organizations, Change, Innovation, and Performance 187
188 Kontoghiorghes, Awbrey, Feurig
conditions that ensure learning and are intentionally pursued. The secondorientation is developmental. It views learning organizations as developing andevolving over time. DiBella also identified a third orientation, capability, whichviews all learning styles as legitimate and does not prescribe learning organi-zation characteristics. It views learning as embedded in the culture andstructure of the organization.
Various models of learning organizations have developed based on thetheoretical roots and perspectives held by different authors. Altman and Iles(1998) identify two models that are prevalent in the literature. The character-istics model of the learning organization identifies the essential attributes orcharacteristics of a learning organization (Beckhard & Pritchard, 1992; McGillet al., 1993; Pedler et al., 1991). The phase or stage model views the develop-ment of a learning organization as an evolving process (Garvin cited inAppelbaum & Goransson 1997; Jones & Hendry, 1992, 1994; Torbert, 1994).These models support the orientations that DiBella identified.
The study reported here takes a holistic theoretical view that draws on thelearning concepts of Argyris and Schön (1978, 1996) and views structure andculture as important dimensions of a learning organization (Senge, 1990a). Itemploys a characteristics model (Altman & Iles, 1998) of the learning organi-zation and incorporates learning organization characteristics that are associ-ated with the dimensions of structure and culture.
Learning Organization Characteristics
Many studies of learning organizations have attempted to diagnose the char-acteristics of learning organization (Armstrong & Foley, 2003; Goh, 1998;Griego, Geroy, & Wright, 2000; Pedler et al., 1991; Phillips, 2003; Rowden,2001; Slater & Narver, 1995). Although different authors stress differentelements, the characteristics of the learning organization incorporated in thisstudy have been proposed as important features by several authors:
• Open communications (Appelbaum & Reichart, 1998; Gardiner & Whiting,1997; Phillips, 2003; Pool, 2000)
• Risk taking (Appelbaum & Reichart, 1998; Goh, 1998; Richardson, 1995;Rowden, 2001)
• Support and recognition for learning (Bennett & O’Brien, 1994; Griegoet al., 2000; Wilkinson & Kleiner, 1993)
• Resources to perform the job (Pedler et al., 1991)• Teams (Appelbaum & Goransson, 1997; Anderson, 1997; Goh, 1998;
Salner, 1999; Strachan, 1996; Senge 1990a)• Rewards for learning (Griego et al., 2000; Lippitt, 1997; Phillips, 2003)• Training and learning environment (Gephart, Marsick, Van Buren, & Spiro,
1996; Goh, 1998; Robinson, Clemson, & Keating, 1997)• Knowledge management (Loermans, 2002; Selen, 2000)
Instruments have been developed to identify the characteristics that canbe used to diagnose whether an organization is, or is becoming, a learningorganization and to study learning organizations along different dimensions(Goh & Richards, 1997; O’Brien, 1994; Phillips, 2003; Marquardt, 1996;Marsick & Watkins, 1999; Mayo & Lank, 1994; Pedler et al., 1991; Pedler,Boydell, & Burgoyne, 1988; Tannenbaum, 1997). Nevertheless, there are stillrelatively few tools that have received adequate scientific testing for reliabilityand validity (Moilanen, 2001; Nonaka, Byosiere, Borucki, & Konno, 1994).
The Relationship of Characteristicsand Organizational Outcomes
Some authors believe that adaptation to change is insufficient to maintain orga-nizational competitiveness. They stress generative learning that leads to inno-vation as a defining characteristic of the learning organization (Gardiner &Whiting, 1997; McGill et al., 1993; Senge, 1990a), and they view innovationas an important outcome and benefit of the learning organization (Porth et al.,1999; Teare & Dealty, 1998). Others argue that both outcomes, adaptation aswell as innovation, are needed for organizations to succeed (Appelbaum &Reichart, 1998; Fiol & Lyles, 1985; Armstrong & Foley, 2003). Regardless ofwhich outcomes are deemed most important, there is little empirical evidencein the literature that shows how the characteristics of learning organizationsaffect organizational outcomes ( Jashapara, 2003). Some authors have begunto address this lack of evidence. For example, Ellinger, Ellinger, Yang, andHowton (2002) and Jashapara (2003) found positive relationships betweenlearning organization characteristics and organizational performance. Thestudy examined here is designed to add to the base of empirical evidenceregarding the relationship between learning organization characteristics andorganizational outcomes.
Purpose of the Study
Several authors cite gaps in the research on learning organizations: lack ofsound conceptualization (Heraty & Morley, 1995), lack of empirical basis forinfluential models (Altman & Iles, 1998), overall lack of empirical research(Boyle, 2002; Jashapara, 2003; Thomsen & Hoest, 2001; Tsang, 1997), andreliance on anecdotal evidence of success and the overuse of nonrigorous casestudies (Easterby-Smith, 1997).
Given these limitations of learning organization research, the main pur-pose of this study is to address the gap in empirical research by examining therelationship between learning organization characteristics (open communica-tions, risk taking, support and recognition for learning, resources to performthe job, teams, rewards for learning, training and learning environment,and knowledge management) and the organizational outcomes of changeadaptation, innovation, and bottom-line performance. Change adaptation is
Learning Organizations, Change, Innovation, and Performance 189
190 Kontoghiorghes, Awbrey, Feurig
defined in terms of the extent to which the organization can adapt to changesrapidly. Innovation is defined as the extent to which the organization canintroduce new products or services quickly and easily. Organizational perfor-mance is defined in terms of quality, productivity, profitability, organizationalcompetitiveness, and employee commitment indicators.
Research Questions
The study seeks to answer the following research questions:
• To what extent are the identified learning organization characteristicsassociated with rapid change adaptation?
• To what extent are the identified learning organization characteristicsassociated with the innovation indicator of quick product or serviceintroduction?
• To what extent are the identified learning organization characteristicsassociated with bottom-line organizational performance?
Research Method
Although the study uses a standard quantitative survey research design(Alreck & Settle, 1995), we are aware that the positivist paradigm has beencriticized by adherents of action science (Argyris & Schön, 1989; Argyris,Putnam, & Smith, 1985). Therefore, an internal and external research teamwas employed to create a more open relationship between researchers andthose researched, and the research goals included both the discovery of newknowledge and the improvement of the organizations studied.
Sample. This study involved the participation of four different organiza-tions in the service and manufacturing industries, and data collection occurredat the individual level. More specifically, the prospective participants of thisstudy consisted of the entire population of the information technology divi-sion of a large auto manufacturer (300 employees) as well as the case man-agement division of a health care insurance organization (256 employees).Furthermore, this study involved the participation of the entire workforceof two manufacturing facilities of two different organizations (189 and60 employees, respectively) in the auto parts industry.
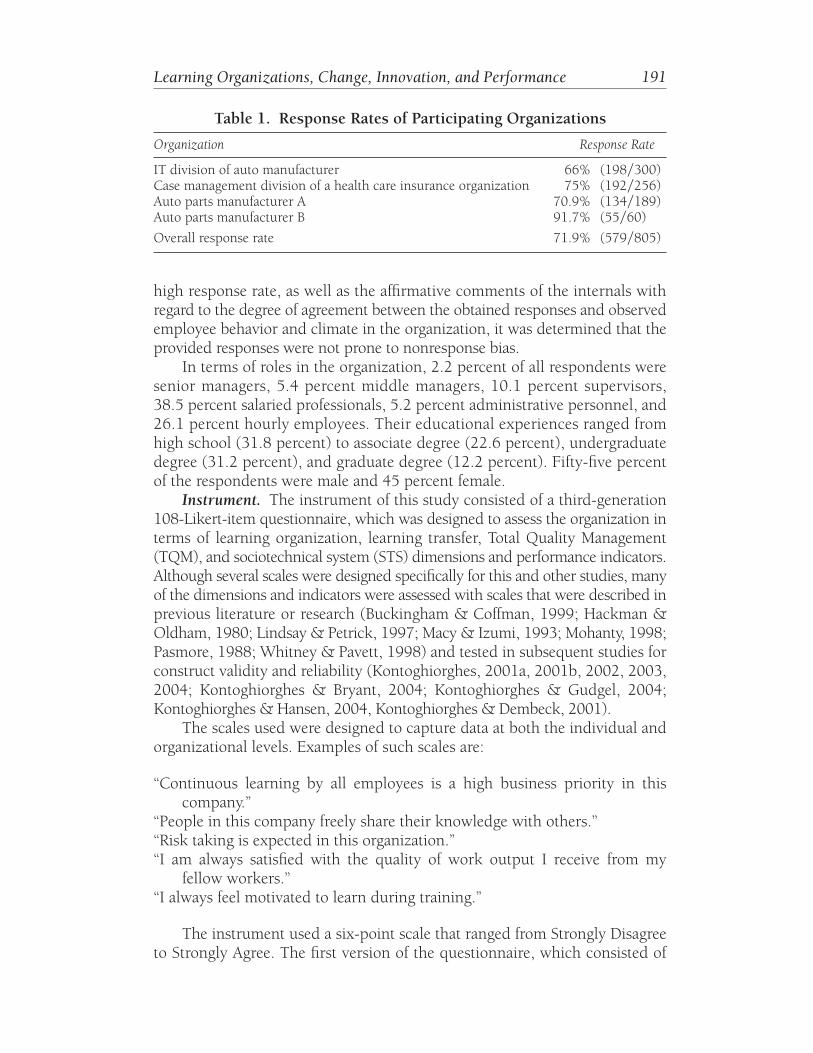
To increase the likelihood of a high response rate, the anonymous surveyswere administered internally by the corresponding human resource (HR) ororganizational development (OD) manager of the organization, who assured theemployees of complete confidentiality. Moreover, three of the four organizationsoffered their employees the opportunity to win a monetary reward, which rangedfrom $50 to $100, for participation. The incentive was distributed after a ran-dom drawing of completed raffle tickets, which the participants provided onreturning their survey. The response rate reflecting each organization is depictedin Table 1. Table 1 also includes the overall response, 71.9 percent. Given the
high response rate, as well as the affirmative comments of the internals withregard to the degree of agreement between the obtained responses and observedemployee behavior and climate in the organization, it was determined that theprovided responses were not prone to nonresponse bias.
In terms of roles in the organization, 2.2 percent of all respondents weresenior managers, 5.4 percent middle managers, 10.1 percent supervisors,38.5 percent salaried professionals, 5.2 percent administrative personnel, and26.1 percent hourly employees. Their educational experiences ranged fromhigh school (31.8 percent) to associate degree (22.6 percent), undergraduatedegree (31.2 percent), and graduate degree (12.2 percent). Fifty-five percentof the respondents were male and 45 percent female.
Instrument. The instrument of this study consisted of a third-generation108-Likert-item questionnaire, which was designed to assess the organization interms of learning organization, learning transfer, Total Quality Management(TQM), and sociotechnical system (STS) dimensions and performance indicators.Although several scales were designed specifically for this and other studies, manyof the dimensions and indicators were assessed with scales that were described inprevious literature or research (Buckingham & Coffman, 1999; Hackman &Oldham, 1980; Lindsay & Petrick, 1997; Macy & Izumi, 1993; Mohanty, 1998;Pasmore, 1988; Whitney & Pavett, 1998) and tested in subsequent studies forconstruct validity and reliability (Kontoghiorghes, 2001a, 2001b, 2002, 2003,2004; Kontoghiorghes & Bryant, 2004; Kontoghiorghes & Gudgel, 2004;Kontoghiorghes & Hansen, 2004, Kontoghiorghes & Dembeck, 2001).
The scales used were designed to capture data at both the individual andorganizational levels. Examples of such scales are:
“Continuous learning by all employees is a high business priority in thiscompany.”
“People in this company freely share their knowledge with others.”“Risk taking is expected in this organization.”“I am always satisfied with the quality of work output I receive from my
fellow workers.”“I always feel motivated to learn during training.”
The instrument used a six-point scale that ranged from Strongly Disagreeto Strongly Agree. The first version of the questionnaire, which consisted of
Learning Organizations, Change, Innovation, and Performance 191
Table 1. Response Rates of Participating Organizations
Organization Response Rate
IT division of auto manufacturer 66% (198�300)Case management division of a health care insurance organization 75% (192�256)Auto parts manufacturer A 70.9% (134�189)Auto parts manufacturer B 91.7% (55�60)
Overall response rate 71.9% (579�805)
192 Kontoghiorghes, Awbrey, Feurig
99 Likert items, was originally pilot-tested on a group of fifteen participants forclarity. Furthermore, a group of seven experts who held a doctorate or were can-didates for a doctorate in the OD, human HRD, or quality management areasreviewed the instrument for content validity. These experts were either well-known scholars or experienced consultants in the HRD field. On revision, theinstrument was administered to a group of 129 members of four different orga-nizations. Reliability tests were conducted, and the instrument was furtherrefined and expanded. In particular, items with low reliabilities and low factorloadings in relation to their corresponding constructs were replaced. The thresh-old used for factor loadings was 0.40. In its final format, the instrument con-sisted of 108 Likert items. The overall reliability of the instrument was measuredin terms of coefficient alpha and was found to be 0.98. In all, the questionnaireattempts to determine the extent to which the organization is functioning as ahigh-performance system and according to learning organization, TQM, and STStheory and principles. Again, only items pertaining to the earlier describedlearning organization dimensions are analyzed in this study.
Data Analysis. After the data from the participants were collected, theresearch questions of this study were answered through the use of a principalcomponents analysis (PCA) in conjunction with multiple regression and cor-relational analyses. More specifically, the PCA that used a varimax rotation wasused to determine if the instrument was measuring the dimensions itwas designed to measure and therefore empirically construct validate the learn-ing organization dimensions investigated by the study. Although common fac-tor analysis and PCA “often yield similar results” (Stevens, 1986, p. 338), anadvantage of PCA is that the produced components are orthogonal and thusuncorrelated. Hence, by relying on principal components instead of commonfactors, the problem of multicollinearity is eliminated when building multipleregression models (Stevens, 1986). For this study, the criterion used in orderto determine how many components to retain is that of Kaiser (only compo-nents whose eigenvalues are greater than 1 are retained). Finally, the internalhomogeneity of each factor was determined by calculating coefficient alpha. Ifcoefficient alpha was found to be above 0.70, the factor was deemed reliableand exhibiting internal consistency at an acceptable level.
In terms of regression analysis, stepwise regression was the selectionmethod used when building the regression models for the dependent variablesof rapid change adaptation and quick product or service introduction. Briefly,in stepwise regression, the first predictor entered into the model is the onethat has the highest zero-order correlation with the dependent variable. Thenext predictor selected by the regression equation is the one that has the largestsemipartial correlation with the dependent variable and thus producesthe greatest increment to the multiple correlation R2. The third predictorentered into the model is the one that has the highest semipartial correlationwith the dependent variable after partialing out the first two variables alreadyin the model. This process continues until a predictor that makes no signifi-cant contribution to the regression model is found, and the selection procedure
is therefore terminated. It is important to note that at every step of the selec-tion process, tests are performed to determine the usefulness of each predic-tor already in the model. Predictors that are found to no longer make asignificant contribution toward prediction are removed from the model. Forthis study, the F-to-enter and F-to-remove values used were 0.05 and 0.01,respectively. It should be noted that stepwise regression is particularly usefulin exploratory studies, especially when the researcher has no precon-ceived ideas with regard to the importance or predictive utility of each pre-dictor. The importance of each predictor is derived through a mathematicalmaximization procedure, which precludes any researcher bias.
As far as the last research question is concerned, which attempts to describethe extent to which identified learning organization characteristics are associatedwith bottom-line organizational performance, given the high number of perfor-mance measures investigated, this was answered through a correlational analy-sis. The analysis provided a brief synopsis of the type of association between theinvestigated learning organization factors and performance indicators.
Results and Findings
The results of the statistical analyses are depicted in Tables 2 through 9.Principal Component Analysis. The results of the PCA as well as the
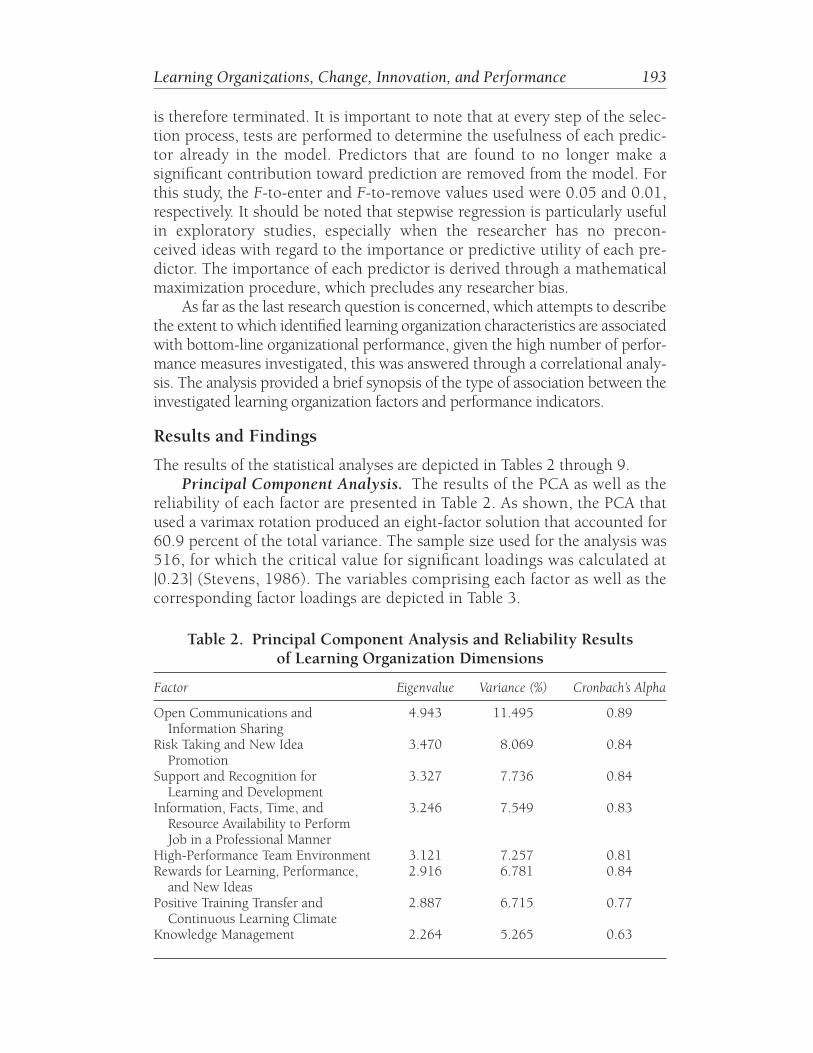
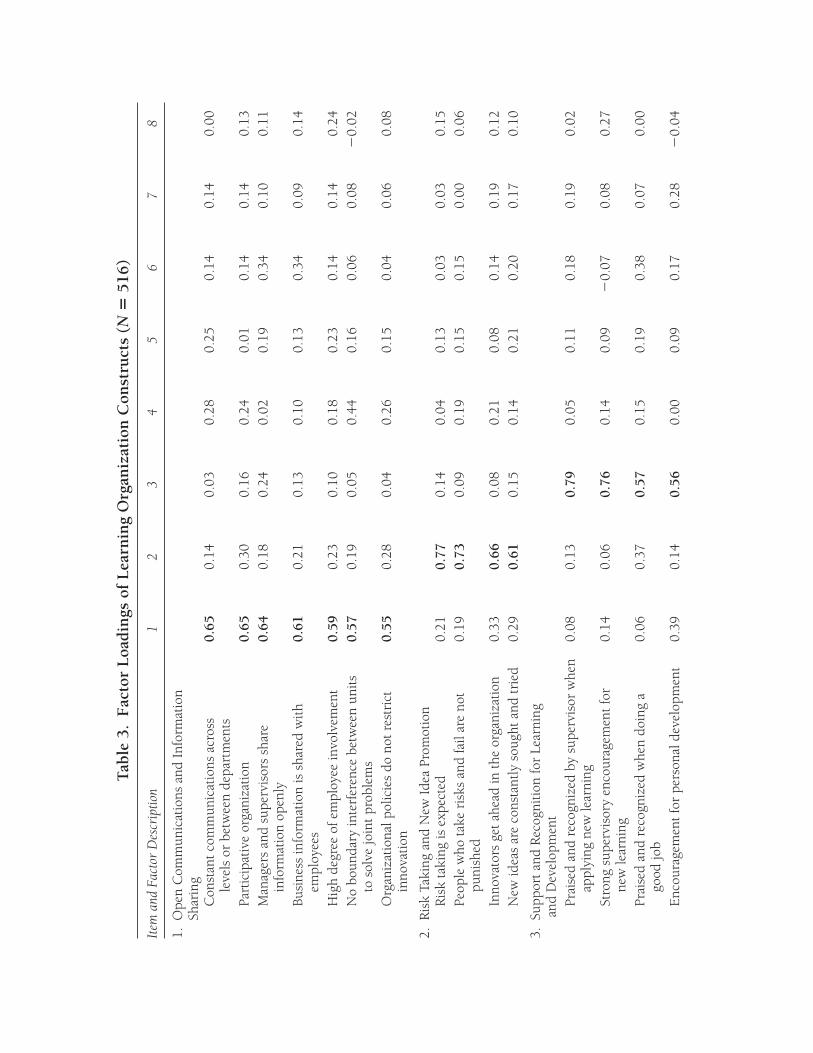
reliability of each factor are presented in Table 2. As shown, the PCA thatused a varimax rotation produced an eight-factor solution that accounted for60.9 percent of the total variance. The sample size used for the analysis was516, for which the critical value for significant loadings was calculated at|0.23| (Stevens, 1986). The variables comprising each factor as well as thecorresponding factor loadings are depicted in Table 3.
Learning Organizations, Change, Innovation, and Performance 193
Table 2. Principal Component Analysis and Reliability Resultsof Learning Organization Dimensions
Factor Eigenvalue Variance (%) Cronbach’s Alpha
Open Communications and 4.943 11.495 0.89Information Sharing
Risk Taking and New Idea 3.470 8.069 0.84Promotion
Support and Recognition for 3.327 7.736 0.84Learning and Development
Information, Facts, Time, and 3.246 7.549 0.83Resource Availability to PerformJob in a Professional Manner
High-Performance Team Environment 3.121 7.257 0.81Rewards for Learning, Performance, 2.916 6.781 0.84
and New IdeasPositive Training Transfer and 2.887 6.715 0.77
Continuous Learning ClimateKnowledge Management 2.264 5.265 0.63
Tab
le 3
.F
acto
r L
oad
ings
of
Lea
rnin
g O
rgan
izat
ion
Con
stru
cts
(N�
516)
Item
and
Fac
tor
Des
crip
tion
12
34
56
78
1.O
pen
Com
mun
icat
ions
and
Inf
orm
atio
nSh
arin
gC
onst
ant
com
mun
icat
ions
acr
oss
0.65
0.14
0.03
0.28
0.25
0.14
0.14
0.00
leve
ls o
r be
twee
n de
part
men
tsPa
rtic
ipat
ive
orga
niza
tion
0.65
0.30
0.16
0.24
0.01
0.14
0.14
0.13
Man
ager
s an
d su
perv
isor
s sh
are
0.64
0.18
0.24
0.02
0.19
0.34
0.10
0.11
info
rmat
ion
open
lyBu
sine
ss in
form
atio
n is
sha
red
wit
h 0.
610.
210.
130.
100.
130.
340.
090.
14em
ploy
ees
Hig
h de
gree
of e
mpl
oyee
invo
lvem
ent
0.59
0.23
0.10
0.18
0.23
0.14
0.14
0.24
No
boun
dary
inte
rfer
ence
bet
wee
n un
its
0.57
0.19
0.05
0.44
0.16
0.06
0.08
�0.
02to
sol
ve jo
int
prob
lem
sO
rgan
izat
iona
l pol
icie
s do
not
res
tric
t0.
550.
280.
040.
260.
150.
040.
060.
08in
nova
tion
2.R
isk
Taki
ng a
nd N
ew I
dea
Prom
otio
nR
isk
taki
ng is
exp
ecte
d0.
210.
770.
140.
040.
130.
030.
030.
15Pe
ople
who
tak
e ri
sks
and
fail
are
not
0.19
0.73
0.09
0.19
0.15
0.15
0.00
0.06
puni
shed
Inno
vato
rs g
et a
head
in t
he o
rgan
izat
ion
0.33
0.66
0.08
0.21
0.08
0.14
0.19
0.12
New
idea
s ar
e co
nsta
ntly
sou
ght
and
trie
d0.
290.
610.
150.
140.
210.
200.
170.
10
3.Su
ppor
t an
d R
ecog
niti
on fo
r Le
arni
ngan
d D
evel
opm
ent
Prai
sed
and
reco
gniz
ed b
y su
perv
isor
whe
n0.
080.
130.
790.
050.
110.
180.
190.
02ap
plyi
ng n
ew le
arni
ngSt
rong
sup
ervi
sory
enc
oura
gem
ent
for
0.14
0.06
0.76
0.14
0.09
�0.
070.
080.
27ne
w le
arni
ngPr
aise
d an
d re
cogn
ized
whe
n do
ing
a 0.
060.
370.
570.
150.
190.
380.
070.
00go
od jo
bE
ncou
rage
men
t fo
r pe
rson
al d
evel
opm
ent
0.39
0.14
0.56
0.00
0.09
0.17
0.28
�0.
04
Supe
rvis
or e
xpec
ts a
pplic
atio
n of
new
0.
080.
090.
530.
040.
05�
0.16
0.51
0.19
lear
ning
Hav
e le
arni
ng a
nd g
row
th o
ppor
tuni
ties
0.27
0.07
0.44
0.09
0.17
0.19
0.16
0.34
Prai
sed
and
reco
gniz
ed b
y co
wor
kers
�
0.02
�0.
040.
400.
070.
380.
260.
280.
05w
hen
appl
ying
new
lear
ning
4.In
form
atio
n, F
acts
, Tim
e, a
nd R
esou
rce
Avai
labi
lity
to P
erfo
rm J
ob in
aPr
ofes
sion
al M
anne
rH
ave
mat
eria
ls a
nd e
quip
men
t to
do
0.21
0.12
0.15
0.78
0.13
0.06
0.08
0.10
wor
k ri
ght
Hav
e fa
cts
and
info
rmat
ion
need
ed t
o do
0.
220.
180.
180.
730.
090.
120.
110.
18a
good
job
Hav
e am
ple
tim
e to
per
form
job
in a
0.21
0.07
0.00
0.67
0.09
0.33
0.11
0.09
prof
essi
onal
man
ner
Peop
le m
eet
each
oth
er’s
need
s0.
270.
38�
0.04
0.50
0.27
0.14
0.26
�0.
01
5.H
igh-
Perf
orm
ance
Tea
m E
nvir
onm
ent
Peop
le a
re w
illin
g to
hel
p th
e or
gani
zati
on0.
190.
22�
0.01
0.02
0.73
0.11
0.07
0.13
succ
eed
Peop
le h
elp
one
anot
her
wit
hout
bei
ng0.
370.
130.
180.
100.
720.
05�
0.06
0.00
told
to
do s
oC
owor
kers
com
mit
ted
to q
ualit
y w
ork
�0.
040.
100.
140.
280.
590.
190.
230.
08Te
am m
embe
rs a
re c
omm
itte
d to
one
0.42
0.17
0.24
0.17
0.55
0.21
0.06
0.06
anot
her’s
suc
cess
Mem
ber
of a
sel
f-di
rect
ed w
ork
team
0.29
0.09
0.17
0.09
0.47
�0.
150.
160.
12Pe
ople
free
ly s
hare
the
ir k
now
ledg
e0.
420.
130.
100.
150.
450.
100.
030.
20w
ith
othe
rs
6.R
ewar
ds fo
r Le
arni
ng, P
erfo
rman
ce,
and
New
Ide
asR
ecei
ve e
xtri
nsic
rew
ards
whe
n ap
plyi
ng0.
430.
070.
110.
080.
070.
670.
220.
10ne
w le
arni
ng
(Con
tinue
d)
Tab
le 3
.F
acto
r L
oad
ings
of
Lea
rnin
g O
rgan
izat
ion
Con
stru
cts
(N�
516)
(C
onti
nued
)
Item
and
Fac
tor
Des
crip
tion
12
34
56
78
Rec
eive
fair
pay
for
the
wor
k I
do0.
070.
13�
0.01
0.38
0.14
0.59
�0.
160.
21Le
arni
ng is
wel
l rew
arde
d0.
480.
150.
160.
120.
110.
590.
340.
08O
utst
andi
ng p
erfo
rman
ce is
qui
ckly
0.29
0.31
0.26
0.23
0.12
0.52
0.08
0.04
reco
gniz
edN
ew id
eas
are
rew
arde
d0.
330.
370.
150.
170.
100.
510.
130.
00
7.Po
siti
ve T
rain
ing
Tran
sfer
and
Con
tinu
ous
Lear
ning
Clim
ate
Hel
d ac
coun
tabl
e fo
r tr
aini
ng r
ecei
ved
0.19
0.14
0.12
0.02
0.00
0.04
0.72
�0.
04Fe
el m
otiv
ated
to
lear
n du
ring
tra
inin
g0.
02�
0.04
0.19
0.14
0.25
0.14
0.61
0.21
Trai
ning
rec
eive
d is
sim
ilar
to p
erfo
rmed
0.
110.
060.
220.
110.
070.
150.
490.
36ta
sks
Con
tinu
ous
lear
ning
is a
hig
h bu
sine
ss
0.33
0.20
0.19
0.20
0.00
0.14
0.49
0.22
prio
rity
Feel
mot
ivat
ed t
o tr
ansf
er le
arni
ng b
ack
0.03
0.05
0.33
0.09
0.19
�0.
040.
430.
34to
the
job
Em
ploy
ees
com
mit
ted
to c
onti
nuou
s0.
240.
340.
000.
350.
250.
270.
420.
08le
arni
ng
8.K
now
ledg
e M
anag
emen
tE
ncou
rage
d an
d ex
pect
ed t
o m
anag
e0.
130.
220.
160.
00�
0.01
0.07
0.04
0.70
own
lear
ning
Hav
e al
l nec
essa
ry s
kills
and
kno
wle
dge
�0.
01�
0.10
�0.
010.
160.
220.
010.
220.
60to
per
form
job
IT u
se t
o ca
ptur
e an
d di
stri
bute
kno
wle
dge
0.19
0.30
0.10
0.14
0.06
0.26
0.17
0.54
Hav
e in
fluen
ce o
ver
my
wor
k0.
260.
140.
210.
370.
16�
0.03
0.03
0.41
Not
e:Bo
ld t
ype
indi
cate
s an
item
was
incl
uded
in t
he c
orre
spon
ding
dim
ensi
on.
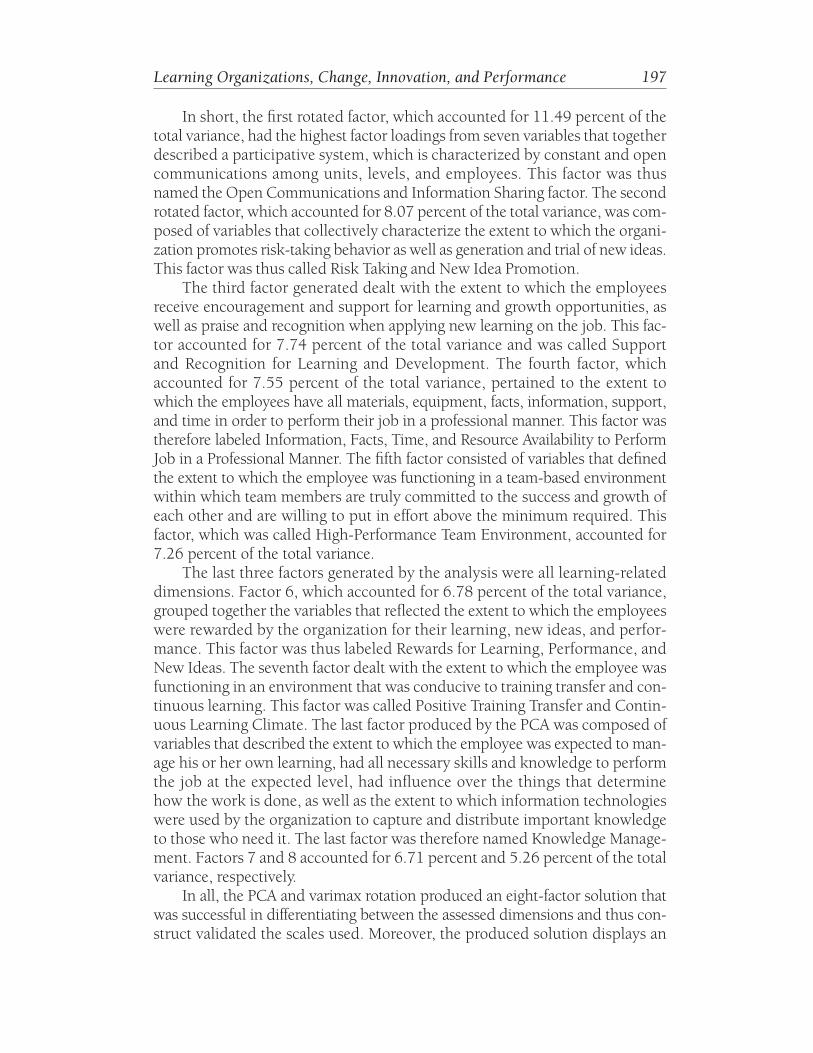
In short, the first rotated factor, which accounted for 11.49 percent of thetotal variance, had the highest factor loadings from seven variables that togetherdescribed a participative system, which is characterized by constant and opencommunications among units, levels, and employees. This factor was thusnamed the Open Communications and Information Sharing factor. The secondrotated factor, which accounted for 8.07 percent of the total variance, was com-posed of variables that collectively characterize the extent to which the organi-zation promotes risk-taking behavior as well as generation and trial of new ideas.This factor was thus called Risk Taking and New Idea Promotion.
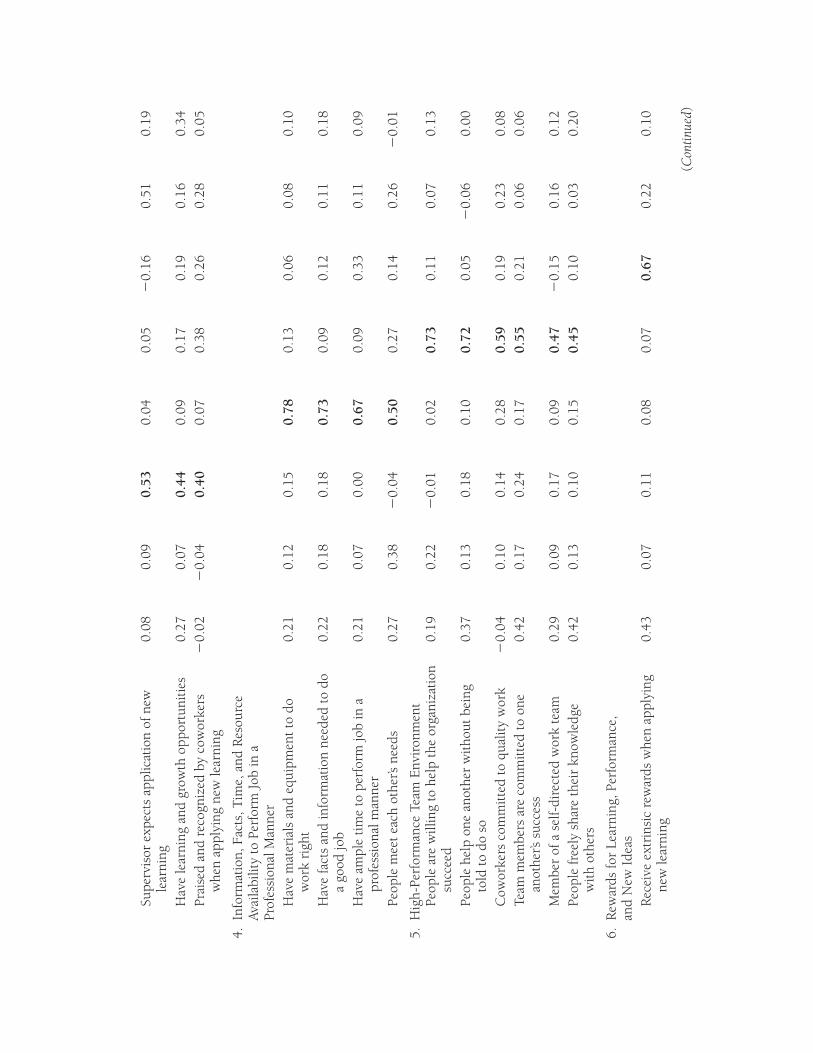
The third factor generated dealt with the extent to which the employeesreceive encouragement and support for learning and growth opportunities, aswell as praise and recognition when applying new learning on the job. This fac-tor accounted for 7.74 percent of the total variance and was called Supportand Recognition for Learning and Development. The fourth factor, whichaccounted for 7.55 percent of the total variance, pertained to the extent towhich the employees have all materials, equipment, facts, information, support,and time in order to perform their job in a professional manner. This factor wastherefore labeled Information, Facts, Time, and Resource Availability to PerformJob in a Professional Manner. The fifth factor consisted of variables that definedthe extent to which the employee was functioning in a team-based environmentwithin which team members are truly committed to the success and growth ofeach other and are willing to put in effort above the minimum required. Thisfactor, which was called High-Performance Team Environment, accounted for7.26 percent of the total variance.
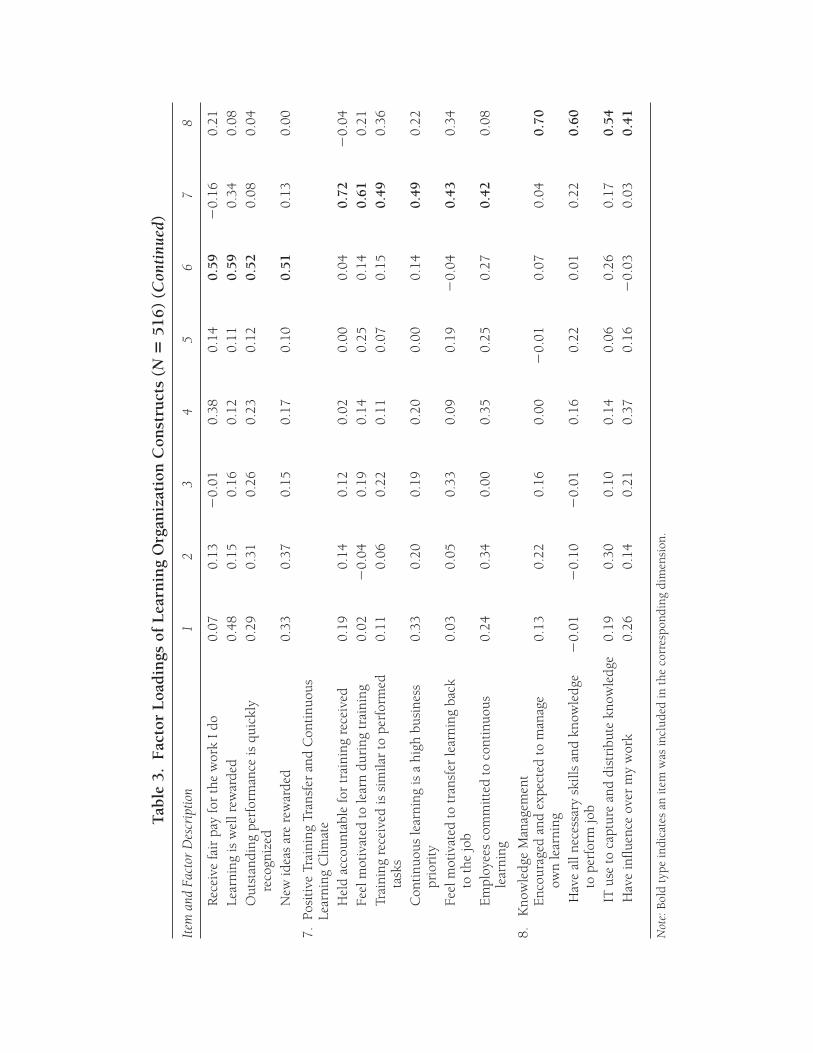
The last three factors generated by the analysis were all learning-relateddimensions. Factor 6, which accounted for 6.78 percent of the total variance,grouped together the variables that reflected the extent to which the employeeswere rewarded by the organization for their learning, new ideas, and perfor-mance. This factor was thus labeled Rewards for Learning, Performance, andNew Ideas. The seventh factor dealt with the extent to which the employee wasfunctioning in an environment that was conducive to training transfer and con-tinuous learning. This factor was called Positive Training Transfer and Contin-uous Learning Climate. The last factor produced by the PCA was composed ofvariables that described the extent to which the employee was expected to man-age his or her own learning, had all necessary skills and knowledge to performthe job at the expected level, had influence over the things that determinehow the work is done, as well as the extent to which information technologieswere used by the organization to capture and distribute important knowledgeto those who need it. The last factor was therefore named Knowledge Manage-ment. Factors 7 and 8 accounted for 6.71 percent and 5.26 percent of the totalvariance, respectively.
In all, the PCA and varimax rotation produced an eight-factor solution thatwas successful in differentiating between the assessed dimensions and thus con-struct validated the scales used. Moreover, the produced solution displays an
Learning Organizations, Change, Innovation, and Performance 197
198 Kontoghiorghes, Awbrey, Feurig
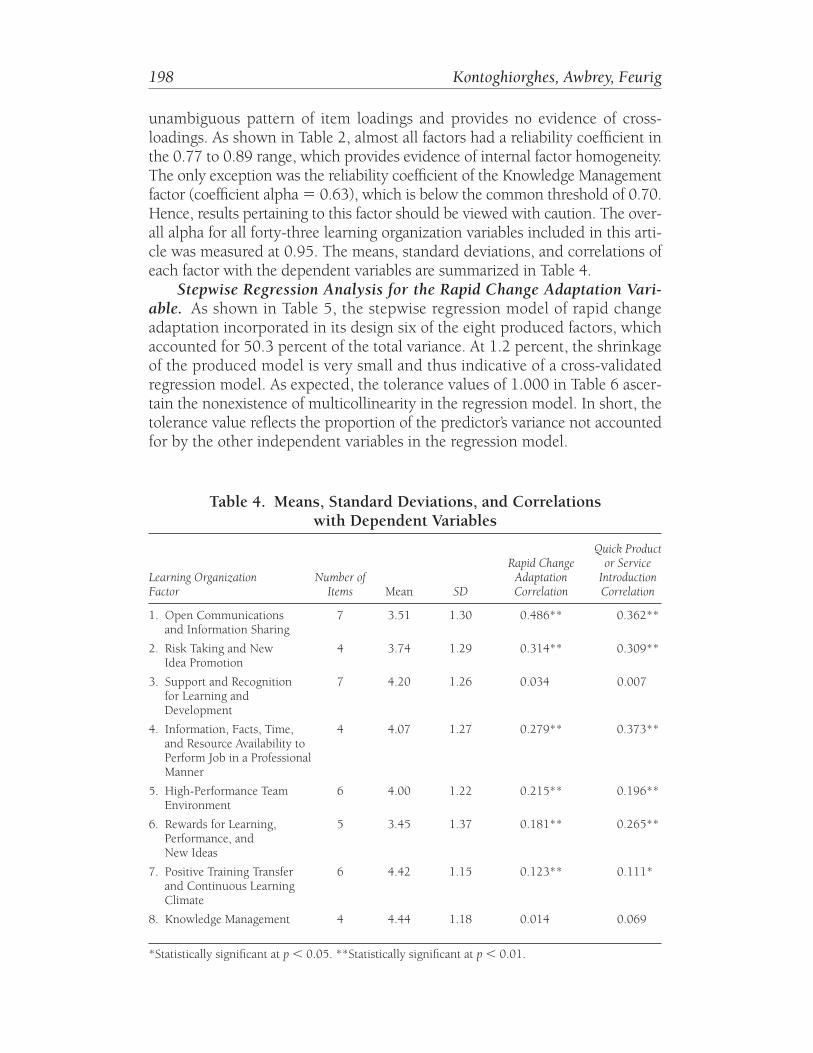
Table 4. Means, Standard Deviations, and Correlationswith Dependent Variables
Quick ProductRapid Change or Service
Learning Organization Number of Adaptation IntroductionFactor Items Mean SD Correlation Correlation
1. Open Communications 7 3.51 1.30 0.486** 0.362**and Information Sharing
2. Risk Taking and New 4 3.74 1.29 0.314** 0.309**Idea Promotion
3. Support and Recognition 7 4.20 1.26 0.034 0.007for Learning andDevelopment
4. Information, Facts, Time, 4 4.07 1.27 0.279** 0.373**and Resource Availability to Perform Job in a ProfessionalManner
5. High-Performance Team 6 4.00 1.22 0.215** 0.196**Environment
6. Rewards for Learning, 5 3.45 1.37 0.181** 0.265**Performance, andNew Ideas
7. Positive Training Transfer 6 4.42 1.15 0.123** 0.111*and Continuous Learning Climate
8. Knowledge Management 4 4.44 1.18 0.014 0.069
*Statistically significant at p � 0.05. **Statistically significant at p � 0.01.
unambiguous pattern of item loadings and provides no evidence of cross-loadings. As shown in Table 2, almost all factors had a reliability coefficient inthe 0.77 to 0.89 range, which provides evidence of internal factor homogeneity.The only exception was the reliability coefficient of the Knowledge Managementfactor (coefficient alpha � 0.63), which is below the common threshold of 0.70.Hence, results pertaining to this factor should be viewed with caution. The over-all alpha for all forty-three learning organization variables included in this arti-cle was measured at 0.95. The means, standard deviations, and correlations ofeach factor with the dependent variables are summarized in Table 4.
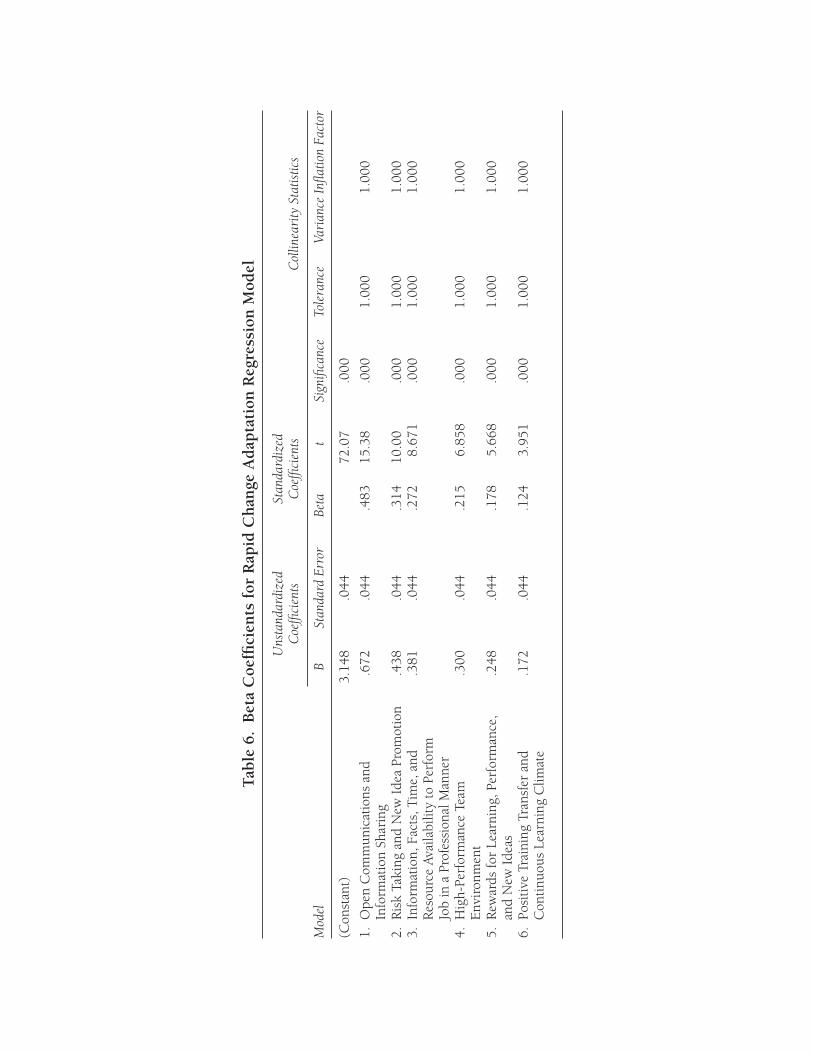
Stepwise Regression Analysis for the Rapid Change Adaptation Vari-able. As shown in Table 5, the stepwise regression model of rapid changeadaptation incorporated in its design six of the eight produced factors, whichaccounted for 50.3 percent of the total variance. At 1.2 percent, the shrinkageof the produced model is very small and thus indicative of a cross-validatedregression model. As expected, the tolerance values of 1.000 in Table 6 ascer-tain the nonexistence of multicollinearity in the regression model. In short, thetolerance value reflects the proportion of the predictor’s variance not accountedfor by the other independent variables in the regression model.
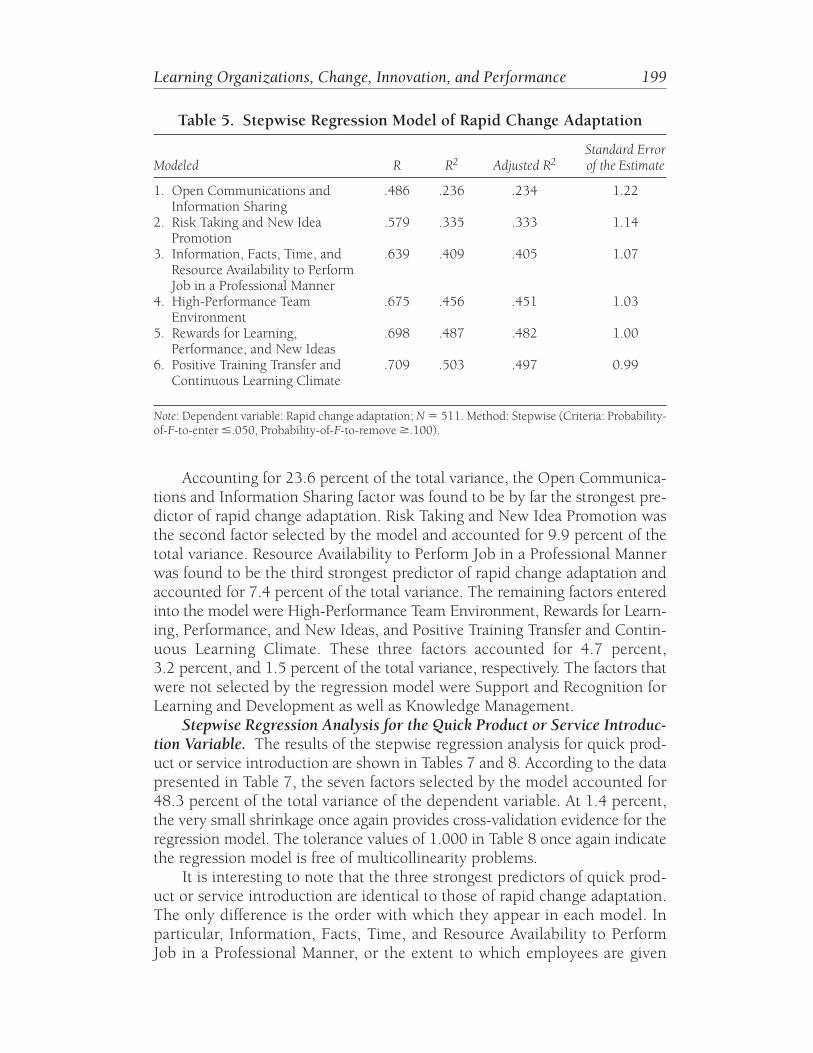
Accounting for 23.6 percent of the total variance, the Open Communica-tions and Information Sharing factor was found to be by far the strongest pre-dictor of rapid change adaptation. Risk Taking and New Idea Promotion wasthe second factor selected by the model and accounted for 9.9 percent of thetotal variance. Resource Availability to Perform Job in a Professional Mannerwas found to be the third strongest predictor of rapid change adaptation andaccounted for 7.4 percent of the total variance. The remaining factors enteredinto the model were High-Performance Team Environment, Rewards for Learn-ing, Performance, and New Ideas, and Positive Training Transfer and Contin-uous Learning Climate. These three factors accounted for 4.7 percent,3.2 percent, and 1.5 percent of the total variance, respectively. The factors thatwere not selected by the regression model were Support and Recognition forLearning and Development as well as Knowledge Management.
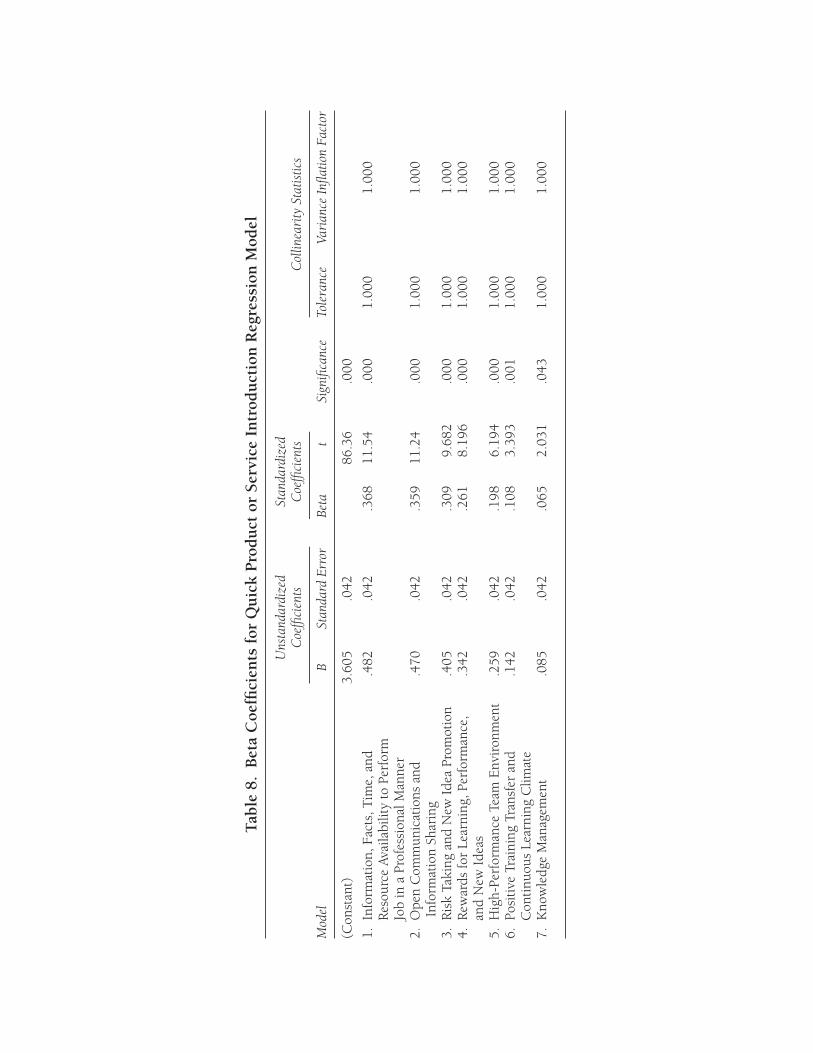
Stepwise Regression Analysis for the Quick Product or Service Introduc-tion Variable. The results of the stepwise regression analysis for quick prod-uct or service introduction are shown in Tables 7 and 8. According to the datapresented in Table 7, the seven factors selected by the model accounted for48.3 percent of the total variance of the dependent variable. At 1.4 percent,the very small shrinkage once again provides cross-validation evidence for theregression model. The tolerance values of 1.000 in Table 8 once again indicatethe regression model is free of multicollinearity problems.
It is interesting to note that the three strongest predictors of quick prod-uct or service introduction are identical to those of rapid change adaptation.The only difference is the order with which they appear in each model. Inparticular, Information, Facts, Time, and Resource Availability to PerformJob in a Professional Manner, or the extent to which employees are given
Learning Organizations, Change, Innovation, and Performance 199
Table 5. Stepwise Regression Model of Rapid Change Adaptation
Standard ErrorModeled R R2 Adjusted R2 of the Estimate
1. Open Communications and .486 .236 .234 1.22Information Sharing
2. Risk Taking and New Idea .579 .335 .333 1.14Promotion
3. Information, Facts, Time, and .639 .409 .405 1.07Resource Availability to PerformJob in a Professional Manner
4. High-Performance Team .675 .456 .451 1.03Environment
5. Rewards for Learning, .698 .487 .482 1.00Performance, and New Ideas
6. Positive Training Transfer and .709 .503 .497 0.99Continuous Learning Climate
Note: Dependent variable: Rapid change adaptation; N � 511. Method: Stepwise (Criteria: Probability-of-F-to-enter �.050, Probability-of-F-to-remove �.100).
Tab
le 6
.B
eta
Coe
ffici
ents
for
Rap
id C
han
ge A
dap
tati
on R
egre
ssio
n M
odel
Uns
tand
ardi
zed
Stan
dard
ized
Coe
ffici
ents
Coe
ffici
ents
Col
linea
rity
Sta
tistic
s
Mod
elB
Stan
dard
Err
orBe
tat
Sign
ifica
nce
Tole
ranc
eVa
rian
ce In
flatio
n Fa
ctor
(Con
stan
t)3.
148
.044
72.0
7.0
00
1.O
pen
Com
mun
icat
ions
and
.672
.044
.483
15.3
8.0
001.
000
1.00
0In
form
atio
n Sh
arin
g2.
Ris
k Ta
king
and
New
Ide
a Pr
omot
ion
.438
.044
.314
10.0
0.0
001.
000
1.00
03.
Info
rmat
ion,
Fac
ts, T
ime,
and
.381
.044
.272
8.67
1.0
001.
000
1.00
0R
esou
rce
Avai
labi
lity
to P
erfo
rmJo
b in
a P
rofe
ssio
nal M
anne
r4.
Hig
h-Pe
rfor
man
ce T
eam
.3
00.0
44.2
156.
858
.000
1.00
01.
000
Env
iron
men
t5.
Rew
ards
for
Lear
ning
, Per
form
ance
,.2
48.0
44.1
785.
668
.000
1.00
01.
000
and
New
Ide
as6.
Posi
tive
Tra
inin
g Tr
ansf
er a
nd.1
72.0
44.1
243.
951
.000
1.00
01.
000
Con
tinu
ous
Lear
ning
Clim
ate
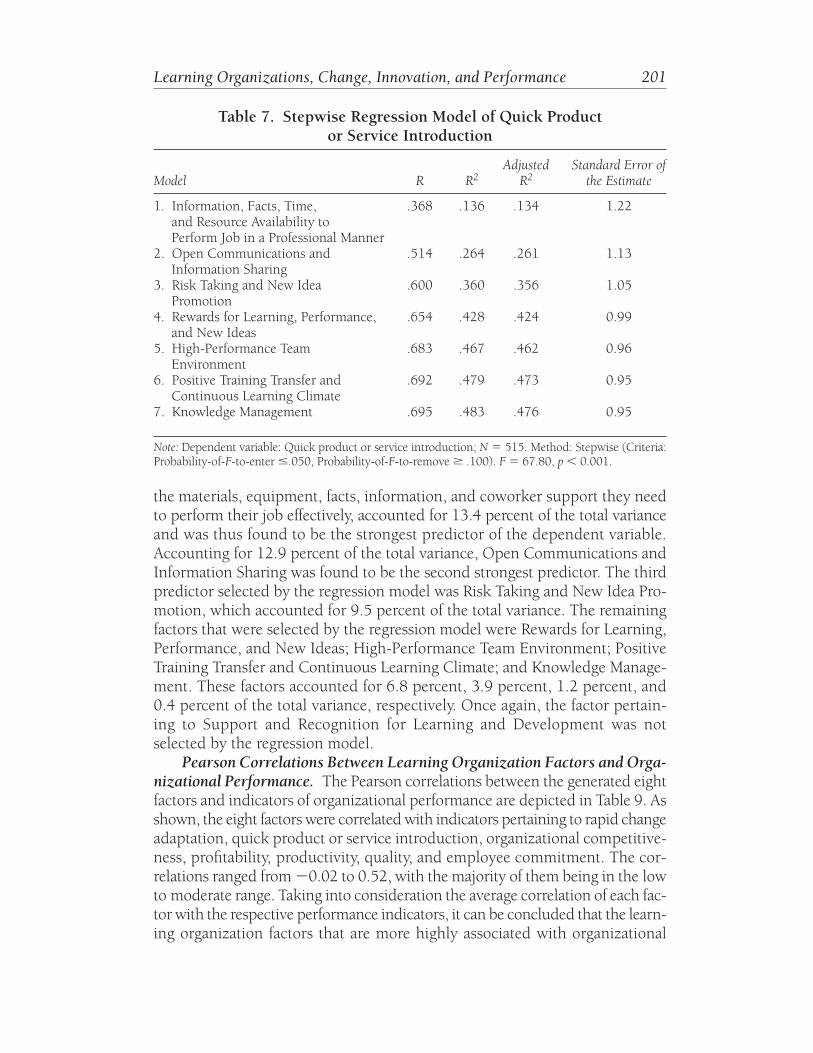
the materials, equipment, facts, information, and coworker support they needto perform their job effectively, accounted for 13.4 percent of the total varianceand was thus found to be the strongest predictor of the dependent variable.Accounting for 12.9 percent of the total variance, Open Communications andInformation Sharing was found to be the second strongest predictor. The thirdpredictor selected by the regression model was Risk Taking and New Idea Pro-motion, which accounted for 9.5 percent of the total variance. The remainingfactors that were selected by the regression model were Rewards for Learning,Performance, and New Ideas; High-Performance Team Environment; PositiveTraining Transfer and Continuous Learning Climate; and Knowledge Manage-ment. These factors accounted for 6.8 percent, 3.9 percent, 1.2 percent, and0.4 percent of the total variance, respectively. Once again, the factor pertain-ing to Support and Recognition for Learning and Development was notselected by the regression model.
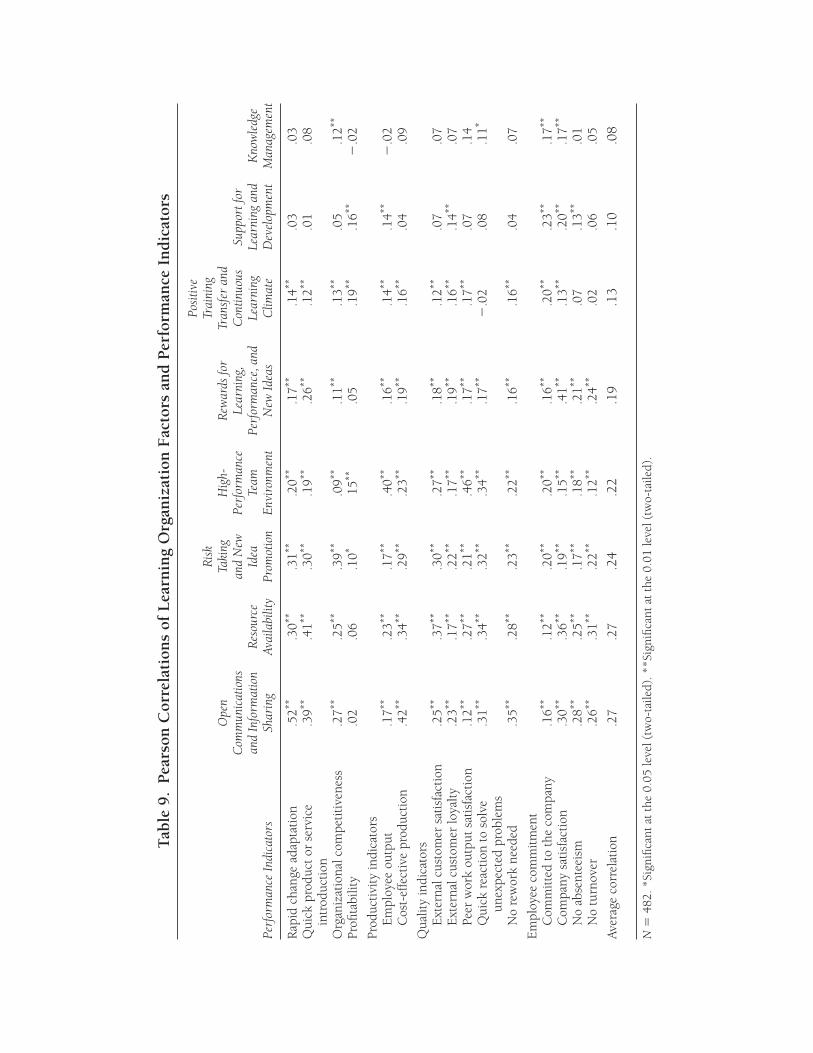
Pearson Correlations Between Learning Organization Factors and Orga-nizational Performance. The Pearson correlations between the generated eightfactors and indicators of organizational performance are depicted in Table 9. Asshown, the eight factors were correlated with indicators pertaining to rapid changeadaptation, quick product or service introduction, organizational competitive-ness, profitability, productivity, quality, and employee commitment. The cor-relations ranged from �0.02 to 0.52, with the majority of them being in the lowto moderate range. Taking into consideration the average correlation of each fac-tor with the respective performance indicators, it can be concluded that the learn-ing organization factors that are more highly associated with organizational
Learning Organizations, Change, Innovation, and Performance 201
Table 7. Stepwise Regression Model of Quick Productor Service Introduction
Adjusted Standard Error ofModel R R2 R2 the Estimate
1. Information, Facts, Time, .368 .136 .134 1.22and Resource Availability toPerform Job in a Professional Manner
2. Open Communications and .514 .264 .261 1.13Information Sharing
3. Risk Taking and New Idea .600 .360 .356 1.05Promotion
4. Rewards for Learning, Performance, .654 .428 .424 0.99and New Ideas
5. High-Performance Team .683 .467 .462 0.96Environment
6. Positive Training Transfer and .692 .479 .473 0.95Continuous Learning Climate
7. Knowledge Management .695 .483 .476 0.95
Note: Dependent variable: Quick product or service introduction; N � 515. Method: Stepwise (Criteria:Probability-of-F-to-enter �.050, Probability-of-F-to-remove � .100). F � 67.80, p � 0.001.
Tab
le 8
.B
eta
Coe
ffici
ents
for
Qu
ick
Pro
du
ct o
r Se
rvic
e In
trod
uct
ion
Reg
ress
ion
Mod
el
Uns
tand
ardi
zed
Stan
dard
ized
Coe
ffici
ents
Coe
ffici
ents
Col
linea
rity
Sta
tistic
s
Mod
elB
Stan
dard
Err
orBe
tat
Sign
ifica
nce
Tole
ranc
eVa
rian
ce In
flatio
n Fa
ctor
(Con
stan
t)3.
605
.042
86.3
6.0
00
1.In
form
atio
n, F
acts
, Tim
e, a
nd.4
82.0
42.3
6811
.54
.000
1.00
01.
000
Res
ourc
e Av
aila
bilit
y to
Per
form
Job
in a
Pro
fess
iona
l Man
ner
2.O
pen
Com
mun
icat
ions
and
.470
.042
.359
11.2
4.0
001.
000
1.00
0In
form
atio
n Sh
arin
g3.
Ris
k Ta
king
and
New
Ide
a Pr
omot
ion
.405
.042
.309
9.68
2.0
001.
000
1.00
04.
Rew
ards
for
Lear
ning
, Per
form
ance
,.3
42.0
42.2
618.
196
.000
1.00
01.
000
and
New
Ide
as5.
Hig
h-Pe
rfor
man
ce T
eam
Env
iron
men
t.2
59.0
42.1
986.
194
.000
1.00
01.
000
6.Po
siti
ve T
rain
ing
Tran
sfer
and
.142
.042
.108
3.39
3.0
011.
000
1.00
0C
onti
nuou
s Le
arni
ng C
limat
e7.
Kno
wle
dge
Man
agem
ent
.085
.042
.065
2.03
1.0
431.
000
1.00
0
Tab
le 9
.P
ears
on C
orre
lati
ons
of L
earn
ing
Org
aniz
atio
n F
acto
rs a
nd
Per
form
ance
In
dic
ator
s
Posi
tive
Ris
kTr
aini
ngO
pen
Taki
ng
Hig
h-R
ewar
ds fo
rTr
ansf
er a
ndC
omm
unic
atio
nsan
d N
ewPe
rfor
man
ceLe
arni
ng,
Con
tinuo
usSu
ppor
t for
and
Info
rmat
ion
Res
ourc
eId
eaTe
amPe
rfor
man
ce, a
ndLe
arni
ngLe
arni
ng a
ndK
now
ledg
ePe
rfor
man
ce In
dica
tors
Shar
ing
Avai
labi
lity
Prom
otio
nEn
viro
nmen
tN
ew Id
eas
Clim
ate
Dev
elop
men
tM
anag
emen
t
Rap
id c
hang
e ad
apta
tion
.52**
.30**
.31**
.20**
.17**
.14**
.03
.03
Qui
ck p
rodu
ct o
r se
rvic
e .3
9**.4
1**.3
0**.1
9**.2
6**.1
2**.0
1.0
8in
trod
ucti
onO
rgan
izat
iona
l com
peti
tive
ness
.27**
.25**
.39**
.09**
.11**
.13**
.05
.12**
Profi
tabi
lity
.02
.06
.10*
15**
.05
.19**
.16**
�.0
2
Prod
ucti
vity
indi
cato
rsE
mpl
oyee
out
put
.17**
.23**
.17**
.40**
.16**
.14**
.14**
�.0
2C
ost-
effe
ctiv
e pr
oduc
tion
.42**
.34**
.29**
.23**
.19**
.16**
.04
.09
Qua
lity
indi
cato
rsE
xter
nal c
usto
mer
sat
isfa
ctio
n.2
5**.3
7**.3
0**.2
7**.1
8**.1
2**.0
7.0
7E
xter
nal c
usto
mer
loya
lty
.23**
.17**
.22**
.17**
.19**
.16**
.14**
.07
Peer
wor
k ou
tput
sat
isfa
ctio
n.1
2**.2
7**.2
1**.4
6**.1
7**.1
7**.0
7.1
4Q
uick
rea
ctio
n to
sol
ve.3
1**.3
4**.3
2**.3
4**.1
7**�
.02
.08
.11*
unex
pect
ed p
robl
ems
No
rew
ork
need
ed.3
5**.2
8**.2
3**.2
2**.1
6**.1
6**.0
4.0
7
Em
ploy
ee c
omm
itm
ent
Com
mit
ted
to t
he c
ompa
ny.1
6**.1
2**.2
0**.2
0**.1
6**.2
0**.2
3**.1
7**
Com
pany
sat
isfa
ctio
n.3
0**.3
6**.1
9**.1
5**.4
1**.1
3**.2
0**.1
7**
No
abse
ntee
ism
.28**
.25**
.17**
.18**
.21**
.07
.13**
.01
No
turn
over
.26**
.31**
.22**
.12**
.24**
.02
.06
.05
Aver
age
corr
elat
ion
.27
.27
.24
.22
.19
.13
.10
.08
N�
482.
*Si
gnifi
cant
at
the
0.05
leve
l (tw
o-ta
iled)
. **S
igni
fican
t at
the
0.0
1 le
vel (
two-
taile
d).
204 Kontoghiorghes, Awbrey, Feurig
performance are those that pertain to the structural, information systems, andorganization culture dimensions.
The factors that were found to exhibit an average correlation of 0.2 orhigher with the performance indicators were Open Communications andInformation Sharing (r � 0.27), Resource Availability (r � 0.27), Risk Takingand New Idea Promotion (r � 0.24), and High-Performance Team Environ-ment (r � 0.22). It is interesting to note that the average correlations betweenthe learning-related dimensions and performance indicators were found to bein the low range. In particular, the average correlation of Positive TrainingTransfer and Continuous Learning Climate, Support for Learning and Devel-opment, and Knowledge Management with the performance indicators were0.13, 0.10, and 0.08, respectively. The Rewards for Learning, Performance, andIdeas factor was found to exhibit an average correlation of 0.19 with the per-formance indicators.
By examining the individual correlations in Table 9, one can observe thatonly 6 out of the possible 120 correlations between the learning organizationfactors and the performance indicators are above 0.4. Furthermore, only fourof the eight factors were found to exhibit a correlation of 0.4 or higher with atleast one of the performance indicators. The Open Communications and Infor-mation Sharing factor was found to be more highly correlated withrapid change adaptation (r � 0.52, p � 0.01) and cost-effective production(r � 0.42, p � 0.01). At the same time, the High-Performance Team Environ-ment factor was found to be more highly correlated with peer work output sat-isfaction (r � 0.46, p � 0.01) and employee output (r � 0.40, p � 0.01).Finally, the factors of Resource Availability and Rewards for Learning, Perfor-mance, and New Ideas exhibited a correlation of 0.41 (p � 0.01) with quickproduct or service introduction and company satisfaction, respectively. It isworth noting that all factors were found to exhibit a low to a very weakassociation with profitability.
Conclusions and Discussion
In all, the correlational data in conjunction with the results of the regressionanalyses indicate that the most important learning organization dimensions forchange adaptation, quick product or service introduction, and bottom-lineorganizational performance are those pertaining to the structural, cultural, andinformation systems of the organization. More specifically, the stepwise regres-sion model for rapid change adaptation identified Open Communications andInformation Sharing, Risk Taking and New Idea Promotion, and Resource Avail-ability to be its strongest predictors. Moreover, the statistical analysis identifiedResource Availability, Open Communications and Information Sharing, andRisk Taking and New Idea Promotion to be the strongest predictors of quickproduct or service introduction. The fourth and fifth strongest predictors for

both models, in reverse order, were High-Performance Team Environment andRewards for Learning, Performance, and New Ideas. Taking into account thatthese five factors were also found to exhibit the highest average correlationswith the fifteen performance indicators in Table 9, it is safe to conclude thatorganizational interventions that focus on the structural, cultural, and com-munication system characteristics of the organization will be more likely to pro-duce higher levels of performance, change adaptation, and innovation thanthose that strictly focus on learning and its application.
Collectively, the three factors that were found to more strongly predict rapidchange adaptation and quick product or service introduction reflect the impor-tance of designing participative and open organizational systems. Within sucha system, information is openly shared with employees, while constant andopen communications across levels and between departments allow joint solu-tions to problems without boundary interference. Furthermore, the three fac-tors together describe an organizational system that not only provides theemployees with all the time, facts, information, and tools they need in order toperform their job in a professional manner, it also gives them the freedom to trynew ideas and be risk takers. The latter validates the importance of Argyris’sdouble-loop learning theory and demonstrates how democratic and open sys-tems, which allow employees to think, challenge the operating norms of theorganization, be creative, and take risks, ultimately transform themselves intoinnovative and rapidly adapting entities capable of coping with highly complexand rapidly changing environments.
In a nutshell, the results of this study suggest that organizational designsthat are based on the holographic principles of connectivity, redundancy, andself-organization facilitate innovation and rapid change adaptation. An advan-tage today’s organizations have is that through information technologies, theycan very easily transform themselves into holographic entities and thus elim-inate the bounded rationality that may characterize them. To do so, however,they will need to operate as open and trusting systems capable of adapting par-ticipative practices, which promote employee involvement and empowerment.Simply put, open communications, free flow of information, and risk takingdo not occur in bureaucratic systems for which information is considered asacred commodity and deviation from operating norms a serious violation.
Another conclusion that stems from the results of this study is that althoughlearning organization designs facilitate change adaptation and innovation, andthus organizational growth and evolution, they are not as equally effective whenit comes to such bottom-line organizational performance as productivity, qual-ity, and profitability. This finding is in agreement with Lawler and Mohrman’sassertion (1998) according to which no single approach to management offers acomplete system of management. Lawler and Mohrman note that “the challengefor the future is to develop a complete system of management that integrates andgoes beyond what is offered by any one of them” (p. 207).
Learning Organizations, Change, Innovation, and Performance 205

206 Kontoghiorghes, Awbrey, Feurig
Implications for Practice. The findings of this study have important impli-cations for HRD practice. First, they reinforce the notion that systemic interven-tions that address a variety and different combinations of learning organizationcharacteristics will be more likely to be successful than interventions that solelyfocus on singular or a limited number of dimensions. However, the results of thisstudy further imply that when it comes to performance, transforming the struc-tural and cultural dimensions of the learning organization approach should bethe first priority. More specifically, the results of this study suggest that trans-forming the organizational structure into an organic one, and in turn changingthe organizational culture accordingly, should be the first critical step whenbuilding the learning organization. This is in contrast to the approach typicallyfollowed when attempting to build a learning organization. Often enough, creat-ing a continuous learning environment and knowledge dissemination is the pri-mary focus of many learning organization interventions. According to the resultsof this study, focusing first on such learning organization characteristics as opencommunications, teamwork, resource availability, and risk taking, and then onbuilding the learning network and continuous learning culture, can make thetransformation process faster to produce results. Given that altering the struc-ture of the organization often demands cultural changes as well, the learningorganization transformation process could be facilitated further if attention is alsopaid to such cultural characteristics as trust, experimentation, flexibility,employee participation, and teamwork.
Limitations and Implications for Future Research. Given that the findingsof this study are based on a correlational analysis, which in turn was based onself-reported data, no strict causal conclusions can be inferred. The causal direc-tion between the investigated variables could further be established throughquasi-experimental or longitudinal research designs. Reliance on more direct orobjective measures, such as archival data, interviews with key stakeholders, anddirect observations by trained research observers, could also enhance the valid-ity of the conclusions drawn in this study. Furthermore, although this study isbased on data gathered from organizations representing different sectors of theindustry, replicating this study in other industries and environments will helpdetermine the extent to which the presented results can be generalized to othersettings as well. Moreover, the dimensions incorporated in this study are only asubset of all possible ones that can be studied under learning organization theory.Hence, replication of this study with inclusion of more learning organizationdimensions may help develop a better conceptual framework with regard to theassociation between learning organization practices and change adaptation,innovation as well as bottom-line organizational performance.
References
Ackoff, R. (1981). Creating the corporate future. New York: Wiley.Alreck, P. L., & Settle, R. B. (1995). The survey research handbook: Guidelines and strategies for
conducting a survey (2nd). Burr Ridge, IL: Irwin.
Altman, Y., & Iles, P. (1998). Learning, leadership, teams: Corporate learning and organizationalchange. Journal of Management Development, 17 (1), 44–55.
Anderson, C. (1997). Values-based management. Academy of Management Executive, 11 (4),25–46.
Appelbaum, S. H., & Goransson, L. (1997). Transformational and adaptive learning within thelearning organization: A framework for research and application. Learning Organization, 4 (3),115–128.
Appelbaum, S. H., & Reichart, W. (1998). How to measure an organization’s learning ability: Thefacilitating factors—part II. Journal of Workplace Learning, 10 (1), 15–28.
Argyris, C. (1991). Teaching smart people how to learn. Harvard Business Review, 69 (3), 99–109.Argyris, C. (1999). On organizational learning (2nd ed.). Oxford: Blackwell.Argyris, C., Putnam, R., & Smith, D. M. (1985). Action science: Concepts, methods, and skills for
research and intervention. San Francisco: Jossey-Bass.Argyris, C., & Schön, D. A. (1978). Organizational learning: A theory of action perspective. Read-
ing, MA: Addison-Wesley.Argyris, C., & Schön, D. A. (1989). Participative action research and action science compared:
A commentary. American Behavioral Scientist, 32, 612–623.Argyris, C., & Schön, D. A. (1996). Organizational learning II: Theory, method, and practice. Read-
ing, MA: Addison-Wesley.Armstrong, A., & Foley, P. (2003). Foundations of a learning organization: Organization learn-
ing mechanisms. Learning Organization, 10 (2), 74–82.Baldwin, T. T., Danielson, C., & Wiggenhorn, W. (1997). The evolution of learning strategies in
organizations: From employee development to business redefinition. Academy of ManagementExecutive, 11 (4), 47–57.
Barnes, J. (1991). From resources and sustained competitive advantage. Journal of Management,17, 99–120.
Beckhard, R., & Pritchard, W. (1992). Changing the essence: The art of creating and leading funda-mental change in organizations. San Francisco: Jossey-Bass.
Bennett, J. K., & O’Brien, M. J. (1994). The building blocks of the learning organization. Train-ing, 31 (6), 41–49.
Blackler, F. (1995). Knowledge, knowledge work and organizations: An overview and interpre-tation. Organization Studies, 1 (6), 1021–1046.
Boyle, E. (2002). A critical appraisal of the performance of Royal Dutch Shell as a learning orga-nization in the 1990s. Learning Organization, 9 (1), 6–18.
Buckingham, M., & Coffman, C. (1999). First break all the rules: What the world’s greatest man-agers do differently. New York: Simon & Schuster.
Burgoyne, J. (1999, June 3). Design of the times. People Magazine, pp. 38–44.Calvert, G., Mobley, S., & Marshall, L. (1994). Grasping the learning organization. Training and
Development, 48 (6), 38–43.Campbell, T., & Cairns, H. (1994). Developing and measuring the learning organization: From
buzz words to behaviors. Industrial and Commercial Training, 26 (7), 10–15.Cook, S.D.N., & Yanow, D. (1993). Culture and organizational learning. Journal of Management
Inquiry, 2 (4), 373–390.Coopey, J. P. (1995). The learning organization: Power, politics, and ideology. Management Learn-
ing, 26 (2), 193–213.Daft, R., & Marcic, D. (1998). Understanding management. Forth Worth, TX: Dryden Press.DeGeus, A. P. (1988). Planning as learning. Harvard Business Review, 66 (2), 70–74.DiBella, A. J. (1995). Developing learning organizations: A matter of perspective. Academy of
Management Journal, 38, 287–290.Dodgson, M. (1993). Organizational learning: A review of some literatures. Organizational Studies,
14 (3), 375–394.Easterby-Smith, M. (1997). Disciplines of organizational learning: Contributions and critiques.
Human Relations, 50 (9), 1085–1106.
Learning Organizations, Change, Innovation, and Performance 207
208 Kontoghiorghes, Awbrey, Feurig
Easterby-Smith, M., & Araujo, L. (1999). Organizational learning: Current debates and oppor-tunities. In M. Easterby-Smith, J. Burgoyne, & L. Araujo (Eds.), Organizational learning and thelearning organization: Developments in theory and practice (pp. 1–21). Thousand Oaks, CA: Sage.
Ellinger, A. D., Ellinger, A. E., Yang, B., & Howton, S. W. (2002). The relationship between thelearning organization concept and firms’ financial performance: An empirical assessment.Human Resource Development Quarterly, 13 (1), 5–21.
Finger, M., & Brand, S. (1999). The concept of the learning organization applied to the trans-formation of the public sector. In M. Easterby-Smith, J. Burgoyne, & L. Araujo (Eds.),Organizational learning and the learning organization: Developments in theory and practice(pp. 130–156). Thousand Oaks, CA: Sage.
Fiol, M. C., & Lyles, M. A. (1985). Organizational learning. Academy of Management Review, 10(4), 803–813.
Forrester, J. (1968). Principles of systems. Portland, OR: Productivity Press.Gagnon, S. (1999). Resource-based competition and the new operations strategy. International
Journal of Operations and Production Management, 19 (2), 125–138.Gardiner, P., & Whiting, P. (1997). Success factors in learning organizations: An empirical study.
Industrial and Commercial Training, 29 (2), 41–48.Garvin, D. (1993). Building learning organizations. Harvard Business Review, 71, 78–91.Gephart, M. A., Marsick, V. J., Van Buren, M. E., & Spiro, M. S. (1996). Learning organizations
come alive. Training and Development, 50 (12), 34–46.Goh, S. C. (1998). Toward a learning organization: The strategic building blocks. S.A.M. Advanced
Management Journal, 63 (2), 15–20.Goh, S. C., & Richards, G. (1997). Benchmarking the learning capability of organization. Euro-
pean Management Journal, 2 (2), 575–583.Grant, R. M. (1991). The resource-based theory of competitive advantage: Implications for strat-
egy formulation. California Management Review, 33, 114–135.Griego, O. V., Geroy, G. D., & Wright, P. C. (2000). Predictors of learning organizations: A human
resource development practitioner’s perspective. Learning Organization, 7 (1), 5–13.Hackman, J. R., & Oldham, G. R. (1980). Work redesign. Reading, MA: Addison-Wesley.Hamel, G., & Prahalad, C. K. (1994). Competing for the future. Boston: Harvard Business School Press.Heraty, N., & Morley, M. (1995). A review of issues in conducting organization-level research
with reference to the learning organization. Learning Organization, 2 (4), 27–35.Jashapara, A. (1993). The competitive learning organization: A quest for the Holy Grail.
Management Decision, 31 (8), 52–62.Jashapara, A. (2003). Cognition, culture and competition: An empirical test of the learning orga-
nization. Learning Organization, 10 (1), 31–50.Jones, M. (1995). Organizational learning: Collective mind or cognitivist metaphor? Accounting,
Management and Information Technology, 5 (1), 61–77.Jones, A. M., & Hendry, C. (1992). The learning organization: A review of the literature and prac-
tice. London: HRD Partnership.Jones, A. M., & Hendry, C. (1994). The learning organization: Adult learning and organizational
transformation. British Journal of Management, 5, 153–162.Kiechel, W. (1990, March). The organization that learns. Fortune, pp. 133–136.Kim, D. H. (1993, Fall). The link between individual and organizational learning. Sloan
Management Review, pp. 37–50.Kontoghiorghes, C. (2001a). Factors affecting training effectiveness in the context of the intro-
duction of new technology—a US case study. International Journal of Training and Development,5 (4), 248–260.
Kontoghiorghes, C. (2001b). A holistic approach toward motivation to learn in the workplace.Performance Improvement Quarterly, 14 (4), 3–17.
Kontoghiorghes, C. (2002). Predicting motivation to learn and motivation to transfer learningback to the job in a service organization—A new systemic model for training effectiveness.Performance Improvement Quarterly, 15 (3), 114–129.
Kontoghiorghes, C. (2003). Examining the association between quality and productivity perfor-mance in a service organization. Quality Management Journal, 11 (2), 8–20.
Kontoghiorghes, C. (2004). Reconceptualizing the learning transfer conceptual framework:Empirical validation of a new systemic model. International Journal of Training and Development,8 (3), 210–221.
Kontoghiorghes, C., & Bryant, N. (2004). Exploring employee commitment in a service organi-zation in the health care insurance industry. Organization Development Journal, 22 (3), 59–73.
Kontoghiorghes, C., & Dembeck, D. (2001). Prioritizing quality management and sociotechni-cal variables in terms of quality performance. Quality Management Journal, 8 (3), 36–48.
Kontoghiorghes, C., & Gudgel, R. (2004). Investigating the association between productivity andquality performance in two manufacturing settings. Quality Management Journal, 11 (2), 8–20.
Kontoghiorghes, C., & Hansen, C. (2004). Identification of key predictors of rapid change adap-tation in a service organization—An exploratory study that also examines the link betweenrapid change adaptation and organizational capability. Organization Development Journal, 22 (1),21–39.
Lawler III, E., & Mohrman, S. (1998). Employee involvement, reengineering, and TQM: Focus-ing on capability development. In S. Mohrman, J. Galbraith, E. Lawler III, & Associates, Tomor-row’s organization: Crafting winning capabilities in a dynamic world (pp. 179–207). San Francisco:Jossey-Bass.
Liedtka, J. M. (1996). Collaborating across lines of business for competitive advantage. Academyof Management Executive, 10 (2), 20–34.
Lindsay, W. M., & Petrick, J. A. (1997). Total quality and organization development. Boca Raton,FL: St. Lucie Press.
Lippitt, M. (1997). Creating a learning environment. Human Resources Professional, 10 (5), 23–26.Loermans, J. (2002). Synergizing the learning organization and knowledge management. Journal
of Knowledge Management, 6 (3), 285–294.Macy, B. A., & Izumi, H. (1993). Organizational change, design, and work innovation: A meta-
analysis of 131 North American field studies—1961–1991. Research in Organizational Changeand Development, 7, 235–313.
Marquardt, M. J. (1996). Building the learning organization: A systems approach to quantum improve-ment and global success. New York: McGraw-Hill.
Marsick, V. J., & Watkins, K. E. (1994). The learning organization: An integrative vision for HRD.Human Resource Development Quarterly, 5 (4), 353–360.
Marsick, V. J., & Watkins, K. E. (1999). Facilitating learning organizations: Making learning count.Brookfield, VT: Gower.
Mayo, A., & Lank, E. (1994). The power of learning: A guide to gaining competitive advantage.London: IPD House.
McGill, M. E., Slocum, J. W., & Lei, D. (1993). Management practices in learning organizations.Organizational Dynamics, 21, 5–17.
Mohanty, R. P. (1998). Understanding the integrated linkage: Quality and productivity. Total Qual-ity Management, 9 (8), 753–765.
Moilanen, R. (2001). Diagnostic tools for learning organizations. Learning Organization, 8(1),6–20.
Nonaka, I. (1991). The knowledge-creating company. Harvard Business Review, 69 (6), 96–104.Nonaka, I., Byosiere, P., Borucki, C. C., & Konno, N. (1994). Organizational knowledge creation
theory: A first comprehensive test. International Business Review, 3 (4), 337–351.O’Brien, M. J. (1994). Learning organization practices profile. San Francisco: Pfeiffer.Ortenbald, A. (2001). On differences between organizational learning and learning organization.
Learning Organization, 8 (3, 4), 125–133.Ortenbald, A. (2002). A typology of the ideas of learning organization. Management Learning,
33 (2), 213–230.Pasmore, A. W. (1988). Designing effective organizations: The sociotechnical systems perspective. New
York: Wiley.
Learning Organizations, Change, Innovation, and Performance 209
210 Kontoghiorghes, Awbrey, Feurig
Pedler, M., Boydell, T., & Burgoyne, J. (1988). Learning Company project report. Sheffield: Train-ing Agency.
Pedler, M., Burgoyne, J., & Boydell, T. (1991). The learning company: A strategy for sustainabledevelopment. New York: McGraw-Hill.
Peters, T. (1987). Thriving on chaos: Handbook for a managerial revolution. Old Tappan, NJ:Macmillan.
Phillips, B. T. (2003). A four-level learning organization benchmark implementation model.Learning Organization, 10 (2, 3), 98–105.
Pool, S. W. (2000). The learning organization: Motivating employees by integrating TQM phi-losophy in a supportive organizational culture. Leadership and Organization Development Journal,21 (8), 373–378.
Porth, S. J., McCall, J., & Bausch, T. A. (1999). Spiritual themes of the “learning organization.”Journal of Organizational Change Management, 12 (3), 211–220.
Probst, G., & Buchel, B. (1997). Organizational learning: The competitive advantage of the future.Upper Saddle River, NJ: Prentice Hall.
Richardson, B. (1995). How to administer the networked organization: Tips from the theory andpractice of management. Learning Organization, 2 (4), 4–13.
Robinson, T., Clemson, B., & Keating, C. (1997). Development of high performance organiza-tional learning units. Learning Organization, 4 (5), 228–234.
Rowden, R. W. (2001). The learning organization and strategic change. S.A.M. Advanced Man-agement Journal, 66 (3), 11–17.
Salner, M. (1999). Preparing for the learning organization. Journal of Management Education,23 (5), 489–508.
Sankar, Y. (2003). Designing the learning organization as an information-processing system: Somedesign principles from the systems paradigm and cybernetics. International Journal of Organi-zation Theory and Behavior, 6 (4), 501–521.
Schein, E. H. (1993). Organizational culture and leadership. San Francisco: Jossey-Bass.Selen, W. (2000). Knowledge management in resource-based competitive environments:
A roadmap for building learning organizations. Journal of Knowledge Management, 4 (4),346–353.
Senge, P. M. (1990a). The fifth discipline: The art and practice of the learning organization. New York:Doubleday.
Senge, P. M. (1990b). The leader’s new work: Building learning organizations. Sloan ManagementReview, 32, 7–23.
Slater, S. F., & Narver, J. C. (1995). Market orientation and the learning organization. Journal ofMarketing, 59, 63–74.
Stata, R. (1989, Spring). Organizational learning: The key to management innovation. Sloan Man-agement Review, pp. 63–74.
Stevens, J. (1986). Applied multivariate statistics for the social sciences. Mahwah, NJ: Erlbaum.Strachan, P. (1996). Managing transformational change: The learning organization and teamwork.
Team Performance Management, 2 (2), 32–40.Swain, P. (1999). Organizational learning: Developing leaders to deal with continuous change—
a strategic human resource perspective. Learning Organization, 6 (1), 30–37.Swieringa, J., & Wierdsma, A. (1992). Becoming a learning organization: Beyond the learning curve.
Reading, MA: Addison-Wesley.Tannenbaum, S. (1997). Enhancing continuous learning: Diagnostic findings from multiple com-
panies. Human Resource Management, 36 (4), 437–452.Teare, R., & Dealtry, R. (1998). Building and sustaining a learning organization. Learning Orga-
nization, 5 (1), 47–60.Torbert, W. R. (1994). Managerial learning, organizational learning: A potentially powerful redun-
dancy. Journal of Management Learning, 1, 57–70.Thomsen, H. K., & Hoest, V. (2001). Employees’ perception of the learning organization.
Management Learning, 32 (4), 469–491.
Learning Organizations, Change, Innovation, and Performance 211
For bulk reprints of this article, please call (201) 748-8789.
Tsang, E. (1997). Organizational learning and the learning organization: A dichotomy betweendescriptive and prescriptive research. Human Relations, 50 (1), 73–89.
Ulrich, D. (1997a). Human resource champions: The next agenda for adding value and deliveringresults. Boston: Harvard Business School Press.
Ulrich, D. (1997b). Measuring human resources: An overview of practice and prescription forresults. Human Resource Management, 36 (3), 303–320.
Ulrich, D. (1999). Delivering results: A new mandate for human resource professionals. Boston:Harvard Business School Press.
Watkins, K., & Marsick, V. (1993). Sculpting the learning organization: Lessons in the art and scienceof systemic change. San Francisco: Jossey-Bass.
West, P., & Burnes, B. (2000). Applying organizational learning: Lessons from the automotiveindustry. International Journal of Operations and Production Management, 20 (10), 1236–1252.
Whitney, G., & Pavett, C. (1998). Total quality management as an organizational change: Pre-dictors of successful implementation. Quality Management Journal, 5 (4), 9–22.
Wilkinson, B., & Kleiner, B. H. (1993). New developments in improving learning in organiza-tions. Industrial and Commercial Training, 25 (10), 17–21.
Yang, B., Watkins, K. E., & Marsick, V. J. (2004). The construct of the learning organization:Dimensions, measurement, and validation. Human Resource Development Quarterly, 15 (1),31–55.
Constantine Kontoghiorghes is an assistant professor of human resource managementand organizational behavior at the Cyprus International Institute of Management.
Susan M. Awbrey is vice provost for undergraduate education and associate professorof human resource development at Oakland University in Rochester, Michigan.
Pamela L. Feurig works in the information technology NAFTA change managementdivision of DaimlerChrysler Corporation, Sterling Heights, Michigan.

Reproduced with permission of the copyright owner. Further reproduction prohibited without permission.