examining the relationship between registered …
TRANSCRIPT
University of Texas at TylerScholar Works at UT Tyler
Human Resource Development Theses andDissertations Human Resource Development
Fall 11-14-2017
EXAMINING THE RELATIONSHIPBETWEEN REGISTERED NURSES’TURNOVER AND THE BENEFITS OF ANAFFIRMING CLIMATE OF DIVERSITY ASMEDIATED BY WORKPLACE OUTCOMESJames Mark ClardyUniversity of Texas at Tyler
Follow this and additional works at: https://scholarworks.uttyler.edu/hrd_grad
Part of the Nursing Administration Commons, and the Training and Development Commons
This Dissertation is brought to you for free and open access by the HumanResource Development at Scholar Works at UT Tyler. It has been acceptedfor inclusion in Human Resource Development Theses and Dissertationsby an authorized administrator of Scholar Works at UT Tyler. For moreinformation, please contact [email protected].
Recommended CitationClardy, James Mark, "EXAMINING THE RELATIONSHIP BETWEEN REGISTERED NURSES’ TURNOVER AND THEBENEFITS OF AN AFFIRMING CLIMATE OF DIVERSITY AS MEDIATED BY WORKPLACE OUTCOMES" (2017). HumanResource Development Theses and Dissertations. Paper 21.http://hdl.handle.net/10950/611
EXAMINING THE RELATIONSHIP BETWEEN REGISTERED NURSES’
TURNOVER AND THE BENEFITS OF AN AFFIRMING CLIMATE OF DIVERSITY
AS MEDIATED BY WORKPLACE OUTCOMES
by
J. MARK CLARDY
A dissertation submitted in partial fulfillment
of the requirements for the degree of
Ph.D. in HRD
Department of Human Resource Development
Jerry Gilley, Ed.D, Committee Chair
College of Business and Technology
The University of Texas at Tyler
October 2017

© Copyright by J. Mark Clardy 2017
All rights reserved
Acknowledgements
My doctoral journey would not have been possible without the love, support, and
excellent marketing skills of my wife, Carla. Thank you, Annie and Josh, Evie, Alex, Ben
and James for always taking interest in my projects and asking questions about my
research. Thank you to my dissertation committee chair, Dr. Jerry Gilley, and the other
committee members, Dr. Ann Gilley, Dr. Rosemary Cooper and Dr. Colleen Marzilli, for
your insight, guidance, and encouragement. Thank you to Dr. Kim Nimon for statistical
enlightenment. Thank you to the 2014 cohort for sharing the journey with advice and
friendship. Thank you to my in-laws, Herb and Eva Hahn, for always challenging that
young boy who dated your daughter, and finally, thank you to my parents, Bill and Alice
Clardy, for giving me the foundations to enjoy life’s journey and always supporting me in
every challenge I’ve faced.
i
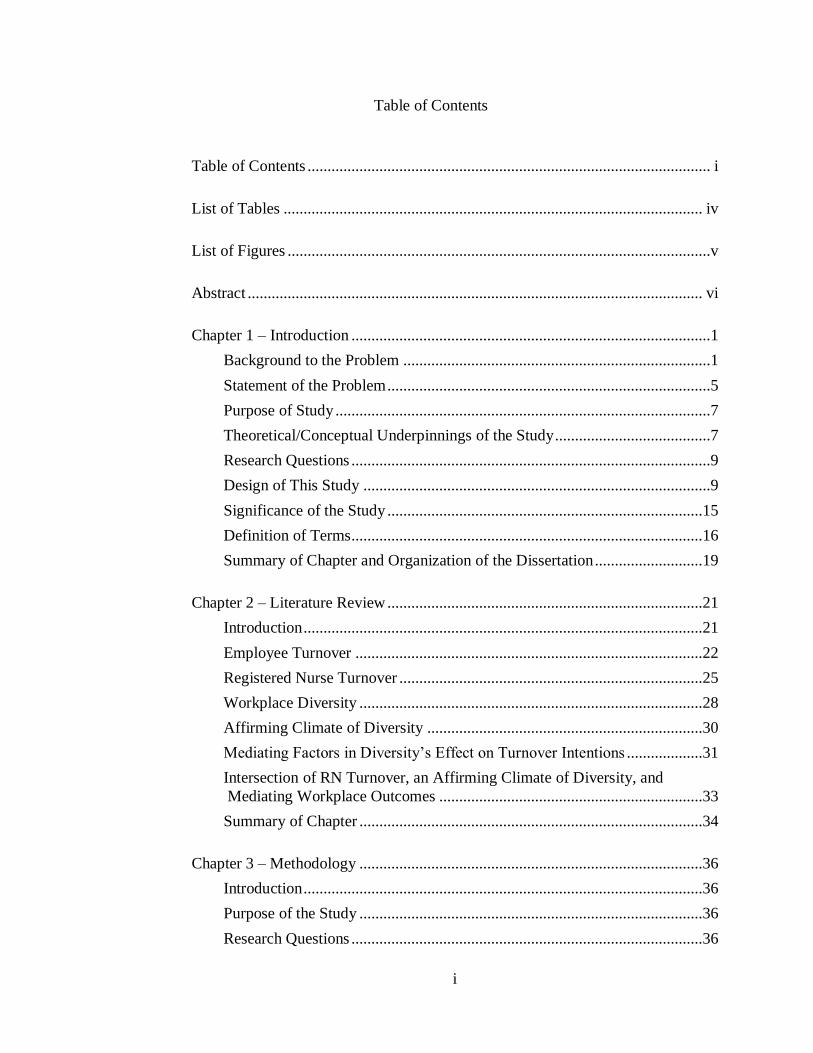
Table of Contents
Table of Contents ..................................................................................................... i
List of Tables ......................................................................................................... iv
List of Figures ..........................................................................................................v
Abstract .................................................................................................................. vi
Chapter 1 – Introduction ..........................................................................................1
Background to the Problem .............................................................................1
Statement of the Problem .................................................................................5
Purpose of Study ..............................................................................................7
Theoretical/Conceptual Underpinnings of the Study .......................................7
Research Questions ..........................................................................................9
Design of This Study .......................................................................................9
Significance of the Study ...............................................................................15
Definition of Terms........................................................................................16
Summary of Chapter and Organization of the Dissertation ...........................19
Chapter 2 – Literature Review ...............................................................................21
Introduction ....................................................................................................21
Employee Turnover .......................................................................................22
Registered Nurse Turnover ............................................................................25
Workplace Diversity ......................................................................................28
Affirming Climate of Diversity .....................................................................30
Mediating Factors in Diversity’s Effect on Turnover Intentions ...................31
Intersection of RN Turnover, an Affirming Climate of Diversity, and
Mediating Workplace Outcomes ..................................................................33
Summary of Chapter ......................................................................................34
Chapter 3 – Methodology ......................................................................................36
Introduction ....................................................................................................36
Purpose of the Study ......................................................................................36
Research Questions ........................................................................................36

II
Hypotheses .....................................................................................................37
Overview and Influence of Unpublished Survey ...........................................39
Design of the Study ........................................................................................50
Population and Sample ..................................................................................50
Instrumentation ..............................................................................................51
Data Collection Procedures............................................................................53
Data Analysis Procedures ..............................................................................54
Reliability and Validity ..................................................................................56
Limitations .....................................................................................................57
Summary of Chapter ......................................................................................57
Chapter 4 – Findings ..............................................................................................59
Data Cleaning.................................................................................................59
Demographics of Study Participants ..............................................................59
Construct Validity ..........................................................................................62
Measurement Model Fit .................................................................................65
Structural Equation Model .............................................................................69
Research Hypotheses .....................................................................................72
Summary of Chapter ......................................................................................76
Chapter 5 – Discussion ..........................................................................................78
Introduction ....................................................................................................78
Summary of Study .........................................................................................78
Findings..........................................................................................................80
Conclusions ....................................................................................................83
Implications....................................................................................................86
Limitations .....................................................................................................87
Future Research .............................................................................................88
Summary of Chapter ......................................................................................90
References ..............................................................................................................92
Appendices ...........................................................................................................112
Appendix A: Survey Items...........................................................................112
Appendix B: Research Survey Instrument ...................................................116

III
Appendix C: Permission for Use of Measurement Instrument ....................131
Appendix D: CFA Images ...........................................................................132
Appendix E: SEM Images ...........................................................................135
IV
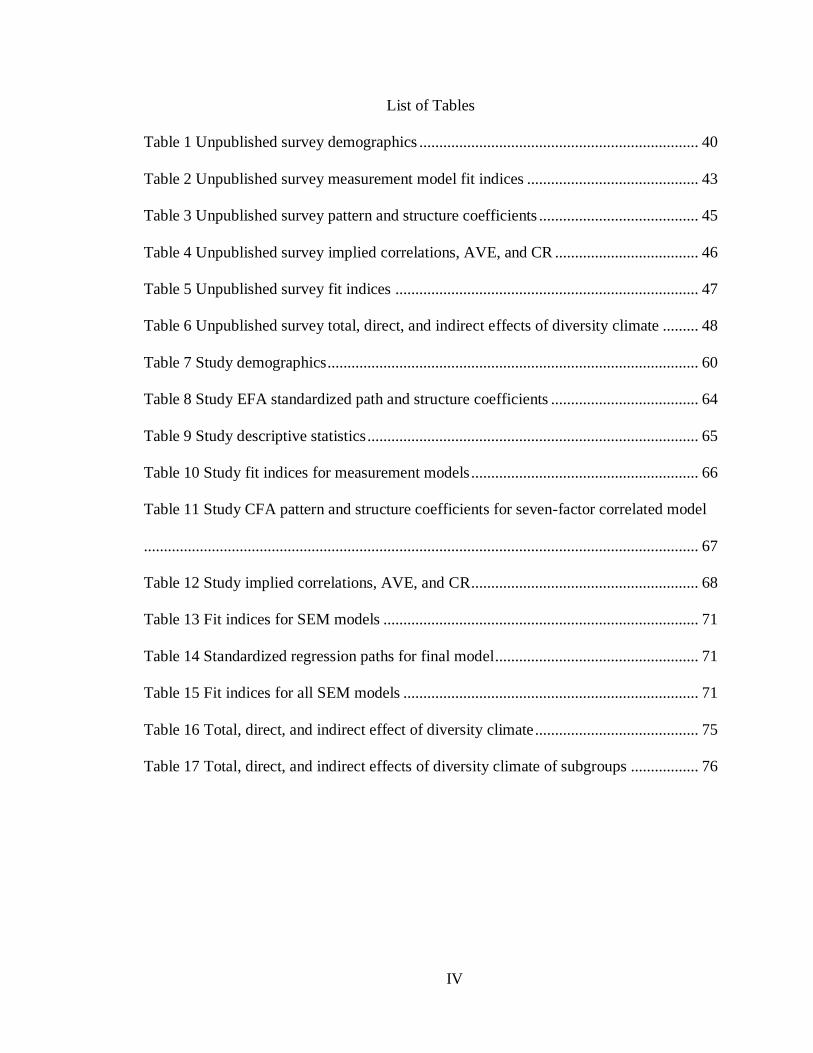
List of Tables
Table 1 Unpublished survey demographics ...................................................................... 40
Table 2 Unpublished survey measurement model fit indices ........................................... 43
Table 3 Unpublished survey pattern and structure coefficients ........................................ 45
Table 4 Unpublished survey implied correlations, AVE, and CR .................................... 46
Table 5 Unpublished survey fit indices ............................................................................ 47
Table 6 Unpublished survey total, direct, and indirect effects of diversity climate ......... 48
Table 7 Study demographics ............................................................................................. 60
Table 8 Study EFA standardized path and structure coefficients ..................................... 64
Table 9 Study descriptive statistics ................................................................................... 65
Table 10 Study fit indices for measurement models ......................................................... 66
Table 11 Study CFA pattern and structure coefficients for seven-factor correlated model
........................................................................................................................................... 67
Table 12 Study implied correlations, AVE, and CR ......................................................... 68
Table 13 Fit indices for SEM models ............................................................................... 71
Table 14 Standardized regression paths for final model ................................................... 71
Table 15 Fit indices for all SEM models .......................................................................... 71
Table 16 Total, direct, and indirect effect of diversity climate ......................................... 75
Table 17 Total, direct, and indirect effects of diversity climate of subgroups ................. 76
V
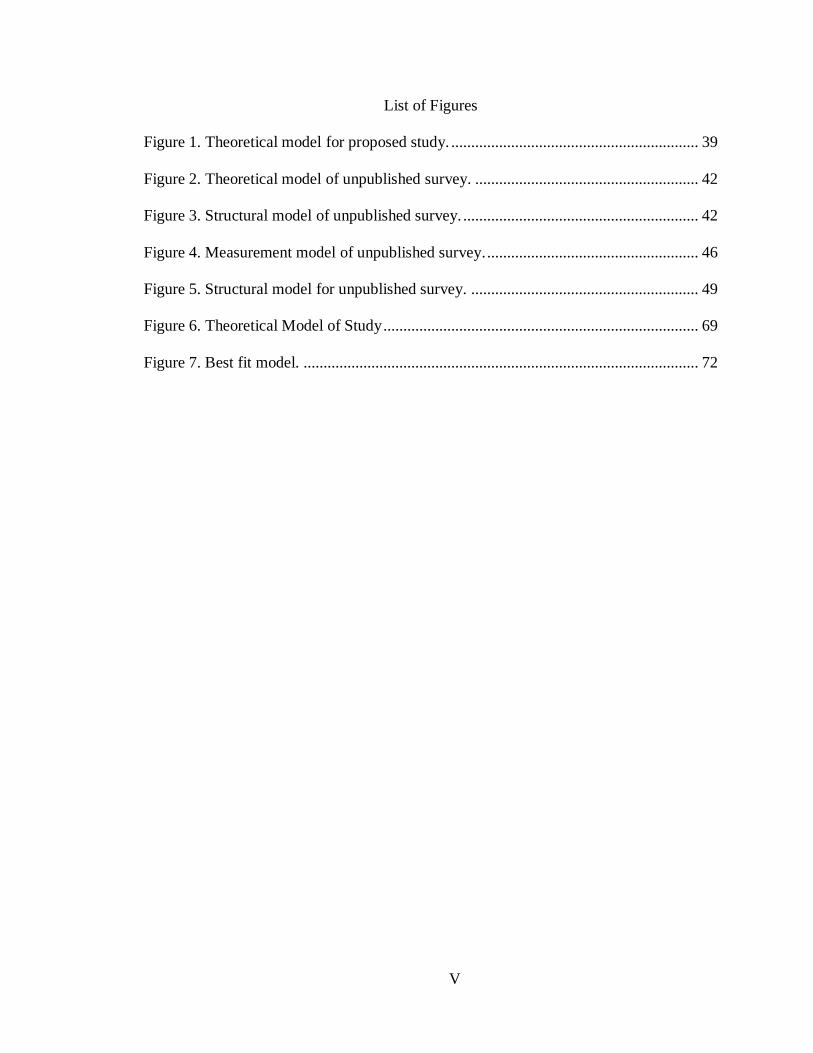
List of Figures
Figure 1. Theoretical model for proposed study. .............................................................. 39
Figure 2. Theoretical model of unpublished survey. ........................................................ 42
Figure 3. Structural model of unpublished survey. ........................................................... 42
Figure 4. Measurement model of unpublished survey. ..................................................... 46
Figure 5. Structural model for unpublished survey. ......................................................... 49
Figure 6. Theoretical Model of Study ............................................................................... 69
Figure 7. Best fit model. ................................................................................................... 72
VI
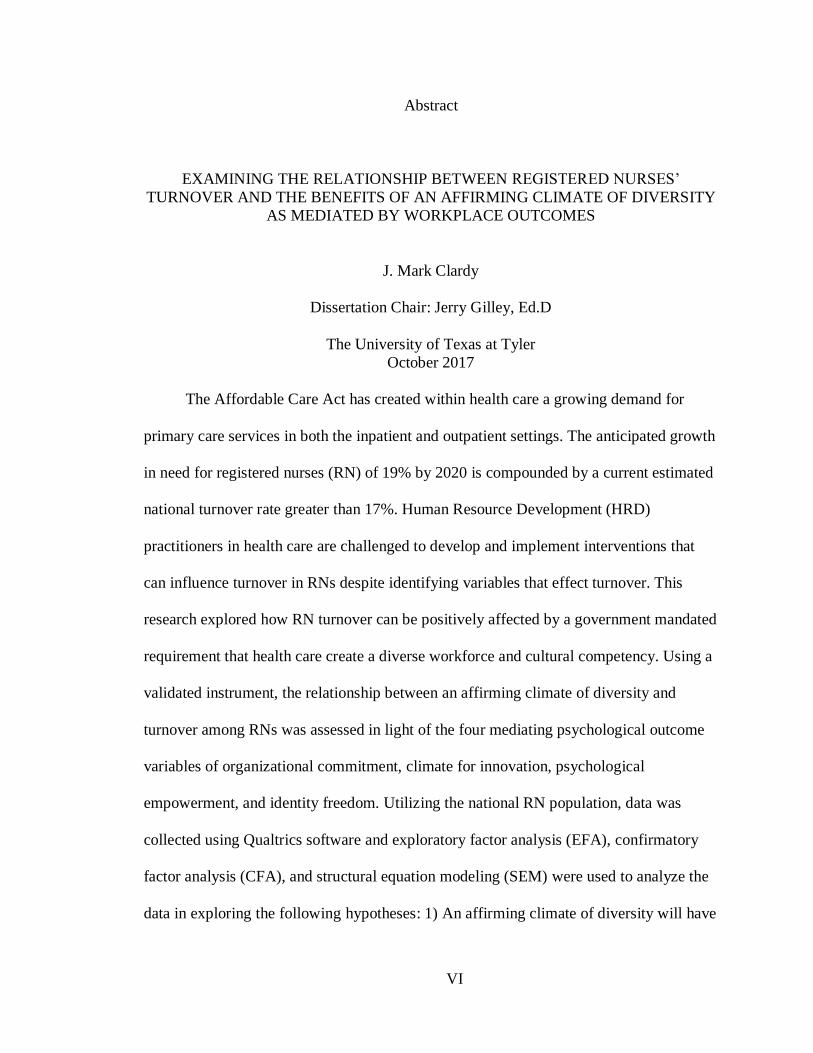
Abstract
EXAMINING THE RELATIONSHIP BETWEEN REGISTERED NURSES’
TURNOVER AND THE BENEFITS OF AN AFFIRMING CLIMATE OF DIVERSITY
AS MEDIATED BY WORKPLACE OUTCOMES
J. Mark Clardy
Dissertation Chair: Jerry Gilley, Ed.D
The University of Texas at Tyler
October 2017
The Affordable Care Act has created within health care a growing demand for
primary care services in both the inpatient and outpatient settings. The anticipated growth
in need for registered nurses (RN) of 19% by 2020 is compounded by a current estimated
national turnover rate greater than 17%. Human Resource Development (HRD)
practitioners in health care are challenged to develop and implement interventions that
can influence turnover in RNs despite identifying variables that effect turnover. This
research explored how RN turnover can be positively affected by a government mandated
requirement that health care create a diverse workforce and cultural competency. Using a
validated instrument, the relationship between an affirming climate of diversity and
turnover among RNs was assessed in light of the four mediating psychological outcome
variables of organizational commitment, climate for innovation, psychological
empowerment, and identity freedom. Utilizing the national RN population, data was
collected using Qualtrics software and exploratory factor analysis (EFA), confirmatory
factor analysis (CFA), and structural equation modeling (SEM) were used to analyze the
data in exploring the following hypotheses: 1) An affirming climate of diversity will have
VII
a negative relationship on RN turnover intentions, 2) the four psychological outcomes
variables of organizational identification, climate for innovation, psychological
empowerment, and identity freedom will mediate the overall effects of an affirming
climate of diversity on RN turnover intentions, and 3) the four psychological outcomes of
organizational identification, climate for innovation, psychological empowerment, and
identity freedom will mediate the overall effects of an affirming climate of diversity on
RN turnover intentions across demographic subgroups.
Keywords: diversity, diverse climate, turnover intention, RN turnover,
organizational identification, identity freedom, climate for innovation, psychological
empowerment,
1
Chapter 1 – Introduction
Background to the Problem
Stakeholders (insurers, hospital systems, and providers) involved in the health care
industry, which provides services to treat patients in curative, preventive, rehabilitative
and palliative care, are being forced to change how health care is delivered as a
consequence of The Affordable Care Act (“Patient Protection and Affordable Care Act, 42
U.S.C.§ 18001 et seq,” 2010). The fee-for-service model in which hospitals and providers
are paid for each service they render is being replaced by one that focuses on paying for
the prevention of illness and managing the wellness of the patient (Davis, 2014). This
refocus has created a growing demand for primary care services or those services focused
on prevention and wellness. Therefore, registered nurses (RN) who are critical to
providing preventative services as well as acute care services become essential to the
success of any effort to manage population health (Baker, 2015; Freund et al., 2015;
Gordon et al., 2014; Smolowitz et al., 2015). According to the Bureau of Labor and
Statistics, the anticipated need for RNs is expected to grow 19% by 2020 (Bureau of
Labor and Statistics, U.S. Department of Labor, 2016). However, poor health care
workforce planning, geographic misdistribution of RNs, and payment incentives not
aligned with patient management goals are preventing nursing schools from being able to
meet the need of 2020 (P. Cox, Willis, & Coustasse, 2014; MacLean et al., 2014).
Compounding any anticipated shortage of RNs is an estimated RN national
turnover rate greater than 17% with regional and specialty differences as high as 36%
(NSI Nursing Solutions, Inc., 2017). Turnover intentions of workers is an attempt to
measure whether an organization’s employees plan to leave their positions (Martin, 1979).
2
With multiple interactions and mediating effects between variables related to turnover,
researchers of nursing turnover have emphasized the role of job satisfaction in nurse
turnover over the significance of the factors of age, work shifts, and career advancement
(Applebaum, Fowler, Fiedler, Osinubi, & Robson, 2010; Hayes et al., 2012; Ma, Lee,
Yang, & Chang, 2009; Zurmehly, Martin, & Fitzpatrick, 2009). In Brewer et al.’s (2011)
synthesis of nursing turnover literature, it is determined that direct influences on nursing
turnover can be categorized into five groups: personal characteristics, work attributes,
opportunity, work attitudes, and shocks or injury. Hayes et al. (2102) more broadly
categorized these groupings into organizational and individual factors. Despite many years
of research on nursing turnover, Gilmartin’s (2013) review of the literature identified a
limited understanding of the causal explanations of voluntary nursing turnover due to the
persistent use of the Price and Mueller (1981) causal turnover model over the unfolding
turnover and job embeddedness turnover models. Gilmartin (2013) calls for nursing
research to embrace and integrate the broader literature’s models of employee turnover.
In addition to a shortage of RNs and a high national RN turnover, health care is
facing a government directed initiative to create a diverse workforce (Department of
Health and Human Services (US), Health Resources and Services Administration, 2015;
Spector, 2013; The Joint Commission, 2010). The governing agencies in health care,
because of the changing demographics in the United States, have deemed it necessary for
health care organizations to develop a diverse workforce that matches the patients being
cared for and create a cultural competency or understanding of different cultures within
that workforce (The Joint Commission, 2010).

3
From the initial immigration from Asia of the first humans to the latest influx of
immigrants fleeing persecution or seeking opportunity, the United States of America (US)
is a country of immigrants and their descendants (Frey, 2014; Hodges, 2015; Logan,
2014). Currently and historically, the European or White population has been in the
majority. With the rise in globalization and its subsequent flow of immigrants from new
areas of the world into the US and the blurring of lines between segments of the
population, the European majority is on the cusp of becoming the larger of many
minorities (Frey, 2014).
These shifts in US demographics and their effects on the workforce have been
predicted for many years with scholarly studies exploring the need for a workplace that
welcomes the existing and coming diverse workforce (T. Cox, 1994; Konrad, Pringle, &
Prasad, 2005; L. M. Shore et al., 2011). These early authors recognized that diversity or
differences in the workforce have the possibility of creating great results for a company or
creating disastrous outcomes. The determining factor for success is how the diversity is
managed. Properly managing diversity has the potential to improve a business’s bottom
line (Milliken & Martins, 1996; Page, 2007; K. Williams & O’Reilly, 1998).
Cultural and racial demographics create unique challenges for the health care
sector (Baillie & Matiti, 2013; Lowe & Archibald, 2009; McClimens, Brewster, & Lewis,
2014; Spector, 2013; D. R. Williams & Sternthal, 2010). Williams and Sternthal (2010), in
their review of racial-ethnic health disparities in the US, acknowledge that some races
have higher occurrences of particular diseases but that these statistics, in general, are not
genetically but socially driven. In the case of African Americans, decades of racial
discrimination in the delivery of health care, housing, and nutrition have created habits
4
and lifestyles that make them more susceptible to diseases that are not prevalent in the
white and socially advantaged populations (D. R. Williams & Sternthal, 2010). These
historical disparities in racial health combine with the cultural differences that are brought
into play with the growth of not simply racial minorities but cultural minorities. In order to
provide adequate health care to these populations, the providers of care need to understand
how different patients approach health and how they respond to the providers (Spector,
2013). Current research in nursing on diversity focuses on building a diverse and inclusive
workforce and creating a cultural competence or understanding of different cultures and
their approach to health (e.g., Baillie & Matiti, 2013; Diaz, Clarke, & Gatua, 2015;
Gathers, 2003; Heinrich, 2014; Millner, 2014).
Creating diverse workgroups results in ingenious ideas and solutions, better
decision making, and better understanding of coworkers because different opinions and
backgrounds will improve effectiveness (Parker, 2010; Rose, 2011). Effective
management of a diverse work environment is crucial to the success of a nursing team but
also the care of the patient. When the workplace does not support diverse employees or
opinions, results may include harassment and discrimination, turnover, and intergroup
conflict (Chrobot-Mason & Aramovich, 2013; K. Jehn, Bezrukova, & Thatcher, 2008;
McKay et al., 2007; K. T. Schneider, Hitlan, & Radhakrishnan, 2000; Singh & Selvarajan,
2013). There are many possible benefits for organizations and, for health care, benefits to
the patient of a diverse workplace. However, the mismanagement of the diverse
environment can result in negative work outcomes (K. Jehn et al., 2008; Singh &
Selvarajan, 2013).
5
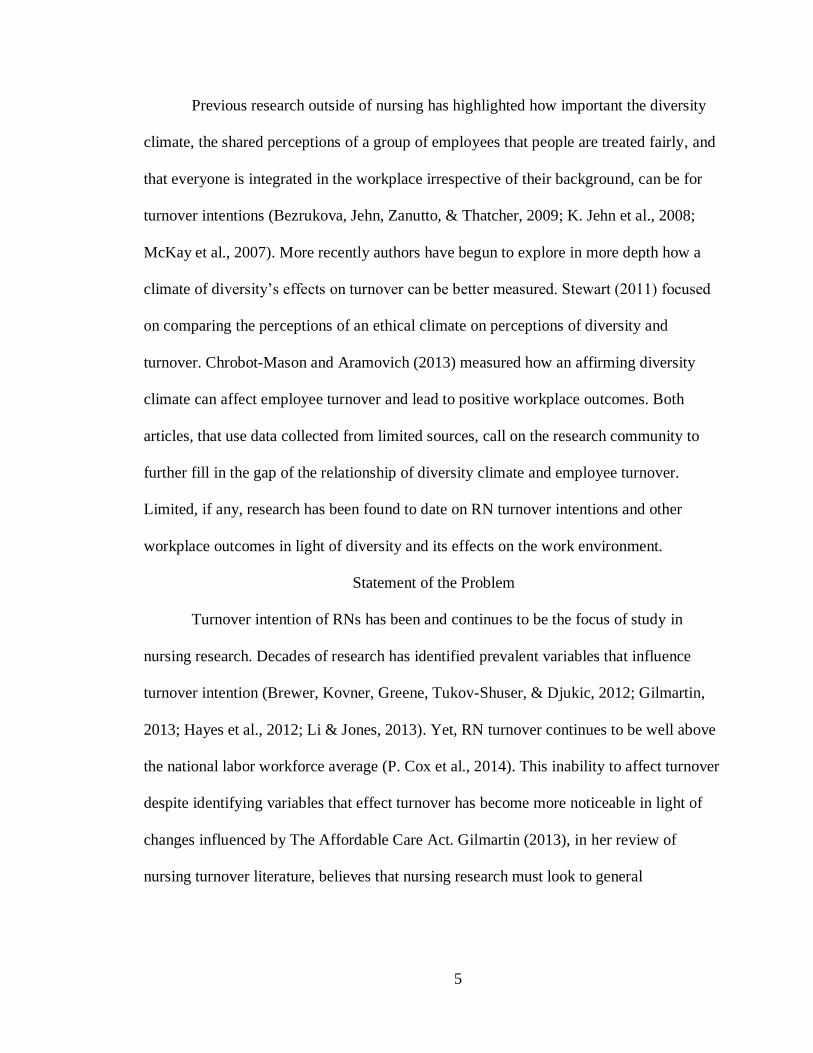
Previous research outside of nursing has highlighted how important the diversity
climate, the shared perceptions of a group of employees that people are treated fairly, and
that everyone is integrated in the workplace irrespective of their background, can be for
turnover intentions (Bezrukova, Jehn, Zanutto, & Thatcher, 2009; K. Jehn et al., 2008;
McKay et al., 2007). More recently authors have begun to explore in more depth how a
climate of diversity’s effects on turnover can be better measured. Stewart (2011) focused
on comparing the perceptions of an ethical climate on perceptions of diversity and
turnover. Chrobot-Mason and Aramovich (2013) measured how an affirming diversity
climate can affect employee turnover and lead to positive workplace outcomes. Both
articles, that use data collected from limited sources, call on the research community to
further fill in the gap of the relationship of diversity climate and employee turnover.
Limited, if any, research has been found to date on RN turnover intentions and other
workplace outcomes in light of diversity and its effects on the work environment.
Statement of the Problem
Turnover intention of RNs has been and continues to be the focus of study in
nursing research. Decades of research has identified prevalent variables that influence
turnover intention (Brewer, Kovner, Greene, Tukov-Shuser, & Djukic, 2012; Gilmartin,
2013; Hayes et al., 2012; Li & Jones, 2013). Yet, RN turnover continues to be well above
the national labor workforce average (P. Cox et al., 2014). This inability to affect turnover
despite identifying variables that effect turnover has become more noticeable in light of
changes influenced by The Affordable Care Act. Gilmartin (2013), in her review of
nursing turnover literature, believes that nursing research must look to general
6
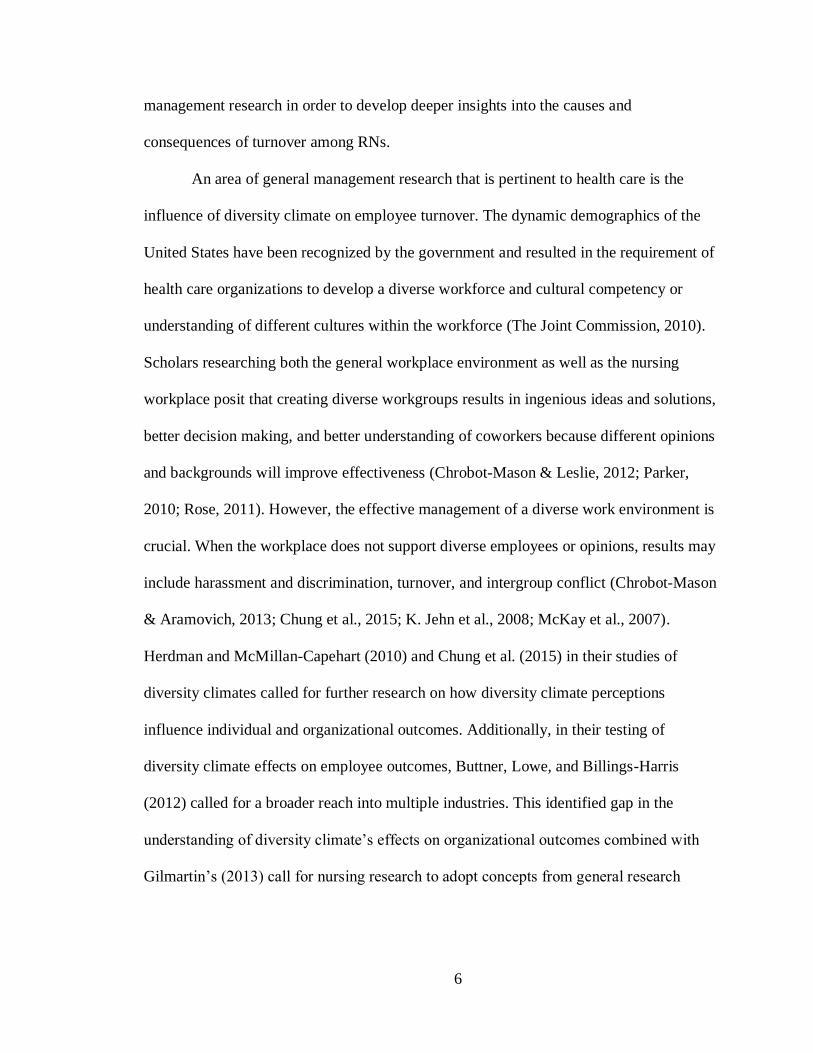
management research in order to develop deeper insights into the causes and
consequences of turnover among RNs.
An area of general management research that is pertinent to health care is the
influence of diversity climate on employee turnover. The dynamic demographics of the
United States have been recognized by the government and resulted in the requirement of
health care organizations to develop a diverse workforce and cultural competency or
understanding of different cultures within the workforce (The Joint Commission, 2010).
Scholars researching both the general workplace environment as well as the nursing
workplace posit that creating diverse workgroups results in ingenious ideas and solutions,
better decision making, and better understanding of coworkers because different opinions
and backgrounds will improve effectiveness (Chrobot-Mason & Leslie, 2012; Parker,
2010; Rose, 2011). However, the effective management of a diverse work environment is
crucial. When the workplace does not support diverse employees or opinions, results may
include harassment and discrimination, turnover, and intergroup conflict (Chrobot-Mason
& Aramovich, 2013; Chung et al., 2015; K. Jehn et al., 2008; McKay et al., 2007).
Herdman and McMillan-Capehart (2010) and Chung et al. (2015) in their studies of
diversity climates called for further research on how diversity climate perceptions
influence individual and organizational outcomes. Additionally, in their testing of
diversity climate effects on employee outcomes, Buttner, Lowe, and Billings-Harris
(2012) called for a broader reach into multiple industries. This identified gap in the
understanding of diversity climate’s effects on organizational outcomes combined with
Gilmartin’s (2013) call for nursing research to adopt concepts from general research
7
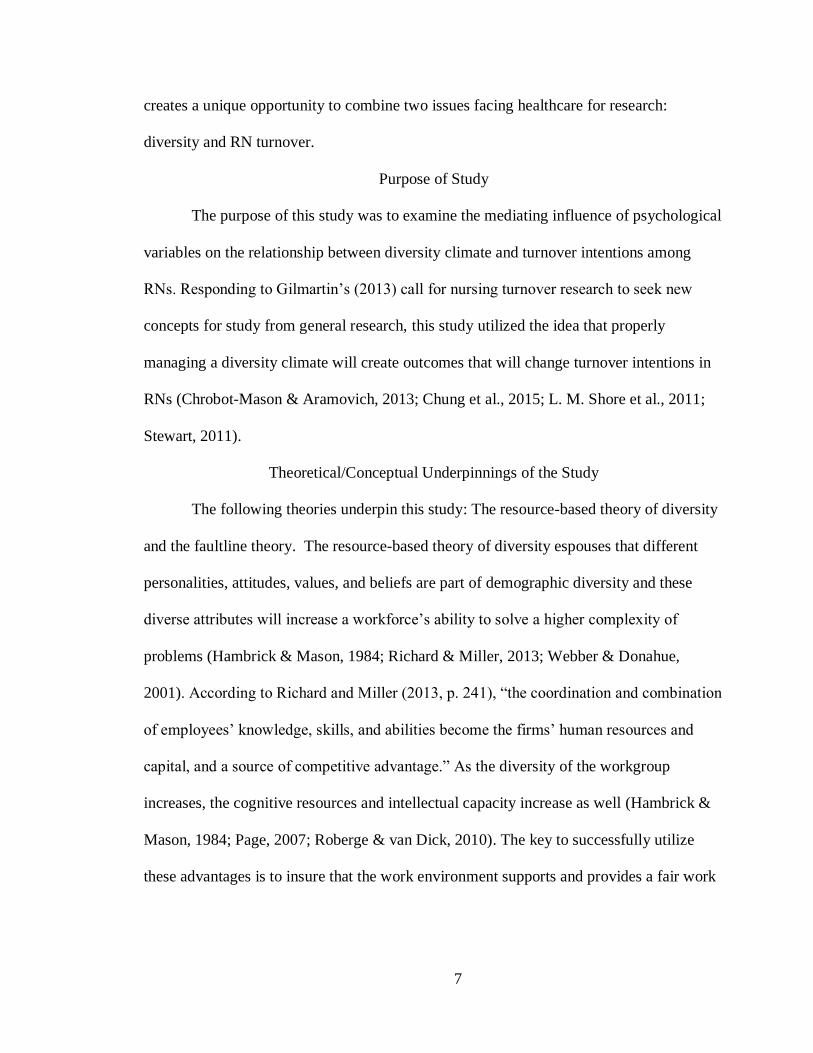
creates a unique opportunity to combine two issues facing healthcare for research:
diversity and RN turnover.
Purpose of Study
The purpose of this study was to examine the mediating influence of psychological
variables on the relationship between diversity climate and turnover intentions among
RNs. Responding to Gilmartin’s (2013) call for nursing turnover research to seek new
concepts for study from general research, this study utilized the idea that properly
managing a diversity climate will create outcomes that will change turnover intentions in
RNs (Chrobot-Mason & Aramovich, 2013; Chung et al., 2015; L. M. Shore et al., 2011;
Stewart, 2011).
Theoretical/Conceptual Underpinnings of the Study
The following theories underpin this study: The resource-based theory of diversity
and the faultline theory. The resource-based theory of diversity espouses that different
personalities, attitudes, values, and beliefs are part of demographic diversity and these
diverse attributes will increase a workforce’s ability to solve a higher complexity of
problems (Hambrick & Mason, 1984; Richard & Miller, 2013; Webber & Donahue,
2001). According to Richard and Miller (2013, p. 241), “the coordination and combination
of employees’ knowledge, skills, and abilities become the firms’ human resources and
capital, and a source of competitive advantage.” As the diversity of the workgroup
increases, the cognitive resources and intellectual capacity increase as well (Hambrick &
Mason, 1984; Page, 2007; Roberge & van Dick, 2010). The key to successfully utilize
these advantages is to insure that the work environment supports and provides a fair work
8
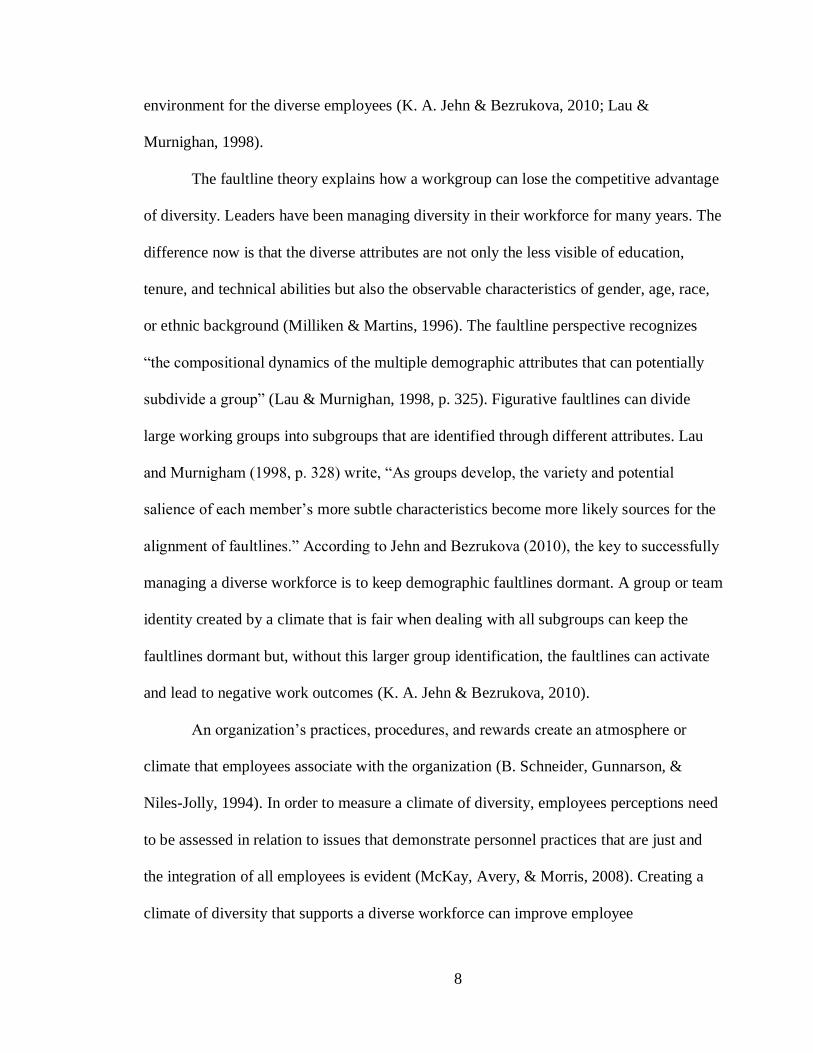
environment for the diverse employees (K. A. Jehn & Bezrukova, 2010; Lau &
Murnighan, 1998).
The faultline theory explains how a workgroup can lose the competitive advantage
of diversity. Leaders have been managing diversity in their workforce for many years. The
difference now is that the diverse attributes are not only the less visible of education,
tenure, and technical abilities but also the observable characteristics of gender, age, race,
or ethnic background (Milliken & Martins, 1996). The faultline perspective recognizes
“the compositional dynamics of the multiple demographic attributes that can potentially
subdivide a group” (Lau & Murnighan, 1998, p. 325). Figurative faultlines can divide
large working groups into subgroups that are identified through different attributes. Lau
and Murnigham (1998, p. 328) write, “As groups develop, the variety and potential
salience of each member’s more subtle characteristics become more likely sources for the
alignment of faultlines.” According to Jehn and Bezrukova (2010), the key to successfully
managing a diverse workforce is to keep demographic faultlines dormant. A group or team
identity created by a climate that is fair when dealing with all subgroups can keep the
faultlines dormant but, without this larger group identification, the faultlines can activate
and lead to negative work outcomes (K. A. Jehn & Bezrukova, 2010).
An organization’s practices, procedures, and rewards create an atmosphere or
climate that employees associate with the organization (B. Schneider, Gunnarson, &
Niles-Jolly, 1994). In order to measure a climate of diversity, employees perceptions need
to be assessed in relation to issues that demonstrate personnel practices that are just and
the integration of all employees is evident (McKay, Avery, & Morris, 2008). Creating a
climate of diversity that supports a diverse workforce can improve employee

9
measurements such as satisfaction and commitment, which, in turn, can lead to reduced
turnover (Chrobot-Mason & Aramovich, 2013; Hicks‐Clarke & Iles, 2000).
Research Questions
The following research questions guide the study:
RQ1: Does an affirming climate of diversity, as measured by equal access and
equal treatment, have a negative effect on RN turnover intentions?
RQ2: Are the effects of an affirming climate of diversity on RN turnover
intentions mediated by the psychological outcomes of organizational
identification, climate for innovation, psychological empowerment, and
identity freedom?
RQ3: Will the psychological outcomes of organizational identification, climate
for innovation, psychological empowerment, and identity freedom mediate
the overall effects of an affirming climate of diversity on RN turnover
intentions across demographic subgroups?
Design of This Study
This section contains a brief discussion of an unpublished survey conducted in
2016, which informed the design of this research study (detailed in Chapter 3). The
section will then present an overview of the design of this study, covering population and
sample, data collection and analysis procedures, reliability and validity issues, and study
limitations.
Unpublished Survey
An unpublished survey with 325 usable respondents was conducted to test the
plausibility of the research hypotheses and the validity of the proposed survey instrument
10
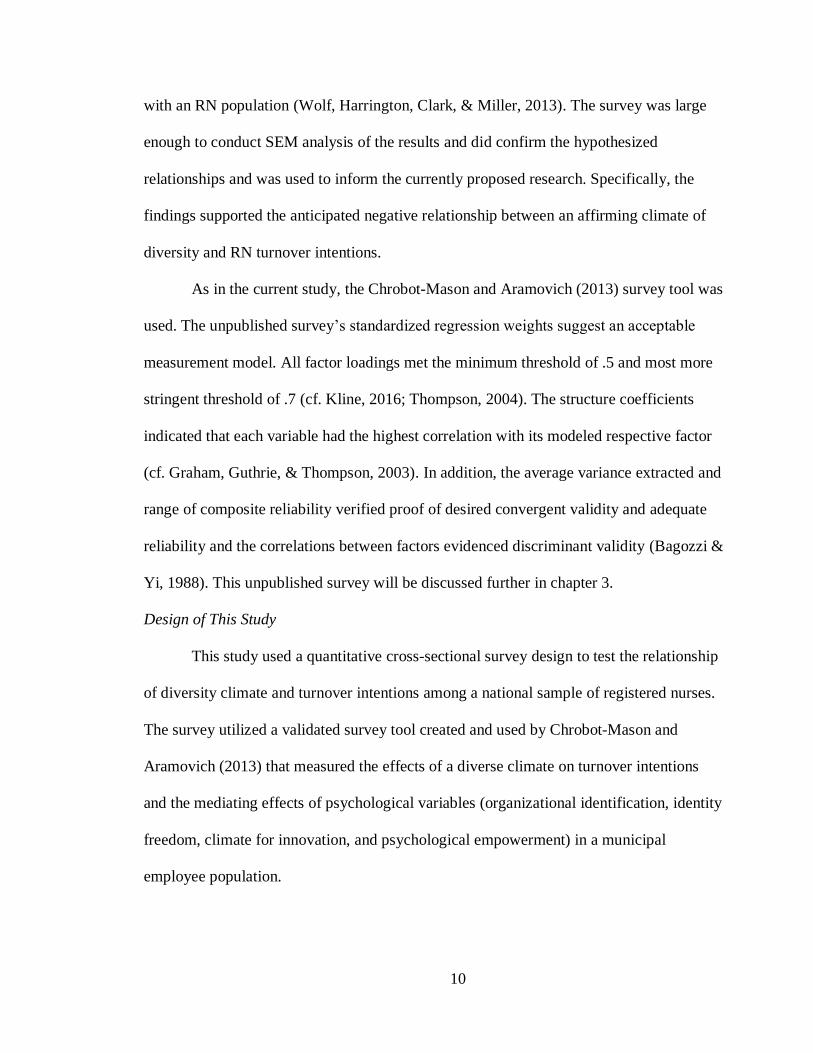
with an RN population (Wolf, Harrington, Clark, & Miller, 2013). The survey was large
enough to conduct SEM analysis of the results and did confirm the hypothesized
relationships and was used to inform the currently proposed research. Specifically, the
findings supported the anticipated negative relationship between an affirming climate of
diversity and RN turnover intentions.
As in the current study, the Chrobot-Mason and Aramovich (2013) survey tool was
used. The unpublished survey’s standardized regression weights suggest an acceptable
measurement model. All factor loadings met the minimum threshold of .5 and most more
stringent threshold of .7 (cf. Kline, 2016; Thompson, 2004). The structure coefficients
indicated that each variable had the highest correlation with its modeled respective factor
(cf. Graham, Guthrie, & Thompson, 2003). In addition, the average variance extracted and
range of composite reliability verified proof of desired convergent validity and adequate
reliability and the correlations between factors evidenced discriminant validity (Bagozzi &
Yi, 1988). This unpublished survey will be discussed further in chapter 3.
Design of This Study
This study used a quantitative cross-sectional survey design to test the relationship
of diversity climate and turnover intentions among a national sample of registered nurses.
The survey utilized a validated survey tool created and used by Chrobot-Mason and
Aramovich (2013) that measured the effects of a diverse climate on turnover intentions
and the mediating effects of psychological variables (organizational identification, identity
freedom, climate for innovation, and psychological empowerment) in a municipal
employee population.
11
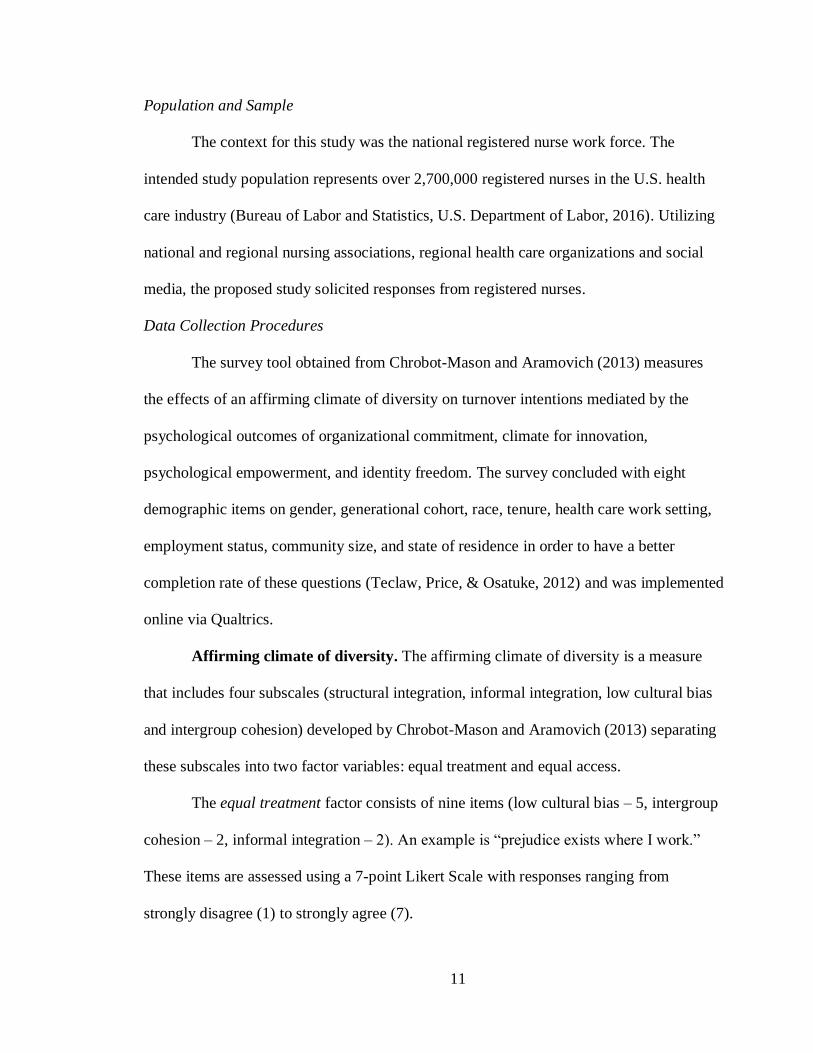
Population and Sample
The context for this study was the national registered nurse work force. The
intended study population represents over 2,700,000 registered nurses in the U.S. health
care industry (Bureau of Labor and Statistics, U.S. Department of Labor, 2016). Utilizing
national and regional nursing associations, regional health care organizations and social
media, the proposed study solicited responses from registered nurses.
Data Collection Procedures
The survey tool obtained from Chrobot-Mason and Aramovich (2013) measures
the effects of an affirming climate of diversity on turnover intentions mediated by the
psychological outcomes of organizational commitment, climate for innovation,
psychological empowerment, and identity freedom. The survey concluded with eight
demographic items on gender, generational cohort, race, tenure, health care work setting,
employment status, community size, and state of residence in order to have a better
completion rate of these questions (Teclaw, Price, & Osatuke, 2012) and was implemented
online via Qualtrics.
Affirming climate of diversity. The affirming climate of diversity is a measure
that includes four subscales (structural integration, informal integration, low cultural bias
and intergroup cohesion) developed by Chrobot-Mason and Aramovich (2013) separating
these subscales into two factor variables: equal treatment and equal access.
The equal treatment factor consists of nine items (low cultural bias – 5, intergroup
cohesion – 2, informal integration – 2). An example is “prejudice exists where I work.”
These items are assessed using a 7-point Likert Scale with responses ranging from
strongly disagree (1) to strongly agree (7).
12
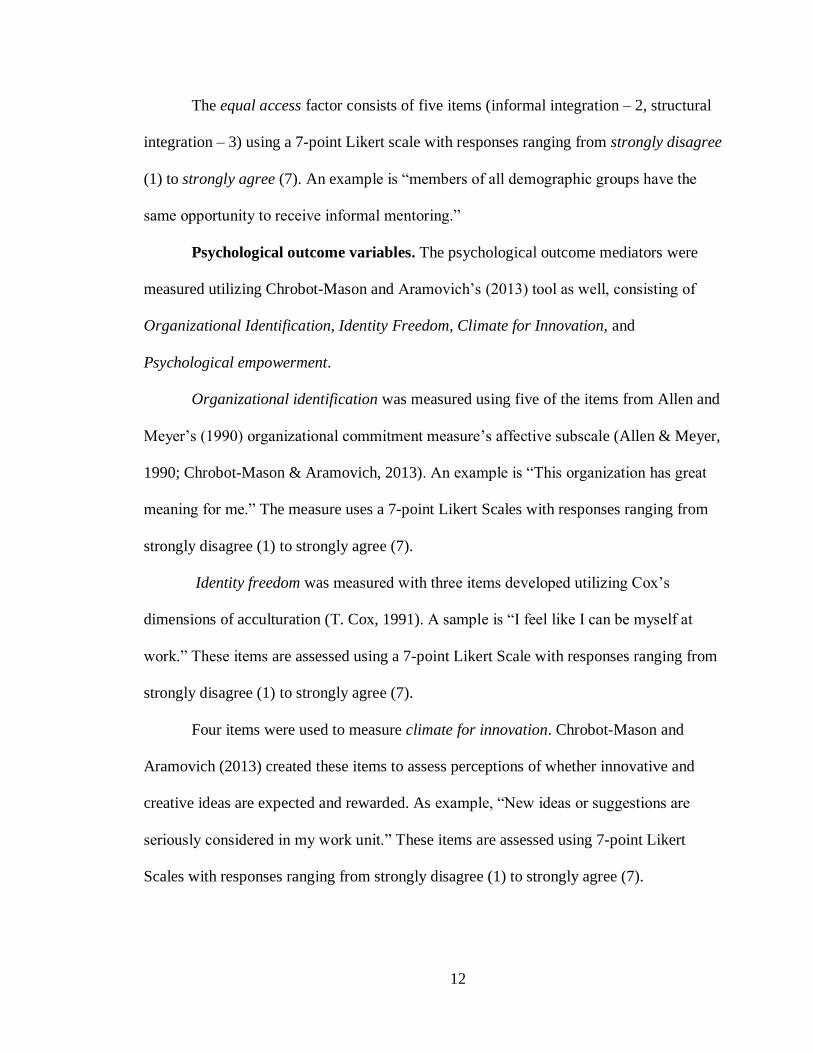
The equal access factor consists of five items (informal integration – 2, structural
integration – 3) using a 7-point Likert scale with responses ranging from strongly disagree
(1) to strongly agree (7). An example is “members of all demographic groups have the
same opportunity to receive informal mentoring.”
Psychological outcome variables. The psychological outcome mediators were
measured utilizing Chrobot-Mason and Aramovich’s (2013) tool as well, consisting of
Organizational Identification, Identity Freedom, Climate for Innovation, and
Psychological empowerment.
Organizational identification was measured using five of the items from Allen and
Meyer’s (1990) organizational commitment measure’s affective subscale (Allen & Meyer,
1990; Chrobot-Mason & Aramovich, 2013). An example is “This organization has great
meaning for me.” The measure uses a 7-point Likert Scales with responses ranging from
strongly disagree (1) to strongly agree (7).
Identity freedom was measured with three items developed utilizing Cox’s
dimensions of acculturation (T. Cox, 1991). A sample is “I feel like I can be myself at
work.” These items are assessed using a 7-point Likert Scale with responses ranging from
strongly disagree (1) to strongly agree (7).
Four items were used to measure climate for innovation. Chrobot-Mason and
Aramovich (2013) created these items to assess perceptions of whether innovative and
creative ideas are expected and rewarded. As example, “New ideas or suggestions are
seriously considered in my work unit.” These items are assessed using 7-point Likert
Scales with responses ranging from strongly disagree (1) to strongly agree (7).
13
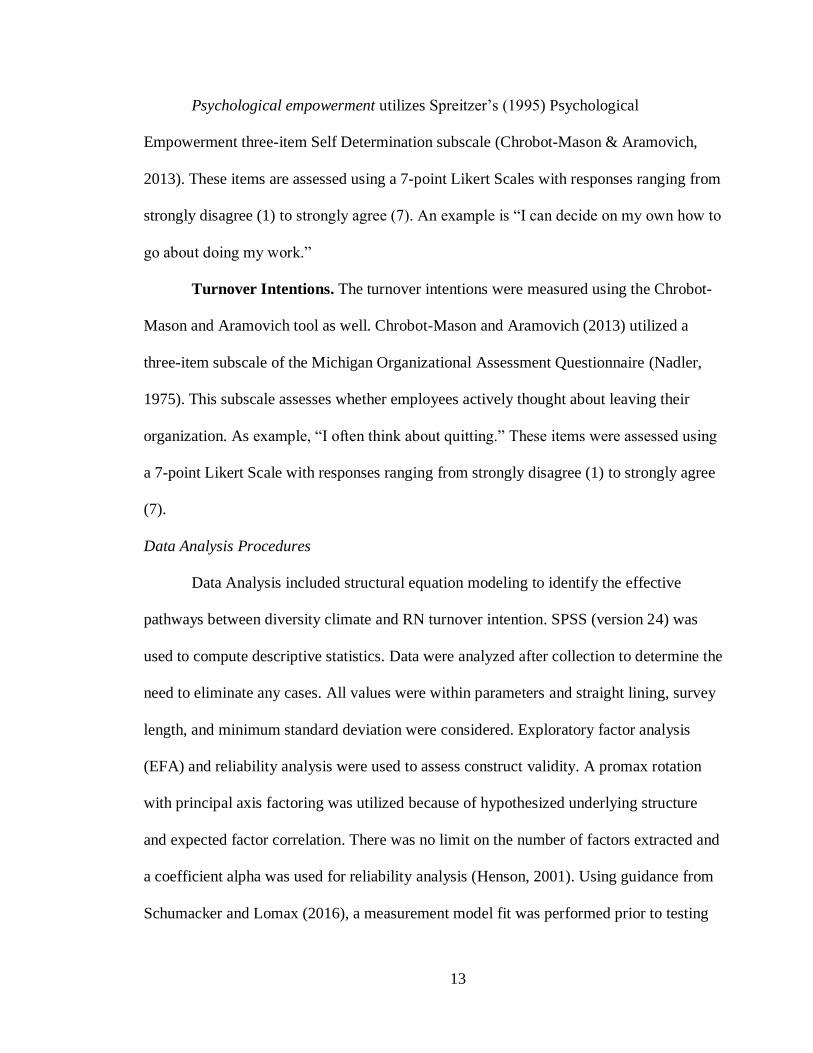
Psychological empowerment utilizes Spreitzer’s (1995) Psychological
Empowerment three-item Self Determination subscale (Chrobot-Mason & Aramovich,
2013). These items are assessed using a 7-point Likert Scales with responses ranging from
strongly disagree (1) to strongly agree (7). An example is “I can decide on my own how to
go about doing my work.”
Turnover Intentions. The turnover intentions were measured using the Chrobot-
Mason and Aramovich tool as well. Chrobot-Mason and Aramovich (2013) utilized a
three-item subscale of the Michigan Organizational Assessment Questionnaire (Nadler,
1975). This subscale assesses whether employees actively thought about leaving their
organization. As example, “I often think about quitting.” These items were assessed using
a 7-point Likert Scale with responses ranging from strongly disagree (1) to strongly agree
(7).
Data Analysis Procedures
Data Analysis included structural equation modeling to identify the effective
pathways between diversity climate and RN turnover intention. SPSS (version 24) was
used to compute descriptive statistics. Data were analyzed after collection to determine the
need to eliminate any cases. All values were within parameters and straight lining, survey
length, and minimum standard deviation were considered. Exploratory factor analysis
(EFA) and reliability analysis were used to assess construct validity. A promax rotation
with principal axis factoring was utilized because of hypothesized underlying structure
and expected factor correlation. There was no limit on the number of factors extracted and
a coefficient alpha was used for reliability analysis (Henson, 2001). Using guidance from
Schumacker and Lomax (2016), a measurement model fit was performed prior to testing

14
theoretical and alternative models. Utilizing Harman’s single-factor test, common method
variance was analyzed (cf. Iverson & Maguire, 2000; Podsakoff, MacKenzie, Lee, &
Podsakoff, 2003). The measurement model and theoretical models were assessed utilizing
IBM ® SPSS ® Amos 24.0.0, measuring Chi-square, degrees of freedom, root measure
square error approximation (RMSEA), standardized root mean square (SRMR),
comparative fit index (CFI), Akaike information criterion (AIC), Bayesian information
criterion (BIC), and standardized residual covariance (SRC).
Reliability and Validity
Prior to testing theoretical and alternative models a measurement model fit was
assessed. Common method variance was analyzed using the Harman’s single-factor test
(cf. Iverson & Maguire, 2000; Podsakoff et al., 2003). Maximum likelihood was used for
testing multivariate normality. Confirmatory Factor Analysis (CFA) was used to
determine composite reliabilities, communalities, and the percentage of average variance
extracted for all loadings to test for validity and reliability (cf. Graham et al., 2003; Kline,
2016; Thompson, 2004).
Limitations
Even though every effort was made to have as accurate and generalizable data as
possible, there is still the possibility of limitations that must be recognized. Common
method variance is possible because of self-reported data (Podsakoff et al., 2003). Yet,
Doty and Glick (1998) claim that when common method variance introduces bias it rarely
will impact a study’s findings. Also of note is the risk of possible other explanations of
identified relationships beyond what is considered in a cross-sectional study (Bryman &
Bell, 2011).
15
Significance of the Study
This study contributes to the field of human resource development by further
exploring and supporting the theory that when diversity is managed well and management
practices are identified by a diverse workforce as fair, employees are less likely to leave an
employer. In addition, this study will contribute to nursing research as well. Although
general research has begun to explore the relationship of a diversity climate on turnover
intentions, limited, if any, similar research has been found to date in RN turnover.
Gonzalez and DeNizi (2009), when discussing the benefits of a diverse workplace
environment on organizational effectiveness, calls on scholars to explore the relationship
between diversity climate and workplace diversity and how these climates are managed.
Authors such as Chrobot-Mason and Aramovich (2013) have attempted to fill this gap in
literature and, in turn, called for further research. In addition, nursing research into
turnover has identified a gap due to predominantly focusing on one theory of turnover and
calls on further research to borrow from the general literature on turnover to adopt newer
theories for explaining RN turnover (Gilmartin, 2013). This study attempts to further fill
these identified gaps in literature.

16
Definition of Terms
Acculturation – Acculturation is the different ways in which two groups adapt to each
other, resolving cultural differences (T. Cox, 1991).
Climate for Innovation – Climate for Innovation is when employees perceive that
innovative and creative ideas are valued and encouraged (Chrobot-Mason &
Aramovich, 2013).
Cultural Bias – Cultural Bias is prejudice and discrimination based on one’s cultural
group identity (T. Cox, 1991).
Cultural Competency – Cultural competency in the context of health care is an ability to
understand and respond effectively to the cultural and linguistic needs brought to
the health care experience (Spector, 2013).
Department of Health and Human Services – The Department of Health and Human
Services is the U.S. governmental agency tasked with providing for effective
health and human services and fostering advances in medicine, public health, and
social services (Department of Health and Human Services (US), Health Resources
and Services Administration, 2015).
Diverse Climate – Diverse Climate is a workplace environment in which employees
perceive that fair personnel practices are used and there is integration of
underrepresented employees (Gelfand, Nishii, Raver, & Schneider, 2007; McKay
et al., 2008).
Diversity – Diversity is “the state of having multiple groups and viewpoints that represent
the full range of cultures in a society” (Rector, Johnson, Malanij, & Fumic, 2011).
17
Identity Freedom – Identity Freedom is how free an employee feels to express their
identity at work (Chrobot-Mason & Aramovich, 2013).
Informal Integration – Informal integration is the inclusion of all members, including
minority-culture members, in informal networks and activities occurring outside
the workplace (T. Cox, 1991)
Intergroup Conflict – Intergroup Conflict is the power struggles, friction, and tension
between cultural groups (T. Cox, 1991).
Minority Group – This can be either a group of employees that make up less than half of a
population or a group “with a lower position in a societal hierarchy because they
have less power and privilege and more disadvantages” (Rector et al., 2011).
Organizational Identification – Organizational Identification is the feelings of belonging
commitment, and loyalty to an organization (T. Cox, 1991)
Psychological Empowerment – Psychological Empowerment is the extent to which
employees perceive that they are empowered at work (Chrobot-Mason &
Aramovich, 2013).
Primary Care – Primary care is the comprehensive initial encounter and continuing care
for patients with any undiagnosed sign, symptom, or health concern (American
Academy of Family Physicians, 2015).
Race – Race is a designation used to identify and group of people by external appearance,
such as skin color, shape of the eyes, or hair texture (Rector et al., 2011).
Structural Integration – Structural Integration is the representation of different cultural
groups in a single organization (T. Cox, 1991).
18
The Affordable Care Act – The Patient Protection and Affordable Care Act of 2010, which
for the purposes of this study, changes the paradigm in how health care in the
United States is delivered (“Patient Protection and Affordable Care Act, 42
U.S.C.§ 18001 et seq,” 2010).
The Joint Commission – The Joint Commission is the accrediting organization for health
care organizations in the United States (The Joint Commission, 2010).
Turnover and Turnover Intention – Turnover intention (for this study) is a measurement of
an organization’s employees plans to leave their jobs (Medina, 2012).
19
Summary of Chapter and Organization of the Dissertation
Chapter 1 provided a background to the problem, the statement of the problem, and
the purpose of this study. The research questions of the study were outlined, following an
explanation of the theoretical and conceptual underpinnings. The influence of an
unpublished survey in 2016 was presented followed by the design of the study. The
significance of the study and possible limitations were discussed, concluding with
definitions of terms used throughout this proposal.
Chapter 2 contains a review of the literature relevant to this study. The literature
domains reviewed include registered nurse turnover, workplace diversity, mediating
factors on diversity’s effect on employee turnover and the intersection of research on RN
turnover, diversity climate, and mediating workplace outcomes. The chapter concludes
with a summary.
Chapter 3 presents a more thorough description of the design of the study. The
research hypotheses are presented again along with a discussion of the population and
sample, the approaches to data collection and analysis, and details of the measurement
instrument. In addition, issues related to reliability and validity are discussed, concluding
with a summary of the chapter.
Chapter 4 describes the analyzed results of the data collected for this study. The
data cleaning process as well as the demographics and descriptive statistics related to the
data are shared. Construct validity and measurement model fit are provided along with
assumption and reliability testing results. To test the theoretical structural model,
hierarchical structural equation modeling (SEM) was performed to develop the most
parsimonious and best fitting structural model. The results and the fit indices of this
20
process are presented. Finally, the testing and analysis of the hypothesized interactions is
presented and explained.
Chapter 5 is a discussion of the results of the analysis, findings, and conclusions of
the study. Beginning with a summary of the study, the findings from the data analysis are
discussed in light of literature reviewed and the unpublished survey that was performed
prior to this study. Knowledge gained from this study and its implications for theory are
offered with their possible implications for RN staffing, human resource development, and
the broader business context. Followed by a summary, possible future research is
proposed.
21
Chapter 2 – Literature Review
Introduction
The literature domains relevant to exploring the relationship between registered
nurses’ turnover and the benefits of an affirming climate of diversity as mediated by
psychological outcomes are organized into seven sections. The first section reviews the
literature relevant to employee turnover. The next section reviews the literature on
employee turnover within the context of registered nurses. The literature relevant to
workplace diversity is reviewed in the third section. The fourth section reviews the idea of
an affirming climate of diversity. The fifth section reviews the mediating factors on
diversity’s effect on turnover intentions. The final section reviews the intersection of
research on RN turnover, an affirming climate of diversity, and mediating workplace
outcomes. In closing, the final section presents a summary of the chapter.
The University of Texas at Tyler Robert Muntz Library and the Baylor Scott &
White Health Richard D. Haines Medical library were used to conduct this search.
Databases including PsycINFO, Emerald, Business Source Complete, Academic Search
Complete, PubMED/Medline, ProQuest, U.S. Census Bureau, CINAHL Complete, and
Springer Link were used to search for peer reviewed journal articles, e-books, literature
reviews, dissertations, government websites, and industry publications. The following
keyword searches were used individually and in combination: turnover, turnover intention,
registered nurse turnover, U.S. demographics, U.S. minorities, diversity, diversity in
health care, cultural approaches to health, benefits of diversity in the workplace, diverse
climate.
22
Employee Turnover
The earliest model of turnover was conceptualized by March and Simon (1958) in
their study of organizations, which identified movement ease and movement desirability
as predictors for leaving a job. Newer terms for these predictors are job opportunities and
job dissatisfaction in which dissatisfaction with one’s job leads to leaving but job
opportunities will affect the relationship of dissatisfaction and quitting (Price & Mueller,
1981). Subsequent research identified that contextual conditions (e.g., management
actions, hiring and pay practices) and attributes of the job (e.g., autonomy, embeddedness)
influence employee attitudes, which shape intentions to leave (Hom, Mitchell, Lee, &
Griffeth, 2012). In addition, research also identified that indirect antecedents can affect an
employee’s intention to leave: personal determinants such as personality, cognitive ability,
and job fit and cognitive states such as stress, burnout, and perceived organizational
support (Chatman, 1991; Maltarich, Nyberg, & Reilly, 2010; Sheridan & Abelson, 1983;
Lynn M. Shore & Tetrick, 1991; Swider & Zimmerman, 2010; Zimmerman, 2008). Price
and Mueller (1981) looked outside the boundaries of business and identified ties within
the community as deterring antecedents to turnover.
The further developments of the original March and Simon (1958) model failed to
explain all turnover (Hom et al., 2012). As a result, Lee and Mitchell (1994) put forth the
idea that intention to leave follows different pathways that are activated by “a shock to the
system” or events that precede deliberations to leave (Lee & Mitchell, 1994, p. 60).
Following up on Lee and Mitchell’s (1994) work, subsequent researchers identified
23
motivational influences on why a person stays in their job or leaves (Maertz & Campion,
2004). These influences or forces include:
• Affective. Current response to an organization or job satisfaction
• Contractual. Desire to fulfill perceived obligations in psychological
contract
• Constituent. Commitment to others in the organization
• Alternative. Perceived job opportunities
• Calculative. Anticipated benefits of continued association
• Normative. External pressures to stay or leave or remain
• Behavioral. Explicit or psychological costs of quitting
• Moral. Consistency between behavior and values about quitting (Maertz &
Campion, 2004, p. 570)
This work has allowed researchers to consider causes for departure other than the original
attitudes (job satisfaction) and alternatives (job opportunities) of March and Simon (2014).
Holtom, Mitchell, Lee, and Eberly (2008), in a review of voluntary turnover
literature, created a conceptual framework or roadmap for understanding turnover,
recognizing that there is a time factor involved in the structure. The first stage of the
model includes individual differences (factors that affect the ease of movement between
jobs) and the nature of the job (variation in the job that precede work attitudes). The
second stage contains traditional attitudes, newer attitudes, organizational context/macro
level, and person-context interface, focusing on the nature of a work environment and an
individual’s perceptions and attitudes about that environment at an organizational level
and individual level. The third stage involves withdrawal conditions (thoughts of leaving)
24
and alternatives (perceived job availability), deciding whether to leave or not. The fourth
stage is withdrawal behaviors or the act of searching for a job alternative. In the fifth
stage, withdrawal and individual performance are affected when the employee’
performance changes and withdrawal behaviors such as tardiness or leave of absence
occur, which lead to the final stage of turnover. Also in the fifth stage is job search
gateways or events that can lead to an impulsive turnover action. The actual turnover stage
creates outcomes for both the organization (human capital loss, organization performance)
and the individual (stress of new job, job satisfaction in new job).
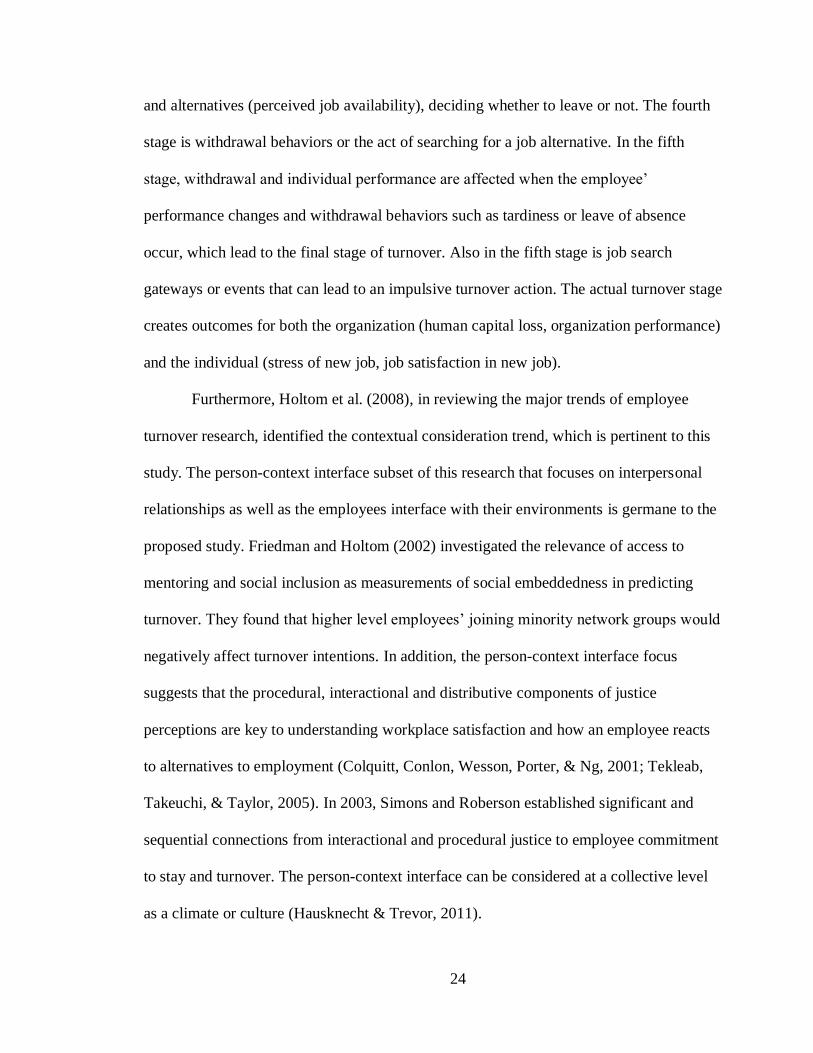
Furthermore, Holtom et al. (2008), in reviewing the major trends of employee
turnover research, identified the contextual consideration trend, which is pertinent to this
study. The person-context interface subset of this research that focuses on interpersonal
relationships as well as the employees interface with their environments is germane to the
proposed study. Friedman and Holtom (2002) investigated the relevance of access to
mentoring and social inclusion as measurements of social embeddedness in predicting
turnover. They found that higher level employees’ joining minority network groups would
negatively affect turnover intentions. In addition, the person-context interface focus
suggests that the procedural, interactional and distributive components of justice
perceptions are key to understanding workplace satisfaction and how an employee reacts
to alternatives to employment (Colquitt, Conlon, Wesson, Porter, & Ng, 2001; Tekleab,
Takeuchi, & Taylor, 2005). In 2003, Simons and Roberson established significant and
sequential connections from interactional and procedural justice to employee commitment
to stay and turnover. The person-context interface can be considered at a collective level
as a climate or culture (Hausknecht & Trevor, 2011).
25
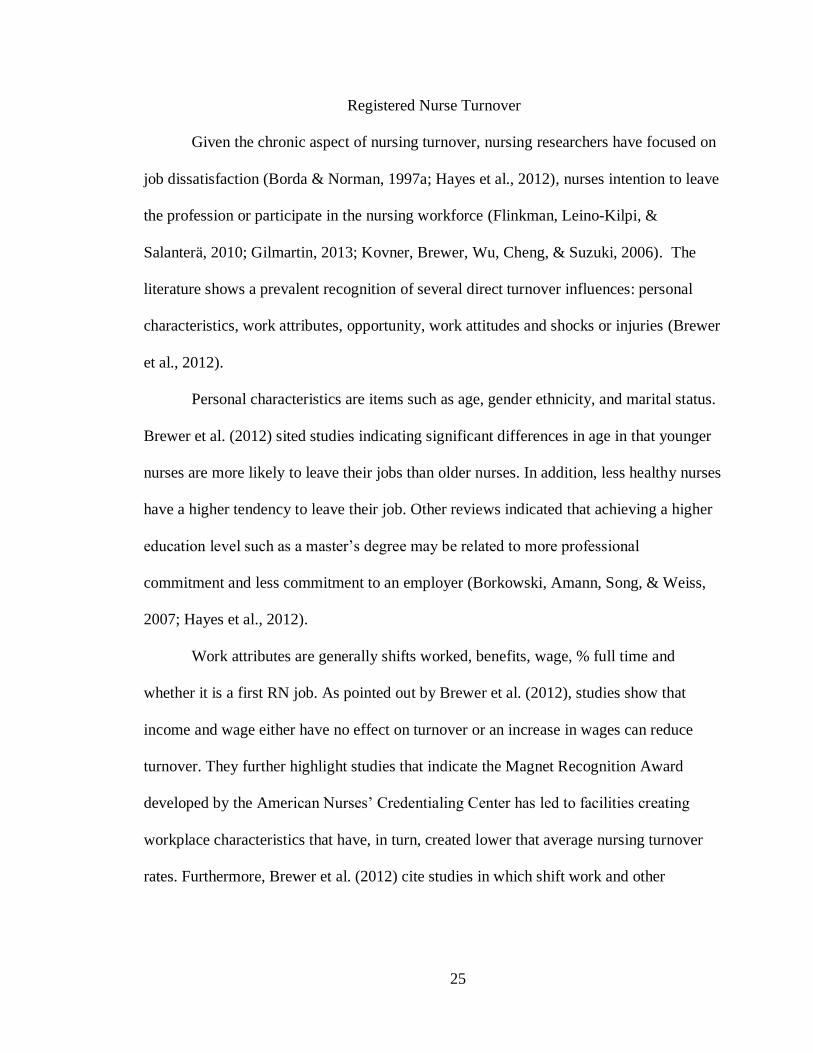
Registered Nurse Turnover
Given the chronic aspect of nursing turnover, nursing researchers have focused on
job dissatisfaction (Borda & Norman, 1997a; Hayes et al., 2012), nurses intention to leave
the profession or participate in the nursing workforce (Flinkman, Leino-Kilpi, &
Salanterä, 2010; Gilmartin, 2013; Kovner, Brewer, Wu, Cheng, & Suzuki, 2006). The
literature shows a prevalent recognition of several direct turnover influences: personal
characteristics, work attributes, opportunity, work attitudes and shocks or injuries (Brewer
et al., 2012).
Personal characteristics are items such as age, gender ethnicity, and marital status.
Brewer et al. (2012) sited studies indicating significant differences in age in that younger
nurses are more likely to leave their jobs than older nurses. In addition, less healthy nurses
have a higher tendency to leave their job. Other reviews indicated that achieving a higher
education level such as a master’s degree may be related to more professional
commitment and less commitment to an employer (Borkowski, Amann, Song, & Weiss,
2007; Hayes et al., 2012).
Work attributes are generally shifts worked, benefits, wage, % full time and
whether it is a first RN job. As pointed out by Brewer et al. (2012), studies show that
income and wage either have no effect on turnover or an increase in wages can reduce
turnover. They further highlight studies that indicate the Magnet Recognition Award
developed by the American Nurses’ Credentialing Center has led to facilities creating
workplace characteristics that have, in turn, created lower that average nursing turnover
rates. Furthermore, Brewer et al. (2012) cite studies in which shift work and other

26
scheduling issues interfere with family responsibilities, resulting in nurses leaving their
jobs.
Opportunity relates to whether there are local or non-local opportunities, how
many hospital beds per 1,000 population, unemployment create and whether they’re in a
large metropolitan statistical area. A perceived abundance of opportunities is more
important than actual job opportunities in creating nursing turnover (Brewer et al., 2012).
Logically, high unemployment rates will decrease turnover and low unemployment rates
will increase it. The more job opportunity there is the higher the turnover rate will be.
Price and Mueller (1981) identified work attitudes, including job satisfaction,
organization commitment, job involvement, stress, and well-being, as antecedents of RN
turnover or nature of the job as a factor influencing nursing turnover. Morrell (2005)
analyzes the shocks that influence nurses and identifies three: 1) work related events that
are unexpected, negative and affect other workers (denied shift change, needle sticks,
verbal abuse by physicians or patients); 2) unexpected, positive, personal events that leave
the nurse no choice but to leave (pregnancy, moving with spouse); 3) unfolding events that
may be avoidable or unavoidable (lack of competent nursing staff on a shift, understaffed
units, lack of respect for front line nurses).
Another conceptual approach posits that nursing duties are inherently stressful and
considers the influence of personal experiences of stress a work on RN job satisfaction,
organizational commitment and intention to leave: The anticipated turnover model
(Hinshaw & Atwood, 1984; Hinshaw, Smeltzer, & Atwood, 1987). The anticipated
turnover model uses organizational and individual factors to create a five-stage linked
causal turnover model: 1) job mobility, 2) group cohesion and job stress at work, 3)

27
organizational satisfaction and professional job satisfaction, 4) anticipated turnover, and 5)
actual turnover. This model consolidates individuals’ attitudes about work stress as a
component leading to intention to leave and actual turnover (Gilmartin, 2013).
Borda and Norman’s (1997a) absence and turnover model of RN turnover submits
the theory of relationships amid job satisfaction, absence, intent to stay, pay, opportunity
for other employment, and kinship responsibilities. This theory addresses the correlation
between family responsibilities and job satisfaction and RN’s voluntary absences from
work (Gilmartin, 2013). The study associated with this theory submits that in some cases
absenteeism may, instead of being a symptom of job withdrawal may be one of competing
work-family demands (Borda & Norman, 1997b).
Introduced in nursing literature by Holtom and O’Neill (2004), the job
embeddedness model views job embeddedness as a vital mediating construct between
specific off-the-job and on-the-job factors promoting employee retention. This theory has
been used to understand retention behavior of nurses working in a rural setting (Stroth,
2010) and, in particular, RNs (Reitz, Anderson, & Hill, 2010). The Reitz et al. (2010)
study found that 24.6 % of the variance in intent to stay was accounted for by job
embeddedness.
Despite the knowledge evidenced in the research, the usefulness has proven weak.
Turnover of RNs remains high and is getting worse (Bureau of Labor and Statistics, U.S.
Department of Labor, 2016). According to Gilmartin (2013), the understanding of why
nurses voluntarily leave their jobs is limited because the conceptual models developed to
account for the antecedents to nursing turnover are not strongly developed. Price and
Mueller (1981) developed their causal turnover model using an all nurse population. This

28
fact seems to have created a persistent use of the causal model over other models
advanced in the general literature (Gilmartin, 2013).
Workplace Diversity
In the early 1990s, predictions of dramatic shifts in the demographics of the
workforce have lead researchers to call on organizations to create work environments that
value and support diverse workers (e.g., Chrobot-Mason, 2012; T. Cox, 1994; Konrad et
al., 2005; McKay et al., 2007). This diversity in the workplace refers to the many
differences between people in an organization, encompassing many characteristics to
include race, gender, ethnic group, age personality, cognitive style, tenure, and function
within the organization (Greenberg, 2004). Researchers such as Cox and Blake (1991)
have identified how managing diversity in the workplace can create a competitive
advantage for an organization.
Resource-based view of diversity
The resource-based view of diversity is a theory that explains how the proper
management of diversity in the workplace can create positive outcomes for an
organization, making diversity a competitive advantage (T. H. Cox & Blake, 1991). The
theory adheres to the belief that demographic diversity is accompanied by a wide range of
attributes like personality, beliefs, attitudes, and values (Webber & Donahue, 2001). With
the increase of this diversity comes an increase in the workgroups intellectual resources
and skills that will enable them to resolve problems of higher complexity (Hambrick &
Mason, 1984; Page, 2007; Roberge & van Dick, 2010). The key to the success of the
diverse workplace is the management of it and the creation of an environment that is
supportive of the diversity. In addition to advantages in the areas of problem-solving,
29
system flexibility, and creativity, Cox and Blake (1991) further expound that such a well-
managed environment will help an organization avoid possible employee turnover costs,
enhance resource acquisition efforts, and contribute to marketing efforts, particularly in a
multi-national environment.
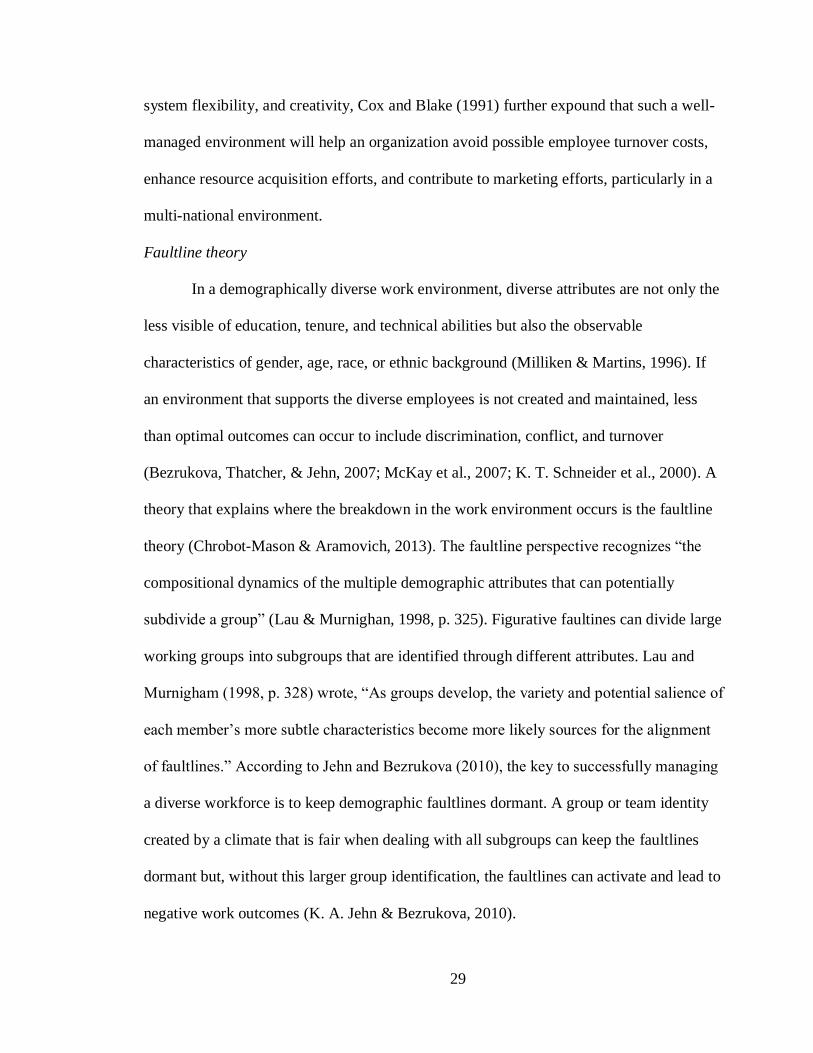
Faultline theory
In a demographically diverse work environment, diverse attributes are not only the
less visible of education, tenure, and technical abilities but also the observable
characteristics of gender, age, race, or ethnic background (Milliken & Martins, 1996). If
an environment that supports the diverse employees is not created and maintained, less
than optimal outcomes can occur to include discrimination, conflict, and turnover
(Bezrukova, Thatcher, & Jehn, 2007; McKay et al., 2007; K. T. Schneider et al., 2000). A
theory that explains where the breakdown in the work environment occurs is the faultline
theory (Chrobot-Mason & Aramovich, 2013). The faultline perspective recognizes “the
compositional dynamics of the multiple demographic attributes that can potentially
subdivide a group” (Lau & Murnighan, 1998, p. 325). Figurative faultines can divide large
working groups into subgroups that are identified through different attributes. Lau and
Murnigham (1998, p. 328) wrote, “As groups develop, the variety and potential salience of
each member’s more subtle characteristics become more likely sources for the alignment
of faultlines.” According to Jehn and Bezrukova (2010), the key to successfully managing
a diverse workforce is to keep demographic faultlines dormant. A group or team identity
created by a climate that is fair when dealing with all subgroups can keep the faultlines
dormant but, without this larger group identification, the faultlines can activate and lead to
negative work outcomes (K. A. Jehn & Bezrukova, 2010).
30
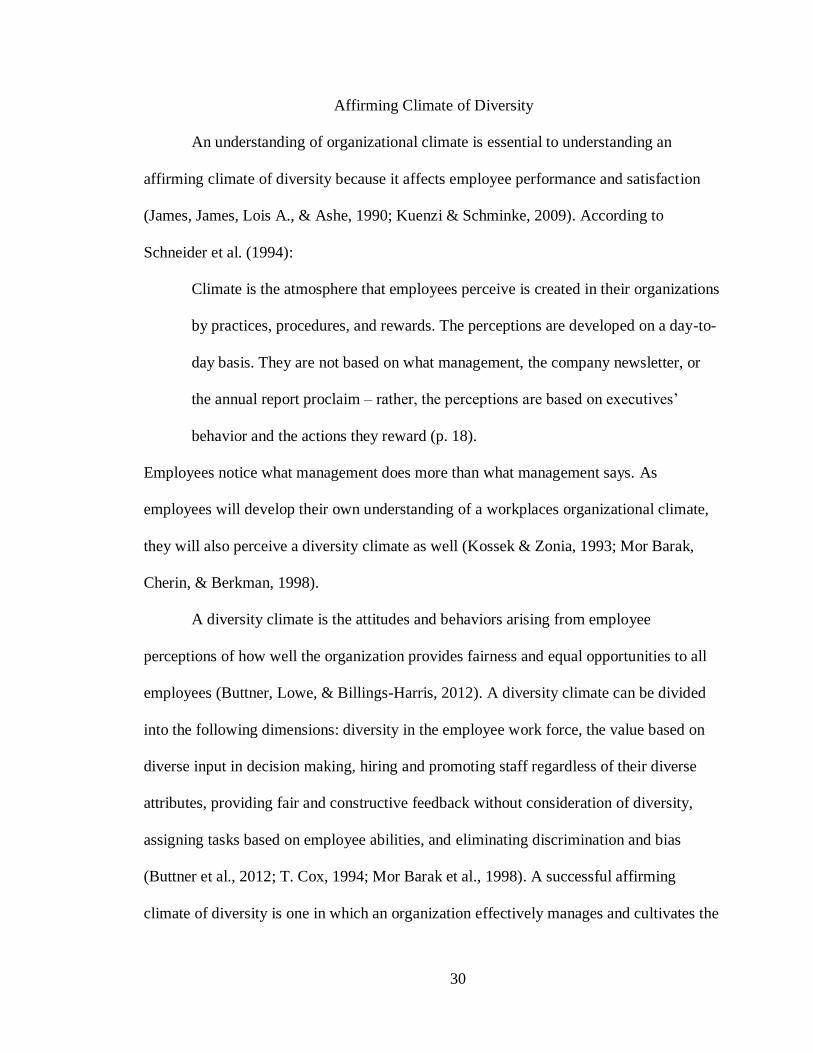
Affirming Climate of Diversity
An understanding of organizational climate is essential to understanding an
affirming climate of diversity because it affects employee performance and satisfaction
(James, James, Lois A., & Ashe, 1990; Kuenzi & Schminke, 2009). According to
Schneider et al. (1994):
Climate is the atmosphere that employees perceive is created in their organizations
by practices, procedures, and rewards. The perceptions are developed on a day-to-
day basis. They are not based on what management, the company newsletter, or
the annual report proclaim – rather, the perceptions are based on executives’
behavior and the actions they reward (p. 18).
Employees notice what management does more than what management says. As
employees will develop their own understanding of a workplaces organizational climate,
they will also perceive a diversity climate as well (Kossek & Zonia, 1993; Mor Barak,
Cherin, & Berkman, 1998).
A diversity climate is the attitudes and behaviors arising from employee
perceptions of how well the organization provides fairness and equal opportunities to all
employees (Buttner, Lowe, & Billings-Harris, 2012). A diversity climate can be divided
into the following dimensions: diversity in the employee work force, the value based on
diverse input in decision making, hiring and promoting staff regardless of their diverse
attributes, providing fair and constructive feedback without consideration of diversity,
assigning tasks based on employee abilities, and eliminating discrimination and bias
(Buttner et al., 2012; T. Cox, 1994; Mor Barak et al., 1998). A successful affirming
climate of diversity is one in which an organization effectively manages and cultivates the
31
aforementioned aspects of a diversity climate (T. H. Cox & Blake, 1991; Wolfson,
Kraiger, & Finkelstein, 2011).
Mediating Factors in Diversity’s Effect on Turnover Intentions
Both McKay et al. (2007) and Kaplan, Wiley, and Maertz (2011) found that
psychological outcomes such as organizational commitment and attachment act as
mediators for the relationship between diversity climate and turnover intentions. Ely and
Thomas (2001) showed that diversity climate affects how workforce members identify and
manage diversity related tensions. In other words, how an affirming climate of diversity
effects turnover intention can be observed in employee’s organizational commitment as
measured by psychological outcomes (Buttner et al., 2012; Chrobot-Mason & Aramovich,
2013; Chung et al., 2015; Stewart, 2011; Wolfson et al., 2011).
Organizational Identification. Organizational identification is the extent to which a
member of an organization defines himself in reference to his membership in an
organization (Hongwei & Brown, 2013). In addition to McKay et al. (2007) highlighting
organizational commitment as a mediating factor in the relationship, other researchers
have found that organizational identification, organizational commitment, and intentions
to quit are all moderated by diversity climate (Gonzalez & DeNisi, 2009). Bacharach,
Bamberger, and Vashdi (2005) showed that any tensions or lack of belonging due to race
were moderated by perceptions of peer support that lead to influence attachment. This
study will use Allen and Meyer’s (1990) definition as “the extent to which employees
identify with, are involved in, and enjoy a sense of belonging and membership in an
organization” (Chrobot-Mason & Aramovich, 2013, p. 667).
32
Climate for innovation. In continuation of the argument that a diverse workforce
has positive benefits to the bottom line of an organization, diverse workgroups should be
more likely to have innovative and creative ideas because of the diverse perspectives
brought to the table (Richard & Miller, 2013). In addition, Yang and Konrad (2011)
discovered an interaction between innovation and diversity, “the three-way interaction
effect, we observed, show that when level of employee involvement is high, racioethnic
diversity is positively related to innovation under the condition of high variation in
involvement where minority employees are equally or more active in involvement
behaviors than the White counterparts” (p. 1,077). Also, the literature claims that a climate
for innovation is related to employee well-being (King, Chermont, West, Dawson, &
Hebl, 2007). For this study, when an affirming climate of diversity is recognized by
employees, a climate that values and encourages creative and innovative thinking will be
present as well (Chrobot-Mason & Aramovich, 2013).
Psychological empowerment. Thomas and Velthouse (1991) defined
empowerment as intrinsic task motivation, identifying four cognitions or task assessments
as a basis for work empowerment: sense of impact, competence, meaningfulness, and
choice or self-determination. Meaningfulness is the fit of the job requirements with ones
beliefs, values, and behaviors (Spreitzer, 1995). Competence is an individuals’ confidence
in whether he/she can perform a task with skill (Spreitzer, 1995). Choice or self-
determination is an individual having the choice whether to initiate or control their
actions. It is reflective of autonomy in that the employee can initiate and continue work
projects and behaviors (Spreitzer, 1995). Finally, impact is to what level can an individual
influence strategic, administrative, or operating outcomes in the workplace (Spreitzer,
33
1995). Evidence in literature suggests that when employees identify that they are
empowered positive outcomes are a result to include a lower propensity to leave the
organization (Koberg, Boss, Senjem, & Goodman, 1999).
Identity Freedom. Cox (1991) posits that how diversity impacts behavior in
organizations is manifested in identity of workers. Workers are at their best, being more
productive for the company, when they are free to be themselves and not pressured to
conform to a larger group identity (T. Cox, 1991). Roberts and Creary (2013) further
expound that if employees use their differences in constructive ways, differences become
possible sources of ingenuity.
Intersection of RN Turnover, an Affirming Climate of Diversity, and Mediating
Workplace Outcomes
The conversion of the three topics within literature is limited. As identified by
Gilmartin (2013), literature on nursing turnover has been stagnant within one primary
theory model of turnover, the causal model. Much of the literature in nursing research
pertaining to diversity primarily deals with managing the health of a diverse patient
population (e.g., Baillie & Matiti, 2013; McClimens et al., 2014; Mixer et al., 2013; D. R.
Williams & Sternthal, 2010) and recruiting a diverse workforce (e.g., Katz, Barbosa-
Leiker, & Benavides-Vaello, 2015; Lowe & Archibald, 2009; Schmidt & MacWilliams,
2015; Xue & Brewer, 2014). However, two recent articles have brushed the surface of
whether diversity climate influences RN turnover. Collini, Guidroz and Perez (2015)
studied the mediating role of employee engagement on several variables, including
diversity climate, in their relationship to turnover of health care employees. They found
that a climate of diversity had no direct effect on turnover (p. 175). Collini et al. (2015),
34
however, attributed this absence of effect to a lack of variance in the climate of diversity
scores, a homogeneity of the sample, and using only a 2 item tool to assess diversity
climate. The other article written by Beheri (2009), using a more robust instrument for
measuring cultural diversity and climate (28 items), did find evidence of nurses being
comfortable with diversity as having an effect on turnover in RNs. Beheri (2009) focused
on the interactions between nurses as a mediating variable for several variables, including
cultural diversity, on turnover.
Beheri’s (2009) work comes the closest to addressing the relationship between a
diverse work climate and RN turnover in the existing literature. However, the sample
included a single, large nursing staff in one geographic area that limits the ability to
generalize the results to a larger geographic area (Beheri, 2009). This limitation highlights
the gap that this study will address: the relationship between registered nurses’ turnover
and the workplace diversity climate. In a broader sense, this study has the potential to add
knowledge to the research of Buttner et al. (2012), Herdman and McMillan-Capehart
(2010), Chung et al. (2015), and Chrobot-Mason and Aramovich (2013) in how an
employer’s diversity climate influences individual and organizational outcomes and
expand the application of these concepts to multiple industries. Finally, this study will
attempt to introduce new theories to nursing research literature from the broader literature
to address the issue of RN turnover as identified by Gilmartin (2013).
Summary of Chapter
This chapter has reviewed the literature domains that pertain to the conceptual
framework of this study. The development of a turnover model by Holtom et al. (2008)
was discussed to provide a framework of how diversity can play a role in turnover
35
intentions. Followed by a presentation of the focus and limitations of the literature on RN
turnover, identifying the limitations of this research as highlighted by Gilmartin (2013).
The chapter goes on to discuss workplace diversity. Specifically, the resource-based view
of diversity with its theorized benefits to a company’s bottom line and the faultline theory
of how a diverse workgroup can fall apart without proper management of its diversity
climate. In addition, mediating workplace outcomes and how they are manifestations of an
affirming climate were discussed. Finally, a review of the effects of diversity climates on
RN turnover and the shortcomings of this research were discussed.
36
Chapter 3 – Methodology
Introduction
This chapter outlines the design of this study. The following sections are included:
the purpose of the study, the research hypotheses, an overview of an unpublished survey
conducted in 2016, which informed the design of this research study, a description of both
the population and sample, details about the instrumentation and measurement of
responses, a discussion of the methods that were used to ensure reliability and validity,
and data collection procedures. The chapter concludes with a summary.
Purpose of the Study
The purpose of this study was to examine the mediating influence of psychological
variables on the relationship between diversity climate and turnover intentions among
RNs. Responding to Gilmartin’s (2013) call for nursing turnover research to seek new
concepts for study from general research, the study will utilized the idea that properly
managing a diversity climate will create outcomes that will change turnover intentions in
RNs (Chrobot-Mason & Aramovich, 2013; Stewart, 2011).
Research Questions
Because of the high national turnover rate in RNs and the government directive to
create a diverse health care workforce, this study aimed to evaluate how a properly
managed diverse workforce can negatively affect RN turnover intentions. Chrobot-Mason
and Aramovich’s (2013) work on studying an affirming climate of diversity’s effects on
turnover intentions came to light during the literature review. In their paper, Chrobot-
Mason and Aramovich (2013) create a tool that measures the effects of an affirming
climate of diversity on turnover intentions while measuring mediating psychological
37
outcomes in a large municipality. This study utilized Chrobot-Mason and Aramovich’s
(2013) tool to assess the same question amongst registered nurses, resulting in the
following research questions:
RQ1: Does an affirming climate of diversity, as measured by equal access and
equal treatment, have a negative effect on RN turnover intentions?
RQ2: Are the effects of an affirming climate of diversity on RN turnover
intentions mediated by the psychological outcomes of organizational
identification, climate for innovation, psychological empowerment, and
identity freedom?
RQ3: Will the psychological outcomes of organizational identification, climate
for innovation, psychological empowerment, and identity freedom mediate
the overall effects of an affirming climate of diversity on RN turnover
intentions across demographic subgroups?
Hypotheses
Hypotheses tested in this study were:
H1: An affirming climate of diversity will have a negative effect on RN
turnover intentions.
H1a: Equal access will have a negative effect of RN turnover intentions.
H1b: Equal treatment will have a negative effect on RN turnover intentions.
H2: The effects of an affirming climate of diversity on RN turnover intentions
are mediated by the psychological outcomes of organizational
identification, climate for innovation, psychological empowerment, and
identity freedom.

38
H2a: Organizational identification will mediate the effects of equal treatment on
RN turnover intentions.
H2b: Organizational identification will mediate the effects of equal access on RN
turnover intentions.
H2c: Climate for innovation will mediate the effects of equal treatment on RN
turnover intentions.
H2d: Climate for innovation will mediate the effects of equal access on RN
turnover intentions.
H2e: Psychological empowerment will mediate the effects of equal treatment on
RN turnover intentions.
H2f: Psychological empowerment will mediate the effects of equal access on RN
turnover intentions.
H2g: Identity freedom will mediate the effects of equal treatment on RN turnover
intentions.
H2h: Identity freedom will mediate the effects of equal access on RN turnover
intentions.
H3: The four psychological outcomes of organizational identification, climate
for innovation, psychological empowerment, and identity freedom will
mediate the overall effects of an affirming climate of diversity on RN
turnover intentions across demographic subgroups.
Figure 1 presents the proposed model for this study.
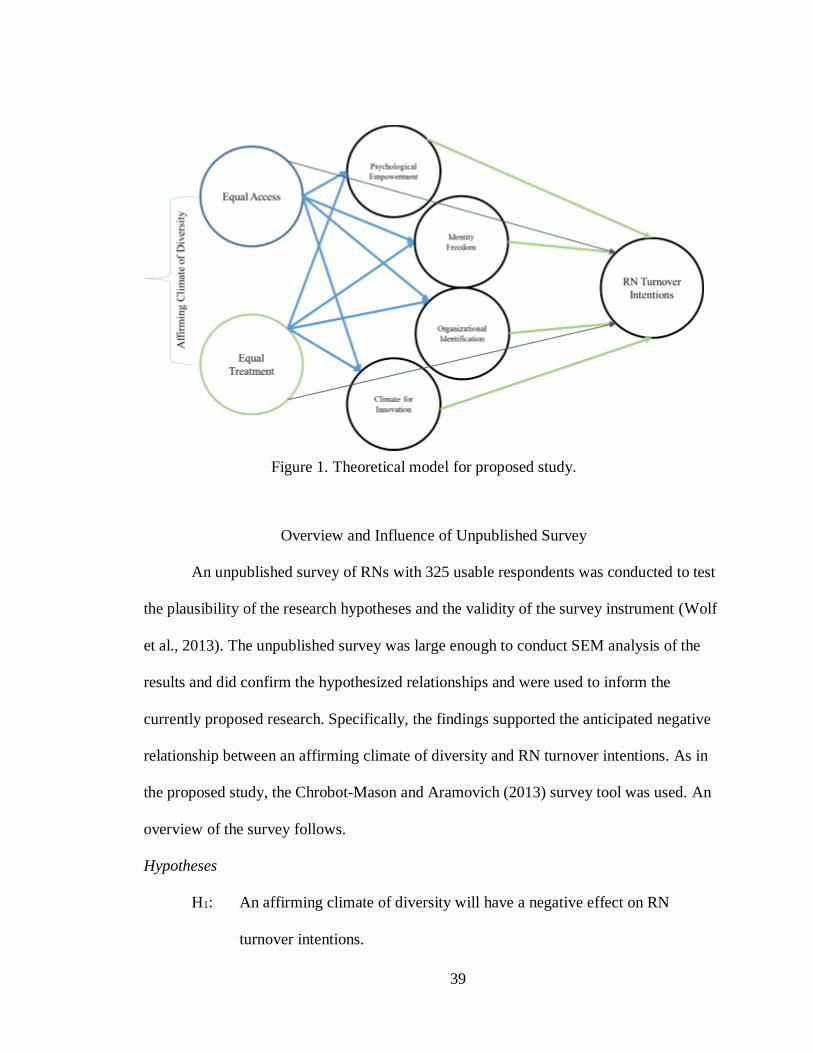
39
Overview and Influence of Unpublished Survey
An unpublished survey of RNs with 325 usable respondents was conducted to test
the plausibility of the research hypotheses and the validity of the survey instrument (Wolf
et al., 2013). The unpublished survey was large enough to conduct SEM analysis of the
results and did confirm the hypothesized relationships and were used to inform the
currently proposed research. Specifically, the findings supported the anticipated negative
relationship between an affirming climate of diversity and RN turnover intentions. As in
the proposed study, the Chrobot-Mason and Aramovich (2013) survey tool was used. An
overview of the survey follows.
Hypotheses
H1: An affirming climate of diversity will have a negative effect on RN
turnover intentions.
Figure 1. Theoretical model for proposed study.
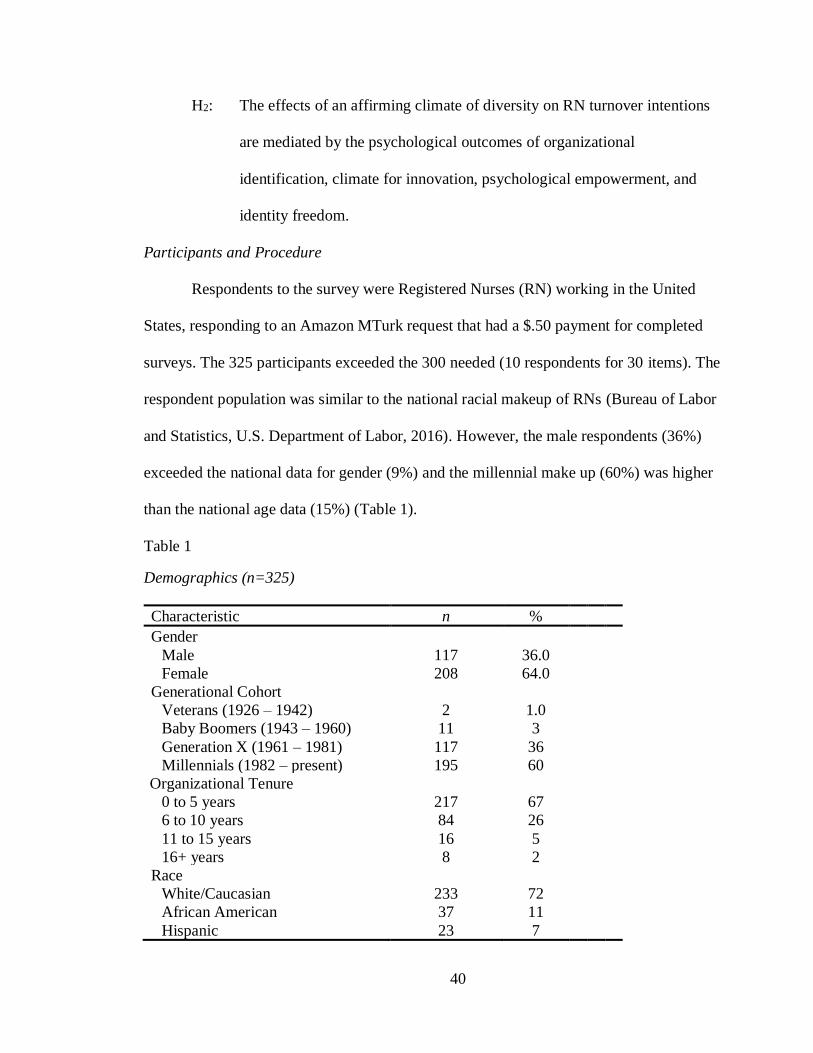
40
H2: The effects of an affirming climate of diversity on RN turnover intentions
are mediated by the psychological outcomes of organizational
identification, climate for innovation, psychological empowerment, and
identity freedom.
Participants and Procedure
Respondents to the survey were Registered Nurses (RN) working in the United
States, responding to an Amazon MTurk request that had a $.50 payment for completed
surveys. The 325 participants exceeded the 300 needed (10 respondents for 30 items). The
respondent population was similar to the national racial makeup of RNs (Bureau of Labor
and Statistics, U.S. Department of Labor, 2016). However, the male respondents (36%)
exceeded the national data for gender (9%) and the millennial make up (60%) was higher
than the national age data (15%) (Table 1).
Table 1 Unpublished survey demographics
Demographics (n=325)
Characteristic n %
Gender
Male 117 36.0
Female 208 64.0
Generational Cohort
Veterans (1926 – 1942) 2 1.0
Baby Boomers (1943 – 1960) 11 3
Generation X (1961 – 1981) 117 36
Millennials (1982 – present) 195 60
Organizational Tenure
0 to 5 years 217 67
6 to 10 years 84 26
11 to 15 years 16 5
16+ years 8 2
Race
White/Caucasian 233 72
African American 37 11
Hispanic 23 7
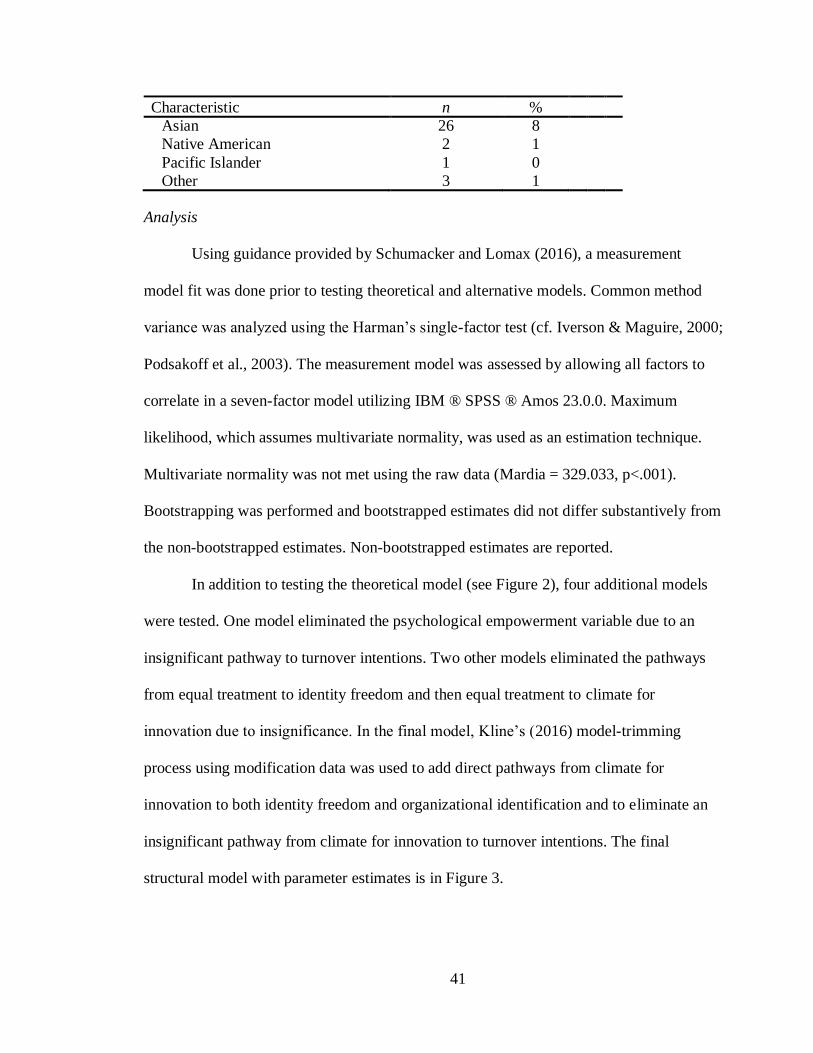
41
Characteristic n %
Asian 26 8
Native American 2 1
Pacific Islander 1 0
Other 3 1
Analysis
Using guidance provided by Schumacker and Lomax (2016), a measurement
model fit was done prior to testing theoretical and alternative models. Common method
variance was analyzed using the Harman’s single-factor test (cf. Iverson & Maguire, 2000;
Podsakoff et al., 2003). The measurement model was assessed by allowing all factors to
correlate in a seven-factor model utilizing IBM ® SPSS ® Amos 23.0.0. Maximum
likelihood, which assumes multivariate normality, was used as an estimation technique.
Multivariate normality was not met using the raw data (Mardia = 329.033, p<.001).
Bootstrapping was performed and bootstrapped estimates did not differ substantively from
the non-bootstrapped estimates. Non-bootstrapped estimates are reported.
In addition to testing the theoretical model (see Figure 2), four additional models
were tested. One model eliminated the psychological empowerment variable due to an
insignificant pathway to turnover intentions. Two other models eliminated the pathways
from equal treatment to identity freedom and then equal treatment to climate for
innovation due to insignificance. In the final model, Kline’s (2016) model-trimming
process using modification data was used to add direct pathways from climate for
innovation to both identity freedom and organizational identification and to eliminate an
insignificant pathway from climate for innovation to turnover intentions. The final
structural model with parameter estimates is in Figure 3.
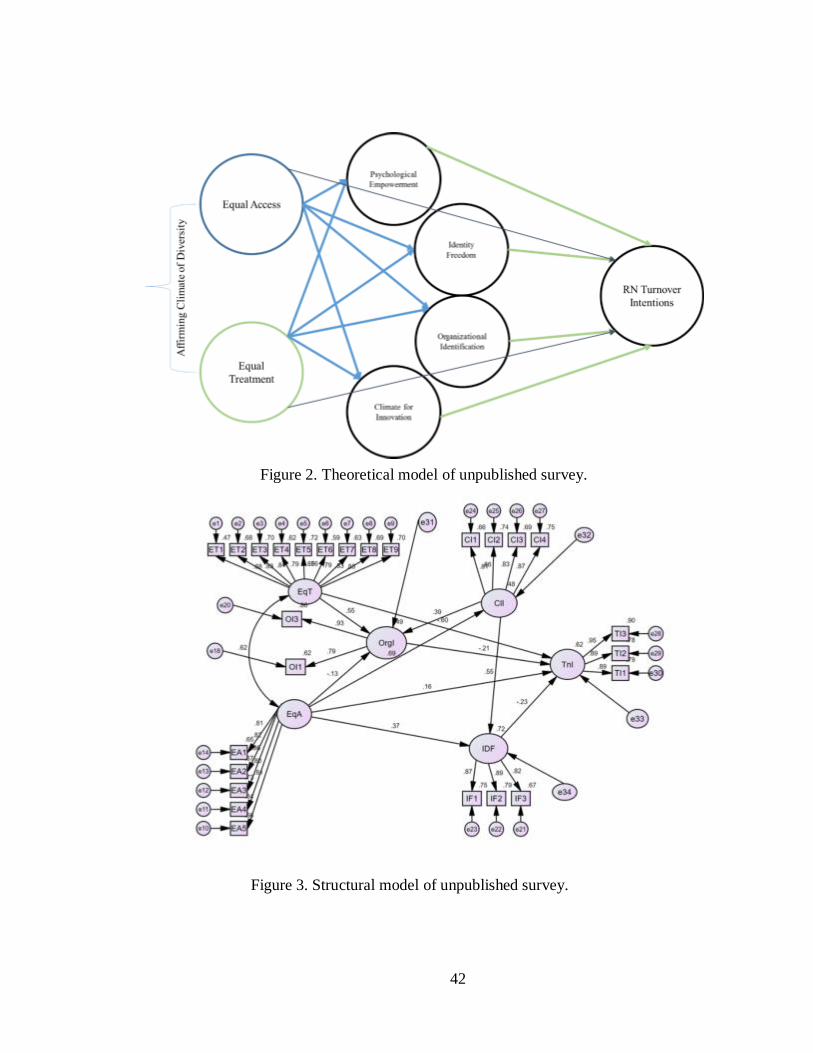
42
Figure 2. Theoretical model of unpublished survey.
Figure 3. Structural model of unpublished survey.
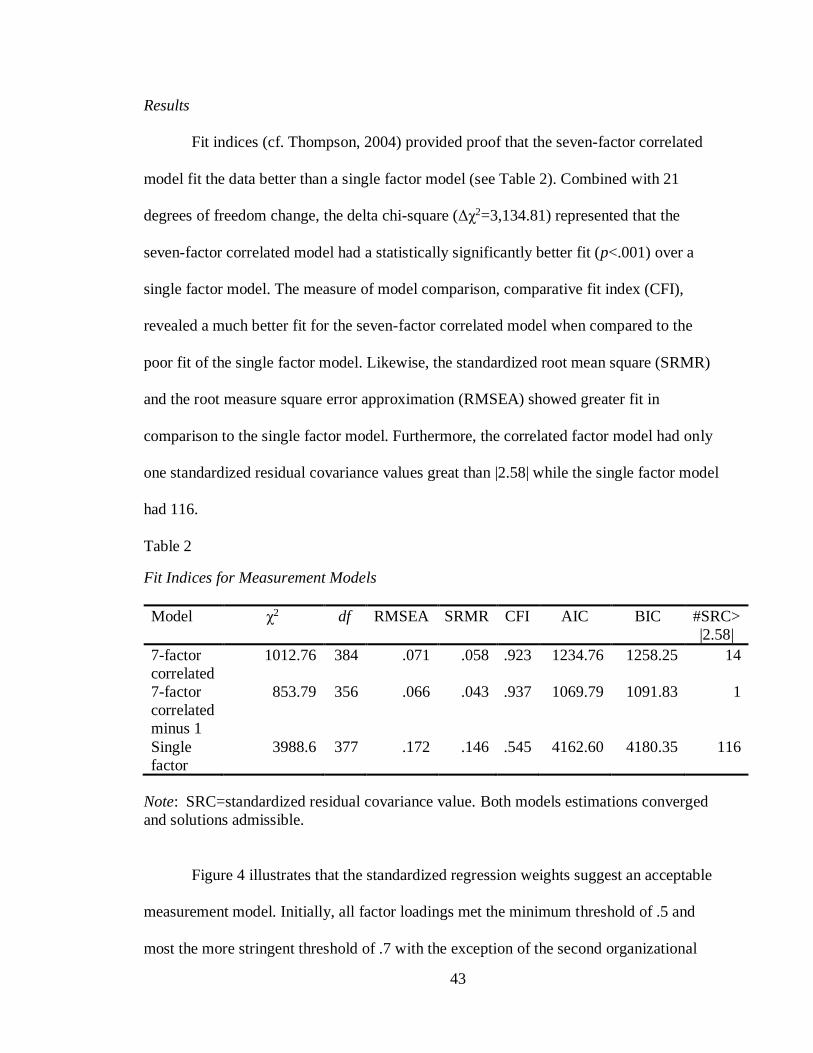
43
Results
Fit indices (cf. Thompson, 2004) provided proof that the seven-factor correlated
model fit the data better than a single factor model (see Table 2). Combined with 21
degrees of freedom change, the delta chi-square (Δχ2=3,134.81) represented that the
seven-factor correlated model had a statistically significantly better fit (p<.001) over a
single factor model. The measure of model comparison, comparative fit index (CFI),
revealed a much better fit for the seven-factor correlated model when compared to the
poor fit of the single factor model. Likewise, the standardized root mean square (SRMR)
and the root measure square error approximation (RMSEA) showed greater fit in
comparison to the single factor model. Furthermore, the correlated factor model had only
one standardized residual covariance values great than |2.58| while the single factor model
had 116.
Table 2 Unpublished survey measurement model fit indices
Fit Indices for Measurement Models
Model χ2 df RMSEA SRMR CFI AIC BIC #SRC>
|2.58|
7-factor
correlated
1012.76 384 .071 .058 .923 1234.76 1258.25 14
7-factor
correlated
minus 1
853.79 356 .066 .043 .937 1069.79 1091.83 1
Single
factor
3988.6 377 .172 .146 .545 4162.60 4180.35 116
Note: SRC=standardized residual covariance value. Both models estimations converged
and solutions admissible.
Figure 4 illustrates that the standardized regression weights suggest an acceptable
measurement model. Initially, all factor loadings met the minimum threshold of .5 and
most the more stringent threshold of .7 with the exception of the second organizational
44
identification statement (OI2). It failed to load high on any factor. It was removed and the
model was reanalyzed. This resulted in all factor loadings meeting the minimum threshold
and most the more stringent threshold (cf. Kline, 2016; Thompson, 2004). An examination
of the structure coefficients (cf. Graham, Guthrie, & Thompson, 2003; see Table 3)
identified that each variable has the highest correlation with its modeled respective factor.
As evidenced in Table 4, the average variance extracted (AVE; .64 - .82) and the range of
composite reliability (CR; .85 - .94) provide proof of desired convergent validity and
adequate reliability (Bagozzi & Yi, 1988, see Table 4). Correlations between factors
provided evidence of discriminant validity due to being lower than the square root of the
AVE for individual factors.
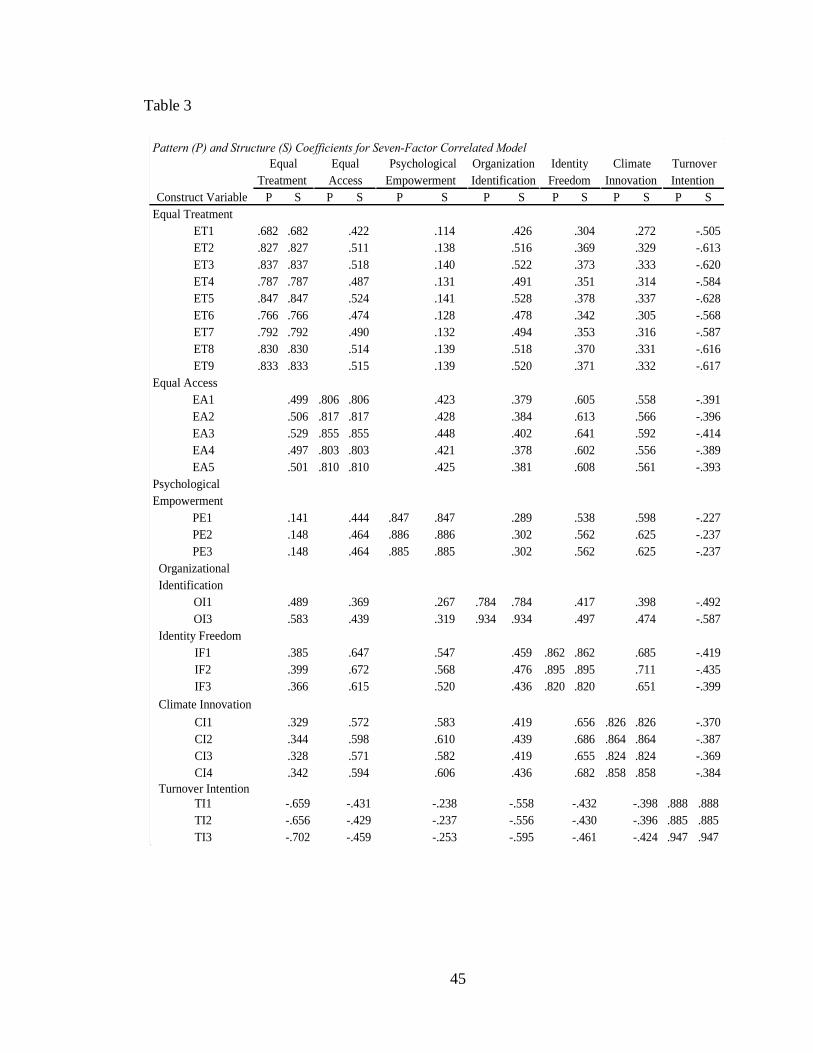
45
Table 3 Unpublished survey pattern and structure coefficients
Pattern (P) and Structure (S) Coefficients for Seven-Factor Correlated Model
Construct Variable P S P S P S P S P S P S P S
Equal Treatment
ET1 .682 .682 .422 .114 .426 .304 .272 -.505
ET2 .827 .827 .511 .138 .516 .369 .329 -.613
ET3 .837 .837 .518 .140 .522 .373 .333 -.620
ET4 .787 .787 .487 .131 .491 .351 .314 -.584
ET5 .847 .847 .524 .141 .528 .378 .337 -.628
ET6 .766 .766 .474 .128 .478 .342 .305 -.568
ET7 .792 .792 .490 .132 .494 .353 .316 -.587
ET8 .830 .830 .514 .139 .518 .370 .331 -.616
ET9 .833 .833 .515 .139 .520 .371 .332 -.617
Equal Access
EA1 .499 .806 .806 .423 .379 .605 .558 -.391
EA2 .506 .817 .817 .428 .384 .613 .566 -.396
EA3 .529 .855 .855 .448 .402 .641 .592 -.414
EA4 .497 .803 .803 .421 .378 .602 .556 -.389
EA5 .501 .810 .810 .425 .381 .608 .561 -.393
Psychological
Empowerment
PE1 .141 .444 .847 .847 .289 .538 .598 -.227
PE2 .148 .464 .886 .886 .302 .562 .625 -.237
PE3 .148 .464 .885 .885 .302 .562 .625 -.237
Organizational
Identification
OI1 .489 .369 .267 .784 .784 .417 .398 -.492
OI3 .583 .439 .319 .934 .934 .497 .474 -.587
Identity Freedom
IF1 .385 .647 .547 .459 .862 .862 .685 -.419
IF2 .399 .672 .568 .476 .895 .895 .711 -.435
IF3 .366 .615 .520 .436 .820 .820 .651 -.399
Climate Innovation
CI1 .329 .572 .583 .419 .656 .826 .826 -.370
CI2 .344 .598 .610 .439 .686 .864 .864 -.387
CI3 .328 .571 .582 .419 .655 .824 .824 -.369
CI4 .342 .594 .606 .436 .682 .858 .858 -.384
Turnover Intention
TI1 -.659 -.431 -.238 -.558 -.432 -.398 .888 .888
TI2 -.656 -.429 -.237 -.556 -.430 -.396 .885 .885
TI3 -.702 -.459 -.253 -.595 -.461 -.424 .947 .947
Turnover
Intention
Equal
Treatment
Equal
Access
Psychological
Empowerment
Organization
Identification
Identity
Freedom
Climate
Innovation

46
Table 4 Unpublished survey implied correlations, AVE, and CR
Implied Correlations, Average Variance Extracted (AVE), and Composite Reliability (CR)
Variable 1 2 3 4 5 6 7
1. Equal Treatment 0.80
2. Equal Access 0.62 0.82
3. Psychological Empowerment 0.17 0.52 0.87
4. Organizational Identification 0.62 0.47 0.34 0.86
5. Identity Freedom 0.45 0.75 0.64 0.53 0.86
6. Climate for Innovation 0.40 0.69 0.71 0.51 0.80 0.84
7. Turnover Intention -0.74 -0.49 -0.37 -0.63 -0.49 -0.45 0.91
CR 0.94 0.91 0.91 0.85 0.89 0.91 0.93
AVE 0.64 0.67 0.76 0.74 0.74 0.71 0.82
Note: Square root of AVE along the diagonal.
Figure 4. Measurement model of unpublished survey.
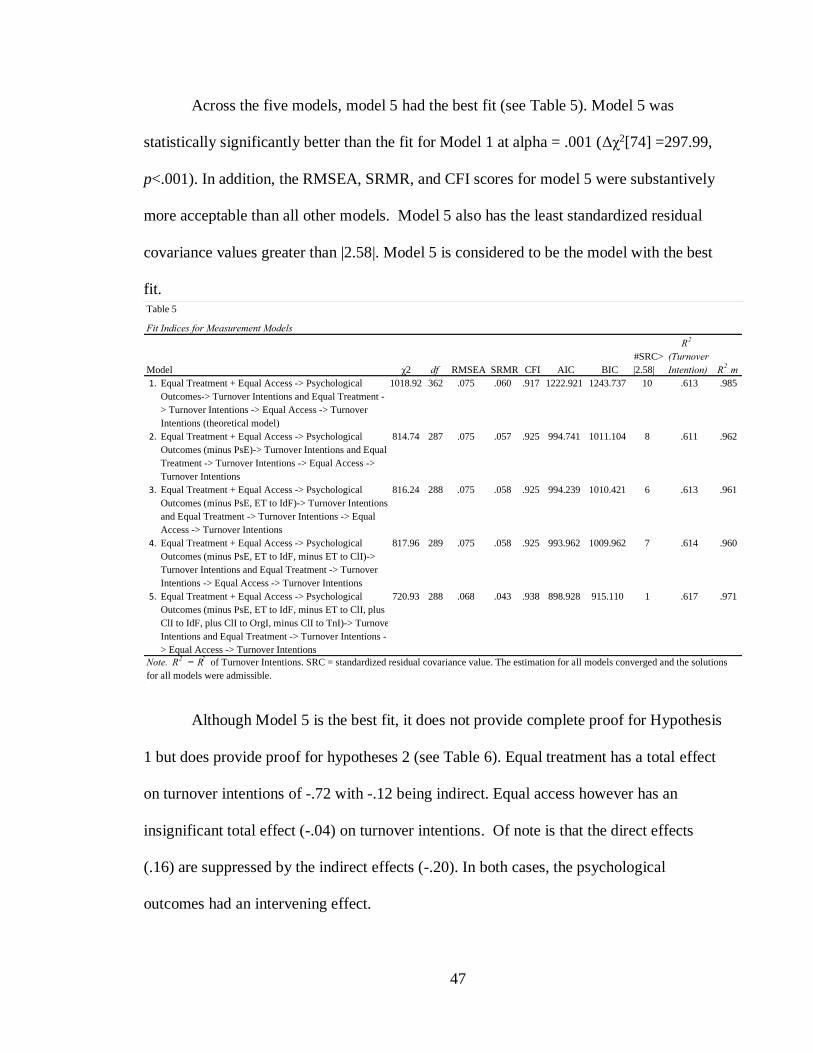
47
Across the five models, model 5 had the best fit (see Table 5). Model 5 was
statistically significantly better than the fit for Model 1 at alpha = .001 (Δχ2[74] =297.99,
p<.001). In addition, the RMSEA, SRMR, and CFI scores for model 5 were substantively
more acceptable than all other models. Model 5 also has the least standardized residual
covariance values greater than |2.58|. Model 5 is considered to be the model with the best
fit.
Table 5 Unpublished survey fit indices
Although Model 5 is the best fit, it does not provide complete proof for Hypothesis
1 but does provide proof for hypotheses 2 (see Table 6). Equal treatment has a total effect
on turnover intentions of -.72 with -.12 being indirect. Equal access however has an
insignificant total effect (-.04) on turnover intentions. Of note is that the direct effects
(.16) are suppressed by the indirect effects (-.20). In both cases, the psychological
outcomes had an intervening effect.
Table 5
Fit Indices for Measurement Models
Model χ2 df RMSEA SRMR CFI AIC BIC
#SRC>
|2.58|
R2
(Turnover
Intention) R2
m
1. Equal Treatment + Equal Access -> Psychological
Outcomes-> Turnover Intentions and Equal Treatment -
> Turnover Intentions -> Equal Access -> Turnover
Intentions (theoretical model)
1018.92 362 .075 .060 .917 1222.921 1243.737 10 .613 .985
2. Equal Treatment + Equal Access -> Psychological
Outcomes (minus PsE)-> Turnover Intentions and Equal
Treatment -> Turnover Intentions -> Equal Access ->
Turnover Intentions
814.74 287 .075 .057 .925 994.741 1011.104 8 .611 .962
3. Equal Treatment + Equal Access -> Psychological
Outcomes (minus PsE, ET to IdF)-> Turnover Intentions
and Equal Treatment -> Turnover Intentions -> Equal
Access -> Turnover Intentions
816.24 288 .075 .058 .925 994.239 1010.421 6 .613 .961
4. Equal Treatment + Equal Access -> Psychological
Outcomes (minus PsE, ET to IdF, minus ET to ClI)->
Turnover Intentions and Equal Treatment -> Turnover
Intentions -> Equal Access -> Turnover Intentions
817.96 289 .075 .058 .925 993.962 1009.962 7 .614 .960
5. Equal Treatment + Equal Access -> Psychological
Outcomes (minus PsE, ET to IdF, minus ET to ClI, plus
ClI to IdF, plus ClI to OrgI, minus ClI to TnI)-> Turnover
Intentions and Equal Treatment -> Turnover Intentions -
> Equal Access -> Turnover Intentions
720.93 288 .068 .043 .938 898.928 915.110 1 .617 .971
Note. R2
= R2
of Turnover Intentions. SRC = standardized residual covariance value. The estimation for all models converged and the solutions
for all models were admissible.
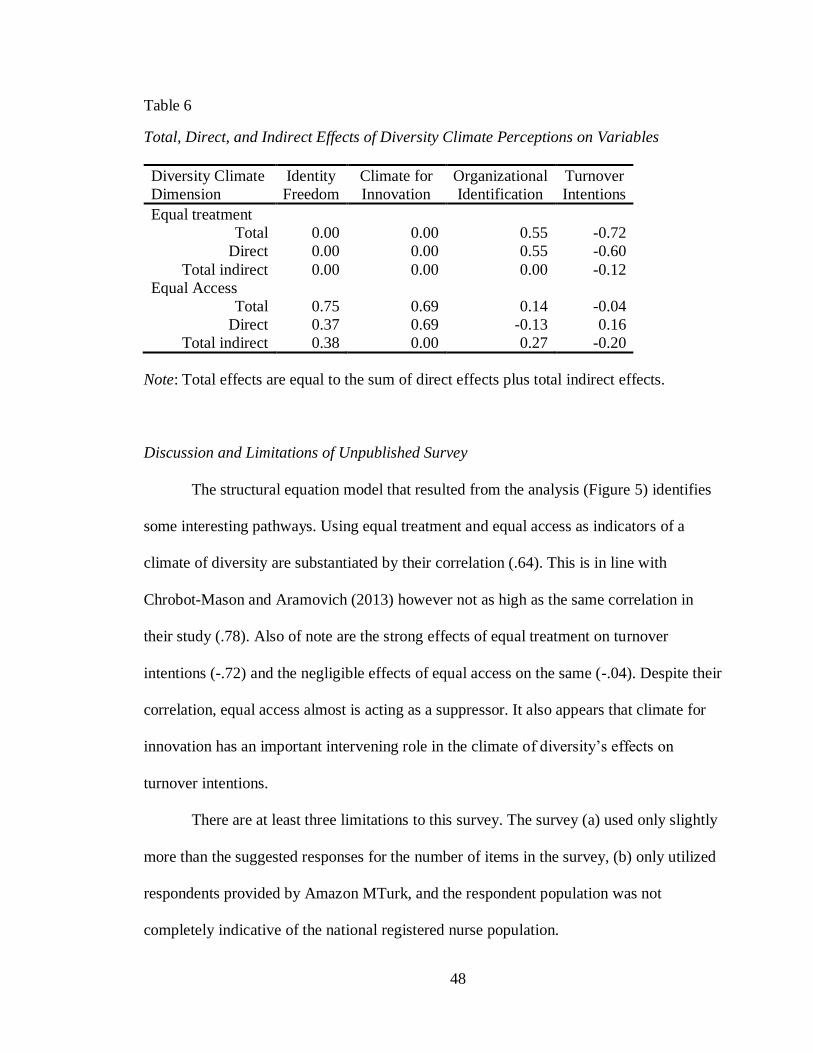
48
Table 6 Unpublished survey total, direct, and indirect effects of diversity climate
Total, Direct, and Indirect Effects of Diversity Climate Perceptions on Variables
Diversity Climate
Dimension
Identity
Freedom
Climate for
Innovation
Organizational
Identification
Turnover
Intentions
Equal treatment
Total 0.00 0.00 0.55 -0.72
Direct 0.00 0.00 0.55 -0.60
Total indirect 0.00 0.00 0.00 -0.12
Equal Access
Total 0.75 0.69 0.14 -0.04
Direct 0.37 0.69 -0.13 0.16
Total indirect 0.38 0.00 0.27 -0.20
Note: Total effects are equal to the sum of direct effects plus total indirect effects.
Discussion and Limitations of Unpublished Survey
The structural equation model that resulted from the analysis (Figure 5) identifies
some interesting pathways. Using equal treatment and equal access as indicators of a
climate of diversity are substantiated by their correlation (.64). This is in line with
Chrobot-Mason and Aramovich (2013) however not as high as the same correlation in
their study (.78). Also of note are the strong effects of equal treatment on turnover
intentions (-.72) and the negligible effects of equal access on the same (-.04). Despite their
correlation, equal access almost is acting as a suppressor. It also appears that climate for
innovation has an important intervening role in the climate of diversity’s effects on
turnover intentions.
There are at least three limitations to this survey. The survey (a) used only slightly
more than the suggested responses for the number of items in the survey, (b) only utilized
respondents provided by Amazon MTurk, and the respondent population was not
completely indicative of the national registered nurse population.
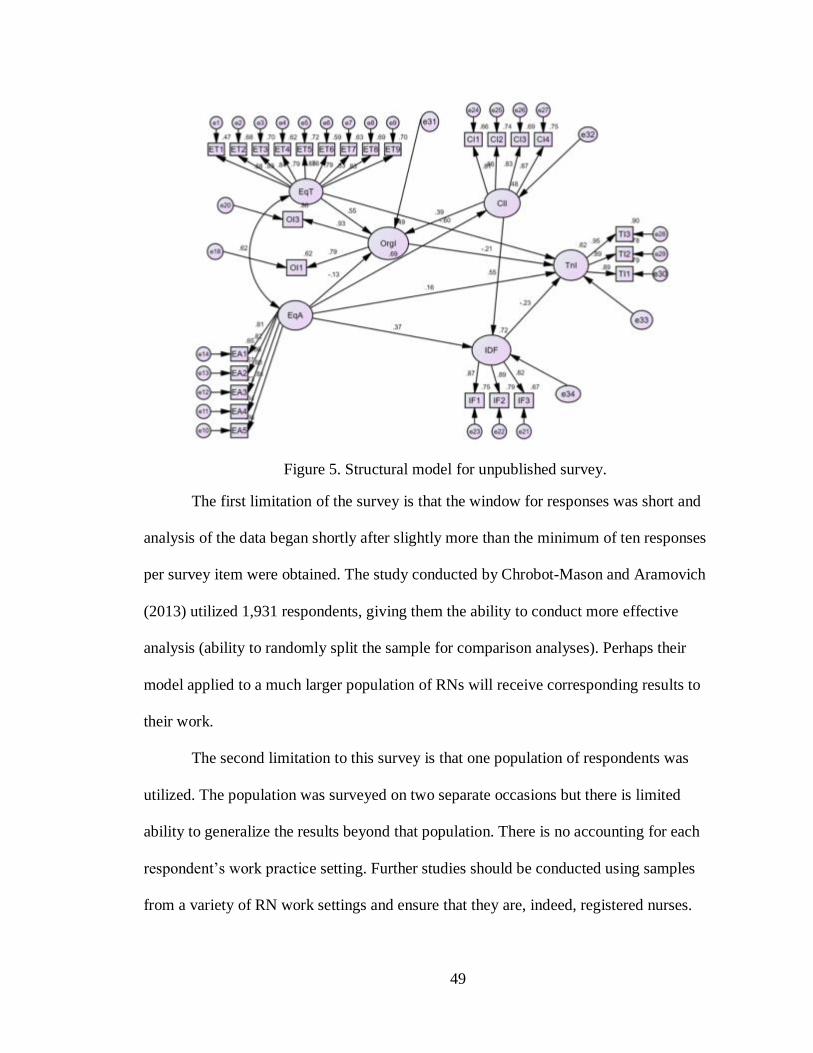
49
The first limitation of the survey is that the window for responses was short and
analysis of the data began shortly after slightly more than the minimum of ten responses
per survey item were obtained. The study conducted by Chrobot-Mason and Aramovich
(2013) utilized 1,931 respondents, giving them the ability to conduct more effective
analysis (ability to randomly split the sample for comparison analyses). Perhaps their
model applied to a much larger population of RNs will receive corresponding results to
their work.
The second limitation to this survey is that one population of respondents was
utilized. The population was surveyed on two separate occasions but there is limited
ability to generalize the results beyond that population. There is no accounting for each
respondent’s work practice setting. Further studies should be conducted using samples
from a variety of RN work settings and ensure that they are, indeed, registered nurses.
Figure 5. Structural model for unpublished survey.
50
The third limitation to the survey is that the respondents that were male and those
that were millennials skewed the demographic information away from national numbers
(Bureau of Labor and Statistics, U.S. Department of Labor, 2016). Either of these groups
may not see the equal access issues due to being a male or a new worker who hasn’t seen
enough work to answer the questions knowledgeably.
Design of the Study
This study used a quantitative cross-sectional survey design to test the relationship
of diversity climate and turnover intentions among a national sample of registered nurses.
The survey utilized a validated survey tool created and utilized by Chrobot-Mason and
Aramovich (2013) that measured the effects of a diverse climate on turnover intentions
and the mediating effects of psychological variables (organizational identification, identity
freedom, climate for innovation, and psychological empowerment) in a municipal
employee population. Even though the unpublished survey identified items to eliminate
that did not load strongly in the CFA and eliminated the psychological empowerment
variable, this study utilized the full survey tool to see if these characteristics of the model
would occur in the full study.
Population and Sample
The context for this study was the national registered nurse work force. The
intended study population represents over 2,700,000 registered nurses in the U.S. health
care industry (Bureau of Labor and Statistics, U.S. Department of Labor, 2016). Utilizing
national and regional nursing associations, regional health care organizations and social
media, the proposed study solicited responses from registered nurses. In order to conduct

51
SEM analysis of the data from a tool with 30 items, a minimum of 300 respondents was
needed (Schumacker & Lomax, 2016).
Instrumentation
The survey tool obtained from Chrobot-Mason and Aramovich (2013) measures
the effects of an affirming climate of diversity on turnover intentions mediated by the
psychological outcomes of organizational commitment, climate for innovation,
psychological empowerment, and identity freedom. The survey concluded with 8
demographic items on gender, generational cohort, race, tenure, health care work setting,
employment status, community size, and state of residence in order to have a better
completion rate of these questions (Teclaw et al., 2012) and was implemented online via
Qualtrics.
Affirming climate of diversity. The affirming climate of diversity is a measure
that includes four subscales (structural integration, informal integration, low cultural bias
and intergroup cohesion) developed by Chrobot-Mason and Aramovich (2013) separating
these subscales into two factor variables: equal treatment and equal access.
The equal treatment factor consists of nine items (low cultural bias – 5, intergroup
cohesion – 2, informal integration – 2). An example is “prejudice exists where I work.”
These items are assessed using a 7-point Likert Scale with responses ranging from
strongly disagree (1) to strongly agree (7).
The equal access factor consists of five items (informal integration – 2, structural
integration – 3) using a 7-point Likert scale with responses ranging from strongly disagree
(1) to strongly agree (7). An example is “members of all demographic groups have the
same opportunity to receive informal mentoring.”
52
Psychological outcome variables. The psychological outcome mediators were
measured utilizing Chrobot-Mason and Aramovich’s (2013) tool as well, consisting of
Organizational Identification, Identity Freedom, Climate for Innovation, and
Psychological empowerment.
Organizational identification was measured using five of the items from Allen and
Meyer’s (1990) organizational commitment measure’s affective subscale (Allen & Meyer,
1990; Chrobot-Mason & Aramovich, 2013). An example is “This organization has great
meaning for me.” The measure uses a 7-point Likert Scales with responses ranging from
strongly disagree (1) to strongly agree (7).
Identity freedom was measured with three items developed utilizing Cox’s
dimensions of acculturation (T. Cox, 1991). A sample is “I feel like I can be myself at
work.” These items were assessed using a 7-point Likert Scale with responses ranging
from strongly disagree (1) to strongly agree (7).
Four items were used to measure climate for innovation. Chrobot-Mason and
Aramovich (2013) created these items to assess perceptions of whether innovative and
creative ideas are expected and rewarded. As example, “New ideas or suggestions are
seriously considered in my work unit.” These items are assessed using 7-point Likert
Scales with responses ranging from strongly disagree (1) to strongly agree (7).
Psychological empowerment utilizes Spreitzer’s (1995) Psychological
Empowerment three-item Self Determination subscale (Chrobot-Mason & Aramovich,
2013). These items were assessed using a 7-point Likert Scales with responses ranging
from strongly disagree (1) to strongly agree (7). An example is “I can decide on my own
how to go about doing my work.”
53
Turnover Intentions. The turnover intentions were measured using the Chrobot-
Mason and Aramovich tool as well. Chrobot-Mason and Aramovich (2013) utilized a
three-item subscale of the Michigan Organizational Assessment Questionnaire (Nadler,
1975). This subscale assesses whether employees actively thought about leaving their
organization. As example, “I often think about quitting.” These items were assessed using
a 7-point Likert Scale with responses ranging from strongly disagree (1) to strongly agree
(7).
Data Collection Procedures
Individual survey participants were recruited utilizing network sampling also
known as snowball sampling. In snowball sampling, initial sample participants are
selected through probability or nonprobability methods and secondary participants are
identified through social network information (Hill, Dean, & Murphy, 2013). This study
employed a targeted snowball approach in which registered nurses working in the US
were intended respondents (Dusek, Yurova, & Ruppel, 2015). One part of the sampling
consisted of utilizing membership lists of nursing associations and RN employees of
health care institutions to recruit participants by email with a link to the web-based survey,
resulting in 75 respondents. These participants were encouraged to spread the survey link
to their RN friends and associates. In addition, several RN internet bloggers and tweeters
agreed to post a link to the survey on their websites. RN visitors to these internet blogs or
recipients of these tweets were presented with a link to the web-based survey and
encouraged to spread the link to their RN community, resulting in 54 respondents.
Finally, a Facebook post with a link to the survey was broadcast and shared
throughout Facebook. An associate of the researcher volunteered to use her Facebook
54
network to spread the survey link. The associate created a post on her Facebook page that
would be seen by her network of over 1,500 individuals. The post described the nature of
the study and the intended audience. In addition, she encouraged her network to
participate if they were a registered nurse, invite friends and relatives who were registered
nurses to participate, and share the posting. This effort resulted in 3,339 respondents.
The web entry to the survey conveyed information to the respondent that the
survey is voluntary, all survey responses are confidential, and results will be reported at
the aggregate level. The survey was available from any web browser and took
approximately 7-10 minutes to complete. Recipients that chose to participate clicked an
embedded link to the web-based survey. The participants that proceeded were presented
with an informed consent at the beginning of the survey along with instructions on
withdrawing or continuing the survey and that the participant could withdraw from the
survey at any point within the survey. Survey responses remain confidential and have no
personal identifying information from the participant. In addition, the study received
approval from the Institutional Review Board of The University of Texas at Tyler.
Data Analysis Procedures
Data Analysis included structural equation modeling to identify the effective
pathways between diversity climate and RN turnover intention. IBM ® SPSS 24.0.0® and
IBM ® SPSS ® Amos 24.0.0 were for the analyses. Data were analyzed after collection to
determine the need to eliminate any cases. All values were within parameters and straight
lining, survey length, and minimum standard deviation were considered. For the
remaining data set, demographic data were calculated. The data included gender,
generational cohort (i.e., veterans (1926 – 1942), baby boomers (1943 – 1960), generation
55
X (1961 – 1981), or Millennials (1982 – present), organizational tenure, race, employment
status, and work setting (i.e., government, home health, hospital, nursing residential
facility, or office of physician) (Lyons & Kuron, 2014; Pritchard & Whiting, 2014; Strauss
& Howe, 1991; VanMeter, Grisaffe, Chonko, & Roberts, 2013; Wells & Twenge, 2005).
Microsoft Excel 2013 was used to calculate frequencies, distributions, medians, and
modes.
Exploratory factor analysis (EFA) and reliability analysis were used to assess
construct validity. A promax rotation with principal axis factoring was utilized because of
hypothesized underlying structure and expected factor correlation. In light of the
theoretical structure from Chrobot-Mason and Aramovich (2013), there was a limit of
seven factors extracted and a coefficient alpha was used for reliability analysis (Henson,
2001). For items to remain in the analysis for interpretation, the items loading needed to
be greater than 0.45 on their respective factor (Tabachnick & Fidell, 2007; Thompson,
2004). These criteria eliminated three items, which were not included for the remainder of
the analysis.
Using guidance from Schumacker and Lomax (2016), a measurement model fit
was performed using confirmatory factor analysis (CFA) prior to testing theoretical and
alternative models. Utilizing Harman’s single-factor test, common method variance was
analyzed before the measurement model was identified and assessed again afterwards by
creating a common latent factor, which was retained for the remainder of the analysis (cf.
Iverson & Maguire, 2000; Podsakoff et al., 2003). The measurement model and theoretical
models were assessed utilizing IBM ® SPSS ® Amos 24.0.0, measuring Chi-square,
degrees of freedom, root measure square error approximation (RMSEA), standardized root
56
mean residual (SRMR), comparative fit index (CFI), Tucker-Lewis Index (TLI), Akaike
information criterion (AIC), and Bayesian information criterion (BIC). Tenure was used as
a control variable. Through meta-analysis, organizational tenure has been linked to both
organizational identification and turnover (Griffeth, Hom, & Gaertner, 2000; Mathieu &
Zajac, 1990).
Each model’s chi-square and degrees of freedom were used to compute the chi-
square difference statistic (χ2D). This statistic was used to test the statistical significance of
the decrement or improvement of overall fit when comparing models (Kline, 2016).
Measuring the discrepancy per degree of freedom, RMSEA measures the average amount
of misfit in the model or difference from close or approximate fit (Kline, 2016). Zero
represents a perfect fit for RMSEA with ≤ 0.05 considered close fit and ≤ 0.08 considered
reasonable fit (Schumacker & Lomax, 2016). SRMR is an absolute fit metric that
measures the mean absolute covariance residual with a perfect model fit being indicated
by a value of zero and ≤ 0.09 indicating a good model fit (Hu & Bentler, 1999;
Schumacker & Lomax, 2016). Both CFI and TLI are measures of incremental fit with
values close to or above 0.95 indicating good fit. TLI favors less complex models (Kline,
2016). Like the χ2D, the AIC and BIC are used to compare different models, declining
values indicating a better goodness of fit (Kline, 2016).
Reliability and Validity
Prior to testing theoretical and alternative models a measurement model fit was
assessed. Common method variance was analyzed using the Harman’s single-factor test
and by creating a common latent factor and comparing the Δχ2 between unconstrained and
constrained models (cf. Iverson & Maguire, 2000; Podsakoff et al., 2003). Maximum
57
likelihood was used for testing multivariate normality. Confirmatory Factor Analysis
(CFA) was used to determine composite reliabilities, communalities, and the percentage of
average variance extracted for all loadings to test for validity and reliability (cf. Graham et
al., 2003; Kline, 2016; Thompson, 2004).
Limitations
Even though every effort was made to have as accurate and generalizable data as
possible, the possibility of limitations must be recognized. Common method variance was
possible because of self-reported data (Podsakoff et al., 2003). Yet, Doty and Glick (1998)
claim that when common method variance introduces bias it rarely will impact a study’s
findings. Common method variance was identified and accounted for by retaining a
common latent variable during the structural equation model analysis. Also of note is the
possible risk of possible other explanations of identified relationships beyond what is
considered in a cross-sectional study (Bryman & Bell, 2011). Finally, collecting data
through targeted snowballing, leaves less ability to scrutinize the qualifications of
participants and can focus that sample to a particular segment of the targeted population
(Dusek et al., 2015; Hill et al., 2013).
Summary of Chapter
This chapter provided an outline of the design for the study. Beginning with a
review of the purpose of the study and a review of the hypotheses, an unpublished survey
conducted in 2016 that helped guide the design of the proposed research study was
discussed. The chapter also covered the proposed and collected population and sample
size, presenting the instrumentation and how the responses were measured. In addition, the
data collection procedures were discussed in detail, emphasizing the use of targeted

58
snowballing and its benefits and drawbacks. Finally, the processes used for data cleaning
and analysis, assessment of data reliability and validity, and limitations of the study were
described and explained.
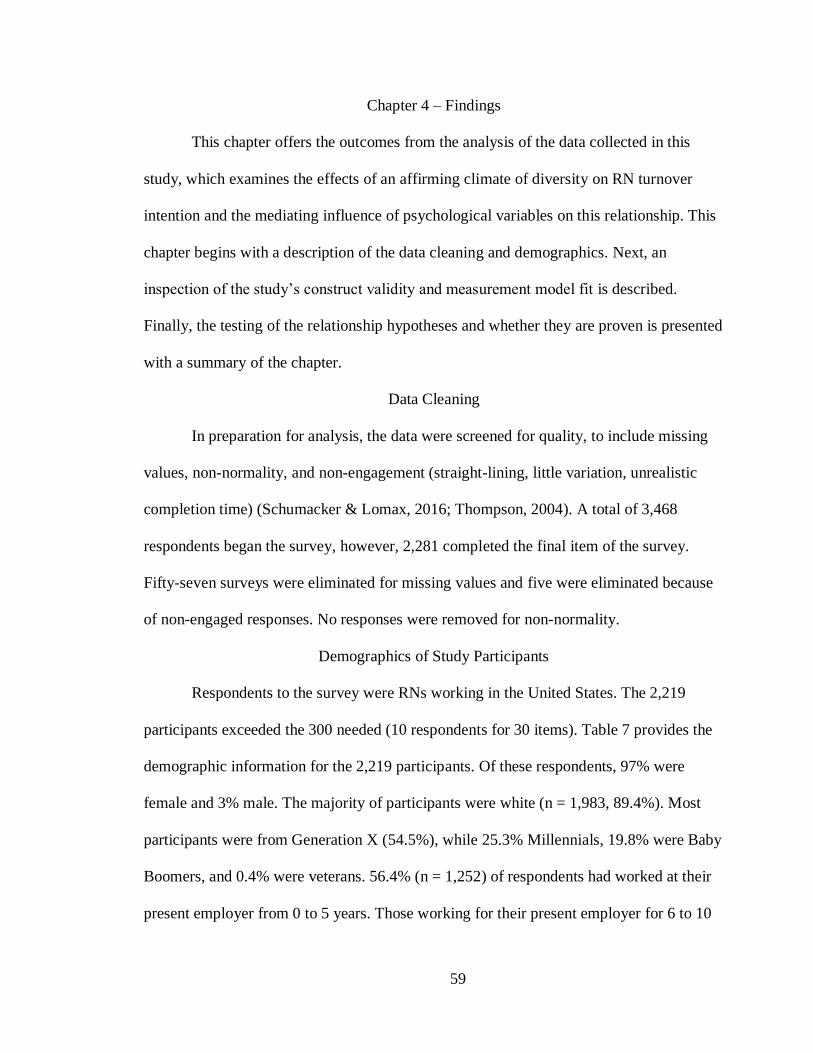
59
Chapter 4 – Findings
This chapter offers the outcomes from the analysis of the data collected in this
study, which examines the effects of an affirming climate of diversity on RN turnover
intention and the mediating influence of psychological variables on this relationship. This
chapter begins with a description of the data cleaning and demographics. Next, an
inspection of the study’s construct validity and measurement model fit is described.
Finally, the testing of the relationship hypotheses and whether they are proven is presented
with a summary of the chapter.
Data Cleaning
In preparation for analysis, the data were screened for quality, to include missing
values, non-normality, and non-engagement (straight-lining, little variation, unrealistic
completion time) (Schumacker & Lomax, 2016; Thompson, 2004). A total of 3,468
respondents began the survey, however, 2,281 completed the final item of the survey.
Fifty-seven surveys were eliminated for missing values and five were eliminated because
of non-engaged responses. No responses were removed for non-normality.
Demographics of Study Participants
Respondents to the survey were RNs working in the United States. The 2,219
participants exceeded the 300 needed (10 respondents for 30 items). Table 7 provides the
demographic information for the 2,219 participants. Of these respondents, 97% were
female and 3% male. The majority of participants were white (n = 1,983, 89.4%). Most
participants were from Generation X (54.5%), while 25.3% Millennials, 19.8% were Baby
Boomers, and 0.4% were veterans. 56.4% (n = 1,252) of respondents had worked at their
present employer from 0 to 5 years. Those working for their present employer for 6 to 10
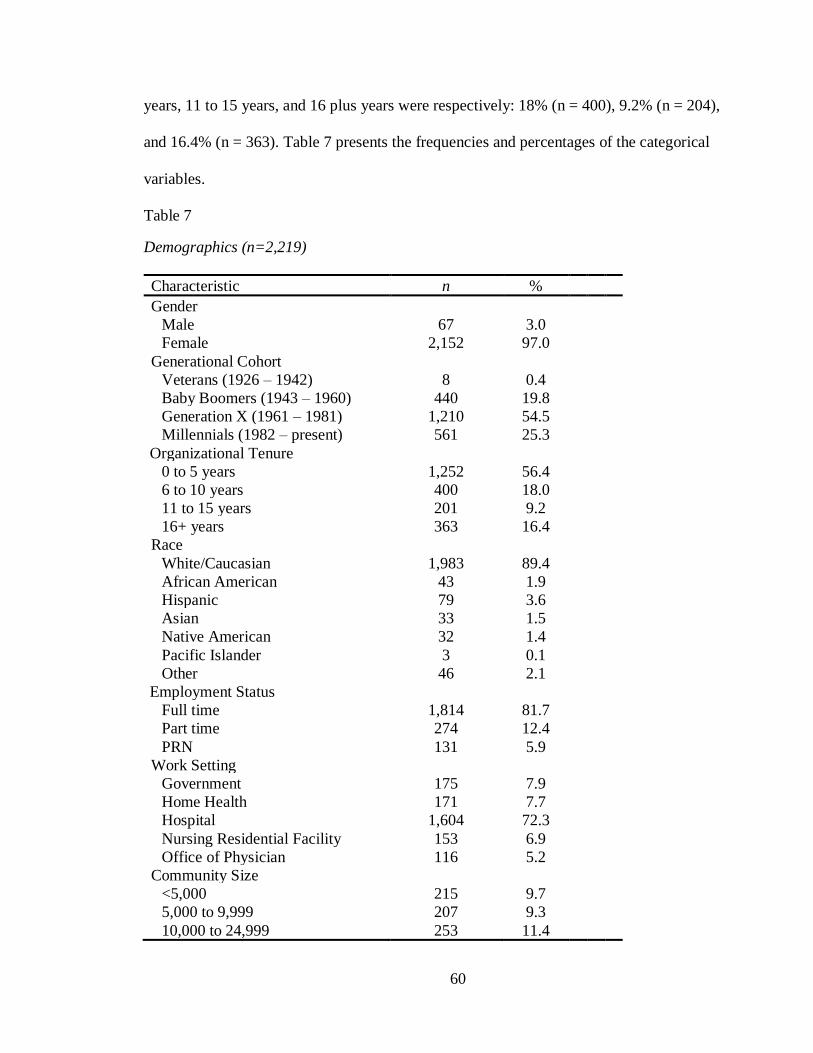
60
years, 11 to 15 years, and 16 plus years were respectively: 18% (n = 400), 9.2% (n = 204),
and 16.4% (n = 363). Table 7 presents the frequencies and percentages of the categorical
variables.
Table 7 Study demographics
Demographics (n=2,219)
Characteristic n %
Gender
Male 67 3.0
Female 2,152 97.0
Generational Cohort
Veterans (1926 – 1942) 8 0.4
Baby Boomers (1943 – 1960) 440 19.8
Generation X (1961 – 1981) 1,210 54.5
Millennials (1982 – present) 561 25.3
Organizational Tenure
0 to 5 years 1,252 56.4
6 to 10 years 400 18.0
11 to 15 years 201 9.2
16+ years 363 16.4
Race
White/Caucasian 1,983 89.4
African American 43 1.9
Hispanic 79 3.6
Asian 33 1.5
Native American 32 1.4
Pacific Islander 3 0.1
Other 46 2.1
Employment Status
Full time 1,814 81.7
Part time 274 12.4
PRN 131 5.9
Work Setting
Government 175 7.9
Home Health 171 7.7
Hospital 1,604 72.3
Nursing Residential Facility 153 6.9
Office of Physician 116 5.2
Community Size
<5,000 215 9.7
5,000 to 9,999 207 9.3
10,000 to 24,999 253 11.4
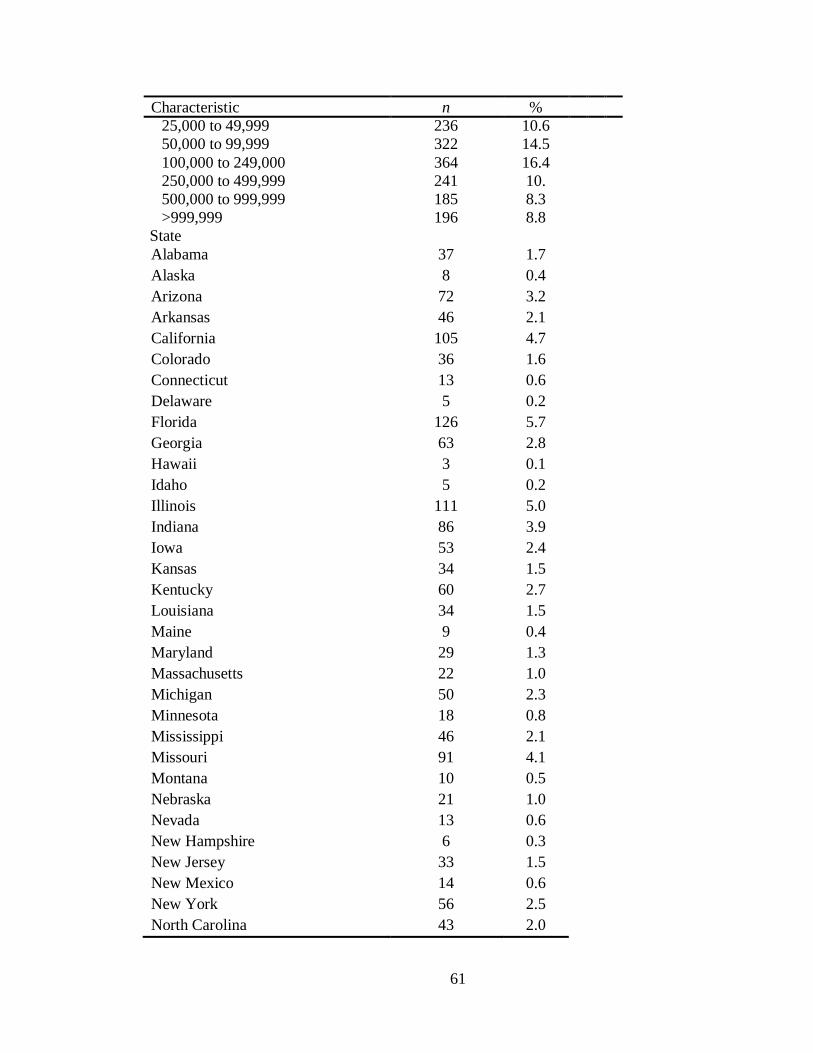
61
Characteristic n %
25,000 to 49,999 236 10.6
50,000 to 99,999 322 14.5
100,000 to 249,000 364 16.4
250,000 to 499,999 241 10.
500,000 to 999,999 185 8.3
>999,999 196 8.8
State
Alabama 37 1.7
Alaska 8 0.4
Arizona 72 3.2
Arkansas 46 2.1
California 105 4.7
Colorado 36 1.6
Connecticut 13 0.6
Delaware 5 0.2
Florida 126 5.7
Georgia 63 2.8
Hawaii 3 0.1
Idaho 5 0.2
Illinois 111 5.0
Indiana 86 3.9
Iowa 53 2.4
Kansas 34 1.5
Kentucky 60 2.7
Louisiana 34 1.5
Maine 9 0.4
Maryland 29 1.3
Massachusetts 22 1.0
Michigan 50 2.3
Minnesota 18 0.8
Mississippi 46 2.1
Missouri 91 4.1
Montana 10 0.5
Nebraska 21 1.0
Nevada 13 0.6
New Hampshire 6 0.3
New Jersey 33 1.5
New Mexico 14 0.6
New York 56 2.5
North Carolina 43 2.0

62
Characteristic n %
North Dakota 7 0.3
Ohio 114 5.1
Oklahoma 59 2.7
Oregon 18 0.8
Pennsylvania 82 3.7
Rhode Island 6 0.3
South Carolina 46 2.1
South Dakota 8 0.4
Tennessee 48 2.2
Texas 279 2.6
Utah 8 0.4
Vermont 2 0.1
Virginia 70 3.2
Washington 35 1.6
West Virginia 29 1.3
Wisconsin 45 2.0
Wyoming 5 0.2
Construct Validity
Exploratory factor analysis (EFA) and reliability analysis were used to assess
construct validity utilizing IBM ® SPSS 24.0.0®. A promax rotation with principal axis
factoring was utilized because of the hypothesized theoretical underlying structure and an
expectation of factor correlation (Browne, 2001). Chrobot-Mason and Aramovich’ (2013)
work was considered when determining the number of factors to extract (i.e., turnover
intention, organizational identification, identity freedom, culture of innovation,
psychological empowerment, equal treatment, and equal access). A coefficient alpha was
used for reliability analysis (Henson, 2001).
The results yielded an order factor structure with three items ET1, ET7, and EA5,
not loading as theoretically expected with values below 0.50. After removing ET1, ET7,
and EA5, the order factor structure yielded loading along theoretical expectations (see
63
Table 8). All seven factors yielded eigenvalues greater than 1 (i.e., 10.96, 2.87, 1.74, 1.36,
1.2, 1.1, 1.05). Together the seven factors explained 75% of the variance. The factors
explained greater than 60% of each items variance, above the threshold advised by
Costello and Osborne (2005), except for seven items – PE1, TI1, OI1, OI2, OI3, IF3, and
EA2 (see h2 in Table 8). The correlation for the remaining items passed EFA statistical
assumptions: (a) The determinant of the matrix was not zero (i.e., 1.6e-10) indicative of a
non-singular correlation matrix. (b) The Kaiser-Meyer-Olkin measure indicated a
sampling adequacy of KMO = .93, above the suggested limit of Field (2013). (c) The
Bartlett test of sphericity produced a p-value less than .001, confirming that the inter-item
correlation matrix was statistically significantly different than an identity matrix
(Snedecor & Cochran, 1989).
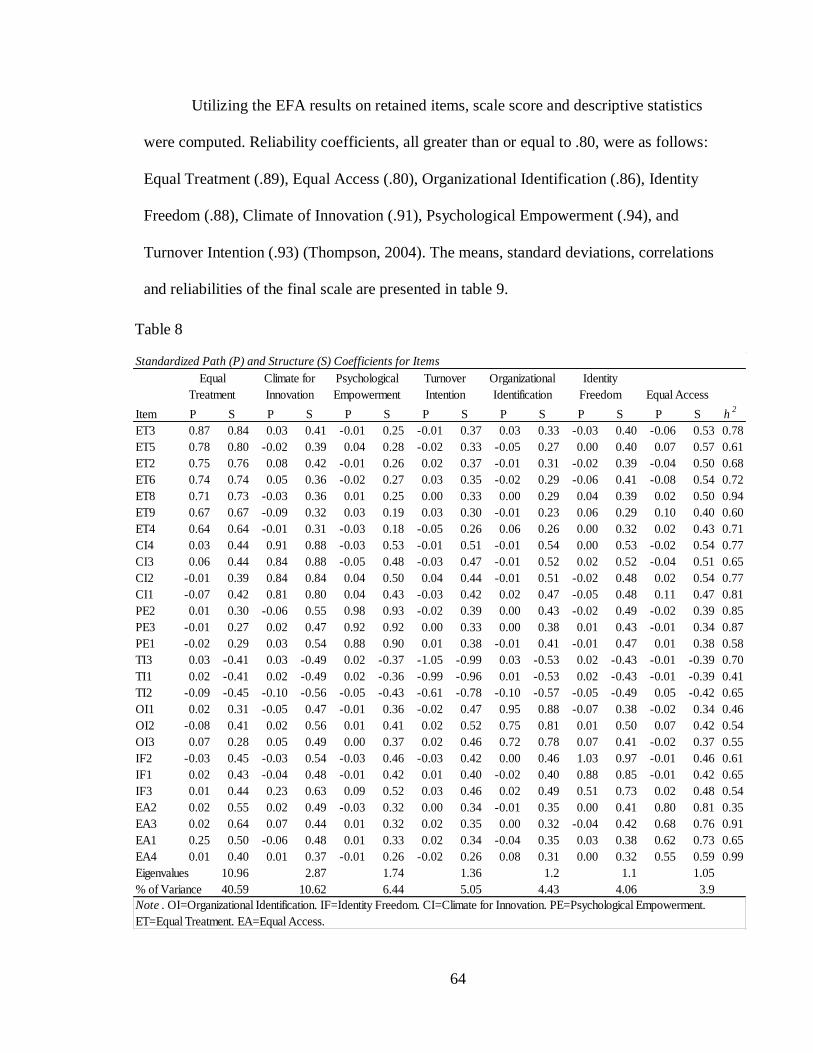
64
Utilizing the EFA results on retained items, scale score and descriptive statistics
were computed. Reliability coefficients, all greater than or equal to .80, were as follows:
Equal Treatment (.89), Equal Access (.80), Organizational Identification (.86), Identity
Freedom (.88), Climate of Innovation (.91), Psychological Empowerment (.94), and
Turnover Intention (.93) (Thompson, 2004). The means, standard deviations, correlations
and reliabilities of the final scale are presented in table 9.
Table 8
Standardized Path (P) and Structure (S) Coefficients for Items
Item P S P S P S P S P S P S P S h2
ET3 0.87 0.84 0.03 0.41 -0.01 0.25 -0.01 0.37 0.03 0.33 -0.03 0.40 -0.06 0.53 0.78
ET5 0.78 0.80 -0.02 0.39 0.04 0.28 -0.02 0.33 -0.05 0.27 0.00 0.40 0.07 0.57 0.61
ET2 0.75 0.76 0.08 0.42 -0.01 0.26 0.02 0.37 -0.01 0.31 -0.02 0.39 -0.04 0.50 0.68
ET6 0.74 0.74 0.05 0.36 -0.02 0.27 0.03 0.35 -0.02 0.29 -0.06 0.41 -0.08 0.54 0.72
ET8 0.71 0.73 -0.03 0.36 0.01 0.25 0.00 0.33 0.00 0.29 0.04 0.39 0.02 0.50 0.94
ET9 0.67 0.67 -0.09 0.32 0.03 0.19 0.03 0.30 -0.01 0.23 0.06 0.29 0.10 0.40 0.60
ET4 0.64 0.64 -0.01 0.31 -0.03 0.18 -0.05 0.26 0.06 0.26 0.00 0.32 0.02 0.43 0.71
CI4 0.03 0.44 0.91 0.88 -0.03 0.53 -0.01 0.51 -0.01 0.54 0.00 0.53 -0.02 0.54 0.77
CI3 0.06 0.44 0.84 0.88 -0.05 0.48 -0.03 0.47 -0.01 0.52 0.02 0.52 -0.04 0.51 0.65
CI2 -0.01 0.39 0.84 0.84 0.04 0.50 0.04 0.44 -0.01 0.51 -0.02 0.48 0.02 0.54 0.77
CI1 -0.07 0.42 0.81 0.80 0.04 0.43 -0.03 0.42 0.02 0.47 -0.05 0.48 0.11 0.47 0.81
PE2 0.01 0.30 -0.06 0.55 0.98 0.93 -0.02 0.39 0.00 0.43 -0.02 0.49 -0.02 0.39 0.85
PE3 -0.01 0.27 0.02 0.47 0.92 0.92 0.00 0.33 0.00 0.38 0.01 0.43 -0.01 0.34 0.87
PE1 -0.02 0.29 0.03 0.54 0.88 0.90 0.01 0.38 -0.01 0.41 -0.01 0.47 0.01 0.38 0.58
TI3 0.03 -0.41 0.03 -0.49 0.02 -0.37 -1.05 -0.99 0.03 -0.53 0.02 -0.43 -0.01 -0.39 0.70
TI1 0.02 -0.41 0.02 -0.49 0.02 -0.36 -0.99 -0.96 0.01 -0.53 0.02 -0.43 -0.01 -0.39 0.41
TI2 -0.09 -0.45 -0.10 -0.56 -0.05 -0.43 -0.61 -0.78 -0.10 -0.57 -0.05 -0.49 0.05 -0.42 0.65
OI1 0.02 0.31 -0.05 0.47 -0.01 0.36 -0.02 0.47 0.95 0.88 -0.07 0.38 -0.02 0.34 0.46
OI2 -0.08 0.41 0.02 0.56 0.01 0.41 0.02 0.52 0.75 0.81 0.01 0.50 0.07 0.42 0.54
OI3 0.07 0.28 0.05 0.49 0.00 0.37 0.02 0.46 0.72 0.78 0.07 0.41 -0.02 0.37 0.55
IF2 -0.03 0.45 -0.03 0.54 -0.03 0.46 -0.03 0.42 0.00 0.46 1.03 0.97 -0.01 0.46 0.61
IF1 0.02 0.43 -0.04 0.48 -0.01 0.42 0.01 0.40 -0.02 0.40 0.88 0.85 -0.01 0.42 0.65
IF3 0.01 0.44 0.23 0.63 0.09 0.52 0.03 0.46 0.02 0.49 0.51 0.73 0.02 0.48 0.54
EA2 0.02 0.55 0.02 0.49 -0.03 0.32 0.00 0.34 -0.01 0.35 0.00 0.41 0.80 0.81 0.35
EA3 0.02 0.64 0.07 0.44 0.01 0.32 0.02 0.35 0.00 0.32 -0.04 0.42 0.68 0.76 0.91
EA1 0.25 0.50 -0.06 0.48 0.01 0.33 0.02 0.34 -0.04 0.35 0.03 0.38 0.62 0.73 0.65
EA4 0.01 0.40 0.01 0.37 -0.01 0.26 -0.02 0.26 0.08 0.31 0.00 0.32 0.55 0.59 0.99
Eigenvalues 10.96 2.87 1.74 1.36 1.2 1.1 1.05
% of Variance 40.59 10.62 6.44 5.05 4.43 4.06 3.9
Note . OI=Organizational Identification. IF=Identity Freedom. CI=Climate for Innovation. PE=Psychological Empowerment.
ET=Equal Treatment. EA=Equal Access.
Equal Access
Equal
Treatment
Climate for
Innovation
Psychological
Empowerment
Turnover
Intention
Organizational
Identification
Identity
Freedom
Table 8 Study EFA standardized path and structure coefficients
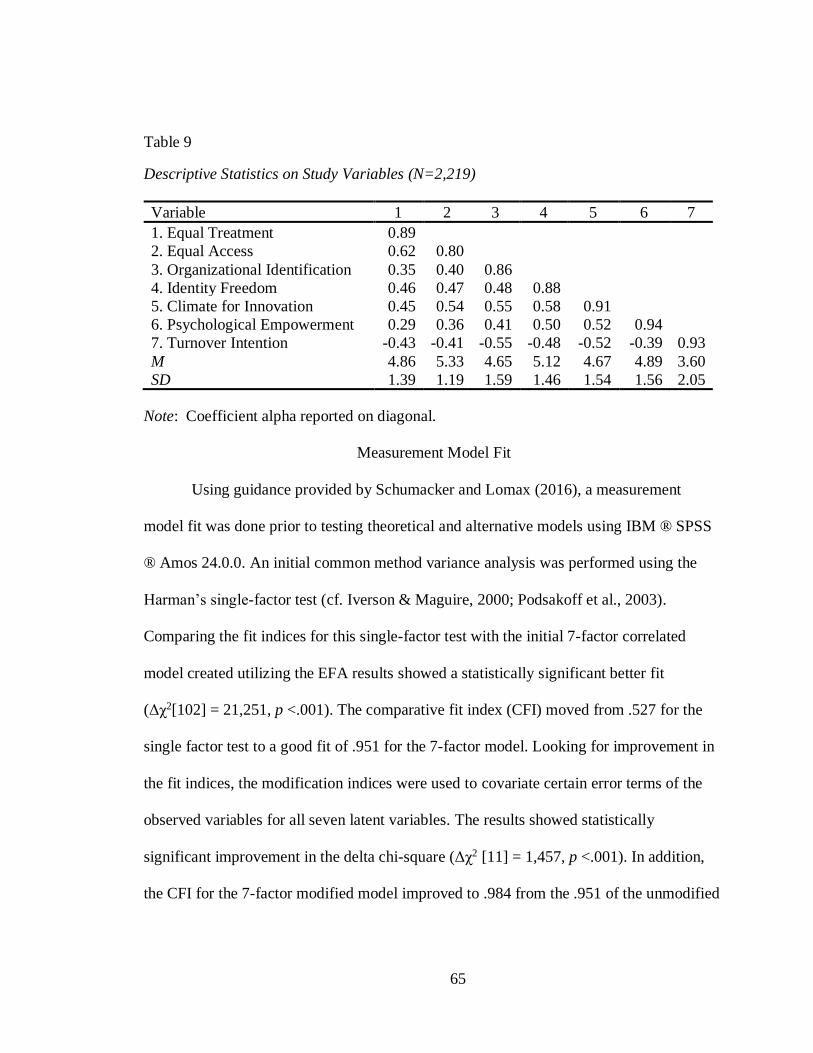
65
Table 9 Study descriptive statistics
Descriptive Statistics on Study Variables (N=2,219)
Variable 1 2 3 4 5 6 7
1. Equal Treatment 0.89
2. Equal Access 0.62 0.80
3. Organizational Identification 0.35 0.40 0.86
4. Identity Freedom 0.46 0.47 0.48 0.88
5. Climate for Innovation 0.45 0.54 0.55 0.58 0.91
6. Psychological Empowerment 0.29 0.36 0.41 0.50 0.52 0.94
7. Turnover Intention -0.43 -0.41 -0.55 -0.48 -0.52 -0.39 0.93
M 4.86 5.33 4.65 5.12 4.67 4.89 3.60
SD 1.39 1.19 1.59 1.46 1.54 1.56 2.05
Note: Coefficient alpha reported on diagonal.
Measurement Model Fit
Using guidance provided by Schumacker and Lomax (2016), a measurement
model fit was done prior to testing theoretical and alternative models using IBM ® SPSS
® Amos 24.0.0. An initial common method variance analysis was performed using the
Harman’s single-factor test (cf. Iverson & Maguire, 2000; Podsakoff et al., 2003).
Comparing the fit indices for this single-factor test with the initial 7-factor correlated
model created utilizing the EFA results showed a statistically significant better fit
(Δχ2[102] = 21,251, p <.001). The comparative fit index (CFI) moved from .527 for the
single factor test to a good fit of .951 for the 7-factor model. Looking for improvement in
the fit indices, the modification indices were used to covariate certain error terms of the
observed variables for all seven latent variables. The results showed statistically
significant improvement in the delta chi-square (Δχ2 [11] = 1,457, p <.001). In addition,
the CFI for the 7-factor modified model improved to .984 from the .951 of the unmodified
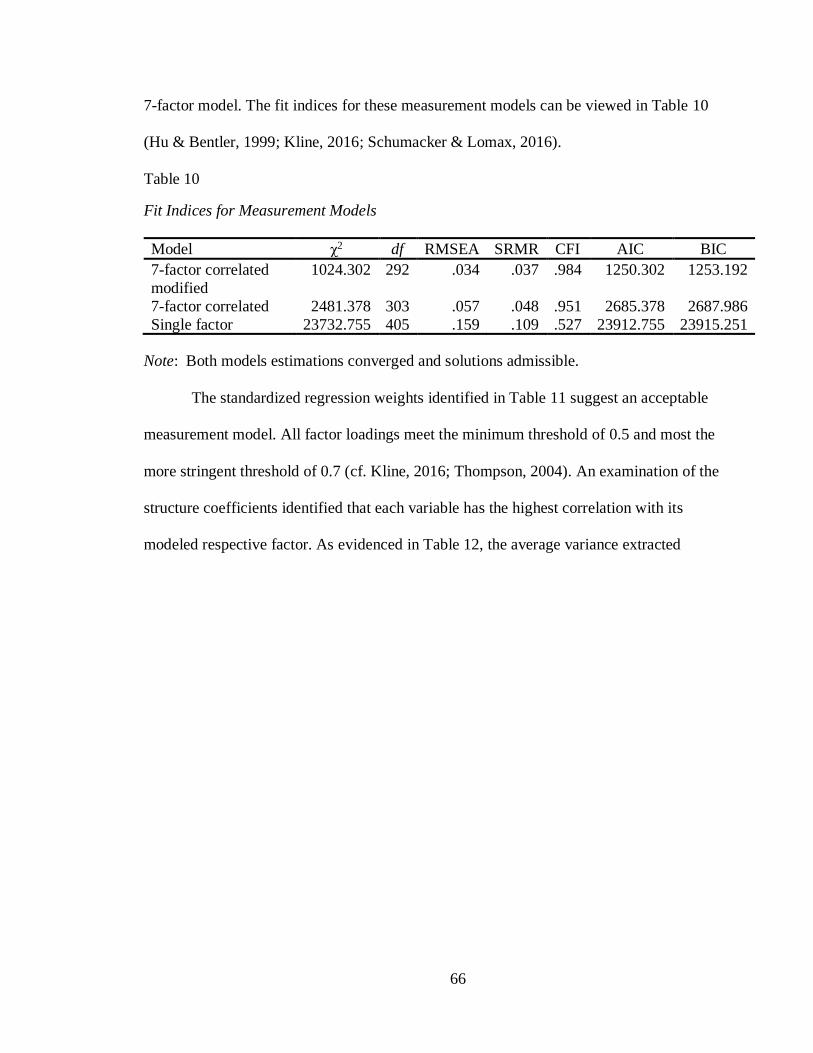
66
7-factor model. The fit indices for these measurement models can be viewed in Table 10
(Hu & Bentler, 1999; Kline, 2016; Schumacker & Lomax, 2016).
Table 10 Study fit indices for measurement models
Fit Indices for Measurement Models
Model χ2 df RMSEA SRMR CFI AIC BIC
7-factor correlated
modified
1024.302 292 .034 .037 .984 1250.302 1253.192
7-factor correlated 2481.378 303 .057 .048 .951 2685.378 2687.986
Single factor 23732.755 405 .159 .109 .527 23912.755 23915.251
Note: Both models estimations converged and solutions admissible.
The standardized regression weights identified in Table 11 suggest an acceptable
measurement model. All factor loadings meet the minimum threshold of 0.5 and most the
more stringent threshold of 0.7 (cf. Kline, 2016; Thompson, 2004). An examination of the
structure coefficients identified that each variable has the highest correlation with its
modeled respective factor. As evidenced in Table 12, the average variance extracted
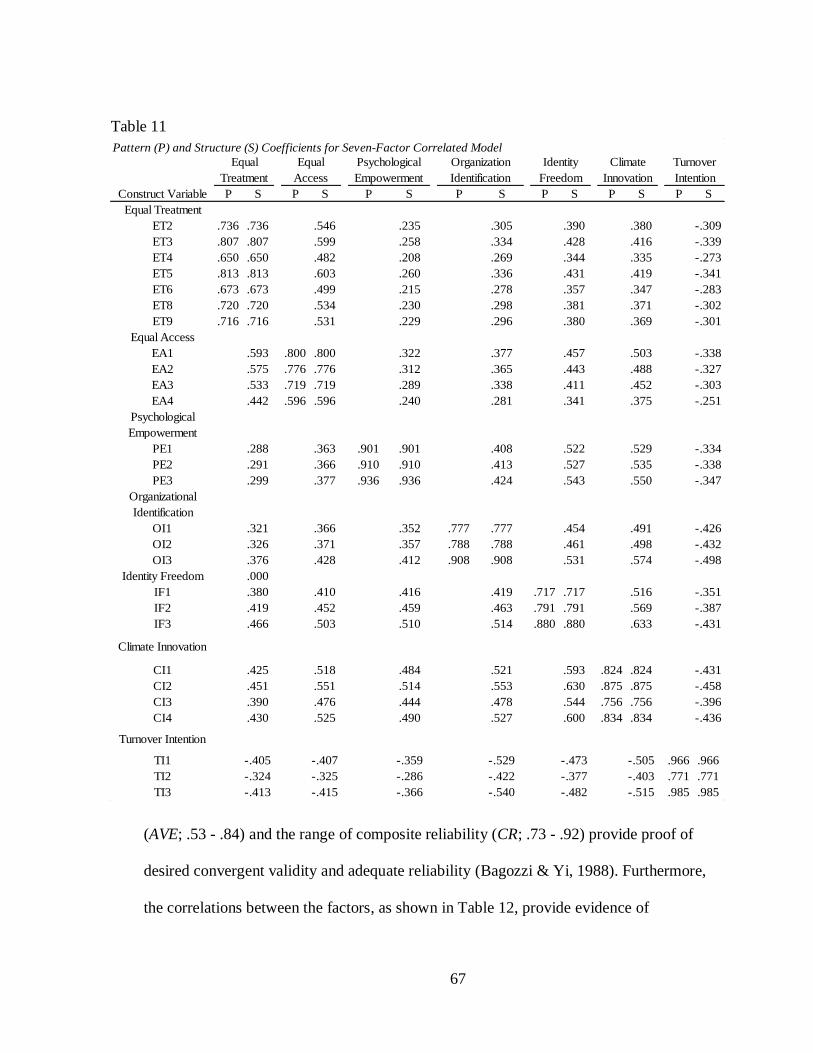
67
(AVE; .53 - .84) and the range of composite reliability (CR; .73 - .92) provide proof of
desired convergent validity and adequate reliability (Bagozzi & Yi, 1988). Furthermore,
the correlations between the factors, as shown in Table 12, provide evidence of
Table 11 Study CFA pattern and structure coefficients for seven-factor correlated model
Table 11
Pattern (P) and Structure (S) Coefficients for Seven-Factor Correlated Model
Construct Variable P S P S P S P S P S P S P S
Equal Treatment
ET2 .736 .736 .546 .235 .305 .390 .380 -.309
ET3 .807 .807 .599 .258 .334 .428 .416 -.339
ET4 .650 .650 .482 .208 .269 .344 .335 -.273
ET5 .813 .813 .603 .260 .336 .431 .419 -.341
ET6 .673 .673 .499 .215 .278 .357 .347 -.283
ET8 .720 .720 .534 .230 .298 .381 .371 -.302
ET9 .716 .716 .531 .229 .296 .380 .369 -.301
Equal Access
EA1 .593 .800 .800 .322 .377 .457 .503 -.338
EA2 .575 .776 .776 .312 .365 .443 .488 -.327
EA3 .533 .719 .719 .289 .338 .411 .452 -.303
EA4 .442 .596 .596 .240 .281 .341 .375 -.251
Psychological
Empowerment
PE1 .288 .363 .901 .901 .408 .522 .529 -.334
PE2 .291 .366 .910 .910 .413 .527 .535 -.338
PE3 .299 .377 .936 .936 .424 .543 .550 -.347
Organizational
Identification
OI1 .321 .366 .352 .777 .777 .454 .491 -.426
OI2 .326 .371 .357 .788 .788 .461 .498 -.432
OI3 .376 .428 .412 .908 .908 .531 .574 -.498
Identity Freedom .000
IF1 .380 .410 .416 .419 .717 .717 .516 -.351
IF2 .419 .452 .459 .463 .791 .791 .569 -.387
IF3 .466 .503 .510 .514 .880 .880 .633 -.431
Climate Innovation
CI1 .425 .518 .484 .521 .593 .824 .824 -.431
CI2 .451 .551 .514 .553 .630 .875 .875 -.458
CI3 .390 .476 .444 .478 .544 .756 .756 -.396
CI4 .430 .525 .490 .527 .600 .834 .834 -.436
Turnover Intention
TI1 -.405 -.407 -.359 -.529 -.473 -.505 .966 .966
TI2 -.324 -.325 -.286 -.422 -.377 -.403 .771 .771
TI3 -.413 -.415 -.366 -.540 -.482 -.515 .985 .985
Turnover
Intention
Equal
Treatment
Equal
Access
Psychological
Empowerment
Organization
Identification
Identity
Freedom
Climate
Innovation
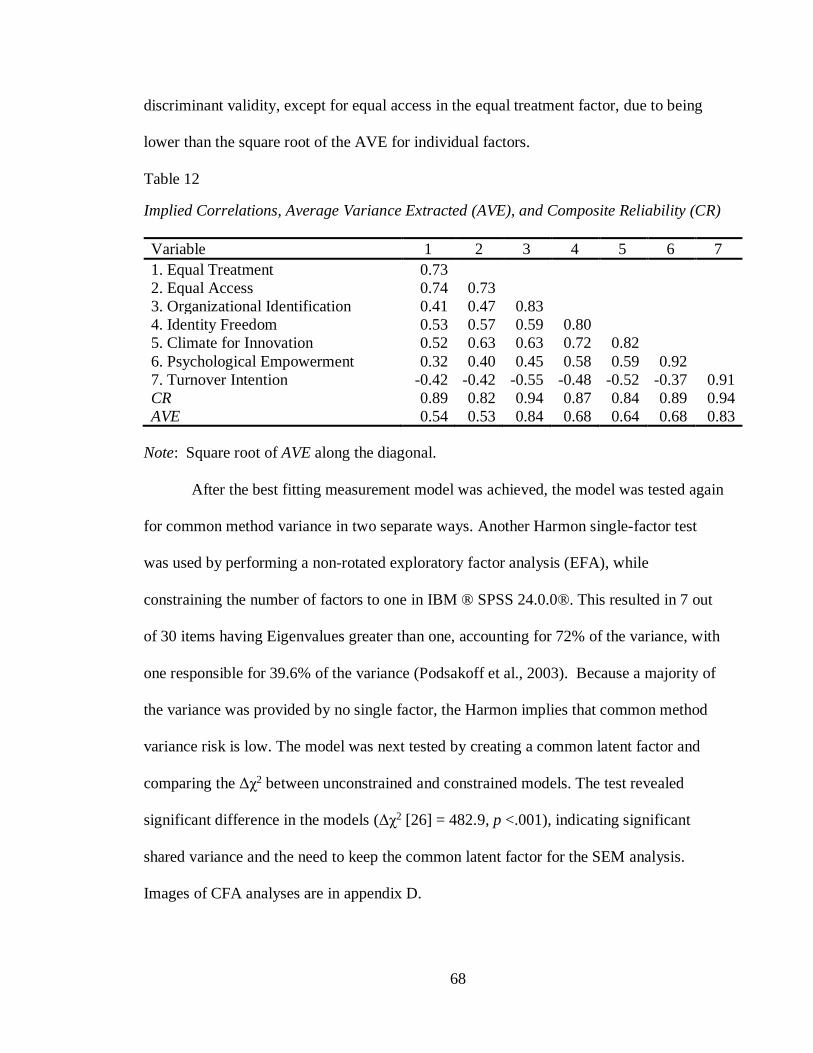
68
discriminant validity, except for equal access in the equal treatment factor, due to being
lower than the square root of the AVE for individual factors.
Table 12 Study implied correlations, AVE, and CR
Implied Correlations, Average Variance Extracted (AVE), and Composite Reliability (CR)
Variable 1 2 3 4 5 6 7
1. Equal Treatment 0.73
2. Equal Access 0.74 0.73
3. Organizational Identification 0.41 0.47 0.83
4. Identity Freedom 0.53 0.57 0.59 0.80
5. Climate for Innovation 0.52 0.63 0.63 0.72 0.82
6. Psychological Empowerment 0.32 0.40 0.45 0.58 0.59 0.92
7. Turnover Intention -0.42 -0.42 -0.55 -0.48 -0.52 -0.37 0.91
CR 0.89 0.82 0.94 0.87 0.84 0.89 0.94
AVE 0.54 0.53 0.84 0.68 0.64 0.68 0.83
Note: Square root of AVE along the diagonal.
After the best fitting measurement model was achieved, the model was tested again
for common method variance in two separate ways. Another Harmon single-factor test
was used by performing a non-rotated exploratory factor analysis (EFA), while
constraining the number of factors to one in IBM ® SPSS 24.0.0®. This resulted in 7 out
of 30 items having Eigenvalues greater than one, accounting for 72% of the variance, with
one responsible for 39.6% of the variance (Podsakoff et al., 2003). Because a majority of
the variance was provided by no single factor, the Harmon implies that common method
variance risk is low. The model was next tested by creating a common latent factor and
comparing the Δχ2 between unconstrained and constrained models. The test revealed
significant difference in the models (Δχ2 [26] = 482.9, p <.001), indicating significant
shared variance and the need to keep the common latent factor for the SEM analysis.
Images of CFA analyses are in appendix D.

69
Structural Equation Model
Using imputed factors from the CFA, that retain the common latent factor, the
study’s theoretical model was used to create the initial structural model. The fully
saturated model included the following factors: equal treatment, equal access,
psychological empowerment, organizational identification, identity freedom, climate of
innovation, and turnover intentions (Figure 6).
The initial model with no control variable did not show good model fit (χ2(6)
=2873.18, p<.001, CFI= .724, TLI= .035, SRMR= .156, RMSEA= .464). In addition, the
significant p value for the Chi-square identifies that the observed and implied model
covariance matrices are significantly different. Because of organizational tenure’s
empirical and conceptual links with turnover and organizational identification, tenure was
used as a control variable (Griffeth et al., 2000; Mathieu & Zajac, 1990). Tenure was
measured using a 4-point scale (1 = 0 to 5 years, 2 = 6 to 10 years, 3 = 11 to 15 years, 4 =
Figure 6. Theoretical Model of Study
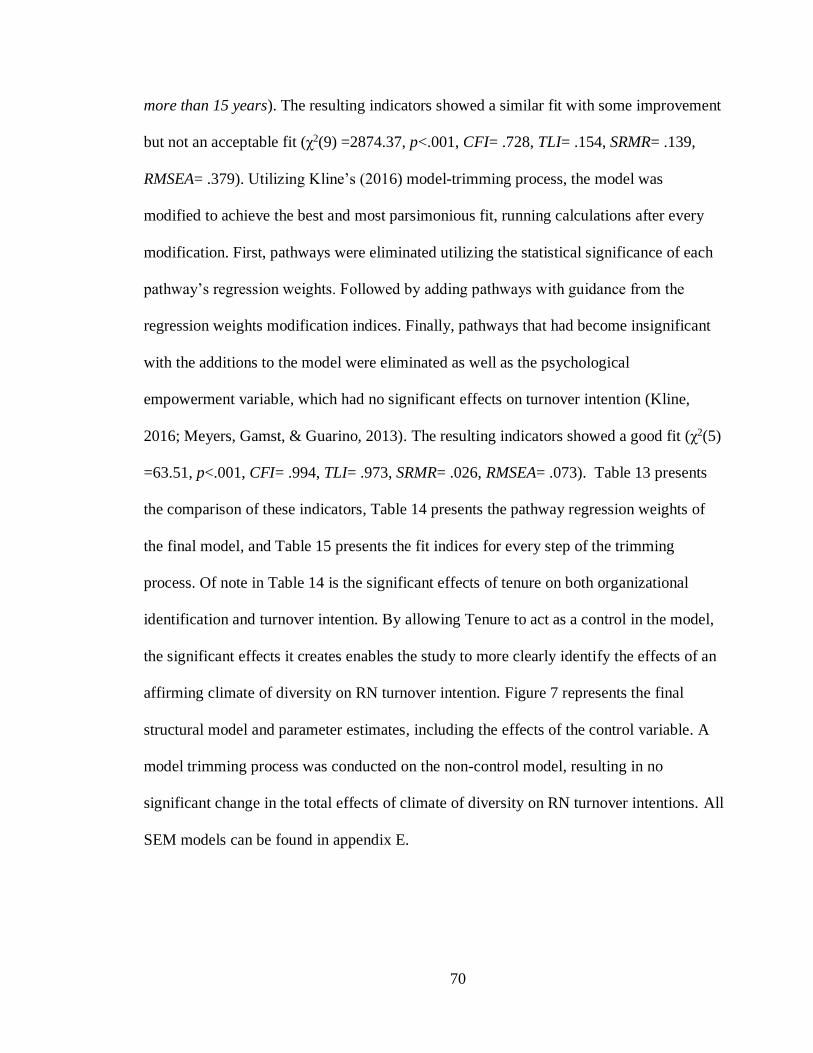
70
more than 15 years). The resulting indicators showed a similar fit with some improvement
but not an acceptable fit (χ2(9) =2874.37, p<.001, CFI= .728, TLI= .154, SRMR= .139,
RMSEA= .379). Utilizing Kline’s (2016) model-trimming process, the model was
modified to achieve the best and most parsimonious fit, running calculations after every
modification. First, pathways were eliminated utilizing the statistical significance of each
pathway’s regression weights. Followed by adding pathways with guidance from the
regression weights modification indices. Finally, pathways that had become insignificant
with the additions to the model were eliminated as well as the psychological
empowerment variable, which had no significant effects on turnover intention (Kline,
2016; Meyers, Gamst, & Guarino, 2013). The resulting indicators showed a good fit (χ2(5)
=63.51, p<.001, CFI= .994, TLI= .973, SRMR= .026, RMSEA= .073). Table 13 presents
the comparison of these indicators, Table 14 presents the pathway regression weights of
the final model, and Table 15 presents the fit indices for every step of the trimming
process. Of note in Table 14 is the significant effects of tenure on both organizational
identification and turnover intention. By allowing Tenure to act as a control in the model,
the significant effects it creates enables the study to more clearly identify the effects of an
affirming climate of diversity on RN turnover intention. Figure 7 represents the final
structural model and parameter estimates, including the effects of the control variable. A
model trimming process was conducted on the non-control model, resulting in no
significant change in the total effects of climate of diversity on RN turnover intentions. All
SEM models can be found in appendix E.
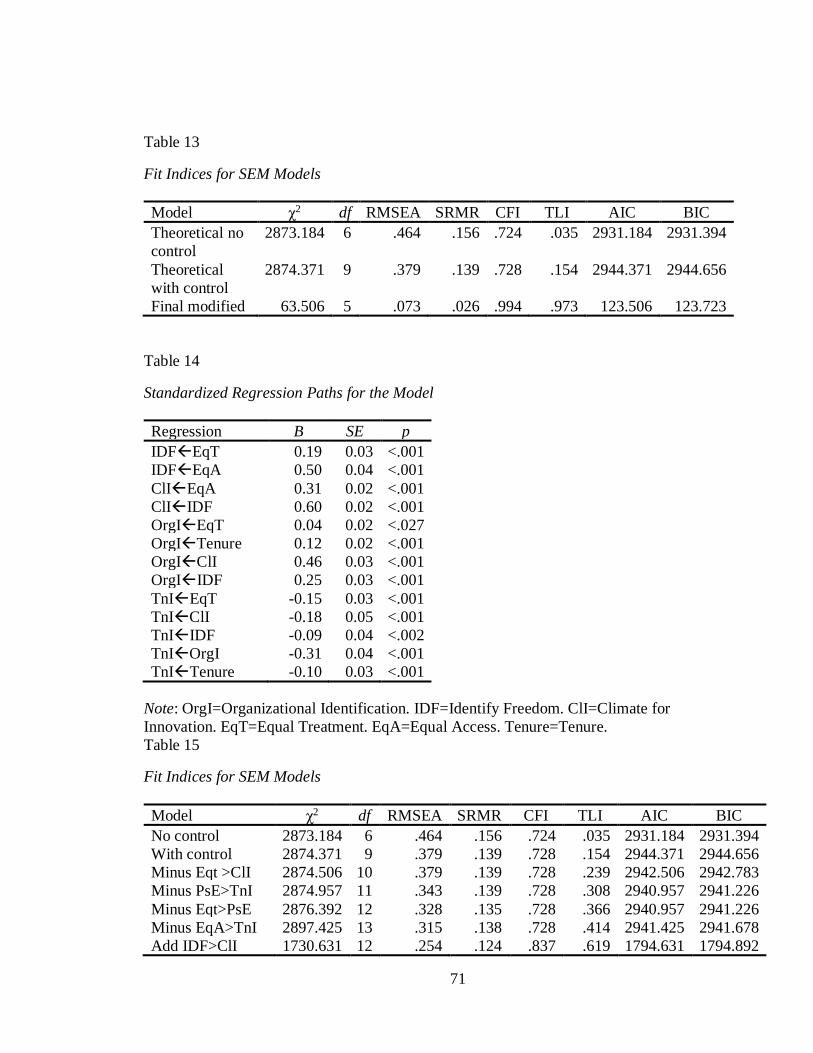
71
Table 13 Fit indices for SEM models
Fit Indices for SEM Models
Model χ2 df RMSEA SRMR CFI TLI AIC BIC
Theoretical no
control
2873.184 6 .464 .156 .724 .035 2931.184 2931.394
Theoretical
with control
2874.371 9 .379 .139 .728 .154 2944.371 2944.656
Final modified 63.506 5 .073 .026 .994 .973 123.506 123.723
Table 14 Standardized regression paths for final model
Standardized Regression Paths for the Model
Regression B SE p
IDFEqT 0.19 0.03 <.001
IDFEqA 0.50 0.04 <.001
ClIEqA 0.31 0.02 <.001
ClIIDF 0.60 0.02 <.001
OrgIEqT 0.04 0.02 <.027
OrgITenure 0.12 0.02 <.001
OrgIClI 0.46 0.03 <.001
OrgIIDF 0.25 0.03 <.001
TnIEqT -0.15 0.03 <.001
TnIClI -0.18 0.05 <.001
TnIIDF -0.09 0.04 <.002
TnIOrgI -0.31 0.04 <.001
TnITenure -0.10 0.03 <.001
Note: OrgI=Organizational Identification. IDF=Identify Freedom. ClI=Climate for
Innovation. EqT=Equal Treatment. EqA=Equal Access. Tenure=Tenure.
Table 15 Fit indices for all SEM models
Fit Indices for SEM Models
Model χ2 df RMSEA SRMR CFI TLI AIC BIC
No control 2873.184 6 .464 .156 .724 .035 2931.184 2931.394
With control 2874.371 9 .379 .139 .728 .154 2944.371 2944.656
Minus Eqt >ClI 2874.506 10 .379 .139 .728 .239 2942.506 2942.783
Minus PsE>TnI 2874.957 11 .343 .139 .728 .308 2940.957 2941.226
Minus Eqt>PsE 2876.392 12 .328 .135 .728 .366 2940.957 2941.226
Minus EqA>TnI 2897.425 13 .315 .138 .728 .414 2941.425 2941.678
Add IDF>ClI 1730.631 12 .254 .124 .837 .619 1794.631 1794.892
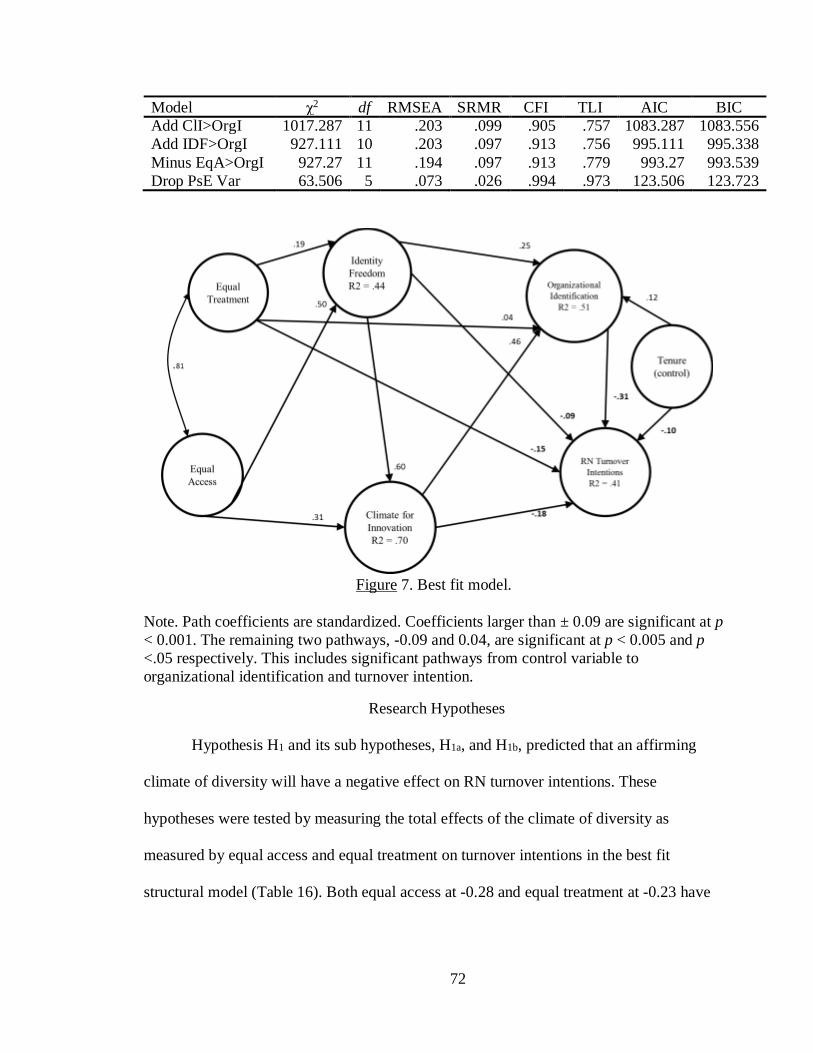
72
Model χ2 df RMSEA SRMR CFI TLI AIC BIC
Add ClI>OrgI 1017.287 11 .203 .099 .905 .757 1083.287 1083.556
Add IDF>OrgI 927.111 10 .203 .097 .913 .756 995.111 995.338
Minus EqA>OrgI 927.27 11 .194 .097 .913 .779 993.27 993.539
Drop PsE Var 63.506 5 .073 .026 .994 .973 123.506 123.723
Figure 7. Best fit model.
Note. Path coefficients are standardized. Coefficients larger than ± 0.09 are significant at p
< 0.001. The remaining two pathways, -0.09 and 0.04, are significant at p < 0.005 and p
<.05 respectively. This includes significant pathways from control variable to
organizational identification and turnover intention.
Research Hypotheses
Hypothesis H1 and its sub hypotheses, H1a, and H1b, predicted that an affirming
climate of diversity will have a negative effect on RN turnover intentions. These
hypotheses were tested by measuring the total effects of the climate of diversity as
measured by equal access and equal treatment on turnover intentions in the best fit
structural model (Table 16). Both equal access at -0.28 and equal treatment at -0.23 have
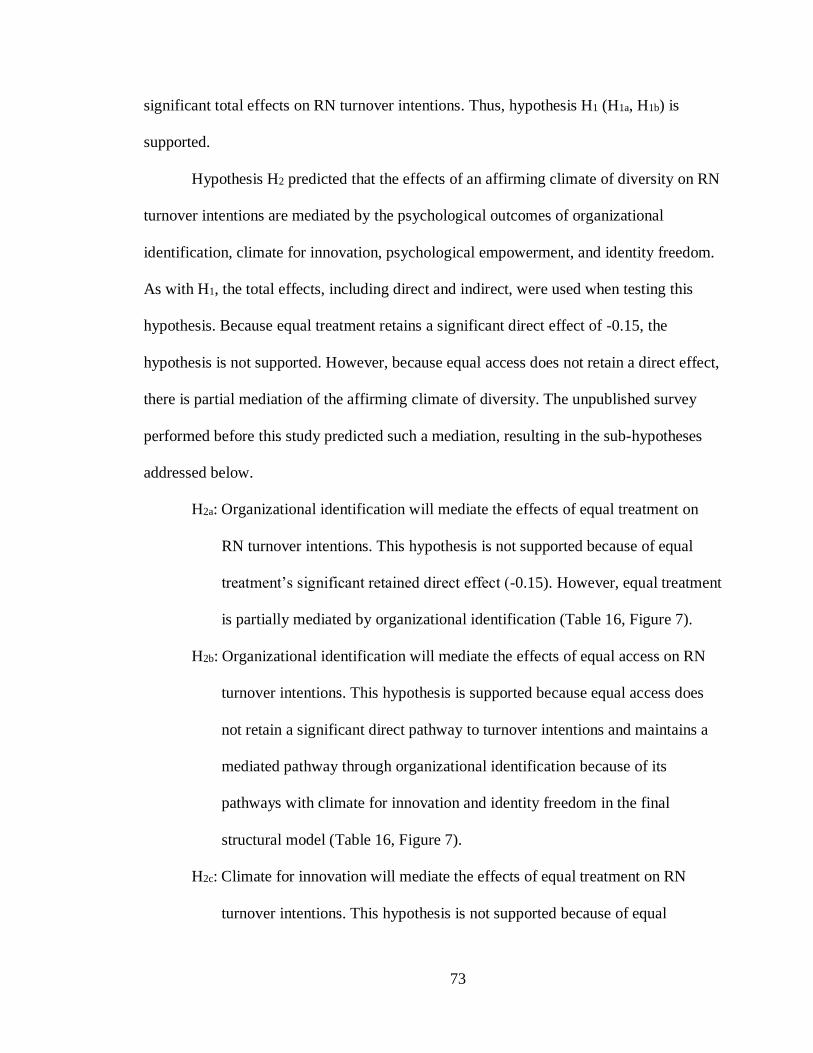
73
significant total effects on RN turnover intentions. Thus, hypothesis H1 (H1a, H1b) is
supported.
Hypothesis H2 predicted that the effects of an affirming climate of diversity on RN
turnover intentions are mediated by the psychological outcomes of organizational
identification, climate for innovation, psychological empowerment, and identity freedom.
As with H1, the total effects, including direct and indirect, were used when testing this
hypothesis. Because equal treatment retains a significant direct effect of -0.15, the
hypothesis is not supported. However, because equal access does not retain a direct effect,
there is partial mediation of the affirming climate of diversity. The unpublished survey
performed before this study predicted such a mediation, resulting in the sub-hypotheses
addressed below.
H2a: Organizational identification will mediate the effects of equal treatment on
RN turnover intentions. This hypothesis is not supported because of equal
treatment’s significant retained direct effect (-0.15). However, equal treatment
is partially mediated by organizational identification (Table 16, Figure 7).
H2b: Organizational identification will mediate the effects of equal access on RN
turnover intentions. This hypothesis is supported because equal access does
not retain a significant direct pathway to turnover intentions and maintains a
mediated pathway through organizational identification because of its
pathways with climate for innovation and identity freedom in the final
structural model (Table 16, Figure 7).
H2c: Climate for innovation will mediate the effects of equal treatment on RN
turnover intentions. This hypothesis is not supported because of equal
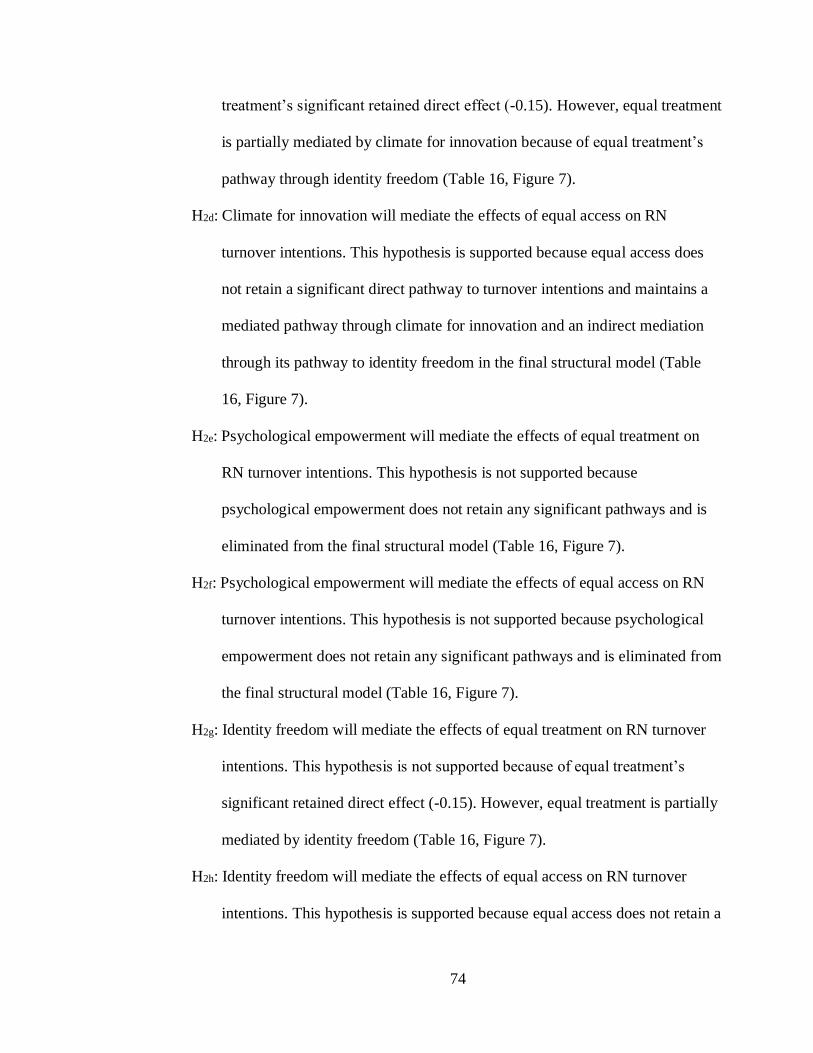
74
treatment’s significant retained direct effect (-0.15). However, equal treatment
is partially mediated by climate for innovation because of equal treatment’s
pathway through identity freedom (Table 16, Figure 7).
H2d: Climate for innovation will mediate the effects of equal access on RN
turnover intentions. This hypothesis is supported because equal access does
not retain a significant direct pathway to turnover intentions and maintains a
mediated pathway through climate for innovation and an indirect mediation
through its pathway to identity freedom in the final structural model (Table
16, Figure 7).
H2e: Psychological empowerment will mediate the effects of equal treatment on
RN turnover intentions. This hypothesis is not supported because
psychological empowerment does not retain any significant pathways and is
eliminated from the final structural model (Table 16, Figure 7).
H2f: Psychological empowerment will mediate the effects of equal access on RN
turnover intentions. This hypothesis is not supported because psychological
empowerment does not retain any significant pathways and is eliminated from
the final structural model (Table 16, Figure 7).
H2g: Identity freedom will mediate the effects of equal treatment on RN turnover
intentions. This hypothesis is not supported because of equal treatment’s
significant retained direct effect (-0.15). However, equal treatment is partially
mediated by identity freedom (Table 16, Figure 7).
H2h: Identity freedom will mediate the effects of equal access on RN turnover
intentions. This hypothesis is supported because equal access does not retain a

75
significant direct pathway to turnover intentions and maintains a mediated
pathway through identity freedom in the final structural model (Table 16,
Figure 7).
Table 16 Total, direct, and indirect effect of diversity climate
Total, Direct, and Indirect Effects of Diversity Climate Perceptions on Variables
Diversity Climate
Dimension
Identity
Freedom
Climate for
Innovation
Organizational
Identification
Turnover
Intentions
Equal treatment
Total 0.19 0.11 0.14 -0.23
Direct 0.19 0.00 0.04 -0.15
Total indirect 0.00 0.11 0.10 -0.08
Equal Access
Total 0.50 0.61 0.40 -0.28
Direct 0.50 0.31 0.00 0.00
Total indirect 0.00 0.30 0.40 -0.28
Note: Total effects are equal to the sum of direct effects plus total indirect effects.
Hypothesis H3 predicted that the four psychological outcomes of organizational
identification, climate for innovation, psychological empowerment, and identity freedom
will mediate the overall effects of an affirming climate of diversity on RN turnover
intentions across demographic subgroups. To test this hypothesis, the data for each
demographic subgroup (baby boomers, generation x, and millennials) were applied to the
hypothetical structural model. The same Kline (2016) trimming process was followed for
each subgroup to obtain the best fitting and most parsimonious structural model (Meyers
et al., 2013). This hypothesis was tested by measuring the total effects of the climate of
diversity as measured by equal access and equal treatment on turnover intentions for each
subgroup’s best fit structural model (Table 17). This hypothesis was not supported
because equal treatment retains a significant direct effect on turnover intentions for each
subgroup.
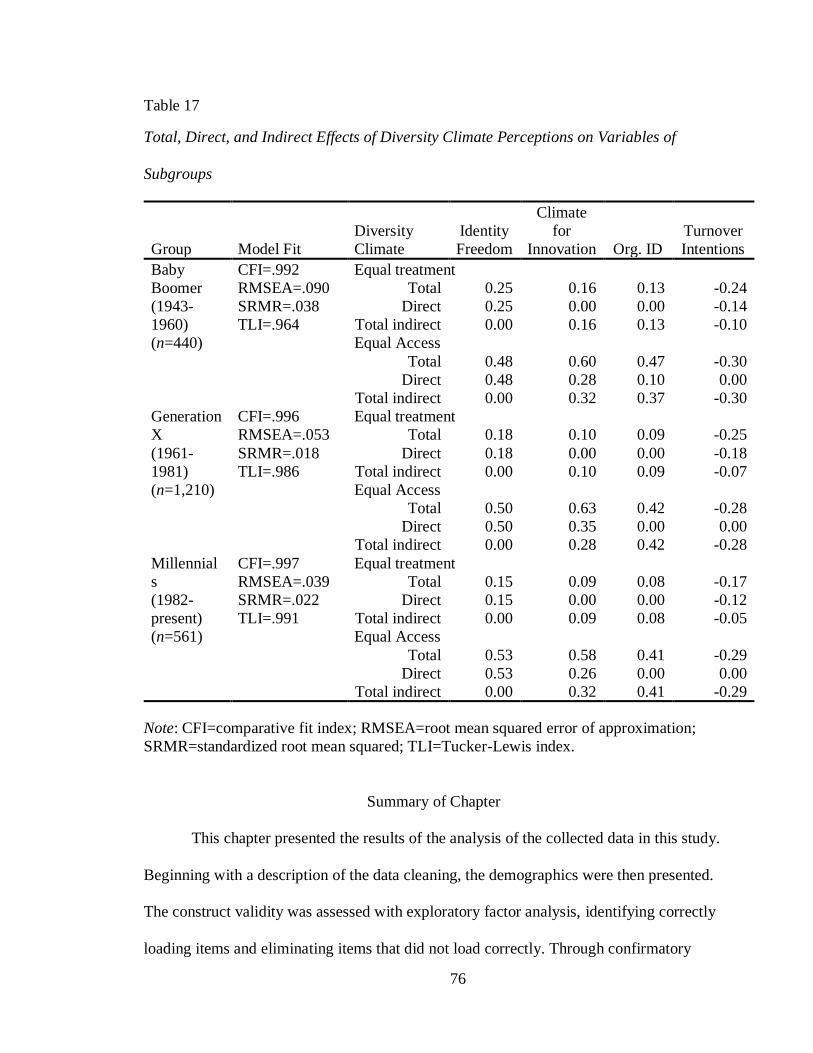
76
Table 17 Total, direct, and indirect effects of diversity climate of subgroups
Total, Direct, and Indirect Effects of Diversity Climate Perceptions on Variables of
Subgroups
Group Model Fit
Diversity
Climate
Identity
Freedom
Climate
for
Innovation Org. ID
Turnover
Intentions
Baby
Boomer
(1943-
1960)
(n=440)
CFI=.992
RMSEA=.090
SRMR=.038
TLI=.964
Equal treatment
Total 0.25 0.16 0.13 -0.24
Direct 0.25 0.00 0.00 -0.14
Total indirect 0.00 0.16 0.13 -0.10
Equal Access
Total 0.48 0.60 0.47 -0.30
Direct 0.48 0.28 0.10 0.00
Total indirect 0.00 0.32 0.37 -0.30
Generation
X
(1961-
1981)
(n=1,210)
CFI=.996
RMSEA=.053
SRMR=.018
TLI=.986
Equal treatment
Total 0.18 0.10 0.09 -0.25
Direct 0.18 0.00 0.00 -0.18
Total indirect 0.00 0.10 0.09 -0.07
Equal Access
Total 0.50 0.63 0.42 -0.28
Direct 0.50 0.35 0.00 0.00
Total indirect 0.00 0.28 0.42 -0.28
Millennial
s
(1982-
present)
(n=561)
CFI=.997
RMSEA=.039
SRMR=.022
TLI=.991
Equal treatment
Total 0.15 0.09 0.08 -0.17
Direct 0.15 0.00 0.00 -0.12
Total indirect 0.00 0.09 0.08 -0.05
Equal Access
Total 0.53 0.58 0.41 -0.29
Direct 0.53 0.26 0.00 0.00
Total indirect 0.00 0.32 0.41 -0.29
Note: CFI=comparative fit index; RMSEA=root mean squared error of approximation;
SRMR=standardized root mean squared; TLI=Tucker-Lewis index.
Summary of Chapter
This chapter presented the results of the analysis of the collected data in this study.
Beginning with a description of the data cleaning, the demographics were then presented.
The construct validity was assessed with exploratory factor analysis, identifying correctly
loading items and eliminating items that did not load correctly. Through confirmatory
77
factor analysis, the best measurement model was defined and it was determined that,
because of common method bias, the structural equation modeling needed to retain a
common latent factor, resulting in imputed latent factors for the SEM.
The initial structural model was first tested without a control variable and was
found to not have good fit. As the control variable was added, the fit remained the same.
Kline’s (2016) trimming process was used to attain the most parsimonious and best fitting
structural model. Finally, the analyses of the hypothesized relationships were presented,
involving the presentation of structural models for demographic subgroups.
78
Chapter 5 – Discussion
Introduction
This chapter provides an examination of the research study. Included in the chapter
are summaries of the study, identified research questions, key literature supporting study,
study methods, and findings. Conclusions from the findings are given and discussed along
with implications, practical uses, limitations, and opportunities for future research.
Summary of Study
The Affordable Care Act of 2010 created a scenario in the health care payment
methodology that moves reimbursement from a fee-for-service model (payment for every
service provided) to one that focuses on payment for illness prevention and management
of population health. Registered nurses, in addition to providing acute care services, are
vital in providing preventative services, making them essential to population health.
RN turnover has been and continues to be well above the national labor workforce
average (P. Cox et al., 2014). This problem in nursing has become more noticeable with
the changes occurring with The Affordable Care Act. In addition, nursing turnover
literature has called for adopting concepts from general management literature to create
solutions.
An area of general management research that is pertinent to health care is the
influence of diversity climate on employee turnover. The dynamic demographics of the
United States have been recognized by the government and resulted in the requirement of
health care organizations to develop a diverse workforce and cultural competency or
understanding of different cultures within the workforce (The Joint Commission, 2010).
Scholars researching both the general workplace environment as well as the nursing
79
workplace posit that creating diverse workgroups results in ingenious ideas and solutions,
better decision making, and better understanding of coworkers because different opinions
and backgrounds will improve effectiveness (Chrobot-Mason & Leslie, 2012; Parker,
2010; Rose, 2011). However, the effective management of a diverse work environment is
crucial. When the workplace does not support diverse employees or opinions, results may
include harassment and discrimination, turnover, and intergroup conflict (Chrobot-Mason
& Aramovich, 2013; Chung et al., 2015; K. Jehn et al., 2008; McKay et al., 2007).
Herdman and McMillan-Capehart (2010) and Chung et al. (2015) in their studies of
diversity climates called for further research on how diversity climate perceptions
influence individual and organizational outcomes. Additionally, in their testing of
diversity climate effects on employee outcomes, Buttner, Lowe, and Billings-Harris
(2012) called for a broader reach into multiple industries. This identified gap in the
understanding of diversity climate’s effects on organizational outcomes combined with
Gilmartin’s (2013) call for nursing research to adopt concepts from general research
creates a unique opportunity to combine two issues facing healthcare for research:
diversity and RN turnover.
Research questions were put together based on the following issues: government
emphasis on population health management; high national turnover rate among RNs;
government directive to create a diverse health care workforce; and gaps in the literature
surrounding the intersection of RN turnover and diversity in the health care workforce.
During the literature search, Chrobot-Mason and Aramovich’s (2013) work on an
affirming climate of diversity’s interactions with turnover intentions came to light. The
authors created and validated a tool that measures the effects of an affirming climate of
80
diversity on turnover intentions while measuring mediating psychological outcomes. The
research questions are:
RQ1: Does an affirming climate of diversity, as measured by equal access and
equal treatment, have a negative effect on RN turnover intentions?
RQ2: Are the effects of an affirming climate of diversity on RN turnover
intentions mediated by the psychological outcomes of organizational
identification, climate for innovation, psychological empowerment, and
identity freedom?
RQ3: Will the psychological outcomes of organizational identification, climate
for innovation, psychological empowerment, and identity freedom mediate
the overall effects of an affirming climate of diversity on RN turnover
intentions across demographic subgroups?
The study was quantitative and cross-sectional in design. The targeted population
was registered nurses in the United States, working fulltime, part-time, or PRN in any
health care setting. Survey participants were recruited through email and social media
postings to a survey in the Qualtrics survey system. Participants that completed the survey
represented every state in the United States of America and crossed multiple generations.
The survey included several screening questions to confirm participants’ membership in
the target population.
Findings
Analysis of the collected data was performed using exploratory factor analysis
(EFA), confirmatory factor analysis (CFA), structural equation modeling (SEM), and
hypotheses testing. The construct validity was assessed by EFA, using hypothesized
81
theoretical underlying structure, promax rotation, and principal axis factoring. Using an
eigenvalue cutoff of 1, the EFA produced a seven-factor solution that accounted for 75%
of the overall variance.
Measurement model fit was assessed with CFA. The results of this analysis
indicated the need to add error covariances to achieve the best fitting model. After finding
the best fitting model, it was determined that common method variance existed by creating
a common latent factor and comparing the Δχ2 between unconstrained and constrained
models. As a result, latent factors were imputed, retaining the common latent factor.
SEM was used to assess the structural model of the study. The initial model with
and without a control variable did not show good fit. Kline’s (2016) model-trimming
process was used to eliminate statistically insignificant pathways and to add modification
indices’ indicated pathways to the model with a control variable. In addition, this process
resulted in no significant pathways from psychological empowerment to RN turnover
intentions, resulting in the elimination of this variable. The results of the unpublished
survey anticipated the elimination of this variable. The result of the process was a
parsimonious model with good fit indices. This process was followed again with a model
without a control variable, a control variable model limited to the Baby Boomer
population of the sample, a control variable model limited to the Generation X population
of the sample, and a control model limited to the Millennial population of the sample.
Finally, the hypotheses were evaluated in light of the resultant models.
The study’s hypotheses anticipated a negative relationship between an affirming
climate of diversity and RN turnover intention. In addition, this hypothesized relationship
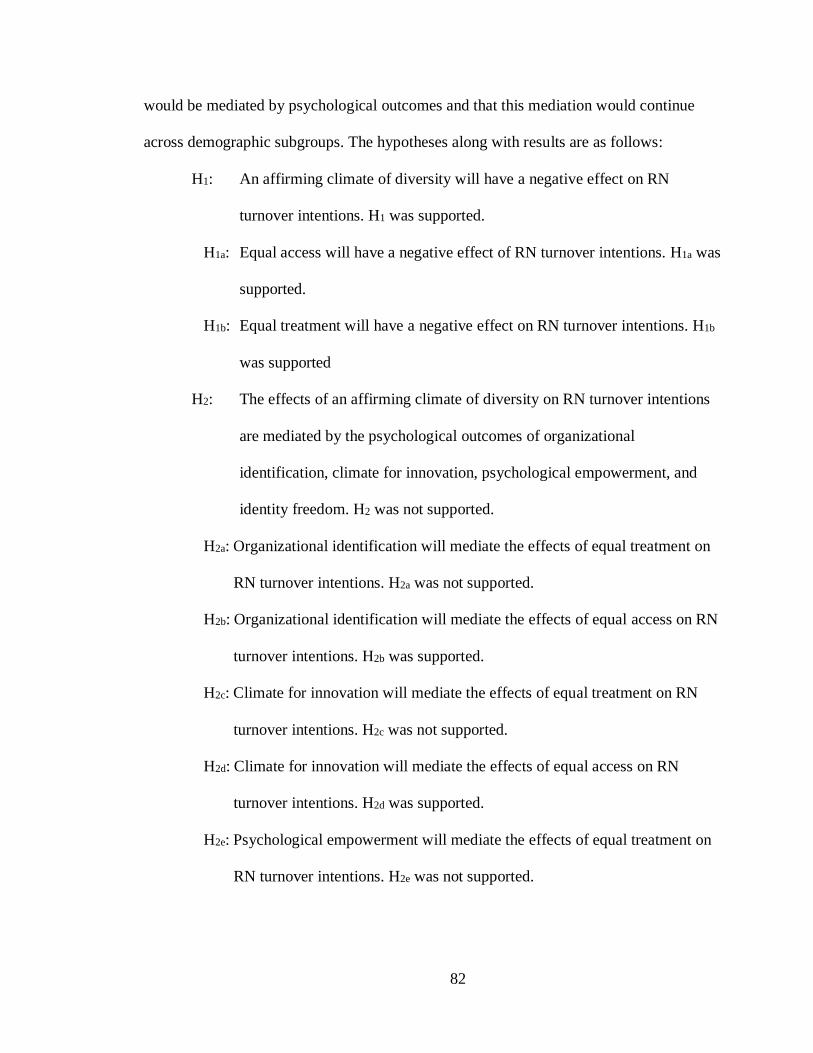
82
would be mediated by psychological outcomes and that this mediation would continue
across demographic subgroups. The hypotheses along with results are as follows:
H1: An affirming climate of diversity will have a negative effect on RN
turnover intentions. H1 was supported.
H1a: Equal access will have a negative effect of RN turnover intentions. H1a was
supported.
H1b: Equal treatment will have a negative effect on RN turnover intentions. H1b
was supported
H2: The effects of an affirming climate of diversity on RN turnover intentions
are mediated by the psychological outcomes of organizational
identification, climate for innovation, psychological empowerment, and
identity freedom. H2 was not supported.
H2a: Organizational identification will mediate the effects of equal treatment on
RN turnover intentions. H2a was not supported.
H2b: Organizational identification will mediate the effects of equal access on RN
turnover intentions. H2b was supported.
H2c: Climate for innovation will mediate the effects of equal treatment on RN
turnover intentions. H2c was not supported.
H2d: Climate for innovation will mediate the effects of equal access on RN
turnover intentions. H2d was supported.
H2e: Psychological empowerment will mediate the effects of equal treatment on
RN turnover intentions. H2e was not supported.
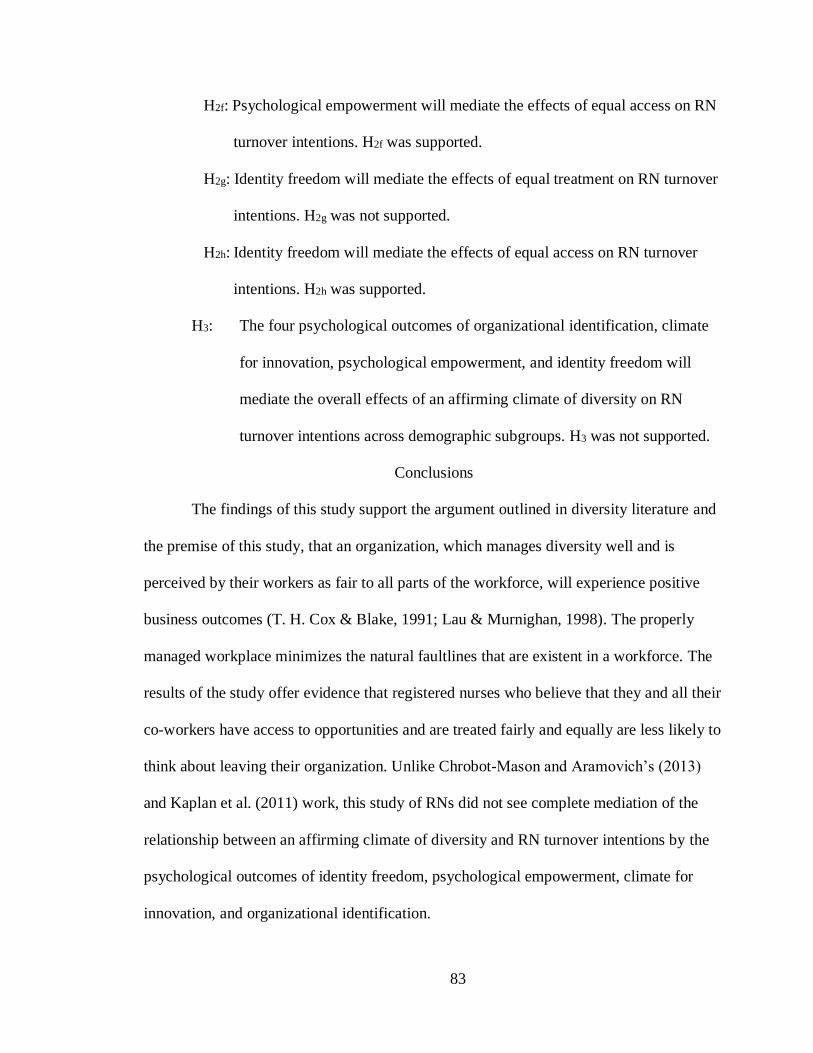
83
H2f: Psychological empowerment will mediate the effects of equal access on RN
turnover intentions. H2f was supported.
H2g: Identity freedom will mediate the effects of equal treatment on RN turnover
intentions. H2g was not supported.
H2h: Identity freedom will mediate the effects of equal access on RN turnover
intentions. H2h was supported.
H3: The four psychological outcomes of organizational identification, climate
for innovation, psychological empowerment, and identity freedom will
mediate the overall effects of an affirming climate of diversity on RN
turnover intentions across demographic subgroups. H3 was not supported.
Conclusions
The findings of this study support the argument outlined in diversity literature and
the premise of this study, that an organization, which manages diversity well and is
perceived by their workers as fair to all parts of the workforce, will experience positive
business outcomes (T. H. Cox & Blake, 1991; Lau & Murnighan, 1998). The properly
managed workplace minimizes the natural faultlines that are existent in a workforce. The
results of the study offer evidence that registered nurses who believe that they and all their
co-workers have access to opportunities and are treated fairly and equally are less likely to
think about leaving their organization. Unlike Chrobot-Mason and Aramovich’s (2013)
and Kaplan et al. (2011) work, this study of RNs did not see complete mediation of the
relationship between an affirming climate of diversity and RN turnover intentions by the
psychological outcomes of identity freedom, psychological empowerment, climate for
innovation, and organizational identification.
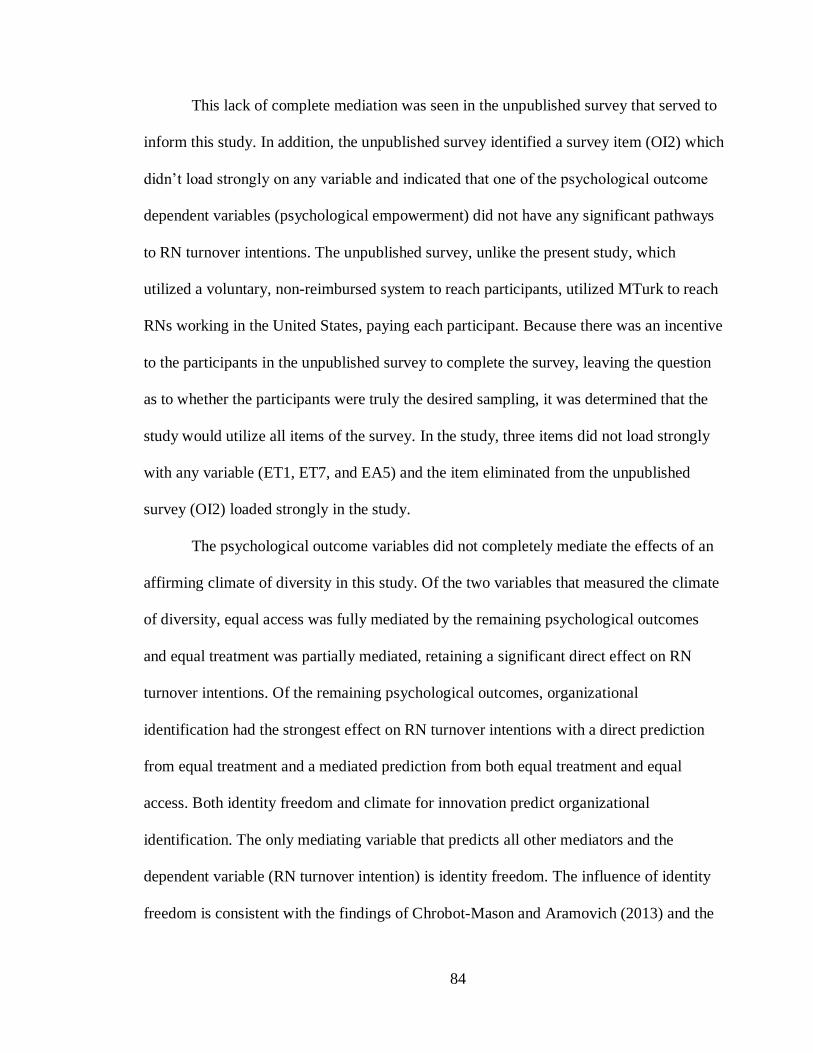
84
This lack of complete mediation was seen in the unpublished survey that served to
inform this study. In addition, the unpublished survey identified a survey item (OI2) which
didn’t load strongly on any variable and indicated that one of the psychological outcome
dependent variables (psychological empowerment) did not have any significant pathways
to RN turnover intentions. The unpublished survey, unlike the present study, which
utilized a voluntary, non-reimbursed system to reach participants, utilized MTurk to reach
RNs working in the United States, paying each participant. Because there was an incentive
to the participants in the unpublished survey to complete the survey, leaving the question
as to whether the participants were truly the desired sampling, it was determined that the
study would utilize all items of the survey. In the study, three items did not load strongly
with any variable (ET1, ET7, and EA5) and the item eliminated from the unpublished
survey (OI2) loaded strongly in the study.
The psychological outcome variables did not completely mediate the effects of an
affirming climate of diversity in this study. Of the two variables that measured the climate
of diversity, equal access was fully mediated by the remaining psychological outcomes
and equal treatment was partially mediated, retaining a significant direct effect on RN
turnover intentions. Of the remaining psychological outcomes, organizational
identification had the strongest effect on RN turnover intentions with a direct prediction
from equal treatment and a mediated prediction from both equal treatment and equal
access. Both identity freedom and climate for innovation predict organizational
identification. The only mediating variable that predicts all other mediators and the
dependent variable (RN turnover intention) is identity freedom. The influence of identity
freedom is consistent with the findings of Chrobot-Mason and Aramovich (2013) and the
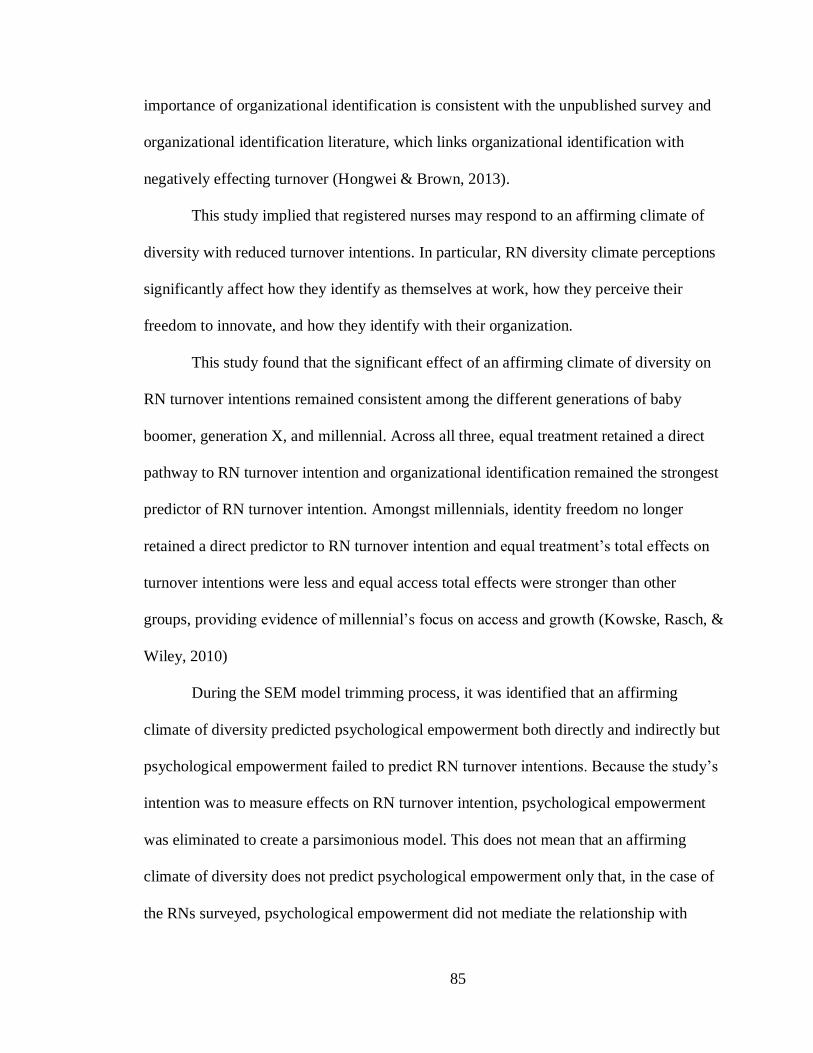
85
importance of organizational identification is consistent with the unpublished survey and
organizational identification literature, which links organizational identification with
negatively effecting turnover (Hongwei & Brown, 2013).
This study implied that registered nurses may respond to an affirming climate of
diversity with reduced turnover intentions. In particular, RN diversity climate perceptions
significantly affect how they identify as themselves at work, how they perceive their
freedom to innovate, and how they identify with their organization.
This study found that the significant effect of an affirming climate of diversity on
RN turnover intentions remained consistent among the different generations of baby
boomer, generation X, and millennial. Across all three, equal treatment retained a direct
pathway to RN turnover intention and organizational identification remained the strongest
predictor of RN turnover intention. Amongst millennials, identity freedom no longer
retained a direct predictor to RN turnover intention and equal treatment’s total effects on
turnover intentions were less and equal access total effects were stronger than other
groups, providing evidence of millennial’s focus on access and growth (Kowske, Rasch, &
Wiley, 2010)
During the SEM model trimming process, it was identified that an affirming
climate of diversity predicted psychological empowerment both directly and indirectly but
psychological empowerment failed to predict RN turnover intentions. Because the study’s
intention was to measure effects on RN turnover intention, psychological empowerment
was eliminated to create a parsimonious model. This does not mean that an affirming
climate of diversity does not predict psychological empowerment only that, in the case of
the RNs surveyed, psychological empowerment did not mediate the relationship with
86
turnover intention. This may be unique to RNs and the health care industry. Thomas and
Velthouse (1991) identified empowerment as having the characteristics of a sense of
impact, competence, meaningfulness, and choice or self-determination. Three of these
factors, sense of impact, competence, and meaningfulness are characteristics of health care
workers, in particular, registered nurses. Their jobs almost by definition create a sense of
impact and meaningfulness with a sense of competence coming from providing the care to
the patients.
Implications
Despite decades of focus in nursing research, RN turnover continues to be above
the national labor workforce average (Brewer et al., 2012; P. Cox et al., 2014; Gilmartin,
2013; Li & Jones, 2013). This study, in an effort to broaden research of RN turnover by
utilizing insights from general management research, advises that health care
organizations must acknowledge the importance of diversity climate on the retention of
RNs. Simply recruiting and hiring for diversity will not be enough. Because an affirming
climate of diversity has an impact on all employees, health care organizations must
apportion the resources and will to create an affirming climate of diversity. This study
may also serve as a useful tool in identifying and constructing diversity training in the
health care setting as well as identifying areas to query on employee engagement surveys.
In addition, this study expands upon the limited research of the relationship
between a climate of diversity and employee turnover intentions. The developers of the
research tool used in this study, Chrobot-Mason and Aramovich (2013), called for an
expansion of this research. This study has both moved this research into the health care
arena and identified differences in workforces that may signal the need to modify the
87
research tool. In the development of the tool, the authors identified that the effects of an
affirming climate of diversity on turnover intentions would be fully mediated by the
psychological outcomes. This was not true for this study and one of the psychological
outcome variables has no significant effect on turnover intentions. Whether this occurred
because of the industry or because of the broad national reach of the survey as compared
to a single municipality needs to be determined.
Finally, the sample of this study was large and geographically broad. In addition, it
had respondents from every type of organization in which a registered nurse works. The
population spanned three generations (boomer, generation X, and millennial) with enough
respondents to perform SEM on each group. All of these factors contribute to making the
study generalizable to the larger RN population.
Limitations
There are a few limitations to this study, which can be accounted for and present as
catalysts for future research. Because of the research tool, the study is correlational in
nature, limiting conclusions about causal relationships. However, like the developers of
the tool, the relationships were designed in light of theories in diversity climate literature
and have been presented in the structural model as causal in nature. In addition, the use of
self-reported data possibly lead to the common method variance identified in the study
(Podsakoff et al., 2003). The common method variance was considered when creating the
latent factors for the SEM structural model. Furthermore, there is also implicit risk with
cross-sectional studies that the observed relationships may have possible explanations
other than those scrutinized in the study (Bryman & Bell, 2011).

88
Another limitation involved having the sample largely skewed to one
demographic, white females. This most likely occurred because of one of the snowballing
methods used to recruit respondents, Facebook. Because the registered nurse population is
difficult to reach without significant efforts in coordinating with their employers, a link to
the survey was spread through social media (Dusek et al., 2015). This effort was
successful in recruiting respondents but created less of an ability to scrutinize the
qualifications of participants.
Future Research
This study has attempted to add to both general management and nursing
management literature and to better understand the relationship between a climate of
diversity and employee turnover. The following are recommendations for future research.
Use of Additional Data Collected
This study focused on the RN population as a whole and as generational groups.
However, the survey collected more information on each participant to include: race,
organizational tenure, workforce status, health care employment setting, community size,
and geographic location. Although there were not enough respondents from each racial
subgroup to examine them individually, collapsing these together as a single category may
prove helpful in determining whether these groups perceive diversity climate differently or
different outcomes are possible. Tenure was used as a control for the study but, examining
the subgroup of tenure less than five years, may yield beneficial new information. The
Affordable Care Act places emphasis on preventive care, which usually occurs outside of
a hospital setting in community clinics and physician offices. Grouping the respondents
into the categories of acute care and primary care may be beneficial in identifying
89
approaches to managing a diversity climate in different clinical settings. Finally, recent
literature has identified that cultural and socio-economic interactions can be influenced by
the social places, be it regional or community, in which they occur (Bertsch, 2013;
Huggins & Thompson, 2014). The participants can be studied in light of their
geographical setting, either regional or community size.
Extend General Management Research
This study confirmed the claims of previous diversity literature by demonstrating
that a well-managed climate of diversity can create positive outcomes for an organization
(Chrobot-Mason & Aramovich, 2013; T. H. Cox & Blake, 1991; Roberge & van Dick,
2010). In particular, this study extends the limited research on the relationship between
diversity climate and employee turnover. The tool used in this study was previously used
to measure this relationship in a single municipal employer, examining the responses of
1,731 employees (Chrobot-Mason & Aramovich, 2013). This study analyzed the
responses of 2,219 registered nurses from across the U.S. The two studies together
confirm that an affirming climate of diversity is likely to have a negative effect on
employee turnover intention. This relationship needs to be explored in other industries to
further validate this relationship.
The mediating variables in this study need further exploration. In Chrobot-Mason
and Aramovich’s (2013) use of this tool, full mediation was achieved but was not
achieved in this study. The equal treatment measurement portion of an affirming climate
of diversity retained a strong direct predictive value for turnover intention. Exploration of
why full mediation did not occur in an RN population is needed. During the SEM
trimming process, predictive relationships from an affirming climate of diversity, climate
90
for innovation, identity freedom, and organizational identification to psychological
empowerment were observed. However, no significant, predictive relationships existed
from psychological empowerment to any other variable. Further analysis needs to be done
on what may be different about the health care setting or the RN population as compared
to other industries. Moreover, further psychological outcomes of an affirming climate of
diversity should be measured to strengthen the argument for the resource-based view of
diversity (T. H. Cox & Blake, 1991)
Extend Nursing Management Research
This study has expanded the nursing management research in relation to registered
nurse’ turnover. Gilmartin (2013) called for the introduction of new ideas from general
management literature and this study is a beginning step. Nursing management research
needs to build on the findings that an affirming climate of diversity negatively effects RN
turnover intentions. Nursing research, similar to what was outlined for HRD research
above, should explore the reasons why the study’s findings about mediation variables
were different from previous studies and why equal treatment retained a significant, direct
relationship with turnover intentions. Further research of these outcomes may best be
accomplished through qualitative studies that explore the reasons behind the relationships
in more detail.
Summary of Chapter
This chapter presented a short summary of the study. It then reviewed the findings
of the study utilizing the analysis of the data outlined in the previous chapter. Particularly,
the chapter reviewed how the data either supported or didn’t support each hypothesis. Of
the three major hypotheses of the study, only the one pertaining to the effects of a
91
diversity climate on RN turnover intentions was supported: an affirming climate of
diversity does have a negative effect on RN turnover intentions. Study conclusions and
limitations were reported along with implications for nursing management and human
resource development. Lastly, recommendations for future research were presented.
92
References
Allen, N. J., & Meyer, J. P. (1990). The measurement and antecedents of affective,
continuance and normative commitment to the organization. Journal of
Occupational Psychology, 63(1), 1–18.
Applebaum, D., Fowler, S., Fiedler, N., Osinubi, O., & Robson, M. (2010). The impact of
environmental factors on nursing stress, job satisfaction, and turnover intention.
JONA: The Journal of Nursing Administration, 40(7/8), 323–328.
https://doi.org/10.1097/NNA.0b013e3181e9393b
Bacharach, S. B., Bamberger, P. A., & Vashdi, D. (2005). Diversity and homophily at
work: Supportive relations among white and African-American peers. Academy of
Management Journal, 48(4), 619–644.
Bagozzi, R. P., & Yi, Y. (1988). On the evaluation of structural equation models. Journal
of the Academy of Marketing Science, 16(1), 74–94.
Baillie, L., & Matiti, M. (2013). Dignity, equality and diversity: an exploration of how
discriminatory behaviour of healthcare workers affects patient dignity. Diversity
and Equality in Health and Care, 10(1), 5–12.
Baker, K. (2015). An emerging role for RN’s: the RN primary care coordinator. Oklahoma
Nurse, 60(3), 13–14.
Beheri, W. H. (2009). Diversity within nursing: Effects on nurse-nurse interaction, job
satisfaction, and turnover. Nursing Administration Quarterly, 33(3), 216–226.
Bertsch, A. (2013). The melting pot vs. the slad bowl: A call to explore regional cross-
cultural differences and similarities within the U.S.A. Journal of Organizational
Culture, Communications and Conflict, 17(1), 131–148.
93
Bezrukova, K., Jehn, K. A., Zanutto, E. L., & Thatcher, S. M. B. (2009). Do workgroup
faultlines help or hurt? A moderated model of faultlines, team identification, and
group performance. Organization Science, 20(1), 35–50.
https://doi.org/10.1287/orsc.1080.0379
Bezrukova, K., Thatcher, S. M., & Jehn, K. A. (2007). Group heterogeneity and faultlines:
Comparing alignment and dispersion theories of group composition. Conflict in
Organizational Groups: New Directions in Theory and Practice, 57–92.
Borda, R., & Norman, I. (1997a). Factors influencing turnover and absence of nurses: a
research review. International Journal of Nursing Studies, 34(6), 385–394.
Borda, R., & Norman, I. (1997b). Testing a model of absence and intent to stay in
employment: a study of registered nurses in Malta. International Journal of
Nursing Studies, 34(5), 375–384.
Borkowski, N., Amann, R., Song, S.-H., & Weiss, C. (2007). Nurses’ intent to leave the
profession: Issues related to gender, ethnicity, and educational level. Health Care
Management Review, 32(2), 160–167.
Brewer, C. S., Kovner, C. T., Greene, W., Tukov-Shuser, M., & Djukic, M. (2012).
Predictors of actual turnover in a national sample of newly licensed registered
nurses employed in hospitals: Turnover of newly licensed registered nurses.
Journal of Advanced Nursing, 68(3), 521–538. https://doi.org/10.1111/j.1365-
2648.2011.05753.x
Browne, M. (2001). An overview of analytic rotation in exploratory factor analysis.
Multivariate Behavioral Research, 36(1), 111–150.
94
Bryman, A., & Bell, E. (2011). Business research methods (3rd ed.). New York: Oxford
University Press.
Bureau of Labor and Statistics, U.S. Department of Labor. (2016). Registered Nurses
(Occupational Outlook Handbook). Retrieved from
http://www.bls.gov/ooh/healthcare/registered-nurses.htm
Buttner, E. H., Lowe, K. B., & Billings-Harris, L. (2012). An empirical test of diversity
climate dimensionality and relative effects on employee of color outcomes.
Journal of Business Ethics, 110(3), 247–258. https://doi.org/10.1007/s10551-011-
1179-0
Chatman, J. (1991). Matching people and organizations: selection and socialization in
public accounting firms. Administrative Science Quarterly, 36, 459–484.
https://doi.org/10.2307/2393204
Chrobot-Mason, D. (2012). Developing multicultural competence to improve cross-race
work relationships. The Psychologist-Manager Journal, 15(4), 199–218.
https://doi.org/10.1080/10887156.2012.730440
Chrobot-Mason, D., & Aramovich, N. P. (2013). The psychological benefits of creating an
affirming climate for workplace diversity. Group & Organization Management,
38(6), 659–689.
Chrobot-Mason, D., & Leslie, J. B. (2012). The role of multicultural competence and
emotional intelligence in managing diversity. The Psychologist-Manager Journal,
15(4), 219–236. https://doi.org/10.1080/10887156.2012.730442
95
Chung, Y., Liao, H., Jackson, S. E., Subramony, M., Colakoglu, S., & Jiang, Y. (2015).
Cracking but not breaking: joint effects of faultline strength and diversity climate
on loyal behavior. Academy of Management Journal, 58(5), 1495–1515.
https://doi.org/10.5465/amj.2011.0829
Collini, S. A., Guidroz, A. M., & Perez, L. M. (2015). Turnover in health care: the
mediating effects of employee engagement. Journal of Nursing Management,
23(2), 169–178. https://doi.org/10.1111/jonm.12109
Colquitt, J. A., Conlon, D. E., Wesson, M. J., Porter, C., & Ng, K. Y. (2001). Justice at the
millennium: A meta-analytic review of 25 years of organizational justice research.
Journal of Applied Psychology, 86(2), 425–445.
Cox, P., Willis, K., & Coustasse, A. (2014). The American epidemic: the US nursing
shortage and turnover problem. Insights to a Changing World Journal, 2014(2).
Cox, T. (1991). The multicultural organization. Academy of Management Executive, 5(2),
34–47.
Cox, T. (1994). Cultural diversity in organizations. San Francisco, CA: Berrett-Koehler.
Cox, T. H., & Blake, S. (1991). Managing cultural diversity: Implications for
organizational competitiveness. The Executive, 45–56.
Davis, K. (2014, September 15). Hospital mergers can lower costs and improve medical
care. Retrieved September 15, 2014, from http://online.wsj.com/opinion
Department of Health and Human Services (US), Health Resources and Services
Administration. (2015). Strategic plan: vision, mission, goals, sub-goals, and
guiding principles. Retrieved June 5, 2015, from
http://www.hrsa.gov/about/strategicplanimplementation2013.pdf
96
Diaz, C., Clarke, P. N., & Gatua, M. W. (2015). Cultural competence in rural nursing
education: Are we there yet? Nursing Education Perspectives, 36(1), 22–26.
https://doi.org/10.5480/12-1066.1
Doty, D., & Glick, W. (1998). Common methods bias: does common methods variance
really bias results? Organizational Research Methods, 1(4), 374–406.
Dusek, G., Yurova, Y., & Ruppel, C. (2015). Using social media and targeted snowball
sampling to survey a hard-to-reach population: A case study. International Journal
of Doctoral Studies, (10), 279–299.
Ely, R. J., & Thomas, D. A. (2001). Cultural diversity at work: The effects of diversity
perspectives on work group processes and outcomes. Administrative Science
Quarterly, 46(2), 229–273.
Field, A. (2013). Discovering Statistics Using IBM SPSS (4th ed.). Thousand Oaks, CA:
Sage.
Flinkman, M., Leino-Kilpi, H., & Salanterä, S. (2010). Nurses’ intention to leave the
profession: integrative review: Nurses’ intention to leave the profession. Journal of
Advanced Nursing, 66(7), 1422–1434. https://doi.org/10.1111/j.1365-
2648.2010.05322.x
Freund, T., Everett, C., Griffiths, P., Hudon, C., Naccarella, L., & Laurant, M. (2015).
Skill mix, roles and remuneration in the primary care workforce: Who are the
healthcare professionals in the primary care teams across the world? International
Journal of Nursing Studies, 52(3), 727–743.
https://doi.org/10.1016/j.ijnurstu.2014.11.014
97
Frey, W. (2014). Diversity explosion: How new racial demographics are remaking
America. Washington D.C.: Brookings Institution Press.
Friedman, R. A., & Holtom, B. (2002). The effects of network groups on minority
employee turnover intentions. Human Resource Management, 41(4), 405–421.
https://doi.org/10.1002/hrm.10051
Gathers, D. (2003). Diversity management: an imperative for healthcare organizations.
Hospital Topics, 81(3), 14–20.
Gelfand, M. J., Nishii, L. H., Raver, J. L., & Schneider, B. (2007). Discrimination in
organizations: An organizational-level systems perspective. CAHRS Working
Paper Series, 470.
Gilmartin, M. J. (2013). Thirty years of nursing turnover research: looking back to move
forward. Medical Care Research and Review, 70(1), 3–28.
https://doi.org/10.1177/1077558712449056
Gonzalez, J. A., & DeNisi, A. S. (2009). Cross-level effects of demography and diversity
climate on organizational attachment and firm effectiveness. Journal of
Organizational Behavior, 30(1), 21–40. https://doi.org/10.1002/job.498
Gordon, C. J., Aggar, C., Williams, A. M., Walker, L., Willcock, S. M., & Bloomfield, J.
(2014). A transition program to primary health care for new graduate nurses: a
strategy towards building a sustainable primary health care nurse workforce? BMC
Nursing, 13(1), 34. https://doi.org/10.1186/s12912-014-0034-x
98
Graham, J. M., Guthrie, A. C., & Thompson, B. (2003). Consequences of not interpreting
structure coefficients in published CFA research: a reminder. Structural Equation
Modeling: A Multidisciplinary Journal, 10(1), 142–153.
https://doi.org/10.1207/S15328007SEM1001_7
Greenberg, J. (2004). Diversity in the workplace: benefits, challenges, and solutions.
Retrieved from http://www.multiculturaladvantage.com/recruit/diversity/diversity-
in-the-workplace-benefits-challenges-solutions.asp
Griffeth, R., Hom, P., & Gaertner, S. (2000). A meta-analysis of antecedents and
correlates of employee turnover: update, moderator tests, and research implications
for the next millennium. Journal of Management, 26(3), 463–488.
https://doi.org/10.1016/S0149-2063(00)00043-X
Hambrick, D. C., & Mason, P. A. (1984). Upper echelons: The organization as a reflection
of its top managers. Academy of Management Review, 9(2), 193–206.
Hausknecht, J. P., & Trevor, C. O. (2011). Collective Turnover at the Group, Unit, and
Organizational Levels: Evidence, Issues, and Implications. Journal of
Management, 37(1), 352–388. https://doi.org/10.1177/0149206310383910
Hayes, L. J., O’Brien-Pallas, L., Duffield, C., Shamian, J., Buchan, J., Hughes, F., …
North, N. (2012). Nurse turnover: A literature review – An update. International
Journal of Nursing Studies, 49(7), 887–905.
https://doi.org/10.1016/j.ijnurstu.2011.10.001
Heinrich, J. (2014). Nursing in 3D: diversity, disparities, and social determinants. Public
Health Reports, 129((Suppl 2)), 1–2.
99
Henson, R. K. (2001). Understanding internal consistency reliability estimates: A
conceptual primer on coefficient alpha. Measurement and Evaluation in
Counseling and Development, 34(3), 177.
Herdman, A. O., & McMillan-Capehart, A. (2010). Establishing a diversity program is not
enough: exploring the determinants of diversity climate. Journal of Business and
Psychology, 25(1), 39–53. https://doi.org/10.1007/s10869-009-9133-1
Hicks‐Clarke, D., & Iles, P. (2000). Climate for diversity and its effects on career and
organizational attitudes and perceptions. Personnel Review, 29(3), 324–345.
https://doi.org/10.1108/00483480010324689
Hill, C., Dean, E., & Murphy, J. (2013). Social media, sociality, and survey research (E
Books on Demand). Hoboken: Wiley.
Hinshaw, A. S., & Atwood, J. R. (1984). Nursing Staff Turnover, Stress, and Satisfaction:
Models, Measures, and Management. In H. H. Werley & J. J. Fitzpatrick (Eds.),
Annual Review of Nursing Research (pp. 133–153). Berlin, Heidelberg: Springer
Berlin Heidelberg. https://doi.org/10.1007/978-3-662-40453-9_6
Hinshaw, A. S., Smeltzer, C., & Atwood, J. (1987). Innovative Retention Strategies for
Nursing Staff. Journal of Nursing Administration, 17(6), 8–16.
Hodges, G. (2015, January). First Americans. National Geographic, 227(1), 134–147.
Holtom, B. C., Mitchell, T. R., Lee, T. W., & Eberly, M. B. (2008). Turnover and
Retention Research: A Glance at the Past, a Closer Review of the Present, and a
Venture into the Future. The Academy of Management Annals, 2(1), 231–274.
https://doi.org/10.1080/19416520802211552
100
Holtom, B. C., & O’Neill, B. S. (2004). Job embeddedness: A theoretical foundation for
developing a comprehensive nurse retention plan. Journal of Nursing
Administration, 34(5), 216–227.
Hom, P. W., Mitchell, T. R., Lee, T. W., & Griffeth, R. W. (2012). Reviewing employee
turnover: Focusing on proximal withdrawal states and an expanded criterion.
Psychological Bulletin, 138(5), 831–858. https://doi.org/10.1037/a0027983
Hongwei, H., & Brown, A. (2013). Organizational identity and organizational
identification: a review of the literature and suggestions for future research. Group
& Organization Management, 38(1), 3–35.
https://doi.org/10.1177/1059601112473815
Hu, L., & Bentler, P. M. (1999). Cutoff criteria for fit indexes in covariance structure
analysis: Conventional criteria versus new alternatives. Structural Equation
Modeling: A Multidisciplinary Journal, 6(1), 1–55.
https://doi.org/10.1080/10705519909540118
Huggins, R., & Thompson, P. (2014). Culture and place-based development: A socio-
economic analysis. Regional Studies, 49(1), 130–159.
Iverson, R. D., & Maguire, C. (2000). The relationship between job and life satisfaction:
Evidence from a remote mining community. Human Relations, 53(6), 807–839.
James, L. R., James, Lois A., & Ashe, D. (1990). The meaning of organizations: The role
of cognition and values. In Organizational climate and culture (pp. 40–84). San
Francisco, CA: Jossey-Bass.
101
Jehn, K. A., & Bezrukova, K. (2010). The faultline activation process and the effects of
activated faultlines on coalition formation, conflict, and group outcomes.
Organizational Behavior and Human Decision Processes, 112(1), 24–42.
https://doi.org/10.1016/j.obhdp.2009.11.008
Jehn, K., Bezrukova, K., & Thatcher, S. (2008). Conflict, diversity, and faultlines in
workgroups. In The psychology of conflict and conflict management in
organizations. New York, New York: Taylor and Francis.
Kaplan, D. M., Wiley, J. W., & Maertz, C. P. (2011). The role of calculative attachment in
the relationship between diversity climate and retention. Human Resource
Management, 50(2), 271–287. https://doi.org/10.1002/hrm.20413
Katz, J., Barbosa-Leiker, C., & Benavides-Vaello, S. (2015). Measuring the success of a
pipeline program to increase nursing workforce diversity. Journal of Professional
Nursing, 0(0), 1–9.
King, E. B., Chermont, K., West, M., Dawson, J. F., & Hebl, M. R. (2007). How
innovation can alleviate negative consequences of demanding work contexts: The
influence of climate for innovation on organizational outcomes. Journal of
Occupational and Organizational Psychology, 80(4), 631–645.
https://doi.org/10.1348/096317906X171145
Kline, R. (2016). Principles and practice of structural equation modeling (Fourth). New
York, New York: The Guilford Press.
Koberg, C. S., Boss, R. W., Senjem, J. C., & Goodman, E. A. (1999). Antecedents and
outcomes of empowerment empirical evidence from the health care industry.
Group & Organization Management, 24(1), 71–91.
102
Konrad, A., Pringle, J., & Prasad, P. (2005). Handbook of workplace diversity. London:
Sage.
Kossek, E., & Zonia, S. (1993). Assessing diversity climate: A field study of reactions to
employer efforts to promote diversity. Journal of Organizational Behavior, 14,
61–81.
Kovner, C., Brewer, C., Wu, Y.-W., Cheng, Y., & Suzuki, M. (2006). Factors associated
with work satisfaction of registered nurses. Journal of Nursing Scholarship, 38(1),
71–79.
Kowske, B. J., Rasch, R., & Wiley, J. (2010). Millennials’ (Lack of) Attitude Problem: An
Empirical Examination of Generational Effects on Work Attitudes. Journal of
Business and Psychology, 25(2), 265–279. https://doi.org/10.1007/s10869-010-
9171-8
Kuenzi, M., & Schminke, M. (2009). Assembling fragments into a lens: A review,
critique, and proposed research agenda for the organizational work climate
literature. Journal of Management, 35(3), 634–717.
https://doi.org/10.1177/0149206308330559
Lau, D. C., & Murnighan, J. K. (1998). Demographic diversity and faultlines: The
compositional dynamics of organizational groups. The Academy of Management
Review, 23(2), 325. https://doi.org/10.2307/259377
Lee, T. W., & Mitchell, T. R. (1994). An alternative approach: The unfolding model of
voluntary employee turnover. Academy of Management Review, 19(1), 51–89.
103
Li, Y., & Jones, C. B. (2013). A literature review of nursing turnover costs: A Literature
review of nursing turnover costs. Journal of Nursing Management, 21(3), 405–
418. https://doi.org/10.1111/j.1365-2834.2012.01411.x
Logan, J. (2014). Diversity and disparities: America enters a new century. New York,
New York: Russell Sage Foundation.
Lowe, J., & Archibald, C. (2009). Cultural diversity: The intention of nursing. In Nursing
forum (Vol. 44, pp. 11–18). Wiley Online Library. Retrieved from
http://onlinelibrary.wiley.com/doi/10.1111/j.1744-6198.2009.00122.x/full
Lyons, S., & Kuron, L. (2014). Generational differences in the workplace: A review of the
evidence and directions for future research: GENERATIONAL DIFFERENCES
IN THE WORKPLACE. Journal of Organizational Behavior, 35(S1), S139–S157.
https://doi.org/10.1002/job.1913
Ma, J.-C., Lee, P.-H., Yang, Y.-C., & Chang, W.-Y. (2009). Predicting factors related to
nurses’ intention to leave, job satisfaction, and perception of quality of care in acut
care hospitals. Nursing Economics, 27(3), 178–184.
MacLean, L., Hassmiller, S., Shaffer, F., Rohrbaugh, K., Collier, T., & Fairman, J. (2014).
Scale, causes, and implications of the primary care nursing shortage. Annual
Review of Public Health, 35(1), 443–457. https://doi.org/10.1146/annurev-
publhealth-032013-182508
Maertz, C. P., & Campion, M. A. (2004). Profiles in quitting: Integrating process and
content turnover theory. Academy of Management Journal, 47(4), 566–582.
104
Maltarich, M. A., Nyberg, A. J., & Reilly, G. (2010). A conceptual and empirical analysis
of the cognitive ability–voluntary turnover relationship. Journal of Applied
Psychology, 95(6), 1058–1070. https://doi.org/10.1037/a0020331
March, J., & Simon, H. (1958). Organizations. New York: Wiley.
Martin, T. N. (1979). A contextual model of employee turnover intentions. Academy of
Management Journal, 22(2), 313–324.
Mathieu, J. E., & Zajac, D. M. (1990). A review and meta-analysis of the antecedents,
correlates, and consequences of organizational commitment. Psychological
Bulletin, 108(2), 171.
McClimens, A., Brewster, J., & Lewis, R. (2014). Recognizing and respecting patients’
cultural diversity. Nursing Standard, 28(28), 45–52.
McKay, P. F., Avery, D. R., & Morris, M. A. (2008). Mean racial-ethnic differences in
employee sales performance: The moderating role of diversity climate. Personnel
Psychology, 61(2), 349–374.
McKay, P. F., Avery, D. R., Tonidandel, S., Morris, M. A., Hernandez, M., & Hebl, M. R.
(2007). Racial differences in employee retention: Are diversity climate perceptions
the key? Personnel Psychology, 60(1), 35–62.
Medina, E. (2012). Job Satisfaction and Employee Turnover Intention: What does
Organizational Culture Have To Do With It? Retrieved from
http://academiccommons.columbia.edu/catalog/ac:156625
Meyers, L., Gamst, G., & Guarino, A. (2013). Performing data analysis using IBM SPSS.
John Wiley & Sons.
105
Milliken, F. J., & Martins, L. L. (1996). Searching for common threads: Understanding the
multiple effects of diversity in organizational groups. Academy of Management
Review, 21(2), 402–433.
Millner, L. (2014). Growing a diverse health workforce. The Journal of Physician
Assistant Education, 25(2), 31–32.
Mixer, S., Lasater, K., Jenkins, K., Burk, R., Oliver, M., Meyer, M., … Mills, J. (2013).
Preparing a culturally competent nursing workforce. Online Journal of Cultural
Competence in Nursing and Healthcare, 3(4), 1–14.
https://doi.org/10.9730/ojccnh.org/v3n4a1
Mor Barak, M., Cherin, D., & Berkman, S. (1998). Organizational and personal
dimensions of diversity climate. Journal of Applied Behavioral Science, 34, 82–
104.
Morrell, K. (2005). Towards a typology of nursing turnover: the role of shocks in nurses’
decisions to leave. Journal of Advanced Nursing, 49(3), 315–322.
Nadler, D. (1975). Michigan Organizational Assessment Package: Progress Report II.
Retrieved from
http://www.psc.isr.umich.edu/dis/infoserv/isrpub/pdf/MichiganOrganizationalAsse
ssmentPackage_OCR.PDF
NSI Nursing Solutions, Inc. (2017). 2017 national health care retention & RN staffing
report. East Petersburg, PA.
Page, S. E. (2007). Making the difference: Applying a logic of diversity. The Academy of
Management Perspectives, 21(4), 6–20.

106
Parker, V. A. (2010). The importance of cultural competence in caring for and working in
a diverse America. Generations, 34(4), 97–102.
Patient Protection and Affordable Care Act, 42 U.S.C.§ 18001 et seq. (2010).
Podsakoff, P. M., MacKenzie, S. B., Lee, J.-Y., & Podsakoff, N. P. (2003). Common
method biases in behavioral research: A critical review of the literature and
recommended remedies. Journal of Applied Psychology, 88(5), 879–903.
https://doi.org/10.1037/0021-9010.88.5.879
Price, J. L., & Mueller, C. W. (1981). A causal model of turnover for nurses. Academy of
Management Journal, 24(3), 543–565.
Pritchard, K., & Whiting, R. (2014). Baby boomers and the lost generation: On the
discursive construction of generation at work. Organization Studies, 35(11), 1605–
1626.
Rector, J., Johnson, D., Malanij, P., & Fumic, L. (2011). The international diversity and
inclusion lexicon (Educator’s Edition). Westlake, Ohio: Profiles in Diversity
Journal.
Reitz, O. E., Anderson, M. A., & Hill, P. D. (2010). Job embeddedness and nurse
retention. Nursing Administration Quarterly, 34(3), 190–200.
Richard, O. C., & Miller, C. (2013). Considering diversity as a source of competitive
advantage in organizations. In The Oxford handbook of diversity and work (pp.
239–250). New York, New York: Oxford University Press.
Roberge, M.-É., & van Dick, R. (2010). Recognizing the benefits of diversity: When and
how does diversity increase group performance? Human Resource Management
Review, 20(4), 295–308. https://doi.org/10.1016/j.hrmr.2009.09.002
107
Roberts, L. M., & Creary, S. J. (2013). Navigating the self in diverse work contexts. The
Oxford Handbook of Diversity and Work, 1, 73–97.
Rose, P. (2011). Cultural competency for health administration and public health.
Sudbury, MA: Jones & Bartlett Learning.
Schmidt, B. J., & MacWilliams, B. R. (2015). Evaluating an Accelerated Nursing
Program: A Dashboard for Diversity. Journal of Professional Nursing, 31(2), 82–
88. https://doi.org/10.1016/j.profnurs.2014.09.001
Schneider, B., Gunnarson, S. K., & Niles-Jolly, K. (1994). Creating the climate and
culture of success. Organizational Dynamics, 23(1), 17–29.
Schneider, K. T., Hitlan, R. T., & Radhakrishnan, P. (2000). An examination of the nature
and correlates of ethnic harassment experiences in multiple contexts. Journal of
Applied Psychology, 85(1), 3–12. https://doi.org/10.1037//0021-9010.85.1.3
Schumacker, R., & Lomax, R. (2016). A beginner’s guide to structural equation modeling
(Fourth). New York, New York: Routledge.
Sheridan, J. E., & Abelson, M. A. (1983). Cusp catastrophe model of employee turnover.
Academy of Management Journal, 26(3), 418–436.
Shore, L. M., Randel, A. E., Chung, B. G., Dean, M. A., Holcombe Ehrhart, K., & Singh,
G. (2011). Inclusion and diversity in work groups: A review and model for future
research. Journal of Management, 37(4), 1262–1289.
https://doi.org/10.1177/0149206310385943
Shore, L. M., & Tetrick, L. E. (1991). A construct validity study of the Survey of
Perceived Organizational Support. Journal of Applied Psychology, 76(5), 637.
108
Singh, B., & Selvarajan, T. T. (2013). Is it spillover or compensation? Effects of
community and organizational diversity climates on race differentiated employee
intent to stay. Journal of Business Ethics, 115(2), 259–269.
https://doi.org/10.1007/s10551-012-1392-5
Smolowitz, J., Speakman, E., Wojnar, D., Whelan, E.-M., Ulrich, S., Hayes, C., & Wood,
L. (2015). Role of the registered nurse in primary health care: Meeting health care
needs in the 21st century. Nursing Outlook, 63(2), 130–136.
https://doi.org/10.1016/j.outlook.2014.08.004
Snedecor, G., & Cochran, W. (1989). Statistical methods (8th ed.). Iowa State University
Press.
Spector, R. (2013). Cultural diversity in health and illness (8th ed.). Boston, MA: Pearson
Education, Inc.
Spreitzer, G. M. (1995). Psychological empowerment in the workplace: Dimensions,
measurement, and validation. Academy of Management Journal, 38(5), 1442–
1465.
Stewart, R. W. (2011). You support diversity, but are you ethical? Examining the
interactive effects of diversity and ethical climate perceptions on turnover
intentions. Journal of Business Ethics, 99(3), 453–465.
https://doi.org/10.1007/s10551-010-0663-2
Strauss, W., & Howe, N. (1991). Generations: The history of America’s future, 1584 to
2069. New York.
Stroth, C. (2010). Job embeddedness as a nurse retention strategy for rural hospitals.
Journal of Nursing Administration, 40(1), 32–35.
109
Swider, B. W., & Zimmerman, R. D. (2010). Born to burnout: A meta-analytic path model
of personality, job burnout, and work outcomes. Journal of Vocational Behavior,
76(3), 487–506. https://doi.org/10.1016/j.jvb.2010.01.003
Tabachnick, B., & Fidell, L. (2007). Using multivariate statistics (5th ed.). Boston, MA:
Allyn and Bacon.
Teclaw, R., Price, M. C., & Osatuke, K. (2012). Demographic question placement: Effect
on item response rates and means of a veterans health administration survey.
Journal of Business and Psychology, 27(3), 281–290.
https://doi.org/10.1007/s10869-011-9249-y
Tekleab, A. G., Takeuchi, R., & Taylor, M. S. (2005). Extending the chain of relationships
among organizational justice, social exchange, and employee reactions: The role of
contract violations. Academy of Management Journal, 48(1), 146–157.
The Joint Commission. (2010). Advancing effective communication, cultural competence,
and patient and family-centered care: A roadmap for hospitals. Oakbrook Terrace,
IL: The Joint Commission. Retrieved from
http://www.vidatak.com/images/pdf/A%20Roadmap%20for%20Hospitals.pdf
Thomas, K., & Velthouse, B. (1991). Cognitive elements of empowerment. Academy of
Management Review, 15(4), 666–681.
Thompson, B. (2004). Exploratory and confirmatory factor analysis: Understanding
concepts and applications. Washington, DC: American Psychological Association.
van Knippenberg, D., van Ginkel, W. P., & Homan, A. C. (2013). Diversity mindsets and
the performance of diverse teams. Organizational Behavior and Human Decision
Processes, 121(2), 183–193. https://doi.org/10.1016/j.obhdp.2013.03.003
110
VanMeter, R. A., Grisaffe, D. B., Chonko, L. B., & Roberts, J. A. (2013). Generation Y’s
Ethical Ideology and Its Potential Workplace Implications. Journal of Business
Ethics, 117(1), 93–109. https://doi.org/10.1007/s10551-012-1505-1
Webber, S., & Donahue, L. (2001). Impact of highly and less job-related diversity on
work group cohesion and performance: a meta-analysis. Journal of Management,
27(2), 22.
Wells, B. E., & Twenge, J. M. (2005). Changes in Young People’s Sexual Behavior and
Attitudes, 1943-1999: A Cross-Temporal Meta-Analysis. Review of General
Psychology, 9(3), 249–261. https://doi.org/10.1037/1089-2680.9.3.249
Williams, D. R., & Sternthal, M. (2010). Understanding racial-ethnic disparities in health:
Sociological contributions. Journal of Health and Social Behavior, 51(1 Suppl),
S15–S27. https://doi.org/10.1177/0022146510383838
Williams, K., & O’Reilly, C. (1998). Demography and diversity in organizations: A
review of 40 years of research. Research in Organizational Behavior, 20, 77–140.
Wolf, E. J., Harrington, K. M., Clark, S. L., & Miller, M. W. (2013). Sample size
requirements for structural equation models: An evaluation of power, bias, and
solution propriety. Educational and Psychological Measurement, 73(6), 913–934.
https://doi.org/10.1177/0013164413495237
Wolfson, N., Kraiger, K., & Finkelstein, L. (2011). The relationship between diversity
climate perceptions and workplace attitudes. The Psychologist-Manager Journal,
14(3), 161–176. https://doi.org/10.1080/10887156.2011.546170
111
Xue, Y., & Brewer, C. (2014). Racial and ethnic diversity of the U.S. national nurse
workforce 1988-2013. Policy, Politics, & Nursing Practice, 15(3–4), 102–110.
https://doi.org/10.1177/1527154414560291
Yang, Y., & Konrad, A. M. (2011). Diversity and organizational innovation: The role of
employee involvement. Journal of Organizational Behavior, 32(8), 1062–1083.
https://doi.org/10.1002/job.724
Zimmerman, R. D. (2008). Understanding the impact of personality traits on individuals’
turnover decisions: A meta-analytic path model. Personnel Psychology, 61(2),
309–348.
Zurmehly, J., Martin, P. A., & Fitzpatrick, J. J. (2009). Registered nurse empowerment
and intent to leave current position and/or profession. Journal of Nursing
Management, 17(3), 383–391. https://doi.org/10.1111/j.1365-2834.2008.00940.x
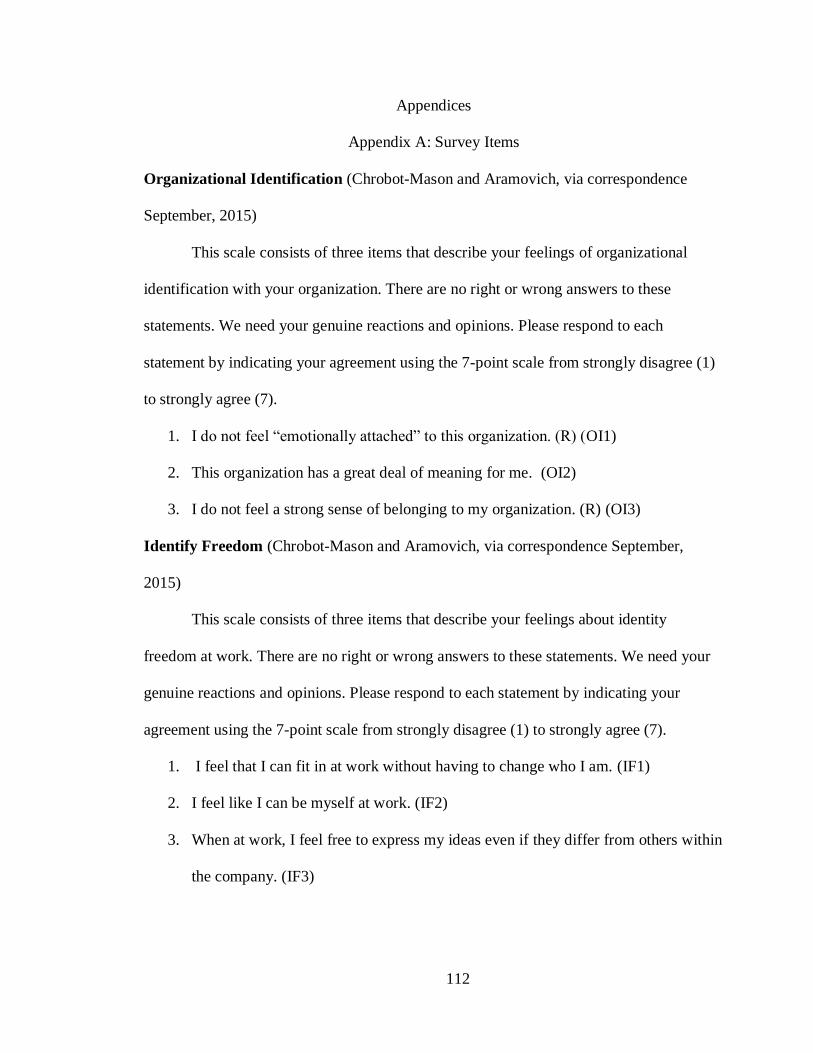
112
Appendices
Appendix A: Survey Items
Organizational Identification (Chrobot-Mason and Aramovich, via correspondence
September, 2015)
This scale consists of three items that describe your feelings of organizational
identification with your organization. There are no right or wrong answers to these
statements. We need your genuine reactions and opinions. Please respond to each
statement by indicating your agreement using the 7-point scale from strongly disagree (1)
to strongly agree (7).
1. I do not feel “emotionally attached” to this organization. (R) (OI1)
2. This organization has a great deal of meaning for me. (OI2)
3. I do not feel a strong sense of belonging to my organization. (R) (OI3)
Identify Freedom (Chrobot-Mason and Aramovich, via correspondence September,
2015)
This scale consists of three items that describe your feelings about identity
freedom at work. There are no right or wrong answers to these statements. We need your
genuine reactions and opinions. Please respond to each statement by indicating your
agreement using the 7-point scale from strongly disagree (1) to strongly agree (7).
1. I feel that I can fit in at work without having to change who I am. (IF1)
2. I feel like I can be myself at work. (IF2)
3. When at work, I feel free to express my ideas even if they differ from others within
the company. (IF3)
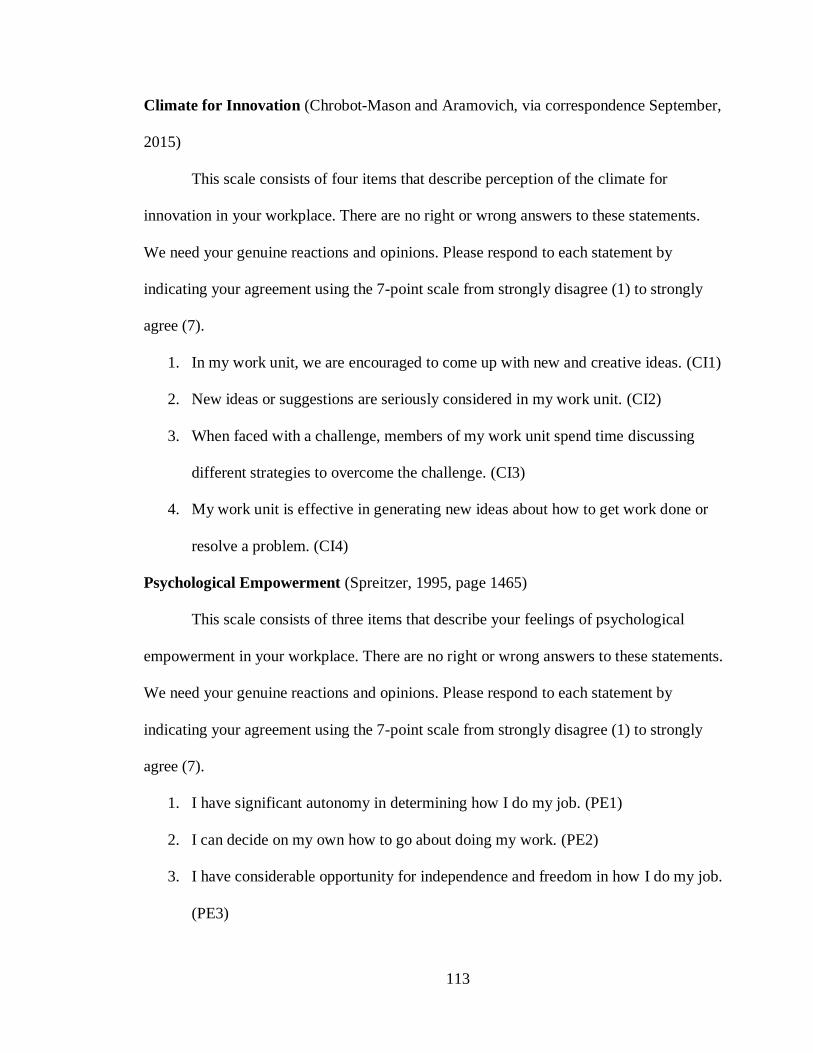
113
Climate for Innovation (Chrobot-Mason and Aramovich, via correspondence September,
2015)
This scale consists of four items that describe perception of the climate for
innovation in your workplace. There are no right or wrong answers to these statements.
We need your genuine reactions and opinions. Please respond to each statement by
indicating your agreement using the 7-point scale from strongly disagree (1) to strongly
agree (7).
1. In my work unit, we are encouraged to come up with new and creative ideas. (CI1)
2. New ideas or suggestions are seriously considered in my work unit. (CI2)
3. When faced with a challenge, members of my work unit spend time discussing
different strategies to overcome the challenge. (CI3)
4. My work unit is effective in generating new ideas about how to get work done or
resolve a problem. (CI4)
Psychological Empowerment (Spreitzer, 1995, page 1465)
This scale consists of three items that describe your feelings of psychological
empowerment in your workplace. There are no right or wrong answers to these statements.
We need your genuine reactions and opinions. Please respond to each statement by
indicating your agreement using the 7-point scale from strongly disagree (1) to strongly
agree (7).
1. I have significant autonomy in determining how I do my job. (PE1)
2. I can decide on my own how to go about doing my work. (PE2)
3. I have considerable opportunity for independence and freedom in how I do my job.
(PE3)
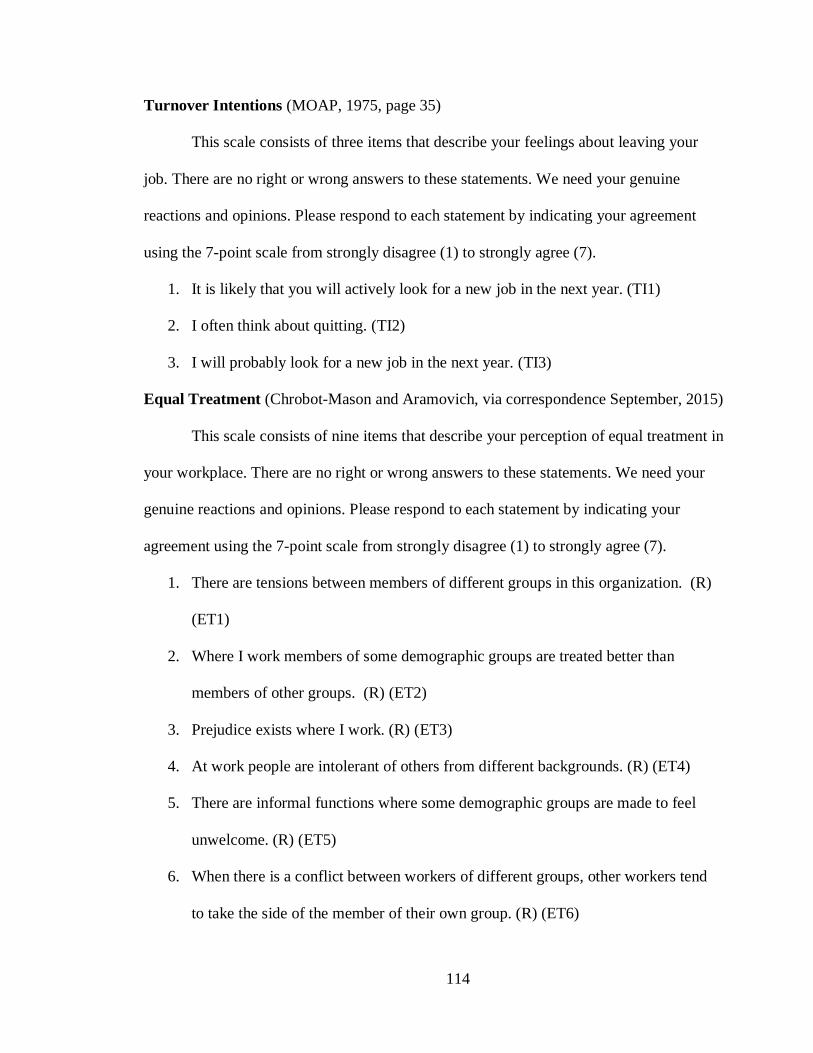
114
Turnover Intentions (MOAP, 1975, page 35)
This scale consists of three items that describe your feelings about leaving your
job. There are no right or wrong answers to these statements. We need your genuine
reactions and opinions. Please respond to each statement by indicating your agreement
using the 7-point scale from strongly disagree (1) to strongly agree (7).
1. It is likely that you will actively look for a new job in the next year. (TI1)
2. I often think about quitting. (TI2)
3. I will probably look for a new job in the next year. (TI3)
Equal Treatment (Chrobot-Mason and Aramovich, via correspondence September, 2015)
This scale consists of nine items that describe your perception of equal treatment in
your workplace. There are no right or wrong answers to these statements. We need your
genuine reactions and opinions. Please respond to each statement by indicating your
agreement using the 7-point scale from strongly disagree (1) to strongly agree (7).
1. There are tensions between members of different groups in this organization. (R)
(ET1)
2. Where I work members of some demographic groups are treated better than
members of other groups. (R) (ET2)
3. Prejudice exists where I work. (R) (ET3)
4. At work people are intolerant of others from different backgrounds. (R) (ET4)
5. There are informal functions where some demographic groups are made to feel
unwelcome. (R) (ET5)
6. When there is a conflict between workers of different groups, other workers tend
to take the side of the member of their own group. (R) (ET6)
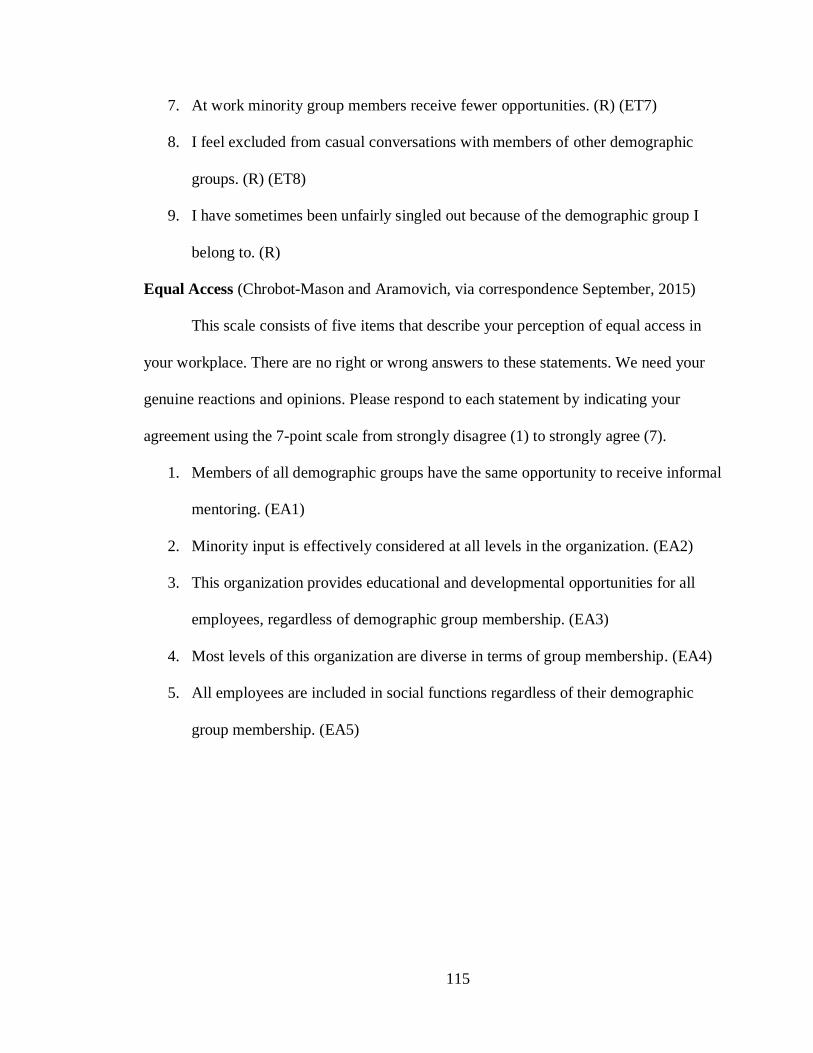
115
7. At work minority group members receive fewer opportunities. (R) (ET7)
8. I feel excluded from casual conversations with members of other demographic
groups. (R) (ET8)
9. I have sometimes been unfairly singled out because of the demographic group I
belong to. (R)
Equal Access (Chrobot-Mason and Aramovich, via correspondence September, 2015)
This scale consists of five items that describe your perception of equal access in
your workplace. There are no right or wrong answers to these statements. We need your
genuine reactions and opinions. Please respond to each statement by indicating your
agreement using the 7-point scale from strongly disagree (1) to strongly agree (7).
1. Members of all demographic groups have the same opportunity to receive informal
mentoring. (EA1)
2. Minority input is effectively considered at all levels in the organization. (EA2)
3. This organization provides educational and developmental opportunities for all
employees, regardless of demographic group membership. (EA3)
4. Most levels of this organization are diverse in terms of group membership. (EA4)
5. All employees are included in social functions regardless of their demographic
group membership. (EA5)
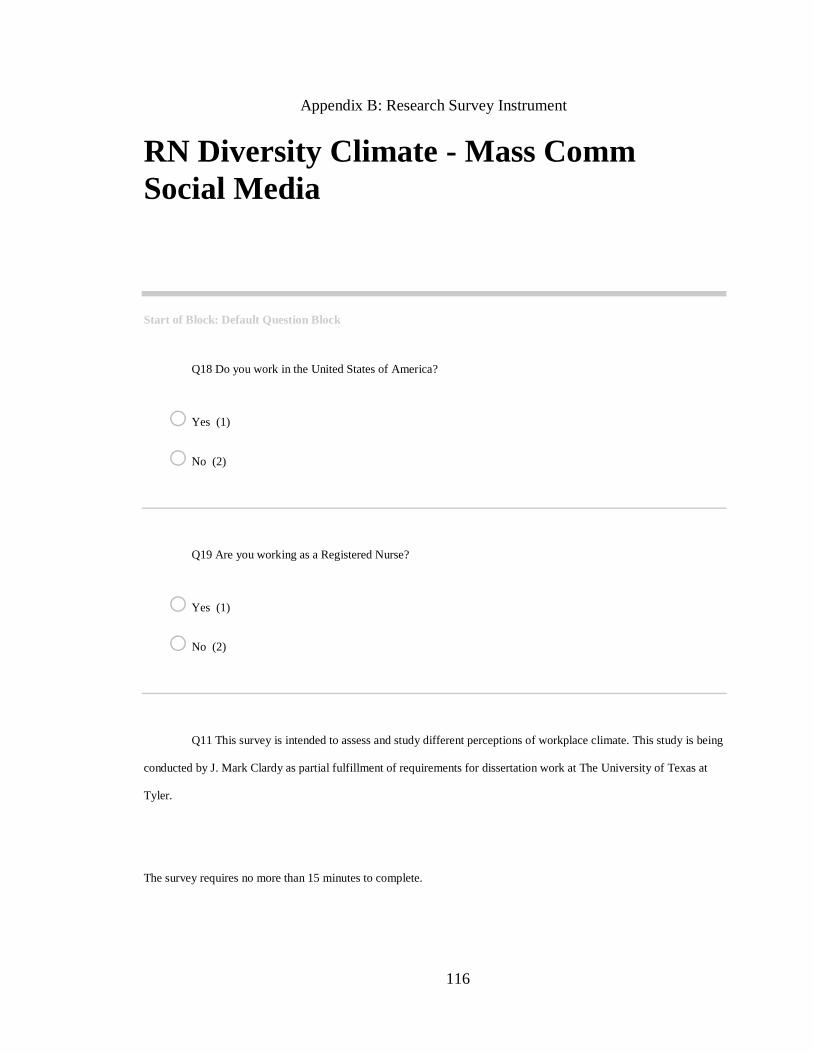
116
Appendix B: Research Survey Instrument
RN Diversity Climate - Mass Comm
Social Media
Start of Block: Default Question Block
Q18 Do you work in the United States of America?
o Yes (1)
o No (2)
Q19 Are you working as a Registered Nurse?
o Yes (1)
o No (2)
Q11 This survey is intended to assess and study different perceptions of workplace climate. This study is being
conducted by J. Mark Clardy as partial fulfillment of requirements for dissertation work at The University of Texas at
Tyler.
The survey requires no more than 15 minutes to complete.
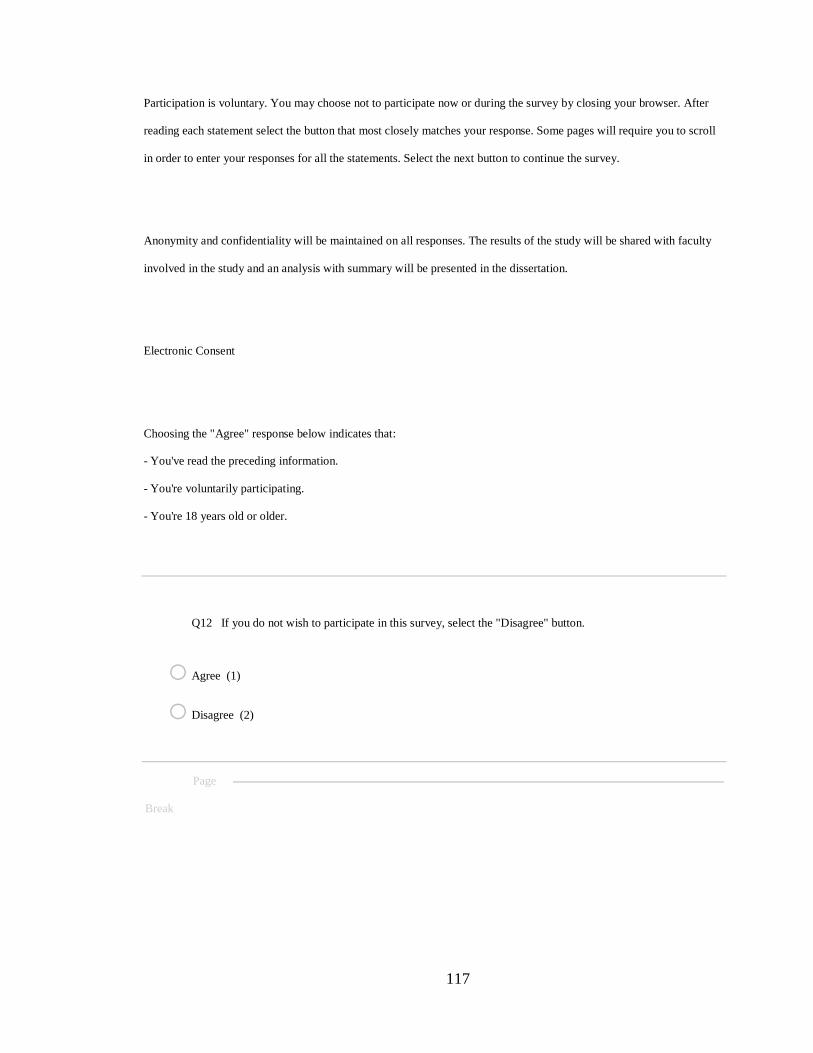
117
Participation is voluntary. You may choose not to participate now or during the survey by closing your browser. After
reading each statement select the button that most closely matches your response. Some pages will require you to scroll
in order to enter your responses for all the statements. Select the next button to continue the survey.
Anonymity and confidentiality will be maintained on all responses. The results of the study will be shared with faculty
involved in the study and an analysis with summary will be presented in the dissertation.
Electronic Consent
Choosing the "Agree" response below indicates that:
- You've read the preceding information.
- You're voluntarily participating.
- You're 18 years old or older.
Q12 If you do not wish to participate in this survey, select the "Disagree" button.
o Agree (1)
o Disagree (2)
Page
Break
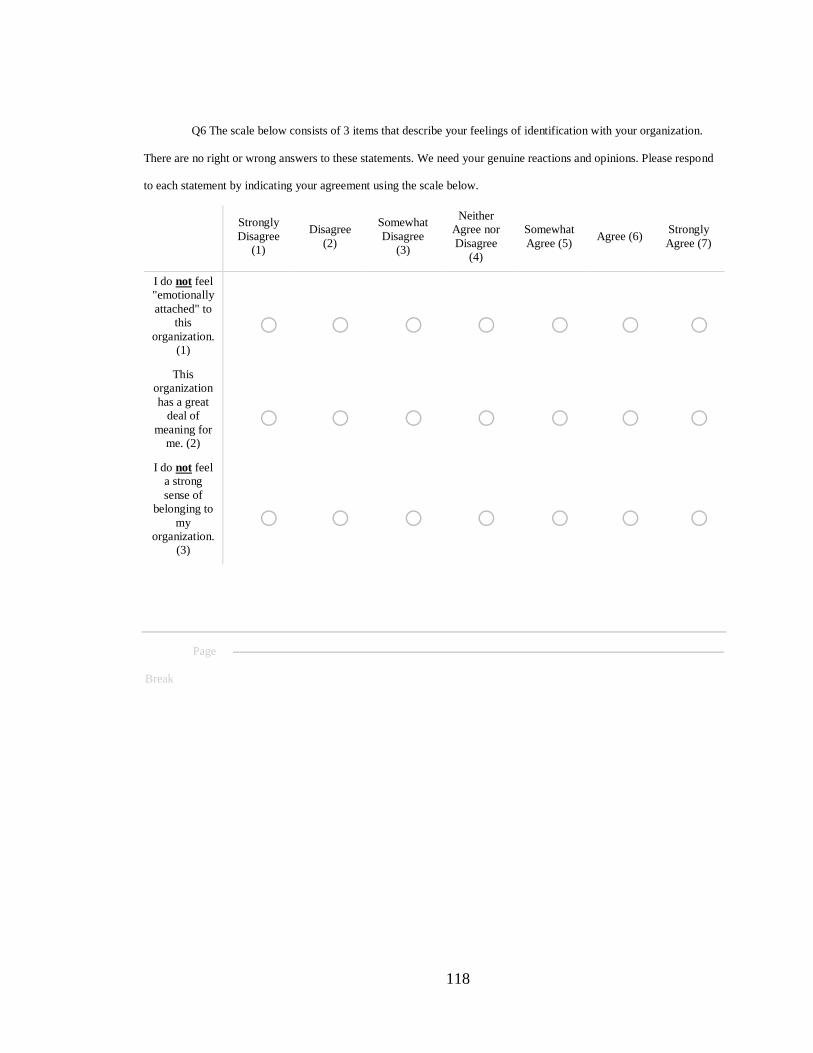
118
Q6 The scale below consists of 3 items that describe your feelings of identification with your organization.
There are no right or wrong answers to these statements. We need your genuine reactions and opinions. Please respond
to each statement by indicating your agreement using the scale below.
Strongly
Disagree
(1)
Disagree
(2)
Somewhat
Disagree
(3)
Neither
Agree nor
Disagree
(4)
Somewhat
Agree (5) Agree (6)
Strongly
Agree (7)
I do not feel
"emotionally
attached" to
this
organization.
(1)
o o o o o o o
This
organization
has a great
deal of
meaning for
me. (2)
o o o o o o o
I do not feel
a strong
sense of
belonging to
my
organization.
(3)
o o o o o o o
Page
Break
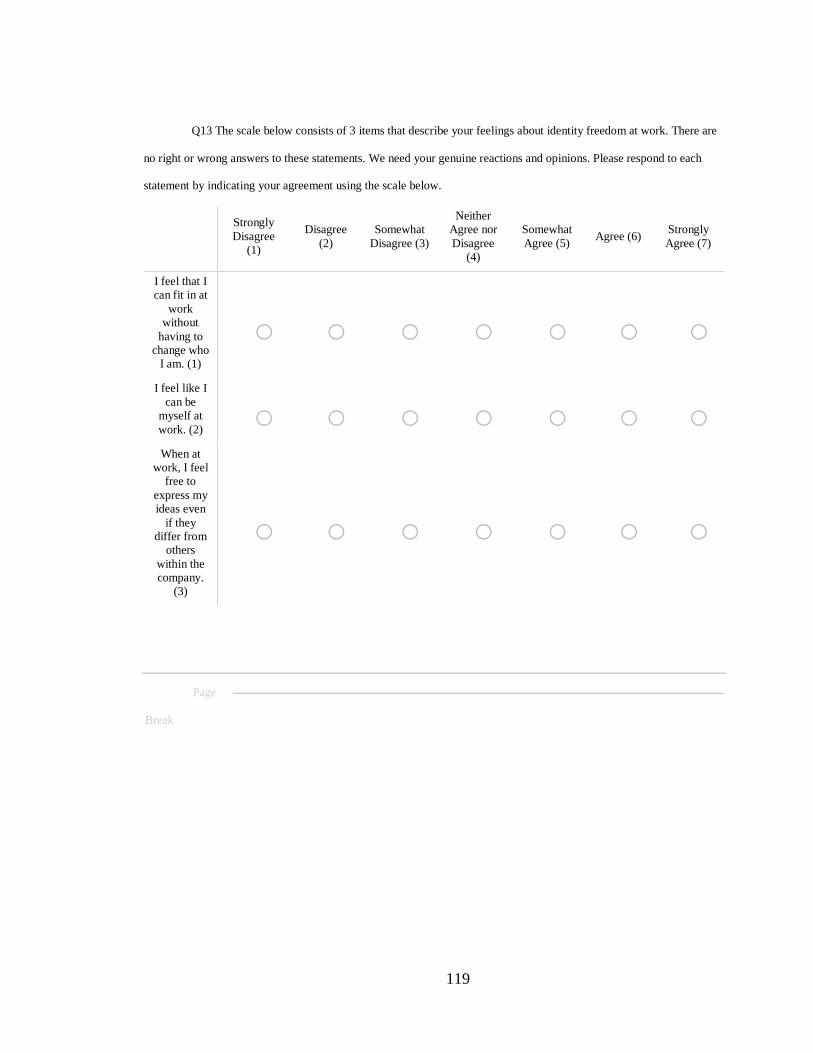
119
Q13 The scale below consists of 3 items that describe your feelings about identity freedom at work. There are
no right or wrong answers to these statements. We need your genuine reactions and opinions. Please respond to each
statement by indicating your agreement using the scale below.
Strongly
Disagree
(1)
Disagree
(2)
Somewhat
Disagree (3)
Neither
Agree nor
Disagree
(4)
Somewhat
Agree (5) Agree (6)
Strongly
Agree (7)
I feel that I
can fit in at
work
without
having to
change who
I am. (1)
o o o o o o o
I feel like I
can be
myself at
work. (2) o o o o o o o
When at
work, I feel
free to
express my
ideas even
if they
differ from
others
within the
company.
(3)
o o o o o o o
Page
Break
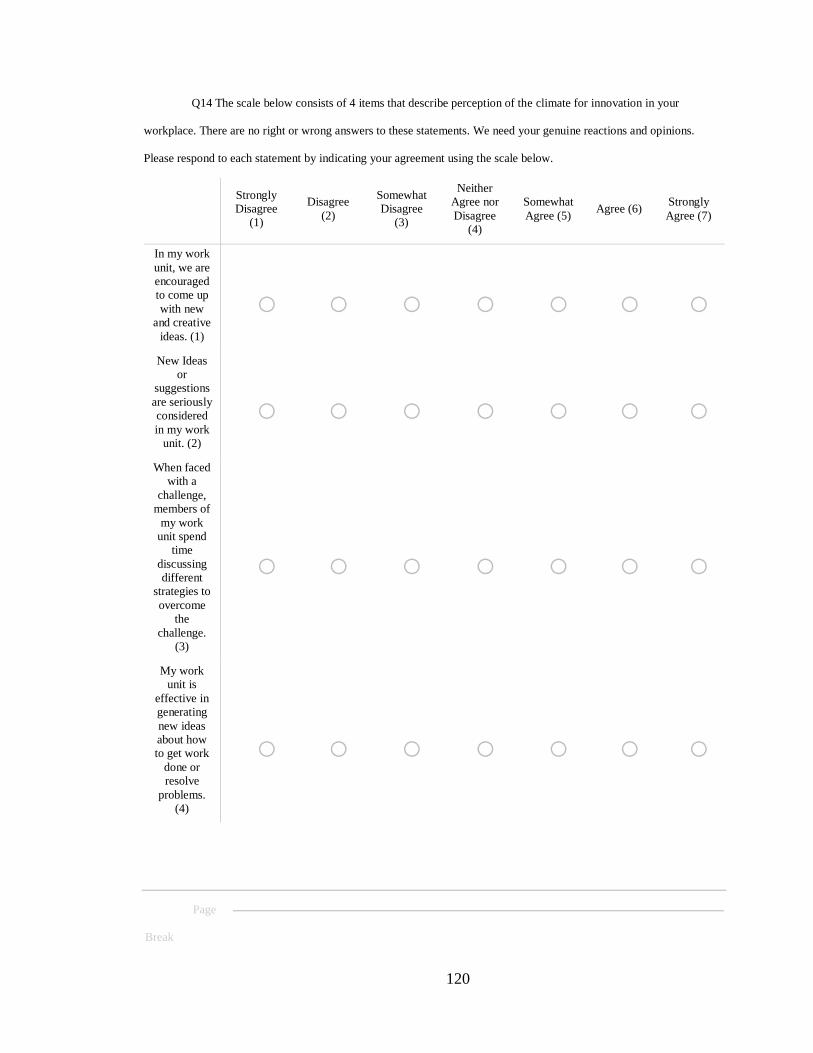
120
Q14 The scale below consists of 4 items that describe perception of the climate for innovation in your
workplace. There are no right or wrong answers to these statements. We need your genuine reactions and opinions.
Please respond to each statement by indicating your agreement using the scale below.
Strongly
Disagree
(1)
Disagree
(2)
Somewhat
Disagree
(3)
Neither
Agree nor
Disagree
(4)
Somewhat
Agree (5) Agree (6)
Strongly
Agree (7)
In my work
unit, we are
encouraged
to come up
with new
and creative
ideas. (1)
o o o o o o o
New Ideas
or
suggestions
are seriously
considered
in my work
unit. (2)
o o o o o o o
When faced
with a
challenge,
members of
my work
unit spend
time
discussing
different
strategies to
overcome
the
challenge.
(3)
o o o o o o o
My work
unit is
effective in
generating
new ideas
about how
to get work
done or
resolve
problems.
(4)
o o o o o o o
Page
Break

121

122
Q15 The scale below consists of 3 items that describe your feelings of psychological empowerment in your
workplace. There are no right or wrong answers to these statements. We need your genuine reactions and opinions.
Please respond to each statement by indicating your agreement using the scale below.
Strongly
Disagree
(1)
Disagree
(2)
Somewhat
Disagree
(3)
Neither
Agree nor
Disagree
(4)
Somewhat
Agree (5) Agree (6)
Strongly
Agree (7)
I have
significant
autonomy in
determining
how I do my
job. (1)
o o o o o o o
I can decide
on my own
how to go
about doing
my work. (2)
o o o o o o o I have
considerable
opportunity
for
independence
and freedom
in how I do
my job. (3)
o o o o o o o
Page
Break
Q3 The scale below consists of 9 statements that describe your perception of equal treatment in your
workplace. There are no right or wrong answers to these statements. We need your genuine reactions and opinions.
Please respond to each statement by indicating your agreement using the scale below.
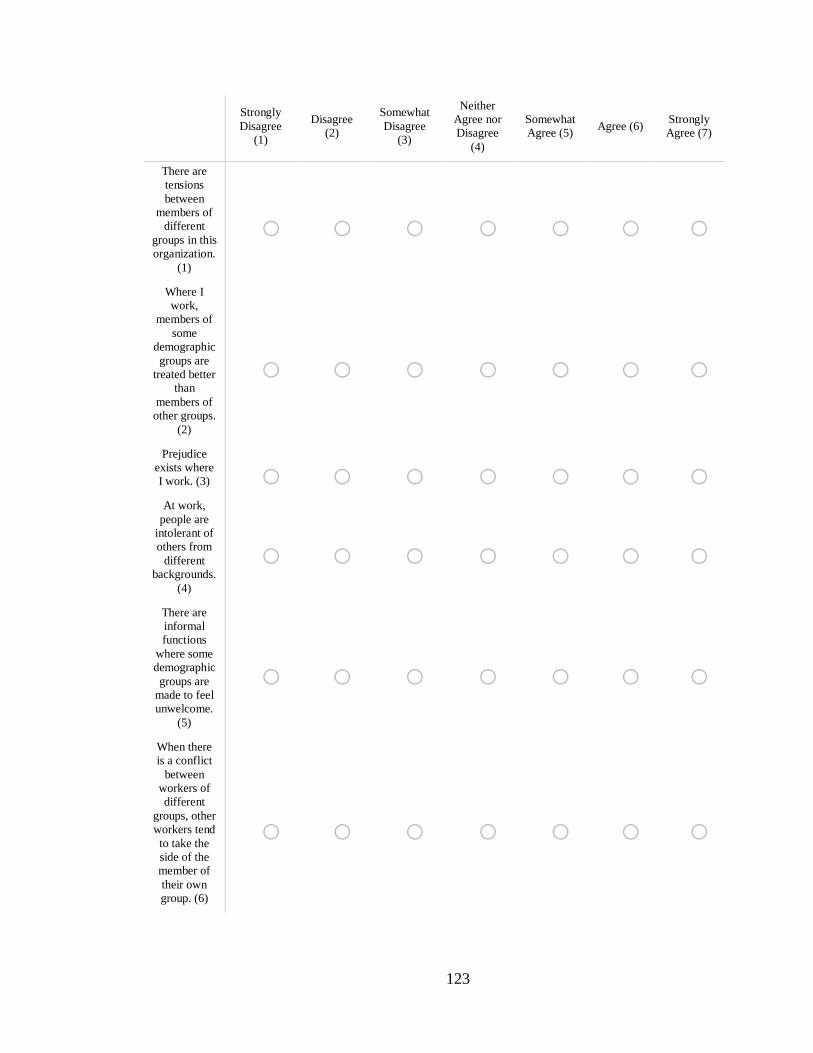
123
Strongly
Disagree
(1)
Disagree
(2)
Somewhat
Disagree
(3)
Neither
Agree nor
Disagree
(4)
Somewhat
Agree (5) Agree (6)
Strongly
Agree (7)
There are
tensions
between
members of
different
groups in this
organization.
(1)
o o o o o o o
Where I
work,
members of
some
demographic
groups are
treated better
than
members of
other groups.
(2)
o o o o o o o
Prejudice
exists where
I work. (3) o o o o o o o At work,
people are
intolerant of
others from
different
backgrounds.
(4)
o o o o o o o
There are
informal
functions
where some
demographic
groups are
made to feel
unwelcome.
(5)
o o o o o o o
When there
is a conflict
between
workers of
different
groups, other
workers tend
to take the
side of the
member of
their own
group. (6)
o o o o o o o
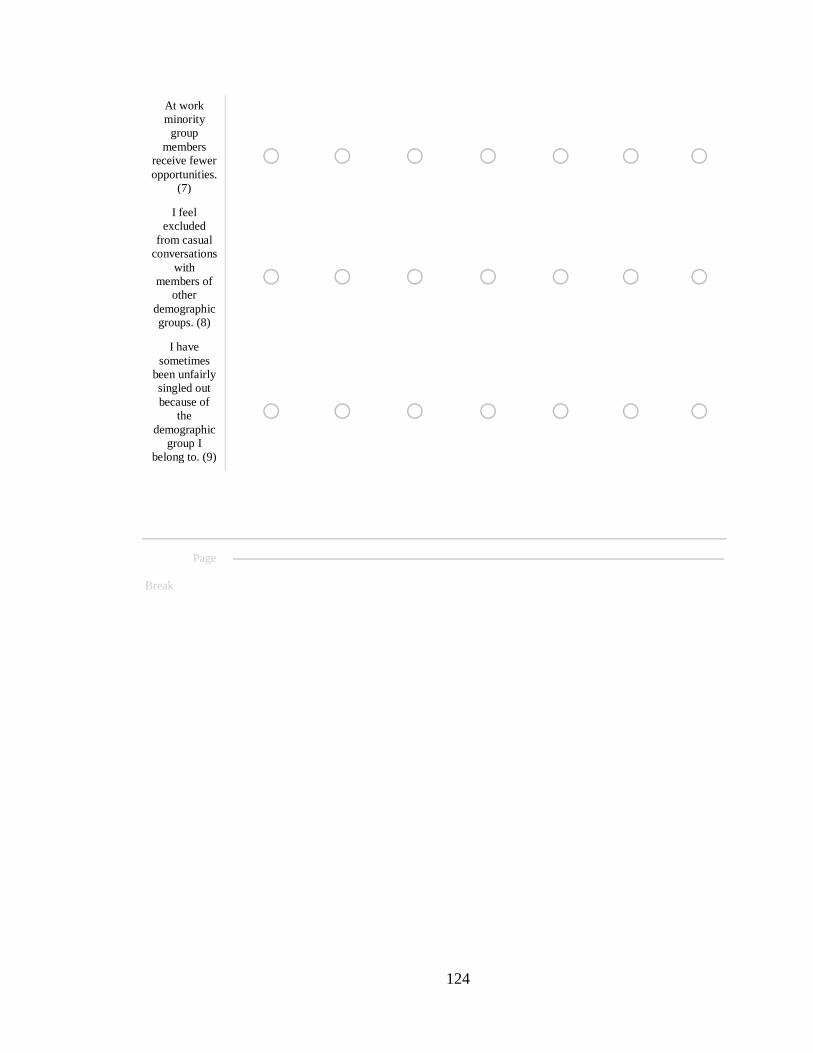
124
At work
minority
group
members
receive fewer
opportunities.
(7)
o o o o o o o
I feel
excluded
from casual
conversations
with
members of
other
demographic
groups. (8)
o o o o o o o
I have
sometimes
been unfairly
singled out
because of
the
demographic
group I
belong to. (9)
o o o o o o o
Page
Break
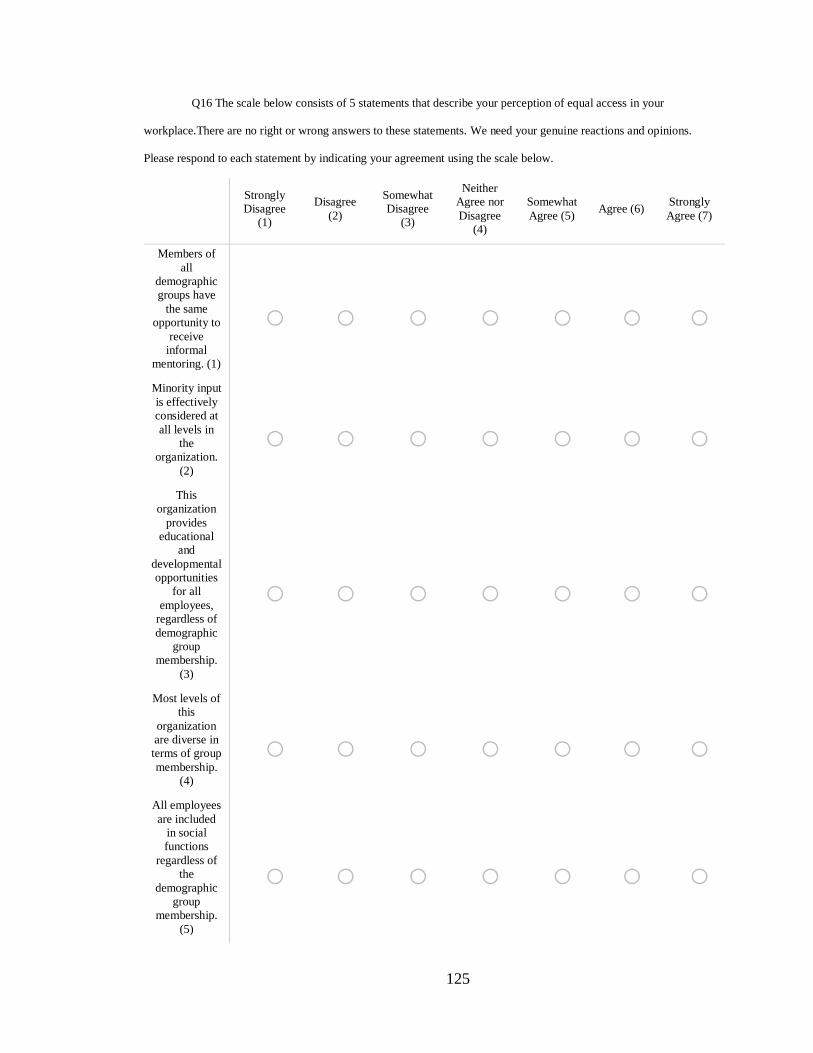
125
Q16 The scale below consists of 5 statements that describe your perception of equal access in your
workplace.There are no right or wrong answers to these statements. We need your genuine reactions and opinions.
Please respond to each statement by indicating your agreement using the scale below.
Strongly
Disagree
(1)
Disagree
(2)
Somewhat
Disagree
(3)
Neither
Agree nor
Disagree
(4)
Somewhat
Agree (5) Agree (6)
Strongly
Agree (7)
Members of
all
demographic
groups have
the same
opportunity to
receive
informal
mentoring. (1)
o o o o o o o
Minority input
is effectively
considered at
all levels in
the
organization.
(2)
o o o o o o o
This
organization
provides
educational
and
developmental
opportunities
for all
employees,
regardless of
demographic
group
membership.
(3)
o o o o o o o
Most levels of
this
organization
are diverse in
terms of group
membership.
(4)
o o o o o o o
All employees
are included
in social
functions
regardless of
the
demographic
group
membership.
(5)
o o o o o o o
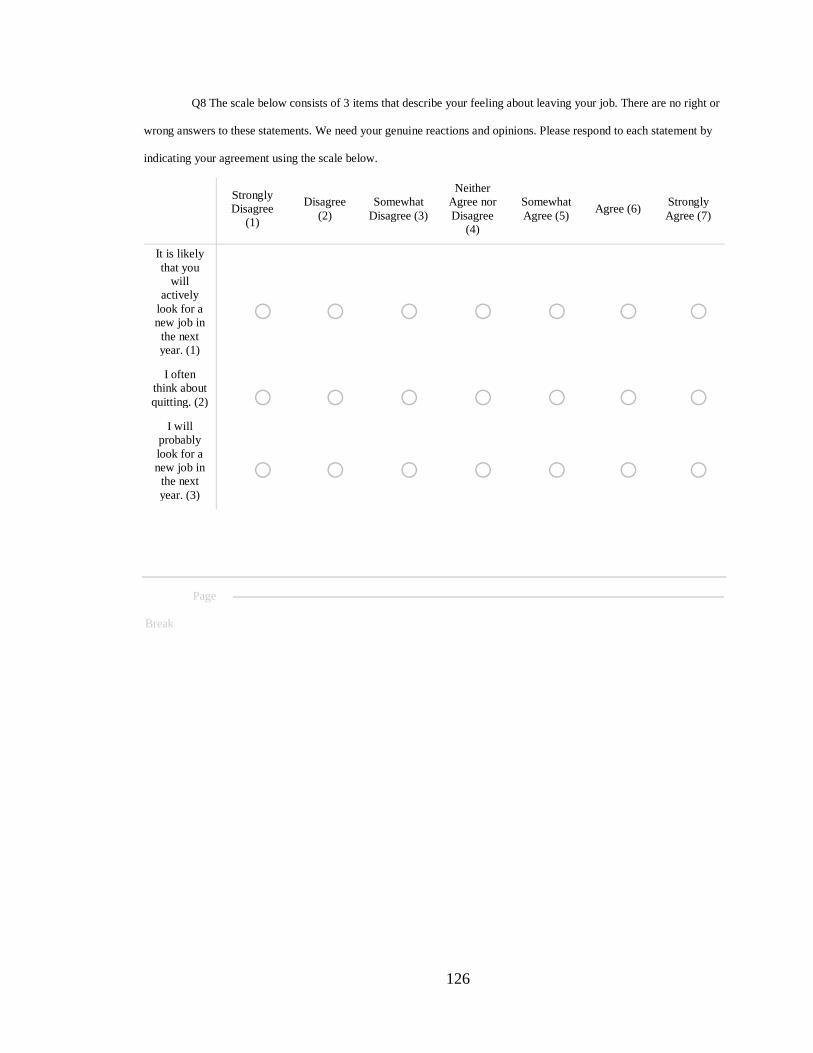
126
Q8 The scale below consists of 3 items that describe your feeling about leaving your job. There are no right or
wrong answers to these statements. We need your genuine reactions and opinions. Please respond to each statement by
indicating your agreement using the scale below.
Strongly
Disagree
(1)
Disagree
(2)
Somewhat
Disagree (3)
Neither
Agree nor
Disagree
(4)
Somewhat
Agree (5) Agree (6)
Strongly
Agree (7)
It is likely
that you
will
actively
look for a
new job in
the next
year. (1)
o o o o o o o
I often
think about
quitting. (2) o o o o o o o I will
probably
look for a
new job in
the next
year. (3)
o o o o o o o
Page
Break
127
Q8 What is your gender?
o Male (1)
o Female (2)
Q9 When were you born?
o 1926-1942 (1)
o 1943-1960 (2)
o 1961-1981 (3)
o 1982- present (4)
128
Q10 What is your race?
o White/Caucasian (1)
o African American (2)
o Hispanic (3)
o Asian (4)
o Native American (5)
o Pacific Islander (6)
o Other (7)
Q13 How long have you worked at current employer?
o 0 to 5 years (1)
o 6 to 10 years (2)
o 11 to 15 years (3)
o 16 + years (4)
Q27 What is your employment status as a registered nurse?
o Full-time (1)
o Part-time (2)
o Per diem (3)

129
Q21 What is your work setting?
o Hospitals; state, local, and private (1)
o Nursing and residential care facilities (2)
o Offices of physicians (3)
o Home healthcare services (4)
o Government (5)
Q26 What is the size of community in which you work?
o (1)
o 5,000-9,999 (2)
o 10,000-24,999 (3)
o 25,000-49,999 (4)
o 50,000-99,999 (5)
o 100,000-249,999 (6)
o 250,000-499,999 (7)
o 500,000-999,999 (8)
o >999,999 (9)
130
Q25 In which state do you currently reside?
▼ Alabama (1) ... I do not reside in the United States (53)
End of Block: Default Question Block
131
Appendix C: Permission for Use of Measurement Instrument
From:”Chrobot-mason, Donna (chrobod)”<[email protected]
Subject: RE: Request for assistance and permission
Date: February 21, 2017 at 11:16:20 AM CST
To:’James Clardy’<[email protected]
HI James, Yes of course, please continue to use the instrument. I am pleased to hear it has been helpful. My only request is that you send me the results of your work so that I can learn more about our instrument and how it is working in the field. Thanks so much. Donna
Donna Chrobot-Mason, Ph.D. Associate Professor and Director, Center for Organizational Leadership Psychology Department University of Cincinnati 513-556-2659 [email protected]
From:James Clardy [mailto:[email protected]]
Sent: Tuesday, February 21, 2017 11:11 AM
To: Chrobot-mason, Donna (chrobod) [email protected]
Subject: Re: Request for assistance and permission
Dr. Chrobot-Mason,
As a refresher, I am J. Mark Clardy, a PhD candidate at The University of Texas at Tyler
studying Human Resource Development and Organizational Change. During the 15-16
academic year, you shared with me the measurement instrument utilized in the
article “The Psychological Benefits of Creating an Affirming Climate for Workplace
Diversity” so that I could use it in my statistics classes. Again, thank you for the
permission. Your instrument made learning Multivariate Analysis, CFA, EFA, and SEM
much easier.
I promised that if I wanted to use it again I would seek your permission first. I seek
your permission to use it again - this time in my dissertation. As in the statistics class, I am
exploring the relationship between registered nurse turnover intentions and the workplace
diversity climate, an area in nursing research that is in need of further exploration.
I hope that you agree and I am always available for any questions that you may have. I am
including all of my contact information below.
Respectfully,
J. Mark Clardy
[email protected], [email protected], [email protected]
254-724-9169 (wk), 254-534-0045 (m), 254-534-0044 (h)
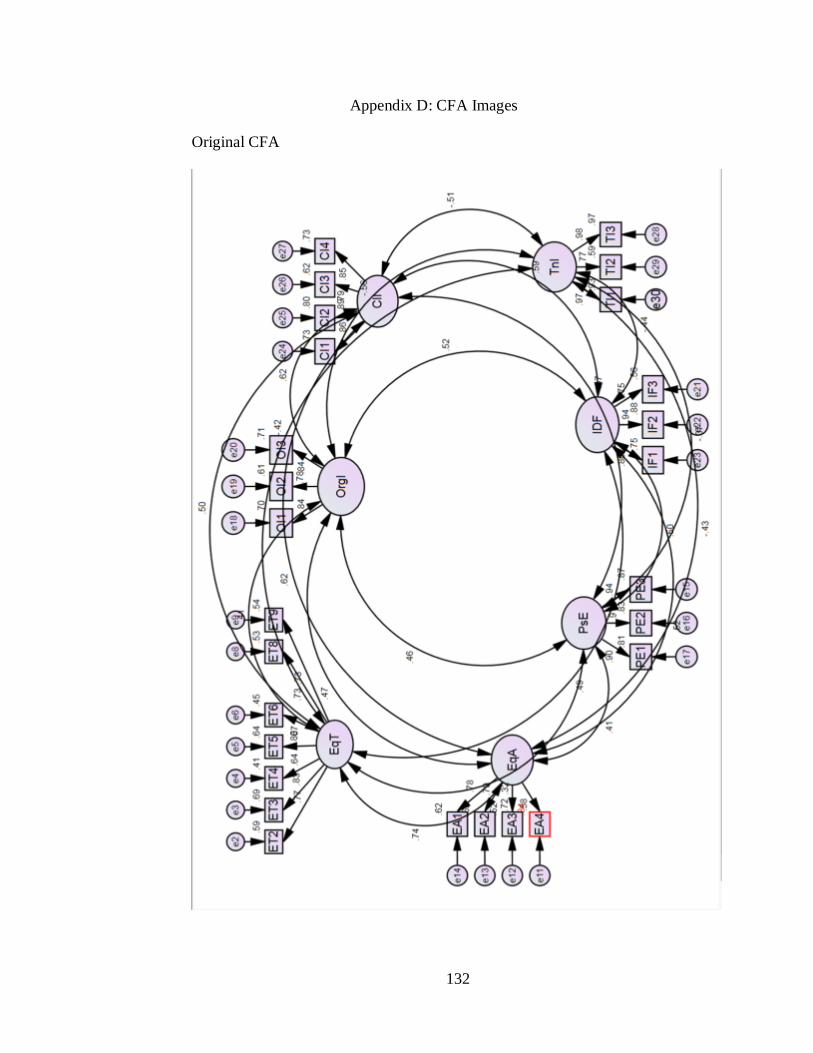
132
Appendix D: CFA Images
Original CFA
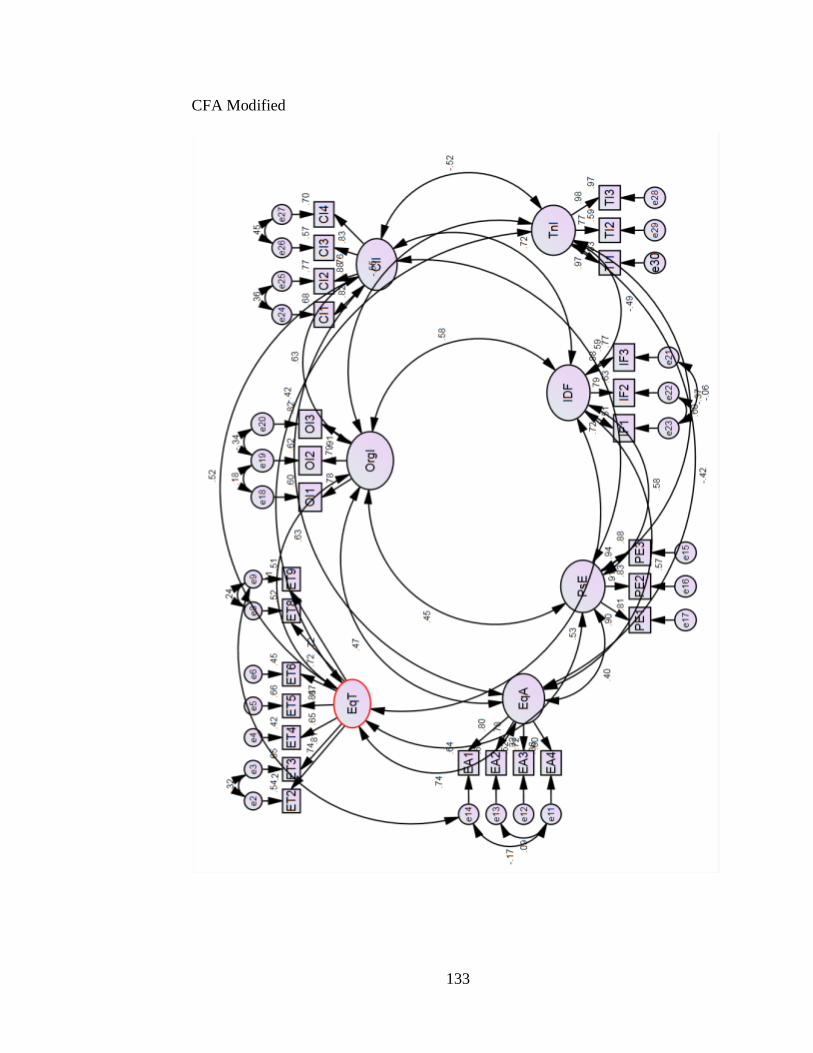
133
CFA Modified
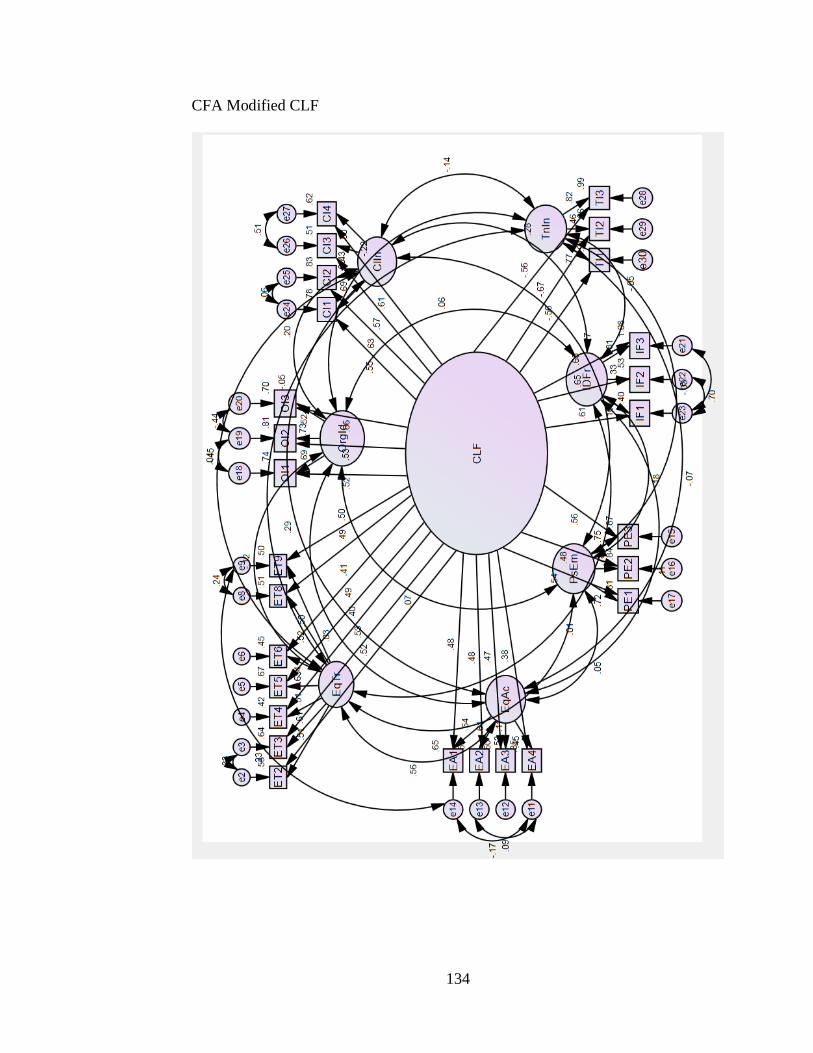
134
CFA Modified CLF
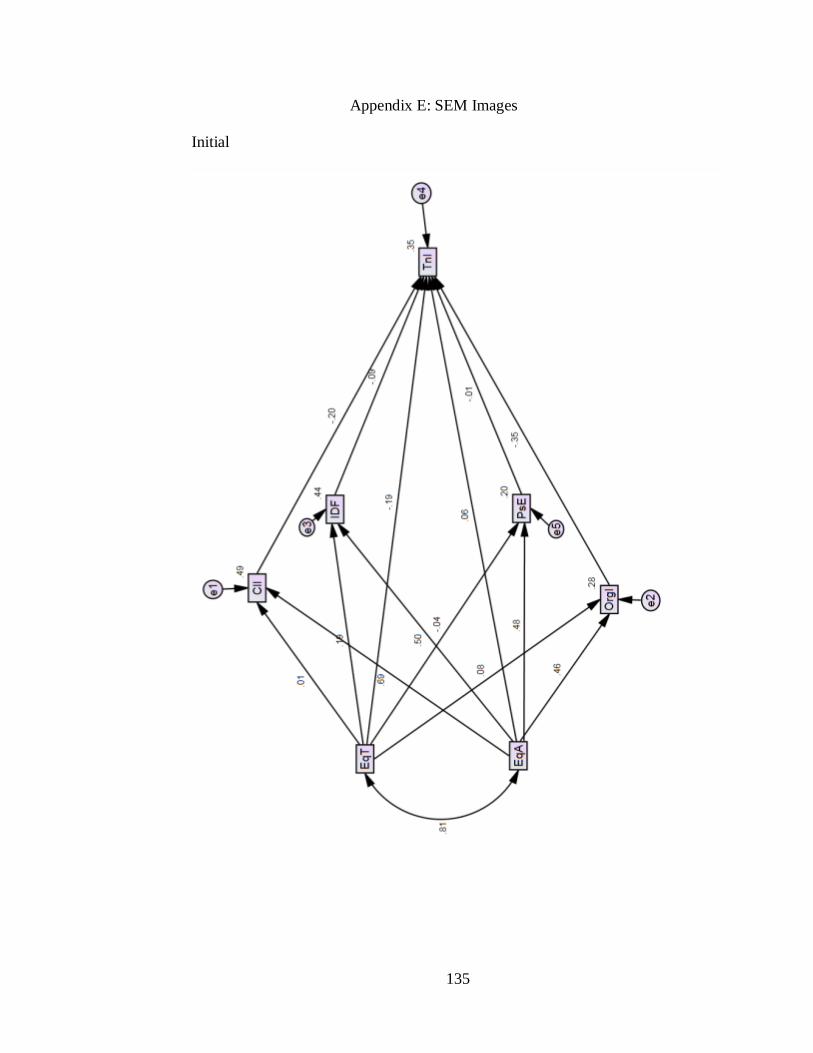
135
Appendix E: SEM Images
Initial

136
With Control
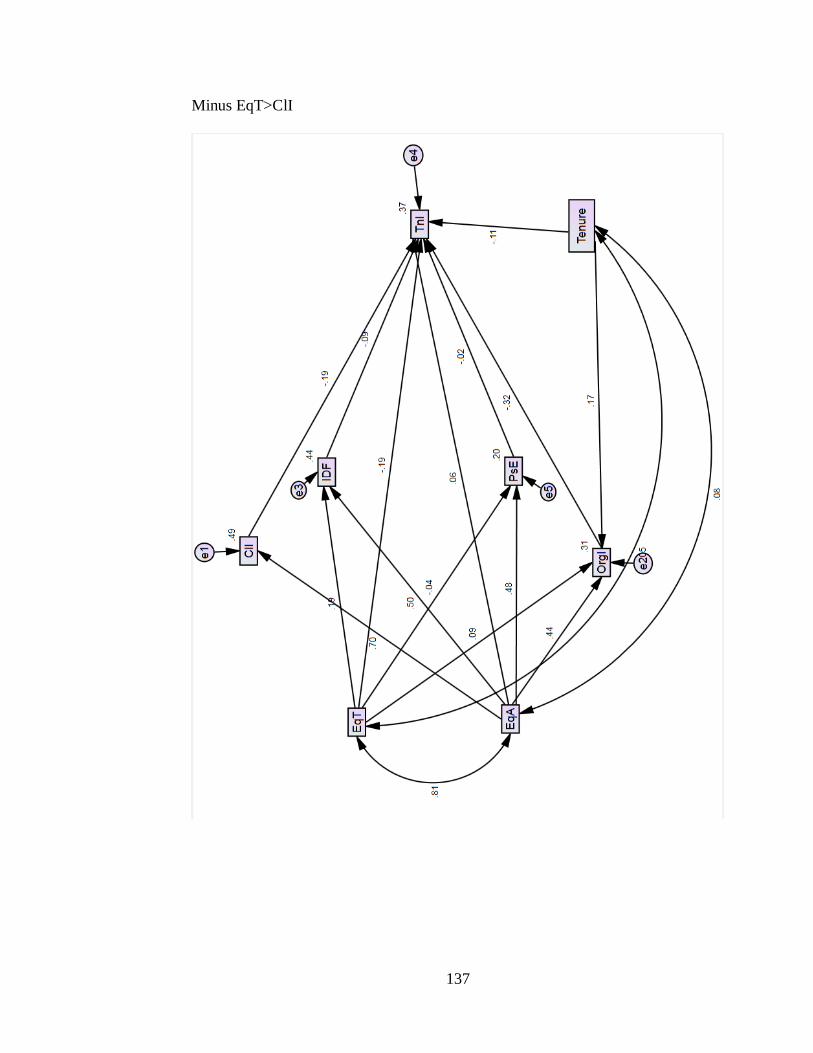
137
Minus EqT>ClI
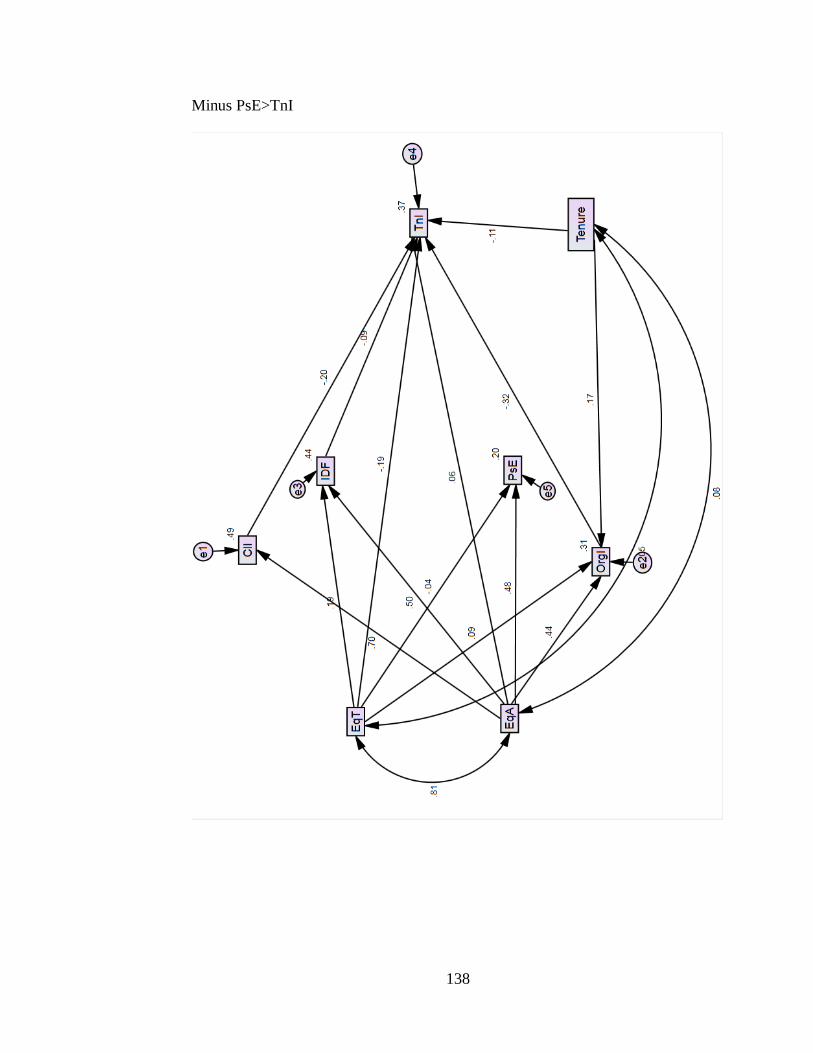
138
Minus PsE>TnI
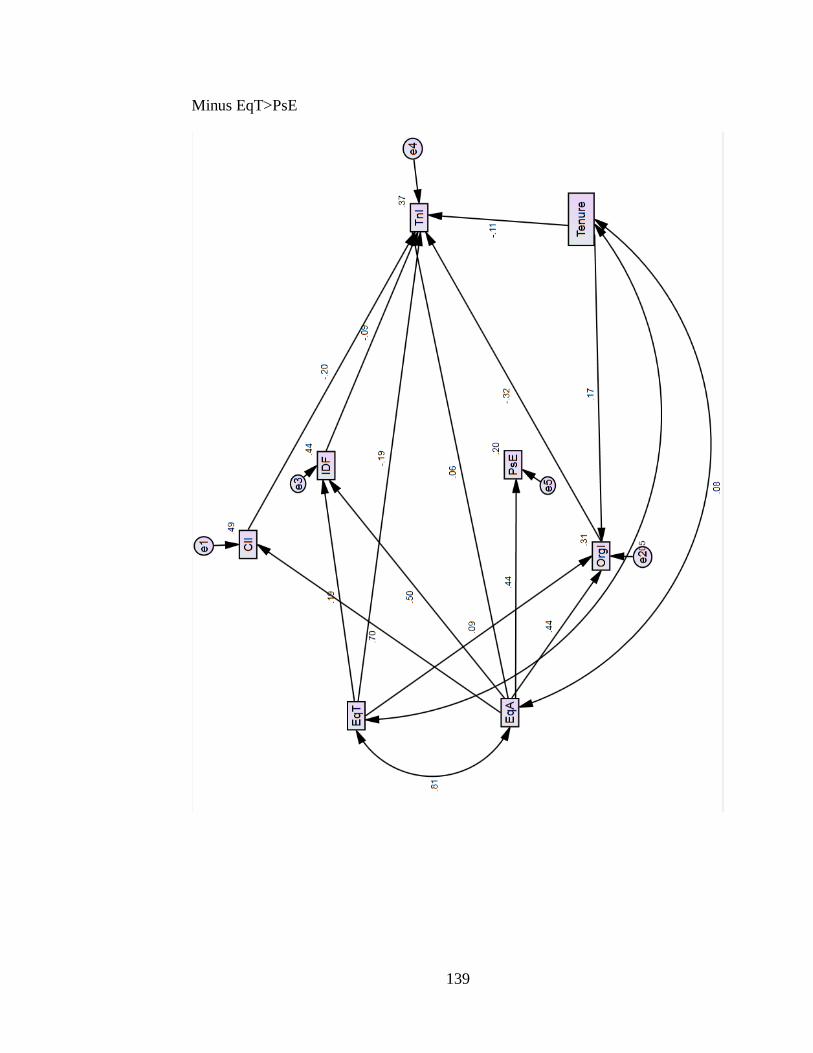
139
Minus EqT>PsE
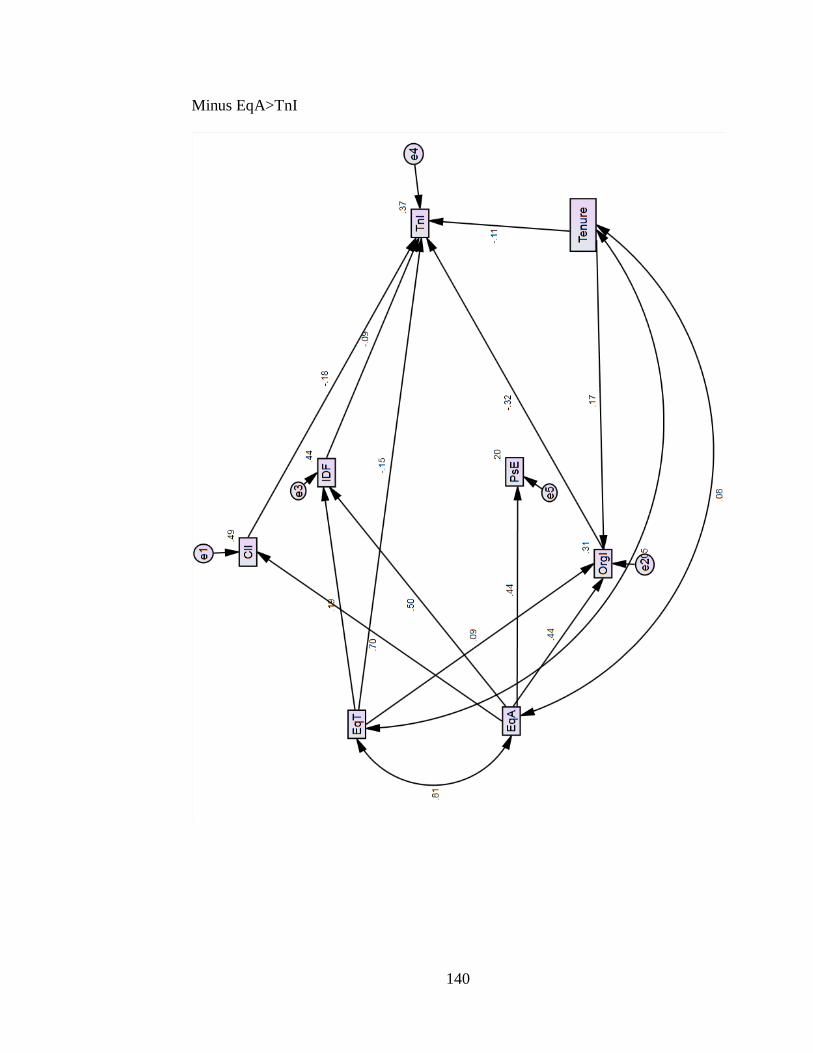
140
Minus EqA>TnI
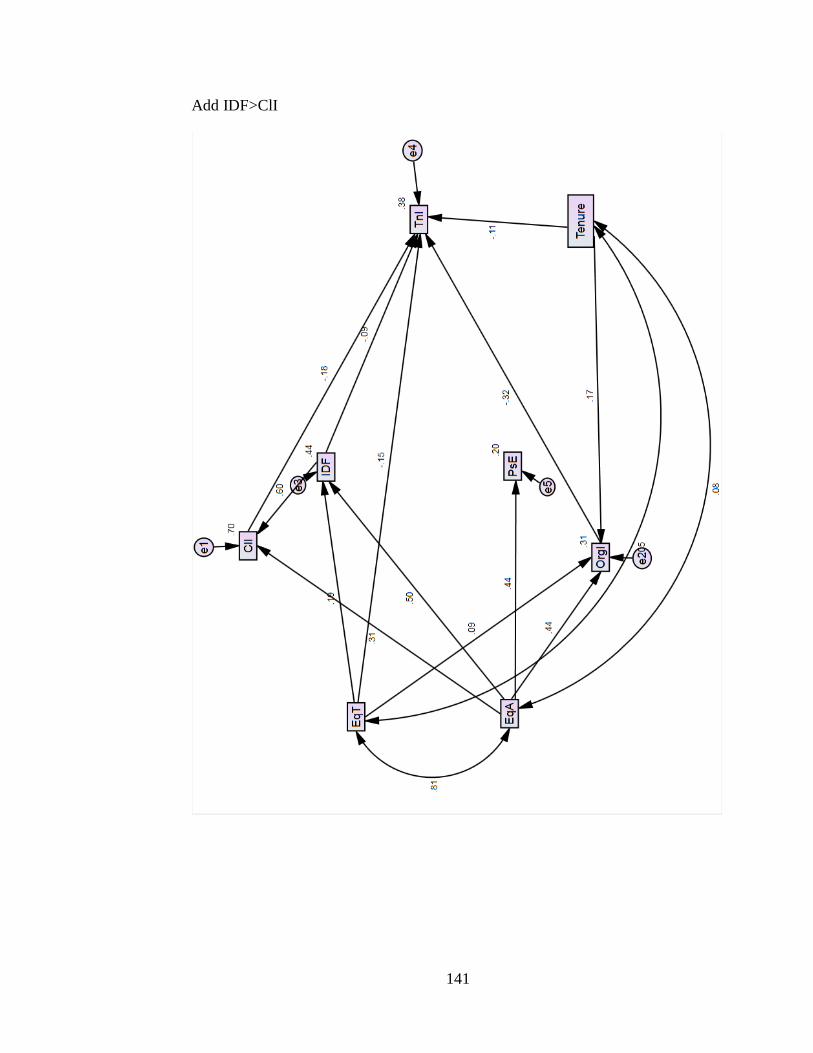
141
Add IDF>ClI
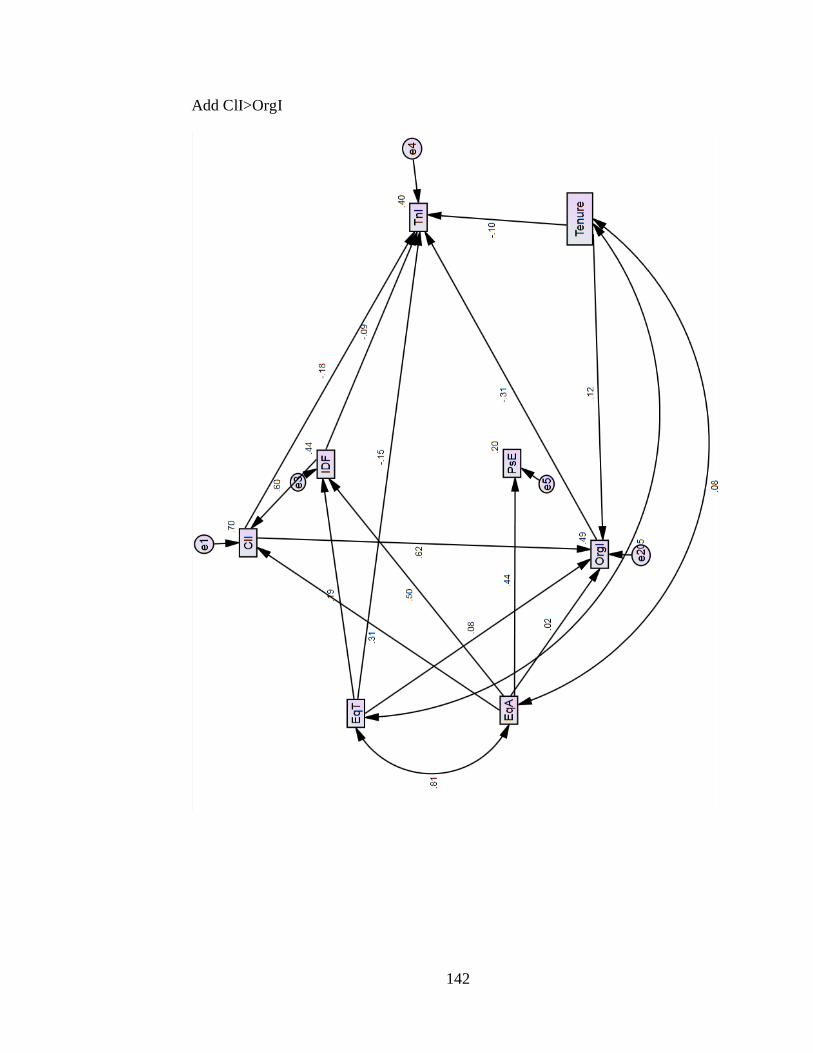
142
Add ClI>OrgI
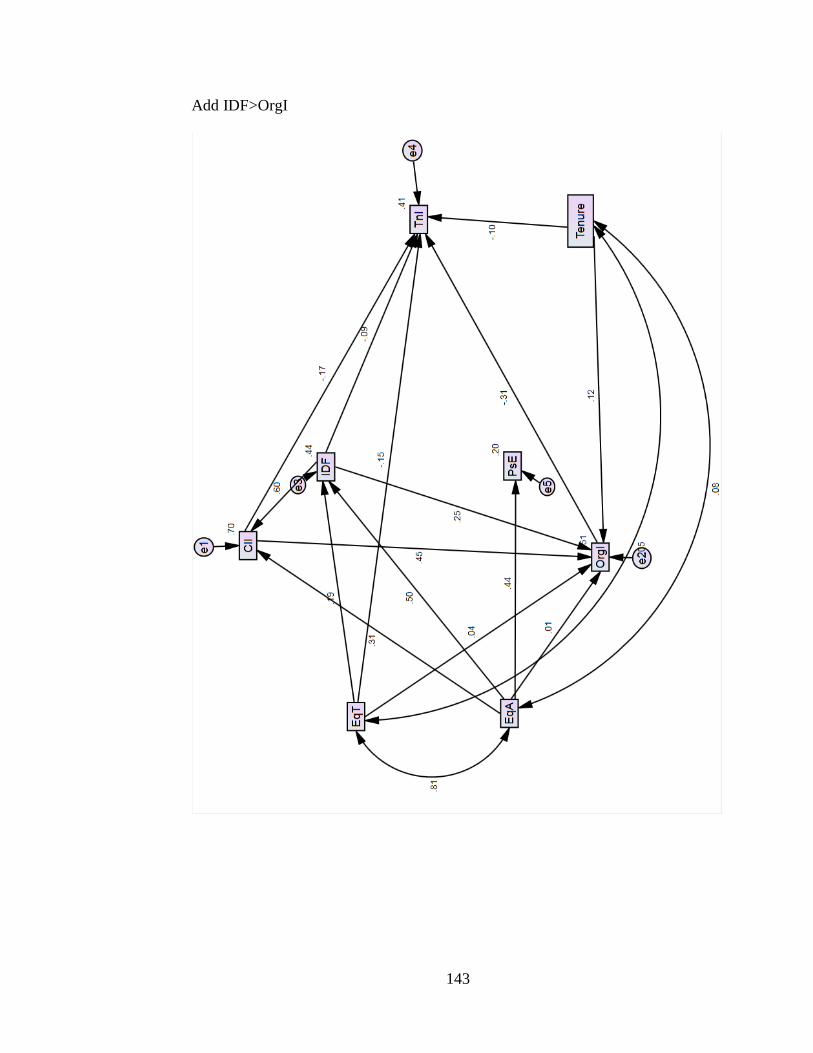
143
Add IDF>OrgI

144
Minus EqA>OrgI
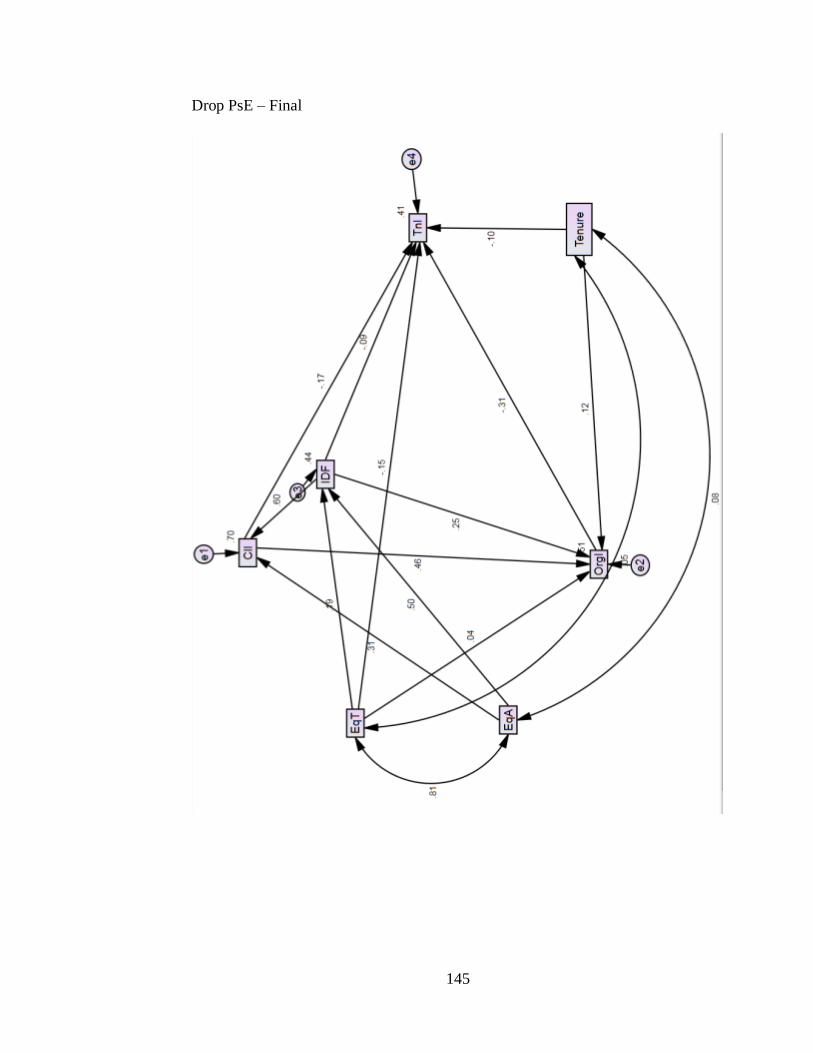
145
Drop PsE – Final
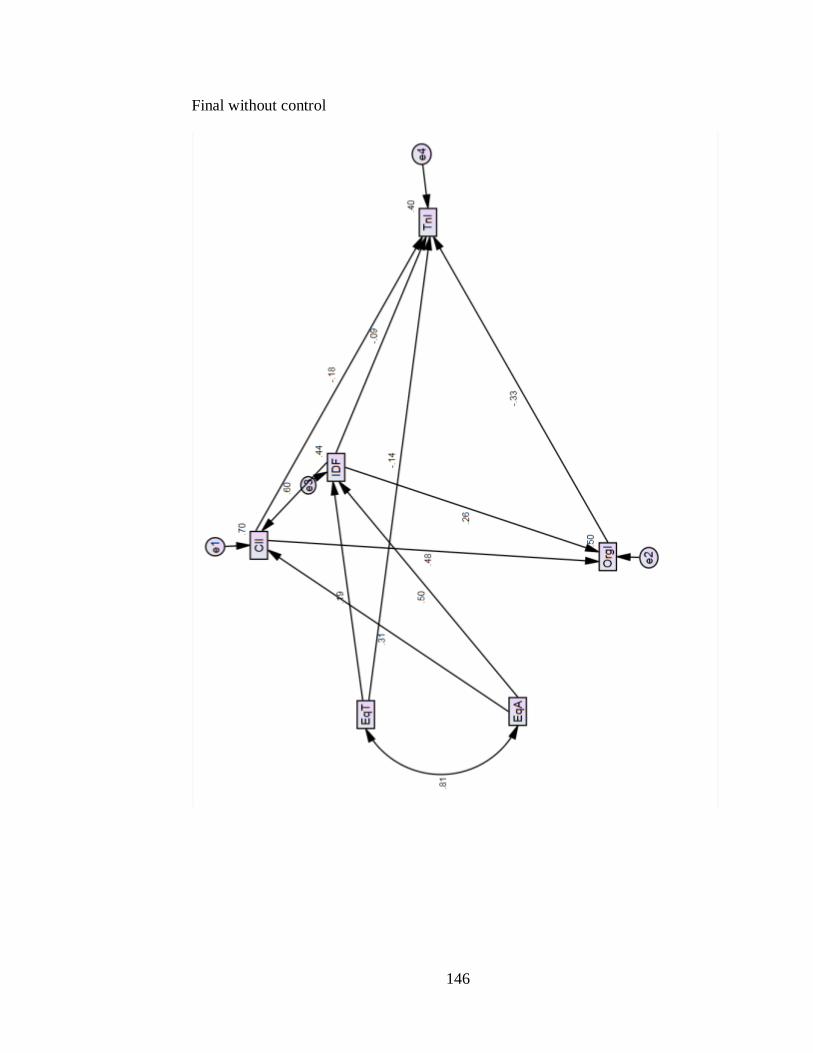
146
Final without control

147
Baby Boomer Final
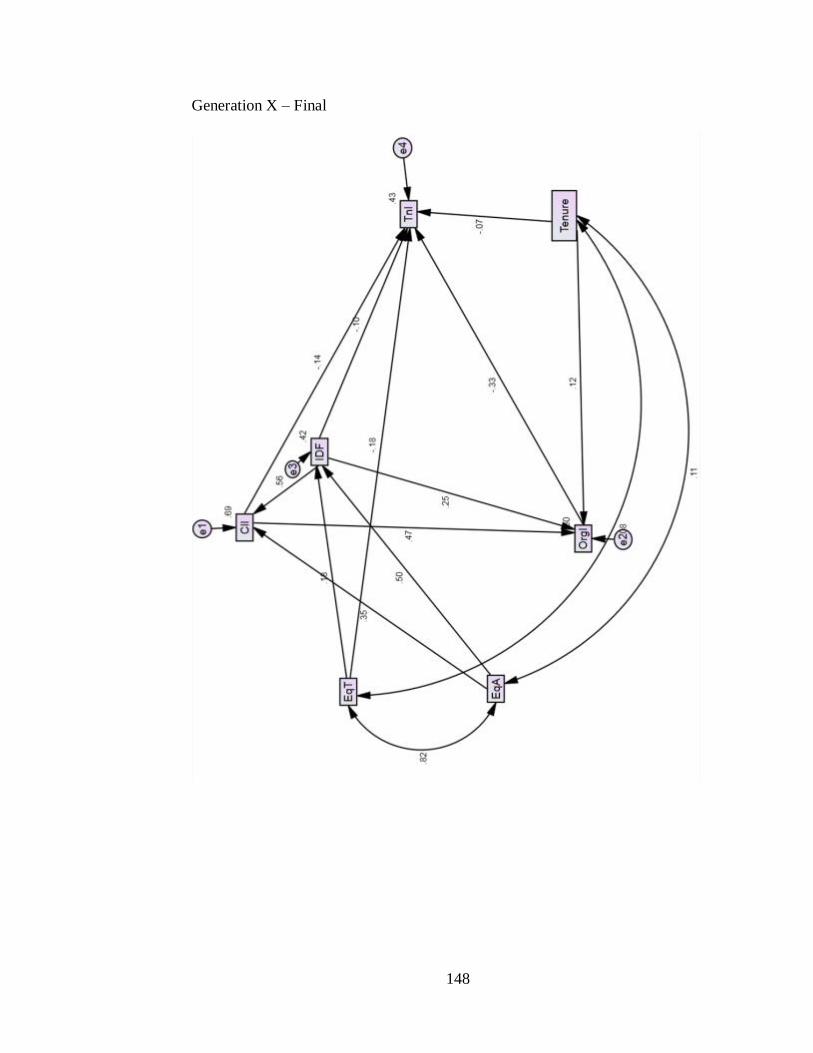
148
Generation X – Final
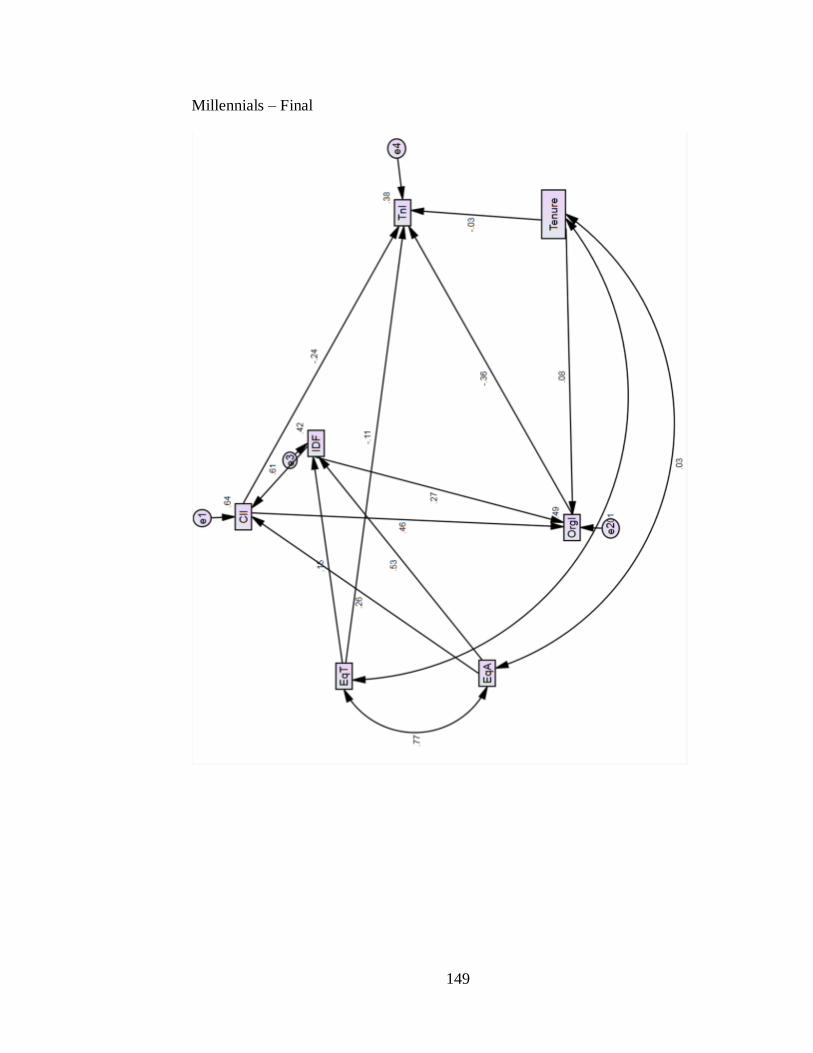
149
Millennials – Final