examining the relationship between job satisfaction and
TRANSCRIPT
Examining the relationship between job satisfaction and
customer satisfaction in a South African firm
Name: David Stanford
Student No: 27526692
A research project submitted to the Gordon Institute of Business Science,
University of Pretoria, in partial fulfilment of the requirements for the degree of
Master of Business Administration.
13th November 2008
©© UUnniivveerrssiittyy ooff PPrreettoorriiaa
ABSTRACT
Employee and customer satisfaction have been widely studied and are
important for business outcomes. Their relationship has primarily been
researched at the organisational and departmental levels within the consumer
type industries where frontline employee interaction with the customer is
important. Research into the relationship at the job characteristic level and
within a business-to-business context is limited and therefore the purpose of the
research is to examine these relationships in a South African firm.
Two data collection instruments, based on the literature review, were used to
obtain the primary data for this research. A self administered job satisfaction
survey was preformed as well as a telephonic customer satisfaction survey was
undertaken. 67 employees and 66 customers responded to the survey.
Descriptive and comparative statistics with a rank order correlation was used to
examining and analyse the data.
Although a weak relationship was observed between the percentages of
satisfied employees and satisfied customers in the survey, a strong and
significant relationship exists between the rank order of the different functions
within the firm, when comparing the employees job and customers satisfaction
results. The results suggest that the job satisfaction levels of the employees in
a business-to-business environment influence to some degree the level of
satisfaction experienced by the customer.
Page ii
DECLARATION
I declare that this research project is my own work. It is submitted in partial
fulfilment of the requirements for the degree of Master of Business
Administration at the Gordon Institute of Business Science, University of
Pretoria. It has not been submitted before for any degree or examination in any
other university. I further declare that I have obtained the necessary
authorisation and consent to carry out this research.
__________________ 13th November 2008
Signature Date
Page iii

ACKNOWLEDGMENT
• Jackey-Ann Stanford: For your enduring support through this process.
• Joanne Habig: Statistician and a supporting sister.
• Dave Beaty: Research supervisor
• Karien Loubser: Collection of the customer satisfaction data
• Ayesha Bevan-Dye: Language editing
Page iv
CONTENTS
ABSTRACT ........................................................................................................ii DECLARATION .................................................................................................iii ACKNOWLEDGMENT.......................................................................................iv CONTENTS ....................................................................................................... v LIST OF TABLES ............................................................................................ viii LIST OF FIGURES ............................................................................................ix LIST OF ABBREVIATIONS............................................................................... x CHAPTER 1....................................................................................................... 1 INTRODUCTION TO THE RESEARCH PROBLEM.......................................... 1 1.1. DEFINITION OF THE PROBLEM............................................................ 1 1.2. THE MOTIVATION FOR THE RESEARCH ............................................ 2 1.3. THE PURPOSE OF THE RESEARCH.................................................... 3 1.4. THE SOUTH AFRICAN CONTEXT......................................................... 3 1.5. THE FOCUS ON JOB SATISFACTION .................................................. 4 1.6. THE RESEARCH PROBLEM.................................................................. 7 CHAPTER 2....................................................................................................... 8 LITERATURE REVIEW ..................................................................................... 8 2.1 INTRODUCTION..................................................................................... 8 2.2 JOB SATISFACTION .............................................................................. 8 2.2.1 The causes of job satisfaction.............................................................. 8 2.2.1.1 The cultural and demographic influences......................................... 9 2.2.1.2 The work situation ............................................................................ 9 2.2.1.3 Dispositional influences.................................................................. 11 2.2.2 The positive and negative results of job satisfaction .......................... 12 2.2.2.1 Job performance ............................................................................ 12 2.2.2.2 Organisational citizenship behaviour (OCB)................................... 13 2.2.2.3 Life Satisfaction .............................................................................. 13 2.2.2.4 Withdrawal behaviours ................................................................... 13 2.2.3 The measurement of job satisfaction ................................................. 14 2.3 CUSTOMER SATISFACTION............................................................... 15 2.4 THE RELATIONSHIP BETWEEN (JS) AND (CS)................................. 17 2.4.1 Early research.................................................................................... 17 2.4.2 Recent research................................................................................. 21 2. 5 CONCLUSION ...................................................................................... 25 CHAPTER 3..................................................................................................... 27 RESEARCH QUESTION ................................................................................. 27 3.1 RESEARCH QUESTION....................................................................... 27
Page v
CHAPTER 4..................................................................................................... 28 RESEARCH METHODOLOGY........................................................................ 28 4.1 INTRODUCTION................................................................................... 28 4.2 RESEARCH DESIGN............................................................................ 28 4.3 POPULATION AND SAMPLING ........................................................... 29 4.3.1 Population definition........................................................................... 29 4.3.2 Sampling............................................................................................ 29 4.3.3 Response rate ................................................................................... 31 4.3.4 Ethical issues..................................................................................... 31 4.3.5 Research limitations........................................................................... 32 4.4 DATA COLLECTION AND INSTRUMENT DESIGN ............................. 33 4.4.1 The job satisfaction survey (JSS)....................................................... 33 4.4.2 The customer satisfaction survey....................................................... 34 4.5 DATA ANALYSIS .................................................................................. 35 4.6 CONCLUSION ...................................................................................... 36 CHAPTER 5..................................................................................................... 37 RESULTS ........................................................................................................ 37 5.1 INTRODUCTION................................................................................... 37 5.2 THE OVERALL JOB SATISFACTION RESULTS ................................. 37 5.3 THE OVERALL CUSTOMER SATISFACTION RESULTS.................... 41 5.4 THE RELATIONSHIP BETWEEN (CS) AND (JS) ................................. 45 5.4.1 Research question ............................................................................. 45 5.4.2 Proportions ........................................................................................ 46 5.4.3 Rank order ......................................................................................... 48 5.5 THE NINE SUB GROUPS OF JOB SATISFACTION............................ 52 5.5.1 Pay..................................................................................................... 53 5.5.2 Promotion .......................................................................................... 54 5.5.3 Supervision ........................................................................................ 55 5.5.4 Benefits.............................................................................................. 56 5.5.5 Contingent rewards............................................................................ 57 5.5.6 Operating procedure .......................................................................... 58 5.5.7 Co-workers ........................................................................................ 59 5.5.8 Nature of the work.............................................................................. 60 5.5.9 Communication .................................................................................. 61 5.6 CONCLUSION ...................................................................................... 62 CHAPTER 6..................................................................................................... 64 DISCUSSION OF RESULTS ........................................................................... 64 6.1 INTRODUCTION................................................................................... 64 6.2 REVIEW OF THE RESEARCH PROBLEM........................................... 64 6.3 RESEARCH QUESTION....................................................................... 65 6.3.1 Proportions ........................................................................................ 66 6.3.1.1 Overall satisfaction ......................................................................... 66 6.3.1.2 Overall satisfaction at the functional level. ..................................... 67
Page vi
6.3.2 Rank order ......................................................................................... 71 6.3.3 The nine job sub groups .................................................................... 74 6.4 CONCLUSION ...................................................................................... 75 CHAPTER 7..................................................................................................... 76 CONCLUSIONS............................................................................................... 76 7.1 INTRODUCTION................................................................................... 76 7.2 MAIN FINDINGS ................................................................................... 76 7.2.1 Finding 1 ............................................................................................ 76 7.2.2 Finding 2 ............................................................................................ 77 7.2.3 Finding 3 ............................................................................................ 78 7.2.4 Finding 4 ............................................................................................ 79 7.3 RECOMMENDATIONS TO MANAGERS.............................................. 80 7.4 FUTURE RESEARCH........................................................................... 81 7.5 CONCLUSION ...................................................................................... 82 REFERENCE LIST .......................................................................................... 83 APPENDICES .................................................................................................. 88 Appendix A – The job satisfaction survey ........................................................ 88 Appendix B – The customer satisfaction survey............................................... 91 Appendix C – T-test for independence results ................................................. 93 Appendix D – Job satisfaction – Box Plots ....................................................... 94 Appendix E – Job Satisfaction – sub group distributions.................................. 97
Page vii

LIST OF TABLES
Table 1: Norms for the job satisfaction survey (JSS) (Spector. 1997).............. 15
Table 2: Job satisfaction: The overall satisfaction results ................................ 38
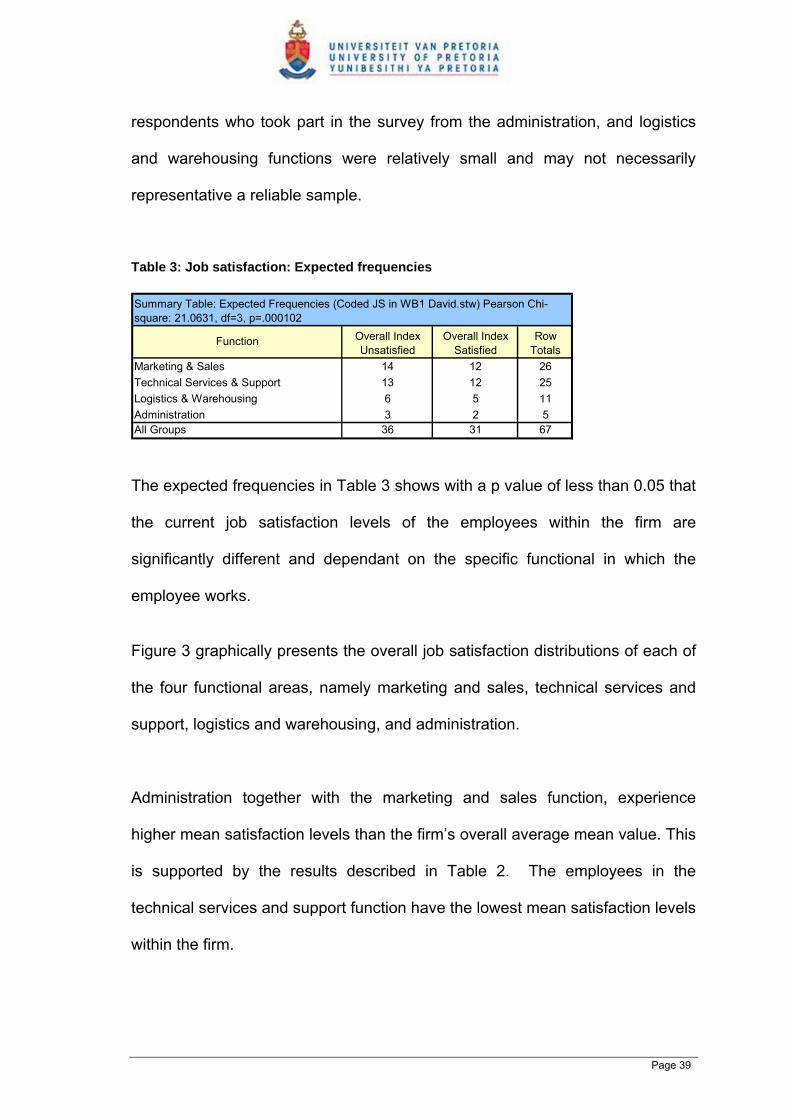
Table 3: Job satisfaction: Expected frequencies .............................................. 39
Table 4: Job satisfaction: The overall mean results ......................................... 40
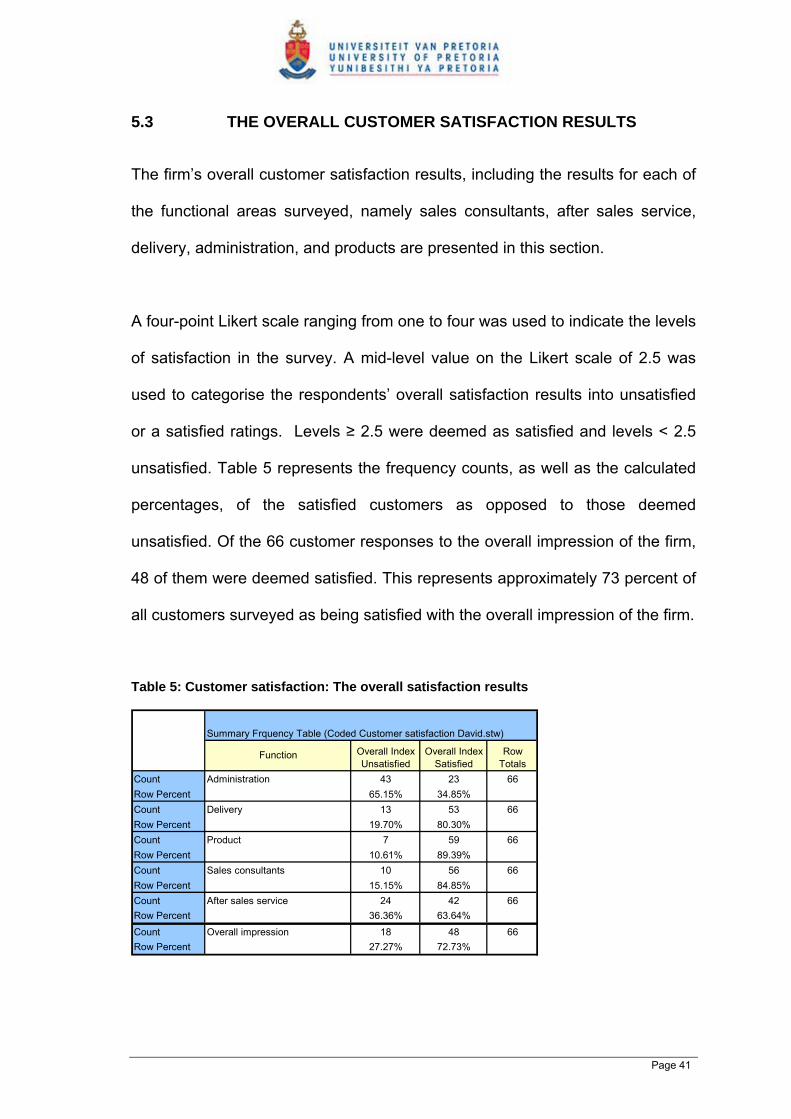
Table 5: Customer satisfaction: The overall satisfaction results....................... 41
Table 6: Customer satisfaction: The overall mean results................................ 43
Table 7: Customer satisfaction: T-test for independence ................................. 44
Table 8: Comparison of functions..................................................................... 50
Table 9: The relationship: rank order. .............................................................. 51
Table 10: The relationship: Spearman-rank correlation ................................... 52
Table 11: Job satisfaction: mean results versus the (JSS) norms.................... 53
Table 12: Job satisfaction: pay......................................................................... 54
Table 13: Pay: expected frequencies ............................................................... 54
Table 14: Job satisfaction: promotion............................................................... 55
Table 15: Promotion: expected frequencies ..................................................... 55
Table 16: Job satisfaction: supervision ............................................................ 56
Table 17: Supervision: expected frequencies................................................... 56
Table 18: Job satisfaction: benefits .................................................................. 57
Table 19: Benefits: expected frequencies ........................................................ 57
Table 20: Job satisfaction: contingent rewards ................................................ 58
Table 21: Contingent rewards: expected frequencies ...................................... 58
Table 22: Job satisfaction: operating procedures............................................. 59
Table 23: Operating procedures: expected frequencies................................... 59
Table 24: Job satisfaction: co-workers ............................................................. 60
Table 25: Co-workers: expected frequencies ................................................... 60
Table 26: Job satisfaction: nature of the work .................................................. 61
Table 27: Nature of the work: expected frequencies ........................................ 61
Table 28: Job satisfaction: communication....................................................... 62
Table 29: Communication: expected frequencies ............................................ 62
Table 30: The nine sub group’s analysis of variance. ...................................... 63
Page viii
LIST OF FIGURES
Figure 1: The service-profit chain....................................................................... 5
Figure 2: The EPSI rating framework. .............................................................. 24
Figure 3: Job satisfaction: Box plot of the overall satisfaction index................. 40
Figure 4: Customer satisfaction: Box plot of the overall satisfaction index....... 42
Figure 5: The relationship: The customer and job satisfaction overall index .... 46
Figure 6: Customer satisfaction: Rank order of the mean satisfaction levels ... 48
Figure 7: Job satisfaction: rank order of the mean satisfaction levels .............. 49
Figure 8: The relationship: rank order .............................................................. 51
Figure 9: The relationship: overall satisfaction ................................................. 67
Figure 10: The relationship: overall satisfaction at the functional level............. 68
Figure 11: The relationship: (CS) overall impression versus (JS) sales
consultants ....................................................................................................... 69
Figure 12: The relationship: sales consultants versus after sales service........ 71
Figure 13: The relationship: rank order ............................................................ 72
Page ix

LIST OF ABBREVIATIONS
JSS: The job satisfaction survey
OCB: Organisational citizenship behaviour
EPSI: European satisfaction index
JS: Job satisfaction
CS: Customer satisfaction
Page x
CHAPTER 1
INTRODUCTION TO THE RESEARCH PROBLEM
1.1. DEFINITION OF THE PROBLEM
In today’s business climate, why is job satisfaction so important? According to
Robbins and Judge (2007), a recent survey showed that business firms that
scored in the top 25 percent of employee job satisfaction surveys were, on
average, 4.6 percent above their sales targets for the year. This suggests that
there is a positive relationship between employee job satisfaction and the
bottom-line profits of a firm.
Kotler and Keller (2007) describe highly satisfied customers as behaving
positively towards firms in the following ways. They stay loyal by buying more
and are less sensitive to price. They speak positively about the firm. In
comparison to newer customers, they are also less expensive and easier to
serve. Robbins and Judge (2007) indicate that satisfied employees increase
customer satisfaction. This is especially true in the case of frontline employees
working in the consumer sectors who have regular contact with customers.
However, according to Homberg and Stock (2004), even though job satisfaction
and customer satisfaction are important business outcomes and have been
widely studied, the relationship between the two has largely been researched at
the organisational and service level of the firm, with limited research between
the two at the job level and within a business-to-business context.
Page 1
1.2. THE MOTIVATION FOR THE RESEARCH
The motivation of this research is to move beyond the relationship of employee
satisfaction at the organisational level. This study examines the relationship
between employee job satisfaction and customer satisfaction at the job level
within a South African firm operating in a business-to-business context. The
purpose of the study is to improve the level of understanding of this relationship.
Early research by Schneider (1991), and Tornow and Wiley (1991) support the
existence of a positive relationship between organisational employee
satisfaction and customer satisfaction in both a consumer and business-to-
business context. However, both studies concentrated specifically on the
relationship of the two constructs at the organisational or departmental level of
a business, with limited examination of the relationships at the job level.
Homberg and Stock (2004) add that positive interaction between the supplier
and customer could be highly relevant in a business-to-business setting. They
propose the argument that the nature of the transaction within a business-to-
business context is usually highly technical in nature and the decision process
preceding the transaction is highly rational. Their argument suggests that within
a business-to-business context, limited financial benefits may be gained from
investing in employee satisfaction. Not with standing this argument, their
research did find a positive link between customer satisfaction levels and the
job satisfaction levels of the sales person.
Page 2
1.3. THE PURPOSE OF THE RESEARCH
This research study is purposeful in two ways. The research contributes to the
academic understanding of those relationships that drive customer satisfaction
from an employee job level and provides another source of reference examining
the relationship between employee job satisfaction and customer satisfaction
levels. From a managerial viewpoint, it presents a reference source for those
interested in investing time and effort into understanding and increasing
employee job-satisfaction levels within the firm, with the aim of improving the
overall customer relationship and satisfaction levels in their environment.
1.4. THE SOUTH AFRICAN CONTEXT
On a national level, a clearer understanding of the relationship between
employee attitudes at the job level, and the effects they have on the outcomes
and the overall performance of a firm will assist the South African human
resource professionals in their quest to better equip and develop the
behavioural side of people in a dynamic and highly competitive environment.
The current skills shortage experienced in the majority of South African firms is
seen as one of the “binding constraints” (ASGISA, 2006 p. 16) to the country’s
chances of being globally competitive.
If a causal relationship between employee job satisfaction and customer
satisfaction can be established, then the strategic investment into improving the
job satisfaction levels within firms, with the aim of improving financial
performances and business outcomes, could result in an overall reduction in the
turnover rate of employees. In addition, this could provide a dedicated approach
Page 3
to enhancing and maintaining the high skill levels of employees. This would
improve South African firms’ chances of being competitive within the global
arena, where knowledge people are essential and are seen as a competitive
advantage (Drucker, 2002).
1.5. THE FOCUS ON JOB SATISFACTION
Job satisfaction, according to Robbins and Judge (2007), is a primary
dependant variable and is one which is affected by a number of factors in the
field of organisational behaviour. Owing to its positive relationship with
organisational measures such as employee productivity, job satisfaction has
gained in importance as a dependant variable. Job satisfaction is an important
factor in the field of organisational behaviour and if its relationship with other
facets within the firm such as customer satisfaction can be explained and
predicted, it could lead to controlled benefits for the firm, including increased
profits and improved performance. This is illustrated in Figure 1, which outlines
the service-profit chain as proposed by Heskett, Jones, Loveman, Sasser and
Schlesinger (1994).
Heskett et al. (1994) propose a relationship between profitability, customer
loyalty, and employee satisfaction, loyalty, and productivity. The service-profit
chain was developed by analysing successful service firms, which centred
frontline employee and customer needs as a main management focus. The
rational of the service-profit chain is based on making employees and
customers paramount to organisational performance.
Page 4

Figure 1: The service-profit chain (Heskett et al., 1994)
Heskett et al. (1994) support the need for concentrating on both facets
simultaneously and developing techniques that measure the effects of
employee satisfaction, loyalty, retention and productivity within the
organisational operating strategy, which will result in an increased level of
customer satisfaction and loyalty. This, in turn, will influence the level of
profitability and growth experienced by the firm over time.
Linking employees’ attitudes to business outcomes is one of the newest areas
of research (Saari and Judge, 2004). A number of current studies linking the
two constructs with customer satisfaction (Dormann and Kaiser, 2002; Homburg
and Stock, 2004) and with market share (Harter, Schmidt and Hayes, 2002),
have helped to demonstrate what impact employee attitudes have on business
Page 5
outcomes. In the process, these studies have aided in identifying the key
drivers that will justify increased investments into the understanding of these
relationships in the aim of improving the working environment of employees.
According to Saari and Judge (2004), from the perspective of research and
practice, job satisfaction is seen as the most focal employee attitude. Job
satisfaction is an attitude that reflects how an employee feels about the major
areas of his or her life. Saari and Judge (2004) highlight that feelings and
thinking are important factors in job satisfaction, and that they are inextricably
linked to one another. Therefore, internal job factors, such as promotional
prospects and rewards, as well as external factors, such as an employee’s
personality and personal problems, can affect the levels of job satisfaction that
the employee experiences.
According to Spector (1997), as firms aiming at being more competitive require
each employee to contribute more, so job satisfaction will become increasingly
more important to employees and firms alike. This is not only because of the
impact dissatisfied employees can have on business outcomes, but also
because, as describe by Spector (1997), firms have a moral responsibility to
treat their employees well.
Page 6
1.6. THE RESEARCH PROBLEM
When measured at the job level, does the level of employee job satisfaction
bear any relation to the satisfaction levels experienced by the customer in a
South African firm?
The research was conducted in a business-to-business context and the
problem was examined at the following levels:
• Employee job satisfaction, in relation to customer satisfaction, is examined
to establish whether any relationship exists between the two constructs.
• The examination of the relationship also takes into account the functional
levels within the firm, for example administration, marketing and sales,
logistics and warehousing, technical service and support, and examines
whether any relationship exists between the customers’ satisfaction levels
and employee satisfaction levels within the same business functions.
• Further examination of the job sub-scales is performed (salary, promotion,
supervision, fringe benefits, contingent rewards, operating procedures, co-
workers, work and communication) to obtain a better understanding of the
possible causes of the relationship.
Page 7

CHAPTER 2
LITERATURE REVIEW
2.1 INTRODUCTION
This chapter reviews the literature regarding job and customer satisfaction.
Separate literature concerning the two constructs is handled up front in this
chapter and concludes with a review of the early and current literature relating
the two constructs to one another.
2.2 JOB SATISFACTION
Robbins and Judge (2007) define job satisfaction as a positive feeling about
one’s job resulting from an evaluation of its characteristics. Employees that
have high levels of job satisfaction hold positive feeling about their job, while
dissatisfied employees hold negative feelings about their job. The causes of
employees’ attitudes, according to Robbins and Judge (2007), have
consequences on the workplace that can affect the outcomes of the firm in a
number of ways.
2.2.1 The causes of job satisfaction
Saari and Judge (2004) categorise the causes of job satisfaction into three main
areas: cultural and demographic influences, the work situation, and
dispositional influences, such as personality and prior experience.
Page 8
2.2.1.1 The cultural and demographic influences
Hofstede (1985) found that employee attitudes varied among four distinct cross-
cultural dimensions: (1) Individualism versus collectivism, (2) uncertainty
avoidance versus risk taking, (3) power distance, and (4) masculinity versus
femininity. It was established that certain countries show higher tendencies in
certain dimensions than others and that the culture from which the employee
originates is as good a predictor of employee satisfaction levels as the work
itself (Saari and Judge, 2004).
Age, gender and race have also been considered as facets that have an effect
on the attitudes of employees (Spector, 1997). Brush, Moch, and Pooyan
(1987) indicate that age and job satisfaction are related, but that whether a
curvilinear or linear relationship exists between the two is unclear. A study by
Clark, Oswald and Warr (1996) indicates that the age and gender composition
of a sample may or may not result in a detected pattern. This suggests that
gender might influence the age-job satisfaction relationship. According to
Spector (1997), there is an inconsistency in the results comparing race to
employee job satisfaction.
2.2.1.2 The work situation
Spector (1997) refers to five core job characteristics as the content and nature
of the job and categorises them into (1) skill variety, (2) task identify, (3) task
significance, (4) autonomy, and (5) Job feedback. The theory of job
characteristics states that those who prefer to be continually challenged and
who are interested in their work will be more motivated and satisfied in more
Page 9

complex jobs. However, there are conditions within the job environment that
can influence the performance and well being of such employees (Spector,
1997).
O’Connor, Peters, Rudolf and Pooyan (1982) found correlations between
organisational constraints, which are those conditions that affect the job
performance, and that of five job satisfaction characteristics - co-workers,
supervision, pay, promotion and the work itself. Supervision had the strongest
negative correlation (r = -.42), suggesting that supervisory levels are the largest
organisational constraint, as viewed by the employees or subordinates.
Jackson and Schuler (1985) found correlations between job satisfaction and job
ambiguity and conflict alike. Spector (1997) refers to role ambiguity as the
degree of certainty the employee has about his or her own functions and
responsibilities, and refers to role conflict as the experiences employees feel
when unsuitable demands are made on their functions and responsibilities.
Jackson and Schuler (1985) also found that employees’ levels of satisfaction
with their supervisors had the strongest negative correlation (r = -.36) to both
job ambiguity and conflict.
Work-family conflict also has an effect on job satisfaction. Research by Rice,
Frone and McFarlin (1992) found that the higher the levels of conflict
experienced in the home, the lower the job satisfaction levels of the employee.
In addition, Parasuraman, Greenhaus and Granrose (1992) found that there
Page 10
was a stronger negative correlation between work-family conflict and men (r = -
.40) than women (r = -.02).
When it comes to pay, Bakke (2005) explains that compensation is a reward for
work accomplished and is not a forecaster of happiness. He indicates that pay
is one of the most important rewards an employee receives; however, it does
not have a significant effect on the level of job satisfaction. Saari and Judge
(2004) support Bakke’s (2005) statement by indicating that when employees
were asked to evaluate the jobs according to different characteristics, such as
pay, promotion, supervision, co-workers and the like, the nature of the work was
generally rated as the most important job characteristic, with good wages being
ranked fifth. This suggests that the nature of the work should be seen as a focal
area when trying to improve job satisfactions levels.
Spector (1997) also refers to environmental conditions, such as job stress,
workload, autonomy and work schedules, as having their own influence on the
levels of job satisfaction that employees experience in the work place.
2.2.1.3 Dispositional influences
According to Saari and Judge (2004), early research into the relationship
between a person’s disposition or personality and job satisfaction indicates that
the levels of satisfaction amongst individuals remain stable over long periods of
time and that the satisfaction levels of employees can be partly explained by the
differences in employees’ personality. Judge and Bono (2001) found that one of
the personality traits - core self-evaluation - is related to the employee’s level of
Page 11

job satisfaction, based on the perception of the job itself. Judge, Heller, and
Mount (2002) suggest that other personality traits, such as extraversion and
conscientiousness, can also affect the levels of employee job satisfaction.
2.2.2 The positive and negative results of job satisfaction
The levels of job satisfaction in the work place can impact the firm’s
performance in a number of ways. It can influence the individual, either
positively or negative, in the following ways.
2.2.2.1 Job performance
Employees are more likely to be productive when satisfied, and as you move
away from the individual level to the organisational level so the satisfaction–
performance relationship strengthens (Robbins and Judge, 2007). However,
according Saari and Judge (2004), early research into the relationship between
job satisfaction and performance levels showed an inconsistent relationship
between the two, resulting in practitioners concluding that the relationship
between job satisfaction and performance was unimportant. The findings of
Judge, Thoresen, Bono and Patton (2001) indicate a stronger positive
correlation (r = .30) between job satisfaction and performance when compared
to a review of earlier studies (r = .17) in this regard. The relationship was also
found to be stronger in more complex jobs, like professional services (Saari and
Judge, 2004).
Page 12
2.2.2.2 Organisational citizenship behaviour (OCB)
Employee organisational citizenship behaviour (OCB), as defined by Spector
(1997), is a behaviour exhibited by the employee that is intended to help co-
workers or the firm as a whole. This relationship tends to be stronger when
employees are satisfied (Robbins and Judge, 2007). Spector (1997) refers to
counterproductive behaviour as being the opposite of organisational citizenship
behaviour (OCB), were the employee intentionally hurts the firm through acts of
aggression, sabotage or theft. He highlights that such behaviour is not a typical
reaction to job dissatisfaction but could be of concern in it occurs frequently.
2.2.2.3 Life Satisfaction
Research performed by Judge and Watanabe (1994) suggests that job
satisfaction affects life satisfaction in a spill over effect. This implies that the
reverse is also true, and that life satisfaction influences the employees’ job
satisfaction levels. Saari and Judge (2004) indicate that firms only have so
much power and control over the job satisfaction levels of their employees, as
the levels of satisfaction are, to a certain degree, the result of a spill over effect
from an employee’s life satisfaction level.
2.2.2.4 Withdrawal behaviours
According to Robbins and Judge (2007), absenteeism and employee turnover
are negatively related to employee satisfaction levels and are in the weak
correlation range (r = -.25). Saari and Judge (2004) concur and indicate that job
satisfaction levels have a negative relationship with withdrawal behaviours such
as lateness, unionisation, grievances, drug abuse and a decision to retire. They
Page 13

comment that when such withdrawal behaviours are grouped together, job
satisfaction is a better predictor of the behavioural grouping than of the
individual behaviour alone.
2.2.3 The measurement of job satisfaction
Spector (1985) uses the Job Satisfaction Survey (JSS) and indicates that
satisfaction is assumed to represent a group of feelings about a job, based on a
number of job characteristics such as salary, promotion, supervision, fringe
benefits, contingent rewards, operating procedures, co-workers, work and
communication. Spector (1985) comments that although it is not totally
accepted that the overall attitude about a job is the summation or combination
of specific attitudes, adequate empirical evidence exists to consider the overall
satisfaction measure as such.
Spector’s (1997) remarks on the reliability, validity and norms of the JSS
indicate that except for the co-worker subscale, which has a reliability
coefficient alpha of 0.60, the other eight subscales of the survey are higher than
the widely-accepted internal consistency of 0.7, with coefficient alphas ranging
up to 0.91 for some subscales. He adds that the test retest reliability data,
which was obtained from other studies, reflect that the satisfaction levels are
relatively stable over time. Van Saane, Sluiter, Verbeek, and Frings-Dresen
(2003), in their review of job satisfaction instruments, conclude that the JSS
instrument is one of a few instruments that meets several criteria for a high level
reliability and construct validity.
Page 14

The norms for the JSS, based on the scores of a number of employees and
samples, are indicated in Table 1.
Table 1: Norms for the job satisfaction survey (JSS) (Spector. 1997)
2.3 CUSTOMER SATISFACTION
Kotler and Keller (2007) encourage firms to measure customer satisfaction
regularly. They describe highly satisfied customers as behaving positively
towards firms in the following ways. They are loyal by buying more and are less
sensitive to price than first time buyers. They speak positively about the firm
and its products and are overall less expensive and easier to serve than newer
customers. Kotler and Keller (2007) are also careful to draw attention to
maintaining a key balance between high levels of customer satisfaction and
adequate levels of satisfaction amongst other stakeholders, such as suppliers,
dealers and employees.
Page 15
Frei (2008), on the topic of what firms need to get right in the service industry,
states that firms that fail to link their employees’ management approaches to
the service needs of customers will ultimately find it difficult to honour their
service promises and thus will be unable to compete. He explains that if a firm
relies of heroism and self-sacrifice from their employees to deliver satisfaction
levels of service to the customer, then the firm has a poorly designed process.
He encourages top management to pay careful attention to all facets, including
job design and performance management, which make up employee
management systems. This suggests that in service industries there is a direct
link between job design and employee satisfaction levels on the one hand, and
customer satisfaction and loyalty on the other hand.
Reichheld (2006) refers to a dissatisfied customer as a detractor and explains
that a detractor can cost the firm a great deal more than the mere direct loss of
a sale. Unhappy customers can drive up service costs by reporting numerous
problems. Unhappy customers can damage the firm’s reputation, thereby
reducing its ability to attract the best people in the industry. In addition, unhappy
customers may demoralise frontline employees with the amount of demands
and complaints that they are inclined to make.
Kotler and Keller (2007), Frei (2008), and Reichheld (2006) refer to the
employees’ role in obtaining customer satisfaction, the impact they have on
customer loyalty and on bottom-line profits. This suggests a direct link between
the levels of employee and customer satisfaction.
Page 16
2.4 THE RELATIONSHIP BETWEEN (JS) AND (CS)
This section reviews the literature relating job satisfaction and customer
satisfaction to one another. The literature is addressed in the following two
ways.
• Early research from 1980 -1999
• Current research from 2000 to date.
2.4.1 Early research
For the most part, research examining the relationship between employees’ and
customers’ attitudes, perceptions or satisfaction has been performed in the
consumer industries or within the service-orientated aspects of the firm. For
example, Schneider, Parkington and Buxton (1980) conducted a study in the
banking sector, Tornow and Wiley (1991) in the software industry, Bernhardt et
al. (2000) in the fast food industry and Schlesinger and Zornitsky (1991) in the
insurance sector. These studies also concentrate specifically on the relationship
between employee satisfaction and customer satisfaction at the organisational
or departmental level, with limited examination of the relationship at the job
level.
Schneider, Parkington and Buxton’s (1980) study in the banking sector revealed
that employees’ perceptions of service-orientated procedures and practices
were related to customers’ perceptions of overall service quality, thus
highlighting the opportunity for subsequent research into the relationship
between employees and customers. They indicate that the subsequent focus on
Page 17
the relationship between employees and customers, as a measure of
organisational success, yielded useful data for evaluating branch effectiveness.
Furthermore, a focus on this relationship highlighted areas within the firm’s
practices and procedures that, if addressed, could increase the level of the
customers’ perception of the service quality. This relatively strong relationship
between employee and customer perceptions focused attention on the role of
front line employees in industries such as retail and, in this case, the banking
sector.
In the research conducted by Schneider et al. (1980), a moderate-to-strong
positive correlation of 0.67 was found between the customers’ perceptions of
branch service and the employees’ perceptions of how customers felt about
branch service. This indicates that employees are sensitive to the customers’
needs. This has the added benefit in that it indicates that similar levels of
sensitivity can be present in comparable roles within other firms. However, this
does not suggest that employees in different functions within the same firm
have the same sensitivity.
Schneider and Bowen (1985) replicated and added to this research and found
that customers reported higher service quality amongst those employees that
described their work positively; that is, employees who had positive work
attitudes. According to Schneider and Bowen (1985), employees were less
likely to resign where customers reported higher levels of service quality, with
the reverse relationship also having merit. This provides a level of predictability
Page 18

regarding employee turnover rates and supports the positive relationship
between employee job satisfaction levels and customer satisfaction levels.
According to Schlesinger and Zornitsky (1991), the relationship between
employee satisfaction and customer satisfaction increases with employees’
years of service. They found that customer satisfaction levels dropped from 75
percent to 55 percent when workers decided to leave the firm. However,
according to the findings of Heskett et al. (1994), job satisfaction levels are
influenced primarily by the service employees’ perceptions of their ability to
meet customer needs, indicating that employees who felt they could meet
customers needs showed higher job satisfaction levels than those who thought
they could not. Heskett et al. (1994) add that this resulted in general
management trying to improve job-related skills and reduce the turnover level of
employees in frontline positions in service firms.
Schneider (1991) concludes that research to date indicates that employee and
customer satisfaction levels were positively correlated, but have been overly
simplistic with regards to the link between employee and customer attitudes and
profits. Schneider (1991) goes on to explain that by taking certain contingencies
into account, even satisfaction levels and profits can be related. He notes that
the relationship between employees’ perceptions of service quality are more
strongly and consistently related to the customers’ perception of service quality,
when compared to employees’ perceptions of the human resource practices
under which they operate. This suggests that a weaker relationship exists
between employee satisfaction at a job level and customer satisfaction levels.
Page 19
This note is also relevant to the work undertaken by Schlesinger and Zornitsky
(1991).
The findings of Tornow and Wiley (1991), and Wiley (1991) support this. A
strong relationship was found between employee satisfaction and customer
satisfaction when the service facets of the firm were measured. In contrast,
when the employee satisfaction levels were measured using human resource
facets; that is, at the job level of the firm such as pay and benefits, a weak
relationship was found between the two.
Heskett et al. (1994) developed the service-profit chain from a case analysis of
successful service firms and propose that the service-profit chain establishes
the relationships between profitability, customer loyalty and employee
satisfaction, loyalty and productivity. Heskett et al. (1994) suggest that the value
of the services provided to the customer influences the level of satisfaction
experienced by them, and that it is through loyal, productive and satisfied
employees that this value is created. Heskett et al. (1994) also refer to internal
quality as the concept that contributes the most to employee satisfaction. They
go on to describe internal quality as a measure of the employees’ feelings
towards their job, firm and co-workers. Furthermore, they indicate that the main
contributor to the level of satisfaction amongst employees is the perception of
their ability to meet customers’ needs with regards to the service level aspects
of the firm.
Page 20

Hallowell, Schlesinger and Zornitsky (1996) identified elements within a firm
that can affect customer satisfaction. They refer to eight components of internal
service quality in this respect and suggest that by measuring these
components, managers might be able to be proactive and control the outcomes
of customer satisfaction. They propose that internal service quality is important
because it relates job satisfaction to customer satisfaction and could begin to
explain why job satisfaction, while not leading directly to customer satisfaction,
is present in most firms that experience it. Hallowell et al. (1996) do not support
the direct relationship between job satisfaction and customer satisfaction, but
did iterate that service firms hardly ever succeed in delivering customer
satisfaction without having satisfied employees.
2.4.2 Recent research
Bernhardt et al (2000), in their longitudinal analysis of satisfaction and
profitability, point out that although their results indicate a positive relationship
between employee satisfaction and customer satisfaction in any given time
period, there is no relationship between employee satisfaction and profit/sales,
and customer satisfaction and profit/sales. This relationship only emerges over
longer timeframes. They suggest that any relationship between job satisfaction
and customer satisfaction is not time period dependant and, if present, should
show up in any one time period study.
Dormann and Kaiser (2002), in one of the few studies measuring job conditions
and customer satisfaction, found similar findings as the literature (for example,
Tornow and Wiley, 1991; Bernhardt et al., 2000). They found that job
Page 21
dissatisfaction reduces customer satisfaction and emphasise that human
resource activities should concentrate as much on job design as on selection
and training. They highlight that one of the major shortcomings in the research
on the relationship between job conditions and customer satisfaction is the
limited empirical analyses at the organisational or branch level and indicate that
although their findings are encouraging, they still did not know much about the
mechanisms through which job conditions may effect customer satisfaction.
Harter, Schmidt and Hayes (2002) conclude in their meta-analysis that overall
employee satisfaction levels are more strongly correlated (0.32) to business
outcomes such as customer satisfaction and loyalty. The turnover of employees
and employee safety were negatively correlated (-0.36 and -0.20 respectively)
with productively and profitability, showing positive correlations of (0.20 and
0.15) towards the business outcomes of customer satisfaction and loyalty. The
strongest correlations were found in the facets of employee turnover and
customer satisfaction and loyalty. Their research was performed at the business
unit level and measured employee satisfaction levels using a Gallup Workplace
Audit instrument. They comment that further understanding into the nature of
the satisfaction levels at a business unit level can be explored by measuring
facets which are important to the employees and which managers can influence
on a day-to-day basis.
More recently, Homburg and Stock (2004) conducted a study in a business-to-
business context that concentrated on examining the relationship between a
salesperson’s job satisfaction and customer satisfaction. Their approach was
Page 22
based on evidence by Anderson and Narus (1999) that salespeople are still the
primary point of contact for the customer, despite the increasing importance of
customer service in a business-to-business setting, and thus have the highest
influence in the purchasing decisions of the buyer.
Their findings show that salespeople’s job satisfaction has its own effect on
customer satisfaction, namely emotional contagion. Homburg and Stock (2004)
also acknowledge that customers interact with more than just the salespeople in
a business-to-business context, for example with customer service personnel
and technical experts. However, they limited their examination in this instance
to the relationship arising from the salesperson-customer interaction.
Homberg and Stock (2004) add that the positive interaction between supplier
and customer could be highly relevant in a business-to-business setting.
However, they point out that the nature of transactions within a business-to-
business setting is usually highly technical in nature and the decision process
preceding the transaction is highly rational. This suggests that the relevance
and benefits experienced between employee satisfaction and customer
satisfaction in consumer industries could be low or neglected all together in the
business-to-business context. Their argument suggests that limited financial
benefit could be gained from investing in employee job satisfaction in a
business-to-business context. Their results did find a positive link between
customer satisfaction and the sales person in a business-to-business context
Page 23
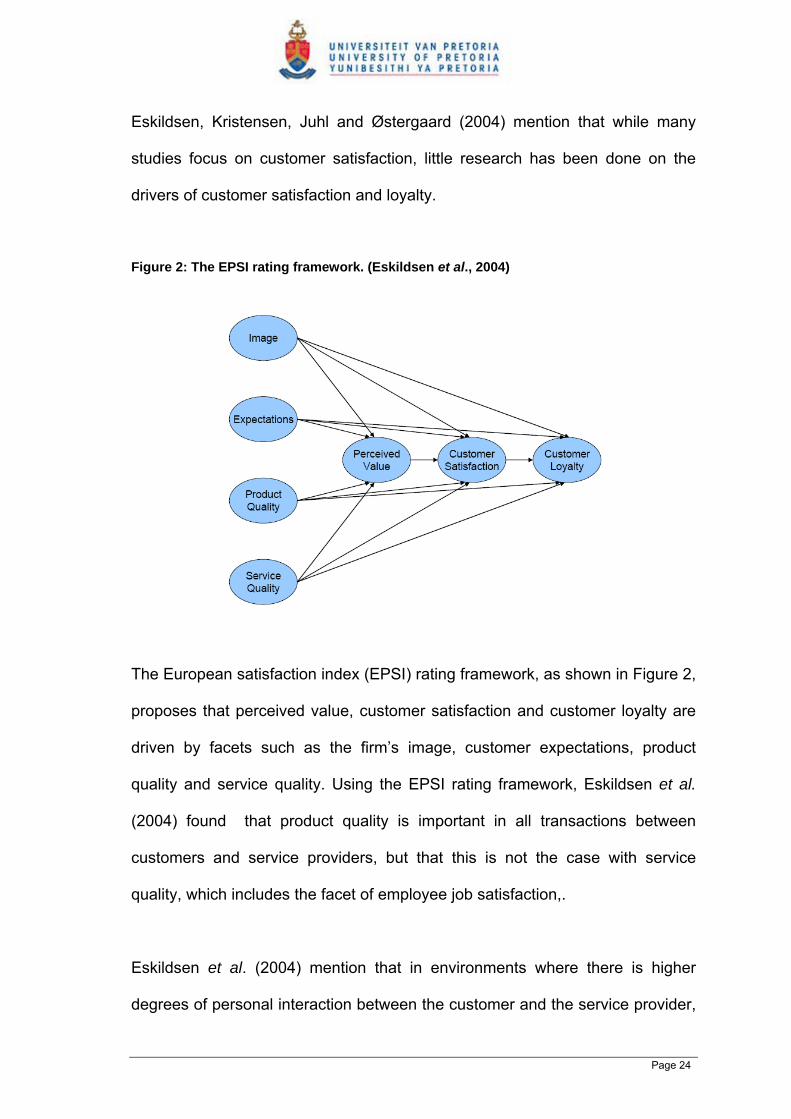
Eskildsen, Kristensen, Juhl and Østergaard (2004) mention that while many
studies focus on customer satisfaction, little research has been done on the
drivers of customer satisfaction and loyalty.
Figure 2: The EPSI rating framework. (Eskildsen et al., 2004)
The European satisfaction index (EPSI) rating framework, as shown in Figure 2,
proposes that perceived value, customer satisfaction and customer loyalty are
driven by facets such as the firm’s image, customer expectations, product
quality and service quality. Using the EPSI rating framework, Eskildsen et al.
(2004) found that product quality is important in all transactions between
customers and service providers, but that this is not the case with service
quality, which includes the facet of employee job satisfaction,.
Eskildsen et al. (2004) mention that in environments where there is higher
degrees of personal interaction between the customer and the service provider,
Page 24
service quality is more important, but in environments where little interaction
occurs between the two, service quality is of a lesser importance. The argument
that Homberg and Stock (2004) raise regarding the relevance and benefits of
employee satisfaction levels and customer satisfaction levels in the business-to-
business context could be challenged in this respect, given the number and
different functional interactions experienced in this context.
2. 5 CONCLUSION
The early work performed in this field by Schneider et al. (1980), Schneider and
Bowen (1985), Tornow and Wiley (1991) and Wiley (1991) all offer support for
the relationship between employee satisfaction and customer satisfaction, but
generally focus on the consumer and service industries. Their research
concentrates specifically on the relationship between employee satisfaction and
customer satisfaction at the organisational or departmental levels, taking the
service level aspects of the firm into account.
There is limited research into the relationship between customer satisfaction
and job satisfaction at the job characteristic level and across different functions
within the firm. Hallowell, Schlesinger and Zornitsky (1996) refer to the internal
service quality of the firm and its relationship with customer satisfaction and job
satisfaction but indicate little support for the direct relationship between the two
constructs.
Homburg and Stock (2004) also researched the relationship between employee
job satisfaction and customer satisfaction in a business-to-business context and
Page 25

argue that the importance of employee job satisfaction levels on customer
satisfaction at functional levels, other than the sales function, is questionable.
A better understanding into this relationship will add to the limited research
currently available in this field.
Page 26

CHAPTER 3
RESEARCH QUESTION
3.1 RESEARCH QUESTION
Is there a relationship between job satisfaction and customer satisfaction in a South African firm?
The relationship will be examined in a business-to-business context and will be
performed at the following levels:
• An examination of the overall employee job and customer satisfactions
levels of the firm. The examination will also take into account the functional
satisfaction levels within the firm, for example administration, marketing
and sales, logistics and warehousing, technical service and support in
relation to the customer.
• Further examination of the job subscales will be performed (salary,
promotion, supervision, fringe benefits, contingent rewards, operating
procedures, co-workers, work and communication) to obtain a better
understanding of the possible causes of the relationship.
Page 27
CHAPTER 4
RESEARCH METHODOLOGY
4.1 INTRODUCTION
A survey method was employed to find out what employees and customers
think or feel about certain facets of a job, product or service offering. According
to Zikmund (2003), the survey method is a quick, inexpensive, efficient and
accurate way of assessing information about a population. The case study
method was used, whereby one South African firm was selected for the study.
Two groups of respondents were targeted within the firm: employees and
customers.
4.2 RESEARCH DESIGN
A survey method was used to gather the primary data for both the job
satisfaction and customer satisfaction samples. According to Zikmund (2003), a
survey is defined as a method of gathering primary data, based on the
communication with a representative sample of individuals and attempts to
describe what is happening or to learn the reasons for a particular activity.
The primary data requirements for this study were as follows:
• Primary data set 1. Job satisfaction data from employees.
• Primary data set 2. Customer satisfaction data from customers.
Page 28
Two independent surveys, one measuring the job satisfaction levels of the
employees and the other the satisfaction levels of the customers, were
employed.
Descriptive statistics and proportions were used to examine the relationship
between job satisfaction and customer satisfaction. A rank order of the
functional satisfaction levels was performed and the positive relationships were
examined at the job level.
4.3 POPULATION AND SAMPLING
The population definition and sampling methods used during the research is
covered in this section. The response rates, ethical issues as well as any
research limitations have also been discussed.
4.3.1 Population definition
For the job satisfaction survey, the population comprised all employees
employed at South African firms operating in the business-to-business context.
For the customer satisfaction survey, the population consisted of all of the
customers of South African firms operating in the business-to-business context.
4.3.2 Sampling
A census of employees from the employee database of a selected South
African firm was used for the job satisfaction survey. For this survey, 123
Page 29

employees were requested to take part. A total of 67 employees responded,
yielding a response rate of 54 percent.
The sampling frame for the customer satisfaction survey comprised all
customers who had formal accounts and whose accounts had been active
during the last four years at the same firm selected for the job satisfaction
survey. The customer satisfaction survey’s primary sample unit (PSU) was
those customer accounts that had been active at any time during the past four
years.
The sample unit was sub-divided into two subgroups or strata (Zikmund. 2003).
The first stratum included those customers whose accounts had been active
continuously during the past four years (2004-2007). The second stratum
included those customers whose accounts had been active during the past four
years (2004-2007), but which had been inactive for longer than 12 months and
those customers who had closed their accounts all together during this period.
The reason for the stratified sample was to include customers that had possibly
been lost to the competition due to unsatisfactory service during this period.
The stratified sample reduces any selection bias in favour of satisfied
customers. For the customer satisfaction survey, 170 customers were
contacted to take part in the survey, with 85 being randomly selected from each
stratum. Of these 170 customers, 66 responded, yielding a response rate of 39
percent.
Page 30

Two units of analysis were measured. Firstly, the employees’ levels of job
satisfaction were measured from a minimum level of one to a maximum level of
six. Secondly, the customer satisfaction levels were measured from a minimum
level of one to a maximum level of four.
4.3.3 Response rate
A self-administered questionnaire, delivered via e-mail, was used as the data
collection instrument for the job satisfaction survey. According to Zikmund
(2003), the response rate can be as low as 15 percent with this type of method.
Following Zikmund’s (2003) suggestion of including a cover letter outlining the
usefulness of the study, together with making periodic follow ups, the response
rate for the job satisfaction survey was improved to 54 percent.
The customer satisfaction survey was conducted via the telephone interview
method. This ensured a higher level of cooperation from the respondents. The
customers were asked to indicate their level of satisfaction with the different
facets presented. According to Zikmund (2003), the cooperation of respondents
in telephone interviews is fairly good, with the added advantage of being
relatively low cost. For the customer satisfaction survey, 66 customers took
part, which constituted a response rate of 39 percent.
4.3.4 Ethical issues
Permission to conduct a job satisfaction survey was requested from the
selected firm. All the employees were requested to take part and were informed
of the purpose of the survey. The decision to take part was voluntary and no
Page 31

personal details were requested. No individual satisfaction levels were made
available or included in this research report. The employees were also
requested to indicate which function they performed within the firm and it was
established that no functional group consisted of less than seven members. The
response rate from the smallest group amounted to five respondents, yielding a
response rate of 71 percent. The aggregated results of the job satisfaction
survey are made available within this research report.
Each customer was informed of the nature and purpose of the customer
satisfaction survey. The decision to take part was voluntary and no customer
details were requested or noted during the survey. No enticement or reward
was offered to any employee or customer to take part or to improve the
response rate of the survey.
4.3.5 Research limitations
This research was limited to a single firm in South Africa. The firm selected is a
highly technical supplier of capital equipment operating in the business-to-
business context. Therefore, any generalisation of the research findings to the
broader industry has its limitations.
During the job satisfaction survey, employees were also requested to indicate
which of the following work functions they performed: administration, marketing
and sales, logistics and warehousing, or technical service and support. Other
functions do exist within a firm but were not examined in this study.
Page 32
In the job satisfaction survey, the administration function had a response rate of
71 percent. This constituted a response from five employees. Owing to the
small sample size and response rate, the measured job satisfaction levels of
this group and the rank order position of the administration function in relation to
the customers’ satisfaction levels may not provide a true reflection of the actual
situation.
4.4 DATA COLLECTION AND INSTRUMENT DESIGN
The job and customer satisfaction data collection instruments are discussed in
detail in this section.
4.4.1 The job satisfaction survey (JSS)
The collection of the job satisfaction data was performed using a self-
administered survey questionnaire. A slightly modified version of the JSS was
used as the data collection instrument. The JSS, a multidimensional instrument,
was developed for the social services but can be used in other sectors as well
(Spector. 1985). The JSS assesses nine subscales: salary, promotion,
supervision, fringe benefits, contingent rewards, operating procedures, co-
workers, work and communication, as well as the overall satisfaction levels.
The response format was a six-point Likert scale ranging from “disagree very
much” (1) to “agree very much” (6). Van Saane, Sluiter, Verbeek, and Frings-
Dresen (2003), in their review of job satisfaction instruments, conclude that the
Page 33
JSS instrument is one of a few instruments that meets several criteria for a high
level reliability and construct validity.
The JSS scale contains four questions for each of the nine subscales
mentioned above, totalling 36 items in all. It uses a summated rating scale
format. According to Spector (1997), this is the most popular for job satisfaction
scales and the format of the JSS makes it relatively easy to modify.
The final job satisfaction questionnaire consisted of 32 questions of the original
JSS (Spector. 1985). The nine subscales consist of the following number of
related questions: pay (4), promotion (3), supervision (4), benefits (4),
contingent rewards (4), operating procedures (4), co-workers (3), nature of the
work (3) and communication (3).
Each of the questions is either a statement that is positively or negatively
related to the aspect of the job. Owing to the number of question associated
with each of the nine subscales, the final summation of the employees’
responses was divided by the number questions in order to maintain a
representative satisfaction response between one and six. The design of the
questionnaire is included in Appendix A – The job satisfaction survey.
4.4.2 The customer satisfaction survey
In developing the customer satisfaction survey, reference was made to
Kristensen, Kanji and Dahlgaard’s (1992) procedures for implementing a
customer satisfaction system. Informal interview sessions were conducted with
Page 34
senior management to determine, in their view, the total set of quality
characteristics that created customer satisfaction. These included the areas of
administration, delivery, products, sales consultants, after sales service and the
overall impression of the firm. The quality characteristics were reduced to a
manageable size of six functions and a maximum of three questions per
function was decided on. The response format was a four-point Likert scale
ranging from (1) “very dissatisfied” to (4) “very satisfied”.
The customer satisfaction scale consists of three questions per the six quality
characteristics, totalling 18 items in all. By combining the responses of the three
items and dividing by three, a customer satisfaction rating between one and
four for each of the six quality characteristics was obtained. The design of the
questionnaire is included in Appendix B – The customer satisfaction survey.
4.5 DATA ANALYSIS
The survey questionnaire allows various descriptive forms of statistical
measurement. The data were captured into an electronic database to be used
with a statistical programme.
Descriptive statistics were used to examine the relationship between job
satisfaction and customer satisfaction in this research. Box plots, frequency
tables with a Pearson’s Chi-square test for significance were performed on the
job satisfaction data with proportions and percentages examining the level of
customer satisfaction.
Page 35
This research consists of two primary samples measuring two concepts and
varying in scales. A rank order analysis of the level of job satisfaction and
customer satisfaction was performed and, with the use of a Spearman-rank
correlation, an analysis was conducted to determine if a statistical relationship
exists between job satisfaction and customer satisfaction levels. The need to
answer the research question guided the analysis approach.
4.6 CONCLUSION
The data collected during the two surveys samples was analysed and the
results are presented in the following section, namely chapter 5.
Page 36
CHAPTER 5
RESULTS
5.1 INTRODUCTION
This chapter presents the results of the research data which focused on the
relationship between job and customer satisfaction levels. The findings are
based on a total of 67 job satisfaction survey respondents, as well as the 66
customer satisfaction survey respondents. The findings are represented in the
following way:
• The overall job satisfaction results (JS)
• The overall customer satisfaction results (CS)
• The relationship between (CS) and (JS)
• The nine sub groups of job satisfaction.
5.2 THE OVERALL JOB SATISFACTION RESULTS
The overall employee’s job satisfaction results, including the satisfaction levels
of the marketing and sales, technical services and support, logistics and
warehousing, and the administration functions are presented in this section.
A six-point Likert scale ranging form one to six was used to indicate the levels
of satisfaction in the survey. The mid-level value on the Likert scale of 3.5 was
used to categorise the respondents’ overall satisfaction level into either
Page 37
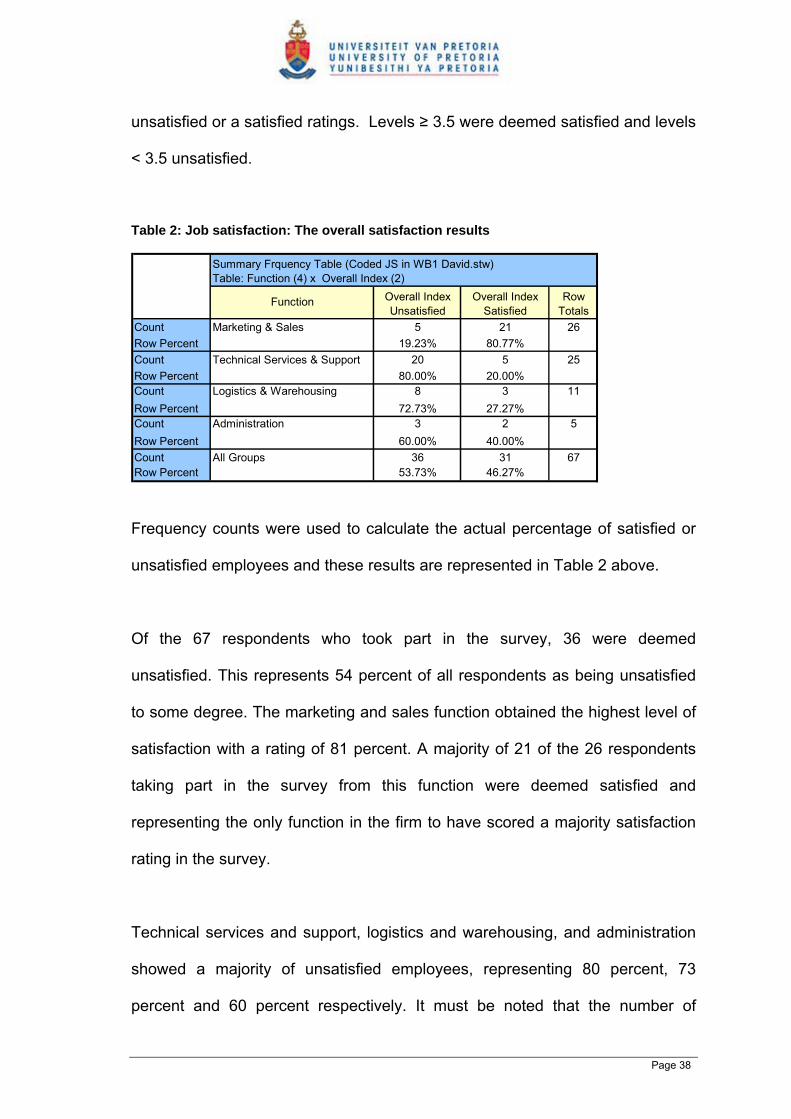
unsatisfied or a satisfied ratings. Levels ≥ 3.5 were deemed satisfied and levels
< 3.5 unsatisfied.
Table 2: Job satisfaction: The overall satisfaction results
Count 5 21 26Row Percent 19.23% 80.77%Count 20 5 25Row Percent 80.00% 20.00%Count 8 3 11Row Percent 72.73% 27.27%Count 3 2 5Row Percent 60.00% 40.00%Count 36 31 67Row Percent 53.73% 46.27%
All Groups
Logistics & Warehousing
Administration
Technical Services & Support
Marketing & Sales
Function Overall Index Unsatisfied
Overall Index Satisfied
Row Totals
Summary Frquency Table (Coded JS in WB1 David.stw) Table: Function (4) x Overall Index (2)
Frequency counts were used to calculate the actual percentage of satisfied or
unsatisfied employees and these results are represented in Table 2 above.
Of the 67 respondents who took part in the survey, 36 were deemed
unsatisfied. This represents 54 percent of all respondents as being unsatisfied
to some degree. The marketing and sales function obtained the highest level of
satisfaction with a rating of 81 percent. A majority of 21 of the 26 respondents
taking part in the survey from this function were deemed satisfied and
representing the only function in the firm to have scored a majority satisfaction
rating in the survey.
Technical services and support, logistics and warehousing, and administration
showed a majority of unsatisfied employees, representing 80 percent, 73
percent and 60 percent respectively. It must be noted that the number of
Page 38
respondents who took part in the survey from the administration, and logistics
and warehousing functions were relatively small and may not necessarily
representative a reliable sample.
Table 3: Job satisfaction: Expected frequencies
14 12 2613 12 256 53 2
36 31 67All Groups
Logistics & WarehousingAdministration
Marketing & SalesTechnical Services & Support
Summary Table: Expected Frequencies (Coded JS in WB1 David.stw) Pearson Chi-square: 21.0631, df=3, p=.000102
Function Overall Index Unsatisfied
Overall Index Satisfied
Row Totals
115
The expected frequencies in Table 3 shows with a p value of less than 0.05 that
the current job satisfaction levels of the employees within the firm are
significantly different and dependant on the specific functional in which the
employee works.
Figure 3 graphically presents the overall job satisfaction distributions of each of
the four functional areas, namely marketing and sales, technical services and
support, logistics and warehousing, and administration.
Administration together with the marketing and sales function, experience
higher mean satisfaction levels than the firm’s overall average mean value. This
is supported by the results described in Table 2. The employees in the
technical services and support function have the lowest mean satisfaction levels
within the firm.
Page 39
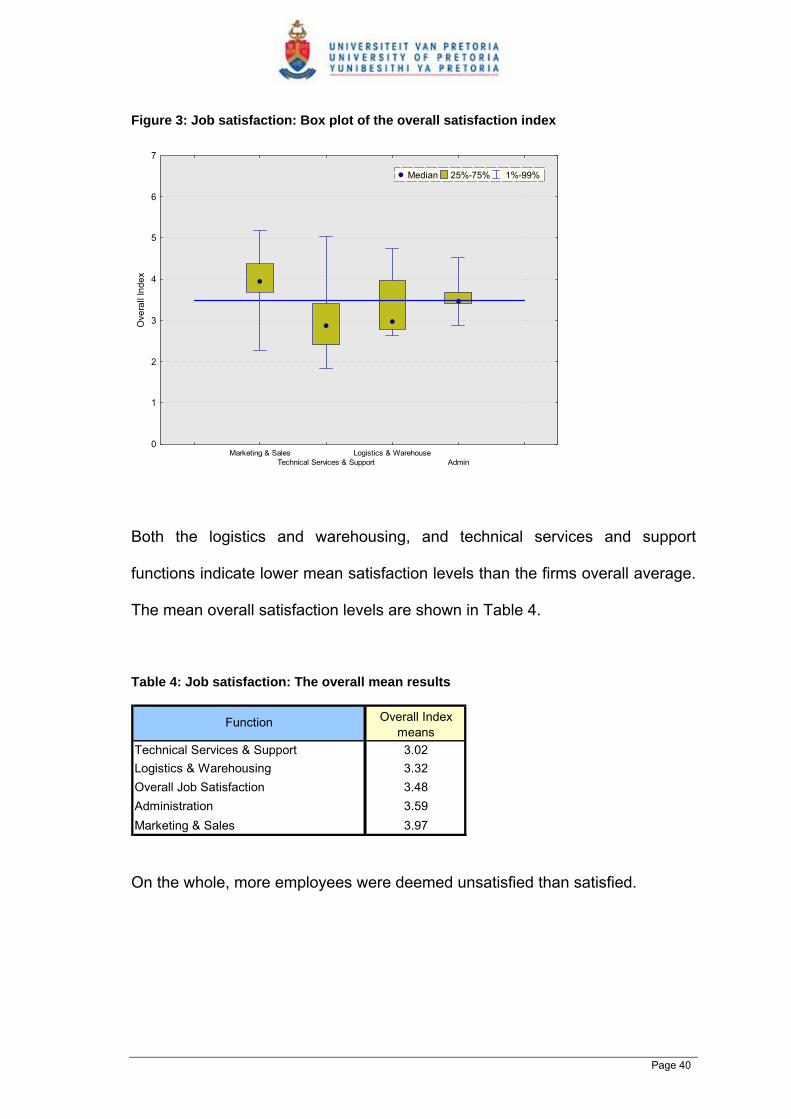
Figure 3: Job satisfaction: Box plot of the overall satisfaction index
Marketing & SalesTechnical Services & Support
Logistics & WarehouseAdmin
0
1
2
3
4
5
6
7
Ove
rall
Inde
x
Median 25%-75% 1%-99%
Both the logistics and warehousing, and technical services and support
functions indicate lower mean satisfaction levels than the firms overall average.
The mean overall satisfaction levels are shown in Table 4.
Table 4: Job satisfaction: The overall mean results
Technical Services & Support 3.02Logistics & Warehousing 3.32Overall Job Satisfaction 3.48Administration 3.59Marketing & Sales 3.97
Function Overall Index means
On the whole, more employees were deemed unsatisfied than satisfied.
Page 40
5.3 THE OVERALL CUSTOMER SATISFACTION RESULTS
The firm’s overall customer satisfaction results, including the results for each of
the functional areas surveyed, namely sales consultants, after sales service,
delivery, administration, and products are presented in this section.
A four-point Likert scale ranging from one to four was used to indicate the levels
of satisfaction in the survey. A mid-level value on the Likert scale of 2.5 was
used to categorise the respondents’ overall satisfaction results into unsatisfied
or a satisfied ratings. Levels ≥ 2.5 were deemed as satisfied and levels < 2.5
unsatisfied. Table 5 represents the frequency counts, as well as the calculated
percentages, of the satisfied customers as opposed to those deemed
unsatisfied. Of the 66 customer responses to the overall impression of the firm,
48 of them were deemed satisfied. This represents approximately 73 percent of
all customers surveyed as being satisfied with the overall impression of the firm.
Table 5: Customer satisfaction: The overall satisfaction results
Count 43 23 66Row Percent 65.15% 34.85%Count 13 53 66Row Percent 19.70% 80.30%Count 7 59 66Row Percent 10.61% 89.39%Count 10 56 66Row Percent 15.15% 84.85%Count 24 42 66Row Percent 36.36% 63.64%Count 18 48 66Row Percent 27.27% 72.73%
After sales service
Overall impression
Summary Frquency Table (Coded Customer satisfaction David.stw)
Function Row Totals
Administration
Delivery
Overall Index Satisfied
Overall Index Unsatisfied
Product
Sales consultants
Page 41
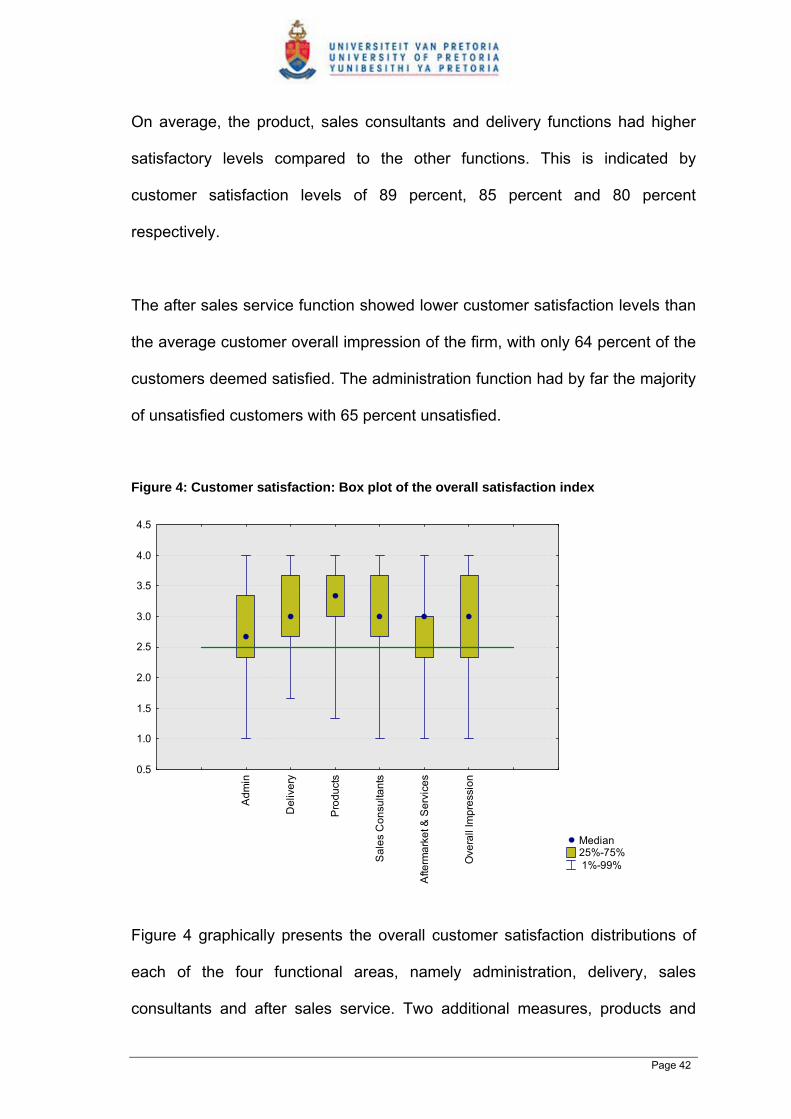
On average, the product, sales consultants and delivery functions had higher
satisfactory levels compared to the other functions. This is indicated by
customer satisfaction levels of 89 percent, 85 percent and 80 percent
respectively.
The after sales service function showed lower customer satisfaction levels than
the average customer overall impression of the firm, with only 64 percent of the
customers deemed satisfied. The administration function had by far the majority
of unsatisfied customers with 65 percent unsatisfied.
Figure 4: Customer satisfaction: Box plot of the overall satisfaction index
Median 25%-75% 1%-99%
Adm
in
Del
iver
y
Pro
duct
s
Sal
es C
onsu
ltant
s
Afte
rmar
ket &
Ser
vice
s
Ove
rall
Impr
essi
on
0.5
1.0
1.5
2.0
2.5
3.0
3.5
4.0
4.5
Figure 4 graphically presents the overall customer satisfaction distributions of
each of the four functional areas, namely administration, delivery, sales
consultants and after sales service. Two additional measures, products and
Page 42
overall impression of the firm, were included as separate facets within the
customer satisfaction survey.
The overall satisfaction levels with regards to customers, is deemed satisfied.
Whether the results observed can be interpreted as moderate or high levels of
satisfaction is unsubstantiated. It does however indicate that the customers are
to some degree satisfied. The overall mean satisfaction levels of each of the
functions are shown in Table 6. The overall impression of the firm is indicated
by the mean value of 2.95
Table 6: Customer satisfaction: The overall mean results
After sales service 2.67Administration 2.78Overall impression 2.95Delivery 3.06Sales Consultant 3.10Products 3.21
Function Overall Index means
Table 7 shows a T–test for independence between the different functions in the
firm. This test also includes the product and the overall impression results. It
indicates which of the customer satisfaction responses, in respect to the rated
function, are significantly different from each other.
Page 43
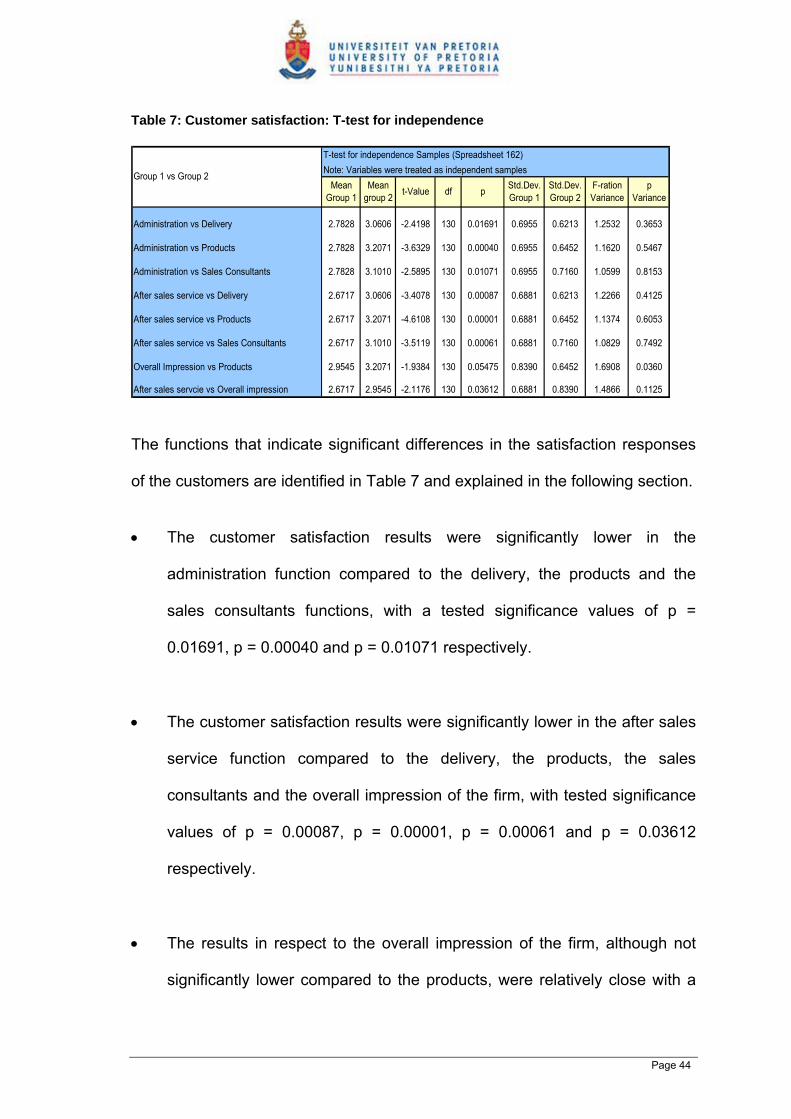
Table 7: Customer satisfaction: T-test for independence
Administration vs Delivery 2.7828 3.0606 -2.4198 130 0.01691 0.6955 0.6213 1.2532 0.3653
Administration vs Products 2.7828 3.2071 -3.6329 130 0.00040 0.6955 0.6452 1.1620 0.5467
Administration vs Sales Consultants 2.7828 3.1010 -2.5895 130 0.01071 0.6955 0.7160 1.0599 0.8153
After sales service vs Delivery 2.6717 3.0606 -3.4078 130 0.00087 0.6881 0.6213 1.2266 0.4125
After sales service vs Products 2.6717 3.2071 -4.6108 130 0.00001 0.6881 0.6452 1.1374 0.6053
After sales service vs Sales Consultants 2.6717 3.1010 -3.5119 130 0.00061 0.6881 0.7160 1.0829 0.7492
Overall Impression vs Products 2.9545 3.2071 -1.9384 130 0.05475 0.8390 0.6452 1.6908 0.0360
After sales servcie vs Overall impression 2.6717 2.9545 -2.1176 130 0.03612 0.6881 0.8390 1.4866 0.1125
T-test for independence Samples (Spreadsheet 162)Note: Variables were treated as independent samples
Std.Dev. Group 1
Std.Dev. Group 2
F-ration Variance
p Variance
Group 1 vs Group 2Mean
Group 1Mean
group 2 t-Value df p
The functions that indicate significant differences in the satisfaction responses
of the customers are identified in Table 7 and explained in the following section.
• The customer satisfaction results were significantly lower in the
administration function compared to the delivery, the products and the
sales consultants functions, with a tested significance values of p =
0.01691, p = 0.00040 and p = 0.01071 respectively.
• The customer satisfaction results were significantly lower in the after sales
service function compared to the delivery, the products, the sales
consultants and the overall impression of the firm, with tested significance
values of p = 0.00087, p = 0.00001, p = 0.00061 and p = 0.03612
respectively.
• The results in respect to the overall impression of the firm, although not
significantly lower compared to the products, were relatively close with a
Page 44
tested significance value of p = 0.05474. It was therefore included in the
results.
Not all the T-tests showed significance results and were therefore not included
in this section. The full T-test results are available in Appendix C – T-test for
independence results.
5.4 THE RELATIONSHIP BETWEEN (CS) AND (JS)
This section provides data and results that will assist in answering the research
question.
5.4.1 Research question
Is there a relationship between job satisfaction and customer satisfaction
in a South African firm?
The results of the job satisfaction and customer satisfaction surveys have been
compared to determine if a relationship exist between the two constructs. The
research consists of two primary samples measuring two concepts and varying
in scales. The data is therefore compared as follows.
• Using percentages to compare the proportions of overall job satisfaction
and customer satisfaction responses and examining the relationship
between the two.
Page 45

• A same comparison as described above is preformed on the following
functions, namely administration, logistic and warehousing, marketing and
sales, and after sales services. The product responses have been omitted
in this comparison.
• Using a rank order comparison of the mean satisfaction levels obtained
during the job and customer satisfaction surveys and performing a
Spearman-rank correlation to determine the strength of the relationship.
5.4.2 Proportions
This section examines the relationships between the overall customer and
employee satisfaction results. A comparison of the functional satisfaction results
also examined for relationships.
Figure 5: The relationship: The customer and job satisfaction overall index
73%
35%
80%85%
64%
46%
40%
27%
81%
20%
0%
10%
20%
30%
40%
50%
60%
70%
80%
90%
100%
Prop
ortio
n of
sam
ple
that
was
rank
ed s
atis
fied
CS Index
JS Index
CS Index 73% 35% 80% 85% 64%
JS Index 46% 40% 27% 81% 20%
Overall impression
Administration Delivery Sales consultants
After sales service
Page 46

Figure 5 compares the four functions in respect to the overall customer and job
satisfaction results. One other facet, namely overall impression of the firm has
also been included in the comparison.
Similar percentages of satisfied customers and satisfied employees were found
in the following two cases.
• Administration: 35 percent of the customers were satisfied with this
function of the firm compared to 40 percent of the employees, who worked
in this function, reporting being satisfied with their job conditions.
• Sales consultants: 85 percent of the customers were satisfied with this
function compared to 81 percent of the employees, who worked in this
function, reporting being satisfied with their job conditions.
Dissimilar percentages of satisfied customers and satisfied employees were
found in the remaining three cases.
• Overall impression: 73 percent of the customers were satisfied with the
overall impression of the firm as opposed to 46 percent of the employees
reporting satisfaction levels with the firm’s job conditions respectively.
• Delivery: 80 percent of the customers were satisfied with this function as
opposed to 27 percent of employees, who worked in this function,
reporting being satisfied with their job conditions.
Page 47

• After sales service: 64 percent of the customers were satisfied with this
function as opposed to 20 percent of employees, who worked in this
function, reporting being satisfied with their job conditions.
5.4.3 Rank order
This section examines the relationships between the rankings of the mean
customer satisfaction results compared to the ranking of the mean job
satisfaction results in the firm.
Figure 6 graphically represents the ranking order of the mean customer
satisfaction results from lowest to highest.
Figure 6: Customer satisfaction: Rank order of the mean satisfaction levels
2.67 2.782.95 3.06 3.10 3.21
0.0
0.5
1.0
1.5
2.0
2.5
3.0
3.5
4.0
After salesservice
Administration OverallImpression
Delivery Sales Consultants Products
Ave
rage
leve
l of c
usto
mer
sat
isfa
ctio
n
The results indicate that the customers are on average satisfied with the
functional performances of the firm. A mean value of ≥ 2.5 is deemed to be
Page 48
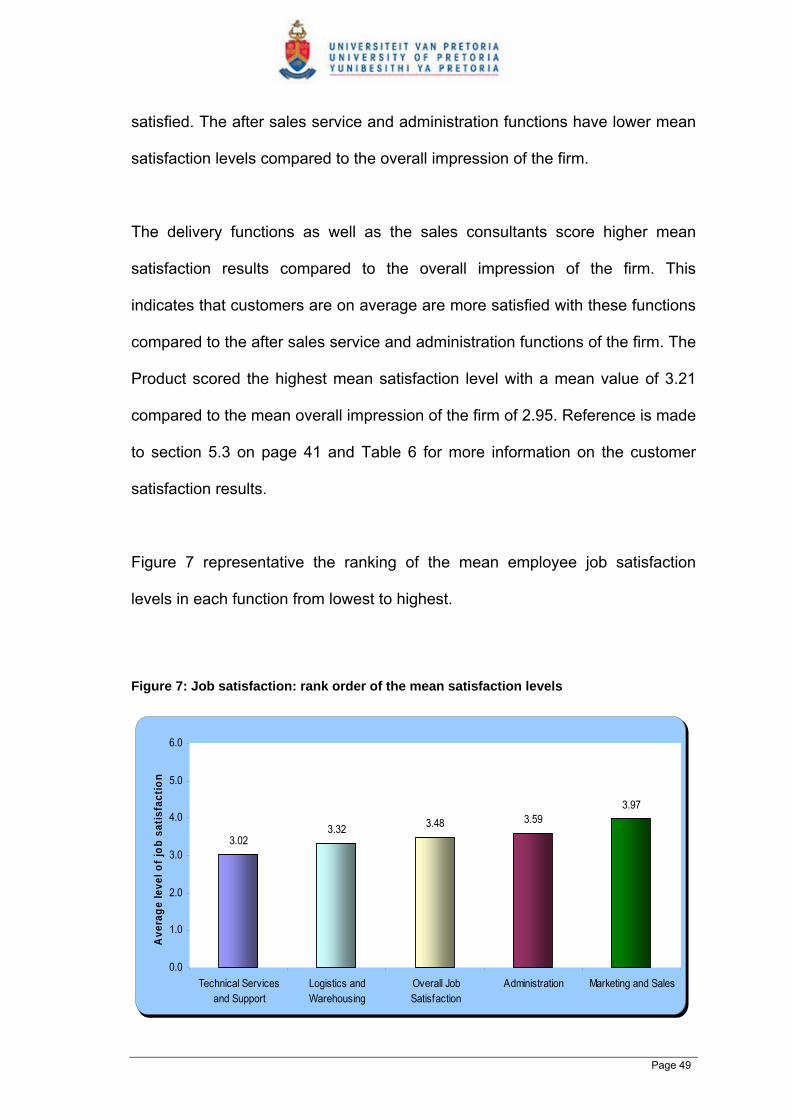
satisfied. The after sales service and administration functions have lower mean
satisfaction levels compared to the overall impression of the firm.
The delivery functions as well as the sales consultants score higher mean
satisfaction results compared to the overall impression of the firm. This
indicates that customers are on average are more satisfied with these functions
compared to the after sales service and administration functions of the firm. The
Product scored the highest mean satisfaction level with a mean value of 3.21
compared to the mean overall impression of the firm of 2.95. Reference is made
to section 5.3 on page 41 and Table 6 for more information on the customer
satisfaction results.
Figure 7 representative the ranking of the mean employee job satisfaction
levels in each function from lowest to highest.
Figure 7: Job satisfaction: rank order of the mean satisfaction levels
3.023.32 3.48 3.59
3.97
0.0
1.0
2.0
3.0
4.0
5.0
6.0
Technical Servicesand Support
Logistics andWarehousing
Overall JobSatisfaction
Administration Marketing and Sales
Ave
rage
leve
l of j
ob s
atis
fact
ion
Page 49

A mean value ≥ 3.5 is deemed to be satisfied in this case. These results differ
slightly from the customer satisfaction results in as far as only two functions,
namely administration and the marketing and sales function that indicate job
conditions that the employees rate satisfactory.
The technical services and support, and logistics and warehousing functions
scored the lowest in the mean job satisfaction results with values of 3.02 and
3.32 respectively. The overall mean employee job satisfaction level in the firm
as well as the levels in the technical services and support, and logistics and
warehousing functions are deemed dissatisfied.
For the ease of comparison the customer satisfaction functional titles have been
used throughout the rest of this section. The customer satisfaction functions
have been compared to the following job satisfaction functions as shown in the
in Table 8.
Table 8: Comparison of functions CS functional titles JS functional titles
Overall impression = All groups
Administration = Administration
Delivery = Logistics and warehousing
Sales consultants = Marketing and sales
After sales service = Technical service and support
A ranking of the firm’s job and customer satisfaction results in respect to each
of the functions are indicated in Table 9. The rank order value “1” represents
Page 50
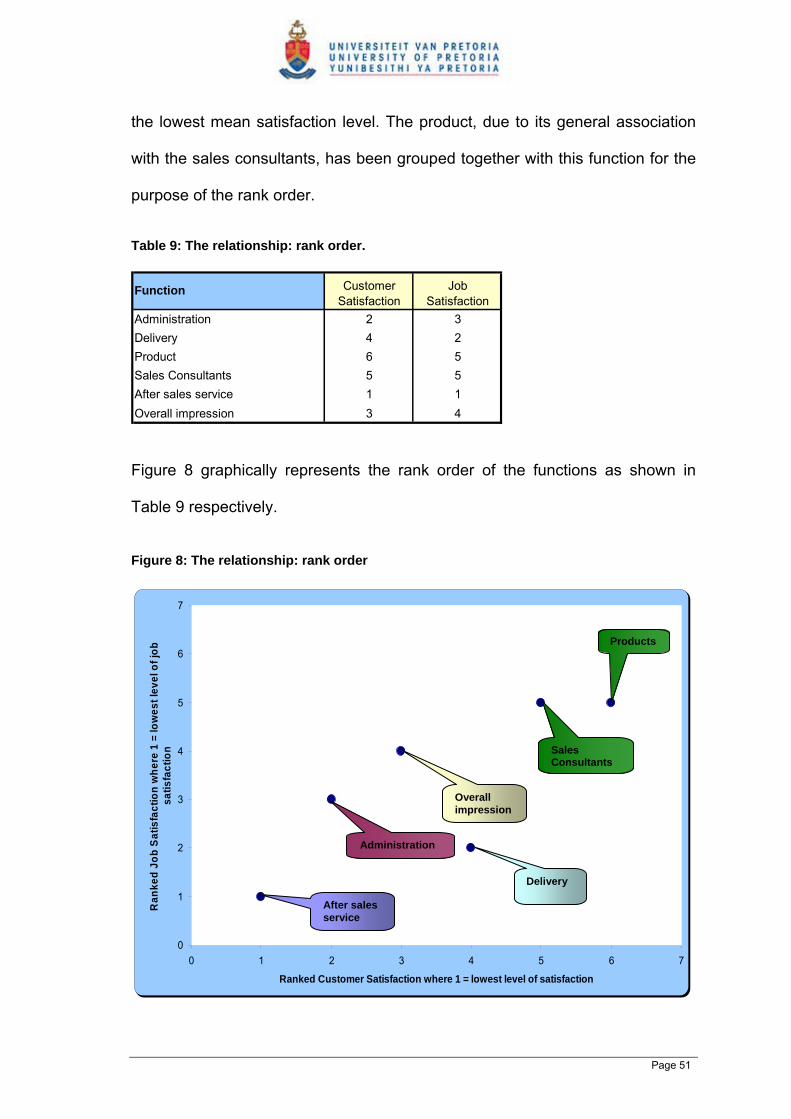
the lowest mean satisfaction level. The product, due to its general association
with the sales consultants, has been grouped together with this function for the
purpose of the rank order.
Table 9: The relationship: rank order.
Administration 2 3Delivery 4 2Product 6 5Sales Consultants 5 5After sales service 1 1Overall impression 3 4
Job Satisfaction
Function Customer Satisfaction
Figure 8 graphically represents the rank order of the functions as shown in
Table 9 respectively.
Figure 8: The relationship: rank order
0
1
2
3
4
5
6
7
0 1 2 3 4 5 6 7
Ranked Customer Satisfaction where 1 = lowest level of satisfaction
Ran
ked
Job
Satis
fact
ion
whe
re 1
= lo
wes
t lev
el o
f job
sa
tisfa
ctio
n
After sales service
Overall impression
Delivery
Administration
Products
Sales Consultants
Page 51
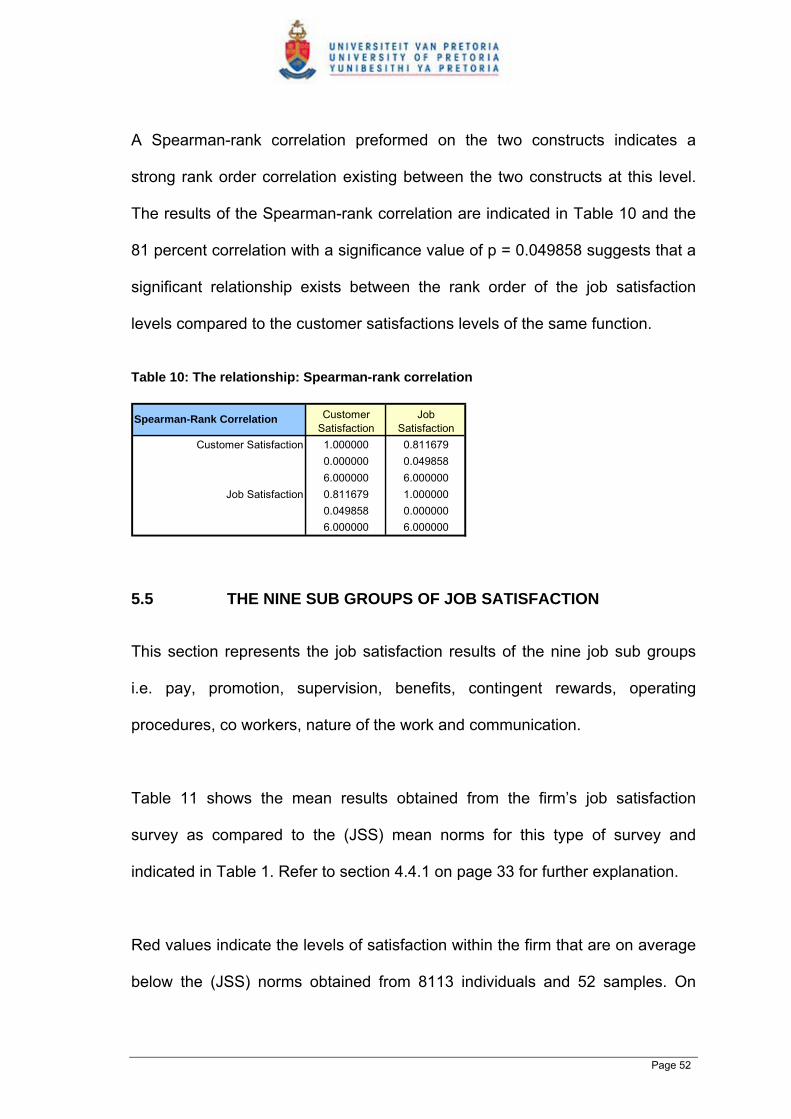
A Spearman-rank correlation preformed on the two constructs indicates a
strong rank order correlation existing between the two constructs at this level.
The results of the Spearman-rank correlation are indicated in Table 10 and the
81 percent correlation with a significance value of p = 0.049858 suggests that a
significant relationship exists between the rank order of the job satisfaction
levels compared to the customer satisfactions levels of the same function.
Table 10: The relationship: Spearman-rank correlation
1.000000 0.8116790.000000 0.0498586.000000 6.0000000.811679 1.0000000.049858 0.0000006.000000 6.000000
Job Satisfaction
Spearman-Rank Correlation Customer Satisfaction
Job Satisfaction
Customer Satisfaction
5.5 THE NINE SUB GROUPS OF JOB SATISFACTION
This section represents the job satisfaction results of the nine job sub groups
i.e. pay, promotion, supervision, benefits, contingent rewards, operating
procedures, co workers, nature of the work and communication.
Table 11 shows the mean results obtained from the firm’s job satisfaction
survey as compared to the (JSS) mean norms for this type of survey and
indicated in Table 1. Refer to section 4.4.1 on page 33 for further explanation.
Red values indicate the levels of satisfaction within the firm that are on average
below the (JSS) norms obtained from 8113 individuals and 52 samples. On
Page 52
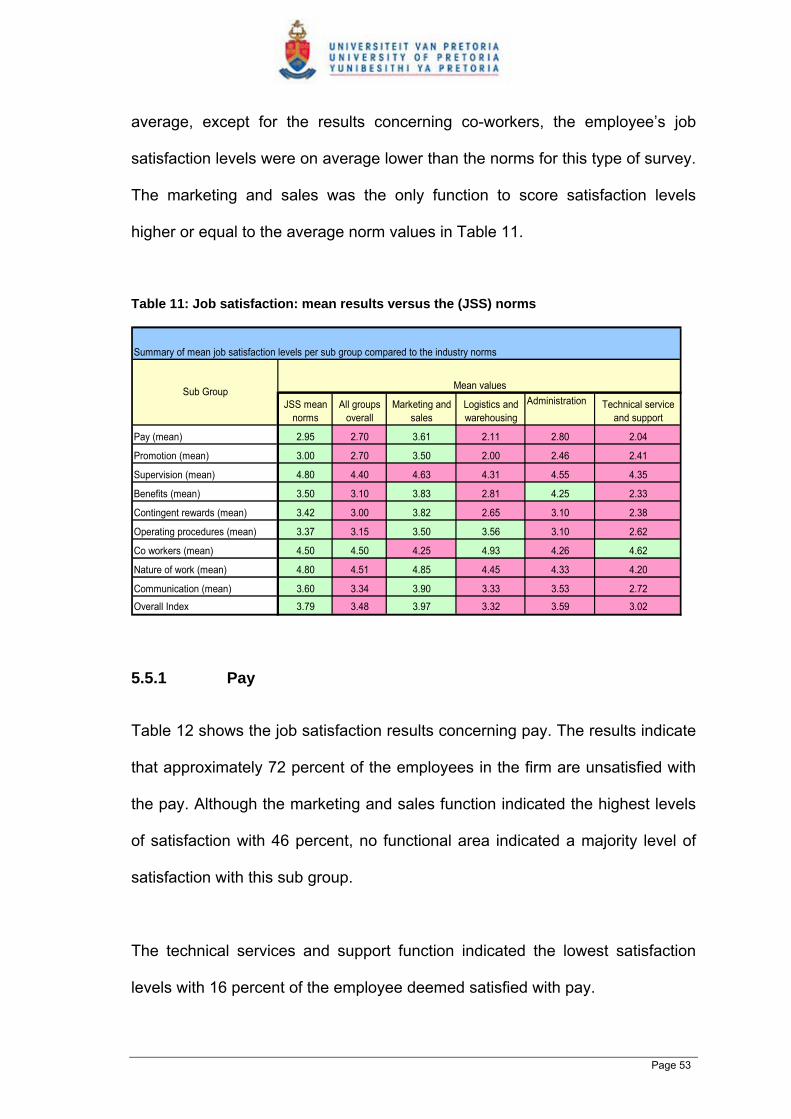
average, except for the results concerning co-workers, the employee’s job
satisfaction levels were on average lower than the norms for this type of survey.
The marketing and sales was the only function to score satisfaction levels
higher or equal to the average norm values in Table 11.
Table 11: Job satisfaction: mean results versus the (JSS) norms
Administration
2.95 2.70 3.61 2.11 2.80 2.04
3.00 2.70 3.50 2.00 2.46 2.41
4.80 4.40 4.63 4.31 4.55 4.35
3.50 3.10 3.83 2.81 4.25 2.33
3.42 3.00 3.82 2.65 3.10 2.38
3.37 3.15 3.50 3.56 3.10 2.62
4.50 4.50 4.25 4.93 4.26 4.62
4.80 4.51 4.85 4.45 4.33 4.20
3.60 3.34 3.90 3.33 3.53 2.72
3.79 3.48 3.97 3.32 3.59 3.02
Communication (mean)
Overall Index
Co workers (mean)
Nature of work (mean)
Contingent rewards (mean)
Operating procedures (mean)
Supervision (mean)
Benefits (mean)
Pay (mean)
Promotion (mean)
Summary of mean job satisfaction levels per sub group compared to the industry norms
Sub Group Mean values
JSS mean norms
All groups overall
Marketing and sales
Logistics and warehousing
Technical service and support
5.5.1 Pay
Table 12 shows the job satisfaction results concerning pay. The results indicate
that approximately 72 percent of the employees in the firm are unsatisfied with
the pay. Although the marketing and sales function indicated the highest levels
of satisfaction with 46 percent, no functional area indicated a majority level of
satisfaction with this sub group.
The technical services and support function indicated the lowest satisfaction
levels with 16 percent of the employee deemed satisfied with pay.
Page 53

Table 12: Job satisfaction: pay
Count 14 12 26Row Percent 53.85% 46.15%Count 21 4 25Row Percent 84.00% 16.00%Count 9 2 11Row Percent 81.82% 18.18%Count 4 1 5Row Percent 80.00% 20.00%Count 48 19 67Row Percent 71.64% 28.36%
All Groups
Logistics and Warehousing
Administration
Technical Services and Support
Marketing and Sales
Summary Frquency Table (Coded JS in WB1 David.stw) Table: Function (4) x Pay (2)
Function Pay Unsatisfied
Pay Satisfied
Row Totals
Table 13 shows with a p value more than 0.05 that the satisfaction levels
concerning pay are not significantly dependant on the function in which the
employee performs.
Table 13: Pay: expected frequencies
19 7 2618 7 258 34 1
48 19 67All Groups
Logistics and WarehousingAdministration
Marketing and SalesTechnical Services and Support
Function Pay Unsatisfied
Pay Satisfied
Row Totals
Summary Table: Expected Frequencies (Coded JS in WB1 David.stw) Pearson Chi-square: 6.66478, df=3, p=.083393
115
5.5.2 Promotion
Table 14 shows the job satisfaction results concerning promotion. The results
indicate that 67 percent of the employees in the firm are unsatisfied with
promotional opportunities. The marketing and sales function indicates the
majority of satisfied employees with this sub group, namely 54 percent. The
logistics and warehousing function indicate the lowest satisfaction levels with 9
Page 54
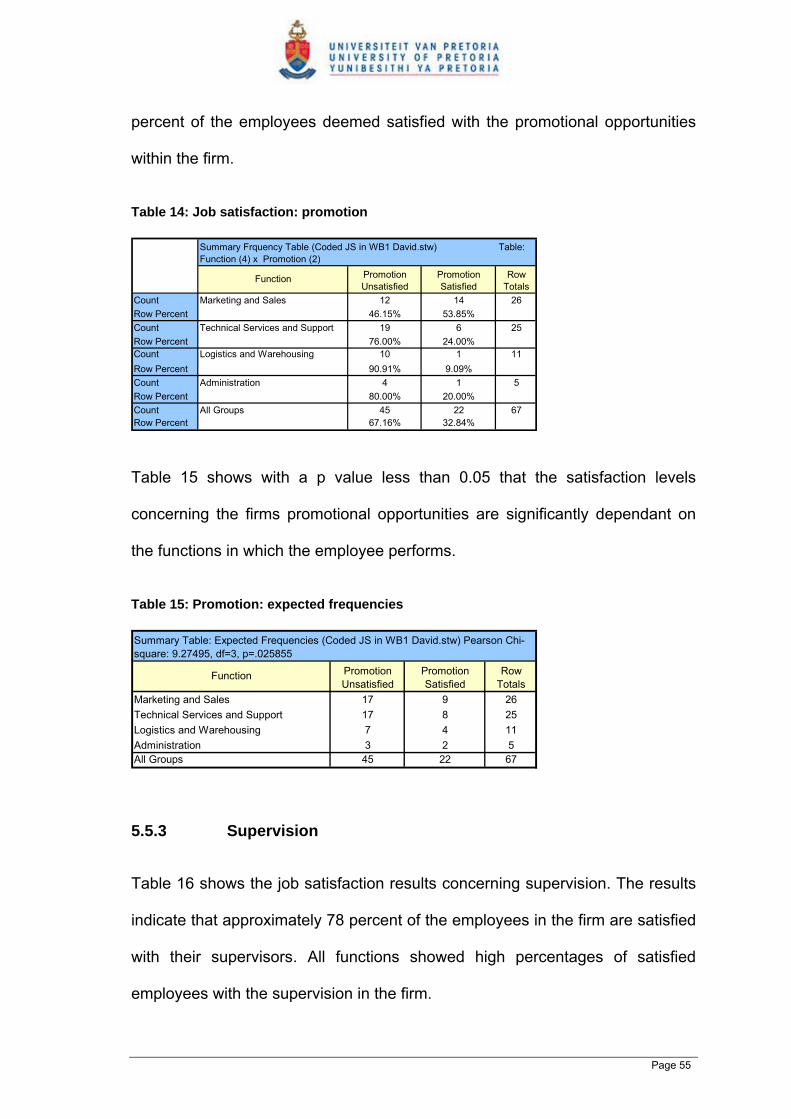
percent of the employees deemed satisfied with the promotional opportunities
within the firm.
Table 14: Job satisfaction: promotion
Count 12 14 26Row Percent 46.15% 53.85%Count 19 6 25Row Percent 76.00% 24.00%Count 10 1 11Row Percent 90.91% 9.09%Count 4 1 5Row Percent 80.00% 20.00%Count 45 22 67Row Percent 67.16% 32.84%
All Groups
Logistics and Warehousing
Administration
Technical Services and Support
Marketing and Sales
Function Promotion Unsatisfied
Promotion Satisfied
Row Totals
Summary Frquency Table (Coded JS in WB1 David.stw) Table: Function (4) x Promotion (2)
Table 15 shows with a p value less than 0.05 that the satisfaction levels
concerning the firms promotional opportunities are significantly dependant on
the functions in which the employee performs.
Table 15: Promotion: expected frequencies
17 9 2617 8 257 43 2
45 22 67All Groups
Logistics and WarehousingAdministration
Marketing and SalesTechnical Services and Support
Summary Table: Expected Frequencies (Coded JS in WB1 David.stw) Pearson Chi-square: 9.27495, df=3, p=.025855
Function Promotion Unsatisfied
Promotion Satisfied
Row Totals
115
5.5.3 Supervision
Table 16 shows the job satisfaction results concerning supervision. The results
indicate that approximately 78 percent of the employees in the firm are satisfied
with their supervisors. All functions showed high percentages of satisfied
employees with the supervision in the firm.
Page 55
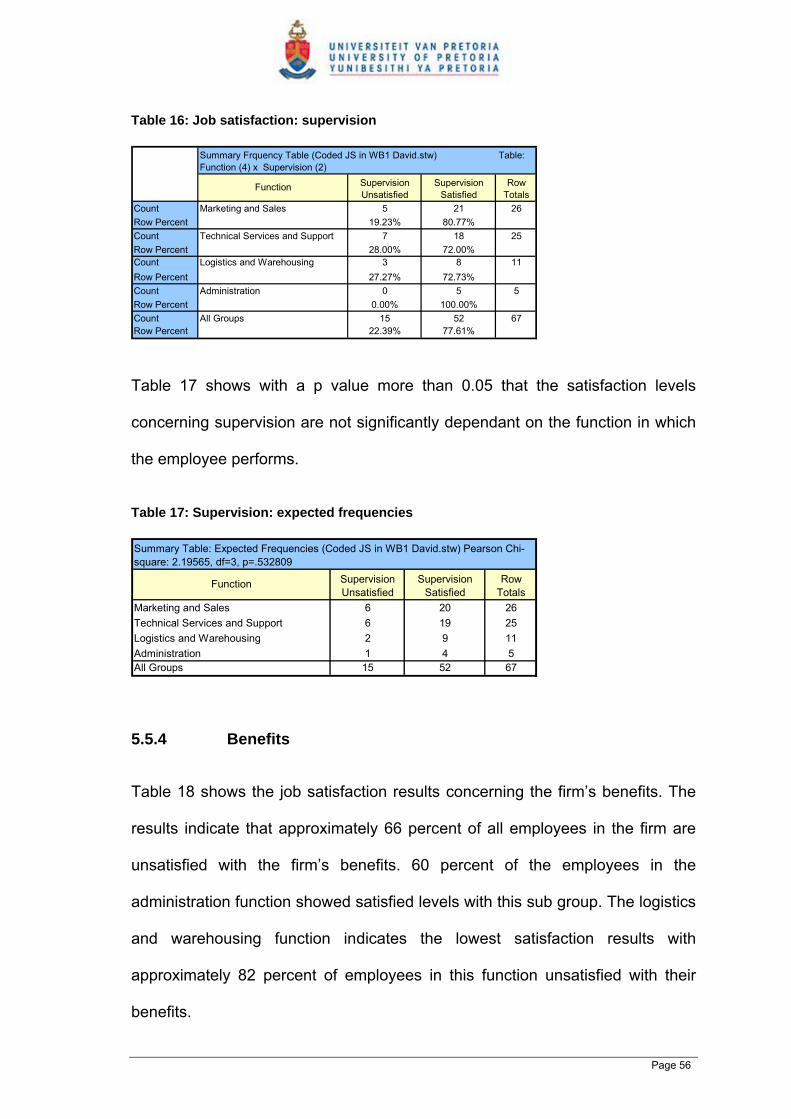
Table 16: Job satisfaction: supervision
Count 5 21 26Row Percent 19.23% 80.77%Count 7 18 25Row Percent 28.00% 72.00%Count 3 8 11Row Percent 27.27% 72.73%Count 0 5 5Row Percent 0.00% 100.00%Count 15 52 67Row Percent 22.39% 77.61%
All Groups
Logistics and Warehousing
Administration
Technical Services and Support
Marketing and Sales
Function Supervision Unsatisfied
Supervision Satisfied
Row Totals
Summary Frquency Table (Coded JS in WB1 David.stw) Table: Function (4) x Supervision (2)
Table 17 shows with a p value more than 0.05 that the satisfaction levels
concerning supervision are not significantly dependant on the function in which
the employee performs.
Table 17: Supervision: expected frequencies
6 206 192 91 4
15 52 67All Groups
Logistics and WarehousingAdministration
Marketing and SalesTechnical Services and Support
Summary Table: Expected Frequencies (Coded JS in WB1 David.stw) Pearson Chi-square: 2.19565, df=3, p=.532809
Function Supervision Unsatisfied
Supervision Satisfied
Row Totals
2625115
5.5.4 Benefits
Table 18 shows the job satisfaction results concerning the firm’s benefits. The
results indicate that approximately 66 percent of all employees in the firm are
unsatisfied with the firm’s benefits. 60 percent of the employees in the
administration function showed satisfied levels with this sub group. The logistics
and warehousing function indicates the lowest satisfaction results with
approximately 82 percent of employees in this function unsatisfied with their
benefits.
Page 56
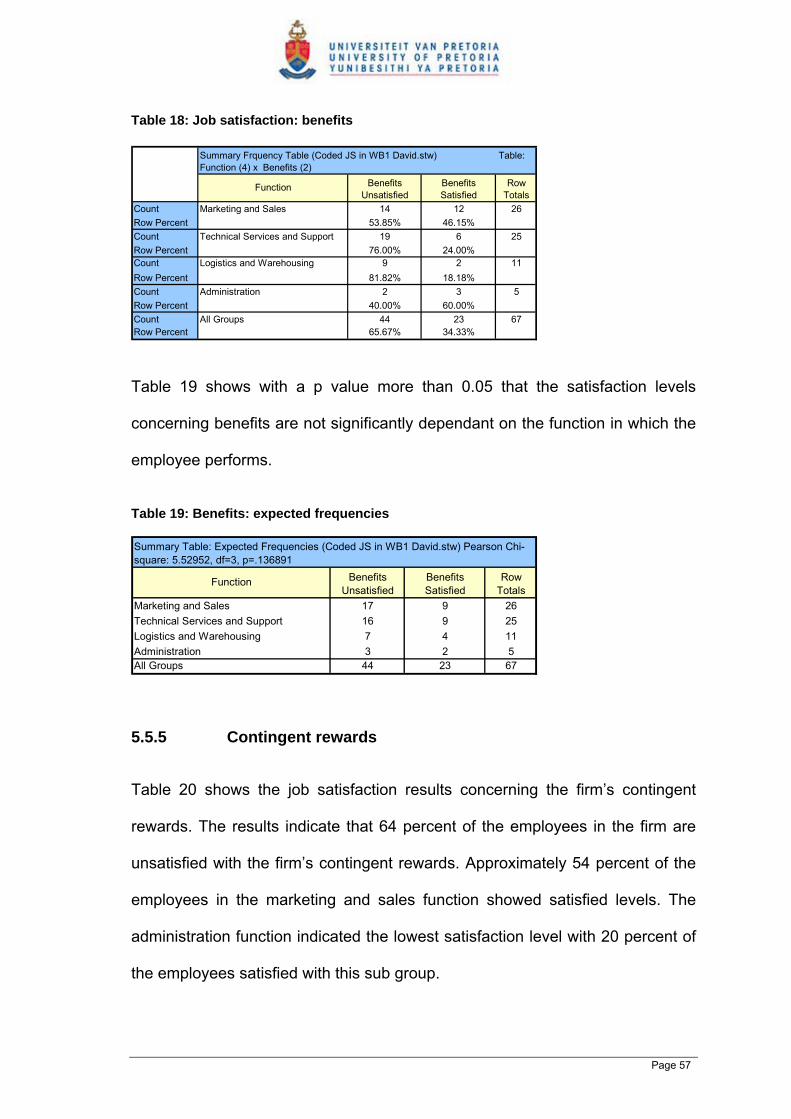
Table 18: Job satisfaction: benefits
Count 14 12 26Row Percent 53.85% 46.15%Count 19 6 25Row Percent 76.00% 24.00%Count 9 2 11Row Percent 81.82% 18.18%Count 2 3 5Row Percent 40.00% 60.00%Count 44 23 67Row Percent 65.67% 34.33%
All Groups
Logistics and Warehousing
Administration
Technical Services and Support
Marketing and Sales
Function Benefits Unsatisfied
Benefits Satisfied
Row Totals
Summary Frquency Table (Coded JS in WB1 David.stw) Table: Function (4) x Benefits (2)
Table 19 shows with a p value more than 0.05 that the satisfaction levels
concerning benefits are not significantly dependant on the function in which the
employee performs.
Table 19: Benefits: expected frequencies
17 9 2616 9 257 43 2
44 23 67All Groups
Logistics and WarehousingAdministration
Marketing and SalesTechnical Services and Support
Summary Table: Expected Frequencies (Coded JS in WB1 David.stw) Pearson Chi-square: 5.52952, df=3, p=.136891
Function Benefits Unsatisfied
Benefits Satisfied
Row Totals
115
5.5.5 Contingent rewards
Table 20 shows the job satisfaction results concerning the firm’s contingent
rewards. The results indicate that 64 percent of the employees in the firm are
unsatisfied with the firm’s contingent rewards. Approximately 54 percent of the
employees in the marketing and sales function showed satisfied levels. The
administration function indicated the lowest satisfaction level with 20 percent of
the employees satisfied with this sub group.
Page 57

Table 20: Job satisfaction: contingent rewards
Count 12 14 26Row Percent 46.15% 53.85%Count 19 6 25Row Percent 76.00% 24.00%Count 8 3 11Row Percent 72.73% 27.27%Count 4 1 5Row Percent 80.00% 20.00%Count 43 24 67Row Percent 64.18% 35.82%
All Groups
Logistics and Warehousing
Administration
Technical Services and Support
Marketing and Sales
Function C-Rewards Unsatisfied
C-Rewards Satisfied
Row Totals
Summary Frquency Table (Coded JS in WB1 David.stw) Table: Function (4) x Contingent Rewards (2)
Table 21 shows with a p value more than 0.05 that the satisfaction levels
concerning contingent rewards are not significantly dependant on the function in
which the employee performs.
Table 21: Contingent rewards: expected frequencies
17 9 2616 9 257 43 2
43 24 67All Groups
Logistics and WarehousingAdministration
Marketing and SalesTechnical Services and Support
Summary Table: Expected Frequencies (Coded JS in WB1 David.stw) Pearson Chi-square: 6.08811, df=3, p=.107408
Function C-Rewards Unsatisfied
C-Rewards Satisfied
Row Totals
115
5.5.6 Operating procedure
Table 22 shows the job satisfaction results concerning the firm’s operating
procedures. The results indicate that approximately 72 percent of the
employees in the firm are unsatisfied with the firms operating procedures. All
the functions indicated unsatisfied levels with regard to this sub group with the
technical services and sales having the lowest level of 88 percent unsatisfied
employees.
Page 58

Table 22: Job satisfaction: operating procedures
Count 16 10 26Row Percent 61.54% 38.46%Count 22 3 25Row Percent 88.00% 12.00%Count 6 5 11Row Percent 54.55% 45.45%Count 4 1 5Row Percent 80.00% 20.00%Count 48 19 67Row Percent 71.64% 28.36%
All Groups
Logistics and Warehouse
Administration
Technical Services and Support
Marketing and Sales
Function O-Procedure Unsatisfied
O-Procedure Satisfied
Row Totals
Summary Frquency Table (Coded JS in WB1 David.stw) Table: Function (4) x Operating Procedure (2)
Table 23 shows with a p value more than 0.05 that the satisfaction levels
concerning the firms operating procedures are not significantly dependant on
the function in which the employee performs.
Table 23: Operating procedures: expected frequencies
19 7 2618 7 258 34 1
48 19 67All Groups
Logistics and WarehousingAdministration
Marketing and SalesTechnical Services and Support
Summary Table: Expected Frequencies (Coded JS in WB1 David.stw) Pearson Chi-square: 6.35362, df=3, p=.095625
Function O-Procedure Unsatisfied
O-Procedure Satisfied
Row Totals
115
5.5.7 Co-workers
Table 24 shows the job satisfaction results concerning co-workers in the firm.
The results indicate that approximately 90 percent of the employees in the firm
are satisfied with their co-workers. No functional area showed major levels of
dissatisfaction is this regard.
Page 59
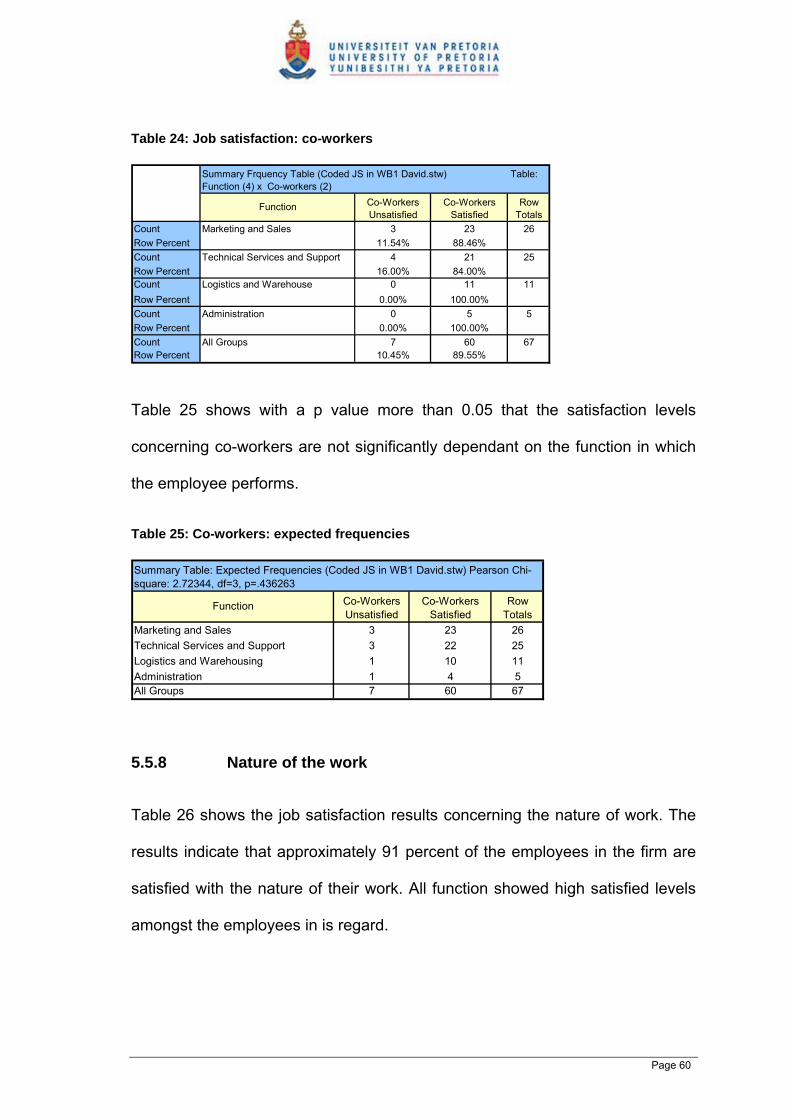
Table 24: Job satisfaction: co-workers
Count 3 23 26Row Percent 11.54% 88.46%Count 4 21 25Row Percent 16.00% 84.00%Count 0 11 11Row Percent 0.00% 100.00%Count 0 5 5Row Percent 0.00% 100.00%Count 7 60 67Row Percent 10.45% 89.55%
All Groups
Logistics and Warehouse
Administration
Technical Services and Support
Marketing and Sales
Function Co-Workers Unsatisfied
Co-Workers Satisfied
Row Totals
Summary Frquency Table (Coded JS in WB1 David.stw) Table: Function (4) x Co-workers (2)
Table 25 shows with a p value more than 0.05 that the satisfaction levels
concerning co-workers are not significantly dependant on the function in which
the employee performs.
Table 25: Co-workers: expected frequencies
3 233 221 101 47 60All Groups
Logistics and WarehousingAdministration
Marketing and SalesTechnical Services and Support
Summary Table: Expected Frequencies (Coded JS in WB1 David.stw) Pearson Chi-square: 2.72344, df=3, p=.436263
Function Co-Workers Unsatisfied
Co-Workers Satisfied
Row Totals
2625115
67
5.5.8 Nature of the work
Table 26 shows the job satisfaction results concerning the nature of work. The
results indicate that approximately 91 percent of the employees in the firm are
satisfied with the nature of their work. All function showed high satisfied levels
amongst the employees in is regard.
Page 60

Table 26: Job satisfaction: nature of the work
Count 1 25 26Row Percent 3.85% 96.15%Count 4 21 25Row Percent 16.00% 84.00%Count 1 10 11Row Percent 9.09% 90.91%Count 0 5 5Row Percent 0.00% 100.00%Count 6 61 67Row Percent 8.96% 91.04%
All Groups
Logistics and Warehousing
Administration
Technical Services and Support
Marketing and Sales
Function N of Work Unsatisfied
N of Work Satisfied
Row Totals
Summary Frquency Table (Coded JS in WB1 David.stw) Table: Function (4) x Nature of work (2)
Table 27 shows with a p value more than 0.05 that the satisfaction levels
concerning the nature of the work are not significantly dependant on the
function in which the employee performs.
Table 27: Nature of the work: expected frequencies
2 242 231 100 56 61All Groups
Logistics and WarehousingAdministration
Marketing and SalesTechnical Services and Support
Summary Table: Expected Frequencies (Coded JS in WB1 David.stw) Pearson Chi-square: 2.84619, df=3, p=.415957
Function N of Work Unsatisfied
N of Work Satisfied
Row Totals
2625115
67
5.5.9 Communication
Table 28 shows the job satisfaction results concerning communication within
the firm. The results indicate that approximately 54 percent of the employees in
the firm are unsatisfied with the firm’s communication. The administration and
the marketing and sales functions showed higher than average satisfaction
percentages with values of 60 percent and 65 percent respectively. The
logistics and warehousing function showed the highest unsatisfied level with 72
Page 61
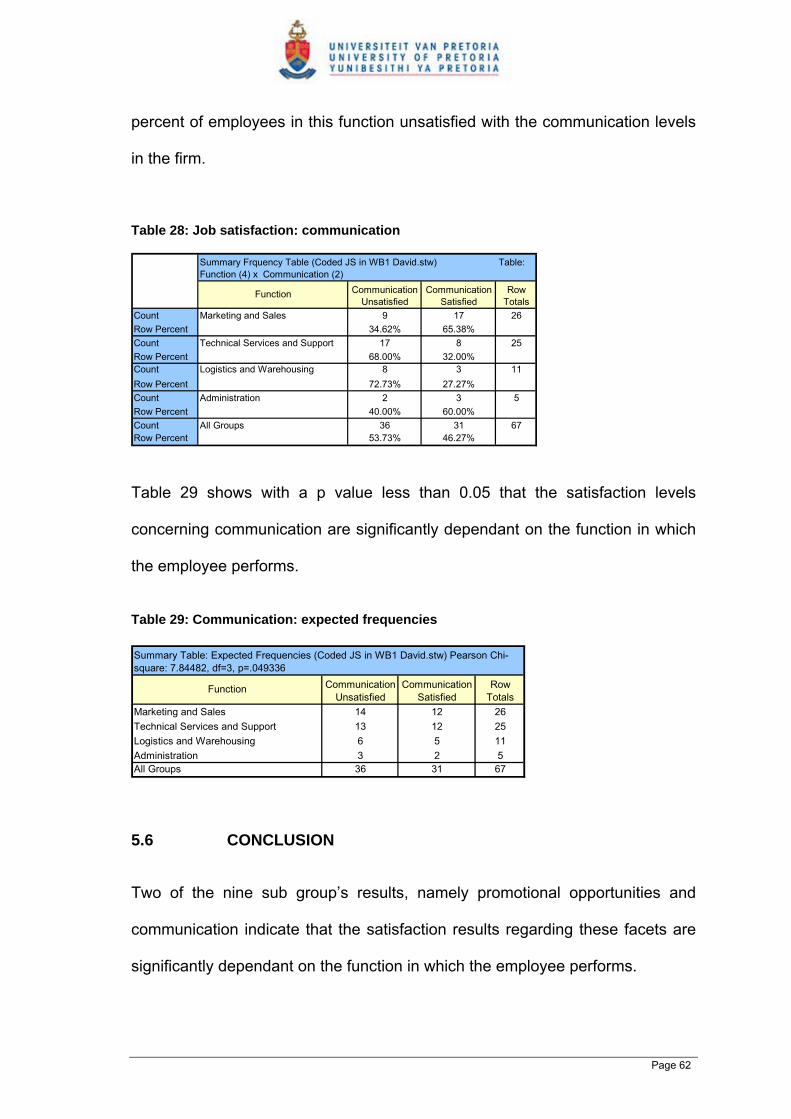
percent of employees in this function unsatisfied with the communication levels
in the firm.
Table 28: Job satisfaction: communication
Count 9 17 26Row Percent 34.62% 65.38%Count 17 8 25Row Percent 68.00% 32.00%Count 8 3 11Row Percent 72.73% 27.27%Count 2 3 5Row Percent 40.00% 60.00%Count 36 31 67Row Percent 53.73% 46.27%
All Groups
Logistics and Warehousing
Administration
Technical Services and Support
Marketing and Sales
Function Communication Unsatisfied
Communication Satisfied
Row Totals
Summary Frquency Table (Coded JS in WB1 David.stw) Table: Function (4) x Communication (2)
Table 29 shows with a p value less than 0.05 that the satisfaction levels
concerning communication are significantly dependant on the function in which
the employee performs.
Table 29: Communication: expected frequencies
14 12 2613 12 256 53 236 31 67All Groups
Logistics and WarehousingAdministration
Marketing and SalesTechnical Services and Support
Summary Table: Expected Frequencies (Coded JS in WB1 David.stw) Pearson Chi-square: 7.84482, df=3, p=.049336
Function Communication Unsatisfied
Communication Satisfied
Row Totals
115
5.6 CONCLUSION
Two of the nine sub group’s results, namely promotional opportunities and
communication indicate that the satisfaction results regarding these facets are
significantly dependant on the function in which the employee performs.
Page 62
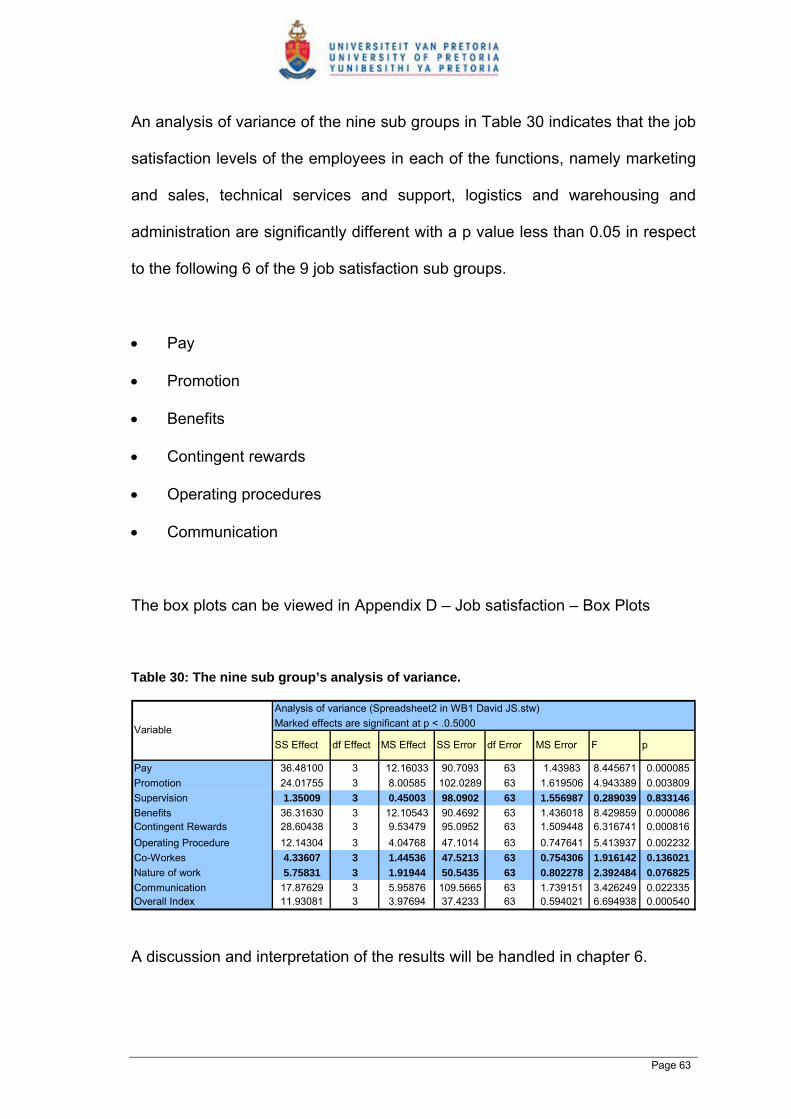
An analysis of variance of the nine sub groups in Table 30 indicates that the job
satisfaction levels of the employees in each of the functions, namely marketing
and sales, technical services and support, logistics and warehousing and
administration are significantly different with a p value less than 0.05 in respect
to the following 6 of the 9 job satisfaction sub groups.
• Pay
• Promotion
• Benefits
• Contingent rewards
• Operating procedures
• Communication
The box plots can be viewed in Appendix D – Job satisfaction – Box Plots
Table 30: The nine sub group’s analysis of variance.
Pay 36.48100 3 12.16033 90.7093 63 1.43983 8.445671 0.000085Promotion 24.01755 3 8.00585 102.0289 63 1.619506 4.943389 0.003809Supervision 1.35009 3 0.45003 98.0902 63 1.556987 0.289039 0.833146Benefits 36.31630 3 12.10543 90.4692 63 1.436018 8.429859 0.000086Contingent Rewards 28.60438 3 9.53479 95.0952 63 1.509448 6.316741 0.000816Operating Procedure 12.14304 3 4.04768 47.1014 63 0.747641 5.413937 0.002232Co-Workes 4.33607 3 1.44536 47.5213 63 0.754306 1.916142 0.136021Nature of work 5.75831 3 1.91944 50.5435 63 0.802278 2.392484 0.076825Communication 17.87629 3 5.95876 109.5665 63 1.739151 3.426249 0.022335Overall Index 11.93081 3 3.97694 37.4233 63 0.594021 6.694938 0.000540
SS Error df Error MS Error F pVariable
Analysis of variance (Spreadsheet2 in WB1 David JS.stw)Marked effects are significant at p < .0.5000
SS Effect df Effect MS Effect
A discussion and interpretation of the results will be handled in chapter 6.
Page 63
CHAPTER 6
DISCUSSION OF RESULTS
6.1 INTRODUCTION
This section discusses the findings presented in the previous chapter to the
research problem discussed in chapters 1 and 3 and reviewed in chapter 2.
6.2 REVIEW OF THE RESEARCH PROBLEM
When measured at the job level, does the level of employee job satisfaction
bear any relation to the satisfaction levels experienced by the customer in a
South African firm?
The early work performed in this field by Schneider et al. (1980), Schneider and
Bowen (1985), Tornow and Wiley (1991) and Wiley (1991) all offer support for
the relationship between employee satisfaction and customer satisfaction, but
generally focus on the consumer and service industries. Their research
concentrates specifically on the relationship between employee satisfaction and
customer satisfaction at the organisational or departmental levels, taking the
service level aspects of the firm into account. There is limited research into the
relationship between customer satisfaction and job satisfaction at the job
characteristic level and across different functions within the firm.
Dormann and Kaiser (2002) highlight that one of the major shortcomings in the
research on the relationship between job conditions and customer satisfaction
Page 64

is the limited empirical analyses at the organisational or branch level and
indicate that although their findings are encouraging, they still did not know
much about the mechanisms through which job conditions may effect customer
satisfaction. Owing to its positive relationship with organisational measures
such as employee productivity, job satisfaction has gained in importance as a
dependant variable and could lead to controlled benefits for the firm, including
increased profits and improved performance.
A better understanding into this relationship at a job characteristic and
business-to-business level will add to the limited research currently available in
this field.
6.3 RESEARCH QUESTION
Is there a relationship between job satisfaction and customer satisfaction
in a South African firm?
The relationship between job satisfaction and customer satisfaction are
discussed in this section and in the following way.
• The relationships comparing the overall results between the employee and
customer satisfaction levels using proportions. The same relationships will
be compared and discussed at the functional level, namely administration,
delivery, sales consultants and after sales services.
Page 65
• Discussing the results of the rank order relationship between functions
within the firm.
6.3.1 Proportions
The results are discussed at two levels, firstly comparing the firms overall
customer and job satisfaction levels and secondly comparing the overall
satisfaction levels within the functional areas of the firm.
6.3.1.1 Overall satisfaction
Figure 9 graphically compares the overall satisfaction results of the surveys and
shows little relationship between the overall percentages of satisfied employees
and the overall percentages of satisfied customers. 73 percent of the
customers, representing the majority of the customers sampled, were satisfied
with the firms performance whereas only 46 percent of the employees in the
firm were deemed satisfied with their job conditions. This represents the
minority of employees sampled.
The results in Figure 9 indicate a weak to no relationship existing between the
overall job satisfaction levels of the employees and the overall satisfaction
levels of the customers within a business-to-business context.
The results support the work performed by Schneider (1991), Tornow and Wiley
(1991) and Wiley (1991) in as much as when the employee satisfaction levels
were measured using human resource facets; that is, at the job level of the firm
such as pay and benefits, a weak relationship was found between the two.
Page 66
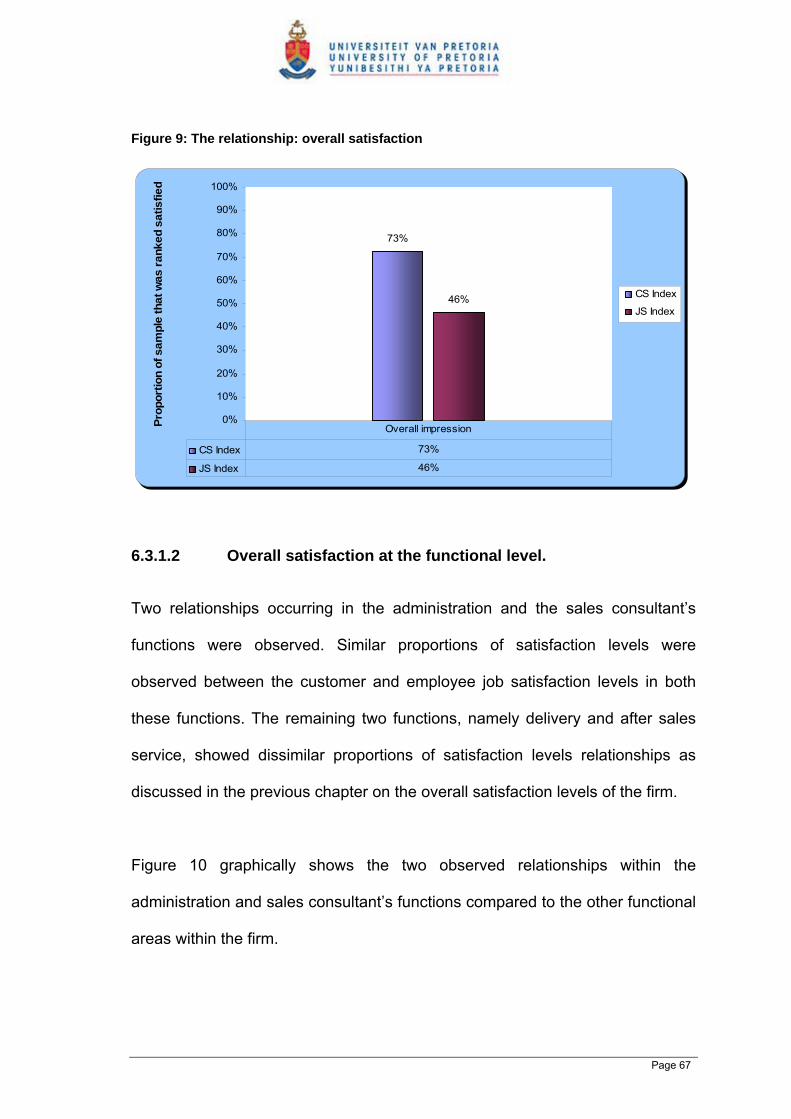
Figure 9: The relationship: overall satisfaction
73%
46%
0%
10%
20%
30%
40%
50%
60%
70%
80%
90%
100%
Prop
ortio
n of
sam
ple
that
was
rank
ed s
atis
fied
CS Index
JS Index
CS Index 73%
JS Index 46%
Overall impression
6.3.1.2 Overall satisfaction at the functional level.
Two relationships occurring in the administration and the sales consultant’s
functions were observed. Similar proportions of satisfaction levels were
observed between the customer and employee job satisfaction levels in both
these functions. The remaining two functions, namely delivery and after sales
service, showed dissimilar proportions of satisfaction levels relationships as
discussed in the previous chapter on the overall satisfaction levels of the firm.
Figure 10 graphically shows the two observed relationships within the
administration and sales consultant’s functions compared to the other functional
areas within the firm.
Page 67
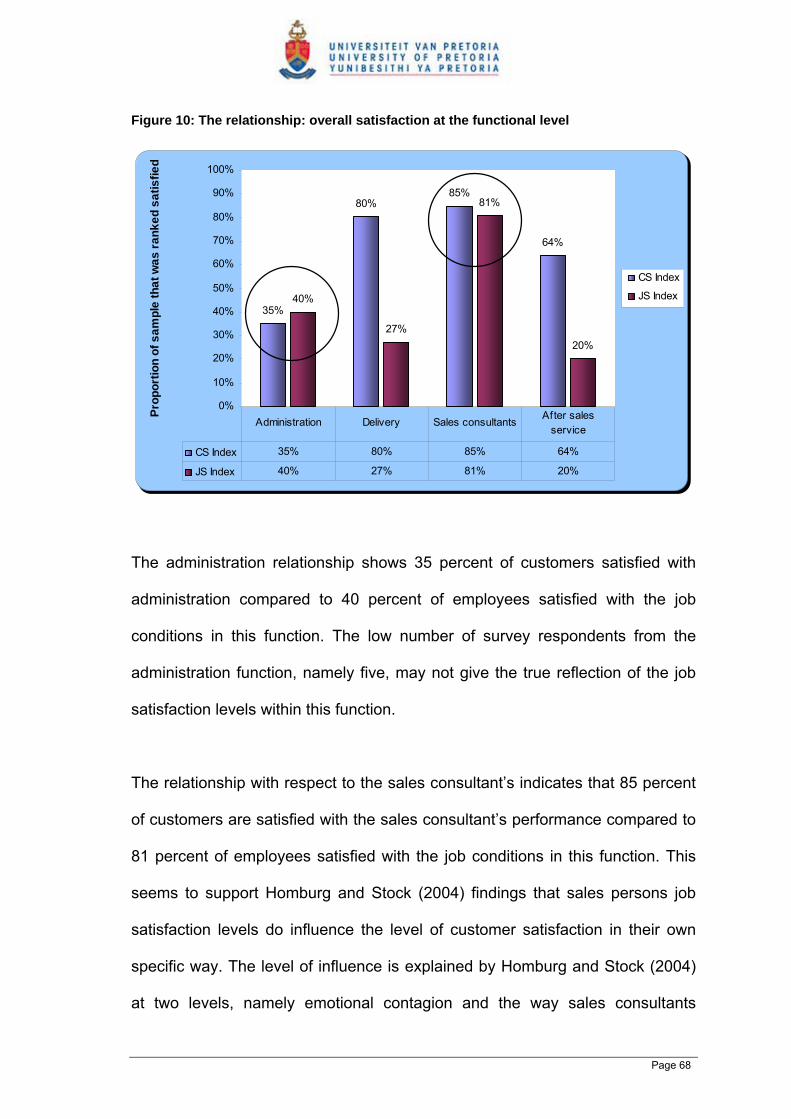
Figure 10: The relationship: overall satisfaction at the functional level
35%
80%85%
64%
40%
27%
81%
20%
0%
10%
20%
30%
40%
50%
60%
70%
80%
90%
100%Pr
opor
tion
of s
ampl
e th
at w
as ra
nked
sat
isfie
d
CS Index
JS Index
CS Index 35% 80% 85% 64%
JS Index 40% 27% 81% 20%
Administration Delivery Sales consultants After sales service
The administration relationship shows 35 percent of customers satisfied with
administration compared to 40 percent of employees satisfied with the job
conditions in this function. The low number of survey respondents from the
administration function, namely five, may not give the true reflection of the job
satisfaction levels within this function.
The relationship with respect to the sales consultant’s indicates that 85 percent
of customers are satisfied with the sales consultant’s performance compared to
81 percent of employees satisfied with the job conditions in this function. This
seems to support Homburg and Stock (2004) findings that sales persons job
satisfaction levels do influence the level of customer satisfaction in their own
specific way. The level of influence is explained by Homburg and Stock (2004)
at two levels, namely emotional contagion and the way sales consultants
Page 68
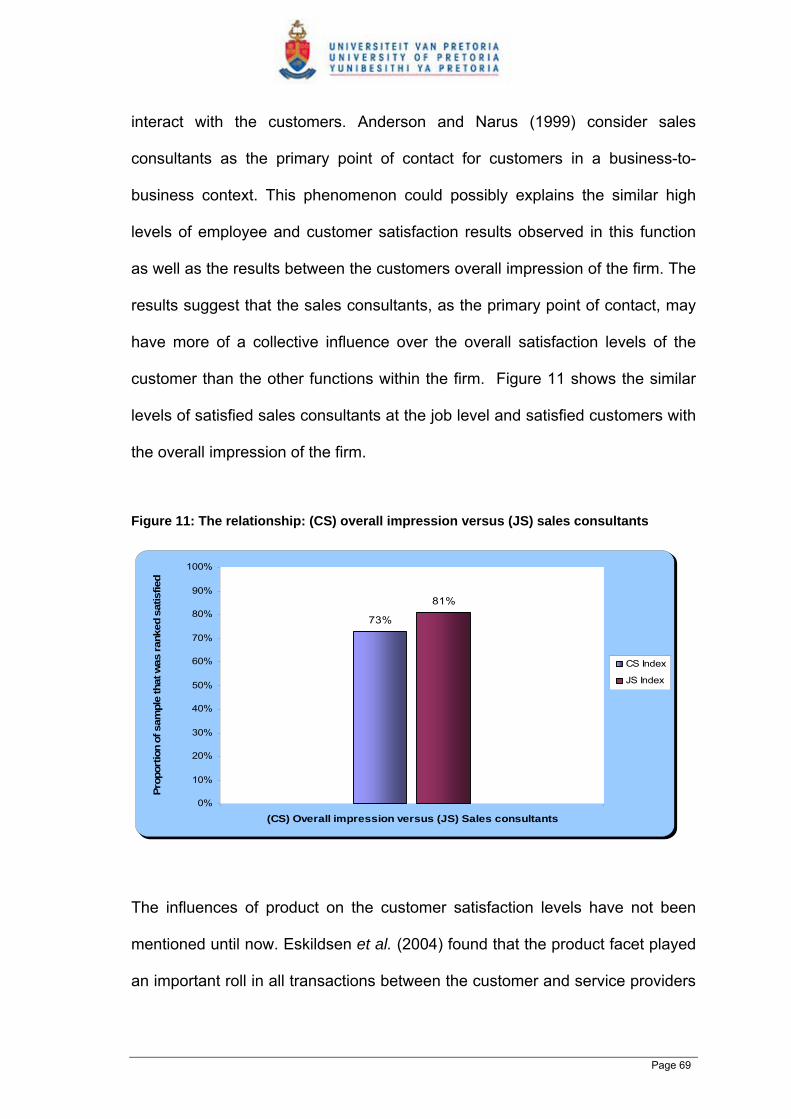
interact with the customers. Anderson and Narus (1999) consider sales
consultants as the primary point of contact for customers in a business-to-
business context. This phenomenon could possibly explains the similar high
levels of employee and customer satisfaction results observed in this function
as well as the results between the customers overall impression of the firm. The
results suggest that the sales consultants, as the primary point of contact, may
have more of a collective influence over the overall satisfaction levels of the
customer than the other functions within the firm. Figure 11 shows the similar
levels of satisfied sales consultants at the job level and satisfied customers with
the overall impression of the firm.
Figure 11: The relationship: (CS) overall impression versus (JS) sales consultants
73%
81%
0%
10%
20%
30%
40%
50%
60%
70%
80%
90%
100%
(CS) Overall impression versus (JS) Sales consultants
Prop
ortio
n of
sam
ple
that
was
rank
ed s
atis
fied
CS Index
JS Index
The influences of product on the customer satisfaction levels have not been
mentioned until now. Eskildsen et al. (2004) found that the product facet played
an important roll in all transactions between the customer and service providers
Page 69

in a business-to-business environment, but which was not the case when it
came to service quality which included the facet of employee job satisfaction.
These findings suggest that the product has a larger influence over the overall
satisfaction levels experienced by the customers than any employee job
satisfaction level did. The product in this sample obtained a mean customer
satisfaction score of 3.21, with satisfaction levels in approximately 90 percent of
the customers surveyed.
To credit the moderate to high customer satisfaction levels directly to the high
percentages of satisfied sales consultant’s without taking into account the
influences the product and the quality thereof may have on the results, would
be unfound at this stage.
Eskildsen et al. (2004) mentions that service quality, which includes the job
satisfaction facet, is also important in environments where higher degrees of
personal interaction exist between customers and employees. Figure 12
compares two functions namely sales consultants and after sales service where
equally high levels of interaction between employees and customers exist. The
results indicate that the low job satisfaction results observed in the after sales
service functions do not result in similar low and proportional customer
satisfaction levels.
This would suggest that employee job satisfaction levels do not affect the
customer satisfaction levels proportionally in this instance.
Page 70

Figure 12: The relationship: sales consultants versus after sales service
85%
64%
81%
20%
0%
10%
20%
30%
40%
50%
60%
70%
80%
90%
100%Pr
opor
tion
of s
ampl
e th
at w
as ra
nked
sat
isfie
d
CS Index
JS Index
CS Index 85% 64%
JS Index 81% 20%
Sales consultants After sales service
Although the job satisfaction results of the sales consultants indicate a high
proportional relationship with the overall satisfaction levels of the customer,
enough data suggests that low percentages of satisfied employees in their jobs,
do not result in equally low percentages of satisfied customers. To conclude
that a moderate to strong relationship exists between the proportions of
satisfied employees and satisfied customers, in the case of the sales
consultants, is therefore unsubstantiated.
6.3.2 Rank order
The results in section 5.4.3 of page 48 indicate that a strong and significant
relationship exists between the ranked order of the different functions when
comparing the employee job and customer satisfaction results. An 81 percent
correlation with a significance of p = 0.049858 is observed.
Page 71
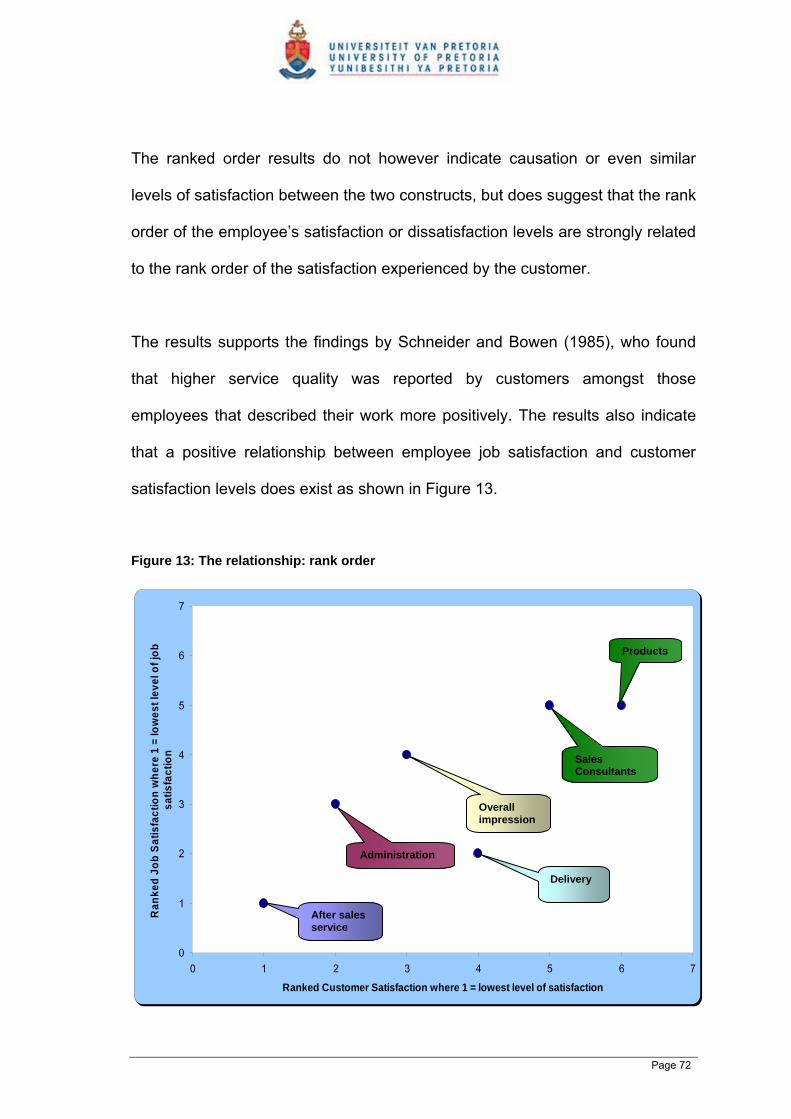
The ranked order results do not however indicate causation or even similar
levels of satisfaction between the two constructs, but does suggest that the rank
order of the employee’s satisfaction or dissatisfaction levels are strongly related
to the rank order of the satisfaction experienced by the customer.
The results supports the findings by Schneider and Bowen (1985), who found
that higher service quality was reported by customers amongst those
employees that described their work more positively. The results also indicate
that a positive relationship between employee job satisfaction and customer
satisfaction levels does exist as shown in Figure 13.
Figure 13: The relationship: rank order
0
1
2
3
4
5
6
7
0 1 2 3 4 5 6
Ranked Customer Satisfaction where 1 = lowest level of satisfaction
Ran
ked
Job
Satis
fact
ion
whe
re 1
= lo
wes
t lev
el o
f job
sa
tisfa
ctio
n
7
Products
Sales Consultants
Overall impression
Delivery
Administration
After sales service
Page 72
The strong rank order correlation in the results supports the work by Dormann
and Kaiser (2002), Tornow and Wiley (1991) and Bernhardt et al (2000) in as
far as employee job dissatisfaction levels reduce customer satisfaction levels in
the consumer industry and indicate that when the employee job satisfaction
levels are significantly different within the different functions of the firm, for
example in the case of the after sales service, the customer satisfaction results
for this function correlated in a rank order fashion to the level of job satisfaction
experience by the employees.
It’s worth noting that when the employee job satisfaction levels in the different
functions of the firm were significantly different from one another, the customer
satisfaction levels were significantly different in some instances, following a
similar trend from the lowest to highest as indicated in Figure 13.
Significant differences in the customer satisfaction results were found in the
following instances and described in section 5.3 on page 41.
• The customer satisfaction results were significantly lower in the
administration function compared to the delivery, the products and the
sales consultants functions, with a tested significance values of p =
0.01691, p = 0.00040 and p = 0.01071 respectively.
• The customer satisfaction results were significantly lower in the after sales
service function compared to the delivery, the products, the sales
consultants and the overall impression of the firm, with tested significance
Page 73
values of p = 0.00087, p = 0.00001, p = 0.00061 and p = 0.03612
respectively.
• The results in respect to the overall impression of the firm, although not
significantly lower compared to the products, were relatively close with a
tested significance value of p = 0.05474. It was therefore included in the
results.
A strong and significant relationship exists between the rank order of the
different functions within the firm, when comparing the employees job and
customers satisfaction results. It does not however indicate equal or even
similar levels of satisfaction between the two constructs, but does suggest that
the employee’s satisfaction or dissatisfaction levels influence the level of
satisfaction experienced by the customer within the different functions of a
business-to-business firm.
6.3.3 The nine job sub groups
The results of the nine sub groups indicate that two of the nine were
significantly dependant on the functional area in which the employee worked.
The two sub groups were promotion and communication respectively.
A variance analysis of the nine sub groups is shown in Table 30 on page 63. It
reveals that the satisfaction levels of the employees were significantly different
in six of the nine sub groups thus substantiating the cause for the significantly
Page 74
different levels of job satisfaction experienced in the different functions of the
firm. Supervision, co-workers and the nature of the work show similar levels of
satisfaction within the different functions of the firm.
Whether the rank order relationship would exist, as described in section 6.3.2
on page 71, without significantly different job satisfaction levels amongst the
firm’s functions is unknown. The results do indicate however, that if the
employees from different functions within the same firm significantly view their
job conditions differently, then the satisfaction levels of the customer in respect
to each of the functions will be influenced accordingly and in some cases
significantly.
6.4 CONCLUSION
Although a weak relationship was observed between the percentages of
satisfied employees and satisfied customers in the survey, a strong and
significant relationship exists between the rank order of the different functions
within the firm, when comparing the employees job and customers satisfaction
results. This research consists of two primary samples measuring two concepts
and varying in scales. It was determined that a rank order would be a suitable
method to observe a relationship in this respect. The results suggest that the
job satisfaction levels of the employees in a business-to-business environment
influence to some degree the level of satisfaction experienced by the customer.
Page 75
CHAPTER 7
CONCLUSIONS
7.1 INTRODUCTION
This section summarises the research findings and presents recommendations
for those interested in investing time and effort into understanding and
increasing employee job-satisfaction levels within the firm and in the process
improving the overall customer relationship and satisfaction levels in their
environment.
7.2 MAIN FINDINGS
The research provides supports for a positive relationship between employee
job satisfaction and customer satisfaction levels within a South Africa firm and
in a business-to-business context.
7.2.1 Finding 1
At the organisation level, no relationship is observed when comparing the
overall percentages of satisfied employees with their job conditions and the
overall percentages of customers satisfied with the firm’s performance. The
overall satisfaction results were obtained from the summation of the different
functions within the firm.
Page 76

The results indicate that a majority of 73 percent of the customers were deemed
satisfied with the firms performance compared to a minority of 46 percent of the
employees satisfied with their job conditions. The results suggest that the
overall employee job satisfaction percentages has no or little bearing on the
overall satisfaction results experienced by the customer in the firm.
7.2.2 Finding 2
At the functional level, similar percentages of employees and customers were
observed between the job satisfaction results of the sales consultants and the
customer satisfaction results in respect to this function. The strength of the
relationship is inconclusive.
The results indicate that 85 percent of the customers surveyed were satisfied
with the sales consultant’s performance compared to 81 percent of the sales
consultant function surveyed were satisfied with the job conditions. Eskildsen et
al. (2004) mentioned that service quality, which includes the job satisfaction
facet, was important in environments where higher degrees of personal
interaction existed between customer and employees. This is true in the case of
the sales consultants function.
The observed relationship suggests that the sales consultant’s job satisfaction
levels have a bearing to some degree the overall satisfaction levels of the
customer. Anderson and Narus (1999) view that sales consultants are
considered the primary point of contact for customers in a business-to-business
Page 77
context could explain this moderate to high relationship between customer
satisfaction and employee job satisfaction results
Comparing two functions, namely sales consultants and after sales service,
where equally high levels of interaction between employees and customers
exist as described by Eskildsen et al. (2004), indicate that low job satisfaction
results present in the after sales service do not result in similar low customer
satisfaction results of equal proportion. Enough data suggests that low
percentages of satisfied employees in their jobs, do not result in equally low
percentages of satisfied customers. It does however suggest that additional
drivers are present in maintaining moderate to high customer satisfaction levels
than just the job satisfaction levels of the employees.
An overall weak relationship exists between the job satisfaction results of the
different functions compared to the satisfaction results of the customer.
7.2.3 Finding 3
The results indicate that a strong and significant relationship exists between the
ranked order of the different functions when comparing the employee job and
customer satisfaction results. An 81 percent correlation with a significance of p
= 0.049858 is observed.
The strong correlation primarily supports the work by Dormann and Kaiser
(2002), Tornow and Wiley (1991) and Bernhardt et al (2000) in as far as
employee job dissatisfaction levels reduce customer satisfaction levels in the
consumer industry.
Page 78

It can be concluded that a strong and significant relationship exists in this case,
but that equal or even similar levels of satisfaction between the two constructs
exist, is unsubstantiated.
7.2.4 Finding 4
The results reveal that when employee job satisfaction levels in the different
functions of the firm are significantly different from one another as described in
section 5.2 on page 37, the customer satisfaction levels in respect to the
specific function were significantly different in some instances.
Significant differences in the level of customer satisfaction were found in
respect to the administration function. The results showed significantly lower
levels of satisfaction compared to the delivery, products and the sales
consultants function.
Significant differences in the level of customer satisfaction were found in
respect to the after sales service function. The results showed significantly
lower levels of satisfaction compared to the delivery, products, sales
consultants and the overall impression of the firm. The overall impression of the
firm, although not significantly lower from the products, was close with a tested
significance value of p = 0.05474.
The results suggest that a customer can experience significantly different levels
of satisfaction, depending on which function the customer decides to interact
Page 79

with and if the employee’s job satisfaction levels between the different functions
are significantly different.
7.3 RECOMMENDATIONS TO MANAGERS
The research supports the positive relationship between employee job
satisfaction and customer satisfaction levels. The first recommendation is
addressed to senior managers who have an influence across the entire firm.
Work actively towards maintaining a similar level of job satisfaction through out
the firm. The results suggest that significantly different job satisfaction levels
contribute to an array of different customer satisfaction experiences when
interacting at the functional level. A consistent and similar customer satisfaction
experience, throughout the firm, would be difficult to maintain when internal job
satisfaction levels were significantly different and dependant on the function in
which the employee performed.
The positive relationship between the two constructs suggests that more
attention should be focused on the employee’s job design, with regards to the
nine sub groups, in improving this facet. Human resource practitioners and
managers are recommended to view job design with the same importance as
job selection and employee training and development.
The results indicate that customer satisfaction levels are higher in those
functions where employees described their work more positively. Line
Page 80
managers should be aware of the trend and actively pursue a job satisfaction
level amongst employees. Gain an understanding to the causes, the positive
and negative results as well as the measurement of job satisfaction levels within
a firm and develop an environment conducive to employee satisfaction as a
minimum. A brief review of the literature on job satisfaction is available in
chapter 2 of this report.
Schneider and Bowen (1985) found that those employees who described their
work more positively were less likely to resign. In this globally competitive
environment and were skills shortage is seen as one of South Africa’s “binding
constraints” (ASGISA, 2006 p. 16) to achieving global competitiveness, job
satisfaction tied in to employee turnover levels is recommended as a business
outcome measurement, not to mention a duty to the employees.
7.4 FUTURE RESEARCH
The research examines whether a relationship exist between employee job
satisfaction and customer satisfaction levels in a business-to-business context
and the results do suggest that such a relationship indeed exists in the South
African firm. An interesting investigation would be to apply the same research
methodology and extend the research over a number of similar firms within
South African environment to determine the reliability and validity of these
results.
Page 81

An investigation into whether significantly similar job satisfaction levels
throughout the firm have the same effects on the customer’s satisfaction levels
as significantly different job satisfaction levels within different function of the
firm.
Eskildsen et al. (2004) found that product quality was important in all
transactions between the customer and service providers, but which was not
the case with service quality, which included employee job satisfaction. The
results in this research indicate high levels of customer satisfaction with the
sales consultants as well as with the product and quality thereof. It would be
interesting to investigate how much on an influence sales consultants job
satisfaction has on the customer satisfaction levels compared to the product
performance and quality.
7.5 CONCLUSION
It is evident from the results in chapter 5 that a strong and significant
relationship exists between the ranked order of the different functions when
comparing the employee job and customer satisfaction results within a South
African firm. Although this research is small and isolated to a single firm, the
results suggest that the job satisfaction levels within the firm could have in
some cases a significant effect on the overall satisfaction levels experienced by
the customer in a business-to-business context.
Page 82
REFERENCE LIST
Anderson, J.C. and Narus, J.A. (1999) Business marketing management:
understanding, creating, and delivering value. Englewood Cliffs, NJ, Prentice
Hall.
Bakke, D.W. (2005) Joy at work: a revolutionary approach to fun on the job.
Seattle.
Bernhardt, K.L., Donthu, N. and Kennett, P.A. (2000) A longitudinal analysis of
satisfaction and profitability. Journal of Business Research, 47, 161-171
Brush, D.H., Moch, M.K., and Pooyan, A. (1987) Individual demographic
differences and job satisfaction. Journal of Occupational Behaviour, 8, 139-155.
Clark, A., Oswald, A., and Warr, P. (1996) is job satisfaction u-shaped in age?
Journal of Occupational and Organisational Psychology, 69, 57-81
Dormann, C. and Kaiser, D.M. (2002) Job conditions and customer satisfaction.
European Journal of work and organisational psychology, 11(2), 257-283
Drucker, P.F. (2002) they’re not employees, they’re people. Harvard Business
Review, February, 70 – 77
Eskildsen, J., Kristensen, K., Juhl, H.J. and Østergaard, P. (2004) The drivers
of customer satisfaction and loyalty. The case of Demark 2000-2002. Total
Quality Management, 15 (5-6), 859 - 868
Frei, F.X. (2008) the four things a service business must get right. Harvard
business Review, April, 70 -80
Page 83
Harter, J.W., Schmidt, F.L. and Hayes, T.L. (2002). Business-unit-level
relationship between employee satisfaction, employee engagement, and
business outcomes: a meta-analysis. Journal of Applied Psychology, 87 (2),
268 - 279
Hallowell, R., Schlesinger, L.A. and Zornitsky, J. (1996) Internal service quality,
customer and job satisfaction: linkages and implications for management.
Human Resource Planning, 19 (2), 20-31
Hernon, P., Nitecki, D.A. and Altman, E. (1999) Service quality and customer
satisfaction: an assessment and future directions. The Journal of Academic
Librarianship, 25 (1), 9-17
Heskett, J.L., Jones, T.O., Loveman, G.W., Sasser, W.E. and Schlesinger, L.A.
(1994) Putting the Service-Profit chain to work. Harvard Business Review,
March - April, 164 -174
Hofstede, G. (1985) The interaction between national and organisational value
systems. Journal of Management Studies, 22, 347 – 357
Homburg, C. and Stock, R.M. (2004) the link between salespeople’s job
satisfaction and customer satisfaction in a business-to-business context: A
dyadic analysis. Journal of the Academy of Marketing Science, 32 (2), 144-158
Jackson, S.E. and Schuler, R.S. (1985) A meta-analysis and conceptual critique
of research on role ambiguity and role conflict in work settings. Organisational
Behaviour and Human Decision Processes, 36, 16 -78
Judge, T.A. and Bono, J.E. (2001) Relationship of core self-evaluation traits –
self esteem, generalised self – efficacy, locus of control, and emotional stability
– with job satisfaction and job performance: a meta-analysis. Journal of Applied
Psychology, 86, 80 – 92
Page 84
Judge, T.A., Heller, D. and Mount, M. K. (2002) Five-factor model of personality
and job satisfaction. a meta–analysis. Journal of Applied Psychology, 87, 530 –
541
Judge, T.A., Thoresen, C.J., Bono, J.E. and Patton, G.K (2001) the job
satisfaction-job performance relationship: a qualitative and quantitative review.
Psychological Bulletin, 127, 376 – 407
Judge, T.A. and Watanabe, S. (1994) Individual differences in the nature of the
relationship between job and life satisfaction. Journal of Occupational and
Organisational Psychology, 67, 101 - 107
Kotler, P. and Keller, K.L. (2007) A framework for marketing management. Upper
Saddle River, New Jersey.
Kristensen, K., Kanji, G.K. and Dahlgaard, J.J. (1992) On measurement of
customer satisfaction. Total Quality Management, 3 (2), 123 -128
O'Connor, E.J., Peters, L.H., Rudolf, C.J., and Pooyan, A. (1982) Situational
constraints and employee affective reactions: a partial field replication. Group
and Organisational studies, 7, 418 – 428
Parasuraman, S., Greenhaus, J.H., and Granrose, C.S. (1992) Role stressors,
social support, and well-being among two-career couples. Journal of
Organisational Behaviour, 13, 339 – 356
Reichheld, F. (2006) The ultimate question: driving good profits and true
growth. Boston, Massachusetts.
Rice, R.W., Frone, M.R., and McFarlin, D.B. (1992) Work-nonwork conflict and
the perceived quality of life. Journal of applied psychology, 75, 386 - 393
Page 85

Robbins, S.P. and Judge, T.A. (2007) Organisational behaviour. Upper Saddle
River, New Jersey.
Saari, L.M. and Judge, T.A. (2004) Employee attitudes and job satisfaction.
Human Resource Management, 43 (4), 395 - 407
Schlesinger, L.A. and Zornitsky, J. (1991) Job satisfaction, service capability
and customer satisfaction: an examination of the linkages and management
implications. Human Resource Planning, 14(2), 141-149
Schneider, B. (1991) Service quality and profits: can you have your cake and
eat it too? Human Resource Planning, 14 (2), 151-157
Schneider, B. and Bowen, D.E. (1985) “Employee and customer perceptions of
service in banks: replication and extension.” Journal of applied psychology, 70,
423-433
Schneider, B., Parkington, J.J. and Buxton, V.M. (1980) “Employee and
customer perceptions of service in banks.” Administrative Science Quarterly,
25, 252-267
South African Government information (2008) Key issues - accelerated and
shared growth initiative for South Africa (AsgiSA).
http://www.info.gov.za/asgisa/ (accessed 15/8/2008)
Spector, P.E. (1985) Measurement of human service staff satisfaction:
development of the job satisfaction survey. Am J Community psycho, 13, 693 -
713.
Spector, P.E. (1997) Job Satisfaction, application, assessment, causes and
consequences. Thousand Oaks, London.
Page 86
Tornow, W.W. and Wiley, J.W. (1991) Service quality and management
practices: a look at employee attitudes, customer satisfaction, and bottom-line
consequences. Human Resource Planning, 14, 105 -115
Van Saane, N., Sluiter, J.K., Verbeek, J.H.A.M. and Frings-Dresen, M.H.W.
(2003) Reliability and validity of instruments measuring job satisfaction – a
systematic review. Occupational Medicine, 53, 191-200.
Wiley, J.W. (1991) Customer satisfaction: a supportive work environment and
its financial cost. Human resource planning, 14 (2), 117-127.
Zikmund, W.G. (2003) Business research methods. Southern Western,
Thomson Learning TM.
Page 87
APPENDICES
Appendix A – The job satisfaction survey
Introductory letter – Survey Questionnaire
To Whom It May Concern:
I am currently conducting academic research, the purpose of which is to examing therelationship between Job Satisfaction and Customer Satisfaction in a South African Firm.Theresearch will foucs on the overall satisfaction levels in question and will not focus on anyindividual in specific.
You have been requested to participate in this research to aid in the understanding of theabovementioned releationships between Job Satisfaction and Customer Satisfaction. Thequestionnaire should take no more than 20 minutes to complete. Your participation isvoluntary, and you can withdraw at any time without penalty. All data will be kept confidentialand your participation in the survey will be conducted in an anonymous way. The overallresearch results will be made available in the form of a research report and will be madepublically available for review.
By completing the questionnaire, you indicate that you voluntarily participate in this research.If you have any queries or concerns regarding the research, please feel free to contact me.My details are listed below.
David Stanford (Researcher)[email protected] .comCell 0836312429
Page 88
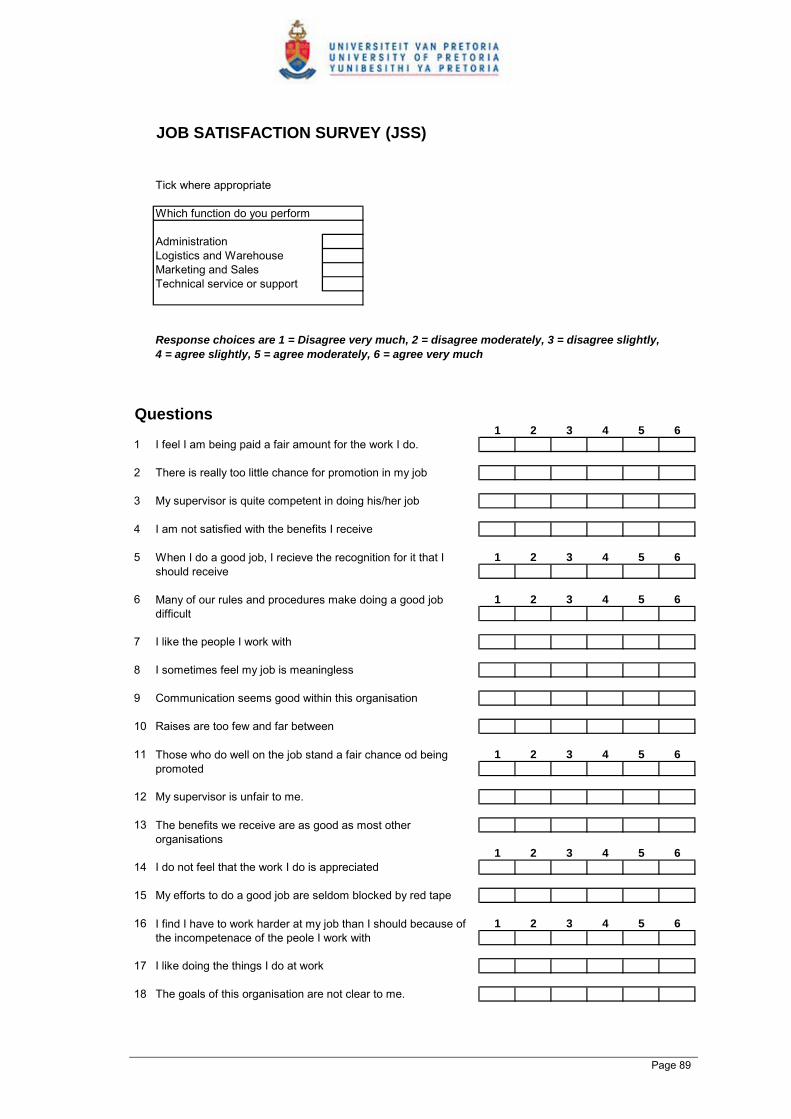
Tick where appropriate
AdministrationLogistics and WarehouseMarketing and SalesTechnical service or support
Questions1 2 3 4 5 6
1 I feel I am being paid a fair amount for the work I do.
2 There is really too little chance for promotion in my job
3 My supervisor is quite competent in doing his/her job
4 I am not satisfied with the benefits I receive
5 1 2 3 4 5 6
6 1 2 3 4 5 6
7 I like the people I work with
8 I sometimes feel my job is meaningless
9 Communication seems good within this organisation
10 Raises are too few and far between
11 1 2 3 4 5 6
12 My supervisor is unfair to me.
13
1 2 3 4 5 614 I do not feel that the work I do is appreciated
15 My efforts to do a good job are seldom blocked by red tape
16 1 2 3 4 5 6
17 I like doing the things I do at work
18 The goals of this organisation are not clear to me.
JOB SATISFACTION SURVEY (JSS)
Which function do you perform
Response choices are 1 = Disagree very much, 2 = disagree moderately, 3 = disagree slightly, 4 = agree slightly, 5 = agree moderately, 6 = agree very much
When I do a good job, I recieve the recognition for it that I should receive
Many of our rules and procedures make doing a good job difficult
Those who do well on the job stand a fair chance od being promoted
The benefits we receive are as good as most other organisations
I find I have to work harder at my job than I should because of the incompetenace of the peole I work with
Page 89

19 1 2 3 4 5 6
20 People get ahead as fast here as they do in other places
21 1 2 3 4 5 6
22 The benefit package we have is equitable
23 There are few rewards for those who work here
24 I have too much to do at work
25 I enjoy my co workers
26 1 2 3 4 5 6
27 I feel a sense of pride in doing my job
28 I feel satisfied with my chances for salary increases
29 There are benefits we do not have which we should have
30 I like my supervisor
31 I have too much paperwork
32 I don't feel my efforts are rewarded the way they should be
I often feel that I do not know what is going on with the organisation
I feel unappreciated by the organisation when I think about what they pay me
My supervisor shows too little interest in the feelings of subordinates
Page 90
Appendix B – The customer satisfaction survey
Introductory letter – Survey Questionnaire
To Whom It May Concern:
I am currently conducting academic research, the purpose of which is to examing therelationship between Job Satisfaction and Customer Satisfaction in a South African Firm.Theresearch will foucs on the overall satisfaction levels in question and will not focus on anyindividual business in specific.
By completing the questionnaire, you indicate that you voluntarily participate in this research.If you have any queries or concerns regarding the research, please feel free to contact me.My details are listed below.
David Stanford (Researcher)[email protected] .comCell 0836312429
Page 91

Response choices are 1 = Very Dissatisfied, 2 = Dissatisfied, 3 = Satisfied, 4 = Very Satisfied.
Questions
1 2 3 41
2
3
4
5
6
7
8
9
10
11
12
13
14
15
Overall Impression
16
17
18
Aftermarket and service
How satisfied are you with the quality of our repair and workmanship
How satisfied are you with the aftermarket support and waiting time
How satisfied are you with our aftermarkets willingness to assit and solve your problem
Sales consultants
How satisfied are you with our sales teams with regards to product knowledge
How satisfied are you with our sales teams integrity and delivery on what was promised
How satisfied are you with our sales teams willingness to assist
Products
How satisfied are you with our ability to offer a total product solution
How satisfied are you with our products with regards to quality and reliability
How satisfied are you with the quality of our documentation
Delivery
How satisfied are you with our delivery with regards to the number of errors
How satisfied are you with our delivery with regards to equipment being delivered damaged
How satisfied are you in using us as your first choice of purchase
How satisfied are you in refering us and our services to a friend
How satisfied are you overall
CUSTOMER SATISFACTION SURVEY
Administration
How satisfied are you with our telephone etiquette in respect of professionalism, transfering and time taken to be assisted.
How satisfied are you with the easy of doing business with us
How satisfied are you with our ability to keep you informed and up to date
How satisfied are you with our delivery with regards to being on time.
Page 92
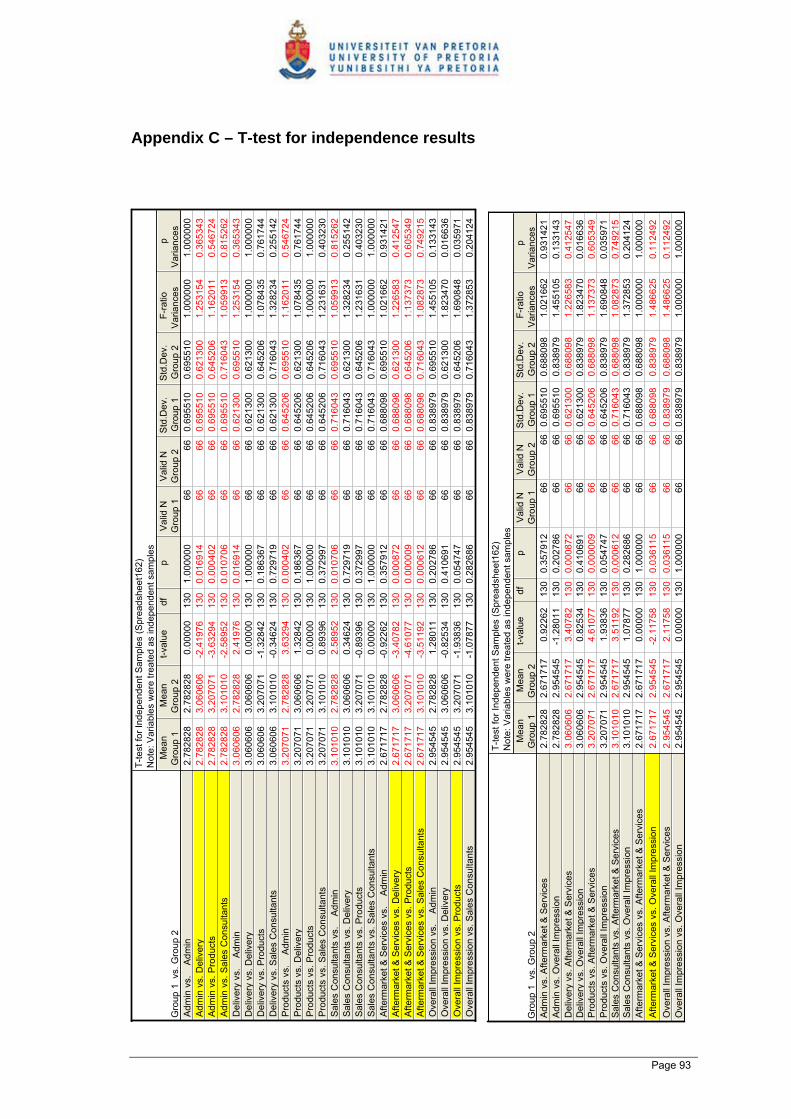
Appendix C – T-test for independence results
T-te
st fo
r Ind
epen
dent
Sam
ples
(Spr
eads
heet
162)
Not
e: V
aria
bles
wer
e tre
ated
as
inde
pend
ent s
ampl
es
Gro
up 1
vs.
Gro
up 2
Mea
nG
roup
1M
ean
Gro
up 2
t-val
uedf
pV
alid
NG
roup
1V
alid
NG
roup
2S
td.D
ev.
Gro
up 1
Std
.Dev
.G
roup
2F-
ratio
Var
ianc
esp
Var
ianc
esA
dmin
vs.
A
dmin
Adm
in v
s. D
eliv
ery
Adm
in v
s. P
rodu
cts
Adm
in v
s. S
ales
Con
sulta
nts
Del
iver
y vs
. A
dmin
Del
iver
y vs
. Del
iver
yD
eliv
ery
vs. P
rodu
cts
Del
iver
y vs
. Sal
es C
onsu
ltant
sP
rodu
cts
vs.
Adm
inP
rodu
cts
vs. D
eliv
ery
Pro
duct
s vs
. Pro
duct
sP
rodu
cts
vs. S
ales
Con
sulta
nts
Sal
es C
onsu
ltant
s vs
. A
dmin
Sal
es C
onsu
ltant
s vs
. Del
iver
yS
ales
Con
sulta
nts
vs. P
rodu
cts
Sal
es C
onsu
ltant
s vs
. Sal
es C
onsu
ltant
sA
fterm
arke
t & S
ervi
ces
vs.
Adm
inA
fterm
arke
t & S
ervi
ces
vs. D
eliv
ery
Afte
rmar
ket &
Ser
vice
s vs
. Pro
duct
sA
fterm
arke
t & S
ervi
ces
vs. S
ales
Con
sulta
nts
Ove
rall
Impr
essi
on v
s.
Adm
inO
vera
ll Im
pres
sion
vs.
Del
iver
yO
vera
ll Im
pres
sion
vs.
Pro
duct
sO
vera
ll Im
pres
sion
vs.
Sal
es C
onsu
ltant
s
2.78
2828
2.78
2828
0.00
000
130
1.00
0000
6666
0.69
5510
0.69
5510
1.00
0000
1.00
0000
3.06
0606
3.20
7071
-1.3
2842
130
0.18
6367
6666
0.62
1300
0.64
5206
1.07
8435
0.76
1744
3.06
0606
3.10
1010
-0.3
4624
130
0.72
9719
6666
0.62
1300
0.71
6043
1.32
8234
0.25
5142
3.20
7071
3.20
7071
0.00
000
130
1.00
0000
6666
0.64
5206
0.64
5206
1.00
0000
1.00
0000
3.20
7071
3.10
1010
0.89
396
130
0.37
2997
6666
0.64
5206
0.71
6043
1.23
1631
0.40
3230
3.10
1010
3.20
7071
-0.8
9396
130
0.37
2997
6666
0.71
6043
0.64
5206
1.23
1631
0.40
3230
3.10
1010
3.10
1010
0.00
000
130
1.00
0000
6666
0.71
6043
0.71
6043
1.00
0000
1.00
0000
2.67
1717
2.78
2828
-0.9
2262
130
0.35
7912
6666
0.68
8098
0.69
5510
1.02
1662
0.93
1421
2.95
4545
3.06
0606
-0.8
2534
130
0.41
0691
6666
0.83
8979
0.62
1300
1.82
3470
0.01
6636
2.95
4545
3.20
7071
-1.9
3836
130
0.05
4747
6666
0.83
8979
0.64
5206
1.69
0848
0.03
5971
2.95
4545
3.10
1010
-1.0
7877
130
0.28
2686
6666
0.83
8979
0.71
6043
1.37
2853
0.20
4124
2.78
2828
3.06
0606
-2.4
1976
130
0.01
6914
6666
0.69
5510
0.62
1300
1.25
3154
0.36
5343
2.78
2828
3.20
7071
-3.6
3294
130
0.00
0402
6666
0.69
5510
0.64
5206
1.16
2011
0.54
6724
2.78
2828
3.10
1010
-2.5
8952
130
0.01
0706
6666
0.69
5510
0.71
6043
1.05
9913
0.81
5262
3.06
0606
2.78
2828
2.41
976
130
0.01
6914
6666
0.62
1300
0.69
5510
1.25
3154
0.36
5343
3.06
0606
3.06
0606
0.00
000
130
1.00
0000
6666
0.62
1300
0.62
1300
1.00
0000
1.00
0000
3.20
7071
2.78
2828
3.63
294
130
0.00
0402
6666
0.64
5206
0.69
5510
1.16
2011
0.54
6724
3.20
7071
3.06
0606
1.32
842
130
0.18
6367
6666
0.64
5206
0.62
1300
1.07
8435
0.76
1744
3.10
1010
2.78
2828
2.58
952
130
0.01
0706
6666
0.71
6043
0.69
5510
1.05
9913
0.81
5262
3.10
1010
3.06
0606
0.34
624
130
0.72
9719
6666
0.71
6043
0.62
1300
1.32
8234
0.25
5142
2.67
1717
3.06
0606
-3.4
0782
130
0.00
0872
6666
0.68
8098
0.62
1300
1.22
6583
0.41
2547
2.67
1717
3.20
7071
-4.6
1077
130
0.00
0009
6666
0.68
8098
0.64
5206
1.13
7373
0.60
5349
2.67
1717
3.10
1010
-3.5
1192
130
0.00
0612
6666
0.68
8098
0.71
6043
1.08
2873
0.74
9215
2.95
4545
2.78
2828
1.28
011
130
0.20
2786
6666
0.83
8979
0.69
5510
1.45
5105
0.13
3143
T-te
st fo
r Ind
epen
dent
Sam
ples
(Spr
eads
heet
162)
Not
e: V
aria
bles
wer
e tre
ated
as
inde
pend
ent s
ampl
es
Gro
up 1
vs.
Gro
up 2
Mea
nG
roup
1M
ean
Gro
up 2
t-val
uedf
pV
alid
NG
roup
1V
alid
NG
roup
2S
td.D
ev.
Gro
up 1
Std
.Dev
.G
roup
2p
Var
ianc
esF-
ratio
Var
ianc
esA
dmin
vs.
Afte
rmar
ket &
Ser
vice
sA
dmin
vs.
Ove
rall
Impr
essi
onD
eliv
ery
vs. A
fterm
arke
t & S
ervi
ces
Del
iver
y vs
. Ove
rall
Impr
essi
onP
rodu
cts
vs. A
fterm
arke
t & S
ervi
ces
Pro
duct
s vs
. Ove
rall
Impr
essi
onS
ales
Con
sulta
nts
vs. A
fterm
arke
t & S
ervi
ces
Sal
es C
onsu
ltant
s vs
. Ove
rall
Impr
essi
onA
fterm
arke
t & S
ervi
ces
vs. A
fterm
arke
t & S
ervi
ces
Afte
rmar
ket &
Ser
vice
s vs
. Ove
rall
Impr
essi
onO
vera
ll Im
pres
sion
vs.
Afte
rmar
ket &
Ser
vice
s
2.78
2828
2.67
1717
0.92
262
130
0.35
7912
6666
0.69
5510
0.68
8098
1.02
1662
0.93
1421
2.78
2828
2.95
4545
-1.2
8011
130
0.20
2786
6666
0.69
5510
0.83
8979
1.45
5105
0.13
3143
2.67
1717
2.67
1717
0.00
000
130
1.00
0000
6666
0.68
8098
0.68
8098
1.00
0000
1.00
0000
Ove
rall
Impr
essi
on v
s. O
vera
ll Im
pres
sion
3.06
0606
2.67
1717
3.40
782
130
0.00
0872
6666
0.62
1300
0.68
8098
1.22
6583
0.41
2547
3.06
0606
2.95
4545
0.82
534
130
0.41
0691
6666
0.62
1300
0.83
8979
1.82
3470
0.01
6636
3.20
7071
2.67
1717
4.61
077
130
0.00
0009
6666
0.64
5206
0.68
8098
1.13
7373
0.60
5349
3.20
7071
2.95
4545
1.93
836
130
0.05
4747
6666
0.64
5206
0.83
8979
1.69
0848
0.03
5971
3.10
1010
2.67
1717
3.51
192
130
0.00
0612
6666
0.71
6043
0.68
8098
1.08
2873
0.74
9215
3.10
1010
2.95
4545
1.07
877
130
0.28
2686
6666
0.71
6043
0.83
8979
1.37
2853
0.20
4124
2.67
1717
2.95
4545
-2.1
1758
130
0.03
6115
6666
0.68
8098
0.83
8979
1.48
6625
0.11
2492
2.95
4545
2.67
1717
2.11
758
130
0.03
6115
6666
0.83
8979
0.68
8098
1.48
6625
0.11
2492
2.95
4545
2.95
4545
0.00
000
130
1.00
0000
6666
0.83
8979
0.83
8979
1.00
0000
1.00
0000
Page 93

Appendix D – Job satisfaction – Box Plots
Administration Administration
Median 25%-75% 1%-99%
Pay
Pro
mot
ion
Sup
ervi
sion
Ben
efits
Con
tinge
nt R
ewar
ds
Ope
ratin
g P
roce
dure
Co-
wor
kers
Nat
ure
of w
ork
Com
mun
icat
ion
1.5
2.0
2.5
3.0
3.5
4.0
4.5
5.0
5.5
6.0
Logistics and warehousing Logistics & Warehousing
Median 25%-75% 1%-99%
Pay
Pro
mot
ion
Sup
ervi
sion
Ben
efits
Con
tinge
nt R
ewar
ds
Ope
ratin
g P
roce
dure
Co-
wor
kers
Nat
ure
of w
ork
Com
mun
icat
ion
0
1
2
3
4
5
6
7
Page 94
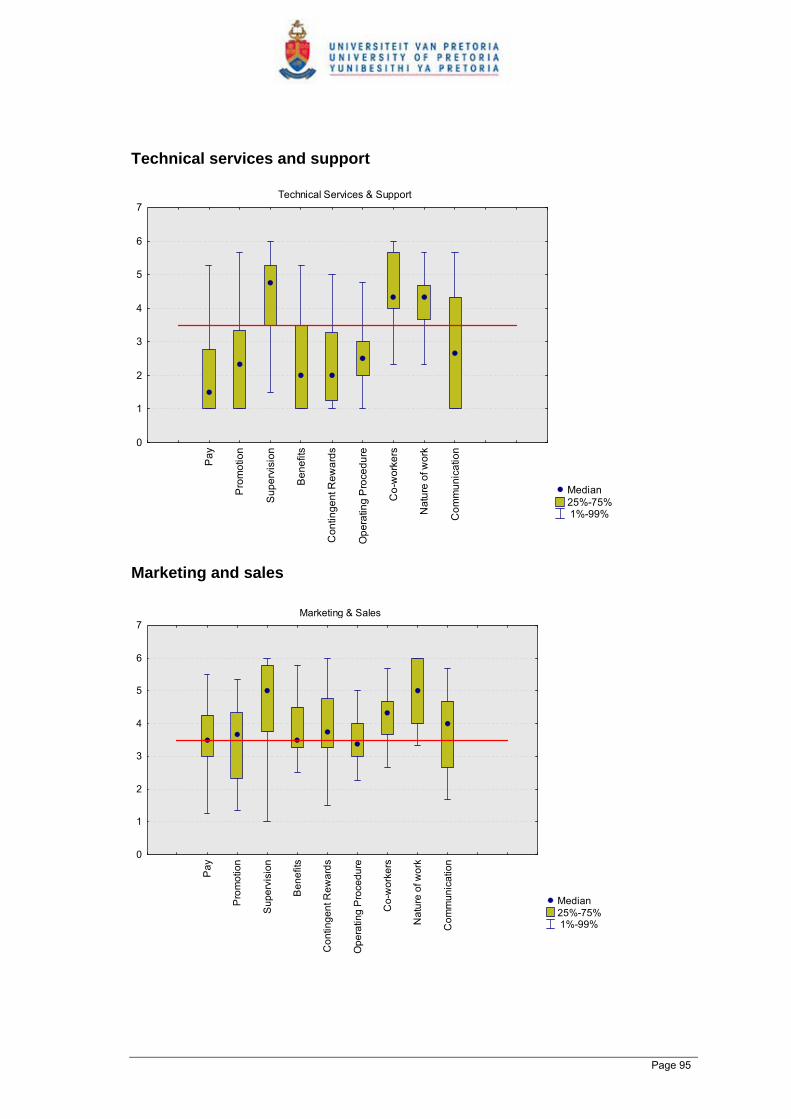
Technical services and support
Technical Services & Support
Median 25%-75% 1%-99%
Pay
Pro
mot
ion
Sup
ervi
sion
Ben
efits
Con
tinge
nt R
ewar
ds
Ope
ratin
g P
roce
dure
Co-
wor
kers
Nat
ure
of w
ork
Com
mun
icat
ion
0
1
2
3
4
5
6
7
Marketing and sales Marketing & Sales
Median 25%-75% 1%-99%
Pay
Pro
mot
ion
Sup
ervi
sion
Ben
efits
Con
tinge
nt R
ewar
ds
Ope
ratin
g P
roce
dure
Co-
wor
kers
Nat
ure
of w
ork
Com
mun
icat
ion
0
1
2
3
4
5
6
7
Page 95

Page 96

Appendix E – Job Satisfaction – sub group distributions
Pay
Marketing & SalesTechnical Services & Support
Logistics & WarehouseAdmin
0
1
2
3
4
5
6
7
Pay
Median 25%-75% 1%-99%
Promotion
Marketing & SalesTechnical Services & Support
Logistics & WarehouseAdmin
0
1
2
3
4
5
6
7
Pro
mot
ion
Median 25%-75% 1%-99%
Page 97
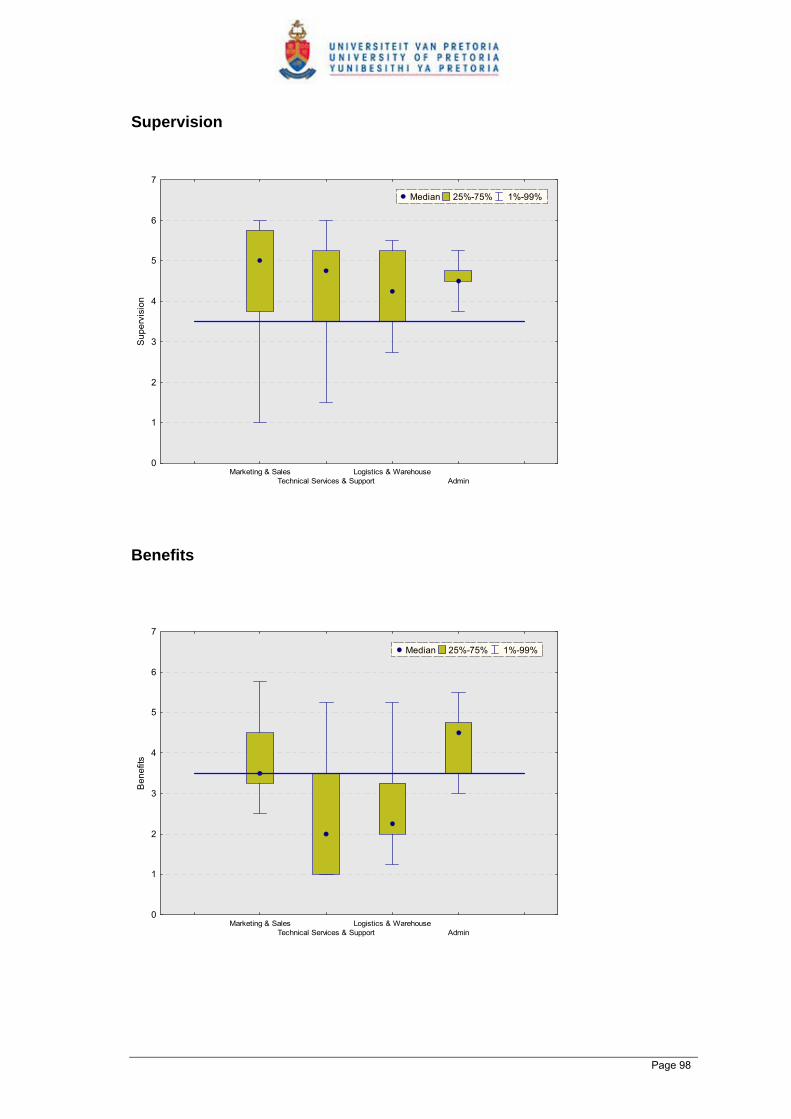
Supervision
Marketing & SalesTechnical Services & Support
Logistics & WarehouseAdmin
0
1
2
3
4
5
6
7
Sup
ervi
sion
Median 25%-75% 1%-99%
Benefits
Marketing & SalesTechnical Services & Support
Logistics & WarehouseAdmin
0
1
2
3
4
5
6
7
Ben
efits
Median 25%-75% 1%-99%
Page 98
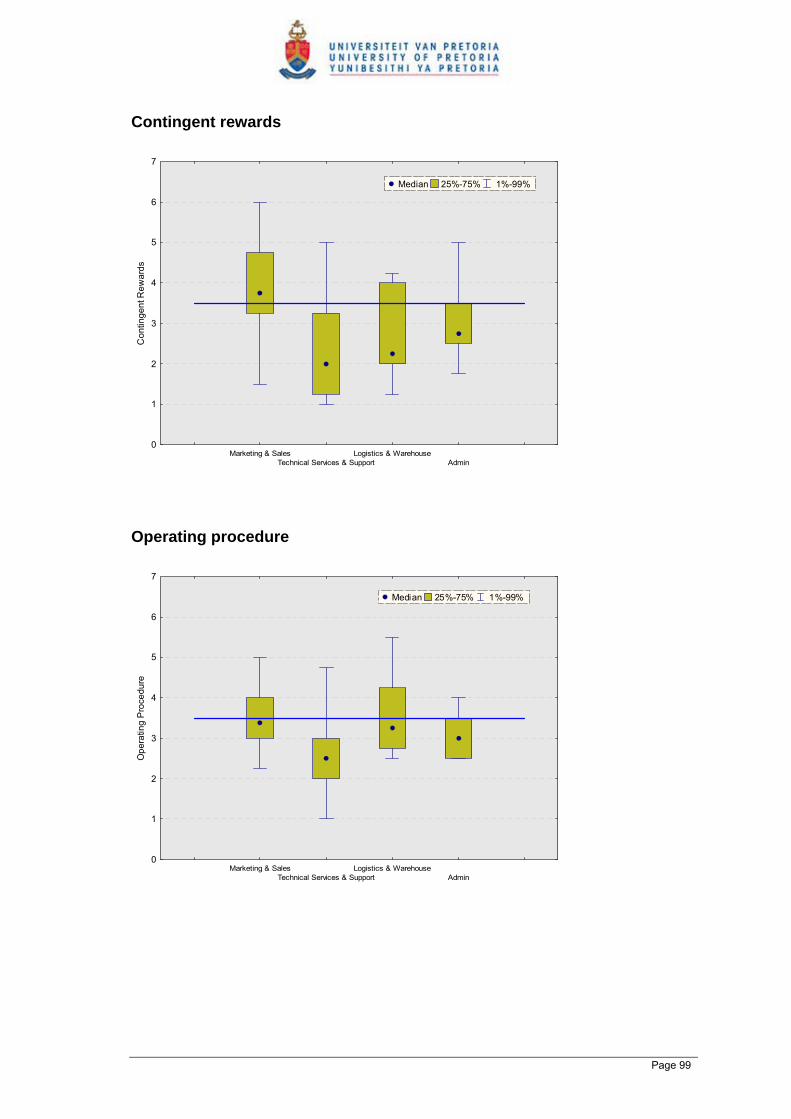
Contingent rewards
Marketing & SalesTechnical Services & Support
Logistics & WarehouseAdmin
0
1
2
3
4
5
6
7
Con
tinge
nt R
ewar
ds
Median 25%-75% 1%-99%
Operating procedure
Marketing & SalesTechnical Services & Support
Logistics & WarehouseAdmin
0
1
2
3
4
5
6
7
Ope
ratin
g P
roce
dure
Median 25%-75% 1%-99%
Page 99

Co Workers
Marketing & SalesTechnical Services & Support
Logistics & WarehouseAdmin
0
1
2
3
4
5
6
7
Co-
wor
kers
Median 25%-75% 1%-99%
Nature of work
Marketing & SalesTechnical Services & Support
Logistics & WarehouseAdmin
0
1
2
3
4
5
6
7
Nat
ure
of w
ork
Median 25%-75% 1%-99%
Page 100
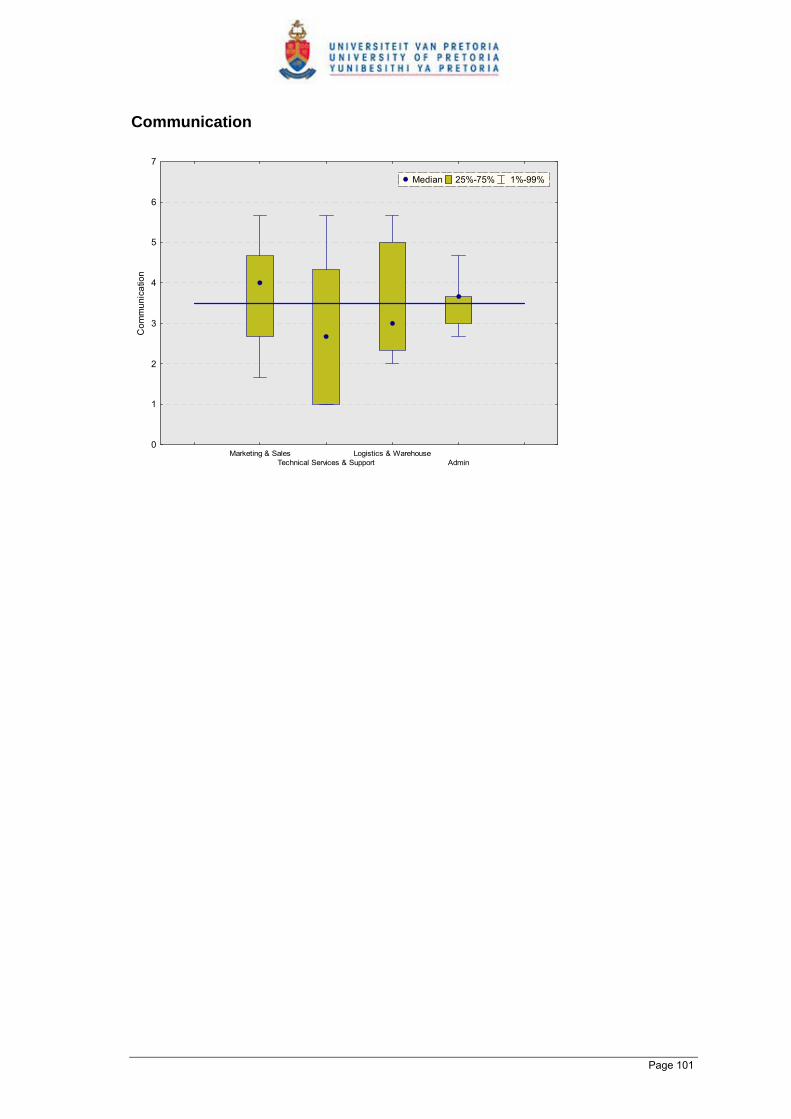
Communication
Marketing & SalesTechnical Services & Support
Logistics & WarehouseAdmin
0
1
2
3
4
5
6
7
Com
mun
icat
ion
Median 25%-75% 1%-99%
Page 101