evaluation of various downhole data reduction methods...
TRANSCRIPT

Geotechnical Testing Journal, Vol. 27, No. 6Paper ID GTJ11811
Available online at: www.astm.org
Dong-Soo Kim,1 Ph.D., Eun-Seok Bang,2 and Won-Chul Kim3
Evaluation of Various Downhole Data ReductionMethods for Obtaining Reliable VS Profiles
ABSTRACT: The downhole method has been widely used to measure in situ shear wave velocity profiles for the seismic response analysis ofgeotechnical sites. To analyze the downhole data, the direct and interval methods are mostly used in practice. In this study, the modified intervalmethod based on a straight ray path and the inversion method based on Snell’s Law ray path were introduced to improve the quality of the wavevelocity profiles evaluated by the downhole seismic method. Various synthesized wave velocity profile models were developed to perform theparametric study and the arrival times were determined by a forward modeling scheme based on Snell’s Law. By comparing the velocity profilesobtained by four different data reduction methods with actual velocity profiles, the accuracy and limitation of various data reduction methodswere assessed. The direct method was difficult for evaluating the detailed velocity profiles, and the interval method was found to provide severeerrors, particularly when a stiff layer is located beneath the soft layer. The modified interval method provides reliable results, except when a strongsoft-to-stiff contrast exists. Snell’s Law ray path method provides the most reliable velocity profiles. Finally, in situ downhole seismic tests wereperformed at three sites, and the importance of considering the ray path in the data reduction was emphasized by comparing the reduced shear wavevelocity profiles with crosshole and standard penetration test results.
KEYWORDS: downhole test, shear wave velocity, data reduction, ray path, Snell’s Law, parametric study, in situ testing
Introduction
The downhole method has been widely used to measure in situcompression and shear wave velocity profiles for the seismic re-sponse analysis of geotechnical sites. The schematic diagram of thedownhole seismic test is shown in Fig. 1. The downhole methodmeasures the travel time for body waves from the source on thesurface to receivers at different depths in a single borehole. Thismethod has advantages such as low cost, ease of operation, andthe use of a simple surface seismic source. Because a boring isnecessary for general site characterization, the downhole seismictest, which needs one borehole, is more economical than the cross-hole test that needs another boring. A downhole seismic test can becombined with CPT using a seismic cone (Campanella and Stewart1992; Joh and Mok 1998; Robertson et al. 1986; Schneider et al.2001). For a reliable assessment of shear wave velocity profilein the downhole seismic test, two conditions should be satisfied:1) accurate measurements of travel times of an elastic wave, and2) a reliable data reduction method considering ray path. The for-mer has been discussed in the literatures (Campanella and Stewart1992; Larkin and Taylor 1979), and the latter will be the focus ofthis paper.
For the analysis of downhole seismic data, conventional methodsincluding the direct method, the interval method, and the pseudo-interval method are currently used in practice (Kramer 1996; Martin
Received December 9, 2002; accepted for publication April 26, 2004; pub-lished November 2004.
1 Professor, Department of Civil and Environmental Engineering, Korea Ad-vanced Institute of Science and Technology (KAIST), Gusong-dong, Yusong-gu, Daejeon, 305-701, Korea.
2 Graduate Student, Department of Civil and Environmental Engineering,Korea Advanced Institute of Science and Technology (KAIST), Gusong-dong,Yusong-gu, Daejeon, 305-701., Korea.
3 Instructor, Department of Civil Engineering, Hanyang University,Haengdang-dong, Sungdong-gu, Seoul, 133-791, Korea.
and Mayne 1997; Stewart and Campanella 1993; Campanella andStewart 1992). In the downhole seismic test, the generated wave onthe ground surface travels through the multilayered profiles and theray path would be refracted based on the stiffness difference be-tween layers. However, in the conventional data reduction method,the effects of multilayered profiles and refracted characteristicscannot be considered. Even in the soft-to-stiff layer interfaces, thetravel time to the bottom receiver is sometimes faster than that tothe upper receiver, and the interval method cannot be applied inthe data reduction. Due to the lack of a sophisticated and rigorousanalysis method for developing velocity profile, the wave velocityprofiles determined by the downhole seismic method are generallythought to be inferior to those evaluated by the crosshole method.To improve the quality of the wave velocity profiles evaluated bythe downhole seismic method, new data analysis techniques havebeen developed (Bang 2001; Batsila 1995; Joh and Mok 1998; Mok1987), including the modified interval method based on straight raypaths and the inversion method based on Snell’s Law ray paths.To evaluate the applicability and advantages of new data reduc-tion methods, it would be important to assess the effects of variousparameters on the data reduction using synthesized layered pro-files, and to compare the evaluated velocity profiles with the profileobtained by reliable field test methods.
In this study, the downhole data reduction methods including theconventional methods, such as direct method and interval method,and the new methods considering ray paths in the analysis, such asthe modified interval method and the Snell’s Law ray path method,were reviewed. Parametric analyses were performed using vari-ous synthesized wave velocity profiles, and the effects of variousparameters and the accuracies of various analysis methods wereassessed. Finally, the downhole seismic tests were performed atthree sites in Kyeongju, Korea and accuracies of various down-hole data reduction methods were assessed by comparing the re-duced velocity profiles with crosshole and standard penetration testresults.
Copyright © 2004 by ASTM International, 100 Barr Harbor Drive, PO Box C700, West Conshohocken, PA 19428-2959. 1Copyright by ASTM Int'l (all rights reserved); Fri Aug 29 05:39:31 EDT 2008Downloaded/printed byNational Cheng Kung University pursuant to License Agreement. No further reproductions authorized.

2 GEOTECHNICAL TESTING JOURNAL
FIG. 1—Schematic diagram of downhole tests.
FIG. 2—Illustration of the Direct Method.
Interpretation Methods of Downhole Seismic Test Data
For the interpretation of downhole seismic data, the directand interval methods are usually employed in practice (Kramer1996; Martin and Mayne 1997; Stewart and Campanella 1993;Campanella and Stewart 1992). The modified interval and Snell’sLaw ray-path methods, which consider the ray path in the data re-duction, have been recently developed (Bang 2001; Batsila 1995;Joh and Mok 1998; Mok 1987). Four interpretation methods ofdownhole seismic test data are briefly reviewed.
Direct Method
The first arrival time of an elastic wave from the source to areceiver at each testing depth can be obtained from the downholeseismic test. The measured travel time (t) in the inclined path canbe corrected to the travel time, tc, in the vertical path by using Eq 1as shown in Fig. 2 (Auld 1977; Batsila 1995; Mok 1987).
tc = Dt
R(1)
FIG. 3—Illustration of the Interval Method.
where tc is the corrected travel time, D is the testing depth fromground surface, t is the first arrival time from test, and R is thedistance between the source and receiver.
By plotting the corrected travel time versus depth, the velocity ofeach layer can be obtained from the slope of the fitting curve usingthe data points that have similar trend by Eq 1. The slope of thefitting curve represents the wave velocity in each covered range.As shown in Fig. 2, the corrected travel times can be fitted by twostraight lines, and the velocity profiles of the site can be classified astwo layers in an average sense. For the detailed velocity profiling,subdivision of �D can be applied, but the potential errors in traveltimes measurement and data interpretation can be increased.
Vd = �D
�tc(2)
where �D is depth interval showing similar slope and �tc is thecorrected travel time difference of �D.
Interval Method
The interval travel time between two receivers installed at differ-ent depths can be obtained from the downhole seismic test (Fig. 3).The wave velocity of a layer between receivers is obtained usingEq 3 (Batsila 1995; Mok 1987; Sully and Campanella 1995)
V = R2 − R1
t2 − t1(3)
where R1, R2 are the distances between the source and the upperand lower receiver, and t1, t2 are measured travel times at theupper and the lower receiver.
Interval method is simple in testing, measurement, and interpre-tation. However, this method cannot consider the wave velocitiesof upper layers along the ray path, and the wave velocity cannotobtain in the case of t2 − t1 being negative.
Modified Interval Method
The testing procedure and data set are the same as those used inthe interval method. In the modified interval method, it is assumedthat the site is composed of stacks of horizontal layers divided aseach testing interval and the elastic wave (shear wave in this study)propagates its own velocity on each divided layer as shown in Fig. 4(Bang 2001; Batsila 1995; Joh and Mok 1998). The travel timesof waves that pass through each layer from the source to the upperand lower receivers can be represented by Eq 4 and Eq 5. Using
Copyright by ASTM Int'l (all rights reserved); Fri Aug 29 05:39:31 EDT 2008Downloaded/printed byNational Cheng Kung University pursuant to License Agreement. No further reproductions authorized.

KIM ET AL. ON VS PROFILES 3
FIG. 4—Illustration of the modified interval measurement.
the wave velocities of upper layers and the measured interval traveltime between two receivers, the travel time at the lower receiver isobtained using Eq 6. The traveling length of elastic wave on eachlayer is also determined using Eq 7, according to the thickness ofeach layer. Based on this information, the wave velocity at eachtesting layer is determined using Eq 8. This method improves thedata reduction scheme compared to the interval method by consid-ering the wave velocities of layers along the path, but there is stilllimitation because it considers a straight ray-path.
Ti,u =i−1∑
j=1
Lij,u
Vj
= Li1,u
V1+ Li2,u
V2+ · · · · · + Li(i−1),u
Vi−1(4)
Ti,l =i∑
j=1
Lij,l
Vj
= Li1,l
V1+ Li2,l
V2+ · · · · · + Lii,l
Vi
(5)
Ti,l = DTi + Ti,u (6)
Lij,l = Ri,l
Di,l
× Zj (7)
Vi = Lii,l
Ti,l −i−1∑
j=1
Lij,l
Vj
(8)
where Vi is the wave velocity of ith layer, Di,l is ith testing depthof lower receiver, DTi is travel time delay between the upper andlower receivers, Ti,u is travel time of ith testing at the upper receiver,Ti,l is travel time of ith testing at the lower receiver, and Lij,l is thelength of ray-path on j th layer of ith testing at the lower receiverand Zj is the thickness of j th layer.
Snell’s Law Ray-Path Method
This method is similar to the modified interval method. However,it is assumed that the wave propagates along a refracted ray pathbased on Snell’s Law, and the following relations should be satisfied
FIG. 5—Illustration of the Snell’s law ray-path method.
as shown in Fig. 5 (Bang 2001; Batsila 1995).
sin θi1
V1= sin θi2
V2= · · · = sin θij
Vj
= · · · = sin θii
Vi
(9)
Z1 tan θi1 + · · · + Zj tan θij + · · · + Zi tan θii = S (10)
where θij is incident angle from j th layer to next layer of ith raypath, and S is the distance from the source to the borehole.
The wave velocity of the first layer can be determined in thesame manner as the interval method, because the stiffness is as-sumed constant and the ray-path is straight. But in evaluation of thewave velocity of the second layer, the refracted ray-path should beconsidered. To determine the refracted ray-path, both the wave ve-locity of upper layer that is already determined in the previous stepand the assumed wave velocity of the evaluating layer are required.The travel times of the seismic wave between source and receivermeasured at each testing depth are the same as in the modifiedinterval method. Using Eq 9 and Eq 10, new ray path is deter-mined and the velocity is calculated using Eq 8 considering newray path. The evaluation process is mainly the same as the modifiedinterval method, but the passage length of each layer is determinedby considering refracted ray-path and Eq 11 is applied instead ofEq 7.
Lij = Zj/cos θij (11)
The iteration process is continued until the assumed velocitymatches the calculated one within the allowable limit, which is0.01 % difference between two velocities. Once the velocity ofconcerning layer is determined, the procedure is continued to thenext layer. The value determined by modified interval method is re-commended to be an initial assumed velocity of the evaluating layerfor better convergence in the iteration process. This method wouldbe the most advanced interpretation method in the downhole datareduction, because it considers the refracted ray path determinedby the velocities of upper layers along the path.
Copyright by ASTM Int'l (all rights reserved); Fri Aug 29 05:39:31 EDT 2008Downloaded/printed byNational Cheng Kung University pursuant to License Agreement. No further reproductions authorized.
4 GEOTECHNICAL TESTING JOURNAL
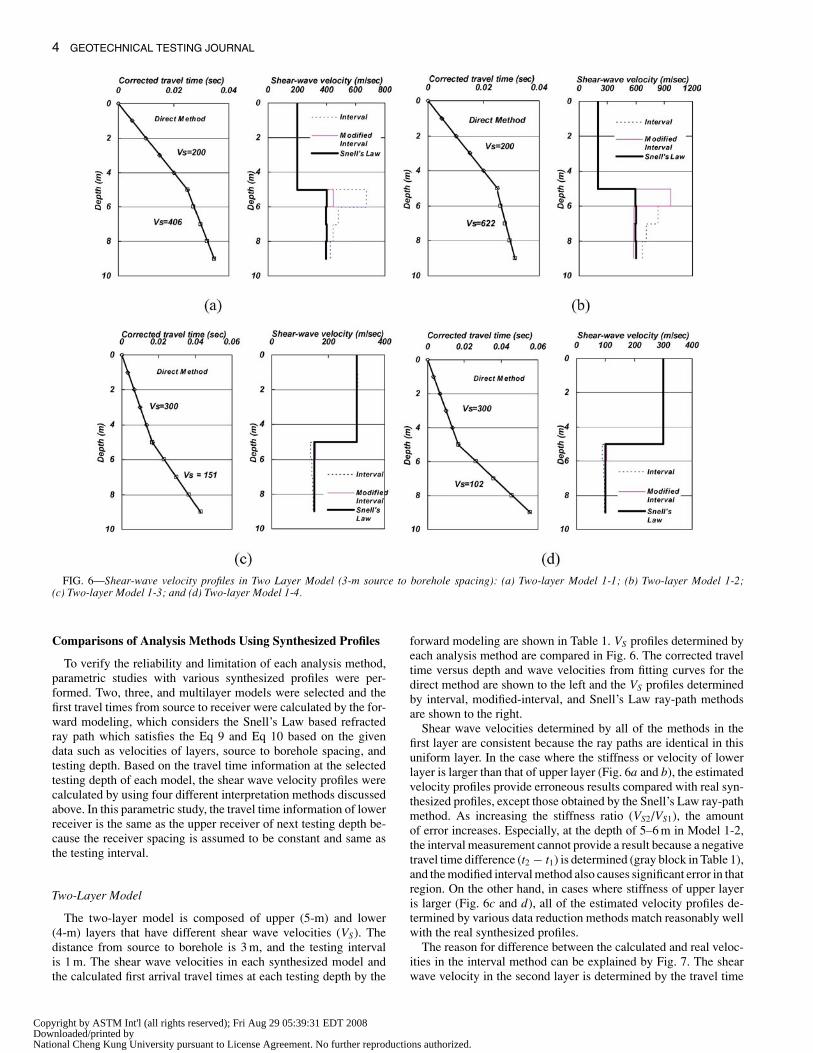
FIG. 6—Shear-wave velocity profiles in Two Layer Model (3-m source to borehole spacing): (a) Two-layer Model 1-1; (b) Two-layer Model 1-2;(c) Two-layer Model 1-3; and (d) Two-layer Model 1-4.
Comparisons of Analysis Methods Using Synthesized Profiles
To verify the reliability and limitation of each analysis method,parametric studies with various synthesized profiles were per-formed. Two, three, and multilayer models were selected and thefirst travel times from source to receiver were calculated by the for-ward modeling, which considers the Snell’s Law based refractedray path which satisfies the Eq 9 and Eq 10 based on the givendata such as velocities of layers, source to borehole spacing, andtesting depth. Based on the travel time information at the selectedtesting depth of each model, the shear wave velocity profiles werecalculated by using four different interpretation methods discussedabove. In this parametric study, the travel time information of lowerreceiver is the same as the upper receiver of next testing depth be-cause the receiver spacing is assumed to be constant and same asthe testing interval.
Two-Layer Model
The two-layer model is composed of upper (5-m) and lower(4-m) layers that have different shear wave velocities (VS). Thedistance from source to borehole is 3 m, and the testing intervalis 1 m. The shear wave velocities in each synthesized model andthe calculated first arrival travel times at each testing depth by the
forward modeling are shown in Table 1. VS profiles determined byeach analysis method are compared in Fig. 6. The corrected traveltime versus depth and wave velocities from fitting curves for thedirect method are shown to the left and the VS profiles determinedby interval, modified-interval, and Snell’s Law ray-path methodsare shown to the right.
Shear wave velocities determined by all of the methods in thefirst layer are consistent because the ray paths are identical in thisuniform layer. In the case where the stiffness or velocity of lowerlayer is larger than that of upper layer (Fig. 6a and b), the estimatedvelocity profiles provide erroneous results compared with real syn-thesized profiles, except those obtained by the Snell’s Law ray-pathmethod. As increasing the stiffness ratio (VS2/VS1), the amountof error increases. Especially, at the depth of 5–6 m in Model 1-2,the interval measurement cannot provide a result because a negativetravel time difference (t2 − t1) is determined (gray block in Table 1),and the modified interval method also causes significant error in thatregion. On the other hand, in cases where stiffness of upper layeris larger (Fig. 6c and d), all of the estimated velocity profiles de-termined by various data reduction methods match reasonably wellwith the real synthesized profiles.
The reason for difference between the calculated and real veloc-ities in the interval method can be explained by Fig. 7. The shearwave velocity in the second layer is determined by the travel time
Copyright by ASTM Int'l (all rights reserved); Fri Aug 29 05:39:31 EDT 2008Downloaded/printed byNational Cheng Kung University pursuant to License Agreement. No further reproductions authorized.

KIM ET AL. ON VS PROFILES 5
TABLE 1—Shear wave velocities and calculated travel time in Two-Layer Models 1-1 to 1-4.
VS1 < VS2 VS1 > VS2
Model 1-1 Model 1-2 Model 1-3 Model 1-4
Layer Depth (m) VS (m/s) Time (ms) VS (m/s) Time (ms) VS (m/s) Time (ms) VS (m/s) Time (ms)
1 15.81 15.81 10.54 10.542 18.03 18.03 12.02 12.02
1 3 200 21.21 200 21.21 300 14.14 300 14.144 25.00 25.00 16.67 16.675 29.15 29.15 19.44 19.446 30.46 29.10 25.88 29.29
27
40032.35
60030.19
15032.37
10039.16
8 34.45 31.50 38.87 49.049 36.67 32.93 45.40 58.93
∗ Source to borehole spacing is 3 m, testing interval is 1 m.
FIG. 7—Interpretation of Interval Method for the case of a two-layermodel.
difference (t2 − t1) and the path difference (R2 − R1, the distanceCD) by using Eq 3. Even if the lengths of the travel path OA andOC are the same, the travel times from O to A and C are differentbecause the shear wave velocities of first and second layers aredifferent. Therefore, the wave velocities of upper layers along thepath are required to consider for better interpretation in the intervalmethod. The reason for difference between the calculation and realvelocities in the modified interval method can be explained by thedifference between the straight ray path and Snell’s Law ray path.As shown in Fig. 8, for the case where the upper layer is stifferthan the lower layer, the difference between the straight ray pathand the refracted ray-path is small and this error does not affectthe VS profile significantly. On the contrary, in the case where thelower layer is stiffer than the upper layer, the difference betweenthe straight ray path and the Snell’s Law ray-path is large, and thiserror prohibits from determining the right velocity value.
Effects of Source to Borehole Spacing
To investigate the effect of source-to-borehole spacing, thesource-to-borehole spacing in the Model 1-2 was set to 0 m, 1.5 m,3.0 m, and 4.5 m, and the results are shown in Fig. 9. As decreas-ing the source-to-borehole distance from 4.5 to 1.5 m (Fig. 9b and9c), it can be noticed that the error, which is the difference be-tween the calculated velocity and the real value in the model, isreduced but still some errors exist in both the interval and modifiedinterval methods, particularly at the soft/stiff boundary. In the caseof source-to-borehole spacing of 0 m (Fig. 9a), all data reduction
FIG. 8—Comparison of straight and Snell’s Law ray paths for the caseof a two-layer model.
methods provide the identical shear wave velocity profile same asthe real velocity profile of Model 1-2. If the source and the bore-hole spacing approaches zero, the travel path can be assumed asa straight, and all methods should provide the same wave velocityprofile. However, if the downhole source is close to the boreholein actual field tests, the wave may travel not through the soil layerbut through the testing casing, and the false arrival time may bedetected. Generally, the distance between the source and the bore-hole in the downhole seismic test is set to be about 2–5 m (Hoarand Stokoe 1978; Hunter et al. 2002), and the ray-path needs to beconsidered in interpretation of data.
Three-Layer Model
The shear wave velocities and the travel times determinedfrom the forward modeling in the three-layer model are shown inTable 2. The thickness of each layer is 3 m. The distance fromsource to borehole and the testing interval are the same as those in
Copyright by ASTM Int'l (all rights reserved); Fri Aug 29 05:39:31 EDT 2008Downloaded/printed byNational Cheng Kung University pursuant to License Agreement. No further reproductions authorized.

6 GEOTECHNICAL TESTING JOURNAL
FIG. 9—Effects of source to borehole spacing (Two-layer Model 1-2): (a) Source to Borehole = 0 m; (b) Source to Borehole = 1.5 m; (c) Source toBorehole = 3.0 m; and (d) Source to Borehole = 4.5 m.
TABLE 2—Shear wave velocities and the calculated travel times in Three-Layer Models 2-1 to 2-5.
VS1 < VS2 < VS3 VS1 > VS2 > VS3 VS1, VS3 > VS2 VS1, VS3 < VS2
Model 2-1 Model 2-2 Model 2-3 Model 2-4 Model 2-5
Layer Depth (m) VS (m/s) Time (ms) VS (m/s) Time (ms) VS (m/s) Time (ms) VS (m/s) Time (ms) VS (m/s) Time (ms)
1 10.54 10.54 3.95 15.81 15.811 2 300 12.00 300 12.00 800 4.50 200 18.03 200 18.03
3 14.13 14.13 21.21 21.21 21.214 14.76 13.33 20.27 30.61 20.27
2 5 500 16.14 800 14.06 500 21.46 100 40.08 500 21.466 17.74 14.99 22.96 49.63 22.967 18.56 15.33 26.09 51.84 26.09
3 8 800 19.57 1200 15.87 300 29.25 300 54.51 300 29.259 20.65 16.46 32.44 57.40 32.44
the two-layer model. Models 2-1 to 2-3 show the cases for stiffnessof layers increasing or decreasing gradually with depth, and VS
profiles determined by different analysis methods are compared inFig. 10a–10c. Models 2-4 and 2-5 show that the cases for stiffnessof the middle sandwiched layers vary differently from the generaltrend, and the VS profiles are compared in Fig. 10d and 10e.
The similar trends as in the two-layer models are shown in thethree-layer models. Significant errors are still produced in the re-sults of the interval method in all cases. In the Model 2-1(Fig. 10a) that is the case, the stiffness of layers increase grad-
ually with depth and the error of third layer is smaller than that ofsecond layer. This is because the difference between the straightray path and the refracted ray-path is getting smaller with increas-ing the depth. However, in the Model 2-2 (Fig. 10b), which is thecase where the stiffness ratio is larger than Model 2-1, the error isstill significant and the interval method cannot provide the result atthe boundary between the first and second layer. In the Model 2-3(Fig. 10c) where the stiffness (VS) decreases gradually with depth,the error is small as shown in the two layer models. In natural soildeposits, the stiffness usually increases with depth, and there is a
Copyright by ASTM Int'l (all rights reserved); Fri Aug 29 05:39:31 EDT 2008Downloaded/printed byNational Cheng Kung University pursuant to License Agreement. No further reproductions authorized.

KIM ET AL. ON VS PROFILES 7
FIG. 10—Shear wave velocity profiles for the three-layer model: (a) Three-layer Model 2-1; ( b) Three-layer Model 2-2; (c) Three-layer Model 2-3;(d) Three-layer Model 2-4; and (e) Three-layer Model 2-5.
possibility of significant error occurring at the layer interface wherethe abrupt stiffness increase happens in the interval and modifiedinterval methods.
In the Model 2-4 (Fig. 10d), the errors between the first andsecond layer (VS1 >VS2) are negligible as in the two layer model,but the errors between the second and third layers (VS2 <VS3)are not significant compared with two layer model. The reason
can be explained that the difference between straight and refractedray path is reduced as shown in Fig. 11, when the soft layer issandwiched between two stiffer layers. In the Model 2-5 (Fig. 10e),the errors provided by the interval and modified interval methods inthe second layer are similar as in the two layer models, and all of thereduction methods provide the accurate wave velocities in the thirdlayer.
Copyright by ASTM Int'l (all rights reserved); Fri Aug 29 05:39:31 EDT 2008Downloaded/printed byNational Cheng Kung University pursuant to License Agreement. No further reproductions authorized.

8 GEOTECHNICAL TESTING JOURNAL
FIG. 11—Comparisons of straight and Snell’s Law ray path forModels 3-4 and 3-5.
Effect of Testing Interval
Because downhole seismic test is not performed continuously,there will be a problem caused by setting a testing interval. In thissection, the multilayer profiles that do not coincide with the test
spacing between upper and lower will be discussed. In this case,there are no test data at the same layer boundaries, as shown inFig. 12. The shear wave velocities and the travel times determinedfrom the forward modeling in the multilayer model are also shownin Fig. 12. In Model 3-1, testing interval of 2 m is larger than theminimum layer thickness (1 m) in the model (Fig. 12a). In this case,errors can be found at the layer boundaries (depths 4 m, 7 m) andeven Snell’s Law ray-path method cannot provide exact profiles butjust mean values in the testing spacing as shown in Fig. 13a. It isworth noting that the determination of reasonable testing interval isimportant before testing for the accurate measurement of velocityprofile in the downhole seismic test.
In the two and three layer models, it was shown that the directmethod provided reasonably good VS profiles compared with theinterval and modified interval methods. In practice, however, theaccurate determination of arrival time is difficult, and the stiffnessprofile will be complex as shown in Fig. 12. Here, the direct methodcan provide the only average velocity profiles of several layers. Inseismic ground response analysis, the determination of accurate VS
profile, particularly the stiffness contrast, is crucial and there mightbe a lack of accuracy in the direct method.
In Model 3-2 (Figs. 12b and 13b), the testing interval is smallenough (0.5 m) compared with the minimum thickness of a layerin the model, but the testing location does not coincide with layerboundaries at depths of 5.5 and 8.5 m. In this case, the shear wavevelocity profile determined by Snell’s Law ray path method agreeswell with synthesized velocity profile up to the depth 5 m, which isthe layer boundary. However, at layer boundaries below, the Snell’sLaw ray path method provides the mean velocity of the upper andlower layers at depth of 5.5 m and 8.5 m. During the downholeseismic test, it is difficult to locate the exact layer boundaries, but
FIG. 12—Illustration of the multilayer model to study the effect of testing interval: (a) Model 3-1; and (b) Model 3-2.
Copyright by ASTM Int'l (all rights reserved); Fri Aug 29 05:39:31 EDT 2008Downloaded/printed byNational Cheng Kung University pursuant to License Agreement. No further reproductions authorized.

KIM ET AL. ON VS PROFILES 9
FIG. 13—Shear wave velocity profiles for the multilayer model:(a) Model 3-1 (Testing interval is larger than a layer thickness); and(b) Model 3-2 (Testing location does not coincide with a layer boundary).
this problem can be partially overcome by dividing testing intervalfine enough.
Field Studies
To evaluate the reliability of various downhole data reductionmethods, downhole seismic tests were performed at three sites, andthe shear wave velocity profiles determined by the various reductionmethods were compared with the profiles determined by crossholetest or SPT N values. Figure 14 shows the locations of testing sites.The site investigation was performed mainly for the evaluation ofseismic response of Kyeongju, Korea during the scenario earth-quakes (Kim et al. 2002). Kyeongsang Basin in southeastern partof Korea where Kyeongju is located, is composed of sedimentaryrock, volcanic rock by extensive volcanic activities, and intrusivegranite. The topography of Kyeongju is characterized as a basin of
FIG. 14—The location of testing sites.
the plains and low hills in which the downtown and farms are lo-cated, with surrounding mountains. Across the area the HyeongsanRiver flows northward and several creeks from valleys join the river(Fig. 15). Therefore, the subsurface deposits of Kyeongju can bemainly composed of thick alluvium over bedrock influenced byrivers and creeks.
The soil profiles of three sites where the downhole seismic testwas performed were obtained by rotary boring and are describedin left sides of Figs. 15–17. The distance from source to boreholewas set to about 3 m and the testing interval was 0.5 m to elimi-nate erroneous judgment in the interpretation of testing data. Tworeceivers were lowered simultaneously, and the receiver intervalbetween the upper and lower receiver was 0.7 m. The polarizedshear waves are generated at the ground surface by hitting eachend of a 0.3 × 0.2 × 1 m wood beam with a 5-kg weight sledgehammer. The travel times obtained at three test sites, which aremeasured by lower receiver at each testing depth, are listed inTable 3.
Sun-Duc High School Site
Both downhole and crosshole tests were performed at theSun-Duc high school site at Kyeongju, Korea. The site consistsof a fill layer, alluvial silty gravel, and soft rock. The shearwave velocity profiles determined by various downhole reductionmethods are compared with crosshole data in Fig. 15. The shearwave velocity profile of the site shows a gradual increase withdepth without abrupt change. The velocity profiles determinedby the modified interval and Snell’s Law ray-path methods agreewell with each other, and those are also in good agreement withcrosshole test data, which was obtained at the same borehole.Even if the same travel time measurement data listed in Table 3are used in the analysis, the velocity profile determined by theinterval method shows significant scatter. As discussed in theparametric study, both the Snell’s Law ray path and modifiedinterval methods provide the reliable velocity profiles in the soildeposit where the stiffness increases gradually with depth, but theinterval method shows the lack of accuracy. The direct method canonly provide the four mean average shear wave velocities in theprofile.
Copyright by ASTM Int'l (all rights reserved); Fri Aug 29 05:39:31 EDT 2008Downloaded/printed byNational Cheng Kung University pursuant to License Agreement. No further reproductions authorized.

10 GEOTECHNICAL TESTING JOURNAL
FIG. 15—Soil profile and shear wave velocity profiles at the Sun-Duc school site.
TABLE 3—Measured travel time information at three test sites.
Sun-Duc School Site Grass Site O-nung Bridge Site
Depth (m) Time (ms) Depth (m) Time (ms) Depth (m) Time (ms)
0.5 24.33 0.6 13.64 0.5 31.361.0 26.66 1.1 13.75 1.0 30.401.5 29.59 1.6 14.42 1.5 31.362.0 32.74 2.1 16.32 2.0 32.242.5 33.49 2.6 18.88 2.5 31.253.0 35.12 3.1 21.98 3.0 30.373.5 35.73 3.6 24.21 3.5 31.274.0 36.41 4.1 26.88 4.0 30.684.5 36.93 4.6 30.66 4.5 31.295.0 37.37 5.1 34.35 5.0 31.765.5 38.98 5.6 38.08 5.5 33.466.0 39.95 6.1 41.72 6.0 34.656.5 41.07 6.6 45.84 6.5 35.527.0 41.94 7.1 49.92 7.0 36.917.5 42.72 7.6 54.08 7.5 39.858.0 43.26 8.1 59.198.5 43.99 8.6 62.409.0 44.83 9.1 67.209.5 45.41 9.6 68.12
10.0 46.20 10.1 68.0310.5 46.73 10.6 68.3011.0 47.19 11.1 69.5611.5 47.90 11.6 70.4012.0 48.40 12.1 71.1312.5 48.92 12.6 71.9213.0 49.30 13.1 72.6313.5 49.87 13.6 73.3214.0 50.41 14.1 74.28
14.6 74.9815.1 75.4215.6 76.1816.1 76.80
∗ Travel times are measured by lower receiver at each testing depth.∗ Source-to-borehole spacing is about 3 m and testing interval is 0.5 m.
Grass Site
Downhole seismic tests were performed to a depth of 16 m at theGrass site, Kyeongju, Korea. The site consists of a fill layer, alluvialsilty clay, and silty gravel. Based on SPT N values, the stiffness ofsoil decreases slowly with depth up to 9.5 m, and the noticeablestiffness increase occurs at depths of about 8–11 m, as shown inFig. 16.
The shear wave velocity profiles determined by various reduc-tion methods were plotted in Fig. 16. Above the layer boundaryat a depth of about 9 m, the velocity profiles determined by vari-ous methods match reasonably well. However, at the layer bound-ary where the stiffness increases abruptly, the interval methodcannot provide the velocity value, and even the modified inter-val method provides the significantly large velocity value (whichcannot be thought to be right value). To assess this problem,the signal traces of upper and lower receivers obtained near thelayer boundary were plotted in Fig. 16. At a depth of 9.11 mand 9.61 m, the signals in the upper receiver arrive faster thanthose in the lower receiver. Whereas, at the depth of 10.11 mand 10.61 m, the signals in the upper receiver arrive later andthe travel time delay became negative, indicating that intervalmethod is unable to be used in the data reduction here. Even inthis circumstance, the Snell’s Law ray-path method provides thereliable results following the stiffness trends expected by SPT-Nvalues, showing the great advantages in the downhole data re-duction.
O-nung Bridge Site
Another downhole seismic test was performed at O-nung Bridgesite, Kyeongju, Korea. The site consists of a fill layer and clayeygravel deposit. The results of this site also support the parametric
Copyright by ASTM Int'l (all rights reserved); Fri Aug 29 05:39:31 EDT 2008Downloaded/printed byNational Cheng Kung University pursuant to License Agreement. No further reproductions authorized.

KIM ET AL. ON VS PROFILES 11
FIG. 16—Field testing results of the Grass site: (a) soil profile, shear wave velocity profiles, and SPT-N values; and (b) signal trace of shear wave.
study as shown in Fig. 17. In the case where the stiffness of soilincreases at the shallow layer, the arrival times of lower receiverswere faster than those of upper receivers. Therefore, the velocity ofthose layers can’t be evaluated by using the interval measurement,and the results determined by the modified interval measurement arenot satisfactory because the variation of shear wave velocity valuesis large and is not consistent with SPT-N values. However, theresult determined by using Snell’s Law ray-path method is thoughtto be reasonable. These phenomena that interval measurement andmodified interval measurement give erroneous results often occurin field downhole seismic tests when the stiffness contrast is severenear the ground surface.
Conclusions
To evaluate the reliability of the various downhole data reductionmethods, the parametric studies were performed using synthesizedprofiles. The modified interval and Snell’s Law methods, whichconsider the ray path in the data reduction as well as the con-ventional direct and interval method, were considered. The directmethod provides a mean value of surrounding layers, and it is dif-ficult to evaluate the detailed velocity profile. The interval methodwas found to provide severe errors, particularly when the stiff layeris located beneath the soft layer. The testing errors in the intervalmethod are reduced as decreasing source to borehole spacing. The
Copyright by ASTM Int'l (all rights reserved); Fri Aug 29 05:39:31 EDT 2008Downloaded/printed byNational Cheng Kung University pursuant to License Agreement. No further reproductions authorized.

12 GEOTECHNICAL TESTING JOURNAL
FIG. 17—Field testing results at the O-nung Bridge site: (a) soil profile, shear wave velocity profiles, and SPT-N values; and (b) signal trace of shearwave.
modified interval method, which considers a straight path, providesreasonable results for the most cases, but this method may causeerrors at the layer interface where a large soft to stiff contrast exists.The Snell’s Law ray path method provides the most reliable velocityprofiles in all cases. Downhole seismic tests were also performedat three sites, and by comparing with crosshole and standard pen-etration test results, the importance of considering ray path in thedata reduction was assessed.
Acknowledgment
This study was sponsored by Smart Infra-Structure TechnologyResearch Center (SISTeC), which is gratefully acknowledged.
References
Auld, B., 1977, “Cross-Hole and Down-Hole VS by Mechanical Im-pulse,” Journal of the Geotechnical Engineering Division, ASCE,Vol. 103, No. GT12, pp. 1381–1398.
Bang, E. S., 2001, “The Evaluation of Shear Wave Velocity ProfilesUsing Downhole and Uphole Test,” Master Thesis, The Depart-ment of Civil and Environmental Engineering, KAIST, Daejeon,Korea.
Batsila, E. V., 1995, “Investigation of Ray Path Assumption onDownhole Velocity Profile,” Master Thesis, The Department ofCivil Engineering, The University of Texas at Austin, Austin,TX.
Campanella, R. G. and Stewart, W. P., 1992, “Seismic Cone Analy-sis Using Digital Processing for Dynamic Site Characterization,”Canadian Geotechnical Journal, Vol. 29, pp. 477–486.
Hoar, R. J. and Stokoe, K. H., II, 1978, “Generation and Measure-ment of Shear Waves In Situ,” Dynamic Geotechnical Testing,ASTM STP 654, ASTM International, West Conshohocken, PA,pp. 3–29.
Hunter, J. A., Benjumea, B., Harris, J. B., Miller, R. D., Pullan,S. E., Burns, R. A., and Good, R. L., 2002, “Surface andDownhole Shear Wave Seismic Methods for Thick Soil Site
Copyright by ASTM Int'l (all rights reserved); Fri Aug 29 05:39:31 EDT 2008Downloaded/printed byNational Cheng Kung University pursuant to License Agreement. No further reproductions authorized.

KIM ET AL. ON VS PROFILES 13
Investigations,” Soil Dynamics and Earthquake Engineering,Vol. 22, pp. 931–941.
Joh, S. H. and Mok, Y. J., 1998, “Development of an InversionAnalysis Technique for Downhole Seismic Testing and Con-tinuous Seismic CPT,” Journal of Korea Geotechnical Society,Vol. 14, No. 3, pp. 95–108.
Kramer, S. L., 1996, Geotechnical Earthquake Engineering,Prentice Hall, Upper Saddle River, NJ, pp. 207–208.
Kim, D. S., Chung, C. K., Sun, C. G., and Bang, E. S., 2002, “SiteAssessment and Evaluation of Spatial Earthquake Ground Mo-tion of Kyeongju,” Soil Dynamics and Earthquake Engineering,Vol. 22, Issue 5, pp. 371–387.
Larkin, T. J. and Taylor, P. W., 1979, “Comparison of Down-Holeand Laboratory Shear Wave Velocities,” Canadian GeotechnicalJournal, Vol. 16, pp. 152–162.
Martin, G. K. and Mayne, P. W., 1997, “Seismic Flat DilatometerTests in Connecticut Valley Varved Clay,” Geotechnical TestingJournal, Vol. 20, No. 3, pp. 357–361.
Mok, Y. J., 1987, “Analytical and Experimental Studies of BoreholeSeismic Methods,” Ph.D. Dissertation, The Department of CivilEngineering, The University of Texas at Austin, Austin, TX.
Robertson, P. K., Campanella, R. G., Gillespie, D., and Rice, A.,1986, “Seismic CPT to Measure in Situ Shear Wave Velocity,”Journal of Geotechnical Engineering, Vol. 112, No. 8, pp. 791–803.
Schneider, J. A., Mayne, P. W., and Rix, G. J., 2001, “GeotechnicalSite Characterization in the Greater Memphis Area Using ConePenetration Tests,” Engineering Geology, Vol. 62, pp. 169–184.
Stewart, W. P. and Campanella, R. G., 1993, “Practical Aspectsof In Situ Measurements of Material Damping with the Seis-mic Cone Penetration Test,” Canadian Geotechnical Journal,Vol. 30, pp. 211–219.
Sully, J. P. and Campanella, R. G., 1995, “Evaluation ofIn Situ Anisotropy from Crosshole and Downhole ShearWave Velocity Measurements,” Geotechnique, Vol. 45, No. 2,pp. 267–282.
Copyright by ASTM Int'l (all rights reserved); Fri Aug 29 05:39:31 EDT 2008Downloaded/printed byNational Cheng Kung University pursuant to License Agreement. No further reproductions authorized.