evaluation of power control system for micro and nano
TRANSCRIPT

1
Evaluation of Power Control System for Micro and Nano Satellites
by Hardware-in-the-Loop Simulator
Yuji Sakamoto, Toshinori Kuwahara, et al.
Tohoku University, Japan
16 AUG 2012
Small Satellite Conference
UTAH, US

2

3 Background
• SPRITE-SAT (RISING), Tohoku University 1st satellite
– JAN 2009, launched and started operation
• defects of battery charge and discharge H/W control
→ a lot of efforts for power system evaluation were being devoted after following satellites

4
from catalogue of SANYO Twicell(R)
Charging history
Discharging history
ba
tter
y vo
ltag
e (V
) b
atte
ry v
olt
age
(V)
battery capacity (%)
battery capacity (%)
ba
tter
y te
mp
era
ture
(deg
C)
voltage
temp.
environment 20 degC
environment 20 degC

5
• Charging was not stopped at the full capacity
→ capacity was manually controlled by On/Off of instruments
• because of shade by mast, output from one solar panel was decreased
– charging was decreased, and critical low voltage was occurred
• At present, the telemetry signals are not modulated (0.1W CW signals can be monitored)
→ data handling system is defective (estimated)

6 Objectives
• Using Hardware in the Loop (HIL) simulator, power system is evaluated in system level
• Utilized for developing RISING-2 and RAIKO
→ Solar generation power and bus consuming power are supplied or consumed by external equipment
→ onboard power status is monitored by telemetry data
→ results are compared to software simulator, then the math model is improved

7

8 Size: 50x50x50 cm Mass: 41 kg Orbit: SSO, 628-km alt., launched in 2013
Spec. of RISING-2
Lightning and Sprite CMOS Imager (LSI)
- 1st CMOS (762nm) - 2nd CMOS (740-830nm)
- FOV = 27x27 deg
Wide Field CCD (WFC)
FOV = 134x180deg
High Precision Telescope (HPT) - 5-m resolution telescope with ZPF mirror - 10-cm diameter, 1-m focal length - RGB and Multi-spectrum CCDs incl. of LCTF (liquid crystal tunable filter)
Bolometer Array (BOL)
FOV = 29 deg
around Sendai Sta. (3.3 x 2.5 km)
(C)Google
5m reso. ground photo cumulonimbus clouds Sprite, terrestrial lightning events

9
SCU Satellite Central Unit
ACU Attitude Control Unit
SHU Science Handling Unit
PCU Power Control Unit

10
satellite (EM)
dummy solar power dummy ground station (transmitter and receiver for ground station) ground operation software
System-level electrical test
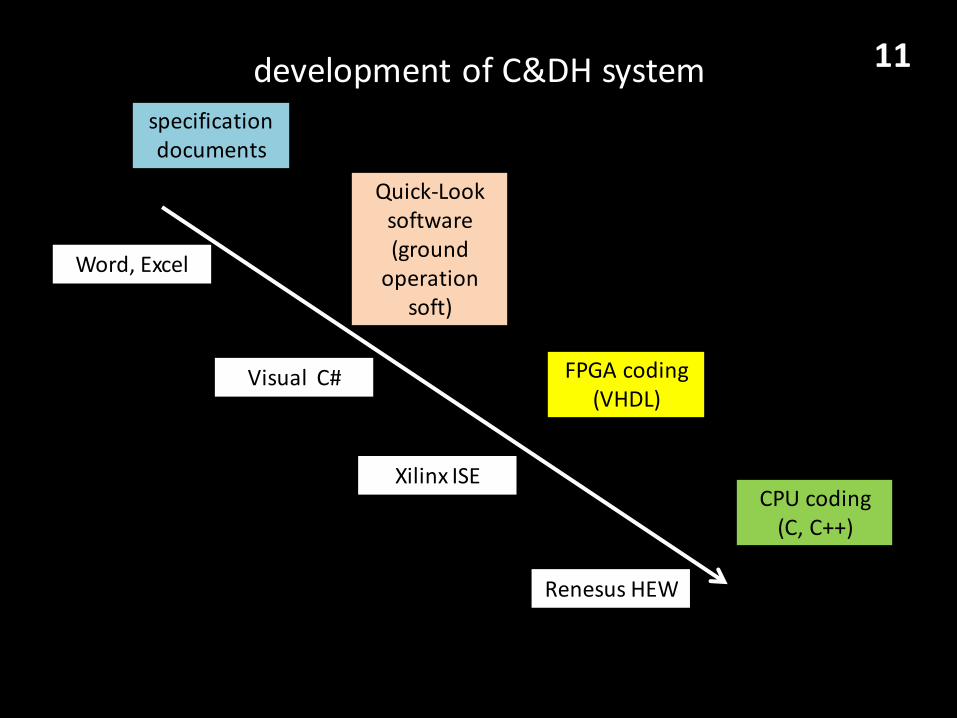
11
specification documents
Quick-Look software (ground
operation soft)
FPGA coding (VHDL)
CPU coding (C, C++)
Word, Excel
Visual C#
Xilinx ISE
Renesus HEW
development of C&DH system

12
(1)
(2)
(3)
(4)
(5)
(6)

13 OLD ground operation software for 1st satellite SPRITE-SAT
difficult to recognize the status and troubles
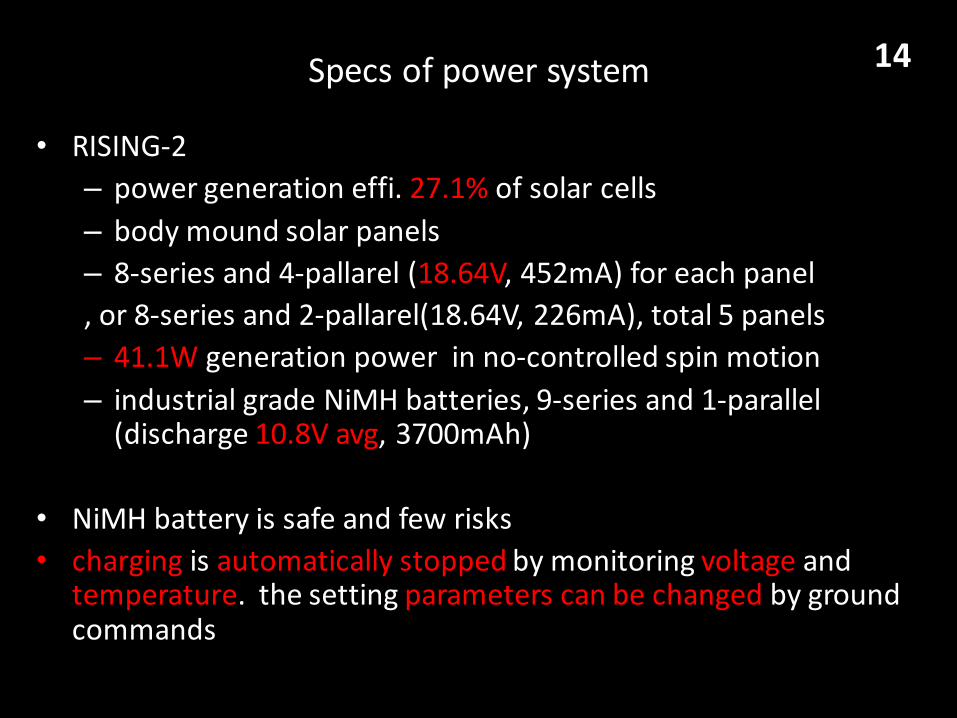
14 Specs of power system
• RISING-2
– power generation effi. 27.1% of solar cells
– body mound solar panels
– 8-series and 4-pallarel (18.64V, 452mA) for each panel
, or 8-series and 2-pallarel(18.64V, 226mA), total 5 panels
– 41.1W generation power in no-controlled spin motion
– industrial grade NiMH batteries, 9-series and 1-parallel (discharge 10.8V avg, 3700mAh)
• NiMH battery is safe and few risks
• charging is automatically stopped by monitoring voltage and temperature. the setting parameters can be changed by ground commands

15
solar panel simulator (agilent corp. E4350B)

16
electrical load (KIKUSUI PLZ164WA)

17
A. Satellite (REAL)
Data Handling
Unit
RF
TransmitterPower Control
Unit
Telemetry
ReceiverSolar Panel
(Dummy)
Load
(Dummy)
B. Satellite(Simulator)a. Operation
Software(for REAL)
desktop PC #1
desktop PC #2
SIGNAL
POWER
H/W
S/W
RF
telemetry
b. Operation
Software(for Simulator)
command telemetry
HILS
equipment

18 DEMO

19 Software Simulator
• aspects of Software in the Loop(SILS) simulator
– in the combination of SatSimulator and ground operation software, the estimated status of dummy satellite can be checked
– in addition to real-time mode (125-ms period), the fast mode (speed is up to computer) can be available. the simulations with various conditions can be evaluated quickly
• 1: Orbit & Attitude Simulator
– calculating the orbit and attitude
– updating status of orbit, attitude, solar cells, magnetometer, and so on

20 Software Simulator
• 2: coarse control by onboard computer
– magnetic coils control by update values of solar cells and magnetometers
• 3: calculation in power control unit
– decide the battery charging or discharging mode from the comparison of bus consuming power and solar generation power
– decide the voltage and current of solar panels and batteries from the math models
– adopting the power converting efficiency or power loss (70% is suitable in the first stage)
21
60
70
80
90
100
0 10 20 30 40 50 60 70 80 90 100
BA
T-S
OC
(%
)
time after start of eclipse (min)
Battery State of Charge
MIN = 67.5 %(DOD 32.5 %)
sunshine (35.4 - 97.3 min)eclipse (0 - 35.4 min)
MODE-A0
(0 - 10min)MODE-A0
(75-min)
MODE-A0
(25-60min)
MODE-A4
(60-65min)
MODE-S6
(65-75min)
MODE-A4
(10-15min)
MODE-S6
(15-25min)
REAL0
10
20
30
40
50
60
0 10 20 30 40 50 60 70 80 90 100
Po
we
r (W
)
time after start of eclipse (min)
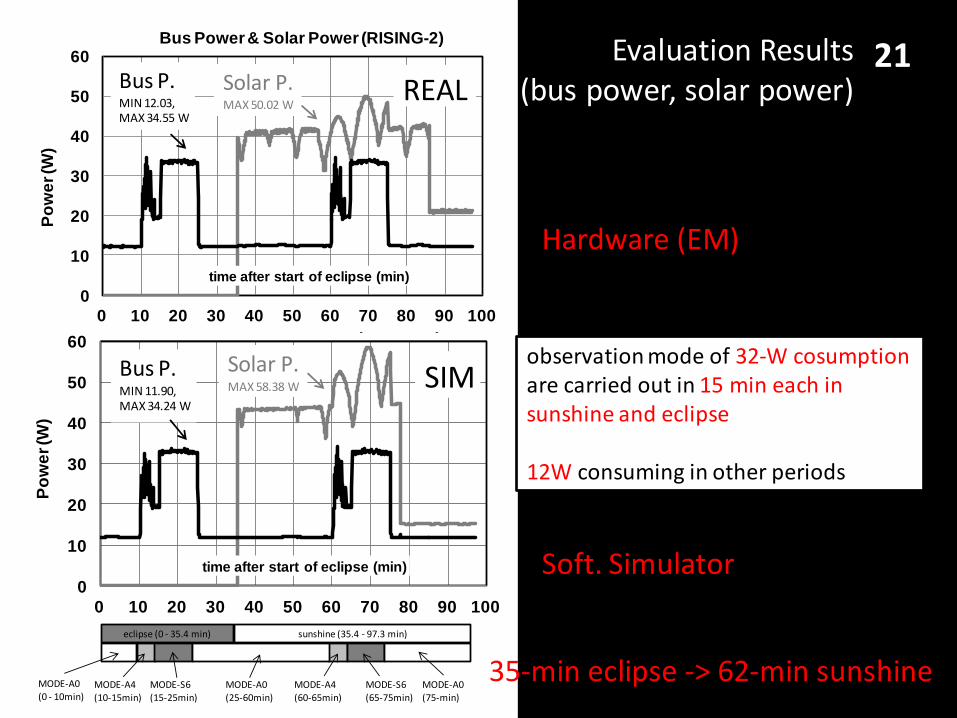
Bus Power & Solar Power (RISING-2)
SIMBus P.MIN 11.90,MAX 34.24 W
Solar P.MAX 58.38 W
0
10
20
30
40
50
60
0 10 20 30 40 50 60 70 80 90 100
Po
we
r (W
)
time after start of eclipse (min)
Bus Power & Solar Power (RISING-2)
REALBus P.MIN 12.03,MAX 34.55 W
Solar P.MAX 50.02 W
observation mode of 32-W cosumption are carried out in 15 min each in sunshine and eclipse 12W consuming in other periods
Evaluation Results (bus power, solar power)
Hardware (EM)
Soft. Simulator
35-min eclipse -> 62-min sunshine

22
60
70
80
90
100
0 10 20 30 40 50 60 70 80 90 100
BA
T-S
OC
(%
)
time after start of eclipse (min)
Battery State of Charge
MIN = 67.5 %(DOD 32.5 %)
sunshine (35.4 - 97.3 min)eclipse (0 - 35.4 min)
MODE-A0
(0 - 10min)MODE-A0
(75-min)
MODE-A0
(25-60min)
MODE-A4
(60-65min)
MODE-S6
(65-75min)
MODE-A4
(10-15min)
MODE-S6
(15-25min)
REAL
10
11
12
13
14
0 10 20 30 40 50 60 70 80 90 100
T.C
.BA
T-V
(V
)
time after start of eclipse (min)
Temp. Comp. Battery Voltage (RISING-2)
TERM-V (13.13V)at 85.9 min
MAX = 13.17 VMIN = 11.01 V
REAL
10
11
12
13
14
0 10 20 30 40 50 60 70 80 90 100
T.C
.BA
T-V
(V)
time after start of eclipse (min)
Temp. Comp. Battery Voltage (RISING-2)
TERM-V (13.13V)at 77.5 min
MAX = 13.17 VMIN = 11.65 V
SIM
(Temp. Comp. battery voltage)
Hardware (EM)
Soft. Simulator

23
60
70
80
90
100
0 10 20 30 40 50 60 70 80 90 100
BA
T-S
OC
(%
)
time after start of eclipse (min)
Battery State of Charge
MIN = 67.5 %(DOD 32.5 %)
sunshine (35.4 - 97.3 min)eclipse (0 - 35.4 min)
MODE-A0
(0 - 10min)MODE-A0
(75-min)
MODE-A0
(25-60min)
MODE-A4
(60-65min)
MODE-S6
(65-75min)
MODE-A4
(10-15min)
MODE-S6
(15-25min)
REAL
60
70
80
90
100
0 10 20 30 40 50 60 70 80 90 100
BA
T-S
OC
(%
)
time after start of eclipse (min)
Battery State of Charge (RISING-2)
MIN = 69.8 %(DOD 30.2 %)
sunshine (35.4 - 97.3 min)eclipse (0 - 35.4 min)
MODE-A0
(0 - 10min)MODE-A0(75-min)
MODE-A0(25-60min)
MODE-A4(60-65min)
MODE-S6(65-75min)
MODE-A4(10-15min)
MODE-S6(15-25min)
SIM
(Battery State-of-charge)
Hardware (EM)
Soft. Simulator

24 Cubesat RAIKO
by team of Wakayama Univ. and Tohoku Univ.
2.6-kg 2U size Cubesat Using spin-off technologies from 50-kg micro satellites
Now in International Space Station Will be released in September (planned)

25 Cubesat RAIKO Features 1) by total 3 cameras, the photos of ISS, Earth, and stars are obtained * color wide-view CMOS, color fish-eye CCD, and mono CCD * in 30-min after satellite release to orbit, total 46 photos of ISS are taken * photos can be taken at anywhere in globe by task schedule commands 2) high-rate telemetry communication (38.4kbps nom. to 500kbps max.) * 2.2GHz data transmitter, 13GHz data transmitter and 13GHz beacon transmitter 3) 50-cm rectangle thin film is deployed at 300-km alt. for de-orbit experiment
inside of sat. test phote by fish-eye CCD deployable film

26 Spec of power system
• RAIKO
– solar power generation effi. 29.5 % (from catalogue)
– 2-series and 1-pallarel (4.82V, 438mA) for each panel, total 6 panels (12 cells)
– total 10 panels when 2 paddles are opened
– 3.19W power generation in no-control spin motion when paddle closed, and 4.70W when paddle opened
– batteries are commercial NiMH (eneloop), 8-series and 1-parallel (discharge 9.6V avg, 750mAh)

27
0
5
0 10 20 30 40 50 60 70 80 90 100
Po
we
r (W
)
time after start of eclipse (min)
Bus Power & Solar Power (RAIKO)
Bus P.MIN 0.71,MAX 4.56 W
SIM Solar P.MAX 4.93 W
circle orbit51.6-deg incl.300-km alt.2.0-deg/s spin
75
80
85
90
95
100
0 10 20 30 40 50 60 70 80 90 100
BA
T-S
OC
(%
)
time after start of eclipse (min)
Battery State of Charge (RAIKO)
MIN = 92.6 %(DOD 7.4 %)
sunshine (36.3 - 90.5 min)eclipse (0 - 36.3 min)
MODE-S/B(0 - 59min)
MODE-S/B(67-90.5min)
MODE-COMM
(59-67min)
SIMcircle orbit51.6-deg incl.300-km alt.2.0-deg/s spin
(bus power, solar power)
(SOC)
Soft. Simulator
Soft. Simulator

28 Conclusions
• Using hardware and software simulators, the health of system can be estimated in long time span before and after the launch
– defectives can be found
– long-time evaluation of battery performance
– quick evaluation of power system before and after environmental tests
• After the launch, using software simulator including the improved math model, future power status can be estimated correctly (nominal case, and especially emergency case)