evaluation and performance monitoring of corrosion...
TRANSCRIPT
EVALUATION AND PERFORMANCE MONITORING OF
CORROSION PROTECTION BY FIBER-REINFORCED
COMPOSITE WRAPPING
by
S. M. Verhulst, L. A. Fuentes, J. O. Jirsa,
D. W. Fowler, H. G. Wheat, and T. Moon
Research Report No. 1774-1
Research Project 0-1774
“Effect of Wrapping Chloride Contaminated Structural Concrete with Multiple
Layers of Glass Fiber/Composites and Resin”
conducted for the
Texas Department of Transportation
in cooperation with the
U.S. Department of Transportation
Federal Highway Administration
by the
CENTER FOR TRANSPORTATION RESEARCH
BUREAU OF ENGINEERING RESEARCH
THE UNIVERSITY OF TEXAS AT AUSTIN
January 2001

iv
Research performed in cooperation with the Texas Department of Transportation and the U.S.
Department of Transportation, Federal Highway Administration.
ACKNOWLEDGMENTS
We greatly appreciate the financial support from the Texas Department of Transportation that made this project possible. The support of the Project Director, Jon Kilgore, (SAT) and Project Coordinator, W. Cox, (BRG) is also very much appreciated. We would also like to thank monitoring committee members, R. Baker (LBB), David McDonnold (BRG), and Keith Ramsey (BRG) for their guidance on this project.
DISCLAIMER
The contents of this report reflect the views of the authors, who are responsible for the facts and the accuracy of
the data presented herein. The contents do not necessarily reflect the view of the Federal Highway
Administration or the Texas Department of Transportation. This report does not constitute a standard,
specification, or regulation.
NOTICE
The United States Government and the state of Texas do not endorse products or manufacturers. Trade or
manufacturers’ names appear herein solely because they are considered essential to the object of this report.
NOT INTENDED FOR CONSTRUCTION,
BIDDING, OR PERMIT PURPOSES
James O. Jirsa, Texas P.E. No. 31360
David Fowler, Texas P.E. No. 27859
Harovel Wheat, Texas P.E. No. 78364
Tess Moon
Research Supervisors
v
TABLE OF CONTENTS
�
������������������� � �����������������������������������������������������������������������������������������������������������������
1.1 INTRODUCTION ......................................................................................................................1
1.2 OVERVIEW OF PROTECTION AND DETECTION STRATEGIES ..............................................2
1.3 OBJECTIVE .............................................................................................................................3
���������������� ���������� �������������� ������ �����������������������������������������������
2.1 THE CORROSION PROCESS ...................................................................................................5
2.2 CAUSES OF CORROSION IN REINFORCED CONCRETE.........................................................6
2.3 COMMON METHODS FOR CORROSION REPAIR AND PREVENTION ....................................8
������ ��������� ������� �����������������������������������������������������������������������������������������������������
������ ������� ������� �����������������������������������������������������������������������������������������������������������
2.4 CORROSION PROTECTION PROVIDED BY FRP WRAPPING SYSTEMS................................9
���������������� ������������ ���� � �� ����������������������������������������������������������������������������
3.1 FRP COMPOSITES ...............................................................................................................11
������ ���������������������������������� ���������������������������������������������������������������������
������ ������� �!"�����"�#�� ����������������������������������������������������������������������������������
������ $���%����������������������������������������������������������������������������������������������������
����&� ����������������'���'��(������)����*�+����(� ���������������������������������������������,�
����������������������� ������������������� ��������������������������������������������������������������
4.1 SPECIMEN VARIABLES ........................................................................................................21
4.2 SPECIMEN CONSTRUCTION.................................................................................................25
4.3 CONCRETE DESIGN..............................................................................................................26
4.4 PRE-WRAP PREPARATION ..................................................................................................30
&�&��� ����-�"���������������������������������������������������������������������������������������������������������������������.�
&�&��� ���������������������������������������������������������������������������������������������������������������������������������
&�&��� ���������/'�0��� ����������������������������������������������������������������������������������������������������&�
4.5 FRP WRAPPING...................................................................................................................34
&�,��� 1� ���)�������������������������������������������������������������������������������������������������������������������
&�,��� 2�������)���� �������������������������������������������������������������������������������������������������������&.�
&�,��� 3�0�����)�*���"����������������������������������������������������������������������������������������������������&&�
4.6 CORROSION DEVELOPMENT AND MONITORING ...............................................................46
&�4��� �� �%����!������ �������������������������������������������������������������������������������������������&4�
&�4��� ��������� �����" �����������������������������������������������������������������������������������������������&��
������������ ����� �� ��������������� �����������������������������������������������
5.1 OUTLINE OF CONSTRUCTION METHODS ...........................................................................51
,����� ������ ��5������������������������� ����������������������������������������������������������������,��
,����� #�� ���������*6$����$�0�����
�%�����"��)��� �������������������������������������������,��
5.2 EVALUATION PRIOR TO REPAIR.........................................................................................56
vi
,����� $������������������������ ���5��������������������������������������������������������������������,4�
,����� ������������� �������������������������������������������������������������������������������������������,��
,����� �' ���5������1���������������������������������������������������������������������������������������4��
,���&� ������0� �)�*���"�������������������������������������������������������������������������������������������������4��
5.3 CONTINUED PERFORMANCE MONITORING IN SERVICE ...................................................63
,����� !�0�55�5�����������������0�� ����������������������������������������������������������������������������4&�
,����� � ������3�"7*����!�� ������������������������������������������������������������������������������������48�
5.4 INTRODUCTION TO EQUIPMENT AND USAGE.....................................................................67
,�&��� 3������� ���9�������������������������������������������������������������������������������������������������������4��
,�&��� 1������������*���"�!������������������������������������������������������������������������������8.�
5.5 CORROSION RATE MEASUREMENT EQUIPMENT ..............................................................70
,�,��� �3��1���������������������������������������������������������������������������������������������������������������������8.�
,�,��� *'����7 ���� ��������������������������������������������������������������������������������������������������������8��
,�,��� 2�����1����� ������������������������������������������������������������������������������������������������������������88�
,�,�&� �������!�0�55�5�����������������0�����������������������������������������������������������������8��
,�,�,� :!*!;� �����"�! ����5������������������������������������������������������������������������������������.�
5.6 SURFACE AIR FLOW (SAF) PERMEABILITY DEVICE ........................................................80
����������������������������� �� ����������������������������������������������������������������������������������������
6.1 SUMMARY ............................................................................................................................83
6.2 FRP COMPOSITE WRAPPING SYSTEMS FOR CORROSION PROTECTION.........................83
6.3 LABORATORY RESEARCH ...................................................................................................83
4����� ������� ����� ���5� �'�5��������������������������������������������������������������������������������������
4����� ���������%�������������������������������������������������������������������������������������������������������������
4����� *��� �'�5����� � ��������������������������������������������������������������������������������������������������&�
6.4 PERFORMANCE MONITORING EQUIPMENT.......................................................................84
6.5 RECOMMENDATIONS FOR CONTINUING AND FURTHER RESEARCH................................84
APPENDIX A: REPAIR MATERIALS .............................................................................................87
APPENDIX B: PRODUCTS USED ON PROJECT CSR 783-2-66...........................................95
BIBLIOGRAPHY..............................................................................................................................99
vii
LIST OF FIGURES
Figure 1.1 Structure wrapped with FRP .............................................................................................1
Figure 1.2 Damage at downstream endcap .........................................................................................3
Figure 2.1 Corrosion reactions and rust formation on the steel surface (Broomfield 1997)..............6
Figure 2.2 Termination of the passive layer by chloride ions (Broomfield 1997) .............................7
Figure 3.1 Endcap delamination .......................................................................................................14
Figure 4.1 Cross section of beams (1 in. = 2.54 cm) ........................................................................25
Figure 4.2 Cross section of columns (1 in. = 2.54 cm).....................................................................26
Figure 4.3 Placing concrete in cylindrical forms..............................................................................28
Figure 4.4 Vibrating concrete in columns ........................................................................................28
Figure 4.5 Wet-mat curing of beams ................................................................................................29
Figure 4.6 Loading configuration .....................................................................................................30
Figure 4.7 Cracked specimen............................................................................................................30
Figure 4.8 Concrete removed prior to repair ....................................................................................32
Figure 4.9 Mixing repair materials ...................................................................................................33
Figure 4.10 Vibrating columns ...........................................................................................................33
Figure 4.11 Drypacking procedure .....................................................................................................34
Figure 4.12 Cutting the fabric.............................................................................................................35
Figure 4.13 Saturating fabric with resin .............................................................................................35
Figure 4.14 Wrapping beam end.........................................................................................................36
Figure 4.15 Wrapping beams..............................................................................................................36
Figure 4.16 Injecting voids .................................................................................................................37
Figure 4.17 Sealing joints of column wrap.........................................................................................37
Figure 4.18 Painting wrapped column................................................................................................38
Figure 4.19 Irrigation pipes over beams .............................................................................................47
Figure 4.20 Row of columns...............................................................................................................47
Figure 4.21 Storage tank filled with salt water...................................................................................48
Figure 4.22 Access hole on wrapped column .....................................................................................48
Figure 4.23 Detail of greased ground clamp.......................................................................................49
Figure 5.1 Endcap damage to Structure #5.......................................................................................51
Figure 5.2 Closeup of corrosion damage on Structure #8 ................................................................52
Figure 5.3 Endcap prepared for application of repair material on Structure #3...............................52
Figure 5.4 Application of Shotpatch 21F to Structure #3 .............................................................53

viii
Figure 5.5 Endcap repair material on Structure #3...........................................................................53
Figure 5.6 Saturation machine used by Delta Structural Technology, Inc. ......................................54
Figure 5.7 Application of Fibrwrap to endcap on Structure #2.....................................................54
Figure 5.8 Removal of air pockets beneath a layer of Fibrwrap ...................................................55
Figure 5.9 Wrapped and painted endcap on Structure #2.................................................................55
Figure 5.10 Corrosion damage on downstream endcap......................................................................56
Figure 5.11 Closeup of area with severe concrete spalling ................................................................57
Figure 5.12 Concrete spalling on a bridge support column................................................................57
Figure 5.13 Corrosion potential (mV vs. CSE) values from different equipment..............................59
Figure 5.14 Corrosion current density (µA/cm2) values from different equipment...........................59
Figure 5.15 Delaminations and corrosion stains on a downstream endcap........................................61
Figure 5.16 Permeability core taken from Structure #10....................................................................62
Figure 5.17 Grinding of the reinforcement to prepare for soldering ..................................................64
Figure 5.18 Torch flame for solder application ..................................................................................65
Figure 5.19 Application of flame to the copper-steel interface ..........................................................65
Figure 5.20 Typical silver soldered electrical connection..................................................................66
Figure 5.21 Installed probe on Structure #7 .......................................................................................66
Figure 5.22 Hypothetical anodic and cathodic polarization curves (Jones 1996) ..............................68
Figure 5.23 The saltwater ponding beams (from an ongoing project at Ferguson Structural
Engineering Laboratory) used for corrosion rate testing ................................................70
Figure 5.24 The 3LP device................................................................................................................71
Figure 5.25 The PR-Monitor device (Scannell, Sohanghpurwala, and Islam 1996) ..........................72
Figure 5.26 Schematic of equipment without a CE guard ring (Broomfield 1997) ...........................73
Figure 5.27 Schematic of equipment with a CE guard ring (Broomfield 1997).................................73
Figure 5.28 Gecor 6 device – sensors and rate meter (James Instruments)........................................77
Figure 5.29 Schematic of the corrosion rate sensor for Gecor 6 (James Instruments).......................78
Figure 5.30 Concorr corrosion rate probe and connection cable (Concorr, 1998).............................79
Figure 5.31 Lengthwise section of embedded corrosion rate probe...................................................79
Figure 5.32 Cross section of embedded corrosion rate probe ............................................................79
ix
LIST OF TABLES
Table 3.1 FRP wrap manufacturers (Bassett 1998) ..........................................................................14
Table 3.2 Hardshell material properties (Hardcore, Inc. 1996) ........................................................17
Table 4.1 Specimen dimensions........................................................................................................21
Table 4.2 Rectangular specimens......................................................................................................23
Table 4.3 Cylindrical specimens .......................................................................................................24
Table 4.4 Trial mix design ................................................................................................................26
Table 4.5 Compression strength........................................................................................................27
Table 4.6 Permeability ......................................................................................................................27
Table 4.7 Slump measurements ........................................................................................................27
Table 4.8 Test results ........................................................................................................................29
Table 4.9 Crack data .........................................................................................................................31
Table 4.10 Panel weight changes (Falabella 1993).............................................................................39
Table 4.11 Curing agents for epoxy resins (Joyce et. al 1998)...........................................................41
Table 4.12 Room-temperature properties of liquid resins (Joyce et. al 1998)....................................42
Table 4.13 Fabric properties (Owens Corning Fabrics 1998).............................................................43
Table 4.14 Average test results (Joyce et. al 1999) ............................................................................45
Table 5.1 Corrosion rate measurement data on Project CSR 783-2-66 ............................................58
Table 5.2 Guidelines for data interpretation corrosion rate devices (Scannell, Sohanghpurwala,
and Islam 1996).................................................................................................................60
Table 5.3 Chloride percentages by concrete weight for structures in Project CSR 783-2-66 ..........61
Table 5.4 Concrete permeability measurements for Project CSR 783-2-66 .....................................63
Table 5.5 Relative permeabilities for the SAF device (Scannell, Sohanghpurwala, and Islam
1996) .................................................................................................................................63
Table 5.6 Probe installation locations...............................................................................................67
Table 5.7 PR-Monitor values at 7 months of exposure.....................................................................75
Table 5.8 PR-Monitor vs. 3LP for corrosion rate measurement at 15 months of exposure..............76

x
xi
SUMMARY
Corrosion in reinforced concrete structures is causing deterioration of our infrastructure. Structures
in or near marine environments and transportation structures on which deicing salts are used are
especially vulnerable. A widely promoted method for repairing damaged structures or for protecting
structures in corrosive environments is the application of fiber-reinforced composite wraps over the
surface of the concrete elements. In this report, material properties and installation procedures for
two fiber-reinforced wrapping systems are described. A test program for evaluating their
performance for long-term corrosion protection is discussed. A field research program to analyze the
effects of composite wrapping systems on the corrosion process is described. Performance
monitoring with various devices to help determine corrosion conditions before and after application
of the wrapping system is discussed.

1
CHAPTER 1
INTRODUCTION
1.1 INTRODUCTION
Corrosion of reinforcing steel in concrete leads to the premature failure of many structures exposed to
harsh environments. Rust products form on the bar, expanding its volume and creating stress in the
surrounding concrete. This leads to cracking and spalling, both of which can severely reduce the service
life and strength of a member. Corrosion of reinforcing steel in concrete structures is one of the most
expensive problems facing civil engineers in the United States. The structural integrity of many bridges,
overpasses, parking garages, and other concrete structures has been impaired by corrosion, and repairs are
urgently required to ensure public safety (Jones 1996).
As structures approach the end of their design life, new and improved methods for repair and
rehabilitation of corroded members must be developed. To prevent and arrest corrosion activity at an
early stage, accurate detection techniques are necessary. Because of the increasing number of corrosion-
related problems in the field of structural design, research is continuously being conducted to evaluate and
implement efficient repair strategies.
Fiber Reinforced Plastic (FRP) composite materials have been used for years as a method of providing
added strength and ductility to reinforced concrete structures. The conventional FRP system is a fabric
saturated with an epoxy resin, which is “wrapped” in layers around the concrete surface. FRP wrapping
has been most widely used in applications where seismic actions pose a threat to the strength and
deformation capacity of an existing structure.
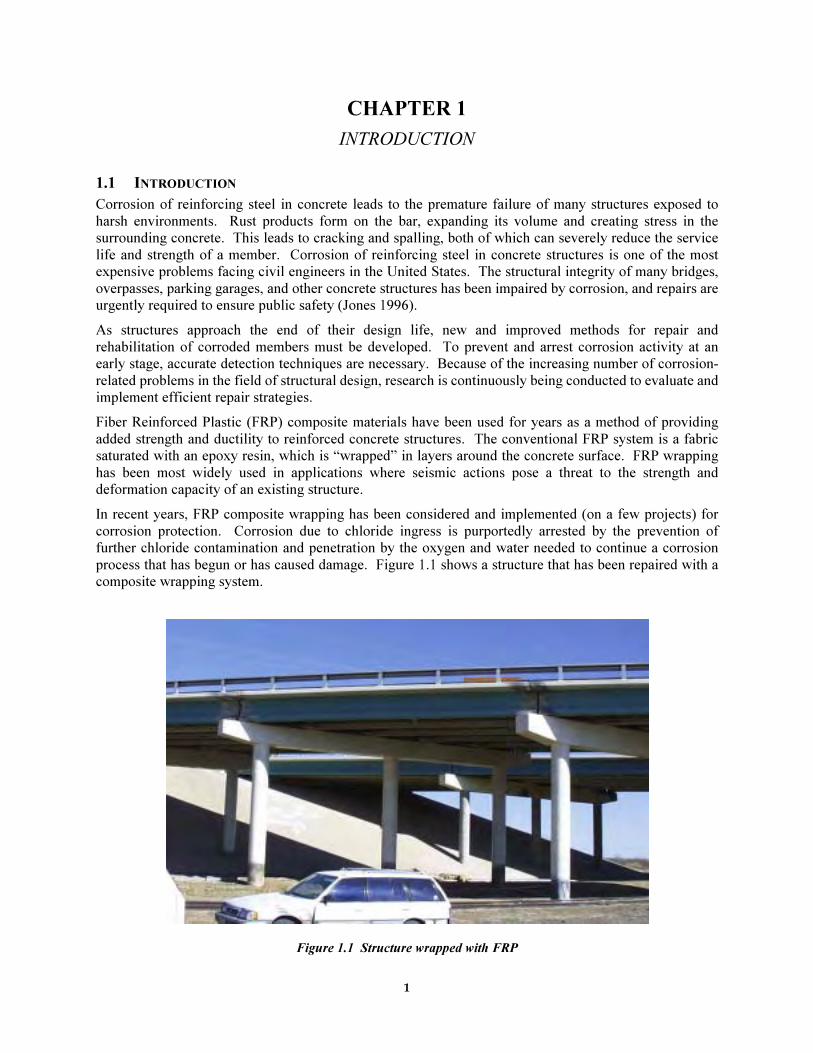
In recent years, FRP composite wrapping has been considered and implemented (on a few projects) for
corrosion protection. Corrosion due to chloride ingress is purportedly arrested by the prevention of
further chloride contamination and penetration by the oxygen and water needed to continue a corrosion
process that has begun or has caused damage. Figure 1.1 shows a structure that has been repaired with a
composite wrapping system.
Figure 1.1 Structure wrapped with FRP
2
To evaluate these procedures, Project 1774, “Effect of Wrapping Chloride Contaminated Structural
Concrete with Multiple Layers of Glass Fiber/Composites and Resin,” was initiated. Variables such as
the effect of cast-in chlorides, cracks, repairs, wet surfaces, wrap length, and presence of corrosion
inhibitor will be studied. Reduced-scale specimens were designed to simulate actual field conditions.
Delta Structural Technology, Inc. provided proprietary composite materials for use in the study. A
second FRP system was designed by personnel at the IMPACT laboratory of the Texas Materials Institute
(Joyce et al. 1998) using fibers and resins. In this report, the use of both systems in a corrosive
environment will be discussed.
Glass FRP wrappings supplied by Delta Structural Technology, Inc. are being used in a TxDOT bridge
rehabilitation project in Lubbock, Texas. Corrosion data recorded prior to the repair implementation will
be compared to post wrap results to verify the system’s effectiveness.
1.2 OVERVIEW OF PROTECTION AND DETECTION STRATEGIES
Many factors influence the durability of a reinforced concrete structure. It is possible to greatly reduce
the risk of corrosion by proper material selection and by implementing suitable design and maintenance
principles. Due to the limited duration of this project, many of the items discussed below were
manipulated in the laboratory to accelerate corrosion of the reinforced concrete specimens.
High quality concrete is more resistant to chloride penetration and carbonation (Vaca 1993). Low
permeability is crucial in defining durable concrete. This property is affected by the following variables:
water-cement ratio, concrete cover, curing process, compaction, and characteristics of the mix
constituents. Design and construction practices are very influential in defining corrosion resistance.
Concrete must be designed, compacted, and cured to minimize defects that will allow rapid ion
penetration. Precise engineering drawings must include drainage provisions and angles of inclination to
avoid water accumulation on the concrete surface. Supervision during the construction phase must ensure
that concrete cover, steel spacing and placement, vibration techniques, and finishing are all done
according to the specifications. It is important to protect the steel from rain and chemicals that might
cause it to corrode before placement. A harsh environment will cause corrosion even in the highest
quality steel-reinforced concrete. Alternating wet/dry cycles are very detrimental to concrete structures.
Marine exposure is one of the most severe environments in nature accelerating the corrosion process.
Deicing salts and other chemicals facilitate the penetration of chlorides and increase the likelihood of
corrosion. High temperatures, contaminated soils, industrial and polluted air are other factors that
increase the rate of corrosion. Increasing the resistance of the concrete cover to the penetration of
chlorides is the primary measure used in increasing the service life of marine structures.
The basic repair principle is to create a protective barrier around either the concrete or the steel, thus
decreasing permeability, and preventing the penetration of unwanted elements through the concrete to the
steel surface. Some of the techniques incorporating these ideas are epoxy coatings, dense concrete,
inhibitors, overlays, and sealers. FRP wrappings also work to eliminate water and oxygen from entering
the concrete, thus creating an airtight barrier system around the structure. Electrochemical methods such
as cathodic protection are also used to reduce corrosion damage.
The corrosion of steel is an electrochemical process that produces an electric current, measurable as an
electric field on the surface of the concrete. Most detection techniques currently used rely on the
electrochemical nature of corrosion for their data collection. A wide variety of instruments produced by
different manufacturers exists for this purpose. They may vary in size, cost, application methods,
underlying theories, and information given. The most used method is the half-cell potential procedure. In
addition, visual inspections should complement any monitoring program, but they may not detect
corrosion early enough to prevent serious damage. The acoustic emission (AE) method detects acoustic
waves generated by flaw growth, thus providing early and accurate data on corrosion activity. The
3
following two chapters of this report will provide detailed information on the most widely used corrosion
detection techniques and protection strategies.
1.3 OBJECTIVE
Because of the long-term aspect of Project 1774, this report represents an initial account of both
laboratory and field studies. The report will provide information on material selection and construction
practices. The specimen variables chosen for analysis are defined, and a detailed monitoring program for
future data collection is furnished. In addition to presenting laboratory work, a review of existing
corrosion detection and repair methods is presented. In the following chapter, composite use in
construction, and more specifically, for rehabilitation of damaged reinforced concrete is described. The
information will be helpful in identifying other civil engineering and government groups conducting
research on FRP or having completed successful infrastructure projects.
The objectives of this part of project 1774 are to:
• Determine the long-term effectiveness of a commercially manufactured FRP system in reducing
corrosion damage in chloride-contaminated structural elements subjected to long-term exposure.
• Study the performance of a generic composite system in a similar corrosive environment.
• Evaluate the performance of several traditional repair techniques and materials, including patches
done with latex-modified concrete and epoxy grout, and corrosion inhibitors, on specimens with
and without fiber wrapping that will be exposed to a corrosive environment.
A program for field research and performance monitoring has been established and is the focus of this
report. The purpose is to assess the condition of actual structures in a corrosive environment. The
structures are to be repaired and wrapped with FRP composites and evaluated both before and after repair.
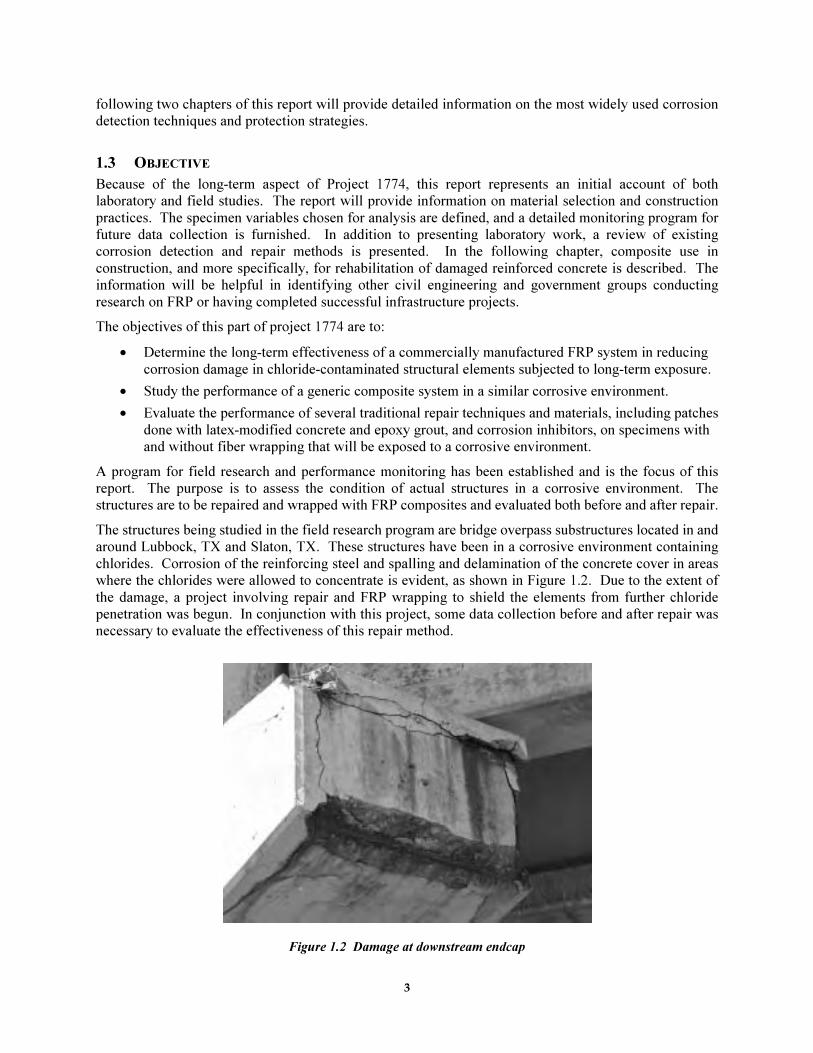
The structures being studied in the field research program are bridge overpass substructures located in and
around Lubbock, TX and Slaton, TX. These structures have been in a corrosive environment containing
chlorides. Corrosion of the reinforcing steel and spalling and delamination of the concrete cover in areas
where the chlorides were allowed to concentrate is evident, as shown in Figure 1.2. Due to the extent of
the damage, a project involving repair and FRP wrapping to shield the elements from further chloride
penetration was begun. In conjunction with this project, some data collection before and after repair was
necessary to evaluate the effectiveness of this repair method.
Figure 1.2 Damage at downstream endcap

4
5
CHAPTER 2
CORROSION OF STEEL IN A CONCRETE ENVIRONMENT
2.1 THE CORROSION PROCESS
Corrosion has increasingly become a structural problem the world over. Structures in and around marine
environments and transportation structures exposed to deicing salts are especially at risk. Of specific
interest are reinforced concrete structures, in which the steel cannot be inspected visually. Corrosion of
steel in concrete is an electrochemical process. This process is triggered when the surface of the
reinforcing steel becomes depassivated, allowing the steel to be oxidized in the presence of water and
oxygen.
Concrete is alkaline by nature with a pH value of about 12.5. This provides a protective environment,
helping to insure that the reinforcement does not corrode (Hausmann 1965). A thin passive film, or layer,
composed of gamma iron oxide is created on the steel surface (Hime and Erlin 1987). This layer prevents
corrosion from taking place and is well maintained in the alkaline environment of the concrete. It is when
this layer breaks down that corrosion can begin. Black steel has been found to depassivate in concrete
environments at pH values around 11.5 (Yeomans 1991).
As an electrochemical process, corrosion involves the transfer of electrons as a result of chemical
reactions. This requires an anode and a cathode. The anode is the site of the oxidation of the steel. The
reaction at the anode is expressed as:
Fe → Fe2+ + 2e- [2.1]
The liberated electrons are used at the cathode – the site of the reduction reaction:
2e- + H2O + ½ O2 → 2OH- [2.2]
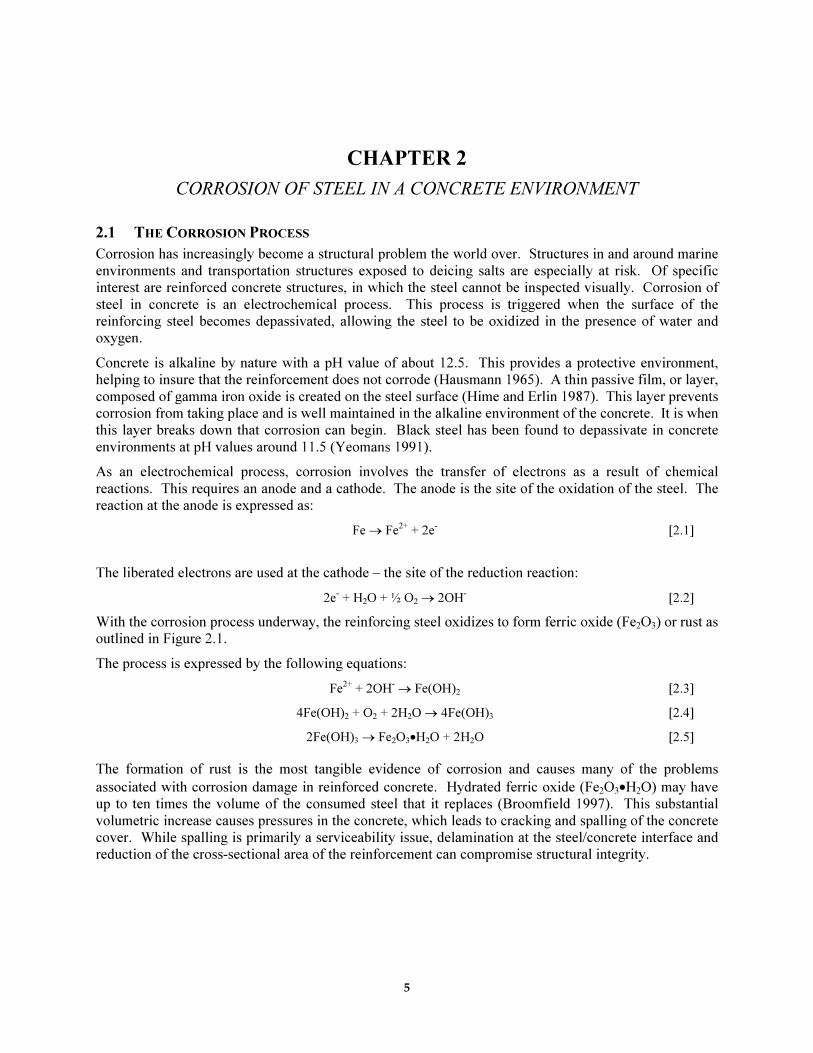
With the corrosion process underway, the reinforcing steel oxidizes to form ferric oxide (Fe2O3) or rust as
outlined in Figure 2.1.
The process is expressed by the following equations:
Fe2+ + 2OH- → Fe(OH)2 [2.3]
4Fe(OH)2 + O2 + 2H2O → 4Fe(OH)3 [2.4]
2Fe(OH)3 → Fe2O3•H2O + 2H2O [2.5]
The formation of rust is the most tangible evidence of corrosion and causes many of the problems
associated with corrosion damage in reinforced concrete. Hydrated ferric oxide (Fe2O3•H2O) may have
up to ten times the volume of the consumed steel that it replaces (Broomfield 1997). This substantial
volumetric increase causes pressures in the concrete, which leads to cracking and spalling of the concrete
cover. While spalling is primarily a serviceability issue, delamination at the steel/concrete interface and
reduction of the cross-sectional area of the reinforcement can compromise structural integrity.
6
Figure 2.1 Corrosion reactions and rust formation on the steel surface (Broomfield 1997)
2.2 CAUSES OF CORROSION IN REINFORCED CONCRETE
Corrosion, or oxidation of the reinforcing steel, in concrete occurs when the local environment causes the
steel to lose its passivity. There are two major causes of corrosion damage to reinforced concrete
structures: carbonation and chloride ion penetration.
Corrosion Due to Carbonation
Carbonation is defined as “The process by which carbon dioxide in the atmosphere reacts with water in
the concrete pores to form a carbonic acid and then reacts with the alkalis in the pores, neutralizing them”
(Broomfield 1997). Carbonation migrates to the reinforcing steel, causing pH reduction and breakdown
of the passive layer. Alkalinity may drop as low as pH 8 in carbonated regions, much lower than the
value required for depassivation.
The mechanism of carbonation is basically diffusion of the carbonated pore water into the concrete.
Therefore, the parameters which influence corrosion by carbonation are invariably those which affect the
depth and rate of diffusion. Such parameters include the amount of concrete cover and the concrete
permeability. Permeability is a function of water-cement ratio and fine aggregate content. The
correlation between permeability and carbonation is evident in cracked specimens. Carbonation will
proceed quickly along the crack with little penetration into the concrete perpendicular to the crack surface
(Francois and Arliguie 1991).
Corrosion Due to Chloride Ion Penetration
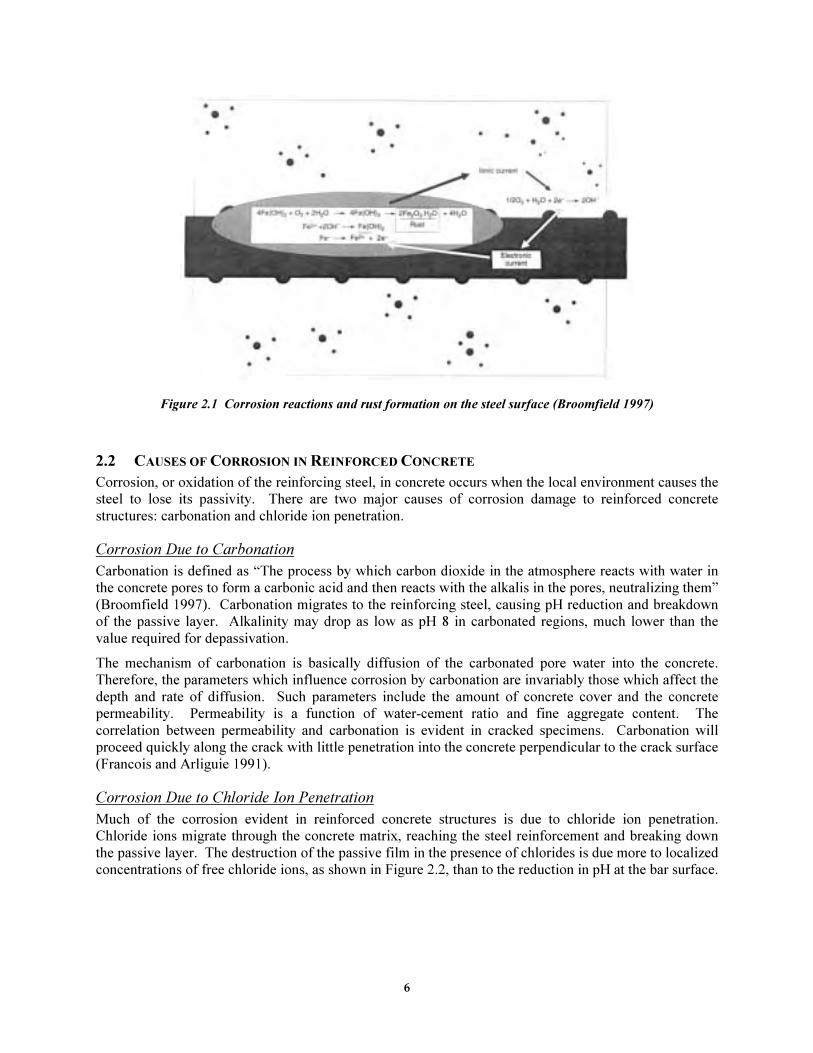
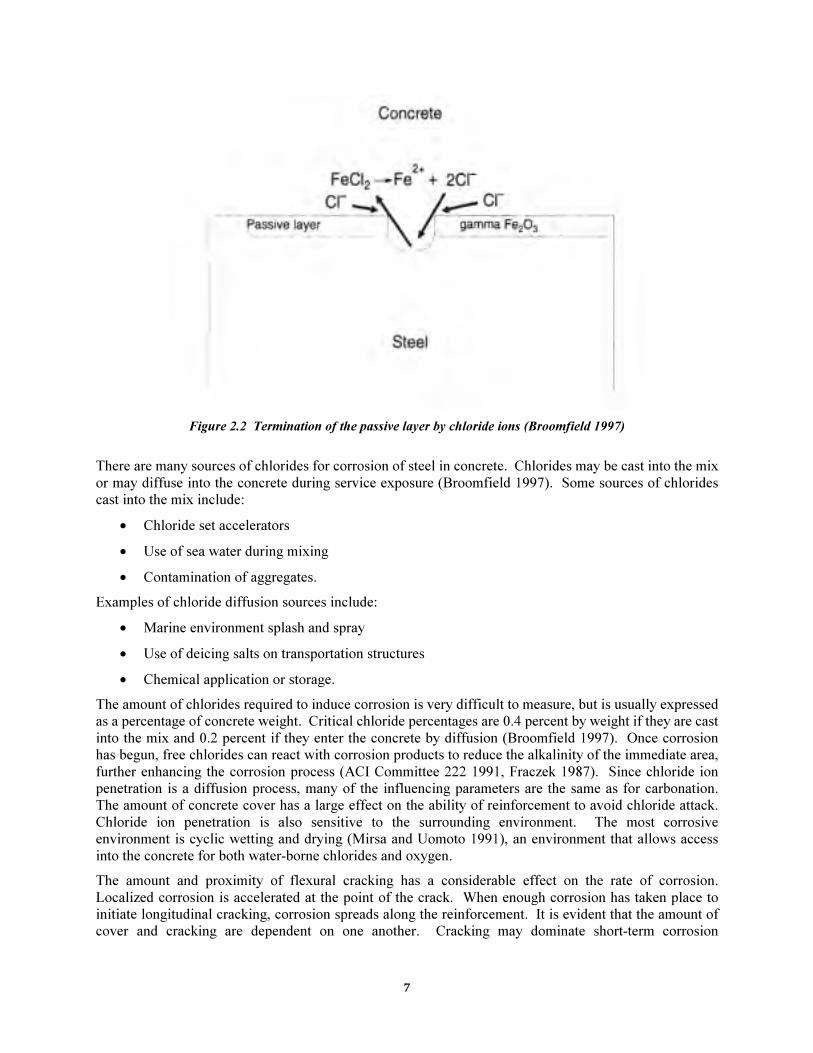
Much of the corrosion evident in reinforced concrete structures is due to chloride ion penetration.
Chloride ions migrate through the concrete matrix, reaching the steel reinforcement and breaking down
the passive layer. The destruction of the passive film in the presence of chlorides is due more to localized
concentrations of free chloride ions, as shown in Figure 2.2, than to the reduction in pH at the bar surface.
7
Figure 2.2 Termination of the passive layer by chloride ions (Broomfield 1997)
There are many sources of chlorides for corrosion of steel in concrete. Chlorides may be cast into the mix
or may diffuse into the concrete during service exposure (Broomfield 1997). Some sources of chlorides
cast into the mix include:
• Chloride set accelerators
• Use of sea water during mixing
• Contamination of aggregates.
Examples of chloride diffusion sources include:
• Marine environment splash and spray
• Use of deicing salts on transportation structures
• Chemical application or storage.
The amount of chlorides required to induce corrosion is very difficult to measure, but is usually expressed
as a percentage of concrete weight. Critical chloride percentages are 0.4 percent by weight if they are cast
into the mix and 0.2 percent if they enter the concrete by diffusion (Broomfield 1997). Once corrosion
has begun, free chlorides can react with corrosion products to reduce the alkalinity of the immediate area,
further enhancing the corrosion process (ACI Committee 222 1991, Fraczek 1987). Since chloride ion
penetration is a diffusion process, many of the influencing parameters are the same as for carbonation.
The amount of concrete cover has a large effect on the ability of reinforcement to avoid chloride attack.
Chloride ion penetration is also sensitive to the surrounding environment. The most corrosive
environment is cyclic wetting and drying (Mirsa and Uomoto 1991), an environment that allows access
into the concrete for both water-borne chlorides and oxygen.
The amount and proximity of flexural cracking has a considerable effect on the rate of corrosion.
Localized corrosion is accelerated at the point of the crack. When enough corrosion has taken place to
initiate longitudinal cracking, corrosion spreads along the reinforcement. It is evident that the amount of
cover and cracking are dependent on one another. Cracking may dominate short-term corrosion
8
characteristics, but adequate cover and the spacing of cracks may have more significant effects on the
long-term corrosion performance of a structure (Mirsa and Uomoto 1991).
In the vast majority of structures, chloride ion ingress is much more critical than carbonation. Corrosion
due solely to carbonation is only expected where concrete cover is exceptionally low or in environments
with severe carbon dioxide concentrations. However, lower amounts of carbonization may accelerate the
corrosion process through interaction with chloride ion penetration. If carbonization depassivates the
protective surface film, the corrosion due to the concentrated free chlorides can proceed more easily.
Experimental results indicate that carbonization amplifies corrosion for a given chloride content, although
high chloride concentrations in the concrete matrix may slow the carbonation rate (Roper and Baweja
1991).
2.3 COMMON METHODS FOR CORROSION REPAIR AND PREVENTION
If the amount of corrosion in a structure is (or is expected to be) substantial, some repair or prevention
technique will be needed to mitigate the effects of corrosion. There are many techniques, both physical
and electrochemical, to delay initial or to slow existing corrosion activity. Similarly, there are various
approaches to repair corrosion damage.
2.3.1 Preventive Measures
The application of a surface coating or sealer is one repair method that is intended to create a barrier to
the incoming contaminated water, thereby robbing corrosion of its reactants (Broomfield 1997).
Unfortunately, there is still some question about the reliability of waterproofing using these treatments.
The use of corrosion inhibitors has gained interest as a means of corrosion protection.
The use of coated reinforcement is a widely used technique for corrosion prevention. The two most
common examples are epoxy-coated reinforcement and galvanized reinforcement. Fusion-bonded epoxy
is intended to prevent corrosive elements from reaching the steel surface. Concern arises when the epoxy
layer is damaged during transport or installation. If kept intact, epoxy coatings are effective for corrosion
prevention (Vaca 1998).
Galvanized reinforcement provides corrosion protection in two ways. The zinc galvanized layer on the
steel surface acts as a barrier to chlorides. Zinc also corrodes in a sacrificial manner in relation to steel
reinforcement, protecting locations where the layer has been damaged or broken down. The zinc coating
remains passive at pH values around 9.5, much lower than the threshold for unprotected steel (Yeomans
1991). Galvanized reinforcement is most effective in situations with low or moderate chloride exposure.
Some practical corrosion prevention methods are reduction of concrete permeability and pore water
through the addition of an admixture and changing structural drainage characteristics to prevent chloride
contamination at critical sections. For a given exposure environment, the presence of adequate cover may
be the most important factor for long-term durability (Swamy 1990).
2.3.2 Repair Measures
Electrochemical repair methods attempt to take advantage of the inherent electrochemistry of the
corrosion process to help reduce or prevent further corrosion. Popular electrochemical techniques include
cathodic protection and chloride removal.
Cathodic protection is essentially the polarization of a metal to reduce the corrosion rate. An electrode is
connected electrically with the reinforcement. This electrode becomes the anode, forcing the steel to
become the cathode; halting the corrosion process (Jones 1996).
Chloride removal (or extraction) also involves polarization of the reinforcement. An electrode applies
current to the steel, driving it to a more negative potential. The negatively charged chloride ions are
9
repelled from the steel surface and are attracted to the positive anode. While cathodic protection is often
a permanent or long-term technique, electrochemical chloride removal is temporary and uses higher
impressed current densities (Vaca 1993).
2.4 CORROSION PROTECTION PROVIDED BY FRP WRAPPING SYSTEMS
FRP wrapping systems have been used extensively in seismic retrofits and for structural maintenance.
Many of the maintenance applications depend on the external wrap to prevent further chloride ingress and
therefore halt the corrosion process inside the structure.
The results of past research have raised questions regarding the effectiveness of FRP wrap and jacket
systems to prevent ongoing corrosion (Sohanghpurwala and Scannell 1994 and Unal and Jirsa 1998). The
field research involves repaired structures that have undergone some corrosion. The corrosion behavior
of previously unexposed (new) reinforced concrete structures treated with an FRP wrapping system has
not been thoroughly evaluated and is an integral portion of the laboratory program described herein.

10
11
CHAPTER 3
COMPOSITE WRAPS FOR DURABILITY
3.1 FRP COMPOSITES
Much of today’s research to improve the durability of reinforced concrete structures focuses on the use of
FRP in large-scale infrastructure projects. Composites exhibit excellent corrosion resistance and a
strength-to-weight ratio comparable to steel. Reduced maintenance and repair expenses justify their
higher initial cost. This section will define key terms related to composites, present an overview of their
use in civil engineering, and focus on FRP wraps as a protective barrier against corrosion.
3.1.1 Overview of Composites (Bassett 1998)
A. Definition
A composite is formed of two or more distinct substances combined to produce a new material with
structural properties not present in any individual component. Fiber reinforced plastics are also known as
composites, and they are used in the infrastructure because they can add strength where needed and
reduce weight. The main advantages of FRP are:
• High strength-to-weight ratio
• Corrosion resistance
• Radio wave and magnetic transparency
• Electrical insulation (glass fibers)
• Fast assembly and construction
A composite is made up of fibers and a matrix. The fibers usually have a very high tensile strength,
3447 Mpa (500 ksi) for a single E-glass filament, but no buckling strength. The polymer resin matrix
binds the fibers together and distributes the load evenly across the surface of the material. It also protects
the fiber from moisture, ultraviolet light and chemicals.
B. Fiber Reinforcement Design
Every composite has three defining characteristics regarding fiber reinforcement: fiber type, form, and
orientation.
In order of increasing cost, the three main fiber types are glass, carbon, and aramid. The selection of the
fiber depends on the required properties and project budget.
• Glass fibers are silica-based glass compounds containing metal oxides.
�����E-glass fibers are electrical insulators and are the most widely used.
�����S-type fibers exhibit higher strength than E-glass and corrosion properties. E-CR fibers have
the highest corrosion resistance.
• Carbon fibers are more brittle and show galvanic corrosion next to metals. They are sold as
“tow,” a bundle of untwisted carbon filaments.
• Aramid fibers have a high tensile strength and are very flexible (Bassett 1998).
12
Fibers are supplied in bundles for protection. The most common fiber forms for infrastructure are
rovings, tow, and fabrics. All three types keep the fibers aligned prior to resin impregnation. A roving is
a collection of untwisted continuous glass or aramid filaments. A tow is a bundle of untwisted carbon
filament bundles.
The fiber orientation is also called fiber architecture. Fibers can be parallel or perpendicular to the
longitudinal axis, depending on the manufacturer and the use. In general, and regardless of the selected
orientation, the end result is a transversely isotropic material.
C. Resin Selection
The most common types of resins used for infrastructure are thermosetting resins that reach a final rigid
form during the curing process. They offer on-site fabrication and modest cost. A thermoplastic resin is
usually processed at higher temperatures and can be reshaped when reheated. The following is a list of
commonly used thermosetting resins (Bassett 1998).
• Unsaturated polyester resins are the most used because of their low cost, ease of fabrication and
good performance history.
• Vinyl esters resist water penetration, shrinkage and chemical attacks. They surpass polyesters in
aggressive environments where corrosion is likely to occur.
• Epoxy resins show excellent adhesion to concrete, little shrinkage, high corrosion resistance, and
good adaptability to different manufacturing processes.
• Polyurethane resins have very good chemical resistance, low chloride diffusion, high toughness
and are resistant to UV rays.
• Phenolics are mostly used to fabricate materials that must pass smoke emission, toxicity and
combustion requirements.
D. Manufacturing Process
Many different manufacturing processes exist to blend fibers and resins into a composite material. These
two components can be combined at a factory or at the job site in many cases. The most important
element in the manufacturing process is the complete saturation of the fibers with the resin. All air
bubbles must be removed from the composite prior to load application.
The basic automated techniques are pultrusion (good for structural columns, beams, rebar, tendons and
cables), filament winding (cylindrical shapes such as pressure vessels), and molding. Nonautomated
techniques, such as the hand lay-up method, are used frequently for composite repair applications. The
usual procedure involves cleaning the concrete surface and rolling on a first layer of resin. The woven
fabric is then placed and compacted to ensure adhesion and saturation. An additional layer of resin is
applied over the fabric. A slightly modified version of the hand lay-up technique is used for FRP
wrapping of beams and columns exposed to environmental damage.
3.1.2 Structural Engineering Applications
Fiber-reinforced polymer composites (FRPC) have been successfully used in structural applications as
reinforcement embedded in the concrete or as strengthening plates attached to the exterior surface of
weakened members (Bassett 1998). Composites have replaced traditional construction materials in many
other large-scale infrastructure projects. These materials have a high specific strength and are very
resistant to corrosion. Their high cost, however, is a disadvantage over more traditional systems. Their
superior efficiency in more structural applications has yet to be determined to standardize their use. The
following series of examples illustrates a wide range of FRP applications in civil engineering
(Basset 1998).
13
• Composite cables that serve as stays, prestressing tendons, and external structural reinforcement.
• Beams and girders created from optimized cross section design and fiber placements.
• FRP trusses that have high stiffness and low deflection in long span structures.
• Column and post pilings that withstand large vertical loads without bending or buckling.
• Composite gratings and handrails that reduce maintenance costs in exterior exposures.
• FRP laminates and wraps that strengthen deficient designs, increase load bearing capacity, and
prevent structural deterioration in existing concrete structures.
The remainder of this chapter focuses on the use of FRP wraps for durability considerations.
3.1.3 FRP Wraps for Corrosion Protection
“Over 1500 reinforced structures throughout the world have been reinforced with FRP laminates”
(Bassett 1998). Although many of these are seismic applications, the use of composite wraps for
corrosion repair and prevention is rapidly increasing. A list of some composite wrap manufacturers is
presented in Table 3.1.
FRP laminates have been used for encapsulation in seismic regions where wrapping a member increases
its load capacity and ductility, thus reducing the damage suffered from earthquakes. In nonseismic
regions, these systems have strengthened utility poles and rehabilitated piers and bent caps
(TxDOT/CTR 1998). Composites are useful in strengthening reinforced concrete because they increase
the structure’s capacity without adding weight. In earthquake retrofitting, the goal is to make the column
more ductile. A composite jacket prevents the concrete spalling and steel buckling.
The California Department of Transportation (Caltrans) has permitted the wrapping of bridge columns
with FRP in addition to the better known technique of steel jacketing of existing columns constructed for
resisting earthquake loads. Caltrans strengthened columns in San Diego using XXsys Technologies’
Robowrapper equipment, an automated wrapping machine (Bassett 1998). The Kansas DOT has encased
two bridge columns for aesthetic repairs of moderate spalling due to road salt corrosion. The Wisconsin
DOT has wrapped about twelve bridges to rehabilitate spalled surfaces subjected to corrosive
environments (Wilson 1996).
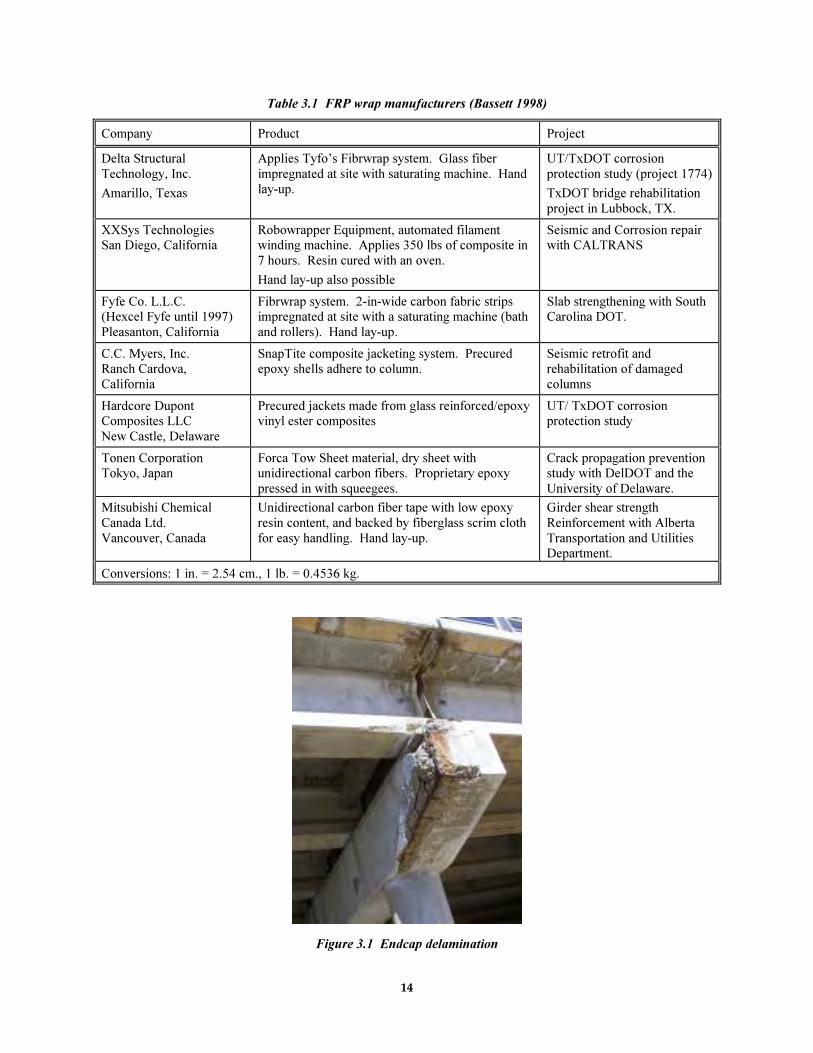
The Texas DOT has wrapped several bridges in Lubbock with composite laminates to protect them from
corrosion. The bridges had shown damage in the form of severe cracking and spalling, as seen in
Figure 3.1, due to water penetration. Many of these bridge bents were wrapped by Delta Structural
Technology, Inc. after concrete in the most damaged areas was removed to the level of the reinforcement
and the members were patched.
14
Table 3.1 FRP wrap manufacturers (Bassett 1998)
Company Product Project
Delta Structural
Technology, Inc.
Amarillo, Texas
Applies Tyfo’s Fibrwrap system. Glass fiber
impregnated at site with saturating machine. Hand
lay-up.
UT/TxDOT corrosion
protection study (project 1774)
TxDOT bridge rehabilitation
project in Lubbock, TX.
XXSys Technologies San Diego, California
Robowrapper Equipment, automated filament winding machine. Applies 350 lbs of composite in
7 hours. Resin cured with an oven.
Hand lay-up also possible
Seismic and Corrosion repair with CALTRANS
Fyfe Co. L.L.C. (Hexcel Fyfe until 1997)
Pleasanton, California
Fibrwrap system. 2-in-wide carbon fabric strips impregnated at site with a saturating machine (bath
and rollers). Hand lay-up.
Slab strengthening with South Carolina DOT.
C.C. Myers, Inc. Ranch Cardova,
California
SnapTite composite jacketing system. Precured epoxy shells adhere to column.
Seismic retrofit and rehabilitation of damaged
columns
Hardcore Dupont Composites LLC
New Castle, Delaware
Precured jackets made from glass reinforced/epoxy vinyl ester composites
UT/ TxDOT corrosion protection study
Tonen Corporation Tokyo, Japan
Forca Tow Sheet material, dry sheet with unidirectional carbon fibers. Proprietary epoxy
pressed in with squeegees.
Crack propagation prevention study with DelDOT and the
University of Delaware.
Mitsubishi Chemical
Canada Ltd.
Vancouver, Canada
Unidirectional carbon fiber tape with low epoxy
resin content, and backed by fiberglass scrim cloth
for easy handling. Hand lay-up.
Girder shear strength
Reinforcement with Alberta
Transportation and Utilities Department.
Conversions: 1 in. = 2.54 cm., 1 lb. = 0.4536 kg.
Figure 3.1 Endcap delamination
15
The University of Toronto, in a joint research project with the Ministry of Transportation of Ontario,
studied the effect of FRP wraps on the compressive strength of specimens subjected to accelerated
corrosion using impressed current. Their report, entitled “Repair of Delaminated Circular Pier Columns
by ACM” examined the effectiveness of advanced composites as a means of mitigating corrosion
damage. Researchers repaired their specimens with different grouts, and then wrapped them with two
layers of FRP. The strengths of the encapsulated columns in all cases were equal to or greater than those
of the original uncorroded columns. The specimens were wrapped with Tyfo Fibrwrap System that was
provided by the manufacturer, the Fyfe Co. This material is composed of a woven fabric made up of
glass and aramid fibers. It is resistant to salt, soil, and other corrosive elements (Sheikh et al.). The
research team concluded that the system was easy and quick to install. The reduced traffic interruption
during a field application would help offset the higher initial cost of FRP wraps. Research on FRP wraps
as a corrosion control system is continuing at The University of Toronto, but the results have not yet been
published.
In spite of a growing number of projects involving rehabilitation with composite wraps, the long-term
performance of such procedures in harsh environments has been questioned. In their article “Repair and
Protection of Concrete Exposed to Seawater,” Sohanghpurwala and Scanell declared nonstructural
composite jackets to be noneffective for marine structures. Columns submerged in seawater are usually
wrapped around the splash zone, where continuous wet and dry cycles accelerate corrosion. Capillary
action allows water to rise up and become trapped in the jacket. Chloride levels rise, and because the
concrete is never fully dry, the rate of corrosion actually increases dramatically. The authors claim that
wrapping the structure worsens the situation, because the degradation is out of sight and the level of
damage is masked. The Florida DOT conducted a study on the Bryant Patton Bridges that confirmed
these claims (Sohanghpurwala 1996). In 1990, several bridge columns were wrapped with fiberglass
jackets. Three years later, these jackets were removed, exposing severe corrosion damage in all columns.
The detrimental effects of FRP encapsulation are crucial in determining the effectiveness of such systems.
The problem of rehabilitating corrosion damaged structures, or protecting new members from such
damage has not been fully investigated. Additional experimental case studies are needed to demonstrate
the long-term behavior and properties of FRP wrappings.
3.1.4 Previous Research at the University of Texas (Unal 1998)
Prior to project 1774, a research study for evaluating the effectiveness of FRP encapsulations was carried
out (Unal 1998). A summary of that study and its findings are discussed here.
A. Description of Setup
Unal’s test program consisted of 6 beams designed to simulate loaded, cracked specimens exposed to
extremely corrosive environments for accelerated testing. The beam dimensions were 15.2 cm X 30.5 cm
X 2.7 m (6 in. x 12 in. x 9 ft). The reinforcement consisted of two No.3 black bars placed at the top
(compression zone) and two No.6 epoxy-coated bars at the bottom (tension zone) of the beam. There was
also an epoxy-coated stirrup placed at midspan.
Corrosion activity had been monitored in the beams for about 5 years prior to encapsulation, and chloride
levels had been determined in all specimens. Encapsulation of four of the samples strictly adhered to the
procedure outlined by the manufacturers (Hardcore Composites). The remaining two beams were left
unwrapped and served as control samples. The beams were placed in a saltwater tank and submitted to
thirteen cycles of exposure, one cycle consisting of one wet week followed by three dry weeks. Cloth
was placed over the beams to ensure uniform flow of the 3.5 percent saline solution. A retaining pool
was designed and built to catch the solution for recycling during the exposed period and for holding the
solution during the dry period. The beams were placed on wood stands in the pool. Corrosion activity
was monitored using half-cell potential readings and acoustic emission testing.
16
At the end of the exposure cycles, the beams were removed from the pool and the following evaluations
were performed:
• extraction of cores to determine depth of resin impregnation,
• chloride content measurements,
• opening of the beams to observe level of steel deterioration.
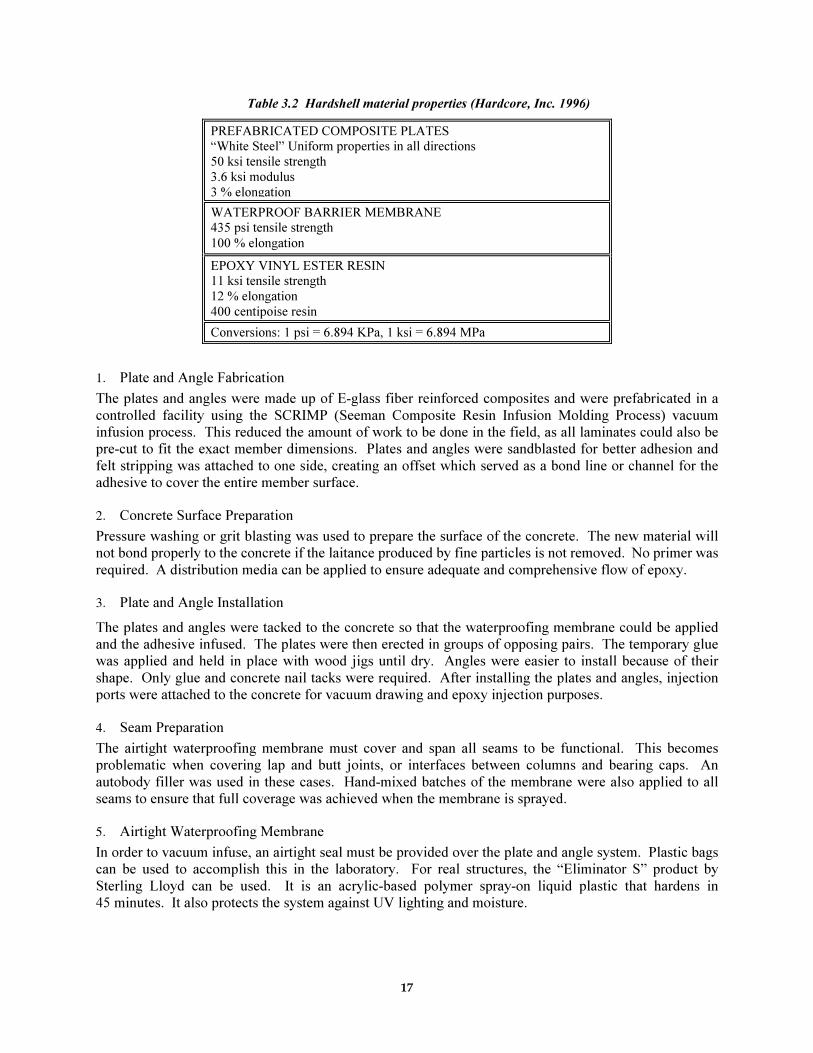
B. Application Procedure (Hardcore DuPont Composites 1996)
An FRPC product, HardshellTM
, manufactured by Hardcore DuPont Composites for seismic retrofit,
concrete corrosion and freeze-thaw damage, structural repair, and structural formwork was used. The
properties as obtained from the manufacturer are given in Table 3.2.
Hardshell’s FRPC systems consist of a woven fiberglass jacket, which is subsequently infused with epoxy
vinyl ester resin. The space between the polymer sheet and the concrete surface is filled with vinyl ester,
epoxy, or blended resins. A vacuum bag then seals the wrapping, and the resin is drawn into the cavity to
seal all structural cracks and provide a tight bond between the concrete surface and the composite layer.
Prior to injecting the resin, evacuation is intended to remove moisture in the concrete. Ideally, the filled
cracks prevent moisture and air ingress. Since oxygen and water are necessary for corrosion, the removal
of any one of these components should reduce the damage.
The installation of this system is divided into the following eight steps, which took about four days to
complete with a four-man work force.
���� Plate and angle fabrication
���� Concrete Surface Preparation
���� Plate and angle installation
���� Seam Preparation
���� Airtight waterproofing membrane
���� Infusion preparation
��� Infusion
��� Post infusion clean-up
17
Table 3.2 Hardshell material properties (Hardcore, Inc. 1996)
PREFABRICATED COMPOSITE PLATES “White Steel” Uniform properties in all directions
50 ksi tensile strength
3.6 ksi modulus
3 % elongation
WATERPROOF BARRIER MEMBRANE 435 psi tensile strength
100 % elongation
EPOXY VINYL ESTER RESIN 11 ksi tensile strength
12 % elongation
400 centipoise resin
Conversions: 1 psi = 6.894 KPa, 1 ksi = 6.894 MPa
���� Plate and Angle Fabrication
The plates and angles were made up of E-glass fiber reinforced composites and were prefabricated in a
controlled facility using the SCRIMP (Seeman Composite Resin Infusion Molding Process) vacuum
infusion process. This reduced the amount of work to be done in the field, as all laminates could also be
pre-cut to fit the exact member dimensions. Plates and angles were sandblasted for better adhesion and
felt stripping was attached to one side, creating an offset which served as a bond line or channel for the
adhesive to cover the entire member surface.
���� Concrete Surface Preparation
Pressure washing or grit blasting was used to prepare the surface of the concrete. The new material will
not bond properly to the concrete if the laitance produced by fine particles is not removed. No primer was
required. A distribution media can be applied to ensure adequate and comprehensive flow of epoxy.
���� Plate and Angle Installation
The plates and angles were tacked to the concrete so that the waterproofing membrane could be applied
and the adhesive infused. The plates were then erected in groups of opposing pairs. The temporary glue
was applied and held in place with wood jigs until dry. Angles were easier to install because of their
shape. Only glue and concrete nail tacks were required. After installing the plates and angles, injection
ports were attached to the concrete for vacuum drawing and epoxy injection purposes.
���� Seam Preparation
The airtight waterproofing membrane must cover and span all seams to be functional. This becomes
problematic when covering lap and butt joints, or interfaces between columns and bearing caps. An
autobody filler was used in these cases. Hand-mixed batches of the membrane were also applied to all
seams to ensure that full coverage was achieved when the membrane is sprayed.
���� Airtight Waterproofing Membrane
In order to vacuum infuse, an airtight seal must be provided over the plate and angle system. Plastic bags
can be used to accomplish this in the laboratory. For real structures, the “Eliminator S” product by
Sterling Lloyd can be used. It is an acrylic-based polymer spray-on liquid plastic that hardens in
45 minutes. It also protects the system against UV lighting and moisture.
18
���� Infusion Preparation
The encased concrete structure was fitted with feeder inlets and vacuum ports placed strategically to
ensure a quick and complete infusion. Vacuum was drawn and leak tests performed on the system to test
the integrity of the airtight seal. Patching materials can be used to fix the leaks. The patches were
removed following the infusion. Perfect vacuum is rarely achieved immediately after the vacuum is
drawn. The structure must remain under vacuum for 24 hours to remove free moisture after which it is
ready for infusion.
��� Infusion
The system was designed to draw the adhesive in from the bottom ports, through the structure, and out
through the top vacuum ports. The felt strips directed the flow so that the entire structure was infused.
As the adhesive rises through the structure, the intent is to penetrate the entire concrete structure via the
voids and cracks. Once the adhesive has hardened, the infusion process is completed. A vacuum is held
on the system for 24 hours so that there are no changes in the adhesive or jacket before the adhesive
cures.
��� Post-Infusion Cleanup
After the 24-hour curing period, all the hoses were removed. Temporary patches were replaced by
permanent ones. If hollow areas (air pockets) larger than 5 percent of the total surface area are evident by
visual inspection or by tapping on the surface, a second infusion is performed.
Hardshell is intended to create an efficient corrosion resistant system. The multiple composite layers
should protect the structure from the environment, deicing salts and freeze-thaw cycles. It aims to solve
problems caused by rebar corrosion. The prefabricated fiberglass plates and angles are permanently glued
to the concrete using a vacuum infusion process, thus eliminating the two main components of corrosion:
oxygen and water. In addition, the adhesive should fill all voids and cracks. The exposure tests indicate,
however, that corrosion was not fully arrested after wrapping.
C. Results
From the half-cell potential data, it was found that the readings for the encapsulated beams remained at a
constant level similar to that prior to wrapping, while the readings for the control specimens had a
tendency to become more negative. This seems to indicate that corrosion activity was still present in the
encapsulated beams due to trapped air and moisture. Since there is no direct correlation between the half-
cell reading and the extent of corrosion damage, it cannot be concluded that the unwrapped beams
performed worse than the encapsulated ones because they were both above the threshold for 90 percent
probability of activity taking place. It was necessary to open up the beams to determine the condition of
the reinforcement.
In addition, Unal (1998) found that chloride contents were above the level for corrosion in all beams. The
cores taken at crack locations showed no impregnation of the resin during the infusion process. Cores
were observed under ultraviolet light because visual observations proved to be insufficient. Upon
opening of the beams, a green viscous fluid indicative of corrosion activity was found surrounding the
bars of all specimens. The interior of the concrete surface of encapsulated samples appeared to be wet,
demonstrating that moisture had been trapped inside the beam during wrapping. In general, it was also
noted that epoxy-covered bars performed better than the black bars, which suffered severe loss of cross-
sectional area. The black bars in the encapsulated beams were more damaged than those in the bare
specimens. Pitting corrosion was visible at the ends of these bars, whereas it had not been observed
before encapsulation or on the unwrapped beams. Unal concludes his research with the following
remarks:
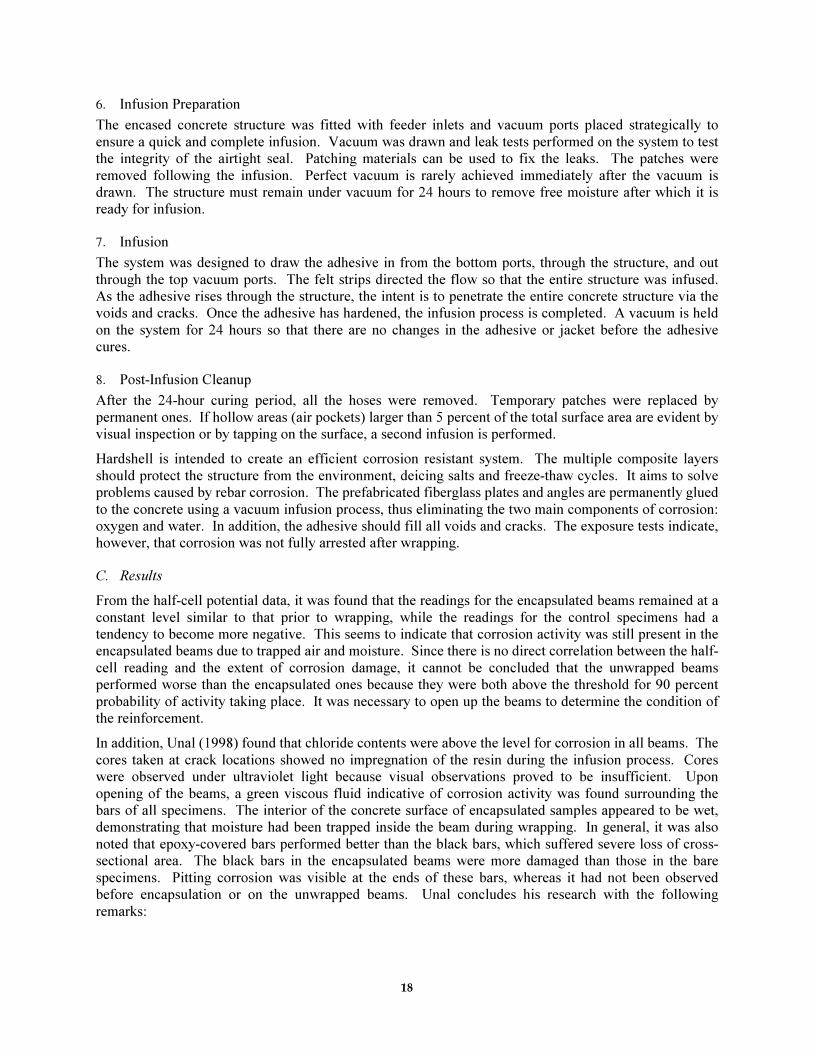
19
• The evacuation procedure did not remove moisture from the beams and there was no penetration
of the resin other than at large cracks. The beams were thus encapsulated with moisture trapped
inside, which may worsen the condition compared to an unwrapped beam.
• The encapsulation process made it difficult to visually detect any signs of corrosion on the
concrete surface.
• Epoxy-coated bars showed signs of superior performance when compared to the black bars.
However, it was not possible to assess the performance of the encapsulation process or membrane
that have not suffered severe corrosion prior to encapsulation.
Unal encourages further investigation of composites for encapsulation of elements exposed to aggressive
environments.

20
21
CHAPTER 4
EXPOSURE TESTING OF WRAPPED ELEMENTS
Manufacturers of proprietary systems have approached TxDOT engineers regarding the use of fiber
wrapping to improve durability or to repair corroded reinforced concrete structures. In the absence of
reliable technical data, TxDOT was reluctant to approve the use of these systems until tests could be
conducted to evaluate composite wrapping systems under exposure conditions simulating aggressive
environments. The test program described here was developed with the assistance of TxDOT engineers.
4.1 SPECIMEN VARIABLES
Based on the results of previous studies on FRP wraps, additional variables are included in Project 1774.
The importance of element shape, surface condition, and protection strategy will be evaluated.
Representative field conditions will be simulated. To accelerate the oxidation of the reinforcement, many
“worst case” field-encountered scenarios are included in the test matrix.
Sixty reinforced concrete specimens have been constructed and are being monitored for this project and
described below.
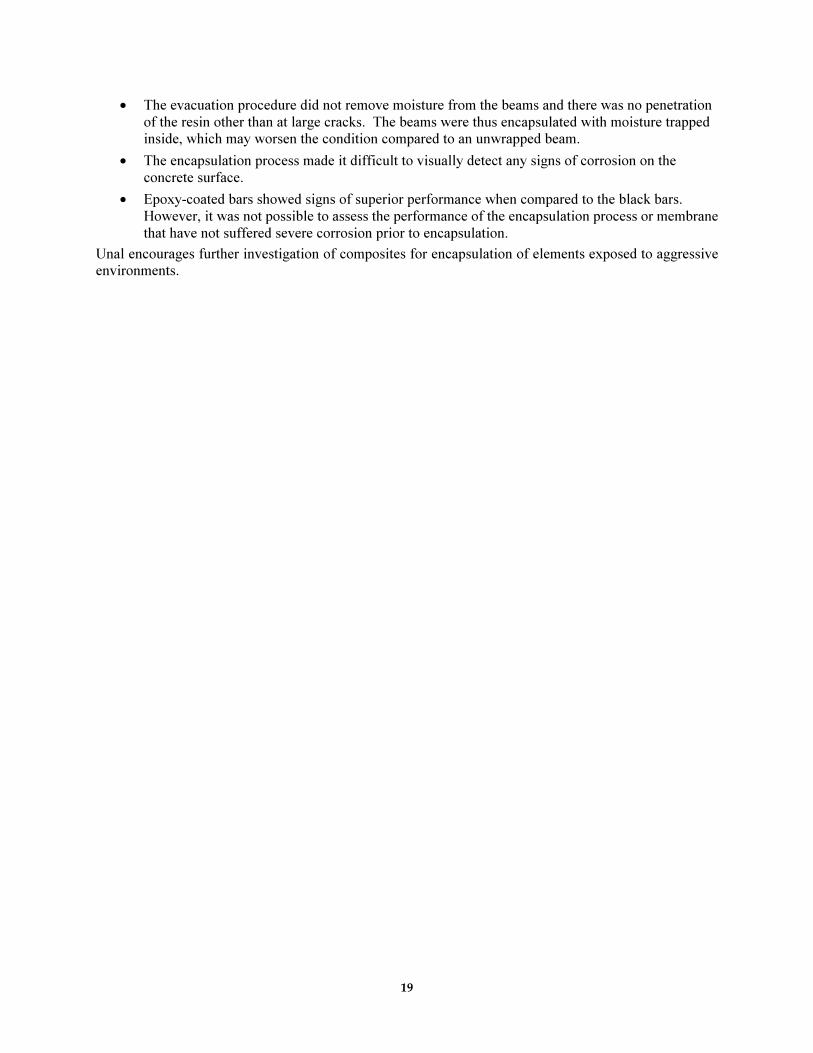
A. Size and Shape
To represent both column and beam elements, 18 rectangular and 42 circular shapes were selected for this
study. More emphasis was placed on studying circular shapes because piers submerged in seawater are
often selected for FRP wrapping applications. The specimen dimensions are presented in Table 4.1.
Table 4.1 Specimen dimensions
Shape Length Cross Section
Rectangular 3 ft. 10-in. x 10-in.
Cylindrical 3 ft. 10-in. diameter
Conversions: 1 in. = 2.54 cm, 1 ft. = 30.48 cm
B. Steel Reinforcement
All specimens were constructed with steel cages formed of longitudinal and transverse reinforcement.
Steel tie wire was used to attach the rebar to the spiral. The tie wire also maintains electrical continuity
necessary for monitoring purposes. Plastic chairs were fastened to the cages so that a 25 mm (1-in.) cover
was provided for all specimens. A small cover was chosen to accelerate corrosion. The reinforcing bars
were cut in 990-mm (39-in) lengths, so that 76 mm (3-in.) of reinforcement protruded on one end of the
beams and columns. The protruding bars facilitate monitoring, as most methods for corrosion detection
require a direct connection to the steel.
C. Cast-in Chlorides
Because of the detrimental effect of chloride ion penetration, two different concrete mixes were used in
the project. Some specimens were cast with concrete containing chlorides, others with uncontaminated
concrete. The chlorides were added to quicken the onset of corrosion, and to compare the effectiveness of
FRP wrappings on structures with varying amounts of chlorides. The chlorides were added to the mixing
water at the ready-mix plant before delivery at the laboratory. Regular salt was included to achieve a
3.5 percent saline solution by weight to yield a contamination level similar to that measured in field tests

22
in marine structures. A threshold value of 0.2 percent chlorides by weight of cement has been found to
initiate the corrosion of reinforcement in a marine structure.
D. Flexural Cracks
Numerous cracks at the surface of a reinforced concrete member facilitate the intrusion of corrosive
elements into the structure, thus accelerating damage. The penetration of chlorides is more rapid in areas
with cracks (Taheri 1997). In real structures, internal restraints to deformations create areas of high
stress, where microcracking may develop, and increase the penetration of corrosive agents into the
concrete. Crack width and propagation are important parameters in the chloride transport mechanism.
Isolated fine cracks have little effect on the permeability of the concrete. Cracking in the column and
beam specimens was reproduced in the laboratory by loading some specimens until flexural cracks of a
given width appeared on the surfaces. Usually a width of 0.5 mm (0.020 mils) was considered to be
sufficient. The specimens will not be loaded during exposure and monitoring.
E. Pre-Existing Concrete Condition
Two pre-existing concrete conditions were evaluated: undamaged; and damaged and repaired. The
undamaged specimens will be monitored with the concrete as cast. The specimens selected for repair will
help to determine the effectiveness of two different patching materials: latex modified concrete containing
a corrosion inhibitor (LMC) and epoxy grout (EG). Prior to repairing the specimens, a portion of the
concrete was removed using a chipping hammer. Two techniques were used to place the repair material;
dry-packing and cast-in-place TxDOT specifications and practices regarding material selection and repair
procedure were followed (see Section 4.4.2 and Appendix A).
A corrosion inhibitor, Sika Ferrogard (see Section 4.4.3), was applied to a few specimens to study the
effect of a third protection technique. This material was donated by Sika and was applied according to
the manufacturer’s guidelines.
To verify the adhesive properties of a composite wrap in marine environments, a few cylindrical
specimens with wet surfaces were wrapped. They were placed in buckets containing 3.5 percent salt
water for 24 hours prior to the encapsulation. All rectangular specimens were wrapped with dry surfaces.
F. FRP Wrapping Systems
The performance of two different composite systems in a corrosive environment was investigated. The
first system was manufactured by Delta Structural Technology, Inc. and was donated to project 1774.
The second system was designed and fabricated at UT, and was be designated as the “Generic” system. If
the latter proves to be a viable corrosion prevention and repair method, general specifications for FRP
laminates can be developed for consideration by TxDOT. The generic system incorporates vinyl ester
(VE) and epoxy (E) resins, and uses fabric produced by Owens Corning. Delta’s system uses one resin
type (TYFO S) and one fabric type (SHE-51). The curing agents for the epoxy-based resin varied
depending on the surface condition of the concrete (EPON 3090 for wet, EPON 3234 for dry).
The wrapping lengths were varied to simulate several conditions. All wrapped beams were encapsulated
over a length of about 760 mm (30 in.). A small portion of the specimen was left uncovered at the end
where the reinforcement was exposed. The other beam end was completely wrapped. Wrapped columns
were either fully or partially enclosed, with the bottom ends always unwrapped to simulate field
conditions where it is impossible to wrap a column to the foundation or below the waterline due to access
difficulties. Partially wrapped columns were wrapped to either the waterline or six inches below the
average waterline, to study the effect of capillary action on composite wraps.
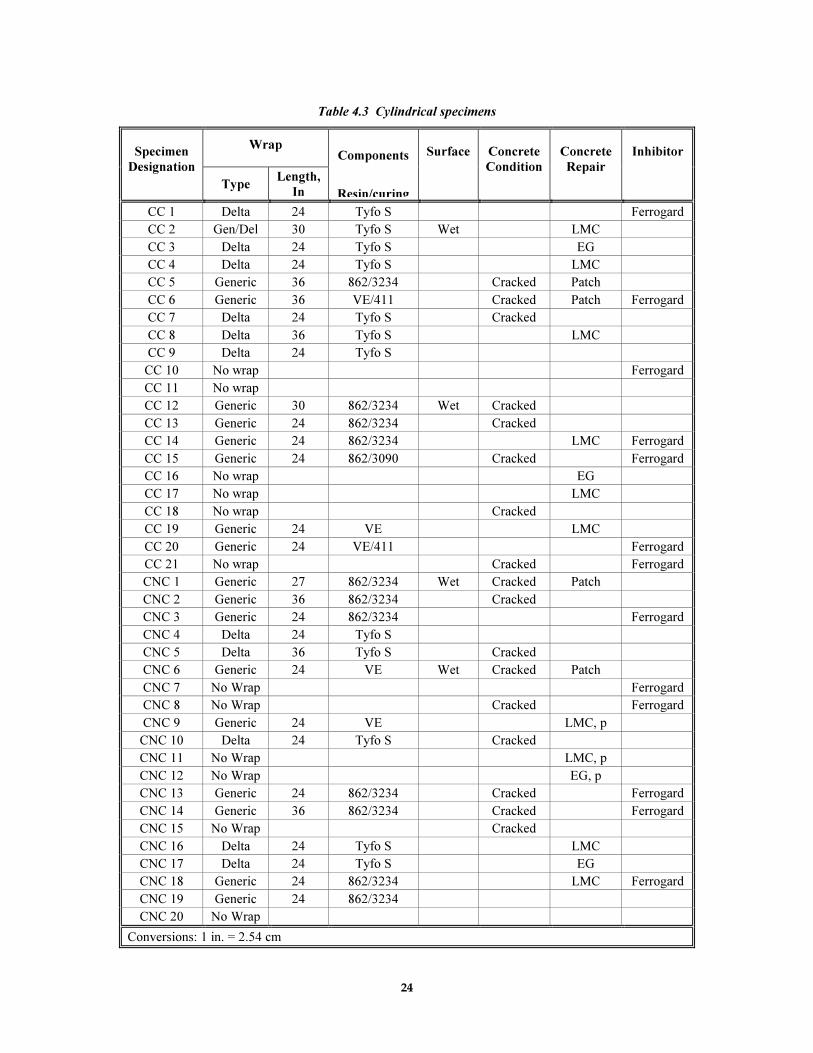
Tables 4.2 and 4.3 describe the specimens in detail. In the specimen designation, the first letter denotes
shape (R for rectangular, C for cylindrical), and the following letters differentiate chloride-contaminated
mixes from uncontaminated ones (C for chlorides, NC for no chlorides). Gen/Del denotes specimens
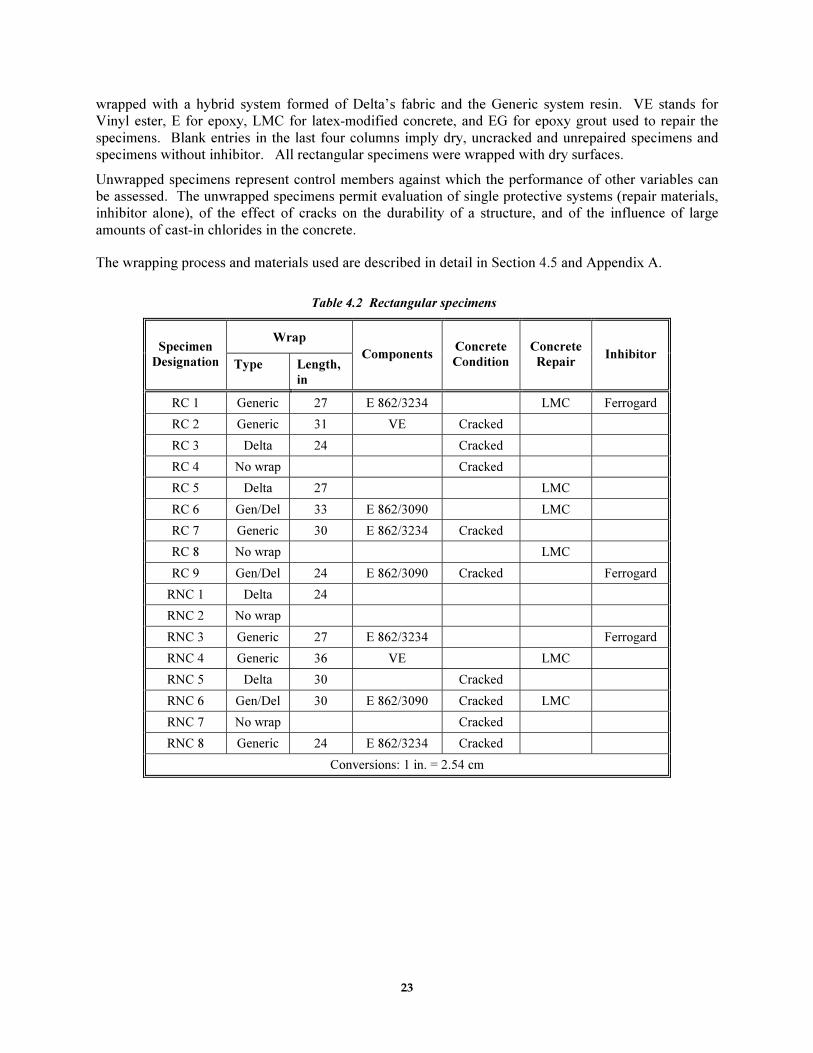
23
wrapped with a hybrid system formed of Delta’s fabric and the Generic system resin. VE stands for
Vinyl ester, E for epoxy, LMC for latex-modified concrete, and EG for epoxy grout used to repair the
specimens. Blank entries in the last four columns imply dry, uncracked and unrepaired specimens and
specimens without inhibitor. All rectangular specimens were wrapped with dry surfaces.
Unwrapped specimens represent control members against which the performance of other variables can
be assessed. The unwrapped specimens permit evaluation of single protective systems (repair materials,
inhibitor alone), of the effect of cracks on the durability of a structure, and of the influence of large
amounts of cast-in chlorides in the concrete.
The wrapping process and materials used are described in detail in Section 4.5 and Appendix A.
Table 4.2 Rectangular specimens
Wrap Specimen
Designation Type Length,
in
Components Concrete
Condition
Concrete
Repair Inhibitor
RC 1 Generic 27 E 862/3234 LMC Ferrogard
RC 2 Generic 31 VE Cracked
RC 3 Delta 24 Cracked
RC 4 No wrap Cracked
RC 5 Delta 27 LMC
RC 6 Gen/Del 33 E 862/3090 LMC
RC 7 Generic 30 E 862/3234 Cracked
RC 8 No wrap LMC
RC 9 Gen/Del 24 E 862/3090 Cracked Ferrogard
RNC 1 Delta 24
RNC 2 No wrap
RNC 3 Generic 27 E 862/3234 Ferrogard
RNC 4 Generic 36 VE LMC
RNC 5 Delta 30 Cracked
RNC 6 Gen/Del 30 E 862/3090 Cracked LMC
RNC 7 No wrap Cracked
RNC 8 Generic 24 E 862/3234 Cracked
Conversions: 1 in. = 2.54 cm
24
Table 4.3 Cylindrical specimens
Wrap Specimen
Designation
Type Length,
In
Components
Resin/curing
Surface Concrete
Condition
Concrete
Repair
Inhibitor
CC 1 Delta 24 Tyfo S Ferrogard
CC 2 Gen/Del 30 Tyfo S Wet LMC
CC 3 Delta 24 Tyfo S EG
CC 4 Delta 24 Tyfo S LMC
CC 5 Generic 36 862/3234 Cracked Patch
CC 6 Generic 36 VE/411 Cracked Patch Ferrogard
CC 7 Delta 24 Tyfo S Cracked
CC 8 Delta 36 Tyfo S LMC
CC 9 Delta 24 Tyfo S
CC 10 No wrap Ferrogard
CC 11 No wrap
CC 12 Generic 30 862/3234 Wet Cracked
CC 13 Generic 24 862/3234 Cracked
CC 14 Generic 24 862/3234 LMC Ferrogard
CC 15 Generic 24 862/3090 Cracked Ferrogard
CC 16 No wrap EG
CC 17 No wrap LMC
CC 18 No wrap Cracked
CC 19 Generic 24 VE LMC
CC 20 Generic 24 VE/411 Ferrogard
CC 21 No wrap Cracked Ferrogard
CNC 1 Generic 27 862/3234 Wet Cracked Patch
CNC 2 Generic 36 862/3234 Cracked
CNC 3 Generic 24 862/3234 Ferrogard
CNC 4 Delta 24 Tyfo S
CNC 5 Delta 36 Tyfo S Cracked
CNC 6 Generic 24 VE Wet Cracked Patch
CNC 7 No Wrap Ferrogard
CNC 8 No Wrap Cracked Ferrogard
CNC 9 Generic 24 VE LMC, p
CNC 10 Delta 24 Tyfo S Cracked
CNC 11 No Wrap LMC, p
CNC 12 No Wrap EG, p
CNC 13 Generic 24 862/3234 Cracked Ferrogard
CNC 14 Generic 36 862/3234 Cracked Ferrogard
CNC 15 No Wrap Cracked
CNC 16 Delta 24 Tyfo S LMC
CNC 17 Delta 24 Tyfo S EG
CNC 18 Generic 24 862/3234 LMC Ferrogard
CNC 19 Generic 24 862/3234
CNC 20 No Wrap
Conversions: 1 in. = 2.54 cm
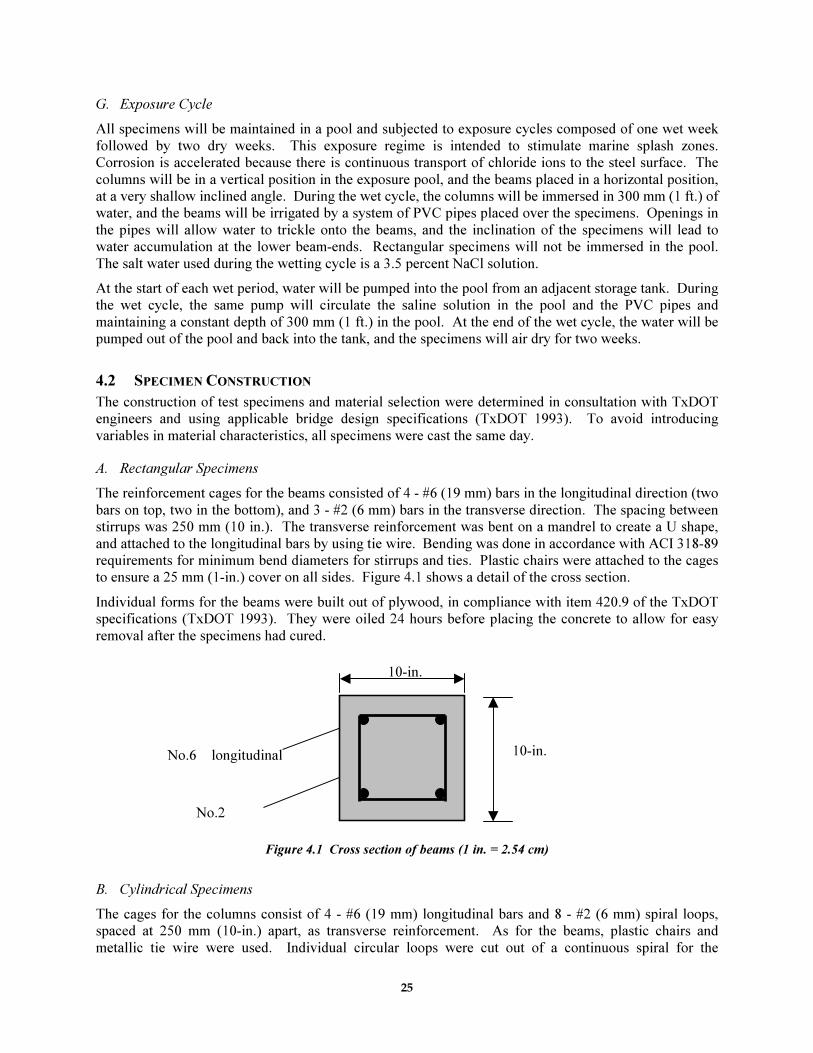
25
G. Exposure Cycle
All specimens will be maintained in a pool and subjected to exposure cycles composed of one wet week
followed by two dry weeks. This exposure regime is intended to stimulate marine splash zones.
Corrosion is accelerated because there is continuous transport of chloride ions to the steel surface. The
columns will be in a vertical position in the exposure pool, and the beams placed in a horizontal position,
at a very shallow inclined angle. During the wet cycle, the columns will be immersed in 300 mm (1 ft.) of
water, and the beams will be irrigated by a system of PVC pipes placed over the specimens. Openings in
the pipes will allow water to trickle onto the beams, and the inclination of the specimens will lead to
water accumulation at the lower beam-ends. Rectangular specimens will not be immersed in the pool.
The salt water used during the wetting cycle is a 3.5 percent NaCl solution.
At the start of each wet period, water will be pumped into the pool from an adjacent storage tank. During
the wet cycle, the same pump will circulate the saline solution in the pool and the PVC pipes and
maintaining a constant depth of 300 mm (1 ft.) in the pool. At the end of the wet cycle, the water will be
pumped out of the pool and back into the tank, and the specimens will air dry for two weeks.
4.2 SPECIMEN CONSTRUCTION
The construction of test specimens and material selection were determined in consultation with TxDOT
engineers and using applicable bridge design specifications (TxDOT 1993). To avoid introducing
variables in material characteristics, all specimens were cast the same day.
A. Rectangular Specimens
The reinforcement cages for the beams consisted of 4 - #6 (19 mm) bars in the longitudinal direction (two
bars on top, two in the bottom), and 3 - #2 (6 mm) bars in the transverse direction. The spacing between
stirrups was 250 mm (10 in.). The transverse reinforcement was bent on a mandrel to create a U shape,
and attached to the longitudinal bars by using tie wire. Bending was done in accordance with ACI 318-89
requirements for minimum bend diameters for stirrups and ties. Plastic chairs were attached to the cages
to ensure a 25 mm (1-in.) cover on all sides. Figure 4.1 shows a detail of the cross section.
Individual forms for the beams were built out of plywood, in compliance with item 420.9 of the TxDOT
specifications (TxDOT 1993). They were oiled 24 hours before placing the concrete to allow for easy
removal after the specimens had cured.
Figure 4.1 Cross section of beams (1 in. = 2.54 cm)
B. Cylindrical Specimens
The cages for the columns consist of 4 - #6 (19 mm) longitudinal bars and 8 - #2 (6 mm) spiral loops,
spaced at 250 mm (10-in.) apart, as transverse reinforcement. As for the beams, plastic chairs and
metallic tie wire were used. Individual circular loops were cut out of a continuous spiral for the
10-in.
10-in.
No.6 longitudinal
No.2

26
transverse reinforcement. This eliminated the lateral tension caused by a large coil, and facilitated
construction. Figure 4.2 shows a detail of the column cross section.
The column cages were placed in prefabricated, 10-in. inner diameter cardboard forms. The tubes were
attached to plywood and were sealed with silicone.
10-in.
No.2 spiral
No.6 longitudinal bar
Figure 4.2 Cross section of columns (1 in. = 2.54 cm)
4.3 CONCRETE DESIGN
To accelerate corrosion under laboratory conditions, high permeability concrete was desired. Trial
batching was done to determine the mix properties used to cast the specimens.
A. Trial Batch
The trial batch for verifying concrete permeability and strength was based on a standard mix from the
ready-mix supplier. The mix was developed for laboratory use and provided strengths closer to design
values than typically provided at construction sites where the design is often quite conservative (higher
than design values). For the purposes of this study, the water-to- cement ratio (w/c) was lowered from
0.75 to 0.65 to increase the strength. Two trial batches were mixed: one with cast-in chlorides and one
without. For the chloride-contaminated mix, regular iodized food grade salt was added to the mixing
water to achieve a 3.5 percent NaCl solution. An air-entraining agent was added to the mix to reduce
bleeding and may affect permeability. The final air entrainment values were 2.5 percent for the first mix
(without chlorides) and 3% for the second mix (with chlorides). The final w/c was about 0.7 for both
mixes, as water was added to increase workability. The mix proportions for 0.765 m3 (1 yd
3) are shown in
Table 4.4.
Table 4.4 Trial mix design
Cement 385 lbs
Water 268 lbs
Coarse Aggregate
19 mm (3/4”) 1926 lbs
Sand 1629 lbs
Conversions: 1 lb. = 0.4536 kg
B. Trial Batch Properties
After curing for 28 days in a moist chamber, both compression strength and permeability tests were
performed. Both tests were performed according to ASTM standards C39 and C1202-97, respectively.
For the permeability test, cores were extracted from both rectangular and cylindrical specimens. The
results are presented in Tables 4.5 and 4.6. The mix was considered to be satisfactory for the project.
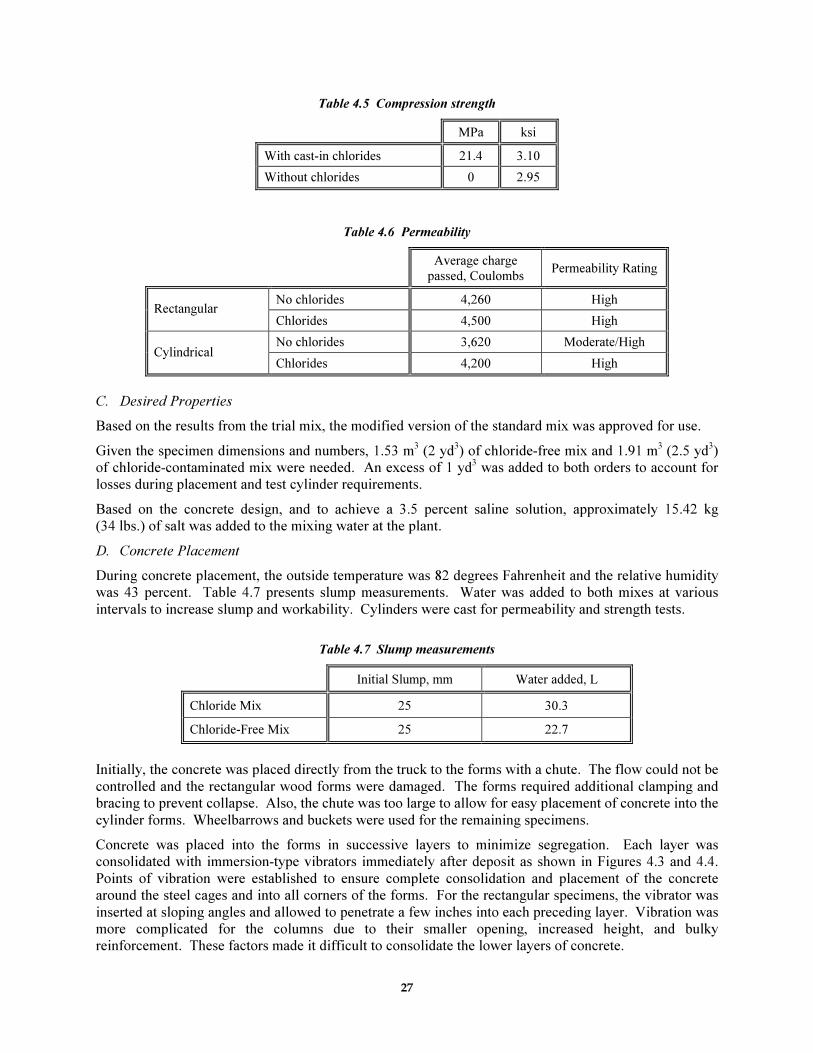
27
Table 4.5 Compression strength
MPa ksi
With cast-in chlorides 21.4 3.10
Without chlorides 0 2.95
Table 4.6 Permeability
Average charge
passed, Coulombs Permeability Rating
No chlorides 4,260 High Rectangular
Chlorides 4,500 High
No chlorides 3,620 Moderate/High Cylindrical
Chlorides 4,200 High
C. Desired Properties
Based on the results from the trial mix, the modified version of the standard mix was approved for use.
Given the specimen dimensions and numbers, 1.53 m3 (2 yd
3) of chloride-free mix and 1.91 m
3 (2.5 yd
3)
of chloride-contaminated mix were needed. An excess of 1 yd3 was added to both orders to account for
losses during placement and test cylinder requirements.
Based on the concrete design, and to achieve a 3.5 percent saline solution, approximately 15.42 kg
(34 lbs.) of salt was added to the mixing water at the plant.
D. Concrete Placement
During concrete placement, the outside temperature was 82 degrees Fahrenheit and the relative humidity
was 43 percent. Table 4.7 presents slump measurements. Water was added to both mixes at various
intervals to increase slump and workability. Cylinders were cast for permeability and strength tests.
Table 4.7 Slump measurements
Initial Slump, mm Water added, L
Chloride Mix 25 30.3
Chloride-Free Mix 25 22.7
Initially, the concrete was placed directly from the truck to the forms with a chute. The flow could not be
controlled and the rectangular wood forms were damaged. The forms required additional clamping and
bracing to prevent collapse. Also, the chute was too large to allow for easy placement of concrete into the
cylinder forms. Wheelbarrows and buckets were used for the remaining specimens.
Concrete was placed into the forms in successive layers to minimize segregation. Each layer was
consolidated with immersion-type vibrators immediately after deposit as shown in Figures 4.3 and 4.4.
Points of vibration were established to ensure complete consolidation and placement of the concrete
around the steel cages and into all corners of the forms. For the rectangular specimens, the vibrator was
inserted at sloping angles and allowed to penetrate a few inches into each preceding layer. Vibration was
more complicated for the columns due to their smaller opening, increased height, and bulky
reinforcement. These factors made it difficult to consolidate the lower layers of concrete.
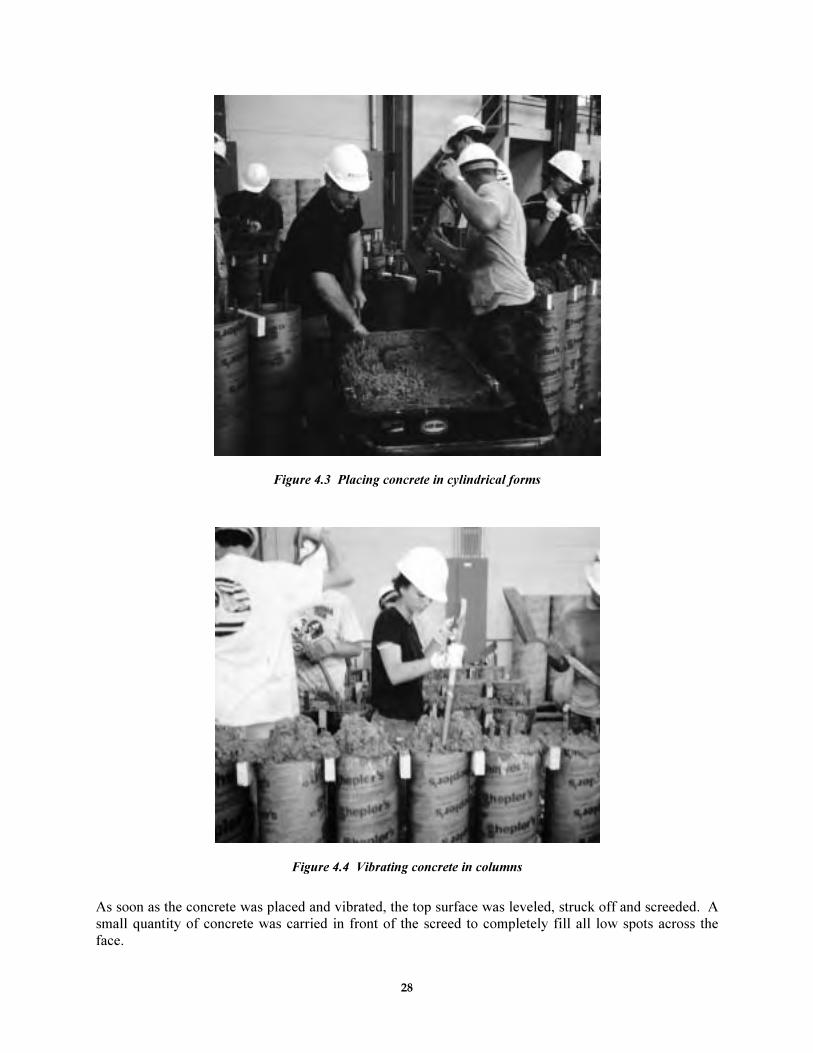
28
Figure 4.3 Placing concrete in cylindrical forms
Figure 4.4 Vibrating concrete in columns
As soon as the concrete was placed and vibrated, the top surface was leveled, struck off and screeded. A
small quantity of concrete was carried in front of the screed to completely fill all low spots across the
face.
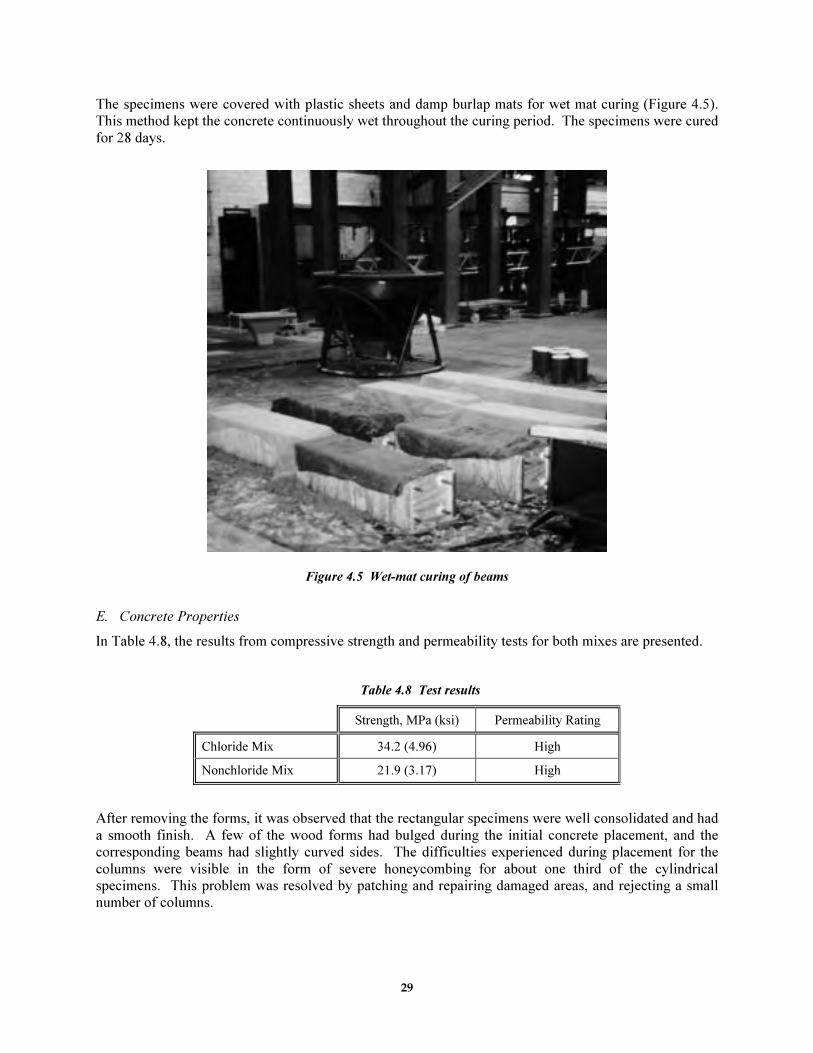
29
The specimens were covered with plastic sheets and damp burlap mats for wet mat curing (Figure 4.5).
This method kept the concrete continuously wet throughout the curing period. The specimens were cured
for 28 days.
Figure 4.5 Wet-mat curing of beams
E. Concrete Properties
In Table 4.8, the results from compressive strength and permeability tests for both mixes are presented.
Table 4.8 Test results
Strength, MPa (ksi) Permeability Rating
Chloride Mix 34.2 (4.96) High
Nonchloride Mix 21.9 (3.17) High
After removing the forms, it was observed that the rectangular specimens were well consolidated and had
a smooth finish. A few of the wood forms had bulged during the initial concrete placement, and the
corresponding beams had slightly curved sides. The difficulties experienced during placement for the
columns were visible in the form of severe honeycombing for about one third of the cylindrical
specimens. This problem was resolved by patching and repairing damaged areas, and rejecting a small
number of columns.
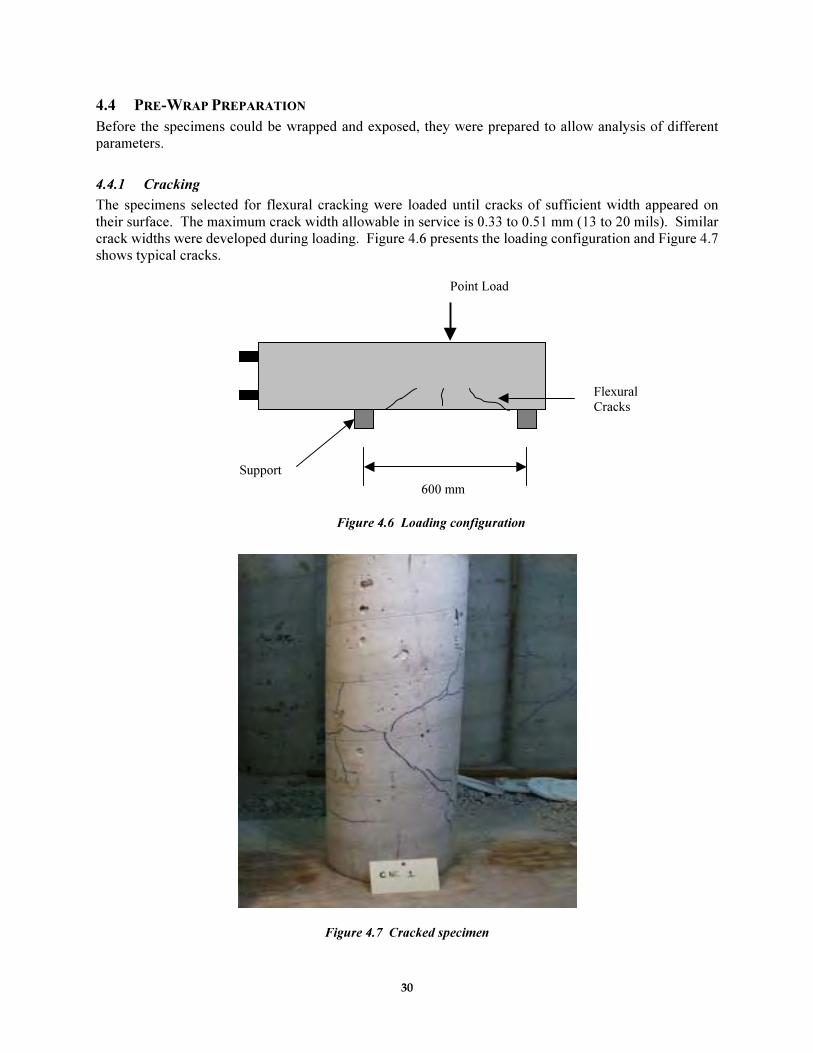
30
4.4 PRE-WRAP PREPARATION
Before the specimens could be wrapped and exposed, they were prepared to allow analysis of different
parameters.
4.4.1 Cracking
The specimens selected for flexural cracking were loaded until cracks of sufficient width appeared on
their surface. The maximum crack width allowable in service is 0.33 to 0.51 mm (13 to 20 mils). Similar
crack widths were developed during loading. Figure 4.6 presents the loading configuration and Figure 4.7
shows typical cracks.
Figure 4.6 Loading configuration
Figure 4.7 Cracked specimen
600 mm
Point Load
Support
Flexural Cracks
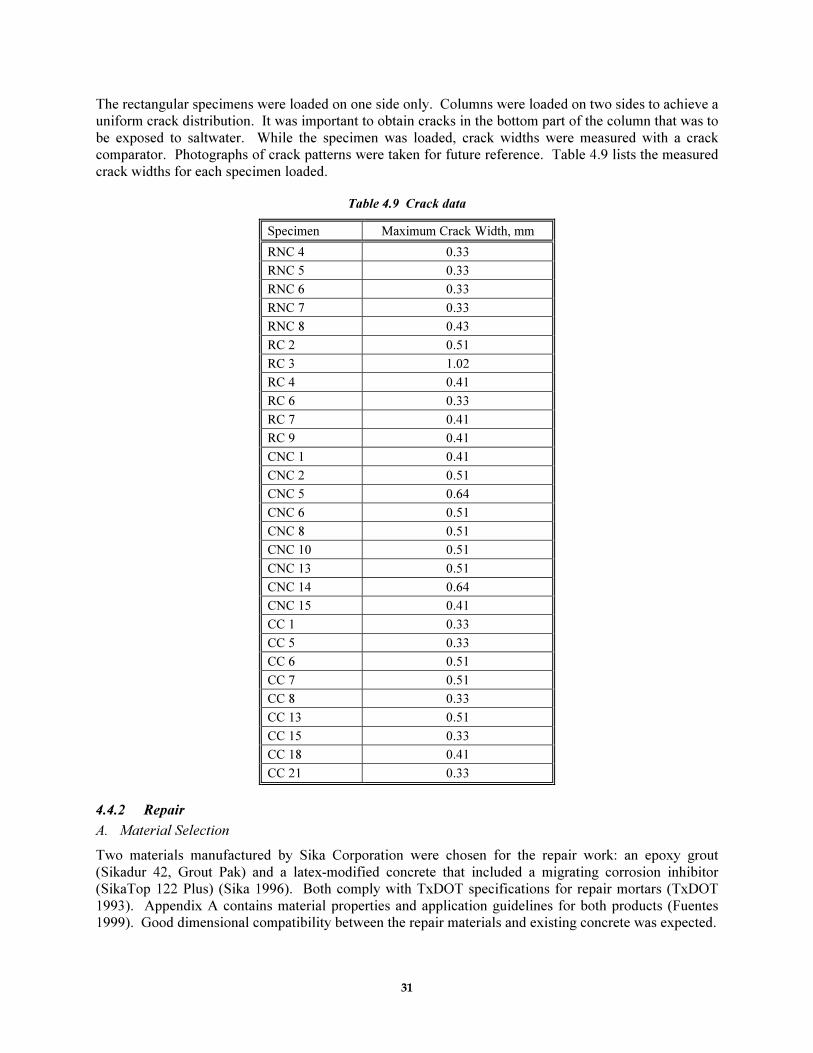
31
The rectangular specimens were loaded on one side only. Columns were loaded on two sides to achieve a
uniform crack distribution. It was important to obtain cracks in the bottom part of the column that was to
be exposed to saltwater. While the specimen was loaded, crack widths were measured with a crack
comparator. Photographs of crack patterns were taken for future reference. Table 4.9 lists the measured
crack widths for each specimen loaded.
Table 4.9 Crack data
Specimen Maximum Crack Width, mm
RNC 4 0.33
RNC 5 0.33
RNC 6 0.33
RNC 7 0.33
RNC 8 0.43
RC 2 0.51
RC 3 1.02
RC 4 0.41
RC 6 0.33
RC 7 0.41
RC 9 0.41
CNC 1 0.41
CNC 2 0.51
CNC 5 0.64
CNC 6 0.51
CNC 8 0.51
CNC 10 0.51
CNC 13 0.51
CNC 14 0.64
CNC 15 0.41
CC 1 0.33
CC 5 0.33
CC 6 0.51
CC 7 0.51
CC 8 0.33
CC 13 0.51
CC 15 0.33
CC 18 0.41
CC 21 0.33
4.4.2 Repair
A. Material Selection
Two materials manufactured by Sika Corporation were chosen for the repair work: an epoxy grout
(Sikadur 42, Grout Pak) and a latex-modified concrete that included a migrating corrosion inhibitor
(SikaTop 122 Plus) (Sika 1996). Both comply with TxDOT specifications for repair mortars (TxDOT
1993). Appendix A contains material properties and application guidelines for both products (Fuentes
1999). Good dimensional compatibility between the repair materials and existing concrete was expected.
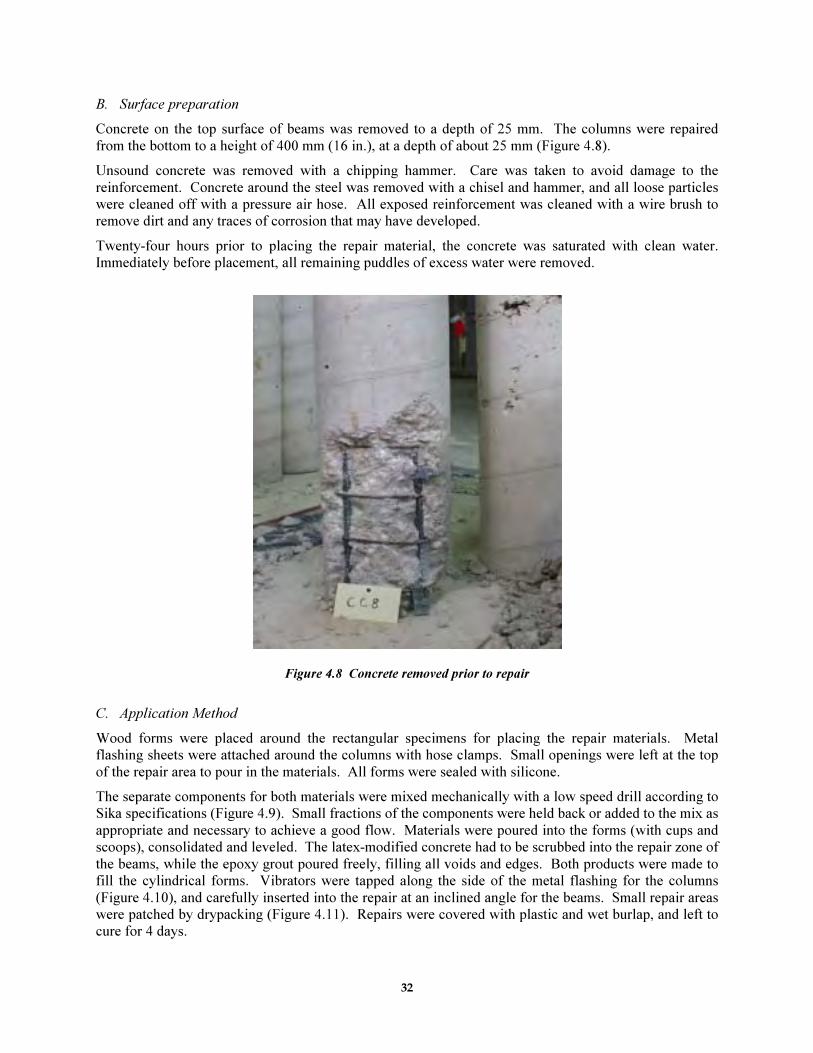
32
B. Surface preparation
Concrete on the top surface of beams was removed to a depth of 25 mm. The columns were repaired
from the bottom to a height of 400 mm (16 in.), at a depth of about 25 mm (Figure 4.8).
Unsound concrete was removed with a chipping hammer. Care was taken to avoid damage to the
reinforcement. Concrete around the steel was removed with a chisel and hammer, and all loose particles
were cleaned off with a pressure air hose. All exposed reinforcement was cleaned with a wire brush to
remove dirt and any traces of corrosion that may have developed.
Twenty-four hours prior to placing the repair material, the concrete was saturated with clean water.
Immediately before placement, all remaining puddles of excess water were removed.
Figure 4.8 Concrete removed prior to repair
C. Application Method
Wood forms were placed around the rectangular specimens for placing the repair materials. Metal
flashing sheets were attached around the columns with hose clamps. Small openings were left at the top
of the repair area to pour in the materials. All forms were sealed with silicone.
The separate components for both materials were mixed mechanically with a low speed drill according to
Sika specifications (Figure 4.9). Small fractions of the components were held back or added to the mix as
appropriate and necessary to achieve a good flow. Materials were poured into the forms (with cups and
scoops), consolidated and leveled. The latex-modified concrete had to be scrubbed into the repair zone of
the beams, while the epoxy grout poured freely, filling all voids and edges. Both products were made to
fill the cylindrical forms. Vibrators were tapped along the side of the metal flashing for the columns
(Figure 4.10), and carefully inserted into the repair at an inclined angle for the beams. Small repair areas
were patched by drypacking (Figure 4.11). Repairs were covered with plastic and wet burlap, and left to
cure for 4 days.
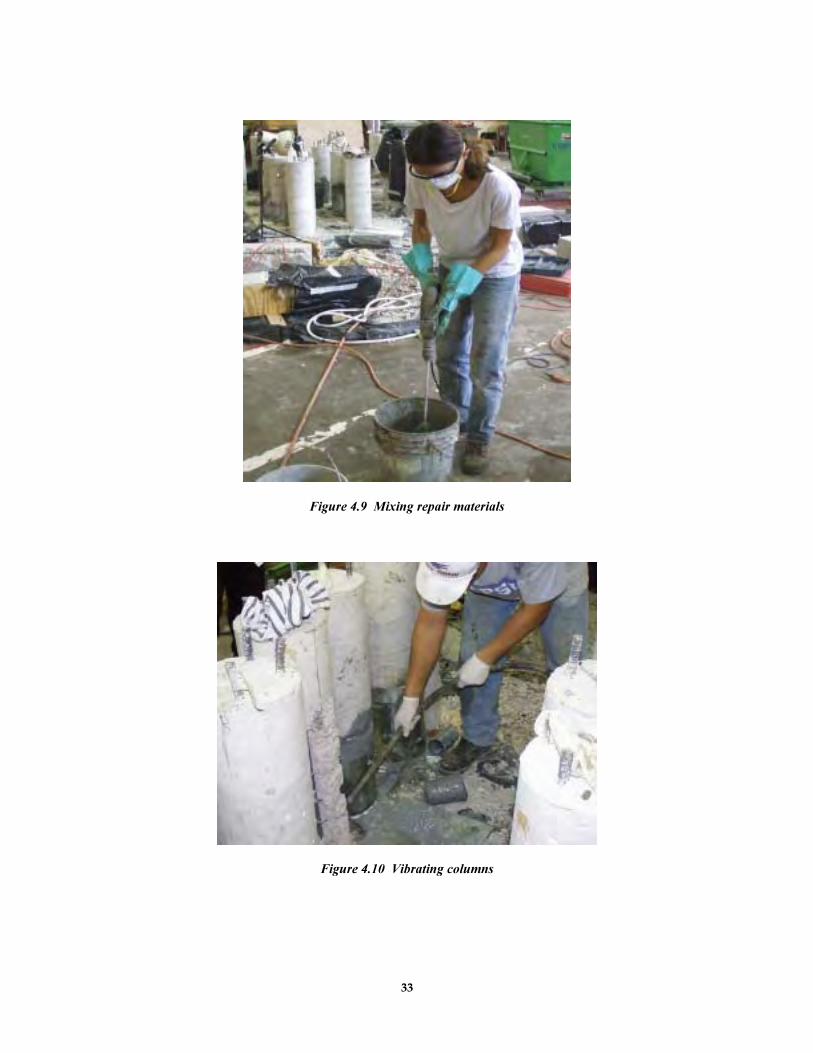
33
Figure 4.9 Mixing repair materials
Figure 4.10 Vibrating columns
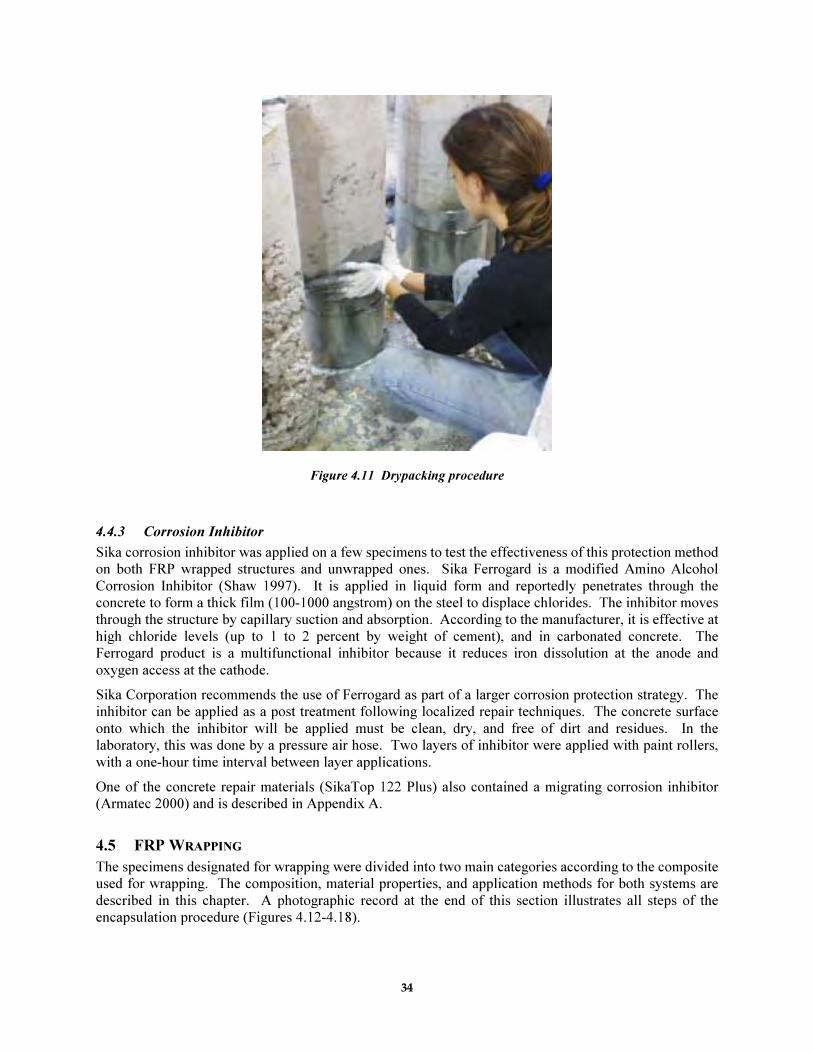
34
Figure 4.11 Drypacking procedure
4.4.3 Corrosion Inhibitor
Sika corrosion inhibitor was applied on a few specimens to test the effectiveness of this protection method
on both FRP wrapped structures and unwrapped ones. Sika Ferrogard is a modified Amino Alcohol
Corrosion Inhibitor (Shaw 1997). It is applied in liquid form and reportedly penetrates through the
concrete to form a thick film (100-1000 angstrom) on the steel to displace chlorides. The inhibitor moves
through the structure by capillary suction and absorption. According to the manufacturer, it is effective at
high chloride levels (up to 1 to 2 percent by weight of cement), and in carbonated concrete. The
Ferrogard product is a multifunctional inhibitor because it reduces iron dissolution at the anode and
oxygen access at the cathode.
Sika Corporation recommends the use of Ferrogard as part of a larger corrosion protection strategy. The
inhibitor can be applied as a post treatment following localized repair techniques. The concrete surface
onto which the inhibitor will be applied must be clean, dry, and free of dirt and residues. In the
laboratory, this was done by a pressure air hose. Two layers of inhibitor were applied with paint rollers,
with a one-hour time interval between layer applications.
One of the concrete repair materials (SikaTop 122 Plus) also contained a migrating corrosion inhibitor
(Armatec 2000) and is described in Appendix A.
4.5 FRP WRAPPING
The specimens designated for wrapping were divided into two main categories according to the composite
used for wrapping. The composition, material properties, and application methods for both systems are
described in this chapter. A photographic record at the end of this section illustrates all steps of the
encapsulation procedure (Figures 4.12-4.18).
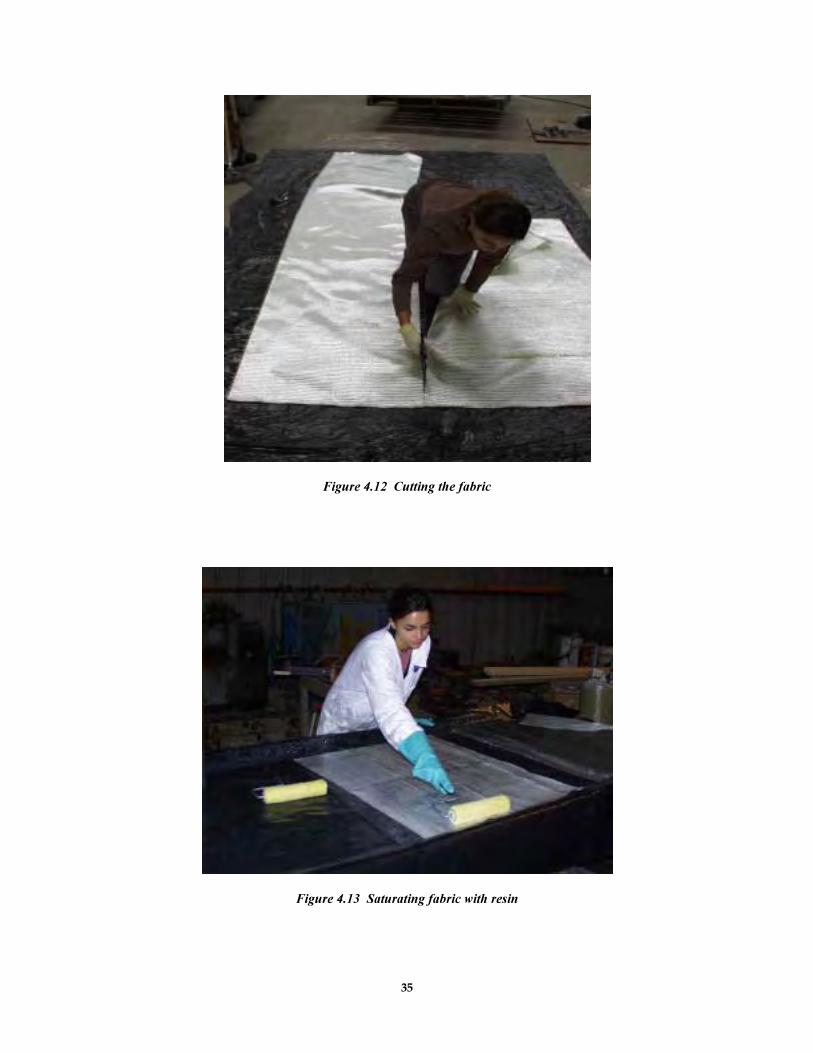
35
Figure 4.12 Cutting the fabric
Figure 4.13 Saturating fabric with resin
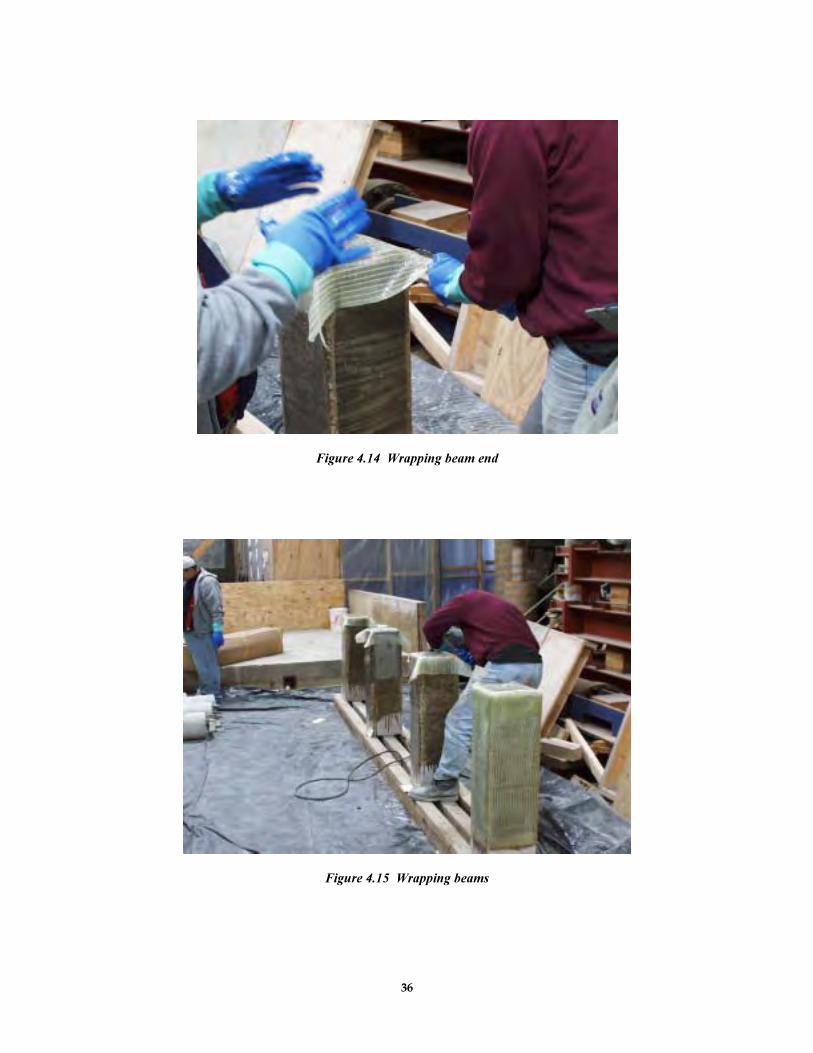
36
Figure 4.14 Wrapping beam end
Figure 4.15 Wrapping beams
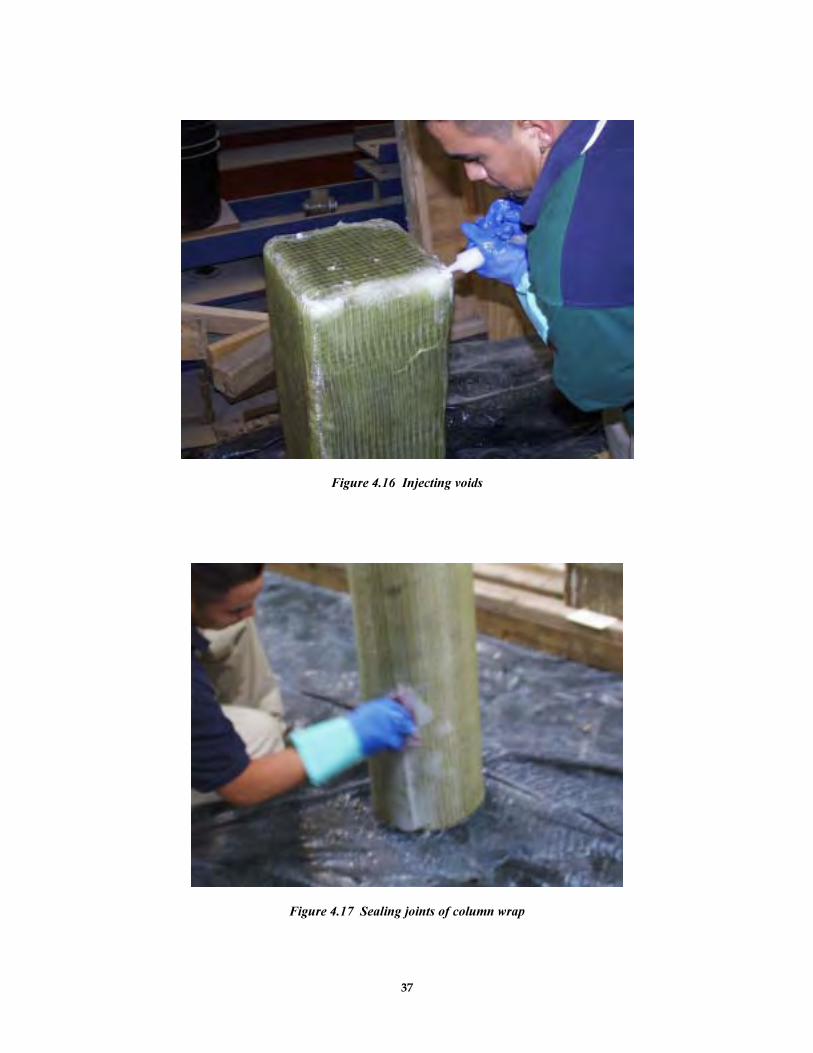
37
Figure 4.16 Injecting voids
Figure 4.17 Sealing joints of column wrap
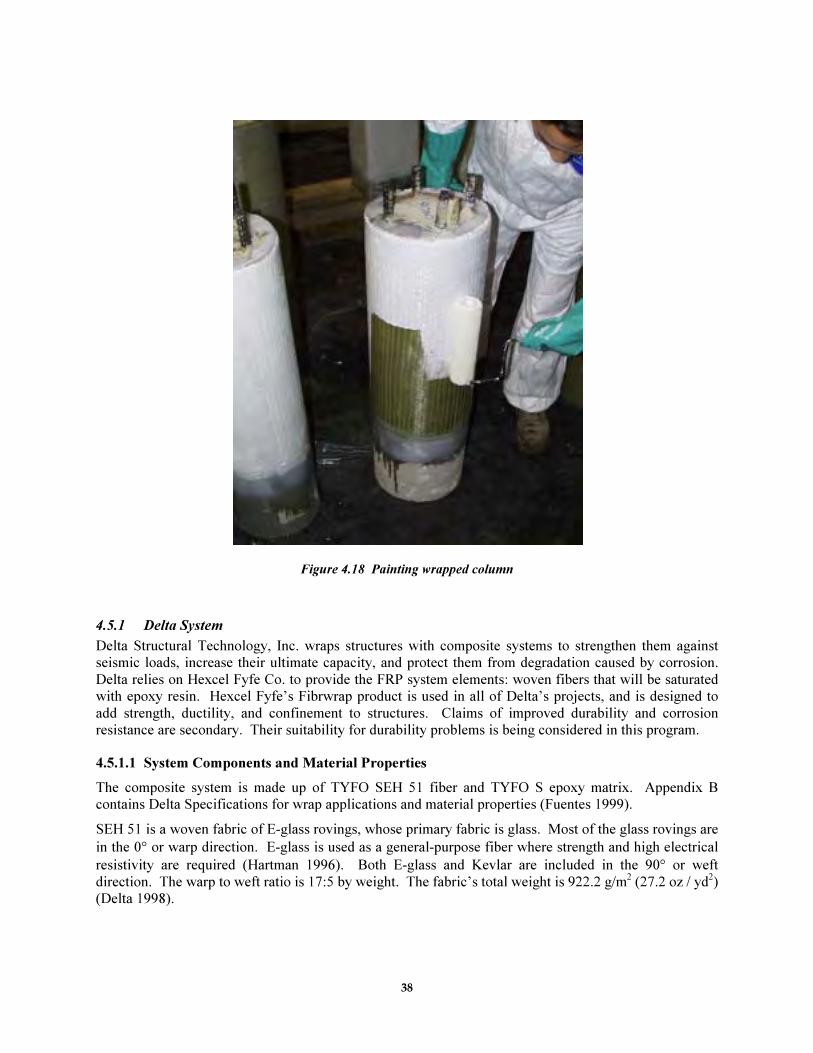
38
Figure 4.18 Painting wrapped column
4.5.1 Delta System
Delta Structural Technology, Inc. wraps structures with composite systems to strengthen them against
seismic loads, increase their ultimate capacity, and protect them from degradation caused by corrosion.
Delta relies on Hexcel Fyfe Co. to provide the FRP system elements: woven fibers that will be saturated
with epoxy resin. Hexcel Fyfe’s Fibrwrap product is used in all of Delta’s projects, and is designed to
add strength, ductility, and confinement to structures. Claims of improved durability and corrosion
resistance are secondary. Their suitability for durability problems is being considered in this program.
4.5.1.1 System Components and Material Properties
The composite system is made up of TYFO SEH 51 fiber and TYFO S epoxy matrix. Appendix B
contains Delta Specifications for wrap applications and material properties (Fuentes 1999).
SEH 51 is a woven fabric of E-glass rovings, whose primary fabric is glass. Most of the glass rovings are
in the 0° or warp direction. E-glass is used as a general-purpose fiber where strength and high electrical
resistivity are required (Hartman 1996). Both E-glass and Kevlar are included in the 90° or weft
direction. The warp to weft ratio is 17:5 by weight. The fabric’s total weight is 922.2 g/m2 (27.2 oz / yd
2)
(Delta 1998).
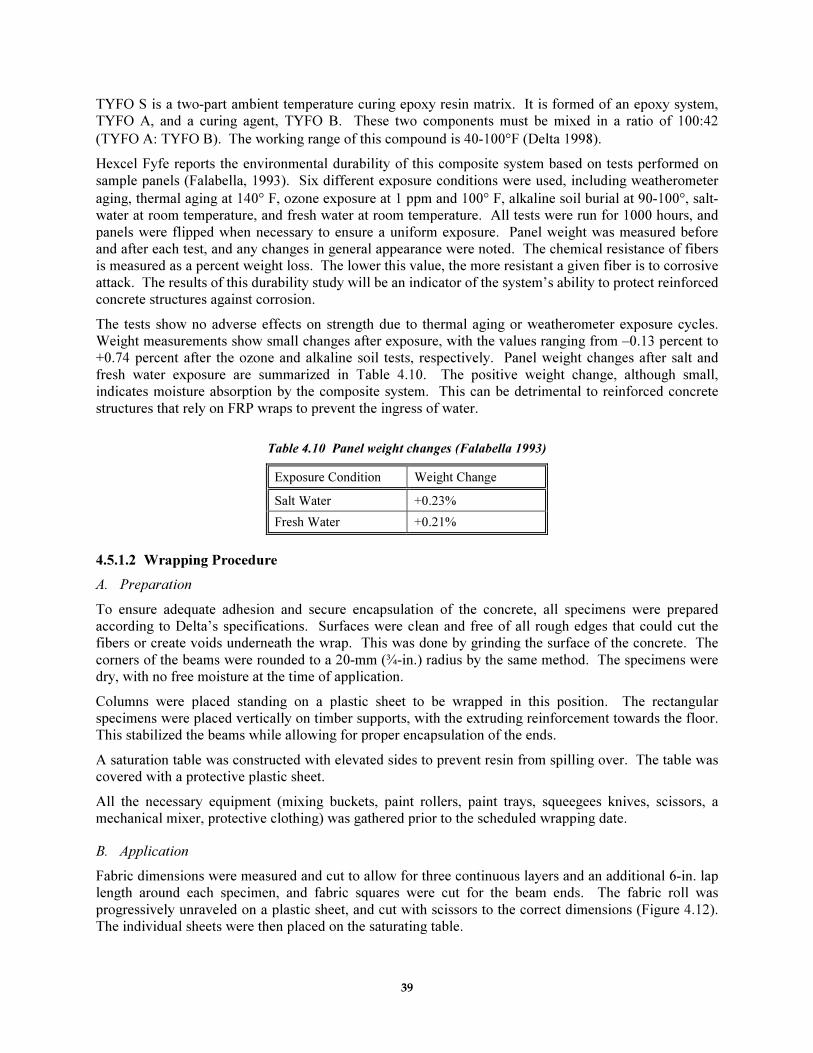
39
TYFO S is a two-part ambient temperature curing epoxy resin matrix. It is formed of an epoxy system,
TYFO A, and a curing agent, TYFO B. These two components must be mixed in a ratio of 100:42
(TYFO A: TYFO B). The working range of this compound is 40-100°F (Delta 1998).
Hexcel Fyfe reports the environmental durability of this composite system based on tests performed on
sample panels (Falabella, 1993). Six different exposure conditions were used, including weatherometer
aging, thermal aging at 140° F, ozone exposure at 1 ppm and 100° F, alkaline soil burial at 90-100°, salt-
water at room temperature, and fresh water at room temperature. All tests were run for 1000 hours, and
panels were flipped when necessary to ensure a uniform exposure. Panel weight was measured before
and after each test, and any changes in general appearance were noted. The chemical resistance of fibers
is measured as a percent weight loss. The lower this value, the more resistant a given fiber is to corrosive
attack. The results of this durability study will be an indicator of the system’s ability to protect reinforced
concrete structures against corrosion.
The tests show no adverse effects on strength due to thermal aging or weatherometer exposure cycles.
Weight measurements show small changes after exposure, with the values ranging from –0.13 percent to
+0.74 percent after the ozone and alkaline soil tests, respectively. Panel weight changes after salt and
fresh water exposure are summarized in Table 4.10. The positive weight change, although small,
indicates moisture absorption by the composite system. This can be detrimental to reinforced concrete
structures that rely on FRP wraps to prevent the ingress of water.
Table 4.10 Panel weight changes (Falabella 1993)
Exposure Condition Weight Change
Salt Water +0.23%
Fresh Water +0.21%
4.5.1.2 Wrapping Procedure
A. Preparation
To ensure adequate adhesion and secure encapsulation of the concrete, all specimens were prepared
according to Delta’s specifications. Surfaces were clean and free of all rough edges that could cut the
fibers or create voids underneath the wrap. This was done by grinding the surface of the concrete. The
corners of the beams were rounded to a 20-mm (¾-in.) radius by the same method. The specimens were
dry, with no free moisture at the time of application.
Columns were placed standing on a plastic sheet to be wrapped in this position. The rectangular
specimens were placed vertically on timber supports, with the extruding reinforcement towards the floor.
This stabilized the beams while allowing for proper encapsulation of the ends.
A saturation table was constructed with elevated sides to prevent resin from spilling over. The table was
covered with a protective plastic sheet.
All the necessary equipment (mixing buckets, paint rollers, paint trays, squeegees knives, scissors, a
mechanical mixer, protective clothing) was gathered prior to the scheduled wrapping date.
B. Application
Fabric dimensions were measured and cut to allow for three continuous layers and an additional 6-in. lap
length around each specimen, and fabric squares were cut for the beam ends. The fabric roll was
progressively unraveled on a plastic sheet, and cut with scissors to the correct dimensions (Figure 4.12).
The individual sheets were then placed on the saturating table.
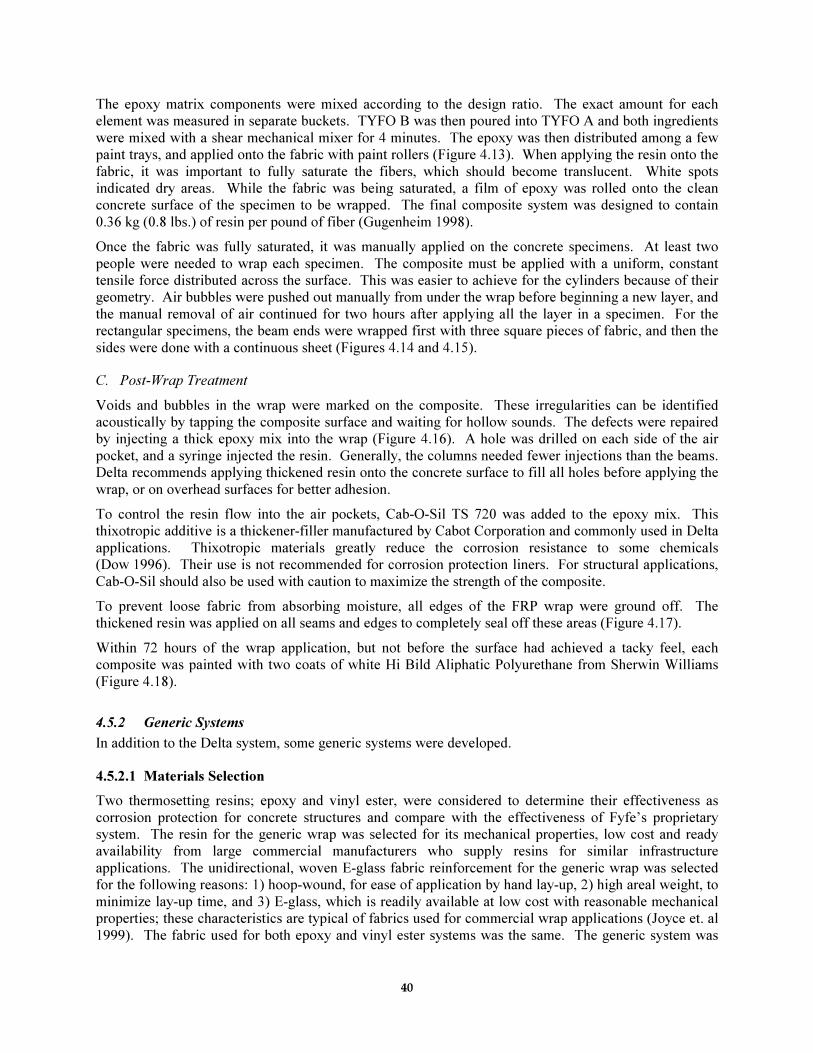
40
The epoxy matrix components were mixed according to the design ratio. The exact amount for each
element was measured in separate buckets. TYFO B was then poured into TYFO A and both ingredients
were mixed with a shear mechanical mixer for 4 minutes. The epoxy was then distributed among a few
paint trays, and applied onto the fabric with paint rollers (Figure 4.13). When applying the resin onto the
fabric, it was important to fully saturate the fibers, which should become translucent. White spots
indicated dry areas. While the fabric was being saturated, a film of epoxy was rolled onto the clean
concrete surface of the specimen to be wrapped. The final composite system was designed to contain
0.36 kg (0.8 lbs.) of resin per pound of fiber (Gugenheim 1998).
Once the fabric was fully saturated, it was manually applied on the concrete specimens. At least two
people were needed to wrap each specimen. The composite must be applied with a uniform, constant
tensile force distributed across the surface. This was easier to achieve for the cylinders because of their
geometry. Air bubbles were pushed out manually from under the wrap before beginning a new layer, and
the manual removal of air continued for two hours after applying all the layer in a specimen. For the
rectangular specimens, the beam ends were wrapped first with three square pieces of fabric, and then the
sides were done with a continuous sheet (Figures 4.14 and 4.15).
C. Post-Wrap Treatment
Voids and bubbles in the wrap were marked on the composite. These irregularities can be identified
acoustically by tapping the composite surface and waiting for hollow sounds. The defects were repaired
by injecting a thick epoxy mix into the wrap (Figure 4.16). A hole was drilled on each side of the air
pocket, and a syringe injected the resin. Generally, the columns needed fewer injections than the beams.
Delta recommends applying thickened resin onto the concrete surface to fill all holes before applying the
wrap, or on overhead surfaces for better adhesion.
To control the resin flow into the air pockets, Cab-O-Sil TS 720 was added to the epoxy mix. This
thixotropic additive is a thickener-filler manufactured by Cabot Corporation and commonly used in Delta
applications. Thixotropic materials greatly reduce the corrosion resistance to some chemicals
(Dow 1996). Their use is not recommended for corrosion protection liners. For structural applications,
Cab-O-Sil should also be used with caution to maximize the strength of the composite.
To prevent loose fabric from absorbing moisture, all edges of the FRP wrap were ground off. The
thickened resin was applied on all seams and edges to completely seal off these areas (Figure 4.17).
Within 72 hours of the wrap application, but not before the surface had achieved a tacky feel, each
composite was painted with two coats of white Hi Bild Aliphatic Polyurethane from Sherwin Williams
(Figure 4.18).
4.5.2 Generic Systems
In addition to the Delta system, some generic systems were developed.
4.5.2.1 Materials Selection
Two thermosetting resins; epoxy and vinyl ester, were considered to determine their effectiveness as
corrosion protection for concrete structures and compare with the effectiveness of Fyfe’s proprietary
system. The resin for the generic wrap was selected for its mechanical properties, low cost and ready
availability from large commercial manufacturers who supply resins for similar infrastructure
applications. The unidirectional, woven E-glass fabric reinforcement for the generic wrap was selected
for the following reasons: 1) hoop-wound, for ease of application by hand lay-up, 2) high areal weight, to
minimize lay-up time, and 3) E-glass, which is readily available at low cost with reasonable mechanical
properties; these characteristics are typical of fabrics used for commercial wrap applications (Joyce et. al
1999). The fabric used for both epoxy and vinyl ester systems was the same. The generic system was
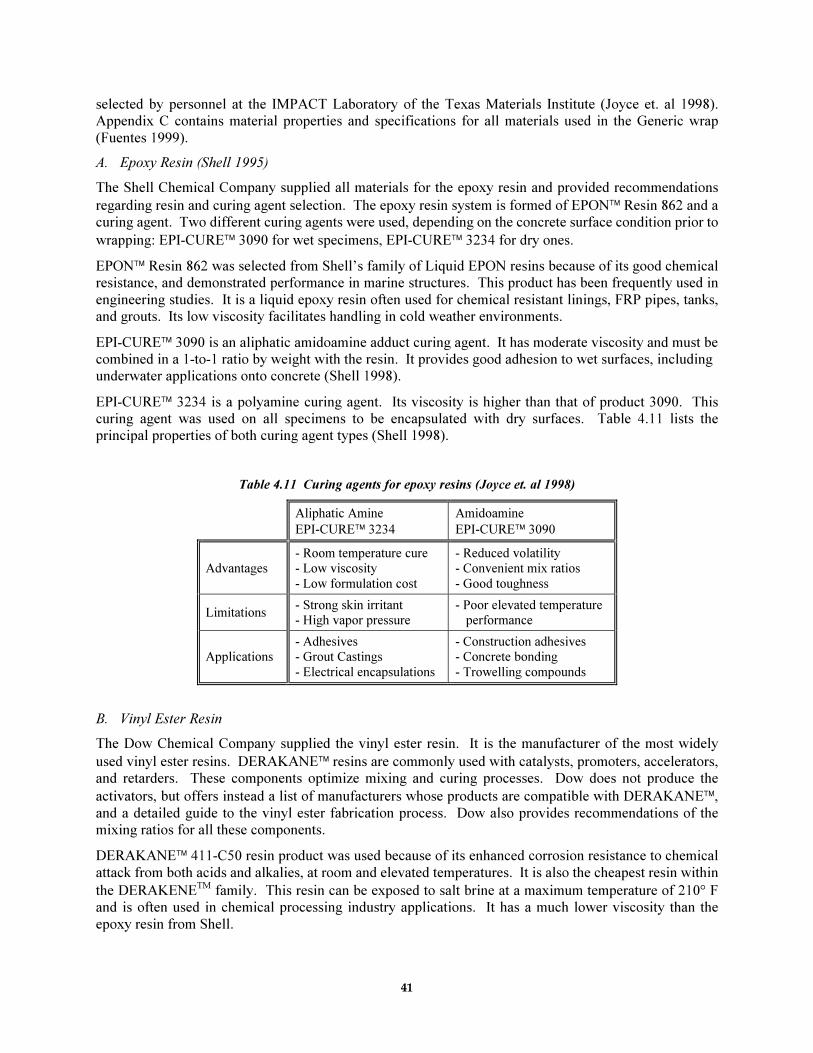
41
selected by personnel at the IMPACT Laboratory of the Texas Materials Institute (Joyce et. al 1998).
Appendix C contains material properties and specifications for all materials used in the Generic wrap
(Fuentes 1999).
A. Epoxy Resin (Shell 1995)
The Shell Chemical Company supplied all materials for the epoxy resin and provided recommendations
regarding resin and curing agent selection. The epoxy resin system is formed of EPON Resin 862 and a
curing agent. Two different curing agents were used, depending on the concrete surface condition prior to
wrapping: EPI-CURE 3090 for wet specimens, EPI-CURE 3234 for dry ones.
EPON Resin 862 was selected from Shell’s family of Liquid EPON resins because of its good chemical
resistance, and demonstrated performance in marine structures. This product has been frequently used in
engineering studies. It is a liquid epoxy resin often used for chemical resistant linings, FRP pipes, tanks,
and grouts. Its low viscosity facilitates handling in cold weather environments.
EPI-CURE 3090 is an aliphatic amidoamine adduct curing agent. It has moderate viscosity and must be
combined in a 1-to-1 ratio by weight with the resin. It provides good adhesion to wet surfaces, including
underwater applications onto concrete (Shell 1998).
EPI-CURE 3234 is a polyamine curing agent. Its viscosity is higher than that of product 3090. This
curing agent was used on all specimens to be encapsulated with dry surfaces. Table 4.11 lists the
principal properties of both curing agent types (Shell 1998).
Table 4.11 Curing agents for epoxy resins (Joyce et. al 1998)
Aliphatic Amine
EPI-CURE 3234
Amidoamine
EPI-CURE 3090
Advantages - Room temperature cure - Low viscosity
- Low formulation cost
- Reduced volatility - Convenient mix ratios
- Good toughness
Limitations - Strong skin irritant - High vapor pressure
- Poor elevated temperature performance
Applications - Adhesives - Grout Castings
- Electrical encapsulations
- Construction adhesives - Concrete bonding
- Trowelling compounds
B. Vinyl Ester Resin
The Dow Chemical Company supplied the vinyl ester resin. It is the manufacturer of the most widely
used vinyl ester resins. DERAKANE resins are commonly used with catalysts, promoters, accelerators,
and retarders. These components optimize mixing and curing processes. Dow does not produce the
activators, but offers instead a list of manufacturers whose products are compatible with DERAKANE,
and a detailed guide to the vinyl ester fabrication process. Dow also provides recommendations of the
mixing ratios for all these components.
DERAKANE 411-C50 resin product was used because of its enhanced corrosion resistance to chemical
attack from both acids and alkalies, at room and elevated temperatures. It is also the cheapest resin within
the DERAKENETM
family. This resin can be exposed to salt brine at a maximum temperature of 210° F
and is often used in chemical processing industry applications. It has a much lower viscosity than the
epoxy resin from Shell.
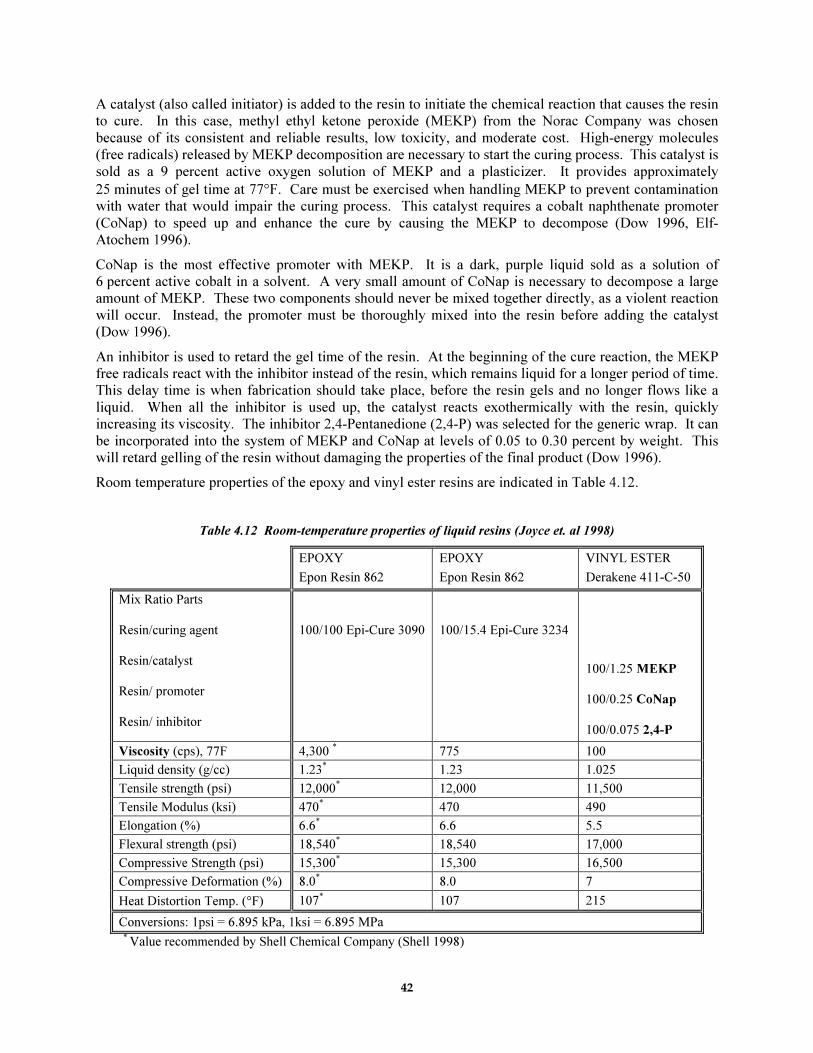
42
A catalyst (also called initiator) is added to the resin to initiate the chemical reaction that causes the resin
to cure. In this case, methyl ethyl ketone peroxide (MEKP) from the Norac Company was chosen
because of its consistent and reliable results, low toxicity, and moderate cost. High-energy molecules
(free radicals) released by MEKP decomposition are necessary to start the curing process. This catalyst is
sold as a 9 percent active oxygen solution of MEKP and a plasticizer. It provides approximately
25 minutes of gel time at 77°F. Care must be exercised when handling MEKP to prevent contamination
with water that would impair the curing process. This catalyst requires a cobalt naphthenate promoter
(CoNap) to speed up and enhance the cure by causing the MEKP to decompose (Dow 1996, Elf-
Atochem 1996).
CoNap is the most effective promoter with MEKP. It is a dark, purple liquid sold as a solution of
6 percent active cobalt in a solvent. A very small amount of CoNap is necessary to decompose a large
amount of MEKP. These two components should never be mixed together directly, as a violent reaction
will occur. Instead, the promoter must be thoroughly mixed into the resin before adding the catalyst
(Dow 1996).
An inhibitor is used to retard the gel time of the resin. At the beginning of the cure reaction, the MEKP
free radicals react with the inhibitor instead of the resin, which remains liquid for a longer period of time.
This delay time is when fabrication should take place, before the resin gels and no longer flows like a
liquid. When all the inhibitor is used up, the catalyst reacts exothermically with the resin, quickly
increasing its viscosity. The inhibitor 2,4-Pentanedione (2,4-P) was selected for the generic wrap. It can
be incorporated into the system of MEKP and CoNap at levels of 0.05 to 0.30 percent by weight. This
will retard gelling of the resin without damaging the properties of the final product (Dow 1996).
Room temperature properties of the epoxy and vinyl ester resins are indicated in Table 4.12.
Table 4.12 Room-temperature properties of liquid resins (Joyce et. al 1998)
EPOXY
Epon Resin 862
EPOXY
Epon Resin 862
VINYL ESTER
Derakene 411-C-50
Mix Ratio Parts
Resin/curing agent
Resin/catalyst
Resin/ promoter
Resin/ inhibitor
100/100 Epi-Cure 3090
100/15.4 Epi-Cure 3234
100/1.25 MEKP
100/0.25 CoNap
100/0.075 2,4-P
Viscosity (cps), 77F 4,300 * 775 100
Liquid density (g/cc) 1.23* 1.23 1.025
Tensile strength (psi) 12,000* 12,000 11,500
Tensile Modulus (ksi) 470* 470 490
Elongation (%) 6.6* 6.6 5.5
Flexural strength (psi) 18,540* 18,540 17,000
Compressive Strength (psi) 15,300* 15,300 16,500
Compressive Deformation (%) 8.0* 8.0 7
Heat Distortion Temp. (°F) 107* 107 215
Conversions: 1psi = 6.895 kPa, 1ksi = 6.895 MPa
* Value recommended by Shell Chemical Company (Shell 1998)
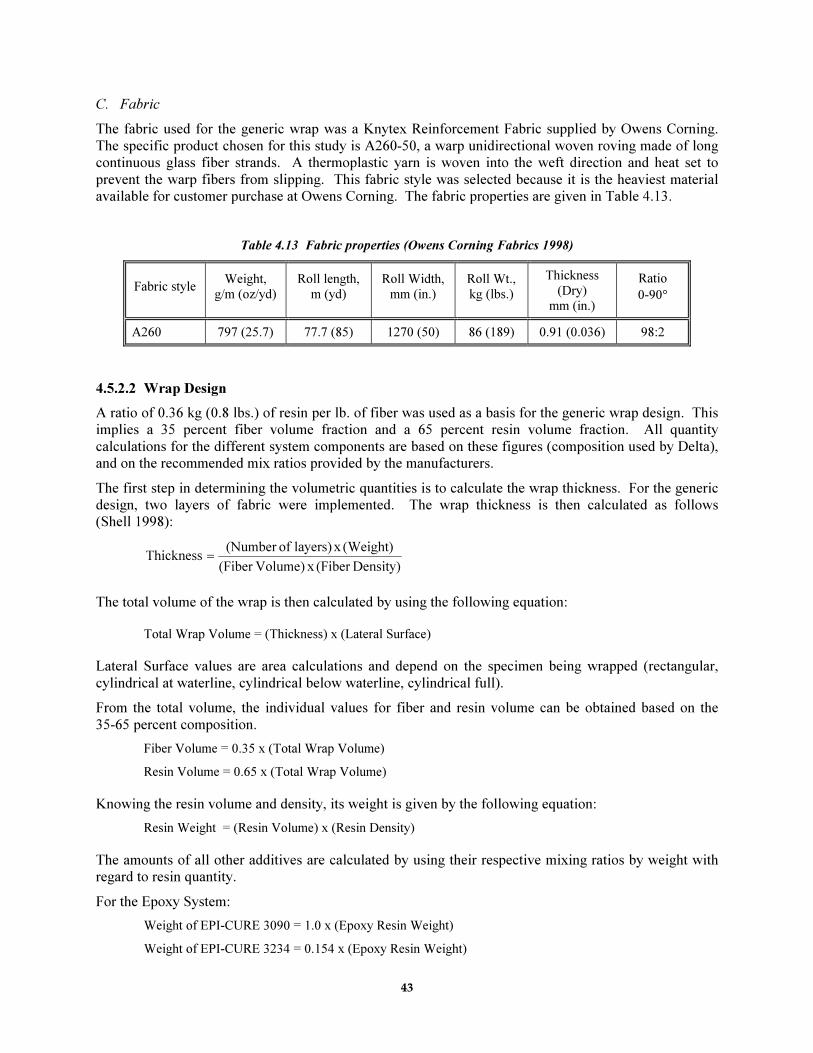
43
C. Fabric
The fabric used for the generic wrap was a Knytex Reinforcement Fabric supplied by Owens Corning.
The specific product chosen for this study is A260-50, a warp unidirectional woven roving made of long
continuous glass fiber strands. A thermoplastic yarn is woven into the weft direction and heat set to
prevent the warp fibers from slipping. This fabric style was selected because it is the heaviest material
available for customer purchase at Owens Corning. The fabric properties are given in Table 4.13.
Table 4.13 Fabric properties (Owens Corning Fabrics 1998)
Fabric style Weight,
g/m (oz/yd)
Roll length,
m (yd)
Roll Width,
mm (in.)
Roll Wt.,
kg (lbs.)
Thickness
(Dry) mm (in.)
Ratio
0-90°
A260 797 (25.7) 77.7 (85) 1270 (50) 86 (189) 0.91 (0.036) 98:2
4.5.2.2 Wrap Design
A ratio of 0.36 kg (0.8 lbs.) of resin per lb. of fiber was used as a basis for the generic wrap design. This
implies a 35 percent fiber volume fraction and a 65 percent resin volume fraction. All quantity
calculations for the different system components are based on these figures (composition used by Delta),
and on the recommended mix ratios provided by the manufacturers.
The first step in determining the volumetric quantities is to calculate the wrap thickness. For the generic
design, two layers of fabric were implemented. The wrap thickness is then calculated as follows
(Shell 1998):
Density)(FiberxVolume)(Fiber
(Weight)xlayers)of(NumberThickness =
The total volume of the wrap is then calculated by using the following equation:
Total Wrap Volume = (Thickness) x (Lateral Surface)
Lateral Surface values are area calculations and depend on the specimen being wrapped (rectangular,
cylindrical at waterline, cylindrical below waterline, cylindrical full).
From the total volume, the individual values for fiber and resin volume can be obtained based on the
35-65 percent composition.
Fiber Volume = 0.35 x (Total Wrap Volume)
Resin Volume = 0.65 x (Total Wrap Volume)
Knowing the resin volume and density, its weight is given by the following equation:
Resin Weight = (Resin Volume) x (Resin Density)
The amounts of all other additives are calculated by using their respective mixing ratios by weight with
regard to resin quantity.
For the Epoxy System:
Weight of EPI-CURE 3090 = 1.0 x (Epoxy Resin Weight)
Weight of EPI-CURE 3234 = 0.154 x (Epoxy Resin Weight)
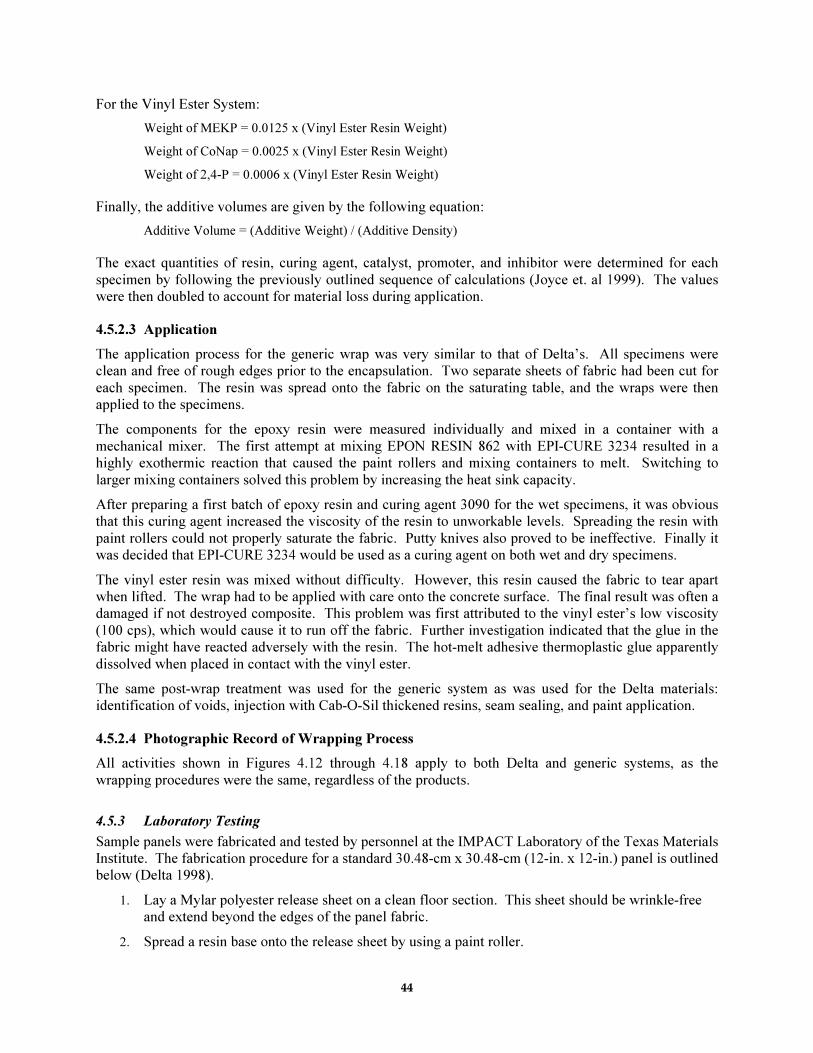
44
For the Vinyl Ester System:
Weight of MEKP = 0.0125 x (Vinyl Ester Resin Weight)
Weight of CoNap = 0.0025 x (Vinyl Ester Resin Weight)
Weight of 2,4-P = 0.0006 x (Vinyl Ester Resin Weight)
Finally, the additive volumes are given by the following equation:
Additive Volume = (Additive Weight) / (Additive Density)
The exact quantities of resin, curing agent, catalyst, promoter, and inhibitor were determined for each
specimen by following the previously outlined sequence of calculations (Joyce et. al 1999). The values
were then doubled to account for material loss during application.
4.5.2.3 Application
The application process for the generic wrap was very similar to that of Delta’s. All specimens were
clean and free of rough edges prior to the encapsulation. Two separate sheets of fabric had been cut for
each specimen. The resin was spread onto the fabric on the saturating table, and the wraps were then
applied to the specimens.
The components for the epoxy resin were measured individually and mixed in a container with a
mechanical mixer. The first attempt at mixing EPON RESIN 862 with EPI-CURE 3234 resulted in a
highly exothermic reaction that caused the paint rollers and mixing containers to melt. Switching to
larger mixing containers solved this problem by increasing the heat sink capacity.
After preparing a first batch of epoxy resin and curing agent 3090 for the wet specimens, it was obvious
that this curing agent increased the viscosity of the resin to unworkable levels. Spreading the resin with
paint rollers could not properly saturate the fabric. Putty knives also proved to be ineffective. Finally it
was decided that EPI-CURE 3234 would be used as a curing agent on both wet and dry specimens.
The vinyl ester resin was mixed without difficulty. However, this resin caused the fabric to tear apart
when lifted. The wrap had to be applied with care onto the concrete surface. The final result was often a
damaged if not destroyed composite. This problem was first attributed to the vinyl ester’s low viscosity
(100 cps), which would cause it to run off the fabric. Further investigation indicated that the glue in the
fabric might have reacted adversely with the resin. The hot-melt adhesive thermoplastic glue apparently
dissolved when placed in contact with the vinyl ester.
The same post-wrap treatment was used for the generic system as was used for the Delta materials:
identification of voids, injection with Cab-O-Sil thickened resins, seam sealing, and paint application.
4.5.2.4 Photographic Record of Wrapping Process
All activities shown in Figures 4.12 through 4.18 apply to both Delta and generic systems, as the
wrapping procedures were the same, regardless of the products.
4.5.3 Laboratory Testing
Sample panels were fabricated and tested by personnel at the IMPACT Laboratory of the Texas Materials
Institute. The fabrication procedure for a standard 30.48-cm x 30.48-cm (12-in. x 12-in.) panel is outlined
below (Delta 1998).
1. Lay a Mylar polyester release sheet on a clean floor section. This sheet should be wrinkle-free
and extend beyond the edges of the panel fabric.
2. Spread a resin base onto the release sheet by using a paint roller.
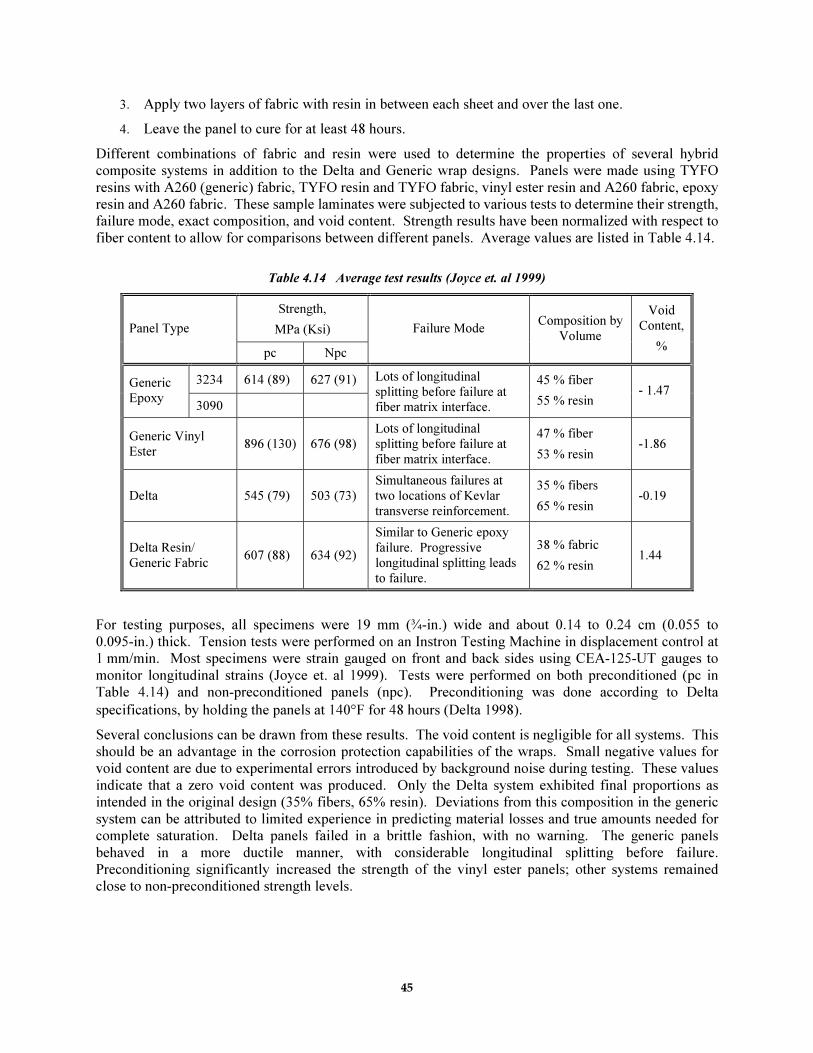
45
3. Apply two layers of fabric with resin in between each sheet and over the last one.
4. Leave the panel to cure for at least 48 hours.
Different combinations of fabric and resin were used to determine the properties of several hybrid
composite systems in addition to the Delta and Generic wrap designs. Panels were made using TYFO
resins with A260 (generic) fabric, TYFO resin and TYFO fabric, vinyl ester resin and A260 fabric, epoxy
resin and A260 fabric. These sample laminates were subjected to various tests to determine their strength,
failure mode, exact composition, and void content. Strength results have been normalized with respect to
fiber content to allow for comparisons between different panels. Average values are listed in Table 4.14.
Table 4.14 Average test results (Joyce et. al 1999)
Strength,
MPa (Ksi) Panel Type
pc Npc
Failure Mode Composition by
Volume
Void
Content,
%
3234 614 (89) 627 (91) Generic
Epoxy 3090
Lots of longitudinal
splitting before failure at fiber matrix interface.
45 % fiber
55 % resin - 1.47
Generic Vinyl
Ester 896 (130) 676 (98)
Lots of longitudinal
splitting before failure at
fiber matrix interface.
47 % fiber
53 % resin -1.86
Delta 545 (79) 503 (73)
Simultaneous failures at
two locations of Kevlar
transverse reinforcement.
35 % fibers
65 % resin -0.19
Delta Resin/
Generic Fabric 607 (88) 634 (92)
Similar to Generic epoxy
failure. Progressive
longitudinal splitting leads
to failure.
38 % fabric
62 % resin 1.44
For testing purposes, all specimens were 19 mm (¾-in.) wide and about 0.14 to 0.24 cm (0.055 to
0.095-in.) thick. Tension tests were performed on an Instron Testing Machine in displacement control at
1 mm/min. Most specimens were strain gauged on front and back sides using CEA-125-UT gauges to
monitor longitudinal strains (Joyce et. al 1999). Tests were performed on both preconditioned (pc in
Table 4.14) and non-preconditioned panels (npc). Preconditioning was done according to Delta
specifications, by holding the panels at 140°F for 48 hours (Delta 1998).
Several conclusions can be drawn from these results. The void content is negligible for all systems. This
should be an advantage in the corrosion protection capabilities of the wraps. Small negative values for
void content are due to experimental errors introduced by background noise during testing. These values
indicate that a zero void content was produced. Only the Delta system exhibited final proportions as
intended in the original design (35% fibers, 65% resin). Deviations from this composition in the generic
system can be attributed to limited experience in predicting material losses and true amounts needed for
complete saturation. Delta panels failed in a brittle fashion, with no warning. The generic panels
behaved in a more ductile manner, with considerable longitudinal splitting before failure.
Preconditioning significantly increased the strength of the vinyl ester panels; other systems remained
close to non-preconditioned strength levels.
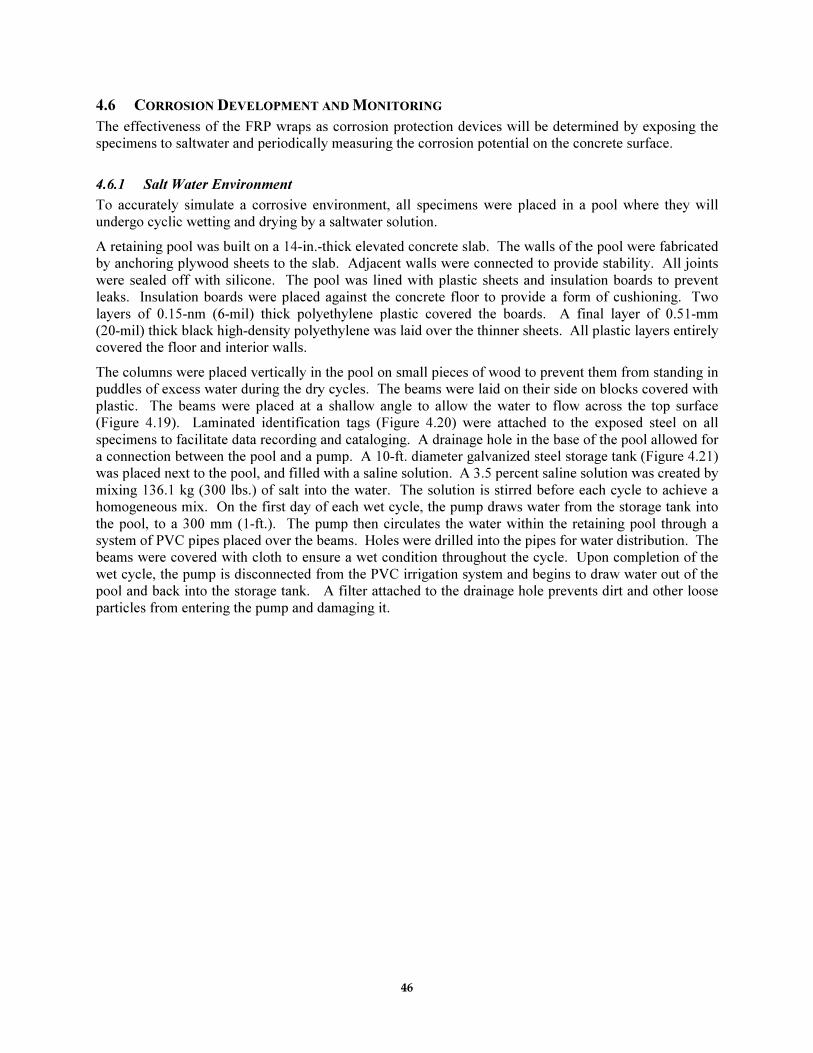
46
4.6 CORROSION DEVELOPMENT AND MONITORING
The effectiveness of the FRP wraps as corrosion protection devices will be determined by exposing the
specimens to saltwater and periodically measuring the corrosion potential on the concrete surface.
4.6.1 Salt Water Environment
To accurately simulate a corrosive environment, all specimens were placed in a pool where they will
undergo cyclic wetting and drying by a saltwater solution.
A retaining pool was built on a 14-in.-thick elevated concrete slab. The walls of the pool were fabricated
by anchoring plywood sheets to the slab. Adjacent walls were connected to provide stability. All joints
were sealed off with silicone. The pool was lined with plastic sheets and insulation boards to prevent
leaks. Insulation boards were placed against the concrete floor to provide a form of cushioning. Two
layers of 0.15-nm (6-mil) thick polyethylene plastic covered the boards. A final layer of 0.51-mm
(20-mil) thick black high-density polyethylene was laid over the thinner sheets. All plastic layers entirely
covered the floor and interior walls.
The columns were placed vertically in the pool on small pieces of wood to prevent them from standing in
puddles of excess water during the dry cycles. The beams were laid on their side on blocks covered with
plastic. The beams were placed at a shallow angle to allow the water to flow across the top surface
(Figure 4.19). Laminated identification tags (Figure 4.20) were attached to the exposed steel on all
specimens to facilitate data recording and cataloging. A drainage hole in the base of the pool allowed for
a connection between the pool and a pump. A 10-ft. diameter galvanized steel storage tank (Figure 4.21)
was placed next to the pool, and filled with a saline solution. A 3.5 percent saline solution was created by
mixing 136.1 kg (300 lbs.) of salt into the water. The solution is stirred before each cycle to achieve a
homogeneous mix. On the first day of each wet cycle, the pump draws water from the storage tank into
the pool, to a 300 mm (1-ft.). The pump then circulates the water within the retaining pool through a
system of PVC pipes placed over the beams. Holes were drilled into the pipes for water distribution. The
beams were covered with cloth to ensure a wet condition throughout the cycle. Upon completion of the
wet cycle, the pump is disconnected from the PVC irrigation system and begins to draw water out of the
pool and back into the storage tank. A filter attached to the drainage hole prevents dirt and other loose
particles from entering the pump and damaging it.
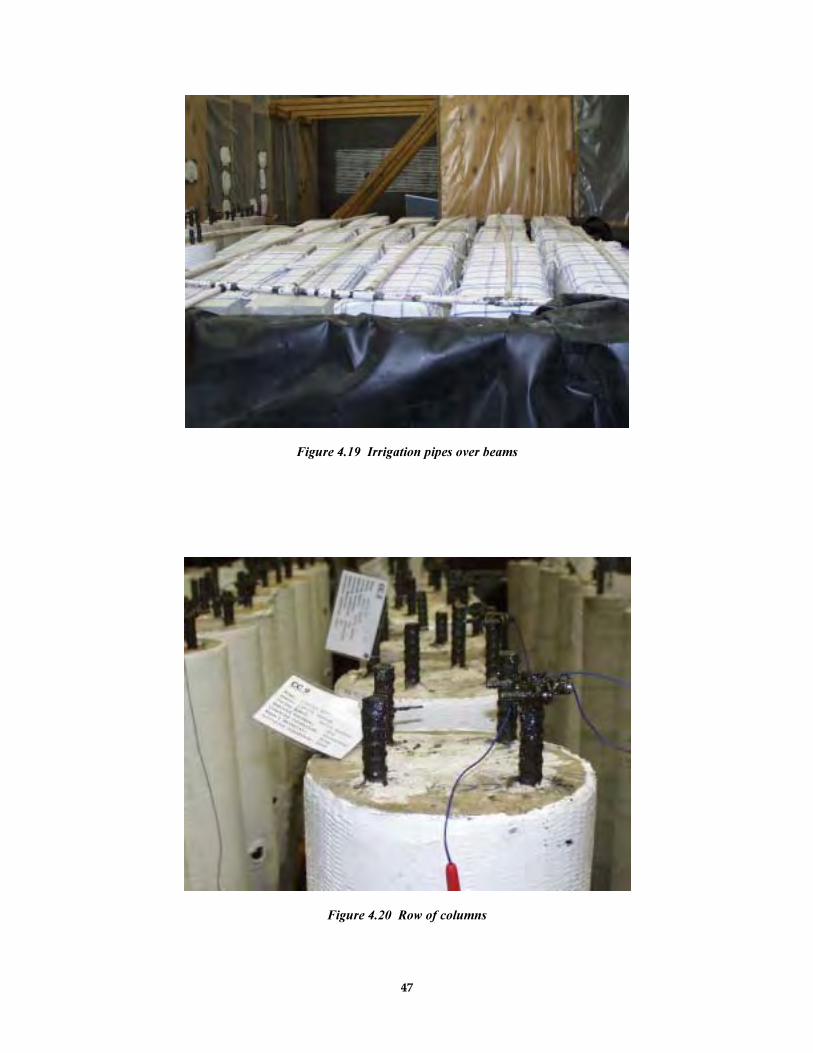
47
Figure 4.19 Irrigation pipes over beams
Figure 4.20 Row of columns
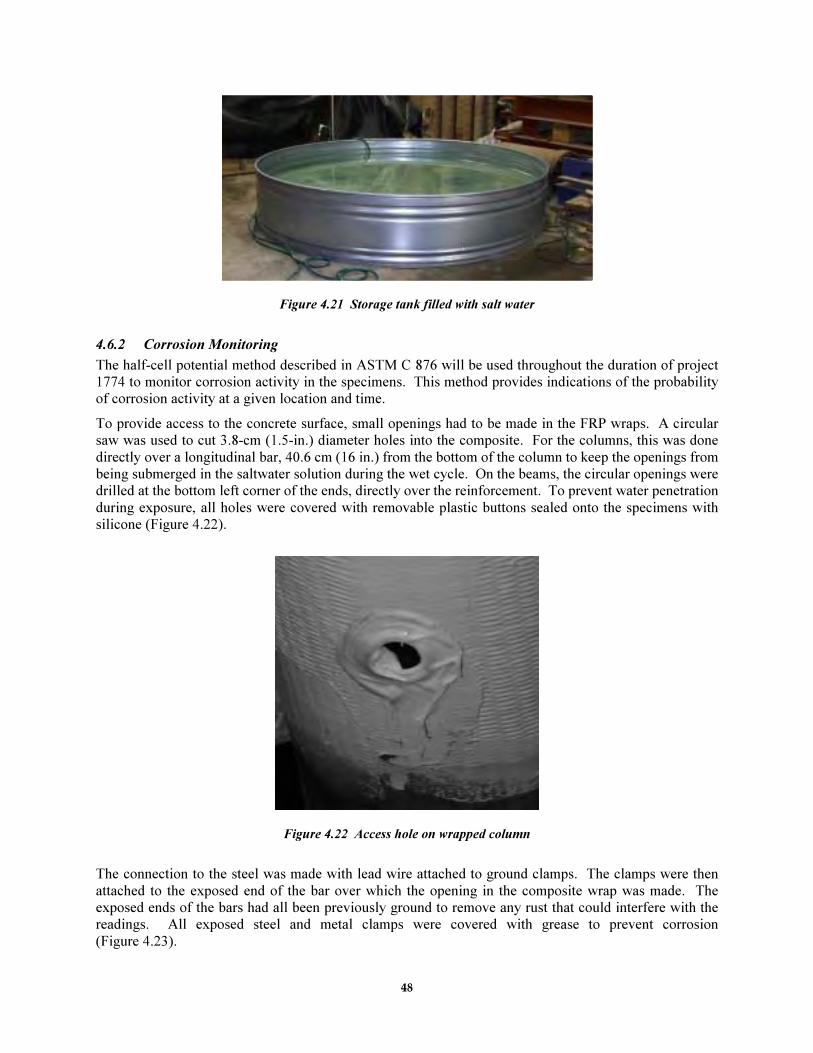
48
Figure 4.21 Storage tank filled with salt water
4.6.2 Corrosion Monitoring
The half-cell potential method described in ASTM C 876 will be used throughout the duration of project
1774 to monitor corrosion activity in the specimens. This method provides indications of the probability
of corrosion activity at a given location and time.
To provide access to the concrete surface, small openings had to be made in the FRP wraps. A circular
saw was used to cut 3.8-cm (1.5-in.) diameter holes into the composite. For the columns, this was done
directly over a longitudinal bar, 40.6 cm (16 in.) from the bottom of the column to keep the openings from
being submerged in the saltwater solution during the wet cycle. On the beams, the circular openings were
drilled at the bottom left corner of the ends, directly over the reinforcement. To prevent water penetration
during exposure, all holes were covered with removable plastic buttons sealed onto the specimens with
silicone (Figure 4.22).
Figure 4.22 Access hole on wrapped column
The connection to the steel was made with lead wire attached to ground clamps. The clamps were then
attached to the exposed end of the bar over which the opening in the composite wrap was made. The
exposed ends of the bars had all been previously ground to remove any rust that could interfere with the
readings. All exposed steel and metal clamps were covered with grease to prevent corrosion
(Figure 4.23).
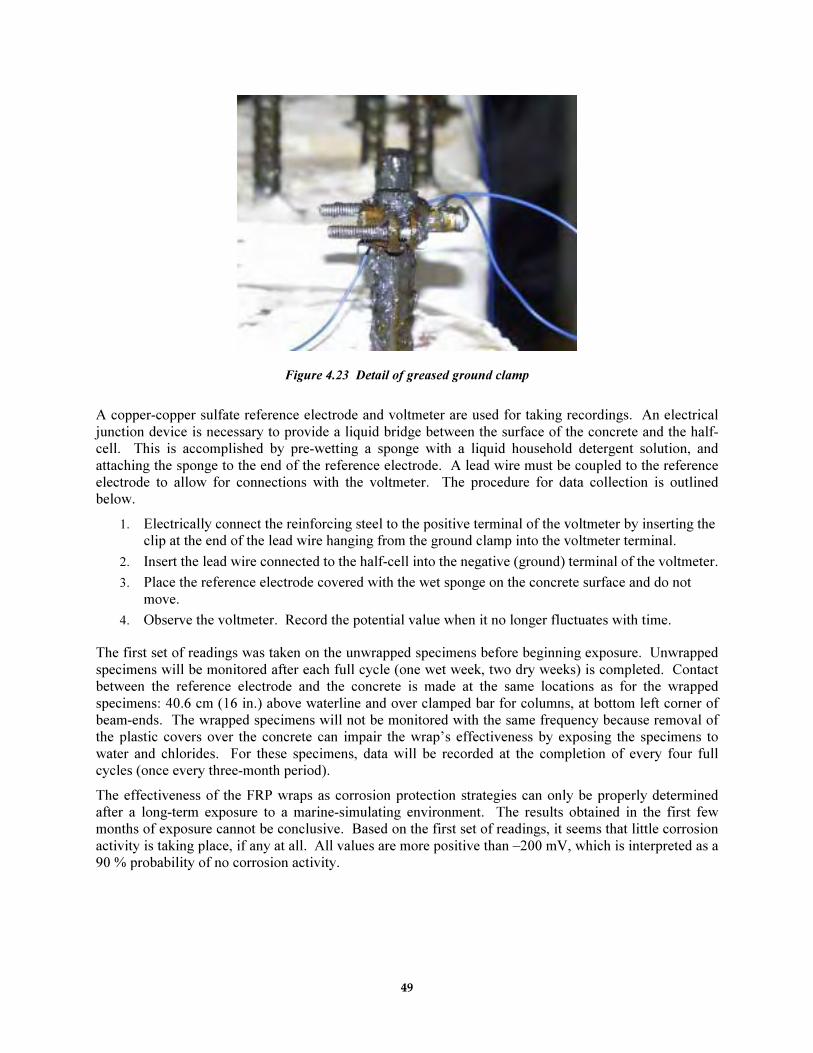
49
Figure 4.23 Detail of greased ground clamp
A copper-copper sulfate reference electrode and voltmeter are used for taking recordings. An electrical
junction device is necessary to provide a liquid bridge between the surface of the concrete and the half-
cell. This is accomplished by pre-wetting a sponge with a liquid household detergent solution, and
attaching the sponge to the end of the reference electrode. A lead wire must be coupled to the reference
electrode to allow for connections with the voltmeter. The procedure for data collection is outlined
below.
1. Electrically connect the reinforcing steel to the positive terminal of the voltmeter by inserting the
clip at the end of the lead wire hanging from the ground clamp into the voltmeter terminal.
2. Insert the lead wire connected to the half-cell into the negative (ground) terminal of the voltmeter.
3. Place the reference electrode covered with the wet sponge on the concrete surface and do not
move.
4. Observe the voltmeter. Record the potential value when it no longer fluctuates with time.
The first set of readings was taken on the unwrapped specimens before beginning exposure. Unwrapped
specimens will be monitored after each full cycle (one wet week, two dry weeks) is completed. Contact
between the reference electrode and the concrete is made at the same locations as for the wrapped
specimens: 40.6 cm (16 in.) above waterline and over clamped bar for columns, at bottom left corner of
beam-ends. The wrapped specimens will not be monitored with the same frequency because removal of
the plastic covers over the concrete can impair the wrap’s effectiveness by exposing the specimens to
water and chlorides. For these specimens, data will be recorded at the completion of every four full
cycles (once every three-month period).
The effectiveness of the FRP wraps as corrosion protection strategies can only be properly determined
after a long-term exposure to a marine-simulating environment. The results obtained in the first few
months of exposure cannot be conclusive. Based on the first set of readings, it seems that little corrosion
activity is taking place, if any at all. All values are more positive than –200 mV, which is interpreted as a
90 % probability of no corrosion activity.

50
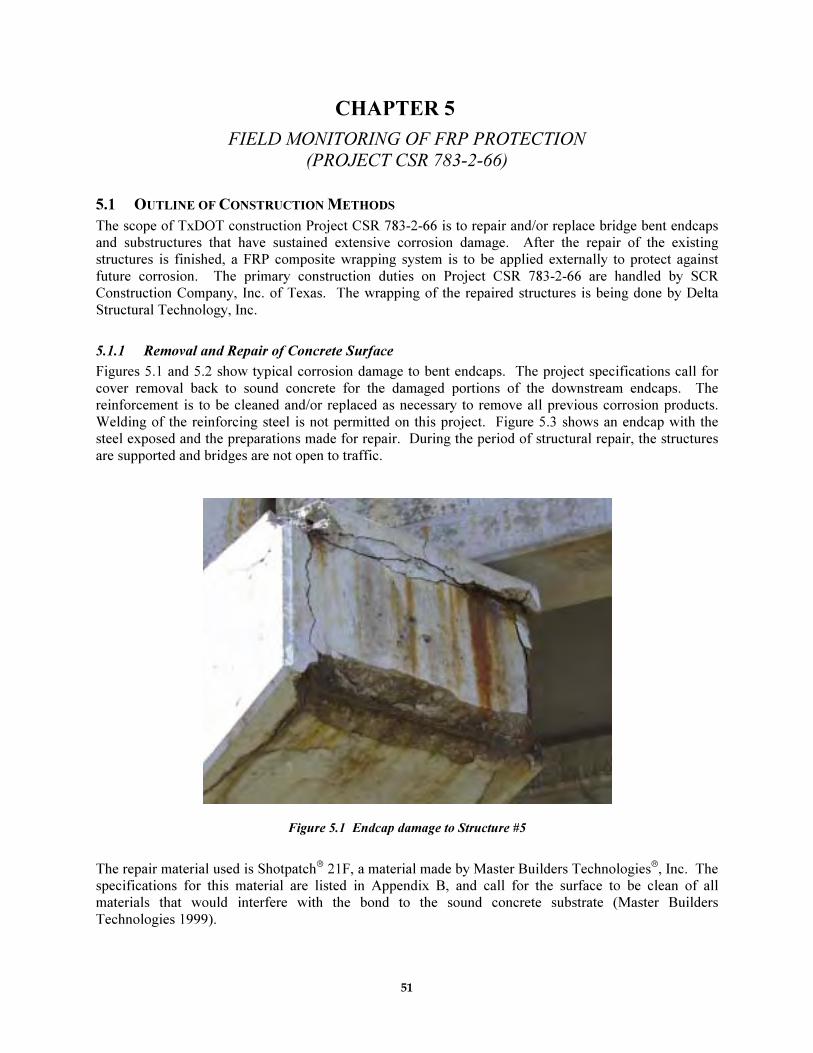
51
CHAPTER 5
FIELD MONITORING OF FRP PROTECTION
(PROJECT CSR 783-2-66)
5.1 OUTLINE OF CONSTRUCTION METHODS
The scope of TxDOT construction Project CSR 783-2-66 is to repair and/or replace bridge bent endcaps
and substructures that have sustained extensive corrosion damage. After the repair of the existing
structures is finished, a FRP composite wrapping system is to be applied externally to protect against
future corrosion. The primary construction duties on Project CSR 783-2-66 are handled by SCR
Construction Company, Inc. of Texas. The wrapping of the repaired structures is being done by Delta
Structural Technology, Inc.
5.1.1 Removal and Repair of Concrete Surface
Figures 5.1 and 5.2 show typical corrosion damage to bent endcaps. The project specifications call for
cover removal back to sound concrete for the damaged portions of the downstream endcaps. The
reinforcement is to be cleaned and/or replaced as necessary to remove all previous corrosion products.
Welding of the reinforcing steel is not permitted on this project. Figure 5.3 shows an endcap with the
steel exposed and the preparations made for repair. During the period of structural repair, the structures
are supported and bridges are not open to traffic.
Figure 5.1 Endcap damage to Structure #5
The repair material used is Shotpatch 21F, a material made by Master Builders Technologies
, Inc. The
specifications for this material are listed in Appendix B, and call for the surface to be clean of all
materials that would interfere with the bond to the sound concrete substrate (Master Builders
Technologies 1999).
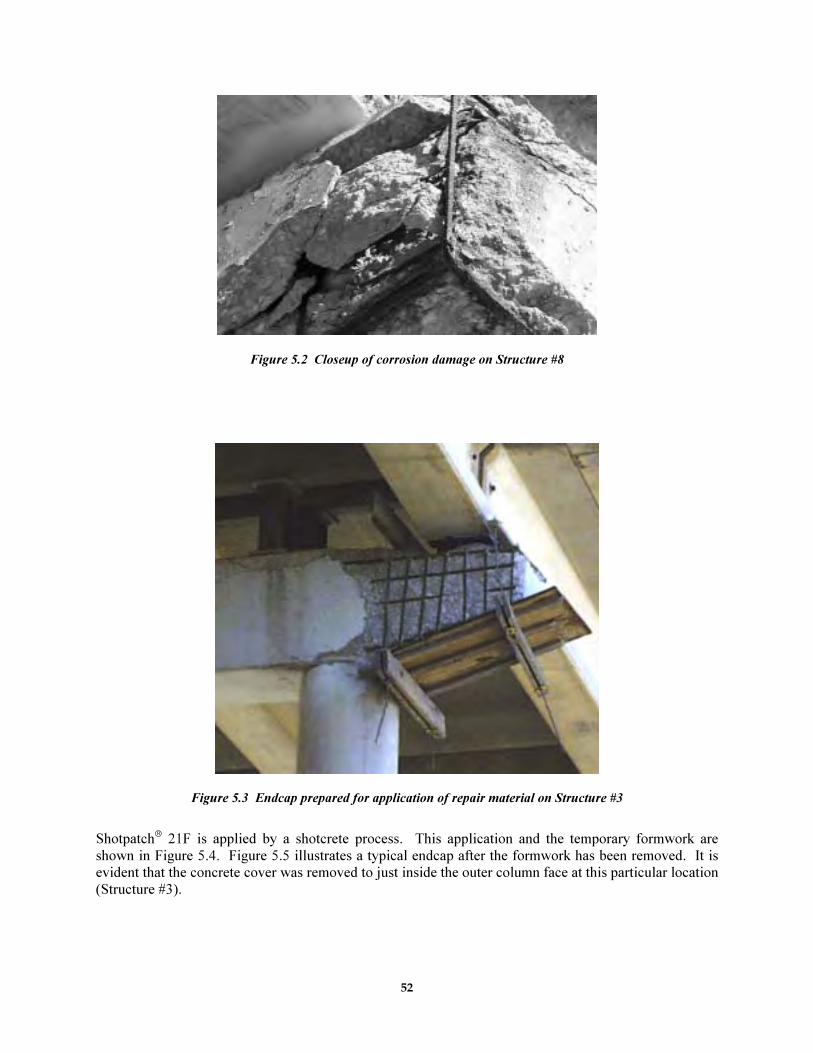
52
Figure 5.2 Closeup of corrosion damage on Structure #8
Figure 5.3 Endcap prepared for application of repair material on Structure #3
Shotpatch 21F is applied by a shotcrete process. This application and the temporary formwork are
shown in Figure 5.4. Figure 5.5 illustrates a typical endcap after the formwork has been removed. It is
evident that the concrete cover was removed to just inside the outer column face at this particular location
(Structure #3).
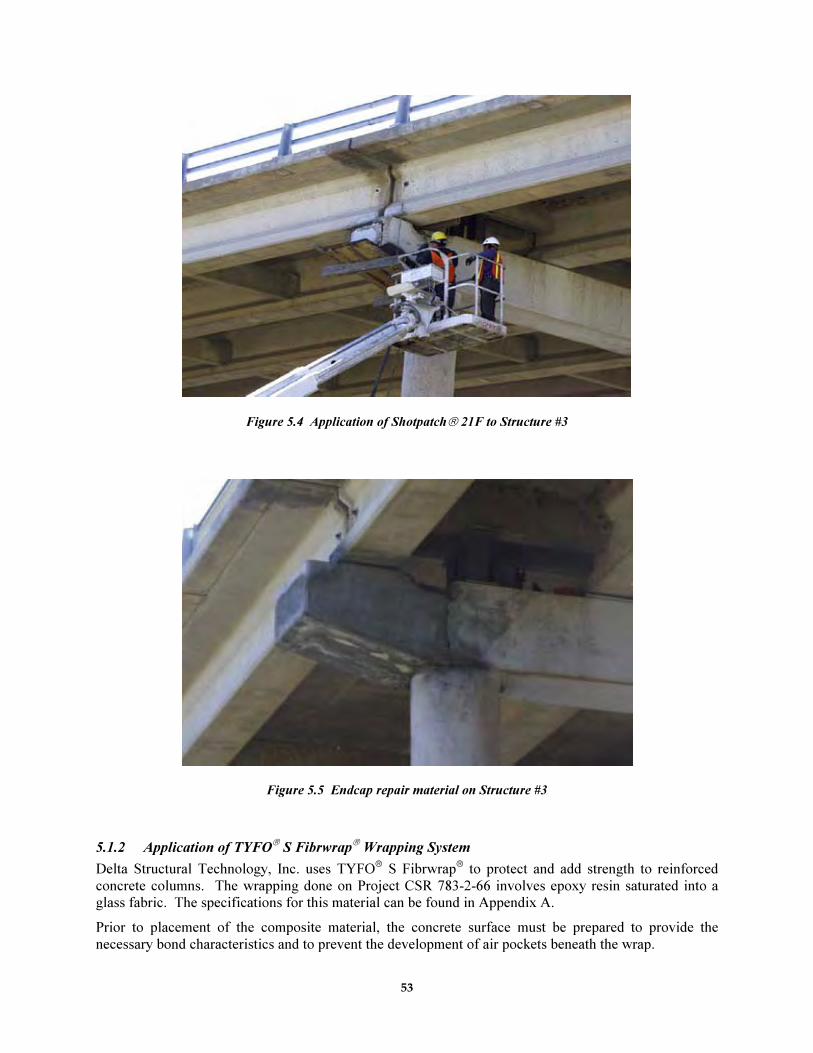
53
Figure 5.4 Application of Shotpatch 21F to Structure #3
Figure 5.5 Endcap repair material on Structure #3
5.1.2 Application of TYFO
S Fibrwrap
Wrapping System
Delta Structural Technology, Inc. uses TYFO S Fibrwrap
to protect and add strength to reinforced
concrete columns. The wrapping done on Project CSR 783-2-66 involves epoxy resin saturated into a
glass fabric. The specifications for this material can be found in Appendix A.
Prior to placement of the composite material, the concrete surface must be prepared to provide the
necessary bond characteristics and to prevent the development of air pockets beneath the wrap.
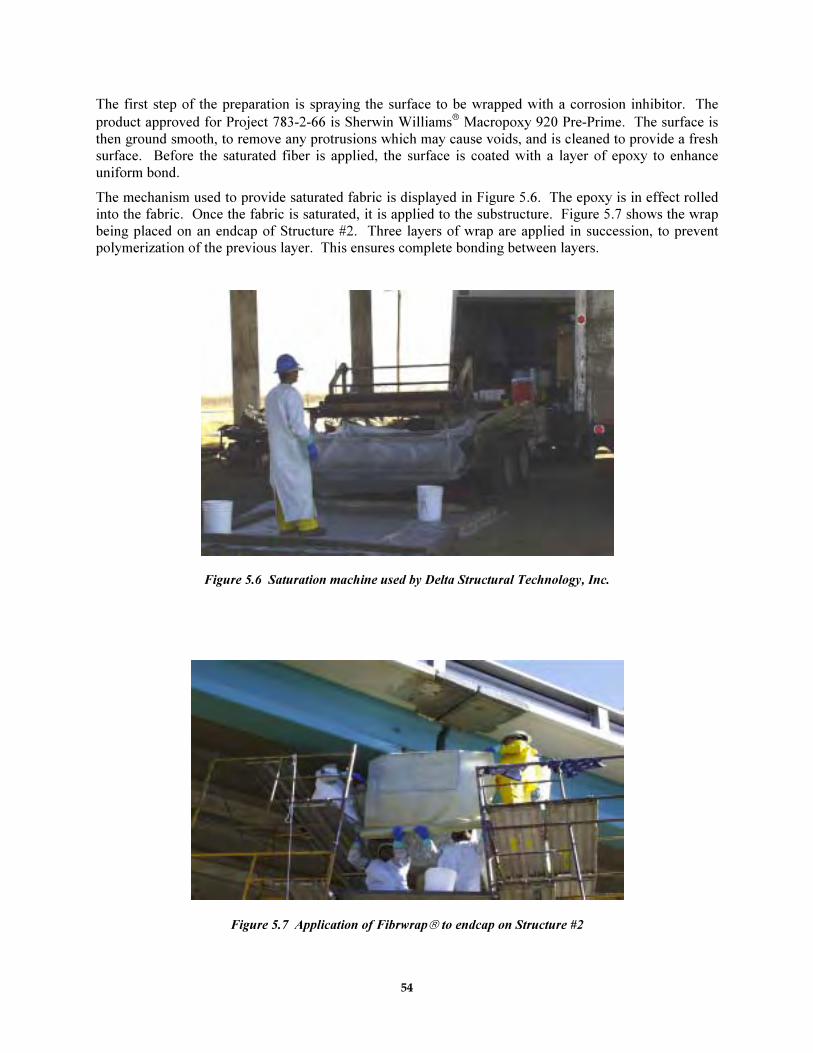
54
The first step of the preparation is spraying the surface to be wrapped with a corrosion inhibitor. The
product approved for Project 783-2-66 is Sherwin Williams Macropoxy 920 Pre-Prime. The surface is
then ground smooth, to remove any protrusions which may cause voids, and is cleaned to provide a fresh
surface. Before the saturated fiber is applied, the surface is coated with a layer of epoxy to enhance
uniform bond.
The mechanism used to provide saturated fabric is displayed in Figure 5.6. The epoxy is in effect rolled
into the fabric. Once the fabric is saturated, it is applied to the substructure. Figure 5.7 shows the wrap
being placed on an endcap of Structure #2. Three layers of wrap are applied in succession, to prevent
polymerization of the previous layer. This ensures complete bonding between layers.
Figure 5.6 Saturation machine used by Delta Structural Technology, Inc.
Figure 5.7 Application of Fibrwrap to endcap on Structure #2
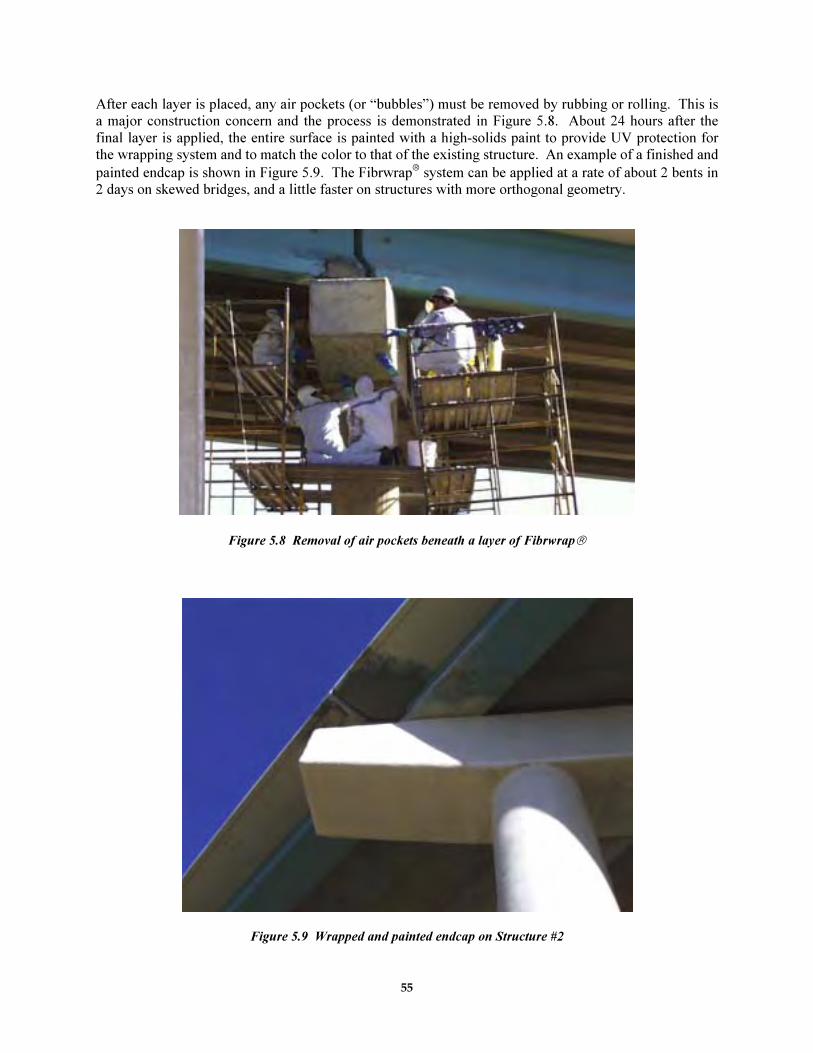
55
After each layer is placed, any air pockets (or “bubbles”) must be removed by rubbing or rolling. This is
a major construction concern and the process is demonstrated in Figure 5.8. About 24 hours after the
final layer is applied, the entire surface is painted with a high-solids paint to provide UV protection for
the wrapping system and to match the color to that of the existing structure. An example of a finished and
painted endcap is shown in Figure 5.9. The Fibrwrap system can be applied at a rate of about 2 bents in
2 days on skewed bridges, and a little faster on structures with more orthogonal geometry.
Figure 5.8 Removal of air pockets beneath a layer of Fibrwrap
Figure 5.9 Wrapped and painted endcap on Structure #2
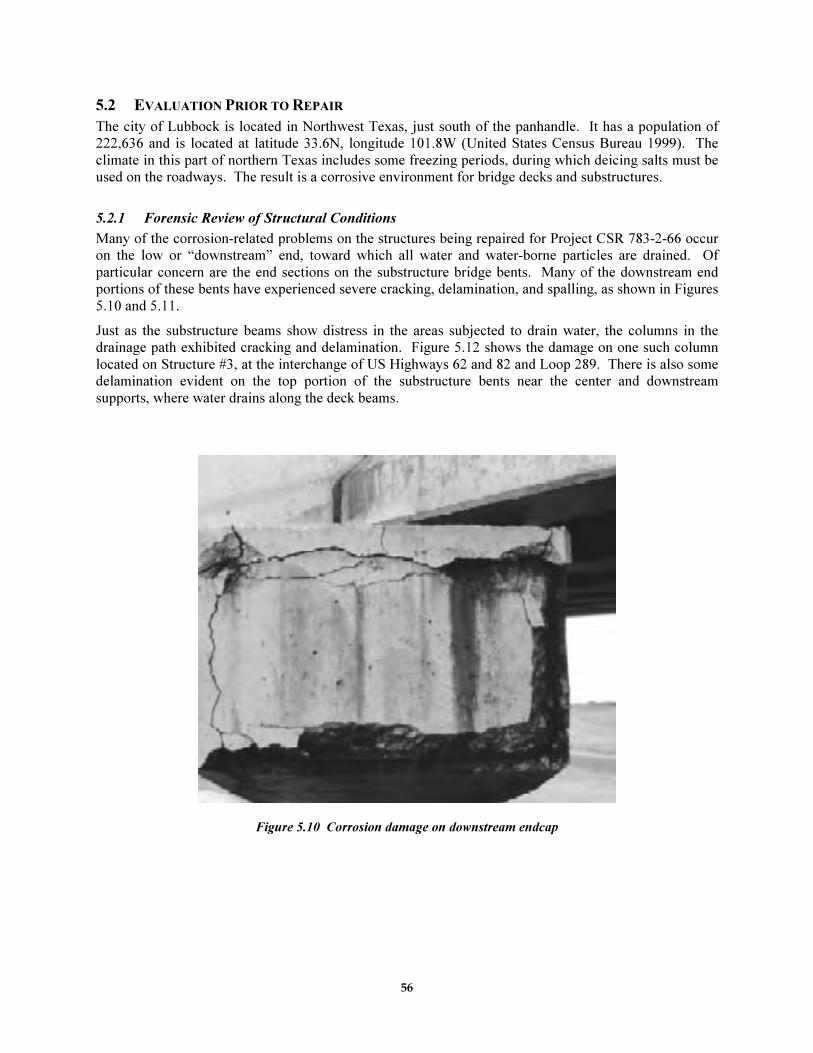
56
5.2 EVALUATION PRIOR TO REPAIR
The city of Lubbock is located in Northwest Texas, just south of the panhandle. It has a population of
222,636 and is located at latitude 33.6N, longitude 101.8W (United States Census Bureau 1999). The
climate in this part of northern Texas includes some freezing periods, during which deicing salts must be
used on the roadways. The result is a corrosive environment for bridge decks and substructures.
5.2.1 Forensic Review of Structural Conditions
Many of the corrosion-related problems on the structures being repaired for Project CSR 783-2-66 occur
on the low or “downstream” end, toward which all water and water-borne particles are drained. Of
particular concern are the end sections on the substructure bridge bents. Many of the downstream end
portions of these bents have experienced severe cracking, delamination, and spalling, as shown in Figures
5.10 and 5.11.
Just as the substructure beams show distress in the areas subjected to drain water, the columns in the
drainage path exhibited cracking and delamination. Figure 5.12 shows the damage on one such column
located on Structure #3, at the interchange of US Highways 62 and 82 and Loop 289. There is also some
delamination evident on the top portion of the substructure bents near the center and downstream
supports, where water drains along the deck beams.
Figure 5.10 Corrosion damage on downstream endcap

57
Figure 5.11 Closeup of area with severe concrete spalling
Figure 5.12 Concrete spalling on a bridge support column
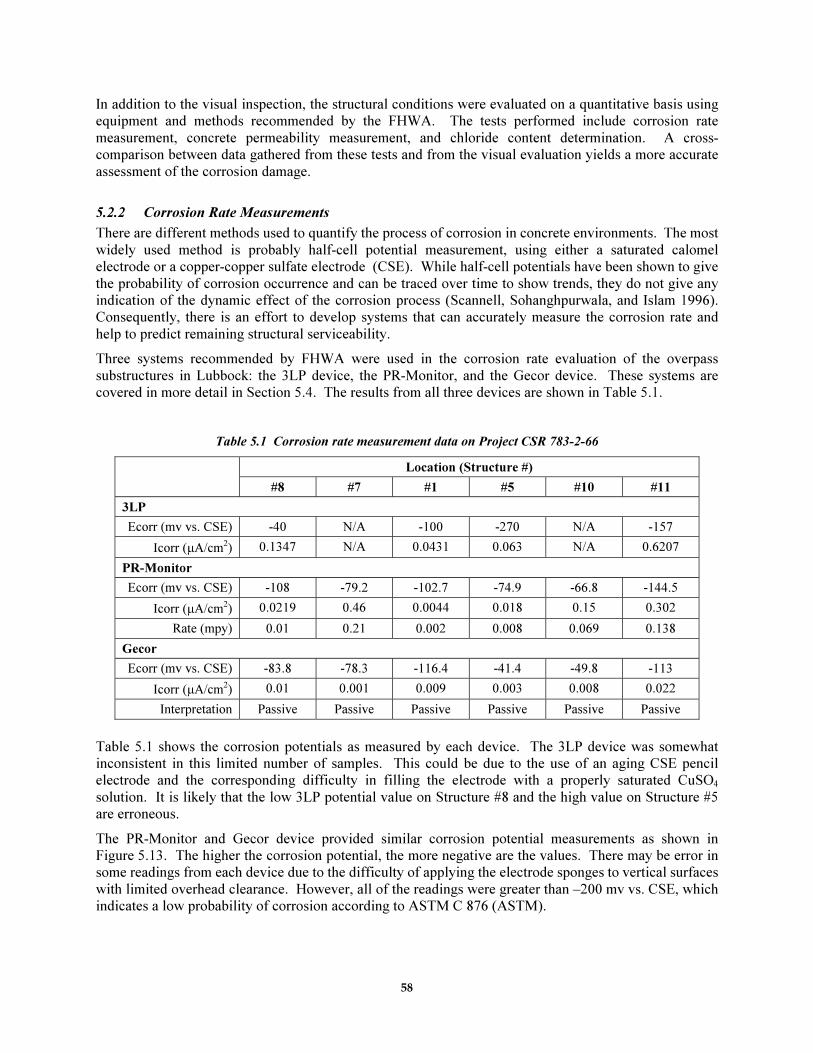
58
In addition to the visual inspection, the structural conditions were evaluated on a quantitative basis using
equipment and methods recommended by the FHWA. The tests performed include corrosion rate
measurement, concrete permeability measurement, and chloride content determination. A cross-
comparison between data gathered from these tests and from the visual evaluation yields a more accurate
assessment of the corrosion damage.
5.2.2 Corrosion Rate Measurements
There are different methods used to quantify the process of corrosion in concrete environments. The most
widely used method is probably half-cell potential measurement, using either a saturated calomel
electrode or a copper-copper sulfate electrode (CSE). While half-cell potentials have been shown to give
the probability of corrosion occurrence and can be traced over time to show trends, they do not give any
indication of the dynamic effect of the corrosion process (Scannell, Sohanghpurwala, and Islam 1996).
Consequently, there is an effort to develop systems that can accurately measure the corrosion rate and
help to predict remaining structural serviceability.
Three systems recommended by FHWA were used in the corrosion rate evaluation of the overpass
substructures in Lubbock: the 3LP device, the PR-Monitor, and the Gecor device. These systems are
covered in more detail in Section 5.4. The results from all three devices are shown in Table 5.1.
Table 5.1 Corrosion rate measurement data on Project CSR 783-2-66
Location (Structure #)
#8 #7 #1 #5 #10 #11
3LP
Ecorr (mv vs. CSE) -40 N/A -100 -270 N/A -157
Icorr (µA/cm2) 0.1347 N/A 0.0431 0.063 N/A 0.6207
PR-Monitor
Ecorr (mv vs. CSE) -108 -79.2 -102.7 -74.9 -66.8 -144.5
Icorr (µA/cm2) 0.0219 0.46 0.0044 0.018 0.15 0.302
Rate (mpy) 0.01 0.21 0.002 0.008 0.069 0.138
Gecor
Ecorr (mv vs. CSE) -83.8 -78.3 -116.4 -41.4 -49.8 -113
Icorr (µA/cm2) 0.01 0.001 0.009 0.003 0.008 0.022
Interpretation Passive Passive Passive Passive Passive Passive
Table 5.1 shows the corrosion potentials as measured by each device. The 3LP device was somewhat
inconsistent in this limited number of samples. This could be due to the use of an aging CSE pencil
electrode and the corresponding difficulty in filling the electrode with a properly saturated CuSO4
solution. It is likely that the low 3LP potential value on Structure #8 and the high value on Structure #5
are erroneous.
The PR-Monitor and Gecor device provided similar corrosion potential measurements as shown in
Figure 5.13. The higher the corrosion potential, the more negative are the values. There may be error in
some readings from each device due to the difficulty of applying the electrode sponges to vertical surfaces
with limited overhead clearance. However, all of the readings were greater than –200 mv vs. CSE, which
indicates a low probability of corrosion according to ASTM C 876 (ASTM).
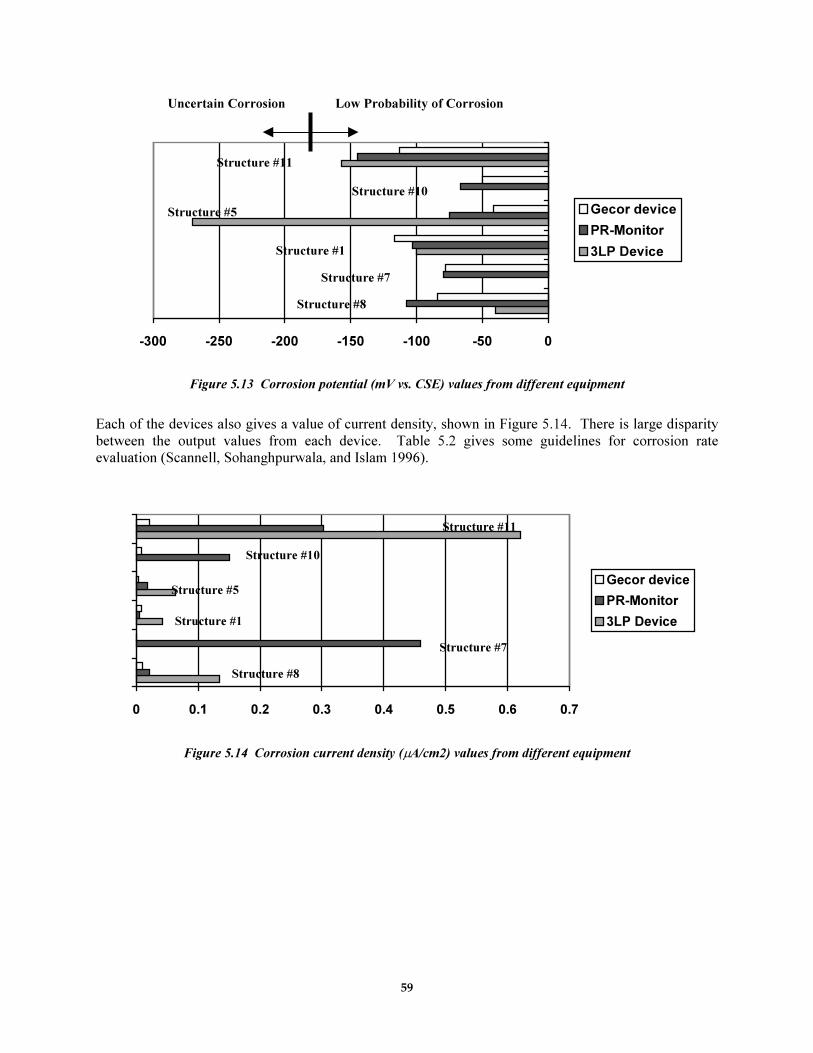
59
Uncertain Corrosion Low Probability of Corrosion
-300 -250 -200 -150 -100 -50 0
Gecor device
PR-Monitor
3LP Device
Structure #11
Structure #10
Structure #5
Structure #1
Structure #7
Structure #8
Figure 5.13 Corrosion potential (mV vs. CSE) values from different equipment
Each of the devices also gives a value of current density, shown in Figure 5.14. There is large disparity
between the output values from each device. Table 5.2 gives some guidelines for corrosion rate
evaluation (Scannell, Sohanghpurwala, and Islam 1996).
0 0.1 0.2 0.3 0.4 0.5 0.6 0.7
Gecor device
PR-Monitor
3LP Device
Structure #11
Structure #10
Structure #5
Structure #1
Structure #7
Structure #8
Figure 5.14 Corrosion current density (µA/cm2) values from different equipment
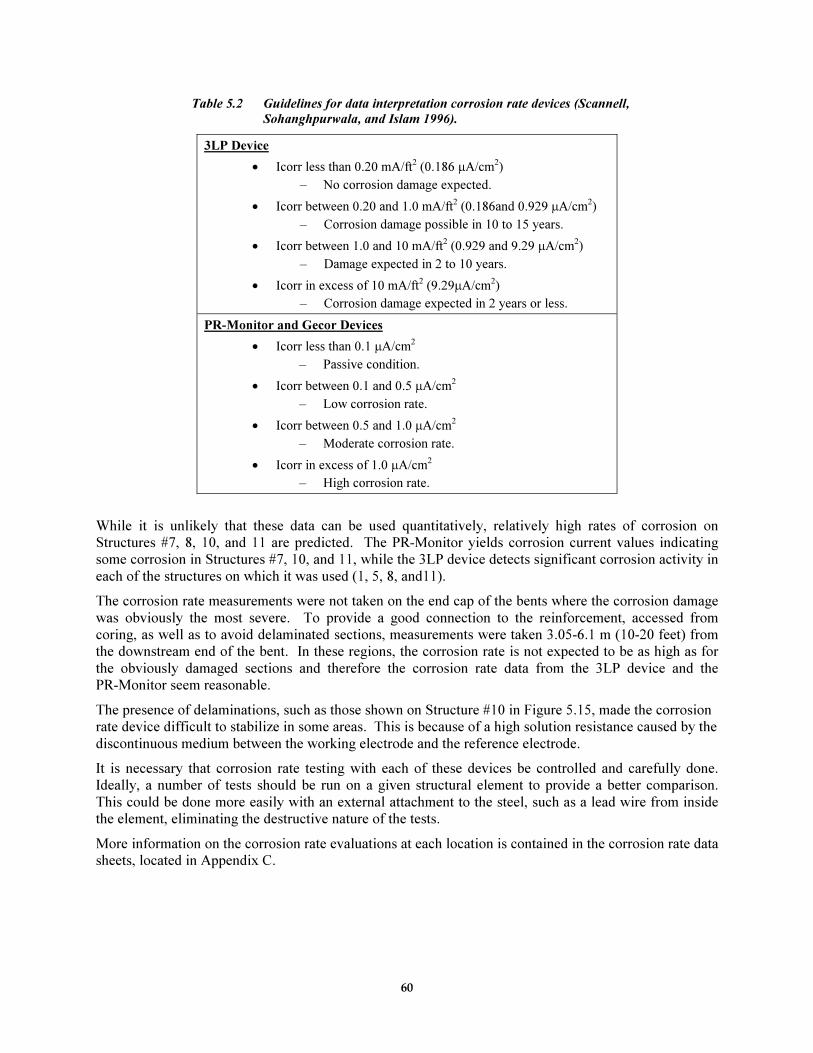
60
Table 5.2 Guidelines for data interpretation corrosion rate devices (Scannell,
Sohanghpurwala, and Islam 1996).
3LP Device
• Icorr less than 0.20 mA/ft2 (0.186 µA/cm2)
– No corrosion damage expected.
• Icorr between 0.20 and 1.0 mA/ft2 (0.186and 0.929 µA/cm2)
– Corrosion damage possible in 10 to 15 years.
• Icorr between 1.0 and 10 mA/ft2 (0.929 and 9.29 µA/cm2)
– Damage expected in 2 to 10 years.
• Icorr in excess of 10 mA/ft2 (9.29µA/cm2)
– Corrosion damage expected in 2 years or less.
PR-Monitor and Gecor Devices
• Icorr less than 0.1 µA/cm2
– Passive condition.
• Icorr between 0.1 and 0.5 µA/cm2
– Low corrosion rate.
• Icorr between 0.5 and 1.0 µA/cm2
– Moderate corrosion rate.
• Icorr in excess of 1.0 µA/cm2
– High corrosion rate.
While it is unlikely that these data can be used quantitatively, relatively high rates of corrosion on
Structures #7, 8, 10, and 11 are predicted. The PR-Monitor yields corrosion current values indicating
some corrosion in Structures #7, 10, and 11, while the 3LP device detects significant corrosion activity in
each of the structures on which it was used (1, 5, 8, and11).
The corrosion rate measurements were not taken on the end cap of the bents where the corrosion damage
was obviously the most severe. To provide a good connection to the reinforcement, accessed from
coring, as well as to avoid delaminated sections, measurements were taken 3.05-6.1 m (10-20 feet) from
the downstream end of the bent. In these regions, the corrosion rate is not expected to be as high as for
the obviously damaged sections and therefore the corrosion rate data from the 3LP device and the
PR-Monitor seem reasonable.
The presence of delaminations, such as those shown on Structure #10 in Figure 5.15, made the corrosion
rate device difficult to stabilize in some areas. This is because of a high solution resistance caused by the
discontinuous medium between the working electrode and the reference electrode.
It is necessary that corrosion rate testing with each of these devices be controlled and carefully done.
Ideally, a number of tests should be run on a given structural element to provide a better comparison.
This could be done more easily with an external attachment to the steel, such as a lead wire from inside
the element, eliminating the destructive nature of the tests.
More information on the corrosion rate evaluations at each location is contained in the corrosion rate data
sheets, located in Appendix C.
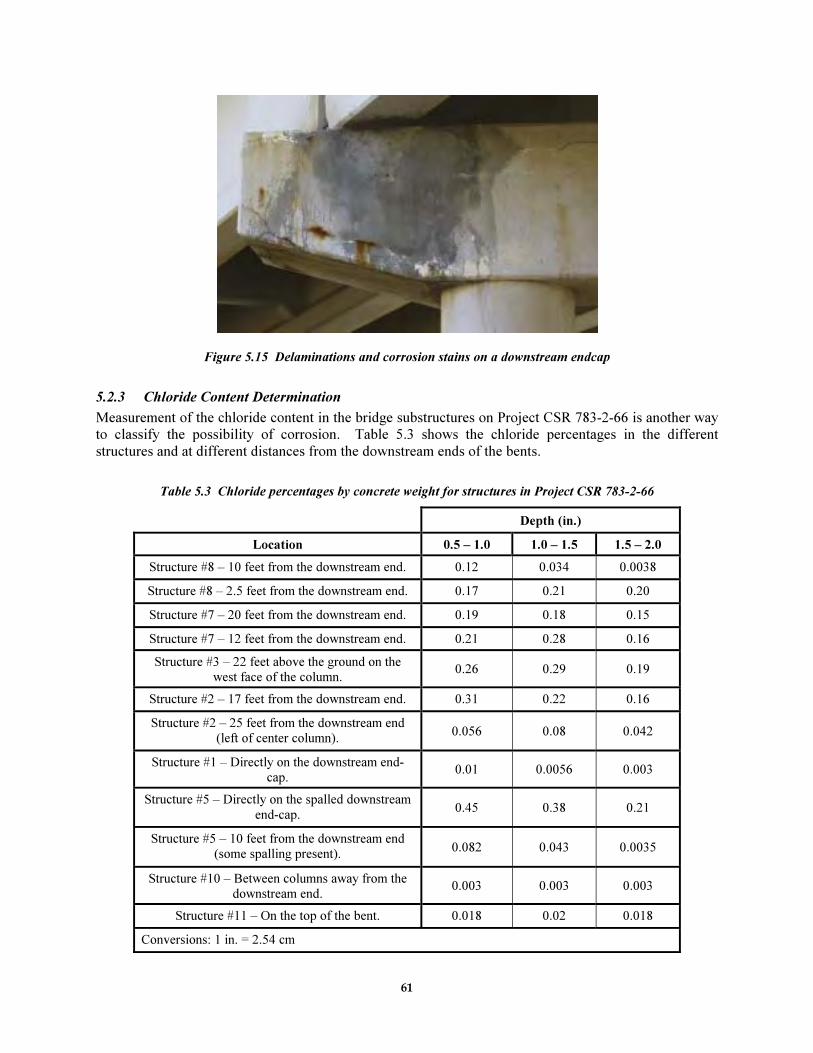
61
Figure 5.15 Delaminations and corrosion stains on a downstream endcap
5.2.3 Chloride Content Determination
Measurement of the chloride content in the bridge substructures on Project CSR 783-2-66 is another way
to classify the possibility of corrosion. Table 5.3 shows the chloride percentages in the different
structures and at different distances from the downstream ends of the bents.
Table 5.3 Chloride percentages by concrete weight for structures in Project CSR 783-2-66
Depth (in.)
Location 0.5 – 1.0 1.0 – 1.5 1.5 – 2.0
Structure #8 – 10 feet from the downstream end. 0.12 0.034 0.0038
Structure #8 – 2.5 feet from the downstream end. 0.17 0.21 0.20
Structure #7 – 20 feet from the downstream end. 0.19 0.18 0.15
Structure #7 – 12 feet from the downstream end. 0.21 0.28 0.16
Structure #3 – 22 feet above the ground on the west face of the column.
0.26 0.29 0.19
Structure #2 – 17 feet from the downstream end. 0.31 0.22 0.16
Structure #2 – 25 feet from the downstream end (left of center column).
0.056 0.08 0.042
Structure #1 – Directly on the downstream end-cap.
0.01 0.0056 0.003
Structure #5 – Directly on the spalled downstream
end-cap. 0.45 0.38 0.21
Structure #5 – 10 feet from the downstream end (some spalling present).
0.082 0.043 0.0035
Structure #10 – Between columns away from the downstream end.
0.003 0.003 0.003
Structure #11 – On the top of the bent. 0.018 0.02 0.018
Conversions: 1 in. = 2.54 cm
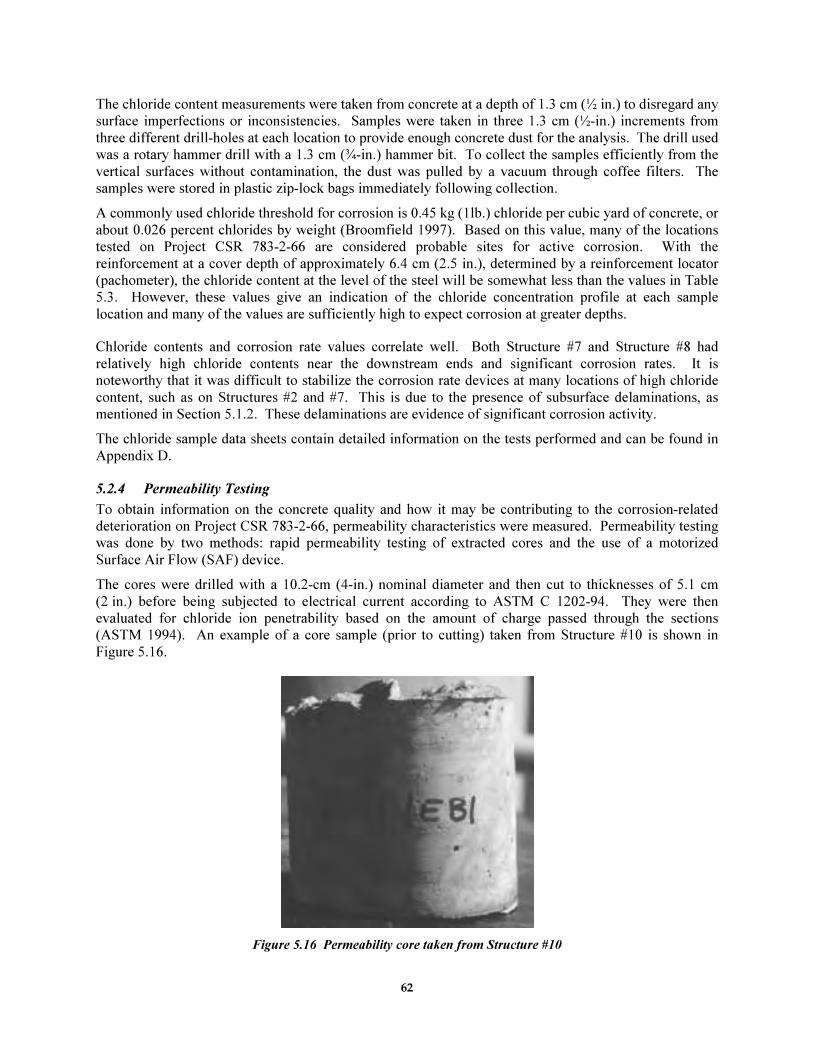
62
The chloride content measurements were taken from concrete at a depth of 1.3 cm (½ in.) to disregard any
surface imperfections or inconsistencies. Samples were taken in three 1.3 cm (½-in.) increments from
three different drill-holes at each location to provide enough concrete dust for the analysis. The drill used
was a rotary hammer drill with a 1.3 cm (¾-in.) hammer bit. To collect the samples efficiently from the
vertical surfaces without contamination, the dust was pulled by a vacuum through coffee filters. The
samples were stored in plastic zip-lock bags immediately following collection.
A commonly used chloride threshold for corrosion is 0.45 kg (1lb.) chloride per cubic yard of concrete, or
about 0.026 percent chlorides by weight (Broomfield 1997). Based on this value, many of the locations
tested on Project CSR 783-2-66 are considered probable sites for active corrosion. With the
reinforcement at a cover depth of approximately 6.4 cm (2.5 in.), determined by a reinforcement locator
(pachometer), the chloride content at the level of the steel will be somewhat less than the values in Table
5.3. However, these values give an indication of the chloride concentration profile at each sample
location and many of the values are sufficiently high to expect corrosion at greater depths.
Chloride contents and corrosion rate values correlate well. Both Structure #7 and Structure #8 had
relatively high chloride contents near the downstream ends and significant corrosion rates. It is
noteworthy that it was difficult to stabilize the corrosion rate devices at many locations of high chloride
content, such as on Structures #2 and #7. This is due to the presence of subsurface delaminations, as
mentioned in Section 5.1.2. These delaminations are evidence of significant corrosion activity.
The chloride sample data sheets contain detailed information on the tests performed and can be found in
Appendix D.
5.2.4 Permeability Testing
To obtain information on the concrete quality and how it may be contributing to the corrosion-related
deterioration on Project CSR 783-2-66, permeability characteristics were measured. Permeability testing
was done by two methods: rapid permeability testing of extracted cores and the use of a motorized
Surface Air Flow (SAF) device.
The cores were drilled with a 10.2-cm (4-in.) nominal diameter and then cut to thicknesses of 5.1 cm
(2 in.) before being subjected to electrical current according to ASTM C 1202-94. They were then
evaluated for chloride ion penetrability based on the amount of charge passed through the sections
(ASTM 1994). An example of a core sample (prior to cutting) taken from Structure #10 is shown in
Figure 5.16.
Figure 5.16 Permeability core taken from Structure #10

63
The SAF device is based on the flow of air at the concrete surface under a vacuum. The device was
developed under SHRP project C-101, and measures the permeability of the concrete to a depth of about
½ in. (Scannell, Sohanghpurwala, and Islam 1996).
The permeability data collected in Lubbock are displayed in Table 5.4. The permeability sample data
sheets can be found in Appendix E. The chloride ion penetrability is evaluated based on Table 1 in
ASTM C 1202-94 (ASTM 1994). The SAF results are assessed with respect to the guidelines contained
in Table 5.5. Data taken in the field is shown in Appendix E.
Table 5.4 Concrete permeability measurements for Project CSR 783-2-66
SAF Device ASTM Permeability
Location Flow Rate
(ml/minute)
Relative
Permeability
Charge (C) Ion Penetrability
Structure #2 97.45 High 10930 High
Structure #7 71.08 High 1630 Low
Structure #8 18.51 High 5600 High
Structure #10 43.5 High 5200 High
Table 5.5 Relative permeabilities for the SAF device (Scannell, Sohanghpurwala, and Islam 1996)
Air Flow Rate (ml/minute) Relative Permeability Category
Less than 5 Low
Between 5 and 16 Moderate
Greater than 16 High
There seems to be only limited correlation between the ASTM method and the SAF device. They both
indicate high permeability of Structure #2 (where severe delamination prevented corrosion rate
determinations), and both suggest high permeabilities for the majority of the samples. However, beyond
this the numbers are inconsistent. The values from the SAF device in particular seem very high.
The flow rate values generated by the SAF device may be affected by an inability of the particular
equipment used to generate the proper vacuum. The calibration protocol calls for a stable value between
750 and 765 mm Hg (Scannell, Sohanghpurwala, and Islam 1996). The device used could not develop a
vacuum above about 685 mm Hg.
Based on visible corrosion damage, the concrete permeability for the structures in Project 783-2-66 is
expected to be rather high. More samples are necessary for an accurate determination of the permeability,
but the destructive nature of coring on the bridge substructure limited the testing to four locations.
However, this restricted sampling does suggest that the concrete is relatively permeable, and it is evident
that chlorides have penetrated the cover and reached the reinforcing steel.
5.3 CONTINUED PERFORMANCE MONITORING IN SERVICE
While the tests described in Section 5.2 are important to establish the structural conditions prior to repair,
they give no information on what will happen after the structures are repaired and wrapped. Evaluation of
conditions in service is necessary to gauge the effectiveness of the wrapping system as a corrosion
prevention technique.
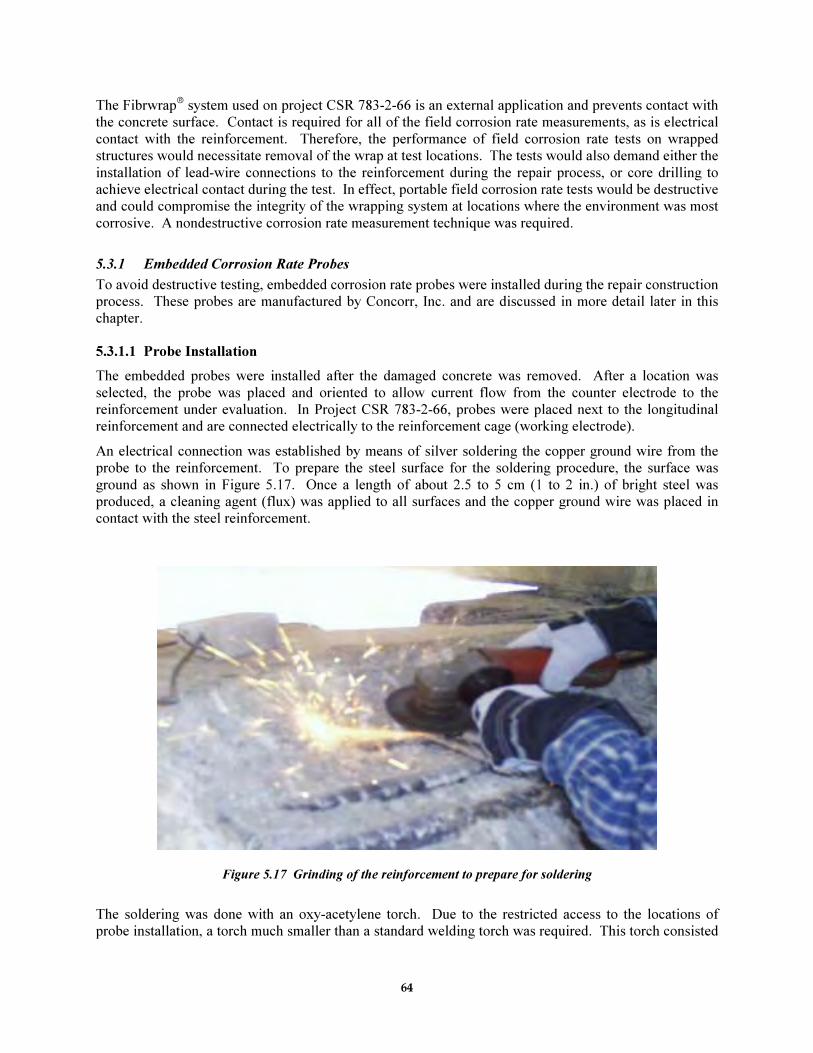
64
The Fibrwrap system used on project CSR 783-2-66 is an external application and prevents contact with
the concrete surface. Contact is required for all of the field corrosion rate measurements, as is electrical
contact with the reinforcement. Therefore, the performance of field corrosion rate tests on wrapped
structures would necessitate removal of the wrap at test locations. The tests would also demand either the
installation of lead-wire connections to the reinforcement during the repair process, or core drilling to
achieve electrical contact during the test. In effect, portable field corrosion rate tests would be destructive
and could compromise the integrity of the wrapping system at locations where the environment was most
corrosive. A nondestructive corrosion rate measurement technique was required.
5.3.1 Embedded Corrosion Rate Probes
To avoid destructive testing, embedded corrosion rate probes were installed during the repair construction
process. These probes are manufactured by Concorr, Inc. and are discussed in more detail later in this
chapter.
5.3.1.1 Probe Installation
The embedded probes were installed after the damaged concrete was removed. After a location was
selected, the probe was placed and oriented to allow current flow from the counter electrode to the
reinforcement under evaluation. In Project CSR 783-2-66, probes were placed next to the longitudinal
reinforcement and are connected electrically to the reinforcement cage (working electrode).
An electrical connection was established by means of silver soldering the copper ground wire from the
probe to the reinforcement. To prepare the steel surface for the soldering procedure, the surface was
ground as shown in Figure 5.17. Once a length of about 2.5 to 5 cm (1 to 2 in.) of bright steel was
produced, a cleaning agent (flux) was applied to all surfaces and the copper ground wire was placed in
contact with the steel reinforcement.
Figure 5.17 Grinding of the reinforcement to prepare for soldering
The soldering was done with an oxy-acetylene torch. Due to the restricted access to the locations of
probe installation, a torch much smaller than a standard welding torch was required. This torch consisted
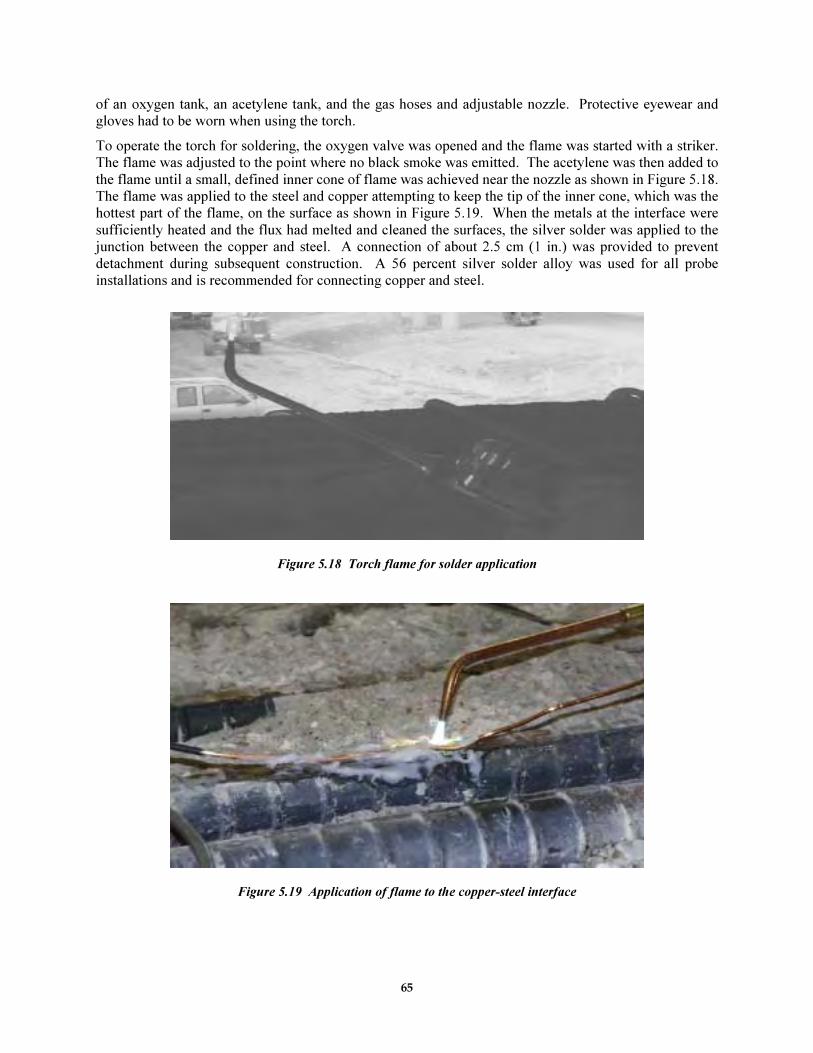
65
of an oxygen tank, an acetylene tank, and the gas hoses and adjustable nozzle. Protective eyewear and
gloves had to be worn when using the torch.
To operate the torch for soldering, the oxygen valve was opened and the flame was started with a striker.
The flame was adjusted to the point where no black smoke was emitted. The acetylene was then added to
the flame until a small, defined inner cone of flame was achieved near the nozzle as shown in Figure 5.18.
The flame was applied to the steel and copper attempting to keep the tip of the inner cone, which was the
hottest part of the flame, on the surface as shown in Figure 5.19. When the metals at the interface were
sufficiently heated and the flux had melted and cleaned the surfaces, the silver solder was applied to the
junction between the copper and steel. A connection of about 2.5 cm (1 in.) was provided to prevent
detachment during subsequent construction. A 56 percent silver solder alloy was used for all probe
installations and is recommended for connecting copper and steel.
Figure 5.18 Torch flame for solder application
Figure 5.19 Application of flame to the copper-steel interface
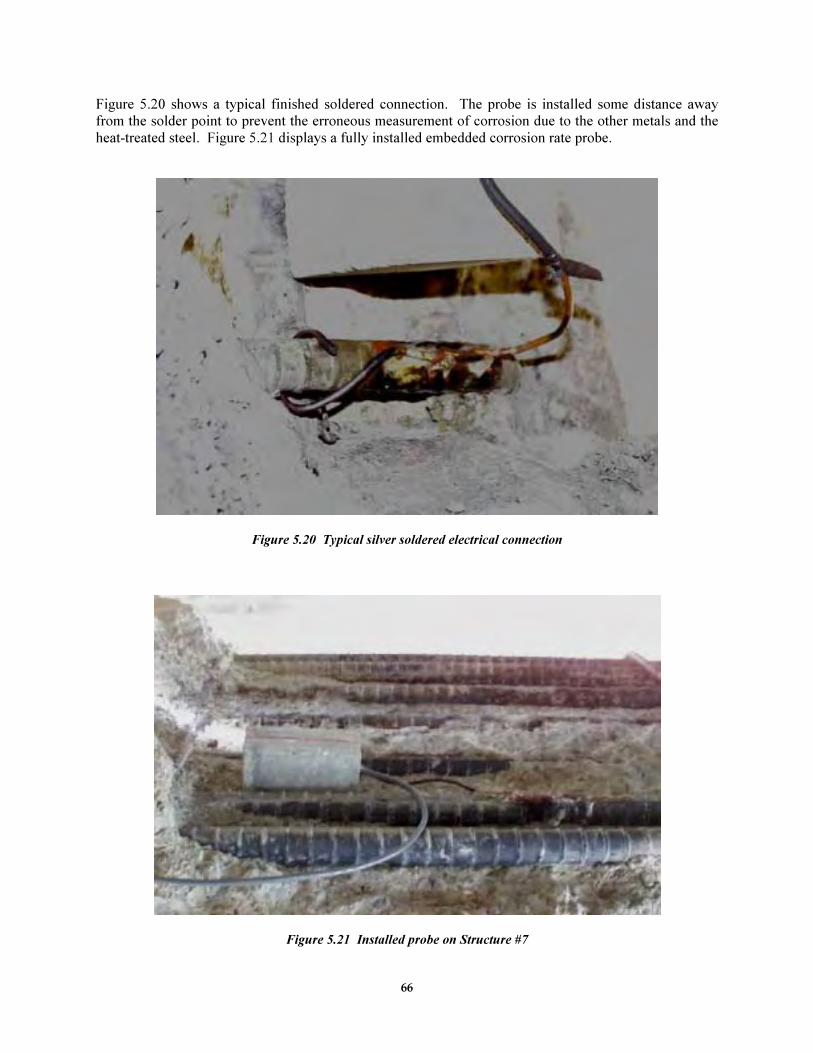
66
Figure 5.20 shows a typical finished soldered connection. The probe is installed some distance away
from the solder point to prevent the erroneous measurement of corrosion due to the other metals and the
heat-treated steel. Figure 5.21 displays a fully installed embedded corrosion rate probe.
Figure 5.20 Typical silver soldered electrical connection
Figure 5.21 Installed probe on Structure #7
67
Two probes were installed on Structure #7 and four were installed on Structure #8. The installations are
recorded in Table 5.6. In many cases the endcaps were already repaired at the time of installation, leaving
limited space for placement of the embedded probes. This was the case on Structure #8, where all probes
are installed in sections about 4 feet from the downstream end of the bent.
The designation (left or right) in Table 5.6 is from the perspective of someone looking at the structure
from the downstream end. For reference, the direction of traffic is from left to right.
Table 5.6 Probe installation locations
ID # Structure Beam Face Distance from End (ft.) Steel Area (in2)
7.1 #7 Left 7.5 44.30
7.2 #7 Right 4 44.30
8.1 #8 Left 4 44.30
8.2 #8 Right 4 44.30
8.3 #8 Left 4 44.30
8.4 #8 Right 4 22.15
The area of steel polarized by the probes is essentially the surface area of the portion of the bar receiving
current from the probe. This area is calculated as the circumference of each reinforcing bar facing the
counter electrode times the 12.7-cm (5-in.) length of the probe.
5.3.1.2 Corrosion Rate Measurements
The corrosion rate measurements from the embedded probes will be taken using the PR-Monitor
corrosion rate measurement device. The probes are equipped with a connection cable containing wires
from the reference, counter, and working electrodes. The cables are about 6.1 m (20 feet) in length and
reach out of the structure for the future monitoring. There is a six-pin connector at the end of the cable
for connection with the PR-Monitor.
To protect against vandalism and the elements, the end of the connection cable was placed in a junction
box in a location not accessible to the public. A lift will be required to take measurements with the
PR-Monitor, which weighs about 9 kg (20 lbs.).
5.3.2 Plan for Long-Term Evaluation
The measurements taken with the PR-Monitor give information on the corrosion potential and corrosion
rate. These values are only valid for the time of the test, requiring a repeated test schedule for accurate
long-term evaluation. In another application with these same embedded probes, readings were taken
every three months. Due to the long life expectancy of the repaired structures, however, a six-month test
interval would be more appropriate. The tests may be run by University of Texas representatives
continuing work on the project or by Texas Department of Transportation personnel. The automated
nature of the PR-Monitor device makes the test procedure straightforward and repeatable.
5.4 INTRODUCTION TO EQUIPMENT AND USAGE
An important part of the research conducted in the field on Project CSR 783-2-66 was the use and
evaluation of the performance monitoring equipment provided or recommended by the Texas Department
of Transportation. The purpose was to determine the usefulness and accuracy of the different types of
equipment and compare results with currently used methods. The equipment includes corrosion rate
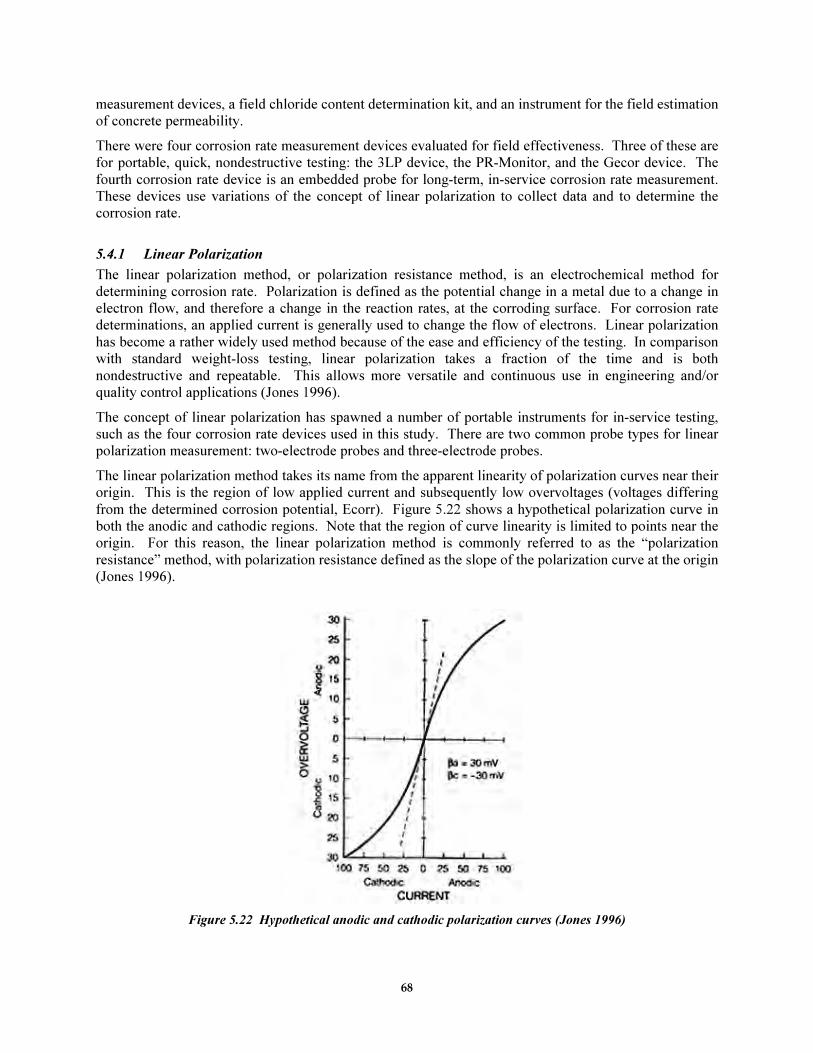
68
measurement devices, a field chloride content determination kit, and an instrument for the field estimation
of concrete permeability.
There were four corrosion rate measurement devices evaluated for field effectiveness. Three of these are
for portable, quick, nondestructive testing: the 3LP device, the PR-Monitor, and the Gecor device. The
fourth corrosion rate device is an embedded probe for long-term, in-service corrosion rate measurement.
These devices use variations of the concept of linear polarization to collect data and to determine the
corrosion rate.
5.4.1 Linear Polarization
The linear polarization method, or polarization resistance method, is an electrochemical method for
determining corrosion rate. Polarization is defined as the potential change in a metal due to a change in
electron flow, and therefore a change in the reaction rates, at the corroding surface. For corrosion rate
determinations, an applied current is generally used to change the flow of electrons. Linear polarization
has become a rather widely used method because of the ease and efficiency of the testing. In comparison
with standard weight-loss testing, linear polarization takes a fraction of the time and is both
nondestructive and repeatable. This allows more versatile and continuous use in engineering and/or
quality control applications (Jones 1996).
The concept of linear polarization has spawned a number of portable instruments for in-service testing,
such as the four corrosion rate devices used in this study. There are two common probe types for linear
polarization measurement: two-electrode probes and three-electrode probes.
The linear polarization method takes its name from the apparent linearity of polarization curves near their
origin. This is the region of low applied current and subsequently low overvoltages (voltages differing
from the determined corrosion potential, Ecorr). Figure 5.22 shows a hypothetical polarization curve in
both the anodic and cathodic regions. Note that the region of curve linearity is limited to points near the
origin. For this reason, the linear polarization method is commonly referred to as the “polarization
resistance” method, with polarization resistance defined as the slope of the polarization curve at the origin
(Jones 1996).
Figure 5.22 Hypothetical anodic and cathodic polarization curves (Jones 1996)
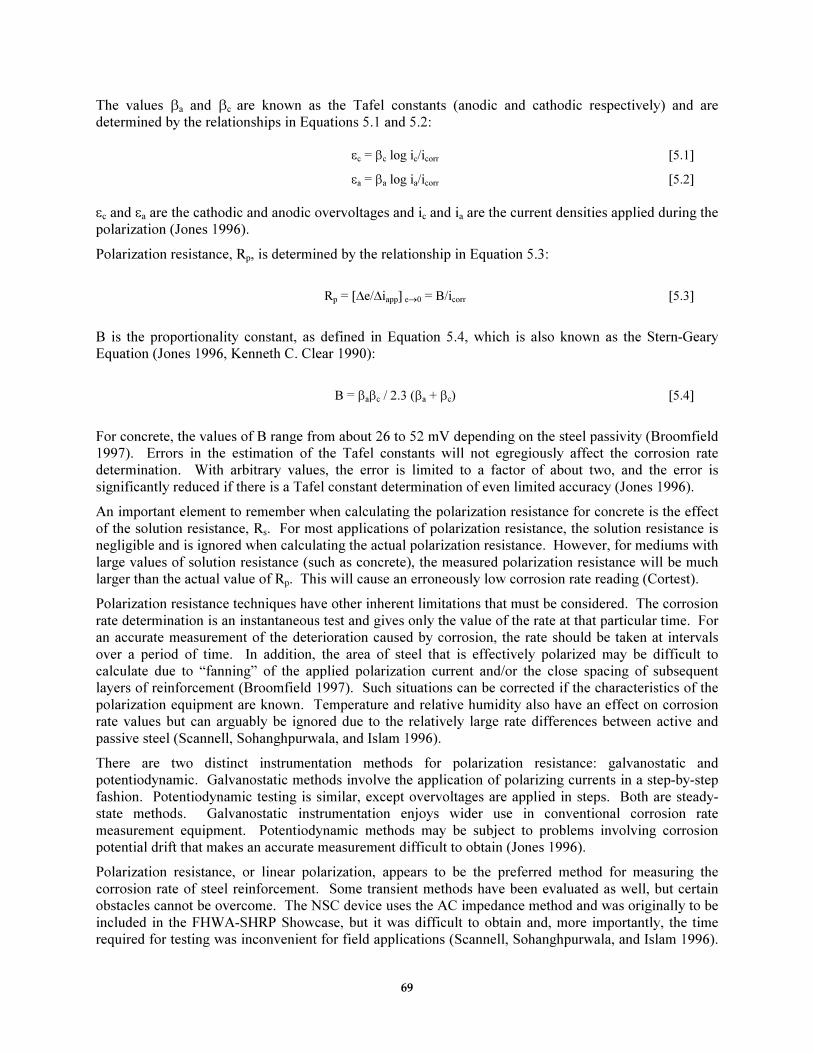
69
The values βa and βc are known as the Tafel constants (anodic and cathodic respectively) and are
determined by the relationships in Equations 5.1 and 5.2:
εc = βc log ic/icorr [5.1]
εa = βa log ia/icorr [5.2]
εc and εa are the cathodic and anodic overvoltages and ic and ia are the current densities applied during the
polarization (Jones 1996).
Polarization resistance, Rp, is determined by the relationship in Equation 5.3:
Rp = [∆e/∆iapp] e→0 = B/icorr [5.3]
B is the proportionality constant, as defined in Equation 5.4, which is also known as the Stern-Geary
Equation (Jones 1996, Kenneth C. Clear 1990):
B = βaβc / 2.3 (βa + βc) [5.4]
For concrete, the values of B range from about 26 to 52 mV depending on the steel passivity (Broomfield
1997). Errors in the estimation of the Tafel constants will not egregiously affect the corrosion rate
determination. With arbitrary values, the error is limited to a factor of about two, and the error is
significantly reduced if there is a Tafel constant determination of even limited accuracy (Jones 1996).
An important element to remember when calculating the polarization resistance for concrete is the effect
of the solution resistance, Rs. For most applications of polarization resistance, the solution resistance is
negligible and is ignored when calculating the actual polarization resistance. However, for mediums with
large values of solution resistance (such as concrete), the measured polarization resistance will be much
larger than the actual value of Rp. This will cause an erroneously low corrosion rate reading (Cortest).
Polarization resistance techniques have other inherent limitations that must be considered. The corrosion
rate determination is an instantaneous test and gives only the value of the rate at that particular time. For
an accurate measurement of the deterioration caused by corrosion, the rate should be taken at intervals
over a period of time. In addition, the area of steel that is effectively polarized may be difficult to
calculate due to “fanning” of the applied polarization current and/or the close spacing of subsequent
layers of reinforcement (Broomfield 1997). Such situations can be corrected if the characteristics of the
polarization equipment are known. Temperature and relative humidity also have an effect on corrosion
rate values but can arguably be ignored due to the relatively large rate differences between active and
passive steel (Scannell, Sohanghpurwala, and Islam 1996).
There are two distinct instrumentation methods for polarization resistance: galvanostatic and
potentiodynamic. Galvanostatic methods involve the application of polarizing currents in a step-by-step
fashion. Potentiodynamic testing is similar, except overvoltages are applied in steps. Both are steady-
state methods. Galvanostatic instrumentation enjoys wider use in conventional corrosion rate
measurement equipment. Potentiodynamic methods may be subject to problems involving corrosion
potential drift that makes an accurate measurement difficult to obtain (Jones 1996).
Polarization resistance, or linear polarization, appears to be the preferred method for measuring the
corrosion rate of steel reinforcement. Some transient methods have been evaluated as well, but certain
obstacles cannot be overcome. The NSC device uses the AC impedance method and was originally to be
included in the FHWA-SHRP Showcase, but it was difficult to obtain and, more importantly, the time
required for testing was inconvenient for field applications (Scannell, Sohanghpurwala, and Islam 1996).
70
Other transient methods have encountered similar problems and also fail to account for changing
variables over the period of the test (Jones 1996). Consequently, polarization resistance will likely
remain the method of choice, and efforts will be concentrated on enhancing accuracy of measurement so
that quantitative results are more reliable.
5.4.2 Description of Testing Environments
The SHRP equipment was evaluated both in the laboratory and in the field. The field testing was
conducted on corrosion damaged bridge overpass elements in Lubbock, TX and is discussed in detail in
Chapter 5. Laboratory evaluation was done in preparation for field testing and also later as a means to
generate comparisons with the equipment.
Prior to the field testing in June 1998, each portable corrosion rate device was used on sample specimens
to get practice in the methodology of each particular test routine. SAF permeability tests were performed
on various horizontal and vertical surfaces. There appeared to be some correlation between permeability
and the corrosion rate measured in the sample specimens.
After the field testing was completed, further tests were conducted with the 3LP device and with the
PR-Monitor. These tests were carried out on several beams, shown in Figure 5.23, which underwent
continuous wet/dry (two weeks wet and two weeks dry) cycling in a saltwater ponding condition and had
previously been examined only with half-cell potential measurements. The Gecor device was not
available for this evaluation.
Figure 5.23 The saltwater ponding beams (from an ongoing project at Ferguson Structural
Engineering Laboratory) used for corrosion rate testing
5.5 CORROSION RATE MEASUREMENT EQUIPMENT
The performance monitoring equipment evaluation includes four corrosion rate devices. Each device uses
a form of the polarization resistance method to calculate the corrosion rate of the steel reinforcement.
5.5.1 3LP Device
The 3LP device is a corrosion rate measurement instrument made by Kenneth C. Clear, Inc. of Virginia.
The device was introduced in the1980’s as a method for the nondestructive determination of corrosion
rate. The ultimate goal of testing with the 3LP device is to quantify corrosion deterioration and predict
the remaining life of a structure in service (Kenneth C. Clear 1990). Figure 5.24 shows the layout of the

71
3LP device, which consists of a self-contained power source and polarization console connected by wire
to the electrodes. A sponge serves as the medium for electrode contact.
Figure 5.24 The 3LP device
The name of the 3LP device is taken from the three-electrode linear polarization setup of the instrument.
The setup consists of a reference electrode, a counter electrode, and a working electrode in the same
system. Only the corrosion rate of the working electrode is of interest, and is therefore the only rate
measured. The reference electrode is a standard CSE in the form of a pencil electrode for ease in
characterizing the corrosion potential (the potential of the working electrode). The counter electrode is a
metallic strip, contained in the sponge, used to apply the polarization current. The current is controlled to
maintain a constant voltage at the reference electrode. This is a potentiostatic system, where the current is
varied to supply the potential in steps. The working electrode is the area of the reinforcing steel being
tested. This is calculated as the projection of the steel being polarized beneath the 7.25-in. x 3-in. sponge,
which is applied to the concrete surface. Studies have shown that the device may also distribute current
to steel in a successive layer of reinforcement, if it is within 15 cm (6 in.) of the probe (Kenneth C. Clear
1990).
The technique for 3LP corrosion rate testing is simple and does not require more than a few minutes.
First, the static potential of the test area is recorded from the measurement taken by the reference
electrode. Once the static potential is reached without a potential drift, the polarization current is applied
until an overpotential of 4mV is reached and the required current is recorded. This is repeated in 4 mV
increments to 8mV and 12 mV of overpotential. The device comes with software that calculates the
corrosion current density, and therefore the corrosion rate of the reinforcement.
3LP testing may also be performed using permanently embedded probes. Embedded probes are used in
areas not easily or conveniently reached with the portable device. The embedded probes consist of a
reference and a counter electrode housed inside a section of concrete or grout. The probe is 15 cm long x
7.5 cm (6-in. x 3-in.) in diameter and requires installation with a minimum of 1.3 cm (½ in.) of cover.
The counter electrode is 13 cm (5 in.) long inside the probe and polarizes all steel within about 15 cm
(6 in.). Measurements are taken with the 3LP console connected to wires running from the probe, which
is electrically connected to the working electrode during the installation (Kenneth C. Clear 1990).
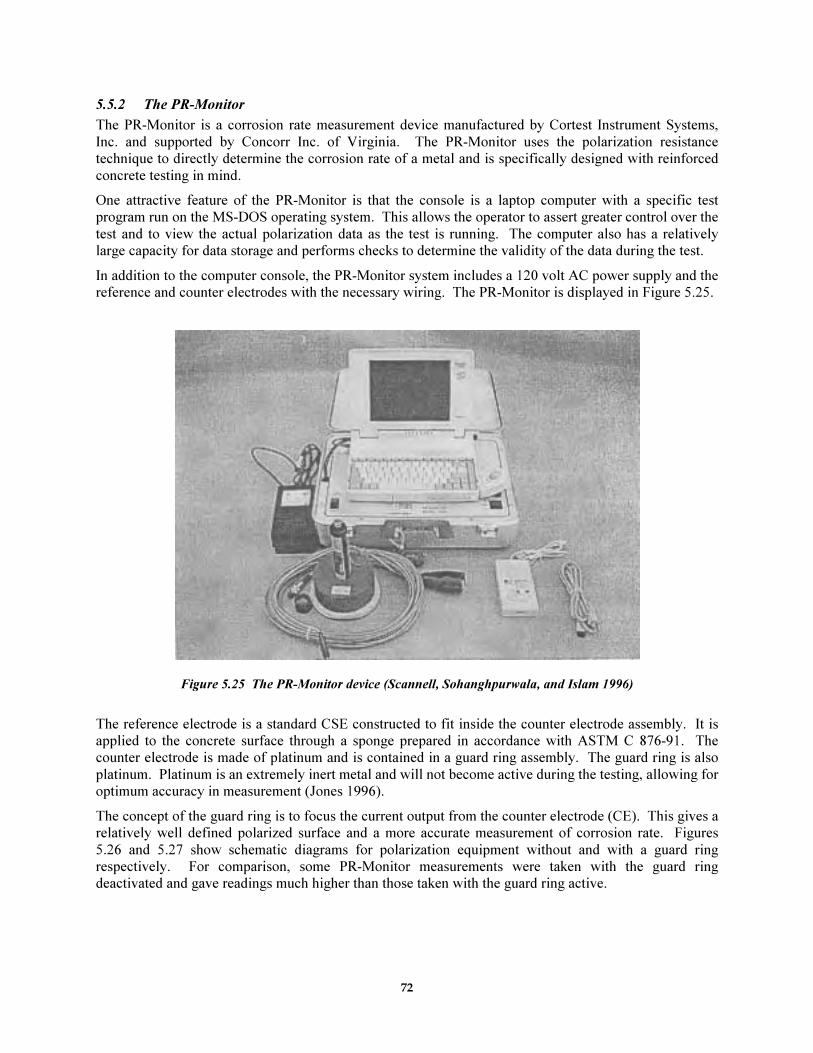
72
5.5.2 The PR-Monitor
The PR-Monitor is a corrosion rate measurement device manufactured by Cortest Instrument Systems,
Inc. and supported by Concorr Inc. of Virginia. The PR-Monitor uses the polarization resistance
technique to directly determine the corrosion rate of a metal and is specifically designed with reinforced
concrete testing in mind.
One attractive feature of the PR-Monitor is that the console is a laptop computer with a specific test
program run on the MS-DOS operating system. This allows the operator to assert greater control over the
test and to view the actual polarization data as the test is running. The computer also has a relatively
large capacity for data storage and performs checks to determine the validity of the data during the test.
In addition to the computer console, the PR-Monitor system includes a 120 volt AC power supply and the
reference and counter electrodes with the necessary wiring. The PR-Monitor is displayed in Figure 5.25.
Figure 5.25 The PR-Monitor device (Scannell, Sohanghpurwala, and Islam 1996)
The reference electrode is a standard CSE constructed to fit inside the counter electrode assembly. It is
applied to the concrete surface through a sponge prepared in accordance with ASTM C 876-91. The
counter electrode is made of platinum and is contained in a guard ring assembly. The guard ring is also
platinum. Platinum is an extremely inert metal and will not become active during the testing, allowing for
optimum accuracy in measurement (Jones 1996).
The concept of the guard ring is to focus the current output from the counter electrode (CE). This gives a
relatively well defined polarized surface and a more accurate measurement of corrosion rate. Figures
5.26 and 5.27 show schematic diagrams for polarization equipment without and with a guard ring
respectively. For comparison, some PR-Monitor measurements were taken with the guard ring
deactivated and gave readings much higher than those taken with the guard ring active.
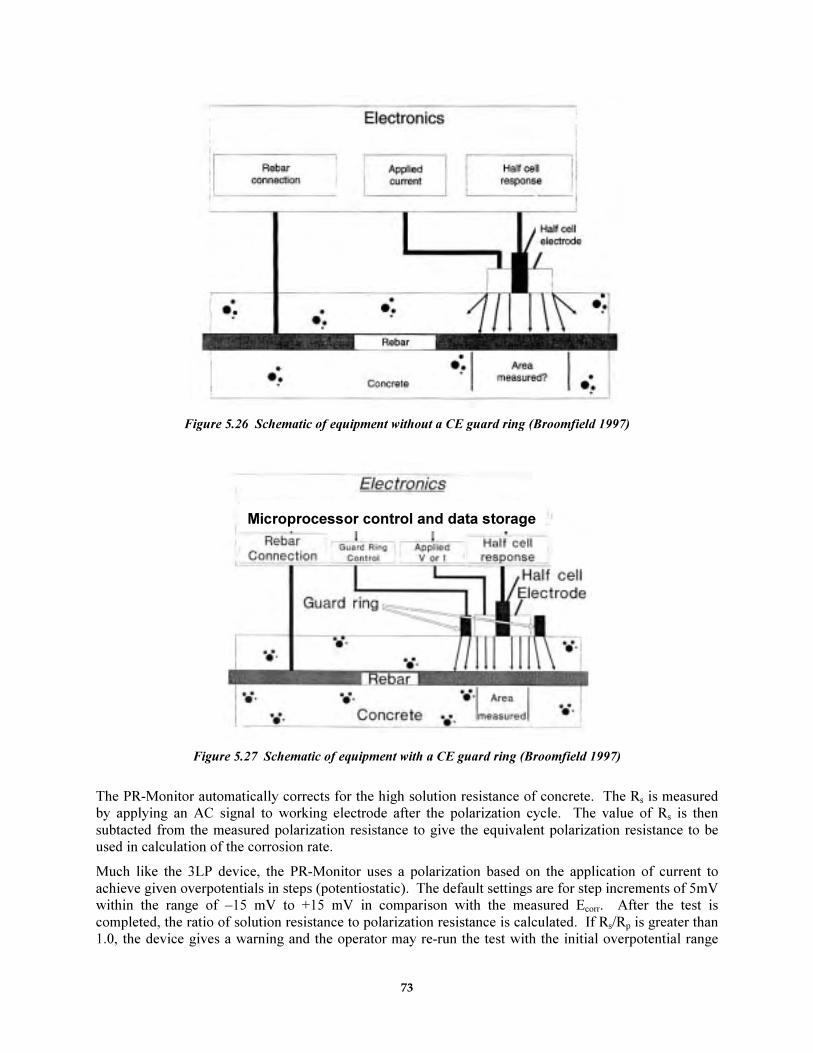
73
Figure 5.26 Schematic of equipment without a CE guard ring (Broomfield 1997)
Microprocessor control and data storage
Figure 5.27 Schematic of equipment with a CE guard ring (Broomfield 1997)
The PR-Monitor automatically corrects for the high solution resistance of concrete. The Rs is measured
by applying an AC signal to working electrode after the polarization cycle. The value of Rs is then
subtacted from the measured polarization resistance to give the equivalent polarization resistance to be
used in calculation of the corrosion rate.
Much like the 3LP device, the PR-Monitor uses a polarization based on the application of current to
achieve given overpotentials in steps (potentiostatic). The default settings are for step increments of 5mV
within the range of –15 mV to +15 mV in comparison with the measured Ecorr. After the test is
completed, the ratio of solution resistance to polarization resistance is calculated. If Rs/Rp is greater than
1.0, the device gives a warning and the operator may re-run the test with the initial overpotential range

74
multiplied approximately by the ratio value. The overpotential increase is designed to give more accurate
data for locations with high solution resistance and may also be input by the operator prior to any test.
Such flexibility in operation increases accuracy and decreases the overall test time because a period of
10 minutes is recommended between subsequent tests to avoid effects caused by the previous
polarization. The maximum overpotential value is 100 mV (Cortest).
The PR-Monitor outputs a corrosion rate based on the measured value of icorr. The familiar Stern-Geary
relationship is applied with an assumed value of the proportionality constant set at B = 35 mV. The
constant is calculated using values of βa = 160 mV and βc = 160 mV; values considered typical for steel in
a concrete environment (Cortest).
5.5.2.1 Corrosion Rate Testing with 3LP and PR-Monitor
Additional corrosion rate testing was performed on the beams mentioned in Section 6.1.2 with the
PR-Monitor and 3LP devices. The beams were separated into four series. There were four beams in the
first series, five each in the second series and third series, and two in the fourth series. The first series
was composed of reinforced concrete members. The second, third and fourth series of beams all also
contained prestressing steel in ducts (West 1999).
Each beam has a unique loading history. Beams 1.4, 2.4, 3.3, 3.4, and 3.5 were all overloaded at least
25 percent above the service load (West 1999). These specimens should have the most severe cracking
conditions in their respective series. Beams 1.1 and 3.1 remained unloaded.
Corrosion rate testing was performed at the midspan (location a) and at 12-in. offset from the midspan
(location b) on each beam. Table 5.7 shows the results of PR-Monitor testing after 7 months of saltwater
exposure. Measurements were also taken with a saturated calomel electrode (the values are adjusted to
reflect mV vs. CSE) to test the accuracy of PR-Monitor values.
The results of the testing show that the PR-Monitor generally gave a value of Ecorr lower than the
recorded half-cell potential. The difference may be due to the greater depth of penetration achieved with
the PR-Monitor; and the consequent measurement of reinforcement in a less corrosive environment.
However, the values were relatively accurate; allowing corrosion characterization according to
ASTM C 876-91.
The values for corrosion rate correlated with the loading conditions as the beams with higher loading
generally show more active corrosion conditions. Many of the higher corrosion rates were observed at
locations with some visible cracks. Cracks were visible on beam 1.4, and the corrosion rate could not be
determined at either location on this beam. Beams 1.1 and 3.1 have the lowest overall corrosion rates for
their respective series, as expected.
Table 5.8 contains the corrosion rate measurement data after 15 months of exposure. Measurements were
carried out with both the 3LP device and the PR-Monitor. For the sake of comparison, corrosion rates are
shown in µA/cm2 for both devices and the criterion from each device is used to evaluate the corrosion
condition.
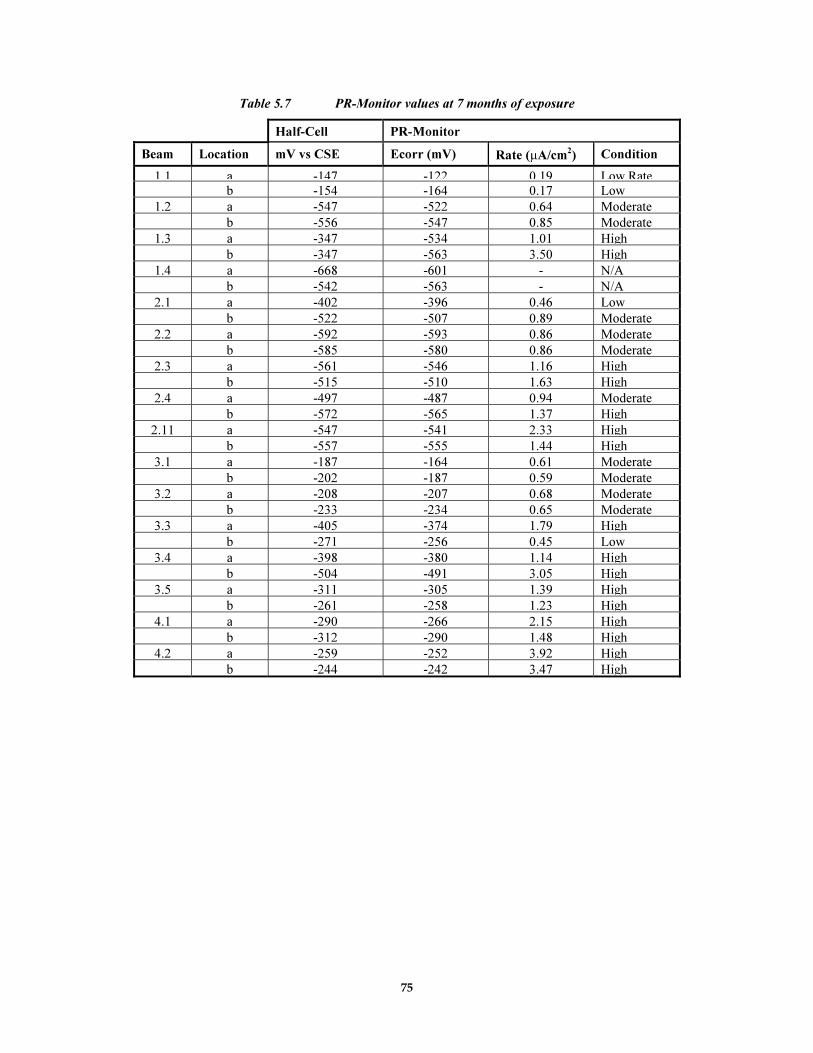
75
Table 5.7 PR-Monitor values at 7 months of exposure
Half-Cell PR-Monitor
Beam Location mV vs CSE Ecorr (mV) Rate (µA/cm2) Condition
1 1 a -147 -122 0 19 Low Rateb -154 -164 0.17 Low
1.2 a -547 -522 0.64 Moderate
b -556 -547 0.85 Moderate
1.3 a -347 -534 1.01 High
b -347 -563 3.50 High
1.4 a -668 -601 - N/A
b -542 -563 - N/A
2.1 a -402 -396 0.46 Low
b -522 -507 0.89 Moderate
2.2 a -592 -593 0.86 Moderate
b -585 -580 0.86 Moderate
2.3 a -561 -546 1.16 High
b -515 -510 1.63 High
2.4 a -497 -487 0.94 Moderate
b -572 -565 1.37 High
2.11 a -547 -541 2.33 High
b -557 -555 1.44 High
3.1 a -187 -164 0.61 Moderate
b -202 -187 0.59 Moderate
3.2 a -208 -207 0.68 Moderate
b -233 -234 0.65 Moderate
3.3 a -405 -374 1.79 High
b -271 -256 0.45 Low
3.4 a -398 -380 1.14 High
b -504 -491 3.05 High
3.5 a -311 -305 1.39 High
b -261 -258 1.23 High
4.1 a -290 -266 2.15 High
b -312 -290 1.48 High
4.2 a -259 -252 3.92 High
b -244 -242 3.47 High

76
Table 5.8 PR-Monitor vs. 3LP for corrosion rate measurement at 15 months of exposure
3LP Device PR-Monitor
Beam Location Rate (µA/cm2) Condition Rate (µA/cm
2) Condition
1.1 a 0.76 Low 0.12 Low b 1.15 Moderate 0.19 Low
1.2 a 4.37 Moderate 0.88 Moderate
b 5.79 Moderate 1.17 High
1.3 a 3.50 Moderate 1.06 High
b 6.29 Moderate 1.30 High
1.4 a 5.64 Moderate 1.76 High
b 7.66 Moderate 2.75 High
2.1 a 5.58 Moderate 0.85 Moderate
b 9.32 High 2.59 High
2.2 a 5.61 Moderate 0.95 Moderate
b 4.86 Moderate 0.91 Moderate
2.3 a 6.33 Moderate 0.47 Moderate
b 4.79 Moderate 1.42 High
2.4 a 4.25 Moderate 0.87 Moderate
b 6.78 Moderate 1.94 High
2.11 a 6.70 Moderate 1.27 High
b 7.08 Moderate 2.19 High
3.1 a 4.44 Moderate 0.14 Low
b 4.62 Moderate 0.31 Low
3.2 a 5.43 Moderate 0.32 Low
b 6.83 Moderate 0.42 Low
3.3 a 14.14 High 1.22 High
b 6.56 Moderate 0.45 Low
3.4 a 14.53 High 1.12 High
b 25.14 High 2.48 High
3.5 a 17.41 High 1.24 High
b 13.32 High 1.20 High
4.1 a 8.88 Moderate 0.87 Moderate
b 12.28 High 1.02 High
4.2 a 7.16 Moderate 0.69 Moderate
b 8.75 Moderate 0.79 Moderate
The corrosion rate values given by the 3LP device were much higher than those from the PR-Monitor.
The area used in the corrosion rate calculation may be smaller than the actual polarized area of steel due
to a lack of current confinement (West 1999). The polarization current from the PR-Monitor is confined
by the guard ring. In spite of the higher rates from the 3LP device, the corrosion rate guidelines from
each instrument actually indicate that more severe conditions can be diagnosed with the PR-Monitor.
There was correlation between the corrosion rate trends of the 3LP and the PR-Monitor devices. All of
the locations where the 3LP device indicated a “High” corrosion condition, the PR-Monitor also
characterized the rate as “High.” The 3LP seems to have a larger range for “Moderate” corrosion
conditions. It should be noted that comparisons between these two devices are not absolute because they
are of different size and shape, and therefore measure different areas of reinforcement. Both devices
showed lower corrosion rates in the unloaded specimens.
The discrepancy between the values from the 3LP and PR-Monitor suggests that the corrosion evaluation
should not be made on a quantitative basis, but rather should be a qualitative analysis based on the
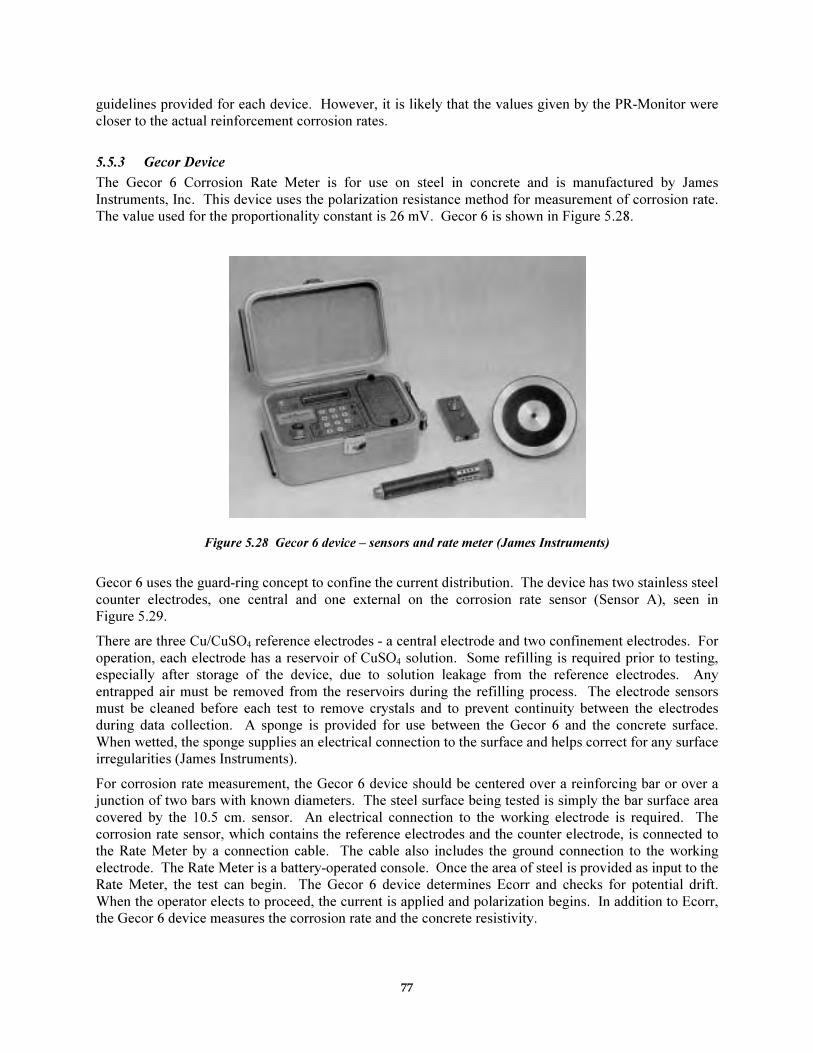
77
guidelines provided for each device. However, it is likely that the values given by the PR-Monitor were
closer to the actual reinforcement corrosion rates.
5.5.3 Gecor Device
The Gecor 6 Corrosion Rate Meter is for use on steel in concrete and is manufactured by James
Instruments, Inc. This device uses the polarization resistance method for measurement of corrosion rate.
The value used for the proportionality constant is 26 mV. Gecor 6 is shown in Figure 5.28.
Figure 5.28 Gecor 6 device – sensors and rate meter (James Instruments)
Gecor 6 uses the guard-ring concept to confine the current distribution. The device has two stainless steel
counter electrodes, one central and one external on the corrosion rate sensor (Sensor A), seen in
Figure 5.29.
There are three Cu/CuSO4 reference electrodes - a central electrode and two confinement electrodes. For
operation, each electrode has a reservoir of CuSO4 solution. Some refilling is required prior to testing,
especially after storage of the device, due to solution leakage from the reference electrodes. Any
entrapped air must be removed from the reservoirs during the refilling process. The electrode sensors
must be cleaned before each test to remove crystals and to prevent continuity between the electrodes
during data collection. A sponge is provided for use between the Gecor 6 and the concrete surface.
When wetted, the sponge supplies an electrical connection to the surface and helps correct for any surface
irregularities (James Instruments).
For corrosion rate measurement, the Gecor 6 device should be centered over a reinforcing bar or over a
junction of two bars with known diameters. The steel surface being tested is simply the bar surface area
covered by the 10.5 cm. sensor. An electrical connection to the working electrode is required. The
corrosion rate sensor, which contains the reference electrodes and the counter electrode, is connected to
the Rate Meter by a connection cable. The cable also includes the ground connection to the working
electrode. The Rate Meter is a battery-operated console. Once the area of steel is provided as input to the
Rate Meter, the test can begin. The Gecor 6 device determines Ecorr and checks for potential drift.
When the operator elects to proceed, the current is applied and polarization begins. In addition to Ecorr,
the Gecor 6 device measures the corrosion rate and the concrete resistivity.
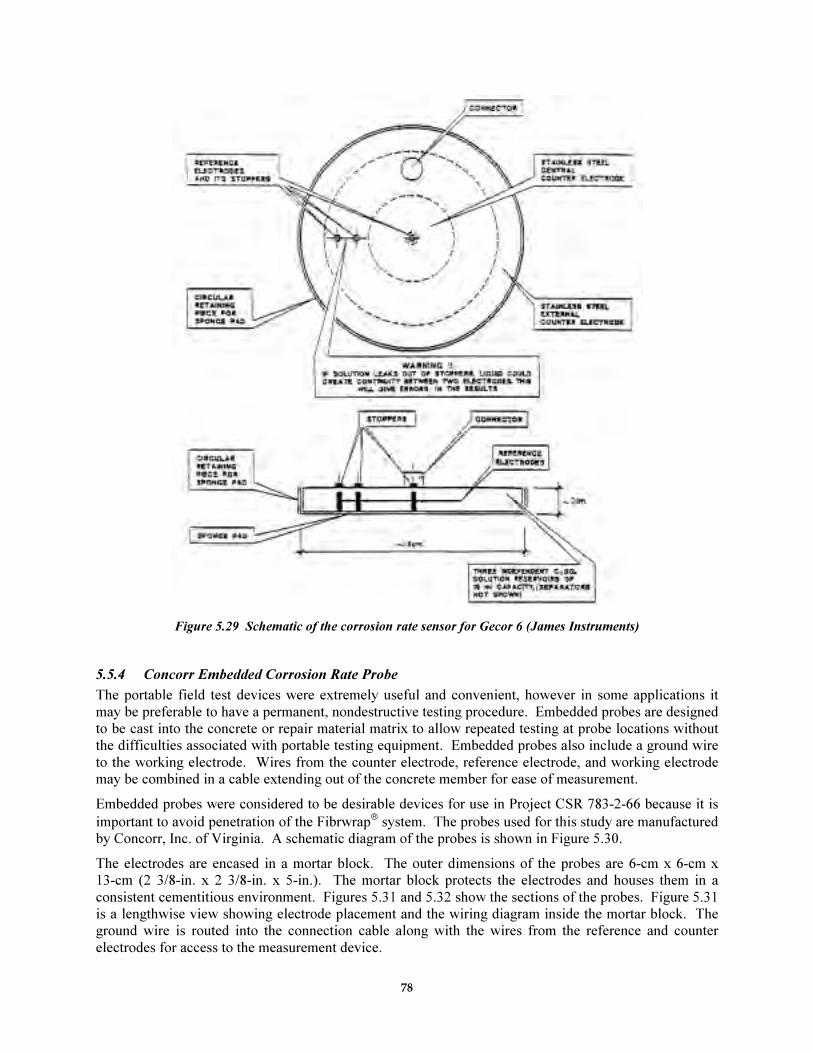
78
Figure 5.29 Schematic of the corrosion rate sensor for Gecor 6 (James Instruments)
5.5.4 Concorr Embedded Corrosion Rate Probe
The portable field test devices were extremely useful and convenient, however in some applications it
may be preferable to have a permanent, nondestructive testing procedure. Embedded probes are designed
to be cast into the concrete or repair material matrix to allow repeated testing at probe locations without
the difficulties associated with portable testing equipment. Embedded probes also include a ground wire
to the working electrode. Wires from the counter electrode, reference electrode, and working electrode
may be combined in a cable extending out of the concrete member for ease of measurement.
Embedded probes were considered to be desirable devices for use in Project CSR 783-2-66 because it is
important to avoid penetration of the Fibrwrap system. The probes used for this study are manufactured
by Concorr, Inc. of Virginia. A schematic diagram of the probes is shown in Figure 5.30.
The electrodes are encased in a mortar block. The outer dimensions of the probes are 6-cm x 6-cm x
13-cm (2 3/8-in. x 2 3/8-in. x 5-in.). The mortar block protects the electrodes and houses them in a
consistent cementitious environment. Figures 5.31 and 5.32 show the sections of the probes. Figure 5.31
is a lengthwise view showing electrode placement and the wiring diagram inside the mortar block. The
ground wire is routed into the connection cable along with the wires from the reference and counter
electrodes for access to the measurement device.
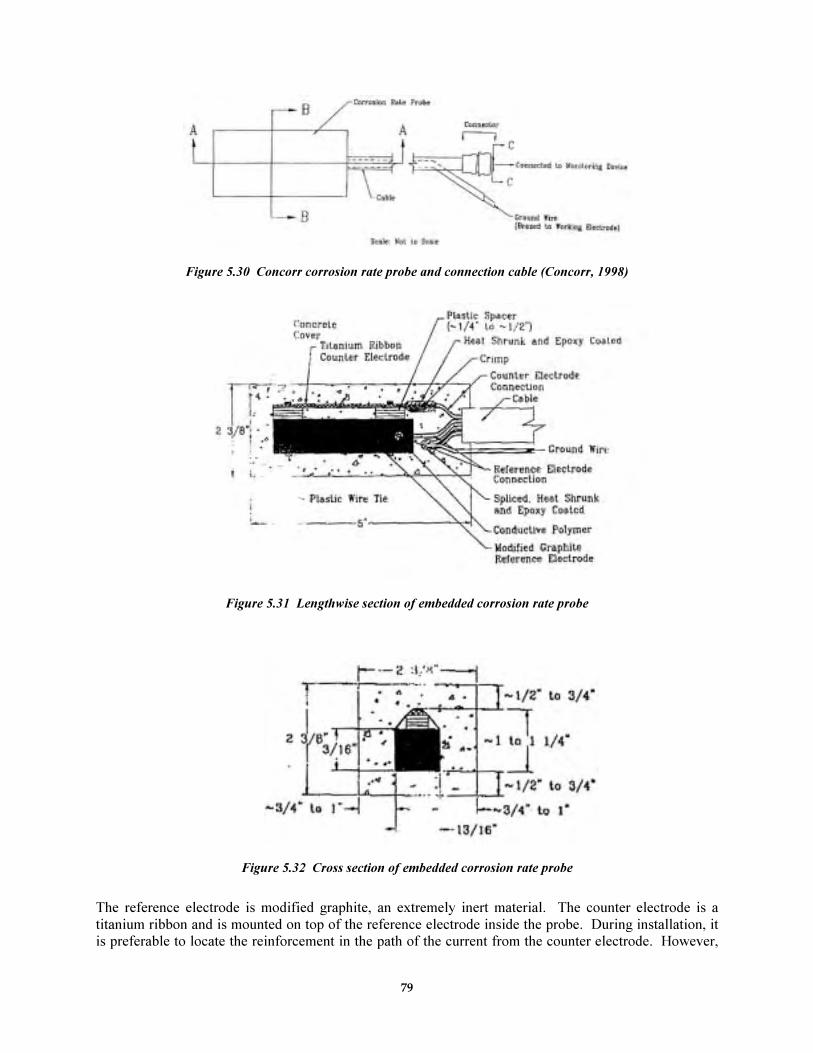
79
Figure 5.30 Concorr corrosion rate probe and connection cable (Concorr, 1998)
Figure 5.31 Lengthwise section of embedded corrosion rate probe
Figure 5.32 Cross section of embedded corrosion rate probe
The reference electrode is modified graphite, an extremely inert material. The counter electrode is a
titanium ribbon and is mounted on top of the reference electrode inside the probe. During installation, it
is preferable to locate the reinforcement in the path of the current from the counter electrode. However,
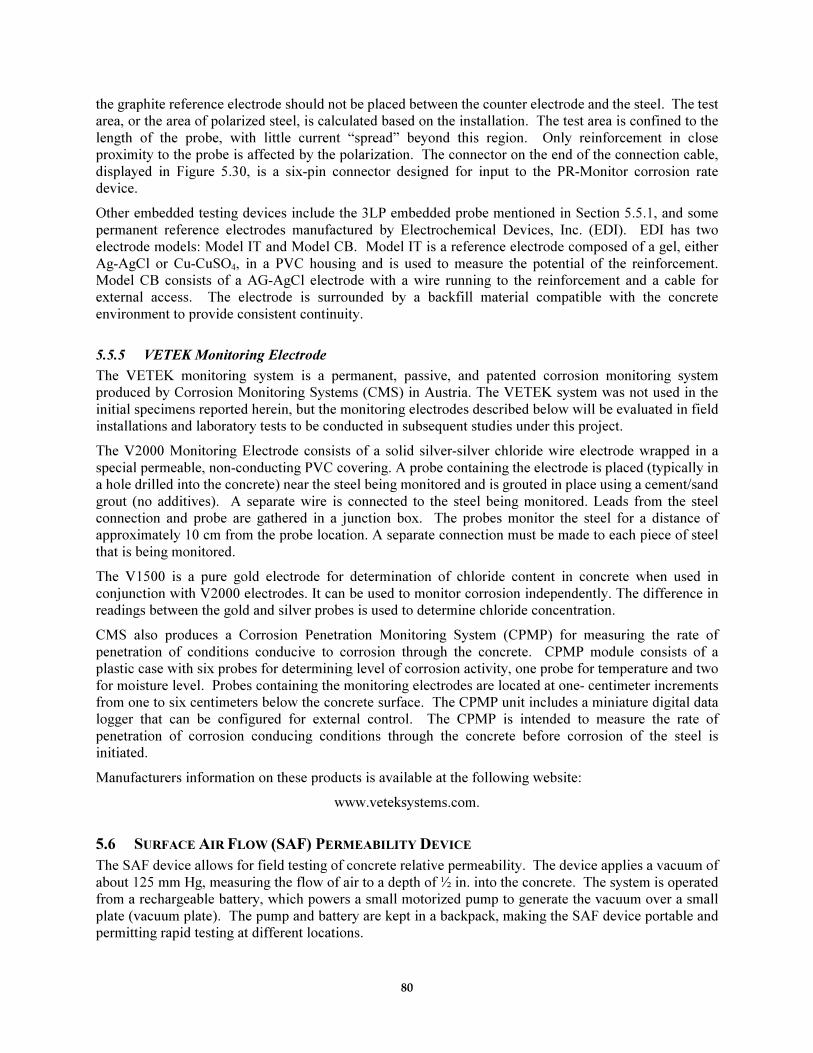
80
the graphite reference electrode should not be placed between the counter electrode and the steel. The test
area, or the area of polarized steel, is calculated based on the installation. The test area is confined to the
length of the probe, with little current “spread” beyond this region. Only reinforcement in close
proximity to the probe is affected by the polarization. The connector on the end of the connection cable,
displayed in Figure 5.30, is a six-pin connector designed for input to the PR-Monitor corrosion rate
device.
Other embedded testing devices include the 3LP embedded probe mentioned in Section 5.5.1, and some
permanent reference electrodes manufactured by Electrochemical Devices, Inc. (EDI). EDI has two
electrode models: Model IT and Model CB. Model IT is a reference electrode composed of a gel, either
Ag-AgCl or Cu-CuSO4, in a PVC housing and is used to measure the potential of the reinforcement.
Model CB consists of a AG-AgCl electrode with a wire running to the reinforcement and a cable for
external access. The electrode is surrounded by a backfill material compatible with the concrete
environment to provide consistent continuity.
5.5.5 VETEK Monitoring Electrode
The VETEK monitoring system is a permanent, passive, and patented corrosion monitoring system
produced by Corrosion Monitoring Systems (CMS) in Austria. The VETEK system was not used in the
initial specimens reported herein, but the monitoring electrodes described below will be evaluated in field
installations and laboratory tests to be conducted in subsequent studies under this project.
The V2000 Monitoring Electrode consists of a solid silver-silver chloride wire electrode wrapped in a
special permeable, non-conducting PVC covering. A probe containing the electrode is placed (typically in
a hole drilled into the concrete) near the steel being monitored and is grouted in place using a cement/sand
grout (no additives). A separate wire is connected to the steel being monitored. Leads from the steel
connection and probe are gathered in a junction box. The probes monitor the steel for a distance of
approximately 10 cm from the probe location. A separate connection must be made to each piece of steel
that is being monitored.
The V1500 is a pure gold electrode for determination of chloride content in concrete when used in
conjunction with V2000 electrodes. It can be used to monitor corrosion independently. The difference in
readings between the gold and silver probes is used to determine chloride concentration.
CMS also produces a Corrosion Penetration Monitoring System (CPMP) for measuring the rate of
penetration of conditions conducive to corrosion through the concrete. CPMP module consists of a
plastic case with six probes for determining level of corrosion activity, one probe for temperature and two
for moisture level. Probes containing the monitoring electrodes are located at one- centimeter increments
from one to six centimeters below the concrete surface. The CPMP unit includes a miniature digital data
logger that can be configured for external control. The CPMP is intended to measure the rate of
penetration of corrosion conducing conditions through the concrete before corrosion of the steel is
initiated.
Manufacturers information on these products is available at the following website:
www.veteksystems.com.
5.6 SURFACE AIR FLOW (SAF) PERMEABILITY DEVICE
The SAF device allows for field testing of concrete relative permeability. The device applies a vacuum of
about 125 mm Hg, measuring the flow of air to a depth of ½ in. into the concrete. The system is operated
from a rechargeable battery, which powers a small motorized pump to generate the vacuum over a small
plate (vacuum plate). The pump and battery are kept in a backpack, making the SAF device portable and
permitting rapid testing at different locations.
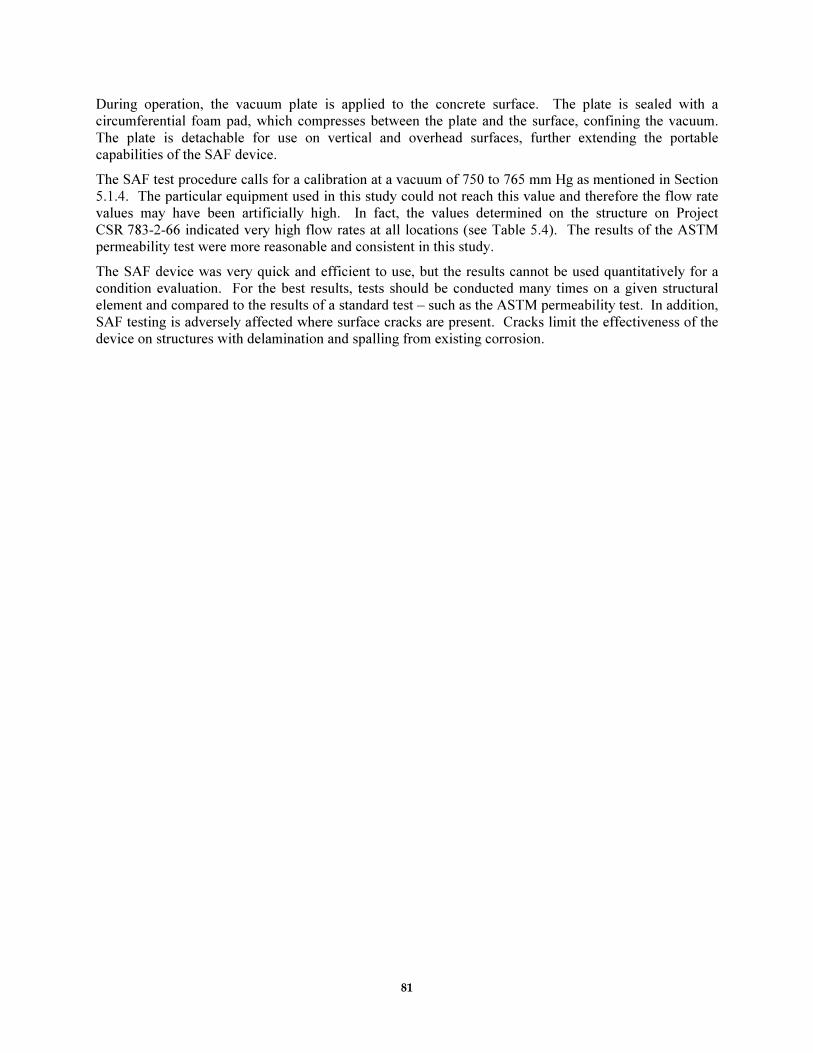
81
During operation, the vacuum plate is applied to the concrete surface. The plate is sealed with a
circumferential foam pad, which compresses between the plate and the surface, confining the vacuum.
The plate is detachable for use on vertical and overhead surfaces, further extending the portable
capabilities of the SAF device.
The SAF test procedure calls for a calibration at a vacuum of 750 to 765 mm Hg as mentioned in Section
5.1.4. The particular equipment used in this study could not reach this value and therefore the flow rate
values may have been artificially high. In fact, the values determined on the structure on Project
CSR 783-2-66 indicated very high flow rates at all locations (see Table 5.4). The results of the ASTM
permeability test were more reasonable and consistent in this study.
The SAF device was very quick and efficient to use, but the results cannot be used quantitatively for a
condition evaluation. For the best results, tests should be conducted many times on a given structural
element and compared to the results of a standard test – such as the ASTM permeability test. In addition,
SAF testing is adversely affected where surface cracks are present. Cracks limit the effectiveness of the
device on structures with delamination and spalling from existing corrosion.

82
83
CHAPTER 6
SUMMARY AND CONCLUSIONS
6.1 SUMMARY
Effective repair methods have become important to address a major problem related to our infrastructure,
corrosion-related deterioration of reinforced concrete structures. FRP composite wrapping has been used
to prevent seismic overloading, but to evaluate the performance of FRP wrapping systems in corrosive
environments, laboratory and field research programs are needed.
The laboratory research involves a range of specimens with selected parameters varied to investigate
corrosion performance. The specimens are monitored during exposure to an aggressively corrosive
environment.
In the field, corrosion-damaged bridge overpass structures are being monitored after they have been
repaired and wrapped with an FRP system. The effectiveness of several performance monitoring
instruments for use in the field was evaluated. The equipment included portable devices for field testing
and permanent instrumentation for in-service testing of corrosion activity.
6.2 FRP COMPOSITE WRAPPING SYSTEMS FOR CORROSION PROTECTION
The performance of FRP wrapping systems used for corrosion repairs and for prevention against further
corrosion in previously exposed areas has not been encouraging. The corrosion rate data collected from
the wrapped structures in Project CSR 783-2-66 will provide valuable information on in-service
performance. Similarly, the corrosion behavior of wrapped laboratory specimens with chlorides inherent
in the concrete mix design is also being monitored. The monitoring of laboratory specimens without mix
chlorides can be used to assess the corrosion performance of wrapping systems on uncontaminated and
uncorroded structures.
The application of wrapping systems in both the laboratory and in the field was a convenient process.
FRP wrapping is easy to place and can be applied quickly.
6.3 LABORATORY RESEARCH
Definitive conclusions concerning the performance of the composite protective laminates cannot be made
yet due to the limited period of exposure. Important findings related to construction, wrap application,
and corrosion detection are summarized below.
6.3.1 Repair Materials and Methods
Repairs performed on selected specimens using epoxy grout and latex modified concrete are aesthetically
pleasing and appear to be structurally sound. These two repair materials were easy to work with and
place. The metal flashing used as formwork around the cylinders proved to be a good method of material
confinement during application and wet-mat curing.
6.3.2 Composite Wraps
The Delta FRP system was applied without difficulty because company personnel provided expertise and
guidance at all stages of the construction. The Delta system showed no visible defects or flaws, and
presented no problems during fabric saturation and specimen wrapping.
The generic system was still in its early development and experimental stage at the time of its application.
Much was learned during specimen encapsulation concerning material behavior, and both the system

84
design and implementation technique were greatly improved over the length of this project. Overall, the
epoxy system behaved well after correcting minor problems. The curing agent chosen for wet surfaces
proved to be too viscous and, therefore, inadequate for this type of application, and was replaced with a
curing agent appropriate for both dry and wet surfaces. The vinyl ester system resulted in a mostly
disintegrated wrap and heavily damaged fabric. This is probably due to a destructive chemical reaction
between the wrap and the resin.
The Cab-O-Sil used as a resin thickener for sealing wrap joints might prove to be a weak spot in the
corrosion protection of both systems (Joyce et. al 1999).
6.3.3 Test Method Results
The half-cell potential method of corrosion detection seems to be the most appropriate in this study
because of its ease of measurement and recorded consistency in similar projects. The wires permanently
attached to specimen reinforcement allow for quick access to both columns and beams.
The results obtained within the first few months of exposure indicated a 90 percent probability of no
corrosion activity in the specimens. These values are changing significantly as the exposure time
increases. A highly permeable concrete mix, numerous flexural cracks, low cover, and cast-in chlorides
increase the rate of oxidation.
6.4 PERFORMANCE MONITORING EQUIPMENT
The use of performance monitoring equipment is essential in understanding the corrosion process in
deteriorating structures. Portable devices are especially useful and allow for extensive and repeatable
testing. It is important that the equipment is well maintained and working properly.
The corrosion rate devices used in this study all operate with the polarization resistance method. Portable
testing was done with the 3LP device, PR-Monitor device, and the Gecor device. Embedded electrodes
are in place for continued in-service evaluation. The following observations are based on readings taken
using the equipment.
• The 3LP and PR-Monitor device showed consistent corrosion rate trends.
• Corrosion rate values from field testing are qualitative, but not quantitative.
• The PR-Monitor was the best device for field corrosion rate testing.
• Embedded corrosion rate probes were convenient for in-service testing.
• Chloride contents from damaged areas of the structures in Project CSR 783-2-66 were above the
threshold for probable corrosion.
• Chloride content measurements correlated with corrosion rate measurements and with visible
delamination and spalling.
• Chloride profiles indicated high concrete permeability on Project CSR 783-2-66, in agreement
with standard permeability tests.
• The SAF permeability device gave inconsistent results and showed only loose correlation with
standard permeability testing.
6.5 RECOMMENDATIONS FOR CONTINUING AND FURTHER RESEARCH
This report details and summarizes the initial phases of a long-term corrosion study. The most important
aspect of this research is that it be continued until definite conclusions on the effect of FRP wrapping
systems on corrosion behavior can be reached. It is recommended that in-service corrosion rate
measurements be taken indefinitely at six-month intervals, with regular evaluation of the values. It is

85
further recommended that the laboratory research continue for 4 to 5 years, concluding with autopsies of
each specimen.
Further research of fiber-reinforced composite wrapping systems is needed. Areas of possible research
include corrosion protection offered under different loading conditions, detailed analysis of capillary
action in submerged elements with partial wrapping, and the development of new wrap systems.
Future research relating to performance monitoring equipment is also important. The development of
better equipment and more comprehensive monitoring programs would make structural repair and
maintenance more effective and could become an important step toward infrastructure improvement.
Research involving the application of various nondestructive test methods would be particularly useful.

86
87
Appendix A –Materials
Appendix A contains specifications for the materials used for the following
operations.
1. Repair of concrete
a. Epoxy grout – Sikadur 42 Grout-Pak
b. Latex-Modified Concrete – SikaTop 122 Plus
2. Wrapping specimens
a. Tyfo ® S fiberwrap materials
b. Generic wrap materials
i) Epoxy resin – EPON 862
ii) Curing agent for dry surfaces – EPI – CURE 3234
iii) Curing agent for wet surfaces – EPI – CURE 3090
iv) Vinyl ester resin – DERAKANE 411
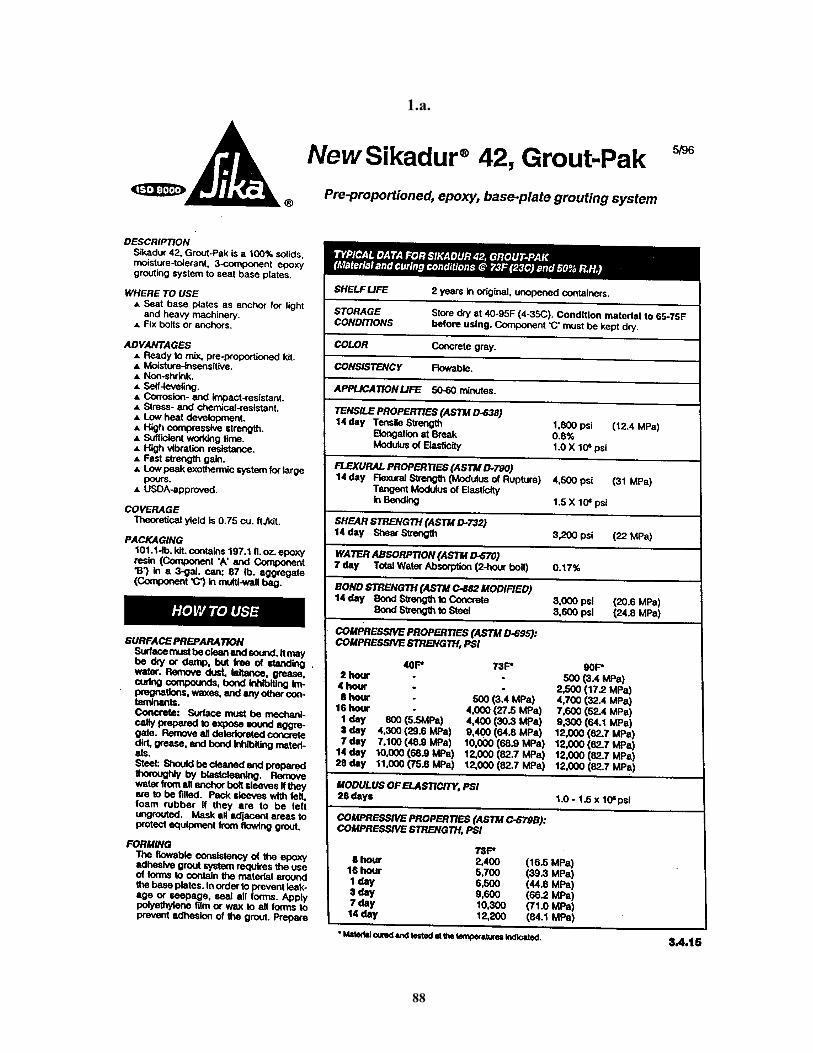
88
1.a.
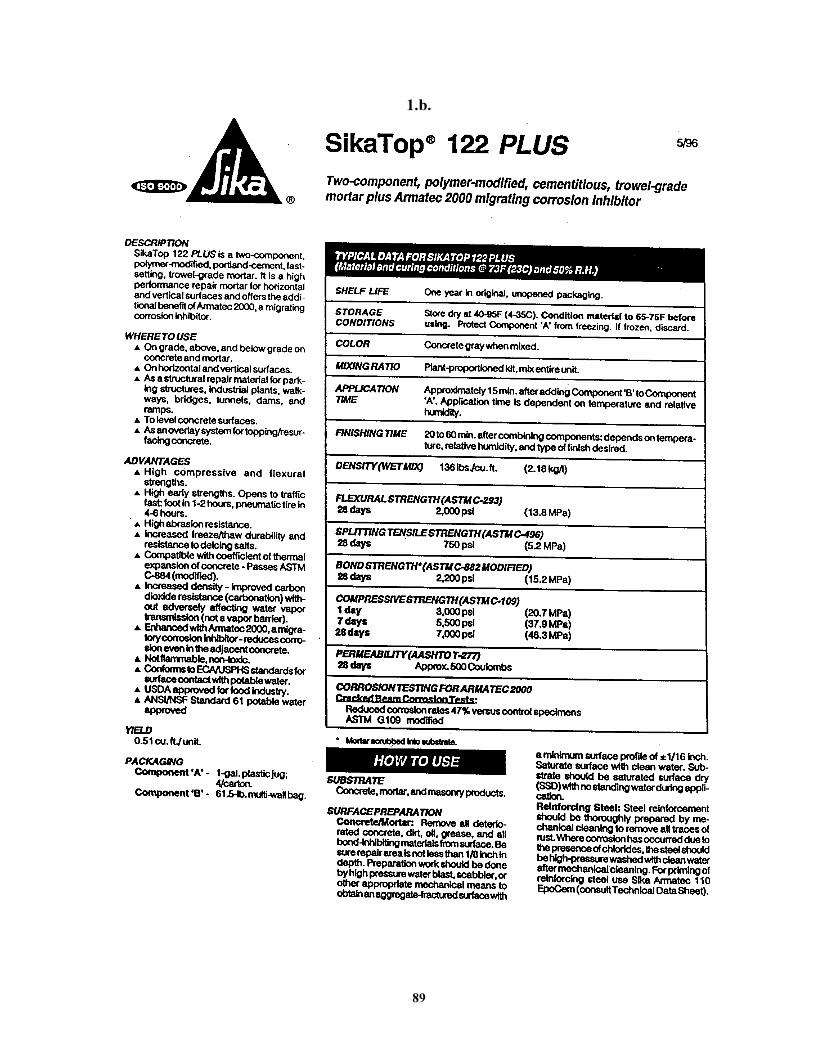
89
1.b.
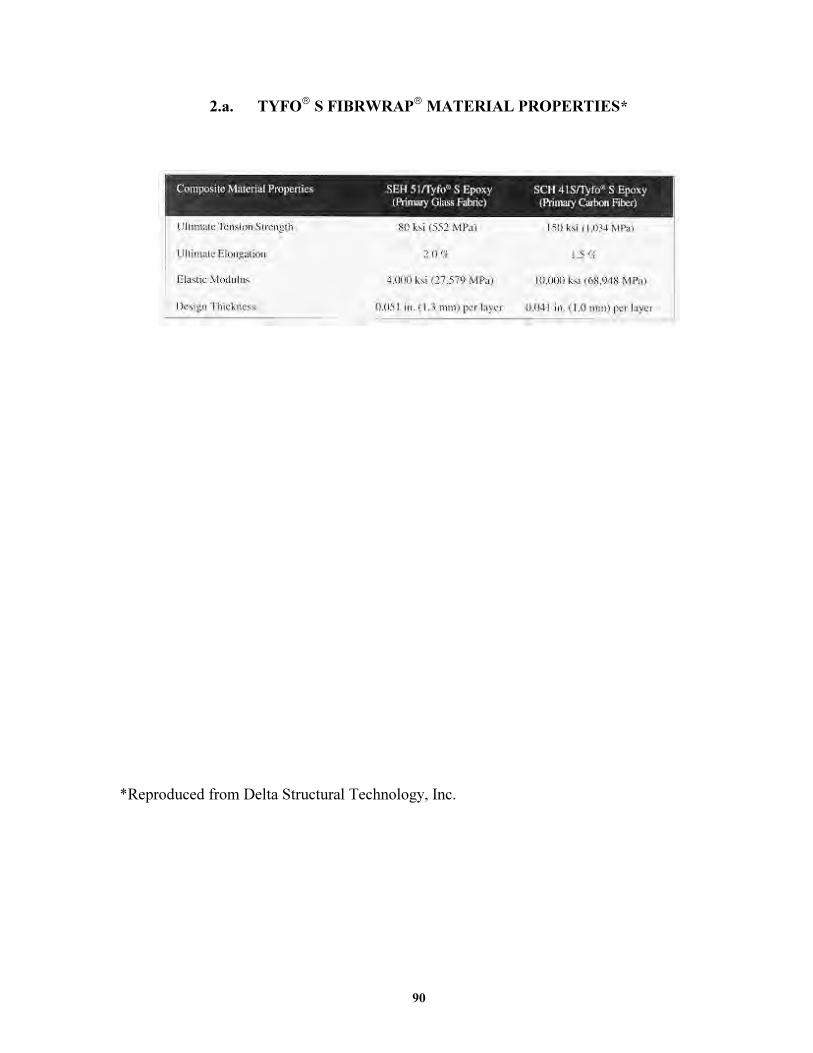
90
2.a. TYFO
S FIBRWRAP
MATERIAL PROPERTIES*
*Reproduced from Delta Structural Technology, Inc.
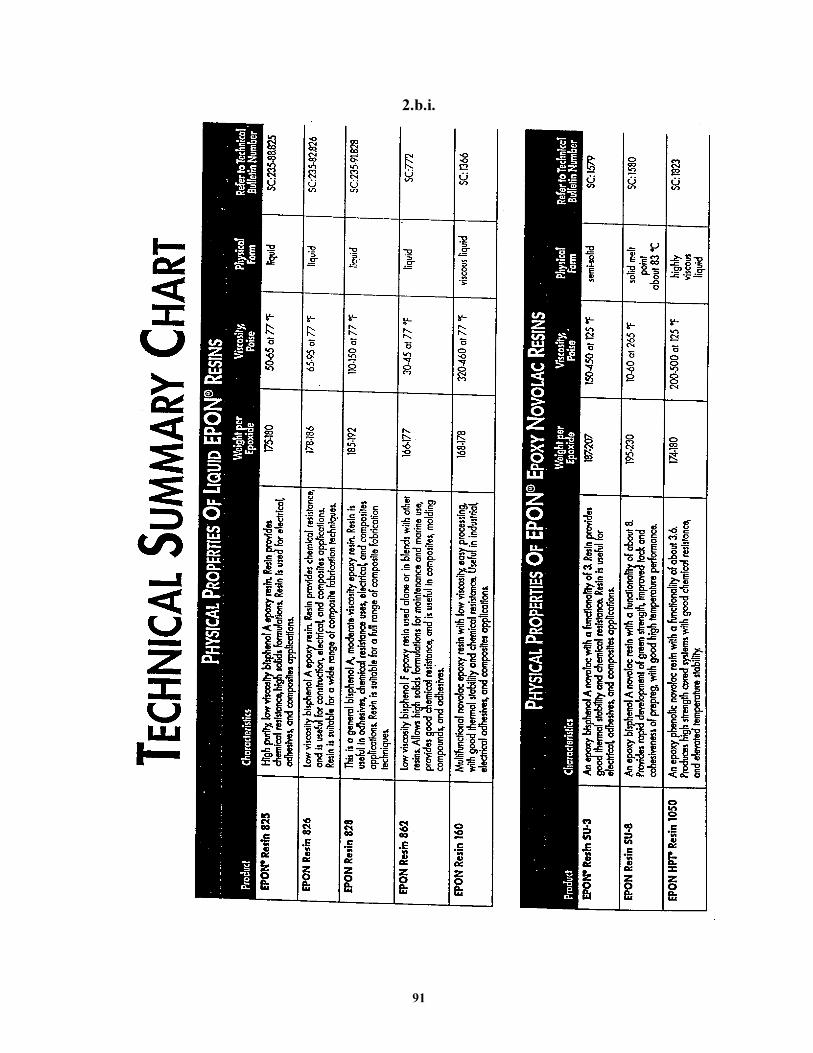
91
2.b.i.

92
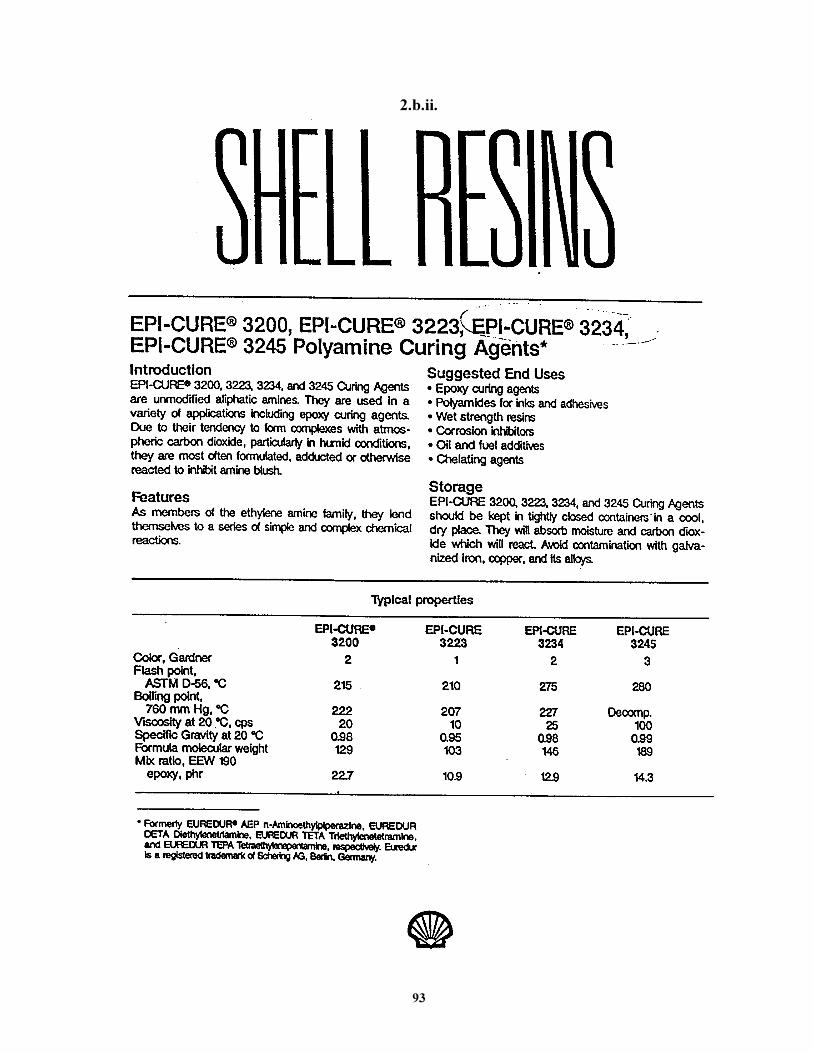
93
2.b.ii.
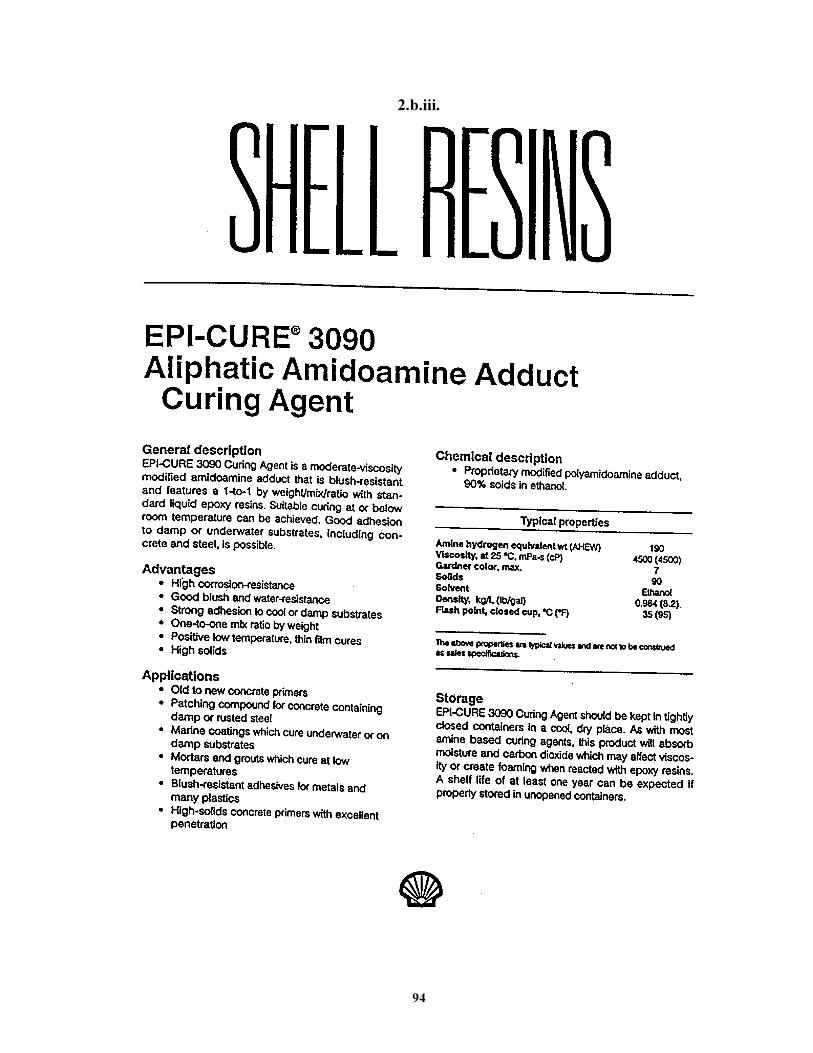
94
2.b.iii.

95
Appendix B
PRODUCTS USED ON PROJECT CSR 783-2-66**
B.1 Repair Material
**Reproduced from Manufacturers’ Product Data Sheets
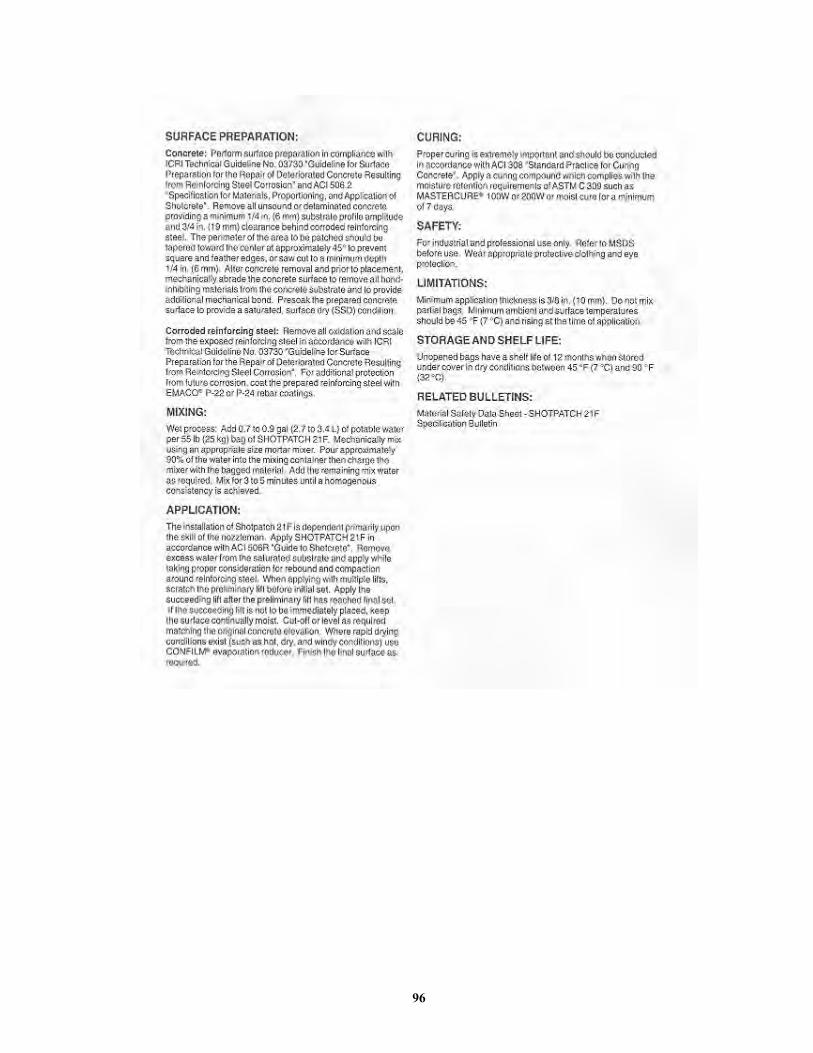
96
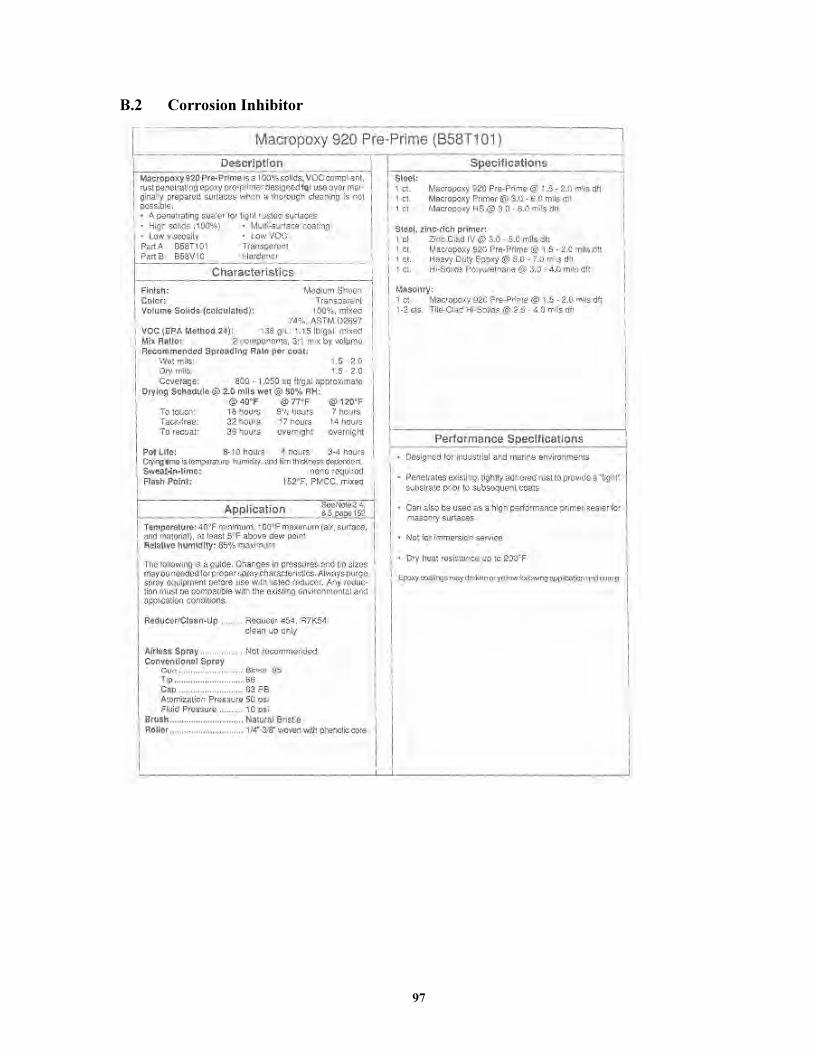
97
B.2 Corrosion Inhibitor

98

99
Bibliography
American Concrete Institute. (1995). Building Code Requirements for Structural Concrete
(ACI 318-95) and Commentary (ACI 318R-95), American Concrete Institute, Farmington
Hills, MI.
American Concrete Institute Committee 222. (1991). “Corrosion of Metals in Concrete,”
ACI 222R-85, ACI Manual of Concrete Practice, Part I, American Concrete Institute, Detroit,
MI.
ASTM. (1998). “Standard Test Method for Half-Cell Potentials of Uncoated Reinforcing Steel in
Concrete,” Annual Book of ASTM Standards, Designation: C 876-91, ASTM, West
Conshohocken, PA, 430-435.
ASTM. (1998). “Standard Test Method for Electrical Indication of Concrete’s Ability to Resist
Chloride Ion Penetration,” Annual Book of ASTM Standards, Designation: C 1202-97,
ASTM, West Conshohocken, PA, 622-627.
Bassett, Susan. Composites for Infrastructure, A Guide for Civil Engineers. Ray Publishing, Wheat
Ridge, Colorado, 1998.
Broomfield, J. P. (1997). Corrosion of Steel in Concrete, E. & F.N. Spon, London, UK.
Buzbee, Sally. (1994). “Freeway material resists quakes,” Associated Press, 1994.
Civil Engineering. (1994). “Fiber Wraps Migrate East,” Civil Engineering, July 1994.
Concorr Inc., Assessment of Physical Condition of Concrete Bridge Components. FHWA-SHRP
Showcase, Participants Workbook, July 1996.
Concorr. (1998). “Corrosion Rate Probe and Connection Details,” Concorr, Inc., Ashburn, VA.
Cortest Instrument Systems, Inc. Operating Manual for the PR Monitor Version 5.00, Cortest
Instrument Systems, Inc., Willoughby, OH.
Delta Structural Technology. Composite Information. Amarillo, Texas.
Dow Plastics. “Fabricating Tips – DERAKENE Epoxy Vinyl Ester Resins,” Bulletin Number
125-00082-196. January 1996.
Emmons, Peter H., Concrete Repair and Maintenance Illustrated, R.S. Means Company, Inc, 1994.
Falabella, R., Neuner, J., Isley, F.P. “Environmental Durability and Resin Stoichiometry Studies of
TYFO S High Strength Column Wrapping System,” Hexcel Corporation, Pleasanton,
California. September 1993.
Fowler, D.W., Repair and Rehabilitation of Damaged Reinforced Concrete Structures. Class Notes.
University of Texas at Austin. Spring 1998.

100
Fowler, T., Nondestructive Testing Methods with an Emphasis on Acoustic Emission. Class Notes.
University of Texas at Austin. Fall 1998.
Fraczek, John. (1987). “A Review of Electrochemical Principals as Applied to Corrosion of Steel in a
Concrete of Grout Environment,” Corrosion, Concrete, and Chlorides. Steel Corrosion in
Concrete: Causes and Restraints, American Concrete Institute, (SP-102-1), Detroit, MI,
13-24.
Francois, R., and Arliguie, G. (1991). “Reinforced Concrete: Correlation Between Cracking and
Corrosion,” Durability of Concrete, Second International Conference, Volume II,
(SP 126-65), American Concrete Institute, Detroit, MI, 1221-1238.
Fuentes, Laura Alexandra. (1999). “Implementation of Composite Wrapping Systems on Reinforced
Concrete Structures Exposed to a Corrosive Laboratory Environment,” Thesis, Civil
Engineering Department, University of Texas at Austin, 1999.
Gallagher, R.B., Robinson, C.H. “Understanding Methyl Ethyl Ketone Peroxides,” Official
Publication of the Composites Fabricators Association. April 1995.
Halmshaw, R. Non-Destructive Testing. Edward Arnold, London, U.K., 1987.
Hardcore DuPont Composites, “Column and Pier Cap Retrofit,” Process Description and Individual
Component Specification, April 2, 1996.
Hartman, D.R., Greenwood, M.E., Miller, D.M. “High Strength Glass Fiber,” Owens Corning
Technical Paper.
Hausmann, D. A. (1964). “Electrochemical Behavior of Steel in Concrete,” Journal of the ACI,
(February 1964), American Concrete Institute, Detroit, MI, 171-187.
Hime, W., and Erlin, B. (1987). “Some Chemical and Physical Aspects of Phenomena Associated
with Chloride-Induced Corrosion,” Corrosion, Concrete, and Chlorides. Steel Corrosion in
Concrete: Causes and Restraints, American Concrete Institute, (SP-102-1), Detroit, MI, 1-12.
Integrated Mechanics of Processing And Composite Manufacturing Technologies (IMPACT)
Laboratory, Department of Mechanical Engineering and the Texas Materials Institute, The
University of Texas at Austin; Dr. Tess J. Moon, Director.
James Instruments Inc. The Gecor6 Corrosion rate Meter for Steel in Concrete, James Instruments
Inc., Chicago, IL.
James Instruments Inc., www.ndtjames.com, 1998.
Jones, Denny A., Principles and Prevention of Corrosion. Prentice Hall, Upper Saddle River, NJ.
1996.
Joyce, P., Miret, D., Moon, T.J., “Assessment of Candidate Material Systems for Infrastructure
Applications: Fabrication and Testing,” Journal of Materials in Civil Engineering, in
preparation for publication in 2000.

101
Kenneth C. Clear, Inc. (1990). KCC Inc. 3LP Package Test Procedures, Data Analysis Procedures
and General Information, Kenneth C. Clear, Inc., Sterling, VA, July 1990.
Master Builders Technologies. (1999). masterbuilders.com/struct.htm
McConnell, Vicki P. (1993). “Bridge Column Retrofit,” High Performance Composites,
September/October 1993, 62-64.
Mirmiran, Amir. (1997). “FRP-Concrete Composite Column and Pile Jacket Splicing Phase II,”
Department of Civil & Environmental Engineering, University of Central Florida, August
1997.
Mirsa, S., and Uomoto, T. (1991). “Reinforcement Corrosion Under Simultaneous Diverse Exposure
Conditions,” Durability of Concrete, Second International Conference, Volume I, (SP 126-
22), American Concrete Institute, Detroit, MI, 423-442.
Moran/Labine, editors, “Corrosion Monitoring in Industrial Plants using Nondestructive Testing and
Electrochemical Methods,” ASTM STP 908, 1986.
Mufti, Aftab A., Erki, Marie-Anne, and Jaeger, Leslie G. (1991). “Chapter 1: Introduction and
Overview,” Advanced Composite Materials with Applications to Bridges, The Canadian
Society for Civil Engineering, Montreal, P.Q., Canada, 1-20.
Nawy, Edward G. Concrete Construction Engineering Handbook. CRC Press, Boca Raton, New
York, 1997.
Neale, K. W., and Labossiere, P. (1991). “Chapter 2: Material Properties of Fibre-Reinforced
Plastics,” Advanced Composite Materials with
Applications to Bridges, The Canadian Society for Civil Engineering, Montreal, P.Q., Canada, 21-69.
Okpala, Daniel. (1996). Correspondence with Mathew Murphy, August 1996.
Page , C.L., Bamforth, P.B., Figg, J.W. Corrosion of Reinforcemnt in Concrete Construction.
Proceedings from the Fourth International Symposium on Corrosion of Reinforcement in
Concrete Construction. Cambridge, U.K., 1996.
Project Agreement between the Texas Department of Transportation and the Center for
Transportation Research at the University of Texas at Austin, Project 1774, September 1997.
Roper, H., and Baweja, D. (1991). “Carbonation-Chloride Interactions and Their Influence on
Corrosion Rates of Steel in Concrete,” Durability of Concrete, Second International
Conference, Volume I, (SP 126-22), American Concrete Institute, Detroit, MI, 295-316.
Saadatmanesh, Hamid, and Ehsani, Mohammed R. (1996). “Experimental Study of Concrete Girders
Rerofitted with Epoxy-Bonded Composite Laminates,” Repair and Strengthening of Concrete
Members with Adhesive Bonded Plates, (SP 165) American Concrete Institute, Farmington
Hills, MI, 205-234.
Saadatmanesh, Hamid, Ehsani, Mohammed R., and An, Wei (1996). “Analytical Study of Concrete
Girders Rerofitted with Epoxy-Bonded Composite Laminates,” Repair and Strengthening of

102
Concrete Members with Adhesive Bonded Plates, (SP 165) American Concrete Institute,
Farmington Hills, MI, 235-259.
Scannell, William T., Sohanghpurwala, Ali A., and Islam, Moavin. (1996). “Assessment of Physical
Condition of Concrete Bridge Components,” FHWA-SHRP Showcase Participant’s
Workbook, Concorr, Inc., Ashburn, VA, 1996.
SDS Companny, “CANIN Corrosion Analyzing Instrument,” www3.tcsn.net/sdsco/011.htm, 1998.
Shaw, M. Migrating Corrosion Inhibitors for Reinforced Concrete Protection. Proceedings from the
7th International Conference and Exhibition on Structural Faults and Repair, U.K., 1997.
Shell Chemical Company. Product Information Guide. 1998.
Sheikh, S., Pantazopoulou, S., Bonacci, J., Thomas, M., Hearn, N. “Repair of Delaminated Circular
Pier Columns by ACM,” Ontario Joint Transportation Research Report, MTO Reference
Number 31902.
Sherman, Mathew Robert, “Field Evaluation of Bridge Corrosion Protection Measures,” Master’s
Thesis, University of Texas at Austin, 1993.
Sika Corporation. Construction Products Catalog. 1996.
Sohanghpurwala, Ali Akbar, and Scannell, William T. (1994). “Repair and Protection of Concrete
Exposed to Seawater,” Concrete Repair Bulletin, July/August 1994, 8-13.
Swamy, R. N. (1990). “Durability of Rebars in Concrete,” Durability of Concrete, G.M. Idorn
International Symposium, (SP 131-3), American Concrete Institute, Detroit, MI, 67-98.
Taheri, A., Van Bruegel, K. Chloride Penetration into Concrete Structures in Aggressive Marine
Environment, Experimental Simulation. Proceedings from the 7th International Conference
and Exhibition on Structural Faults and Repair, U.K., 1997.
Texas Department of Transportation. “Standard Specifications for Construction of Highways,
Streets, and Bridges,” 1993.
Unal, Muhammed Alp, “Evaluation of a Procedure for Encapsulation and Epoxy Injection of
Corroding Reinforced Concrete Structures,” Master’s Thesis, University of Texas at Austin,
1998.
Unal, Muhammed A., and Jirsa, James O. (1998). “Evaluation of an Encapsulation and Epoxy Resin
Injection Procedure for Rehabilitating Corroding Reinforced Concrete Structures,” PMFSEL
Report 98-3, Ferguson Laboratory, The University of Texas at Austin, September 1998.
United States Census Bureau. (1999). state.tx.us/maps/303.html
Vaca, Enrique Cortes. (1993). “Electrochemical Procedures to Rehabilitate Corroded Concrete
Structures,” Departmental Report, University of Texas at Austin, May 1993.
Vaca, et al. (1998). “Repair of Epoxy-Coated Reinforcement,” TxDOT Report 1265-5, The Center
for Transportation Research, The University of Texas at Austin, September 1998.
103
Verhulst, Stewart, “Evaluation and Performance Monitoring of Corrosion Protection Provided by
Fiber-Reinforced Composite Wrapping,” Master’s Thesis, University of Texas at Austin,
1999.
West, J. (1999). “Durability Design of Post-Tensioned Bridge Substructures,” Dissertation, Civil
Engineering Department, University of Texas at Austin, 1999.
XXsys Technologies, Inc. (1998). “Automated Column Wrapping Process Overview,” XXsys
Technologies, Inc. San Diego, CA, 1998.
Yeomans, S. R. (1991). “Comparative Studies of Galvanized and Epoxy Coated Steel Reinforcement
in Concrete,” Durability of Concrete, Second International Conference, Volume I,
(SP 126-19), American Concrete Institute, Detroit, MI, 355-370.
Yuyama, Okamoto, Ohtsu, and Kishi, Evaluation Criteria for Acoustic Emission Examination of
Reinforced Concrete Structures.
Zongjin et al., “Application of Acoustic Emission Technique to Detection of Reinforcing Steel
Corrosion in Concrete,” ACI Materials Journal, January-February 1998, pp 68 – 76.