european economy. economic papers 259/2006. global...
TRANSCRIPT

EUROPEAN ECONOMY
EUROPEAN COMMISSION DIRECTORATE-GENERAL FOR ECONOMIC
AND FINANCIAL AFFAIRS
ECONOMIC PAPERS
ISSN 1725-3187 http://europa.eu.int/comm/economy_finance
N° 259 October 2006
Global Trade Integration and Outsourcing : How Well is the EU Coping with the New Challenges ?
by
Karel Havik and Kieran Mc Morrow
Directorate-General for Economic and Financial Affairs

Economic Papers are written by the Staff of the Directorate-General for Economic and Financial Affairs, or by experts working in association with them. The “Papers” are intended to increase awareness of the technical work being done by the staff and to seek comments and suggestions for further analyses. Views expressed represent exclusively the positions of the author and do not necessarily correspond to those of the European Commission. Comments and enquiries should be addressed to the: European Commission Directorate-General for Economic and Financial Affairs Publications BU1 - -1/13 B - 1049 Brussels, Belgium ISBN 92-79-01200-2 KC-AI-06-259-EN-C ©European Communities, 2006
- 1 -
Global Trade Integration and Outsourcing : How Well is the EU Coping with the New Challenges ?
Karel Havik and Kieran Mc Morrow*
Abstract Even with the growing internationalisation of production and the emerging concerns regarding the outsourcing phenomenon, the present study suggests that Europe has handled the post-1990 upsurge in worldwide trade integration in a relatively successful way. The EU continues to retain its long-established title as the number 1 global trading power. In addition, the EU has been a net gainer in terms of the outsourcing part of the production relocation phenomenon, with an increase in its surplus on trade in intermediate goods and services over the period 1992 to 2003. However, despite this relatively reassuring assessment, the study also highlights a number of areas of concern, such as geographically with regard to the EU's growing trade deficits with Asia in general and technologically with the EU’s exceptionally poor performance on the ICT front. Complacency must therefore be avoided and policy makers need to remain vigilant to a number of potential medium to long run challenges to the EU's present hegemony in world trade.
Disclaimer : The views expressed in this paper are the responsibility of the authors alone and should not be attributed to the European Commission. *The authors work in the Directorate-General for Economic and Financial Affairs (ECFIN) of the European Commission. The authors would like to thank M. Buti, K. Pichelmann, R. Veugelers and especially W. Röger and J. Kröger for valuable comments and drafting suggestions regarding earlier drafts of this paper.
- 2 -
Global Trade Integration and Outsourcing : How well is the EU coping with the new challenges ?
Table of Contents
1. Introduction 2. Growth of intermediate trade, global production structures and the phenomenon of goods and services outsourcing
2.1 : Overview of trade by stage of production at the world level (Goods outsourcing) 2.2 : China’s role in the international production chain – Are there similarities with the
EU10 member states ? 2.3 : Services outsourcing 2.4 : Total global / EU15 outsourcing market for goods and services
3. An assessment of the vulnerability of EU Industry in this emerging “Global Factory”
3.1 : What's happening in terms of overall world markets ? 3.2 : Is Europe holding its own in the high technology / high skill intensive areas of world
trade ? 3.3 : What are the 20 most dynamic global product groupings and is there evidence of a
worldwide shift in the comparative advantage of the EU in these areas ?
4. Summary and concluding remarks Annexes
1.Correspondence of the Broad Economic Categories (BEC) classification of imports with the basic classes of goods used in the national accounts
2. Classification of manufacturing industries based on technology intensity 3. Breakdown of total trade by factor intensity 4. Calculation method for the trade balance-based comparative advantage indicator (CEPII) 5. Trade analysis for the individual EU15 Member States 1992-2003 (Goods) 6. Data on world services trade
- 3 -
Section 1 : Introduction Trade integration has been a striking feature of the world economy over recent decades, with the volume of goods presently traded being more than 15 times greater than in 1950 and with its share in GDP tripling. While some commentators insist that the present GDP share for merchandise trade is only at pre-World War 1 levels, this analogy takes no account of the growing importance of the relatively less tradeable service sector in GDP over the intervening period and consequently of the fact that world trade in goods as a share of world industrial production is now at unprecedented levels. In addition, with the increasing tradeability of large parts of the service economy, trade in services is now growing at similar rates to those of goods and consequently at a pace which is substantially higher than that of GDP. Since 1990, in fact, goods and services trade growth has evolved in a broadly similar pattern (with both growing by about 6% per year on average) and with services consequently retaining its roughly 20% share of overall international trade over this period. While trends at the aggregate level have been characterised by broad stability, there has nevertheless been substantial compositional shifts, with the growth rate of specific categories of goods and services diverging sharply. On the goods side, manufactured products have substantially increased their share of world exports to presently account for close to 60% of the total (from 50% in 1985). In terms of services, the “other services” category which includes computer and information services, financial services, insurance and telecommunications, has witnessed a 1/3 increase in its share of world exports to presently account for roughly 10% of the total. These compositional shifts in trading patterns and the growing integration of national economies into the world trading system is being driven by a wide range of factors. Trade liberalisation, falling transportation and communication costs, rising income levels, higher productivity growth rates in tradeables compared with non-tradeables, and a recent acceleration in the international division of labour (i.e. the specialisation of countries according to their comparative advantage) linked with the development of increasingly global production systems, are all driving international trade integration. Amongst the latter factors, one of the most important since the mid-1980’s has undoubtedly been the development of international production sharing. Such production sharing has resulted in ever growing volumes of intermediate inputs (both goods and services) being exchanged between countries at different stages of the manufacturing process. This growth in intermediate trade (i.e. semi-finished goods / parts and components) or “outsourcing” reflects the re-organisation of many production processes on a global / regional, as opposed to national, basis and is a mirror image of the spectacular growth in FDI flows from less than 5% of world GDP in 1985 to over 15% by the late 1990’s. With more globalised production systems and the emergence of powerful information and communications technologies (ICT), most notably the internet, this outsourcing or “vertical specialisation” (i.e. fragmentation of the production process) phenomenon is increasingly spreading to many areas of the service economy. Whilst most countries in the developed world have in the past been supportive of this ever increasing trend towards specialisation at the international level and the consequent rise in the share of trade in world output, this consensus has recently being exposed to sustained
- 4 -
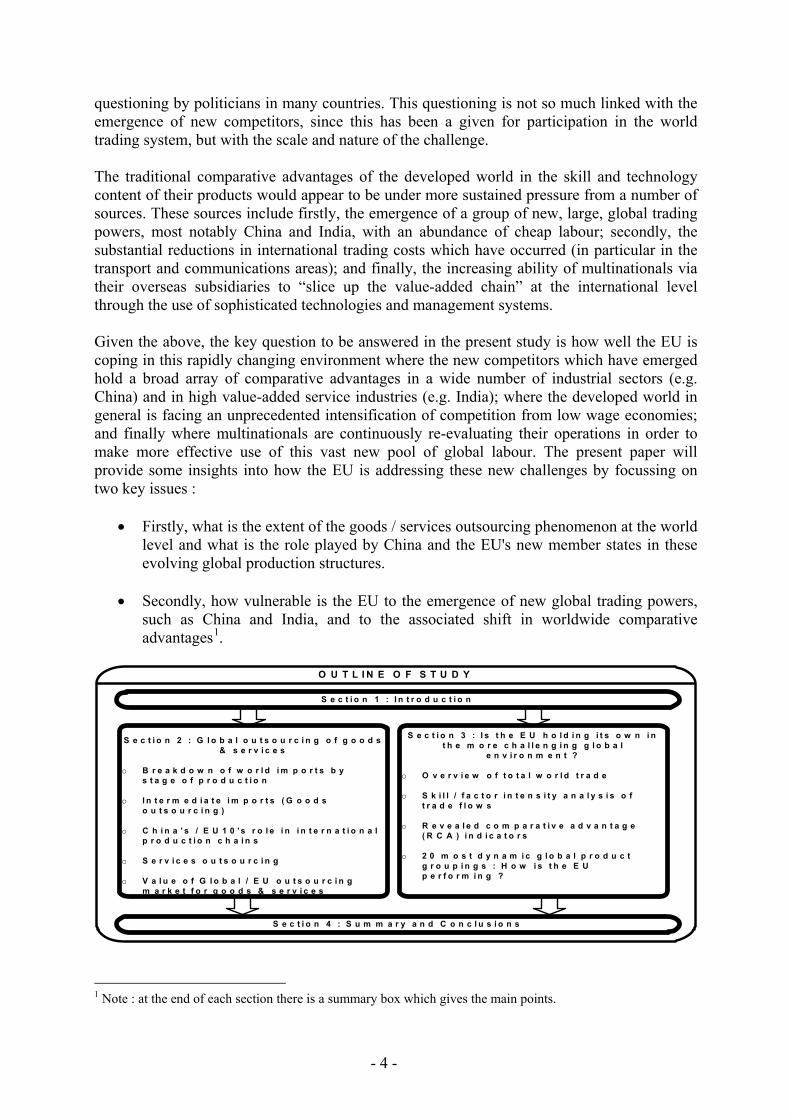
questioning by politicians in many countries. This questioning is not so much linked with the emergence of new competitors, since this has been a given for participation in the world trading system, but with the scale and nature of the challenge. The traditional comparative advantages of the developed world in the skill and technology content of their products would appear to be under more sustained pressure from a number of sources. These sources include firstly, the emergence of a group of new, large, global trading powers, most notably China and India, with an abundance of cheap labour; secondly, the substantial reductions in international trading costs which have occurred (in particular in the transport and communications areas); and finally, the increasing ability of multinationals via their overseas subsidiaries to “slice up the value-added chain” at the international level through the use of sophisticated technologies and management systems. Given the above, the key question to be answered in the present study is how well the EU is coping in this rapidly changing environment where the new competitors which have emerged hold a broad array of comparative advantages in a wide number of industrial sectors (e.g. China) and in high value-added service industries (e.g. India); where the developed world in general is facing an unprecedented intensification of competition from low wage economies; and finally where multinationals are continuously re-evaluating their operations in order to make more effective use of this vast new pool of global labour. The present paper will provide some insights into how the EU is addressing these new challenges by focussing on two key issues :
• Firstly, what is the extent of the goods / services outsourcing phenomenon at the world level and what is the role played by China and the EU's new member states in these evolving global production structures.
• Secondly, how vulnerable is the EU to the emergence of new global trading powers,
such as China and India, and to the associated shift in worldwide comparative advantages1.
S e c t i o n 1 : I n t r o d u c t i o n
O U T L I N E O F S T U D Y
S e c t i o n 2 : G l o b a l o u t s o u r c i n g o f g o o d s & s e r v i c e s
o B r e a k d o w n o f w o r l d i m p o r t s b y s t a g e o f p r o d u c t i o n
o I n t e r m e d i a t e i m p o r t s ( G o o d s o u t s o u r c i n g )
o C h i n a ’ s / E U 1 0 ' s r o l e i n i n t e r n a t i o n a l p r o d u c t i o n c h a i n s
o S e r v i c e s o u t s o u r c i n g
o V a l u e o f G l o b a l / E U o u t s o u r c i n g m a r k e t f o r g o o d s & s e r v i c e s
S e c t i o n 4 : S u m m a r y a n d C o n c l u s i o n s
S e c t i o n 3 : I s t h e E U h o l d i n g i t s o w n i n t h e m o r e c h a l l e n g i n g g l o b a l
e n v i r o n m e n t ?
o O v e r v i e w o f t o t a l w o r l d t r a d e
o S k i l l / f a c t o r i n t e n s i t y a n a l y s i s o f t r a d e f l o w s
o R e v e a l e d c o m p a r a t i v e a d v a n t a g e ( R C A ) i n d i c a t o r s
o 2 0 m o s t d y n a m i c g l o b a l p r o d u c t g r o u p i n g s : H o w i s t h e E U p e r f o r m i n g ?
1 Note : at the end of each section there is a summary box which gives the main points.
- 5 -
Section 2 : Growth of intermediate trade, global production structures and the phenomenon of goods and services outsourcing
Trade in intermediate products is a key feature of economic globalisation and constitutes a specific form of the international division of labour which is quickly substituting for more traditional forms of internationalisation which are based on importing raw materials and exporting finished goods. The globalisation of markets allied with technological progress has enabled the decomposition of the production process of a given product into multiple, successive, upstream – downstream stages, regularly spread across a number of different countries. Upstream intermediate goods which are often highly standardised (due to the importance of reaping economies of scale) are produced on a massive scale by an ever decreasing group of highly specialised producers. These standardised parts and components are then fed into the downstream stages of the production process and assembled in various ways to produce final products which are differentiated by quality or variety in order to meet the demands of specific consumers / markets. This internationalisation of the production process at the regional / global levels is generating rising levels of intra-industry and intra-firm trade, with a country’s exports of a given industry increasingly dependent on imports of intermediate goods which are either produced by the same industry or by a subsidiary of the same multinational. This section will look at this phenomenon by firstly providing an overview of world trade in intermediate goods; secondly by examining in detail the specific example of China and its similarities with the EU10 grouping; and finally by giving an overview of services outsourcing. For the purpose of the present analysis, the world is split into the following 10 countries / country groupings: namely the EU15, EU10, US, Japan, China, India, EU neighbours2, Americas (excl. US)3, South East Asia (excl. China)4 and the rest of the world5. 2.1 : Overview of trade by stage of production at the world level (Goods Outsourcing) Recent decades have witnessed an increasing trend towards the re-organisation of the value added chain of companies in the direction of worldwide structures. This increasing international division of production processes has been especially evident in many segments of the ICT and automobile industries and, as mentioned earlier, has been a key driver of recent trade integration at the global level. While an analysis of trade in intermediate products is a widely used approach for measuring the scale and nature of this production “outsourcing”6, there are a number of methods to choose from in carrying out such an analysis. For example, business surveys and input-output tables can be used to measure trade
2 Includes North Africa, the Middle East, non-EU central and eastern Europe, Turkey, countries of the ex-USSR, Switzerland, Norway and Iceland. 3 All of North and South America and the Caribbean (excluding the US). 4 All of South East Asia (excl. China) plus Australia and New Zealand. 5 All other countries not elsewhere specified. 6 The term “outsourcing” is used here to encompass the phenomenon of external outsourcing (i.e. contracting out of a range of economic activities to external suppliers) and also the notion of “offshoring” where firms locate parts of their activities abroad by setting up subsidiaries.
- 6 -
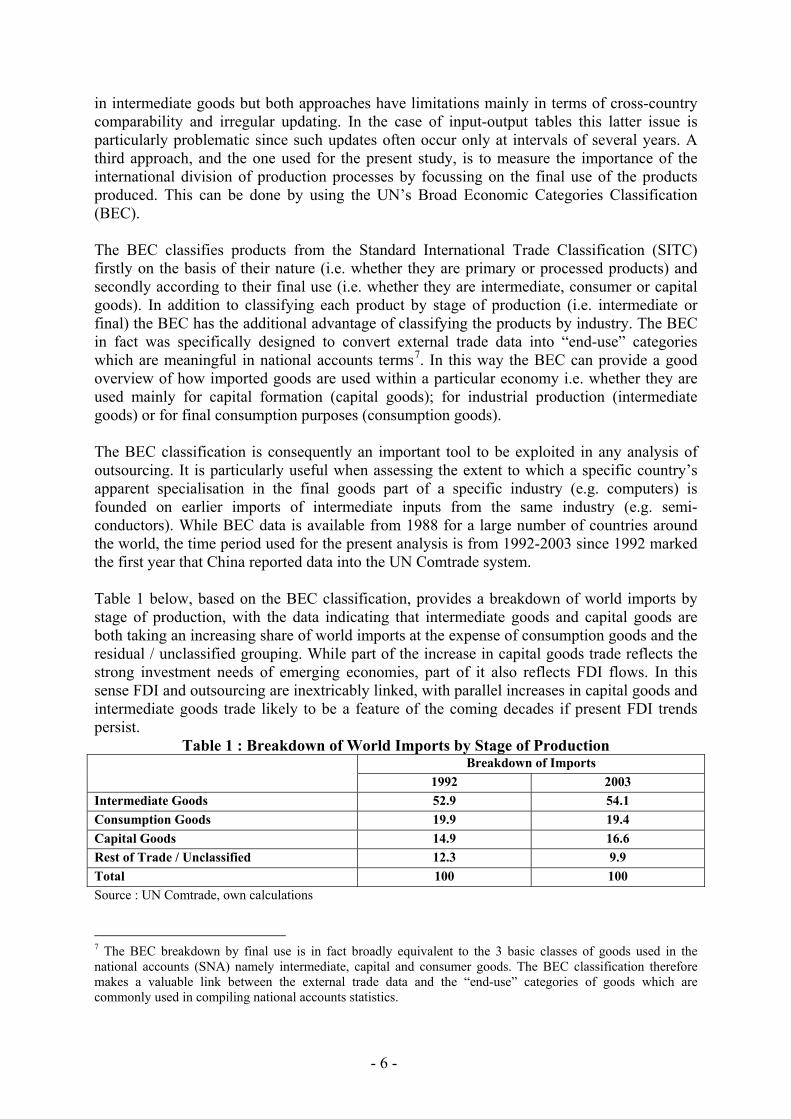
in intermediate goods but both approaches have limitations mainly in terms of cross-country comparability and irregular updating. In the case of input-output tables this latter issue is particularly problematic since such updates often occur only at intervals of several years. A third approach, and the one used for the present study, is to measure the importance of the international division of production processes by focussing on the final use of the products produced. This can be done by using the UN’s Broad Economic Categories Classification (BEC). The BEC classifies products from the Standard International Trade Classification (SITC) firstly on the basis of their nature (i.e. whether they are primary or processed products) and secondly according to their final use (i.e. whether they are intermediate, consumer or capital goods). In addition to classifying each product by stage of production (i.e. intermediate or final) the BEC has the additional advantage of classifying the products by industry. The BEC in fact was specifically designed to convert external trade data into “end-use” categories which are meaningful in national accounts terms7. In this way the BEC can provide a good overview of how imported goods are used within a particular economy i.e. whether they are used mainly for capital formation (capital goods); for industrial production (intermediate goods) or for final consumption purposes (consumption goods). The BEC classification is consequently an important tool to be exploited in any analysis of outsourcing. It is particularly useful when assessing the extent to which a specific country’s apparent specialisation in the final goods part of a specific industry (e.g. computers) is founded on earlier imports of intermediate inputs from the same industry (e.g. semi-conductors). While BEC data is available from 1988 for a large number of countries around the world, the time period used for the present analysis is from 1992-2003 since 1992 marked the first year that China reported data into the UN Comtrade system. Table 1 below, based on the BEC classification, provides a breakdown of world imports by stage of production, with the data indicating that intermediate goods and capital goods are both taking an increasing share of world imports at the expense of consumption goods and the residual / unclassified grouping. While part of the increase in capital goods trade reflects the strong investment needs of emerging economies, part of it also reflects FDI flows. In this sense FDI and outsourcing are inextricably linked, with parallel increases in capital goods and intermediate goods trade likely to be a feature of the coming decades if present FDI trends persist.
Table 1 : Breakdown of World Imports by Stage of Production Breakdown of Imports
1992 2003 Intermediate Goods 52.9 54.1 Consumption Goods 19.9 19.4 Capital Goods 14.9 16.6 Rest of Trade / Unclassified 12.3 9.9 Total 100 100 Source : UN Comtrade, own calculations 7 The BEC breakdown by final use is in fact broadly equivalent to the 3 basic classes of goods used in the national accounts (SNA) namely intermediate, capital and consumer goods. The BEC classification therefore makes a valuable link between the external trade data and the “end-use” categories of goods which are commonly used in compiling national accounts statistics.
- 7 -
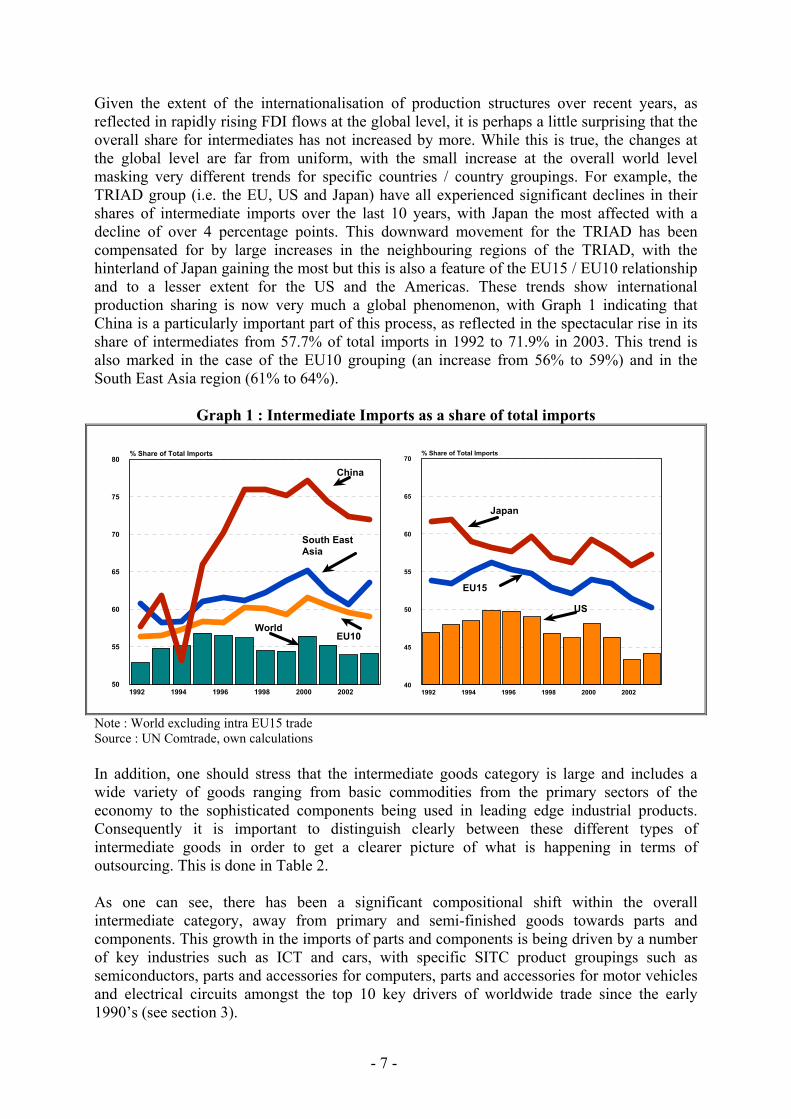
Given the extent of the internationalisation of production structures over recent years, as reflected in rapidly rising FDI flows at the global level, it is perhaps a little surprising that the overall share for intermediates has not increased by more. While this is true, the changes at the global level are far from uniform, with the small increase at the overall world level masking very different trends for specific countries / country groupings. For example, the TRIAD group (i.e. the EU, US and Japan) have all experienced significant declines in their shares of intermediate imports over the last 10 years, with Japan the most affected with a decline of over 4 percentage points. This downward movement for the TRIAD has been compensated for by large increases in the neighbouring regions of the TRIAD, with the hinterland of Japan gaining the most but this is also a feature of the EU15 / EU10 relationship and to a lesser extent for the US and the Americas. These trends show international production sharing is now very much a global phenomenon, with Graph 1 indicating that China is a particularly important part of this process, as reflected in the spectacular rise in its share of intermediates from 57.7% of total imports in 1992 to 71.9% in 2003. This trend is also marked in the case of the EU10 grouping (an increase from 56% to 59%) and in the South East Asia region (61% to 64%).
Graph 1 : Intermediate Imports as a share of total imports
1992 1994 1996 1998 2000 200250
55
60
65
70
75
80% Share of Total Imports
EU10
South East Asia
China
World
1992 1994 1996 1998 2000 200240
45
50
55
60
65
70% Share of Total Imports
EU15
US
Japan
Note : World excluding intra EU15 trade Source : UN Comtrade, own calculations
In addition, one should stress that the intermediate goods category is large and includes a wide variety of goods ranging from basic commodities from the primary sectors of the economy to the sophisticated components being used in leading edge industrial products. Consequently it is important to distinguish clearly between these different types of intermediate goods in order to get a clearer picture of what is happening in terms of outsourcing. This is done in Table 2. As one can see, there has been a significant compositional shift within the overall intermediate category, away from primary and semi-finished goods towards parts and components. This growth in the imports of parts and components is being driven by a number of key industries such as ICT and cars, with specific SITC product groupings such as semiconductors, parts and accessories for computers, parts and accessories for motor vehicles and electrical circuits amongst the top 10 key drivers of worldwide trade since the early 1990’s (see section 3).

- 8 -
Table 2 : Further Breakdown of World Intermediate Imports Breakdown of Imports
1992 2003
Primary Goods 20.2 19.5
Parts and Components 28.1 34.1
Semi-Finished Goods 51.7 46.4
Total Intermediate Goods 100 100
Source : UN Comtrade, own calculations
G oods O utsourc ing
Increase in w orld im ports o f in term ediate goods (especia lly parts &
com ponents ) and capita l goods + R is ing levels o f in tra -industry & in tra -firm trade
Trade flow s being driven by the in ternationalisation o f production
structures & the rise in g lobal FD I flow s
S harp increase in com plem entary , tw o -w ay, trade flow s betw een developed &
developing countries(S hare o f in term ediate im ports in to tal
im ports is fa lling in E U 15, U S and Japan , w h ils t ris ing in the ir less advanced
reg ional partners )
G oods outsourc ing is a particu lar feature o f the IC T & car industries
2.2 : China’s role in the international production chain– Are there similarities with the EU10 member states ?
An analysis of trade by stages of production can be used to underline the comparative advantages of the different countries / country groupings in the international division of labour. The previous section has established that whilst the overall shift in trade patterns towards intermediates has been relatively small at the global level, it has been much more marked in particular geographical areas such as China and the EU10 countries and in particular types of intermediates (such as parts and components) and industries (ICT and cars). The present section will deepen this analysis by looking at the specific example of China and of its respective comparative advantage in the different stages of the production of traded goods. This analysis is intended to highlight the role which China plays in the splitting of the international value added chain and of the role which FDI has played in enabling such a process of vertical specialisation. To emphasise the strong regional element to this process as well as the clear complementarities between developed and developing economies, parallels are also drawn between the experience of China and that of the EU10 group of countries. Table 3 gives a breakdown of Chinese exports and imports by stage of production. On the imports side, it shows a sharp increase in the share of intermediate goods in total imports, with this increase being mainly driven by a more than doubling in the import share of parts and components. This increase is clearly linked with the dramatic growth in FDI flows into China over recent years as foreign firms invested heavily to avail of the large supplies of

- 9 -
relatively cheap labour. These FDI flows are rapidly changing the structure of Chinese trade, away from a model based on the importation of raw materials and the exportation of final goods to one driven by specialisation in the different stages of the production of specific product groupings.
Table 3 : China's Trade Patterns and Comparative Advantage by Stage of Production % Breakdown of
Imports* % Breakdown of
Exports* Actual trade balance
(% of GDP) 1992 2003 1992 2003 1992 2003
Intermediate Goods 57.7 71.9 29.5 38.1 -5.1 -8.0 (Primary Goods) (8.1) (11.8) (7.6) (2.6) (0.1) (-2.3)
(Parts and Components) (11.3) (28.3) (3.1) (15.9) (-1.8) (-2.9) (Semi-Finished Goods) (38.7) (31.9) (18.3) (19.6) (-4.0) (-2.8)
Final Goods 23.9 25.3 46.5 60.8 4.9 10.0 (Consumption) (3.6) (3.5) (40.1) (36.6) (7.5) (9.0)
(Capital) (20.2) (21.8) (6.4) (24.2) (-2.6) (1.0) Total 100 100 100 100 1.0 1.6 * Individual components do not add up to 100 since “unclassified” goods are not included in the table. In addition, some of the records for China in 1992 are incomplete, with the result that the sub-totals do not always sum up to the total for that specific year. Source : UN Comtrade, own calculations Table 3 indicates China’s role in the international division of labour. China’s comparative advantage lies in the downstream stages of production (i.e. final goods), with the upstream stages (i.e. intermediate goods) displaying large structural deficits. With China’s position changing in this way from comparative advantage to disadvantage depending on the stage of production, vertical specialisation is clearly a hallmark of the Chinese development model. Within the international division of labour, China specialises in the processing and assembly of a wide range of intermediate goods, most notably parts and components and semi-finished goods but also more recently a range of basic materials. The large structural deficits in all areas of intermediate trade and surpluses in both categories of final goods, i.e. consumption and capital goods, suggests China is essentially an assembly country, a position which is similar to a large number of other low-wage South East Asian economies.
Graph 2a: China’s overall trade in intermediate goods by main trading partners
(Trade Balances as a % of GDP)
0
2
-2
-4
-6
% of GDP
B92-97 B98-03
South East Asia (Excl China)
US
EU10
EU Neighbours Japan
EU15
World

- 10 -
Graph 2b: China’s overall trade in consumer goods by main trading partners (Trade Balances as a % of GDP)
0
2
4
6
8
10% of GDP
B92-97 B98-03
South East Asia (Excl China)
US
EU10
EU Neighbours
JapanEU15
World
Graph 2c: China’s overall trade in capital goods by main trading partners (Trade Balances as a % of GDP)
0
1
2
-1
-2
-3
% of GDP
B92-97 B98-03
South East Asia (Excl China)
USEU10
EU Neighbours
JapanEU15
World
Source : UN Comtrade, own calculations
While the overall nature of China’s role in the internationalisation of production structures is relatively clear from Table 3, what is less clear is the bilateral dimension. Graphs 2a-2c give a breakdown of Chinese trade by main trading partners as well as by stage of production. The graphs make a number of important points :
• Firstly, while China has deficits in its trade in intermediate goods with all areas of the world, in terms of parts and components and semi-finished goods, there is a relatively heavy concentration of such trade with Japan and other South East Asian countries. This pattern would suggest that production sharing is characterised by a strong regional dimension.
• Secondly, China has trade surpluses in consumer goods with all of its main trading
partners but, as with intermediate goods, there is evidence of geographical asymmetries. China has large trade surpluses, of the order of 2% of GDP, with Japan, South East Asia and the US, with a surplus of around 1% with the EU15 and much smaller surpluses in the case of the EU neighbours and EU10 regions.
• Thirdly, the recent shift towards structural surpluses in capital goods suggests that
China is beginning to move up the value added chain. Such a move should be of concern to the TRIAD group since they traditionally have had a comparative advantage in the production of such goods. Graph 2c highlights the danger for the more developed economies from the upgrading of China’s export capacities towards

- 11 -
more high skilled and technology intensive capital goods. In the case of the EU, the strong surplus in its trade with China in such products has been wiped out over recent years. Japan’s surplus has been more than halved and the US has gone from surplus to deficit over the course of the period as a whole. Regarding the US, interpreting the factors driving the shift to deficits in capital goods is difficult since part of it undoubtedly reflects China’s specialisation in the labour intensive stages of the production of such goods. This is a feature of a range of US dominated high technology product areas, most notably in the ICT sector, with the US supplying the capital and skill intensive parts and components from its South East Asian production sites as well as the imported technology, and with China doing the final processing and assembling. These patterns are reflected in the Morgan Stanley estimate that 60% of the US trade deficit with China is due to imports from subsidiaries of US firms.
• Finally, the analysis for China highlights the gains which can be derived from trade
in intermediate goods. This vertical specialisation model has been driven by both strong production complementarities between China and other developed Asian economies and by large amounts of vertical FDI flows sourced from all around the globe. Both these interlinked trends have resulted in a large shift, over a relatively short period of time, in China’s role in the global production chain and in its range of comparative advantages.
Are there similarities with the EU10 Member States ? While differences clearly exist between the evolution of China and the EU10 group of countries since the early 1990’s, there are also considerable similarities. As with China, the structure of EU10 trade by stage of production indicates that intermediate goods are by far the largest component of trade and that their importance is growing over time (table 4). This suggests that, like China, the EU10 countries are increasing their degree of participation in the international division of the production process, with the actual trade deficit in intermediate goods as a % of GDP rising from 2.2% in 1992 to 5.7% in 2003. In terms of industrial specialisations, the EU10 grouping is characterised by comparative advantages in consumption goods and broad balance in parts and components, with comparative disadvantages in semi-finished goods, basic materials and capital goods.
Table 4 : EU10's Trade Patterns and Comparative Advantage by Stage of Production
% Breakdown of Imports*
% Breakdown of Exports*
Actual trade balance (% of GDP)
1992 2003 1992 2003 1992 2003
Intermediate Goods 56.4 59.0 52.7 54.3 -2.2 -5.7 (Primary Goods) (13.6) (8.2) (10.1) (3.2) (-1.0) (-2.5)
(Parts and Components) (10.4) (19.5) (11.3) (22.9) (-0.2) (0.0) (Semi-Finished Goods) (32.3) (31.3) (31.3) (28.2) (-1.1) (-3.3)
Final Goods 35.9 34.5 40.0 36.5 -0.3 -1.4 (Consumption) (18.4) (15.9) (31.5) (21.0) (1.7) (1.0)
(Capital) (17.5) (18.6) (8.5) (15.5) (-2.0) (-2.4) Total 100 100 100 100 -2.8 -6.6 *Individual components do not add up to 100 since “unclassified” goods are not included in the table. Source: UN Comtrade, own calculations

- 12 -
Graph 3a: EU10’s overall trade in intermediate goods by main trading partners
(Trade Balances as a % of GDP)
0
-2
-4
-6
-8
% of GDP
B92-97 B98-03
South East Asia (Excl China)
USChina
EU Neighbours
Japan
EU15
World
Graph 3b: EU10’s overall trade in consumer goods by main trading partners (Trade Balances as a % of GDP)
0
0,5
1
1,5
2
-0,5
-1
% of GDP
B92-97 B98-03
South East Asia (Excl China)
US
China
EU Neighbours
Japan
EU15
World
Graph 3c: EU10’s overall trade in capital goods by main trading partners (Trade Balances as a % of GDP)
0
1
2
-1
-2
-3
% of GDP
B92-97 B98-03
South East Asia (Excl China)
USChina
EU Neighbours
Japan
EU15
World
Source : UN Comtrade, own calculations

- 13 -
Graphs 3a to 3c underline the striking regional dimension to the EU10’s trade patterns. This is much more pronounced compared with the pattern described earlier for China. In all stages of production, the EU15 or the EU neighbours group dominate the overall trends. This pattern of trade confirms the point made earlier in relation to China that production sharing has a strong geographical dimension, with a similar complementarity in Europe between the EU10, EU15 and EU neighbours grouping as already demonstrated between China, S. E. Asia and Japan. Finally, graphs 3a-3c also point to the growing challenge to the EU10 countries from China in all stages of production, with the EU10 grouping registering a deterioration in intermediates, consumption and capital goods over recent years. This growing vulnerability of the EU10 countries to competition from China is not that surprising given that both their specialisations lie in areas of trade which have similar skill and factor intensities. This latter point is discussed in some detail in Section 3 where it is shown that China has strengths in the labour intensive stages of the production process of a wide range of low technology goods as well as in the production of ICT-related products. The EU10 group is also specialised in the production of low technology, labour intensive, goods as well as in some capital intensive, medium technology, industries such as motor vehicles.
China’s Role in the International Value Added Chain
Similarities in Roles of China + EU10 countries in Global Production Networks
1992-2003
Sharp increase in share of intermediate goods in total
Chinese imports (More than doubling in the
import share of parts & components)
China’s vertical specialisation model focusses on the labour intensive stages of production and is driven by both strong
production complementarities between itself & other
developed Asian economies & by large amounts of vertical FDI flows sourced from all
around the world
Global Production Chains – Role of China + EU10
China’s comparative advantage lies in the
downstream / assembly stages of production – Within the international division of labour, China specialises in
the processing and assembly of a wide range of
intermediate goods
Intermediate goods are by far the largest
component of overall trade for both China &
EU10
Both are increasing their degree of
participation in the international division of production processes (in terms of both trade
& FDI flows)
Production sharing has a strong regional dimension, with a
similar complementarity in Europe between the
EU10, EU15 & EU neighbours grouping
as between China, S.E.Asia & Japan
Both China & EU10 specialise in areas of
trade which have similar skill & factor intensities (strong
competitors)
- 14 -
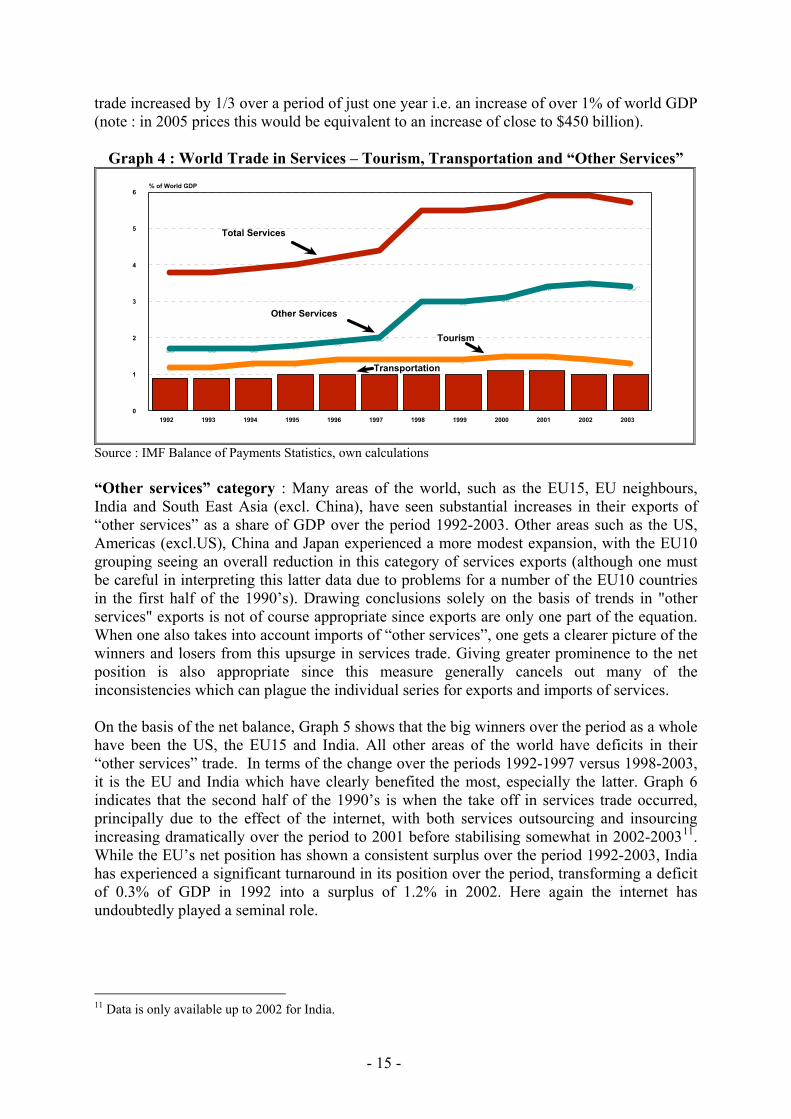
2.3 : Services Outsourcing With the growing tradability of large parts of the service economy, fears are escalating regarding the ongoing viability of a range of labour intensive service sectors in the developed world. Are these fears well founded based on an assessment of trends since the early 1990’s and is the EU15 a net gainer or loser from the services “outsourcing” which has already taken place ? Before proceeding to an assessment of the basic data, a number of important distinctions compared with the goods outsourcing analysis (given in 2.2) need to be pointed out. Firstly, unlike for goods outsourcing, internationally consistent bilateral service flows are not available for all countries. Secondly, it is also not possible to break down the detailed services trade for some of the country groupings into their intra- and extra- area components. Such breakdowns are however available from Eurostat for intra- and extra- EU15 services trade – see Annex 68. This Eurostat data is an important source of information since one is primarily interested, given the focus on globalisation, on the EU’s performance in extra-EU15 markets. Finally, the level of detail is substantially less compared with trade in goods, with total services trade only being broken down into 11 broad categories9 compared with the 266 product groupings used in the analysis in section 3 of this paper. In addition, while data is available for total service exports (i.e. insourcing) and imports (i.e. outsourcing) for all of the 184 countries, the degree of additional detail varies enormously across countries, with for example data for all 11 categories of services only being available for a small sample of the 184 countries surveyed. IMF balance of payments statistics are used for the analysis, with the data taken from the IFS (International Financial Statistics) databank. This data source is supplemented at the EU level with data from Eurostat (see annex 6). Overall trade in services : Graph 4 shows that global trade in services has being growing rapidly over the period 1992-2003, especially since the mid-1990’s. In fact services have been growing at rates similar to that of goods and consequently much faster than GDP. As a % of GDP, services trade rose from 3.8% of world GDP in 1992 to 5.9% in 2002 before declining slightly to 5.7% in 2003. Regarding the 3-way breakdown of services trade shown in the graph, while tourism and transportation have both only being growing at rates similar to GDP over this period, the big growth area has been in the “other services” category, which includes a wide variety of business related services. The remainder of this section focuses on this very dynamic “other services” category since it is here that one finds the type of services which are most relevant for the outsourcing debate. It is also the area where tradeables has been transformed due to the expanding influence of the internet10, with graph 4 showing the level shift occasioned by the worldwide coming on stream of the internet, when "other services"
8 Annex 6 provides some data for the intra/extra EU15 split using Eurostat data. This data shows that the EU has always had a surplus on its total services trade (i.e. transportation + tourism + "other services") with extra-EU15 markets over the period 1992-2003 and that this surplus has increased significantly over recent years due a growing contribution from the "other services" category which is essentially composed of business-related services. The EU has been in broad balance with respect to transportation and tourism services. 9 Total services trade is broken down into transportation, travel and tourism and other services. Other services is in turn broken down into 9 sub-components (communications, construction, insurance, financial, computer and information, royalties and license fees, other business services, personal and cultural, and government). 10 While the internet was formally initiated by CERN in 1991, with the launching of the new World Wide Web project, many commentators feel that the real influence of the internet was only discernible after the mid-1990's once all the basic interconnections and routing policies had been established / agreed in the intervening years.
- 15 -
trade increased by 1/3 over a period of just one year i.e. an increase of over 1% of world GDP (note : in 2005 prices this would be equivalent to an increase of close to $450 billion).
Graph 4 : World Trade in Services – Tourism, Transportation and “Other Services”
1992 1993 1994 1995 1996 1997 1998 1999 2000 2001 2002 20030
1
2
3
4
5
6% of World GDP
Total Services
Transportation
Tourism
Other Services
Source : IMF Balance of Payments Statistics, own calculations “Other services” category : Many areas of the world, such as the EU15, EU neighbours, India and South East Asia (excl. China), have seen substantial increases in their exports of “other services” as a share of GDP over the period 1992-2003. Other areas such as the US, Americas (excl.US), China and Japan experienced a more modest expansion, with the EU10 grouping seeing an overall reduction in this category of services exports (although one must be careful in interpreting this latter data due to problems for a number of the EU10 countries in the first half of the 1990’s). Drawing conclusions solely on the basis of trends in "other services" exports is not of course appropriate since exports are only one part of the equation. When one also takes into account imports of “other services”, one gets a clearer picture of the winners and losers from this upsurge in services trade. Giving greater prominence to the net position is also appropriate since this measure generally cancels out many of the inconsistencies which can plague the individual series for exports and imports of services. On the basis of the net balance, Graph 5 shows that the big winners over the period as a whole have been the US, the EU15 and India. All other areas of the world have deficits in their “other services” trade. In terms of the change over the periods 1992-1997 versus 1998-2003, it is the EU and India which have clearly benefited the most, especially the latter. Graph 6 indicates that the second half of the 1990’s is when the take off in services trade occurred, principally due to the effect of the internet, with both services outsourcing and insourcing increasing dramatically over the period to 2001 before stabilising somewhat in 2002-200311. While the EU’s net position has shown a consistent surplus over the period 1992-2003, India has experienced a significant turnaround in its position over the period, transforming a deficit of 0.3% of GDP in 1992 into a surplus of 1.2% in 2002. Here again the internet has undoubtedly played a seminal role.
11 Data is only available up to 2002 for India.

- 16 -
Graph 5 : Net balance on trade in “other services” : 1992-1997 Vs 1998-2003
(% of GDP)
USA
EU15
India
EU10
Americas (excl USA)
EU Neighbours
Japan
China
SE_Asia excl China
0 0,5 1-0,5-1
% of GDP
1992-1997
1998-2003
1998-20031992-1997
Source : IMF Balance of Payments Statistics, own calculations
Graph 6 : Other Services Exports, Imports and Net Position : EU15 Vs India
1992 1994 1996 1998 2000 2002
0
1
2
3
4
-1
-2
-3
% of GDP
Travel
Total Services
Other Services
1992 1994 1996 1998 2000 2002
0
2
4
6
-2
-4
-6
% of GDP
Other Services Exports("Insourcing")
Other Services Imports("Outsourcing")
Net Position
IndiaEU15
Other Services Exports("Insourcing")
Net Position
Other Services Imports("Outsourcing")
Source : IMF Balance of Payments Statistics, own calculations Decomposition of “other services” category : Given that the “other services” category is driving overall services trade growth, a further breakdown is necessary in order to isolate the types of services which are contributing to this overall upward movement. Table 5 gives a breakdown of the shares of all the different types of services in overall services trade for the EU, India and the world as a whole. It confirms the declining shares of transportation and
- 17 -
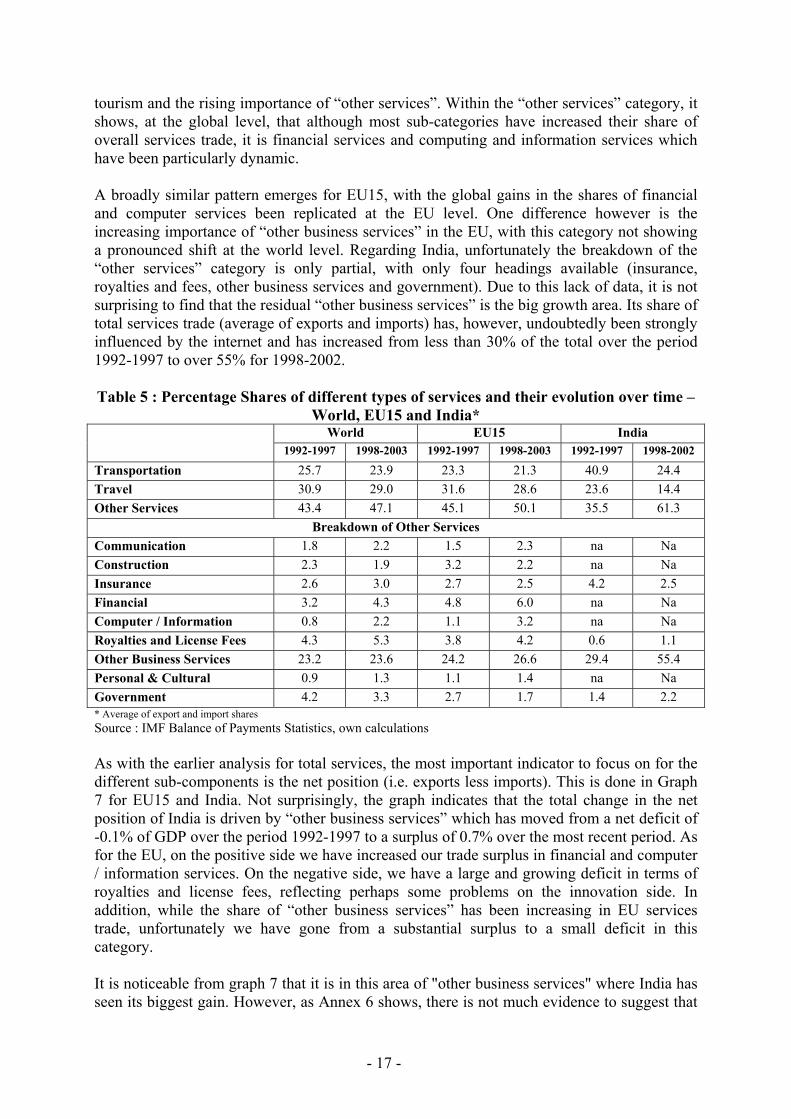
tourism and the rising importance of “other services”. Within the “other services” category, it shows, at the global level, that although most sub-categories have increased their share of overall services trade, it is financial services and computing and information services which have been particularly dynamic. A broadly similar pattern emerges for EU15, with the global gains in the shares of financial and computer services been replicated at the EU level. One difference however is the increasing importance of “other business services” in the EU, with this category not showing a pronounced shift at the world level. Regarding India, unfortunately the breakdown of the “other services” category is only partial, with only four headings available (insurance, royalties and fees, other business services and government). Due to this lack of data, it is not surprising to find that the residual “other business services” is the big growth area. Its share of total services trade (average of exports and imports) has, however, undoubtedly been strongly influenced by the internet and has increased from less than 30% of the total over the period 1992-1997 to over 55% for 1998-2002. Table 5 : Percentage Shares of different types of services and their evolution over time –
World, EU15 and India* World EU15 India
1992-1997 1998-2003 1992-1997 1998-2003 1992-1997 1998-2002
Transportation 25.7 23.9 23.3 21.3 40.9 24.4 Travel 30.9 29.0 31.6 28.6 23.6 14.4 Other Services 43.4 47.1 45.1 50.1 35.5 61.3
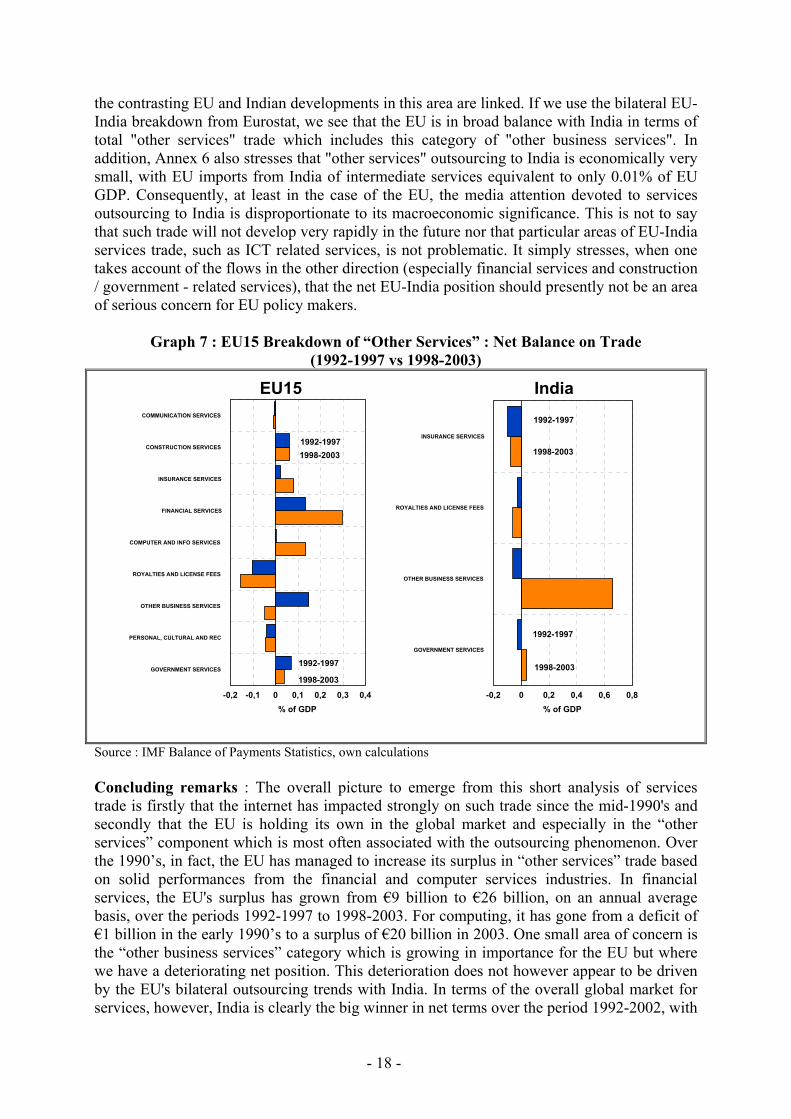
Breakdown of Other Services Communication 1.8 2.2 1.5 2.3 na Na Construction 2.3 1.9 3.2 2.2 na Na Insurance 2.6 3.0 2.7 2.5 4.2 2.5 Financial 3.2 4.3 4.8 6.0 na Na Computer / Information 0.8 2.2 1.1 3.2 na Na Royalties and License Fees 4.3 5.3 3.8 4.2 0.6 1.1 Other Business Services 23.2 23.6 24.2 26.6 29.4 55.4 Personal & Cultural 0.9 1.3 1.1 1.4 na Na Government 4.2 3.3 2.7 1.7 1.4 2.2 * Average of export and import shares Source : IMF Balance of Payments Statistics, own calculations As with the earlier analysis for total services, the most important indicator to focus on for the different sub-components is the net position (i.e. exports less imports). This is done in Graph 7 for EU15 and India. Not surprisingly, the graph indicates that the total change in the net position of India is driven by “other business services” which has moved from a net deficit of -0.1% of GDP over the period 1992-1997 to a surplus of 0.7% over the most recent period. As for the EU, on the positive side we have increased our trade surplus in financial and computer / information services. On the negative side, we have a large and growing deficit in terms of royalties and license fees, reflecting perhaps some problems on the innovation side. In addition, while the share of “other business services” has been increasing in EU services trade, unfortunately we have gone from a substantial surplus to a small deficit in this category. It is noticeable from graph 7 that it is in this area of "other business services" where India has seen its biggest gain. However, as Annex 6 shows, there is not much evidence to suggest that
- 18 -
the contrasting EU and Indian developments in this area are linked. If we use the bilateral EU-India breakdown from Eurostat, we see that the EU is in broad balance with India in terms of total "other services" trade which includes this category of "other business services". In addition, Annex 6 also stresses that "other services" outsourcing to India is economically very small, with EU imports from India of intermediate services equivalent to only 0.01% of EU GDP. Consequently, at least in the case of the EU, the media attention devoted to services outsourcing to India is disproportionate to its macroeconomic significance. This is not to say that such trade will not develop very rapidly in the future nor that particular areas of EU-India services trade, such as ICT related services, is not problematic. It simply stresses, when one takes account of the flows in the other direction (especially financial services and construction / government - related services), that the net EU-India position should presently not be an area of serious concern for EU policy makers.
Graph 7 : EU15 Breakdown of “Other Services” : Net Balance on Trade
(1992-1997 vs 1998-2003)
COMMUNICATION SERVICES
CONSTRUCTION SERVICES
INSURANCE SERVICES
FINANCIAL SERVICES
COMPUTER AND INFO SERVICES
ROYALTIES AND LICENSE FEES
OTHER BUSINESS SERVICES
PERSONAL, CULTURAL AND REC
GOVERNMENT SERVICES
0 0,1 0,2 0,3 0,4-0,1-0,2% of GDP
1992-19971998-2003
1998-2003
1992-1997
INSURANCE SERVICES
ROYALTIES AND LICENSE FEES
OTHER BUSINESS SERVICES
GOVERNMENT SERVICES
0 0,2 0,4 0,6 0,8-0,2% of GDP
1992-1997
1992-1997
1998-2003
1998-2003
EU15 India
Source : IMF Balance of Payments Statistics, own calculations Concluding remarks : The overall picture to emerge from this short analysis of services trade is firstly that the internet has impacted strongly on such trade since the mid-1990's and secondly that the EU is holding its own in the global market and especially in the “other services” component which is most often associated with the outsourcing phenomenon. Over the 1990’s, in fact, the EU has managed to increase its surplus in “other services” trade based on solid performances from the financial and computer services industries. In financial services, the EU's surplus has grown from €9 billion to €26 billion, on an annual average basis, over the periods 1992-1997 to 1998-2003. For computing, it has gone from a deficit of €1 billion in the early 1990’s to a surplus of €20 billion in 2003. One small area of concern is the “other business services” category which is growing in importance for the EU but where we have a deteriorating net position. This deterioration does not however appear to be driven by the EU's bilateral outsourcing trends with India. In terms of the overall global market for services, however, India is clearly the big winner in net terms over the period 1992-2002, with
- 19 -
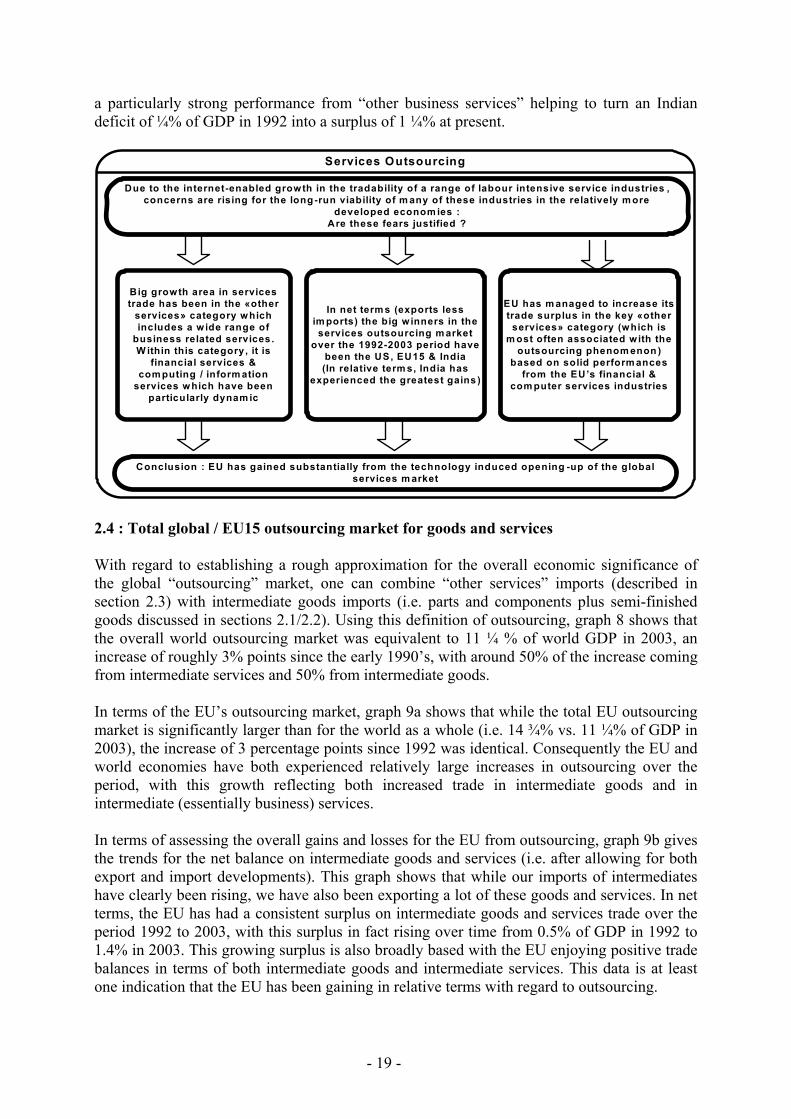
a particularly strong performance from “other business services” helping to turn an Indian deficit of ¼% of GDP in 1992 into a surplus of 1 ¼% at present.
Due to the internet-enabled growth in the tradability of a range of labour intensive service industries , concerns are rising for the long -run viability of m any of these industries in the relatively m ore
developed econom ies : Are these fears justified ?
Services Outsourcing
Big growth area in services trade has been in the «other
services» category which includes a wide range of
business related services. W ithin this category , it is
financial services & com puting / inform ation
services which have been particularly dynam ic
Conclusion : EU has gained substantially from the technology induced opening -up of the global services m arket
In net term s (exports less im ports) the big winners in the services outsourcing m arket
over the 1992-2003 period have been the US, EU15 & India (In relative term s, India has
experienced the greatest gains )
EU has m anaged to increase its trade surplus in the key «other
services» category (which is m ost often associated with the
outsourcing phenom enon ) based on solid perform ances
from the EU’s financial & com puter services industries
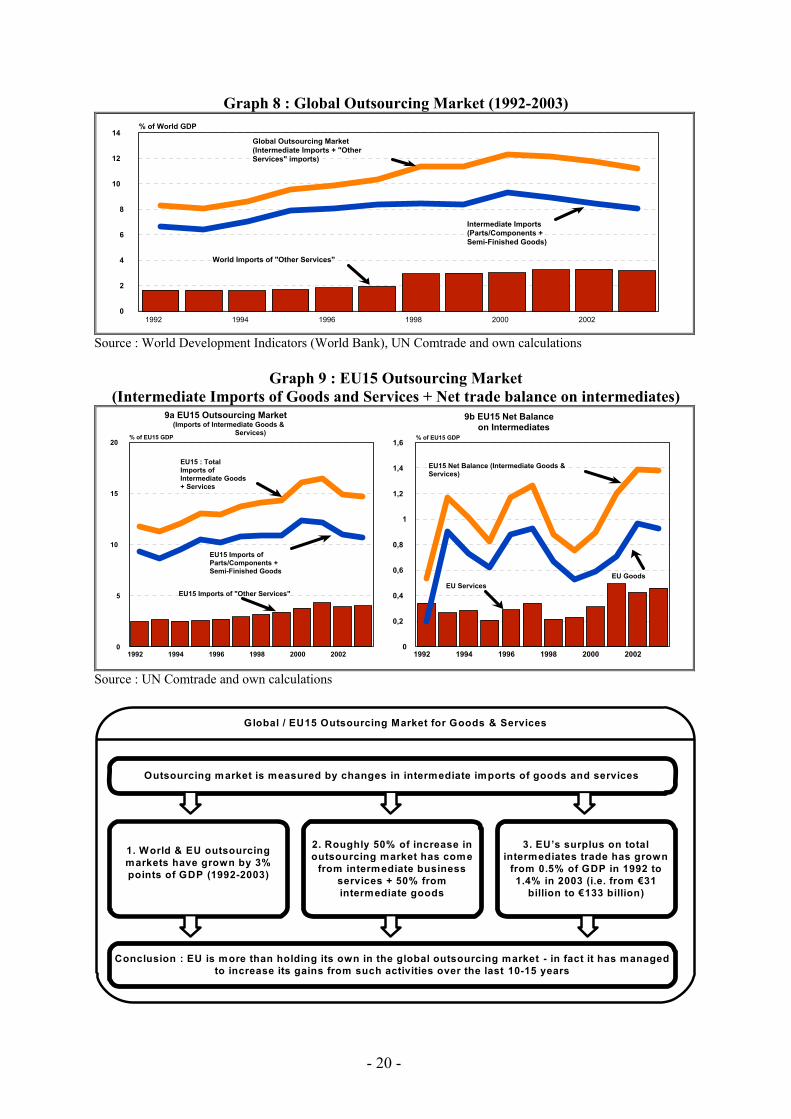
2.4 : Total global / EU15 outsourcing market for goods and services With regard to establishing a rough approximation for the overall economic significance of the global “outsourcing” market, one can combine “other services” imports (described in section 2.3) with intermediate goods imports (i.e. parts and components plus semi-finished goods discussed in sections 2.1/2.2). Using this definition of outsourcing, graph 8 shows that the overall world outsourcing market was equivalent to 11 ¼ % of world GDP in 2003, an increase of roughly 3% points since the early 1990’s, with around 50% of the increase coming from intermediate services and 50% from intermediate goods. In terms of the EU’s outsourcing market, graph 9a shows that while the total EU outsourcing market is significantly larger than for the world as a whole (i.e. 14 ¾% vs. 11 ¼% of GDP in 2003), the increase of 3 percentage points since 1992 was identical. Consequently the EU and world economies have both experienced relatively large increases in outsourcing over the period, with this growth reflecting both increased trade in intermediate goods and in intermediate (essentially business) services. In terms of assessing the overall gains and losses for the EU from outsourcing, graph 9b gives the trends for the net balance on intermediate goods and services (i.e. after allowing for both export and import developments). This graph shows that while our imports of intermediates have clearly been rising, we have also been exporting a lot of these goods and services. In net terms, the EU has had a consistent surplus on intermediate goods and services trade over the period 1992 to 2003, with this surplus in fact rising over time from 0.5% of GDP in 1992 to 1.4% in 2003. This growing surplus is also broadly based with the EU enjoying positive trade balances in terms of both intermediate goods and intermediate services. This data is at least one indication that the EU has been gaining in relative terms with regard to outsourcing.
- 20 -
Graph 8 : Global Outsourcing Market (1992-2003)
1992 1994 1996 1998 2000 20020
2
4
6
8
10
12
14% of World GDP
Global Outsourcing Market (Intermediate Imports + "Other Services" imports)
Intermediate Imports (Parts/Components + Semi-Finished Goods)
World Imports of "Other Services"
Source : World Development Indicators (World Bank), UN Comtrade and own calculations
Graph 9 : EU15 Outsourcing Market (Intermediate Imports of Goods and Services + Net trade balance on intermediates)
1992 1994 1996 1998 2000 20020
5
10
15
20% of EU15 GDP
9a EU15 Outsourcing Market (Imports of Intermediate Goods &
Services)
1992 1994 1996 1998 2000 20020
0,2
0,4
0,6
0,8
1
1,2
1,4
1,6% of EU15 GDP
9b EU15 Net Balance on Intermediates
EU15 Net Balance (Intermediate Goods & Services)
EU Services
EU15 : Total Imports of Intermediate Goods + Services
EU15 Imports of Parts/Components + Semi-Finished Goods
EU15 Imports of "Other Services"
EU Goods
Source : UN Comtrade and own calculations
Outsourcing market is measured by changes in intermediate imports of goods and services
1. World & EU outsourcing markets have grown by 3% points of GDP (1992-2003)
Global / EU15 Outsourcing Market for Goods & Services
Conclusion : EU is more than holding its own in the global outsourcing market - in fact it has managed to increase its gains from such activities over the last 10-15 years
2. Roughly 50% of increase in outsourcing market has come
from intermediate business services + 50% from intermediate goods
3. EU’s surplus on total intermediates trade has grown
from 0.5% of GDP in 1992 to 1.4% in 2003 (i.e. from €31
billion to €133 billion)
- 21 -
Section 3 : An assessment of the vulnerability of EU Industry
in this emerging “Global Factory”
Given the changing nature of global trading patterns, the rapid shifts in the revealed specialisations of different countries and the emergence of a number of large new trading powers, a key issue to be addressed in the present study is the extent to which the EU is responding to these developments. Is the EU displaying an ability to hold its own in this more challenging external environment or is the recent marked lack of dynamism in terms of intra-EU trade spilling over in terms of its world performance ? In carrying out such an analysis, the present section focuses on goods trade only. It will firstly examine the EU’s position in overall world markets; secondly, it will analyse its performance in particular high technology / skill intensive categories of trade; and finally, it will assess its performance in those specific product areas which have been driving world trade growth since the early 1990s.
3.1 : What's happening in terms of overall world markets ?
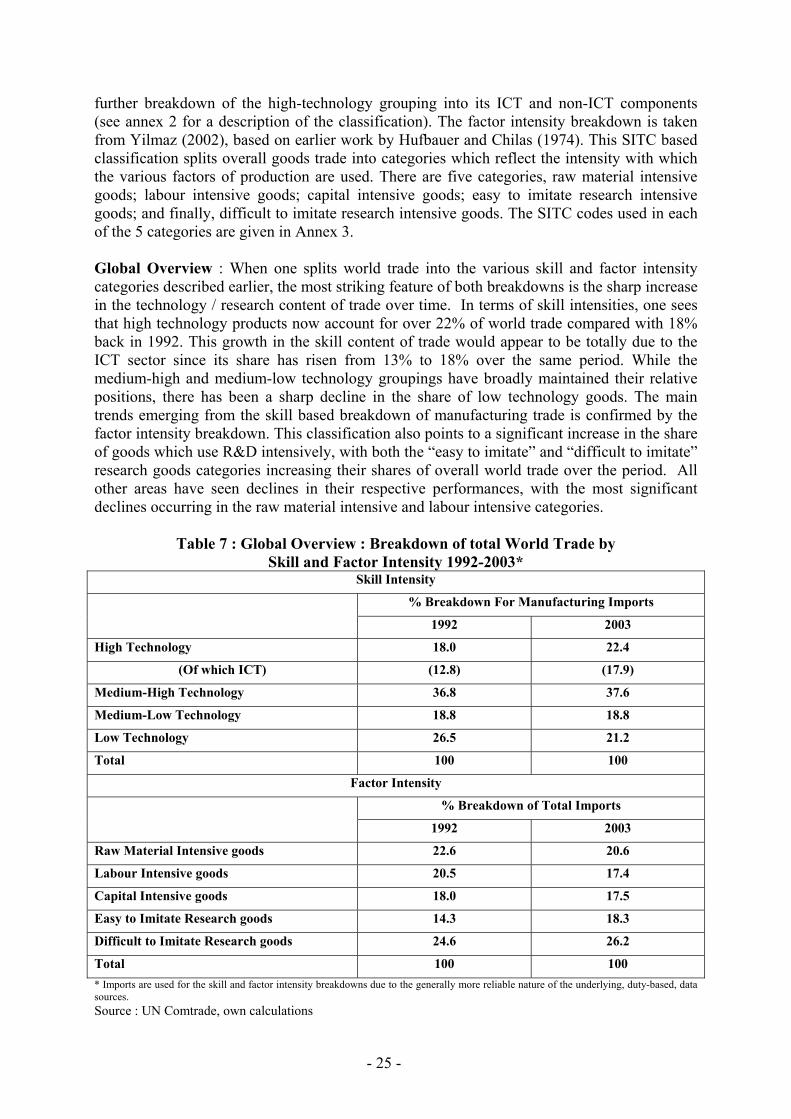
World trade has grown at an annual average rate of about 6% over the last 10-15 years. While overall EU15 trade has been running at considerably lower rates, this relatively poor performance essentially reflects a lack of buoyancy in intra-EU15 trade flows rather than problems at the extra-EU level, where growth rates are close to those of the world average. Consequently, at the extra-EU15 level, which is the area of focus for the present analysis, the EU15 countries have been largely holding their own. As indicated in graph 10, following a difficult period in the second half of the 1990’s, EU15 exporters started to regain market share after the year 2000, with the result that by 2003 its world market share was nearly a percentage point higher than that achieved back in 1992. This performance must also be seen in the light of the strong deterioration in the relative positions of the other TRIAD members, namely the US and Japan, with the world market shares of both of the latter falling by around 2 ½ % points over the period in question. Consequently, not only has the EU maintained its overall share of world trade, it has also consolidated its position as the number one global trading power, with the EU’s 1992 advantage compared with the US nearly doubling over the intervening period to 2003. With regard to the other world areas, the south east Asia (excl. China) region has performed broadly in line with that of the EU, with its world market share growing by about 1% point over the period as a whole. Bigger gainers include China (+ 4% points); the EU’s new member states (+ 2% points); and to a lesser extent the Americas and EU neighbours groupings, each with market share gains of about 1 ½ % points. While India is beginning to show some improvement in its world market position, the gains are still quite limited, at least on the goods side. In addition, India, with a goods market share of less than 1%, has undoubtedly a long way to go before becoming a major global trading power.

- 22 -
Graph 10 : World* Export Market Shares for the Different Countries / Country Groupings
1992 1994 1996 1998 2000 20026
8
10
12
14
16
18% Share of World Exports
South East Asia
EU15
1992 1994 1996 1998 2000 20020,4
2,4
4,4
6,4
8,4
10,4
% Share of World Exports
EU Neighbours
US
Japan
Americas (excl. US)
China
EU10
India
*World excl. intra EU15 trade Source : UN Comtrade, own calculations Export market shares are of course only one indicator of the health of the external sector. An assessment of developments on the import side and in terms of overall trade balances is also necessary. On the imports side, Table 6 shows that the EU, south East Asia and Japan experienced declines of between ½ - 1¼% points in their world shares. All other areas witnessed gains. While in most cases such gains reflected the stage of development of the particular area or the fact that intermediate imports were growing fast to feed buoyant export sectors, this was not the case for the US which was the only one of the nine groups which experienced sharply increasing import shares at the same time as its export performance was deteriorating. In terms of developments at the overall trade balance level, table 6 shows that the EU has remained in broad balance with the rest of the world over the 1992-1997 and 1998-2003 periods, with its position improving over time. The rest of the world is characterised by either large deficits or surpluses. On the surplus side, the EU neighbours and the Americas (excl. US) zones have seen large improvements in their trading positions over the decade, with surpluses of 1.7% and 2.5% respectively in 2003. The other big trading surpluses are registered in Asia where Japan, China and the rest of South East Asia all had large surpluses ranging from 1 ½% of GDP in China to 3% for South East Asia. In terms of deficits, India, the EU’s new member states and the US have consistently showed deficits over the period, with the EU10 and the US having external deficits in excess of 5% of GDP.
- 23 -
Table 6 : World export and import market shares and trade balances 1992-2003
1992 2003 Share of World
Exports
Share of World
Imports
Trade Balance
(% of GDP of Area)
Share of World
Exports
Share of World
Imports
Trade Balance
(% of GDP of Area)
EU15* 15.0 16.5 -0.9 15.9 15.8 -0.4
EU10 1.0 1.1 -2.8 2.8 3.1 -6.6
EU Neighbours 6.2 5.7 0.7 7.6 6.9 1.7
US 12.6 15.1 -1.7 10.2 17.7 -5.3
Americas (excl. US) 7.6 7.3 0.2 9.0 7.7 2.5
Japan 9.5 6.4 2.8 6.7 5.2 2.1
China 2.4 2.2 1.0 6.2 5.6 1.6
South East Asia (excl. China) 12.1 12.5 -2.1 13.3 11.9 3.1
India 0.6 0.7 -1.5 0.9 1.0 -2.2 * Extra-EU15. (Note : Columns do not sum to 100 since the rest of the world grouping and intra-EU15 trade is excluded). Source : UN Comtrade, own calculations
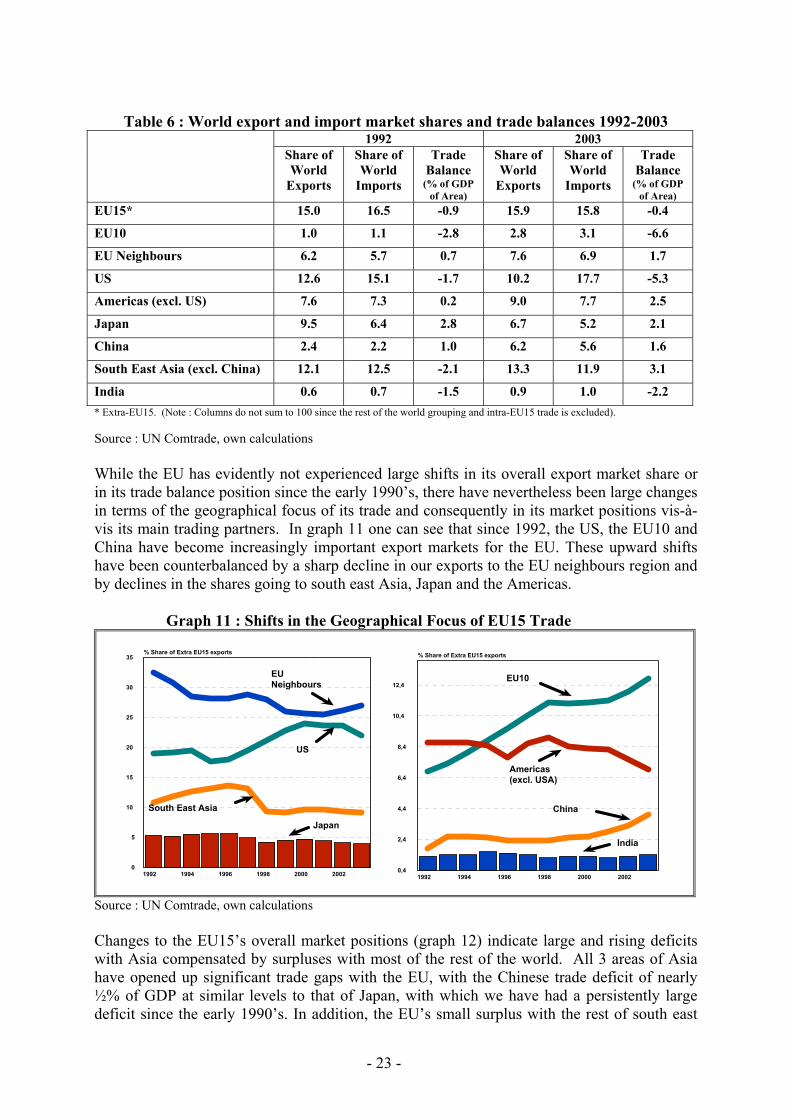
While the EU has evidently not experienced large shifts in its overall export market share or in its trade balance position since the early 1990’s, there have nevertheless been large changes in terms of the geographical focus of its trade and consequently in its market positions vis-à-vis its main trading partners. In graph 11 one can see that since 1992, the US, the EU10 and China have become increasingly important export markets for the EU. These upward shifts have been counterbalanced by a sharp decline in our exports to the EU neighbours region and by declines in the shares going to south east Asia, Japan and the Americas.
Graph 11 : Shifts in the Geographical Focus of EU15 Trade
1992 1994 1996 1998 2000 20020
5
10
15
20
25
30
35% Share of Extra EU15 exports
South East Asia
EU Neighbours
1992 1994 1996 1998 2000 20020,4
2,4
4,4
6,4
8,4
10,4
12,4
% Share of Extra EU15 exports
Americas (excl. USA)
US
Japan
EU10
China
India
Source : UN Comtrade, own calculations Changes to the EU15’s overall market positions (graph 12) indicate large and rising deficits with Asia compensated by surpluses with most of the rest of the world. All 3 areas of Asia have opened up significant trade gaps with the EU, with the Chinese trade deficit of nearly ½% of GDP at similar levels to that of Japan, with which we have had a persistently large deficit since the early 1990’s. In addition, the EU’s small surplus with the rest of south east

- 24 -
Asia in the 1992-1997 period has now been replaced with a deficit of about 0.3% of GDP. These negative developments at the bilateral level are to a large extent being offset at the aggregate level by the buoyancy of the US market where the EU has seen a sharp turnaround in its trading position. The new Member States, as well as the EU neighbours / Americas group of countries, also provide the EU with small but relatively stable trading surpluses.
Graph 12 : EU15 Trade Balances with World*
0
0,2
0,4
0,6
-0,2
-0,4
-0,6
% of GDP
B92-97 B98-03
Americas (Excl US)
China
South East Asia (Excl China)
US
India
EU10EU Neighbours
Japan
*World excl. intra EU15 trade Source : UN Comtrade, own calculations
E U 1 5 ’s s h a re o f o v e ra ll w o rld tra d e
E U h a s m a in ta in e d its o v e ra ll s h a re o f w o r ld tra d e + it h a s c o n s o lid a te d its p o s itio n a s th e n u m b e r 1 g lo b a l tra d in g
p o w e r(1 9 9 2 -2 0 0 3 )
W h ile th e E U h a s re m a in e d in b ro a d b a la n c e in its tra d e w ith th e re s t o f th e w o r ld
o v e r th e 1 9 9 2 -2 0 0 3 p e r io d , th e re h a v e b e e n la rg e c h a n g e s in its m a rk e t
p o s itio n s v is -a -v is in d iv id u a l tra d in g p a rtn e rs
C h a n g e s in th e E U ’s o v e ra ll m a rk e t p o s itio n s
in d ic a te la rg e & r is in g tra d e d e fic its w ith A s ia ,
c o m p e n s a te d b y s u rp lu s e s w ith m o s t o f th e
re s t o f th e w o rld
3.2 : Is Europe holding its own in the high technology / high skill intensive areas of world trade ? While the EU is managing to maintain its share of overall world markets, there are nevertheless concerns regarding its trading position with Asia, where it has large and growing trading deficits. The persistent nature of these deficits points to the possibility of structural deficiencies at the skill / technology levels (focus of the present section) or specific weaknesses in particularly dynamic product areas (3.3). In this context, Table 7 gives a breakdown of world trade based on classifications which focus on either the technology level of products or on the intensity with which they use different factors of production. The technology breakdown has been developed by the OECD and groups manufacturing industries according to their skill / technology content on the basis of the ISIC Rev 3 classification of industrial activities. Total manufacturing is classified into one of four categories: high-technology; medium-high technology; medium-low technology; or low-technology. In addition, using the OECD’s own definition of the ICT sector, it provides a
- 25 -
further breakdown of the high-technology grouping into its ICT and non-ICT components (see annex 2 for a description of the classification). The factor intensity breakdown is taken from Yilmaz (2002), based on earlier work by Hufbauer and Chilas (1974). This SITC based classification splits overall goods trade into categories which reflect the intensity with which the various factors of production are used. There are five categories, raw material intensive goods; labour intensive goods; capital intensive goods; easy to imitate research intensive goods; and finally, difficult to imitate research intensive goods. The SITC codes used in each of the 5 categories are given in Annex 3. Global Overview : When one splits world trade into the various skill and factor intensity categories described earlier, the most striking feature of both breakdowns is the sharp increase in the technology / research content of trade over time. In terms of skill intensities, one sees that high technology products now account for over 22% of world trade compared with 18% back in 1992. This growth in the skill content of trade would appear to be totally due to the ICT sector since its share has risen from 13% to 18% over the same period. While the medium-high and medium-low technology groupings have broadly maintained their relative positions, there has been a sharp decline in the share of low technology goods. The main trends emerging from the skill based breakdown of manufacturing trade is confirmed by the factor intensity breakdown. This classification also points to a significant increase in the share of goods which use R&D intensively, with both the “easy to imitate” and “difficult to imitate” research goods categories increasing their shares of overall world trade over the period. All other areas have seen declines in their respective performances, with the most significant declines occurring in the raw material intensive and labour intensive categories.
Table 7 : Global Overview : Breakdown of total World Trade by
Skill and Factor Intensity 1992-2003* Skill Intensity
% Breakdown For Manufacturing Imports
1992 2003
High Technology 18.0 22.4
(Of which ICT) (12.8) (17.9)
Medium-High Technology 36.8 37.6
Medium-Low Technology 18.8 18.8
Low Technology 26.5 21.2
Total 100 100
Factor Intensity
% Breakdown of Total Imports
1992 2003
Raw Material Intensive goods 22.6 20.6
Labour Intensive goods 20.5 17.4
Capital Intensive goods 18.0 17.5
Easy to Imitate Research goods 14.3 18.3
Difficult to Imitate Research goods 24.6 26.2
Total 100 100 * Imports are used for the skill and factor intensity breakdowns due to the generally more reliable nature of the underlying, duty-based, data sources. Source : UN Comtrade, own calculations
- 26 -
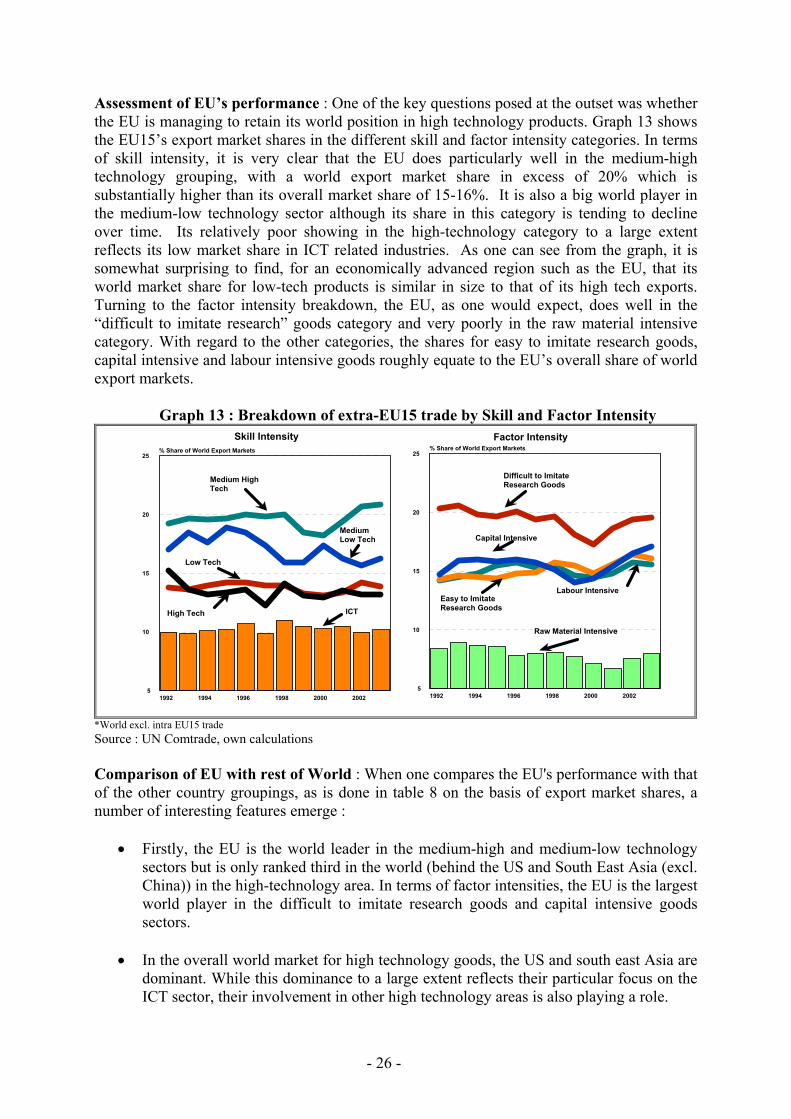
Assessment of EU’s performance : One of the key questions posed at the outset was whether the EU is managing to retain its world position in high technology products. Graph 13 shows the EU15’s export market shares in the different skill and factor intensity categories. In terms of skill intensity, it is very clear that the EU does particularly well in the medium-high technology grouping, with a world export market share in excess of 20% which is substantially higher than its overall market share of 15-16%. It is also a big world player in the medium-low technology sector although its share in this category is tending to decline over time. Its relatively poor showing in the high-technology category to a large extent reflects its low market share in ICT related industries. As one can see from the graph, it is somewhat surprising to find, for an economically advanced region such as the EU, that its world market share for low-tech products is similar in size to that of its high tech exports. Turning to the factor intensity breakdown, the EU, as one would expect, does well in the “difficult to imitate research” goods category and very poorly in the raw material intensive category. With regard to the other categories, the shares for easy to imitate research goods, capital intensive and labour intensive goods roughly equate to the EU’s overall share of world export markets.
Graph 13 : Breakdown of extra-EU15 trade by Skill and Factor Intensity
1992 1994 1996 1998 2000 20025
10
15
20
25% Share of World Export Markets
Medium High Tech
MediumLow Tech
Low Tech
Skill Intensity Factor Intensity
1992 1994 1996 1998 2000 20025
10
15
20
25% Share of World Export Markets
Difficult to Imitate Research Goods
Capital Intensive
Easy to Imitate Research Goods
Raw Material Intensive
Labour Intensive
ICTHigh Tech
*World excl. intra EU15 trade Source : UN Comtrade, own calculations Comparison of EU with rest of World : When one compares the EU's performance with that of the other country groupings, as is done in table 8 on the basis of export market shares, a number of interesting features emerge :
• Firstly, the EU is the world leader in the medium-high and medium-low technology sectors but is only ranked third in the world (behind the US and South East Asia (excl. China)) in the high-technology area. In terms of factor intensities, the EU is the largest world player in the difficult to imitate research goods and capital intensive goods sectors.
• In the overall world market for high technology goods, the US and south east Asia are
dominant. While this dominance to a large extent reflects their particular focus on the ICT sector, their involvement in other high technology areas is also playing a role.

- 27 -
Table 8 : Breakdown of Trade by Skill / Factor Intensity : Comparisons based on World Export Market Shares 8a : Breakdown of Trade by Skill Intensity
Total Manufacturing
Exports (2)
High Technology
(HT)
ICT (Part of High Technology)
Medium-High Technology (MHT)
Medium-Low Technology (MLT)
Low Technology
(LT)
1992-1997
1998-2003
1992-1997
1998-2003
1992-1997
1998-2003
1992- 1997
1998- 2003
1992- 1997
1998- 2003
1992-1997
1998-2003
EU15 (1) 16.1 15.8 13.4 13.1 10.3 10.4 19.8 19.9 18.5 17.3 14.1 14.0 EU10 1.4 2.4 0.5 0.8 0.6 1.0 1.4 1.9 2.5 2.4 2.4 2.6 EU Neighbours 4.2 4.6 2.4 2.5 1.5 1.6 4.3 4.5 7.1 10.3 4.8 5.6 US 13.0 12.7 18.7 19.9 16.2 16.6 13.2 13.9 9.6 9.9 8.4 8.4 Americas (excl US) 6.2 7.4 4.0 4.7 4.2 4.9 7.6 8.3 9.1 9.4 9.1 9.8 Japan 10.8 8.2 14.8 11.8 16.3 12.8 13.2 11.6 8.1 7.2 1.7 1.6 China 3.0 5.0 2.1 2.8 2.2 3.0 1.4 1.7 2.3 2.8 6.4 7.4 S.E. Asia (excl China) 15.7 16.5 22.9 22.8 26.8 26.8 7.3 7.2 11.4 11.9 18.4 17.4 India 0.6 0.7 0.1 0.1 0.1 0.1 0.3 0.3 0.4 0.4 1.8 1.9
8b : Breakdown of Trade by Factor Intensity Total
Exports (2) Difficult to Imitate
Research Goods (DIRG)
Easy to Imitate Research Goods
(EIRG)
Capital Intensive Goods
(CIG)
Labour Intensive Goods
(LIG)
Raw Material Intensive Goods
(RMIG)
1992-1997
1998-2003
1992- 1997
1998- 2003
1992- 1997
1998- 2003
1992-1997
1998-2003
1992-1997
1998-2003
1992-1997
1998-2003
EU15 (1) 15.5 15.4 19.8 19.7 14.5 15.1 15.9 15.6 15.4 15.4 8.4 8.0 EU10 1.4 2.2 1.3 1.5 0.8 1.1 1.9 2.2 2.4 2.7 1.8 1.8 EU Neighbours 6.3 7.7 3.9 3.9 4.2 4.4 3.8 5.5 5.2 5.7 16.6 18.8 US 12.8 12.0 16.4 18.1 14.1 14.5 9.7 9.9 8.0 8.4 10.4 9.6 Americas (excl US) 8.2 9.3 4.5 5.2 4.7 5.2 11.9 12.5 5.7 6.4 17.9 18.5 Japan 8.8 6.9 14.8 12.4 11.7 9.6 12.9 11.6 3.0 2.7 0.7 0.6 China 2.8 4.4 1.5 1.9 2.7 3.3 1.4 1.4 7.7 8.5 2.3 2.3 S.E. Asia (excl China) 15.5 15.8 13.2 13.5 18.4 17.8 6.2 6.3 18.8 17.8 14.2 14.3 India 0.6 0.7 0.1 0.1 0.3 0.3 0.4 0.4 1.8 1.8 0.9 0.8 (1) Note: Trade with World=Extra-EU15 for EU15. Columns do not sum to 100 since the rest of the world grouping and intra-EU15 trade is excluded. (2) Note : There may be small discrepancies between the total column and the sum of the remaining columns due to differences in the date of extraction from Comtrade / data revisions. Source: UN Comtrade, own calculations
- 28 -
• For China and the EU10 groupings, both have large and growing shares in the low
technology sectors. China has also a large presence in the high technology area but, as the factor intensity breakdown shows, this essentially reflects their presence in the labour intensive stages of the production of high technology goods, many of which draw on imported technology (via FDI) and on imports of parts and components which have a high skill content. Reflecting the greater focus of the EU10 countries on the low-technology and medium-low technology sectors, a relatively large proportion of their trade is in goods which use labour and capital intensively.
• Japan has the highest concentration in the medium and high technology sectors of any
of the areas covered. Over 80% of Japan’s trade is in these groupings compared with less than 60% for the EU. This concentration is also reflected in the factor intensity breakdown, where over 90% of Japan's trade is in the difficult to imitate research, easy to imitate research and capital intensive goods categories, with less than 10% in the labour intensive and raw material intensive categories. This compares with China where the latter two categories account for over 60% of all trade. Given these figures, the widespread belief that China poses a serious threat to the more developed economies in the high technology segments of world markets is clearly not supported on the basis of present trends although specialisation patterns can change quickly as we will see in section 3.3.
• Finally, regarding the rest of the world, India displays remarkable stability in its shares
for the different skill and factor intensity categories. For the EU neighbours and the Americas (excl US) groupings, the most striking (and indeed predictable) feature is their world dominance in the raw material intensive goods section which includes oil.
Indicators of overall comparative advantage : “Structural” trade balances : While an analysis of export market shares provides interesting insights concerning changes in world trade patterns and shifts in the relative competitiveness of countries, their use in calculating measures of revealed comparative advantage (RCA) is more problematic. Traditional measures of comparative advantage, based on the Balassa method, are normally calculated using the export market shares of individual products and product groupings relative to developments at the world level. These RCA’s have been used for decades to measure the specialisation patterns of countries as indicated by their allocation of resources to specific industries. However, our calculation of these measures for the analysis in the present paper resulted in RCA’s which were counter-intuitive for a large number of the country groupings. These rather strange results could in fact be linked to the internationalisation of the production process discussed earlier in section 2 and specifically to the growing importance of two-way trade flows at the world level. These flows are being driven by the foreign direct investment activities of multinationals and are reflected in rising levels of intermediate trade at the intra-industry and intra-firm levels. Given the problems encountered in calculating “traditional” RCA’s, it was decided instead to focus on RCA measures which take account of developments at the net level (i.e. exports less imports) since such an approach is increasingly being used in the literature. From ECFIN’s perspective, focussing on the trade balance has the potential to increase our understanding of the large shifts in specialisation which are taking place at the world level. In our view, an analysis at the trade balance level is becoming more relevant as the outsourcing phenomenon gathers pace. The growing fragmentation of international value added chains is leading to a

- 29 -
growth in intermediate imports, with imports of parts and components and semi-finished goods being used to maintain the export market shares of many countries. The maintenance of export market shares via a strategy of large scale delocalisation of the input supply chain often leads to a deterioration in a countries overall trade balance. In these circumstances, focussing solely on the export side would be insufficient to reflect the true underlying position of the country in question12. In practical terms, while the actual trade balance can provide a useful indicator of the specialisation patterns for the specific areas, to calculate an accurate measure of a country’s comparative advantage one must first adjust the actual balance to take account of the effects of the business cycle. This is done using a methodology which has been developed by CEPII. In essence this indicator gives the contribution of different products or product groupings to the cyclically adjusted trade balance of the particular country or country grouping (see Annex 4 for a description of the approach used). “Structural” Trade Balances for the EU and a Comparison with the Rest of the World : Graph 14a gives the “structural” trade balances as calculated by the CEPII approach for the different skill and factor intensities described earlier for extra EU15 trade. These figures can be interpreted as indicators of the comparative advantage of the EU in terms of the specialisation patterns of its respective industries. Given the EU’s import patterns, the RCA’s based on trade balances do not differ dramatically from RCA’s which are calculated using export market shares and consequently there are no significant surprises compared with the conclusions of the previous section. Graph 14a in fact confirms the strong medium-high technology specialisation shown earlier for the EU, with a significant proportion of its internal resources being directed towards a range of medium technology sectors which use R&D and capital intensively. Table 9 goes on to compare the RCA’s for the EU with those of the other world areas. While the absolute figures cannot be compared across countries (since the cyclically adjusted trade balance is an indicator of how individual countries allocate resources to their own specific industries), the RCA measures given in the table do allow one to compare the specialisation patterns of the different skill and factor intensity categories in a given country compared with another. While the conclusions from such an analysis are often similar to those discussed earlier regarding export market shares, this is not always the case as one would expect given the additional informational content provided by the structural balance indicator. Differences exist for particular world areas either because of large amounts of two way trade flows or
12 This viewpoint is supported in the ECB report "Competitiveness and the export performance of the Euro area" where it is stated that "….the import content of (euro area) exports has risen over time as exports become increasingly reliant on imported inputs, implying a lower value added per export unit in comparison to the past. As a result, strong export growth is no guarantee of strong GDP growth (net trade is the key variable that actually affects GDP growth)…..For all the (euro area) countries, the results show an increase in the import content of exports between 1995 and 2000 ….with the import content of exports for the euro area increased from 37.6% to 44.2%. In addition, among the components of final demand, exports have by far the highest import content (compared with 44.2% for exports in 2000, the import content of total investment was 29%). Given that the import content of exports increased … this implies that the (domestic) value added in euro area exports has declined over the same period from 62% to 56%. However, the internationalisation of production that partly explains the rise in the import content of exports has boosted trade as well. For the euro area, the share of exports in GDP rose from 29% in 1995 to 38% in 2000. As a result, the net impact of a 1% increase in exports on GDP growth may have remained constant in the euro area, with the decline in the value added of exports being counterbalanced by the increasing share of exports in GDP."
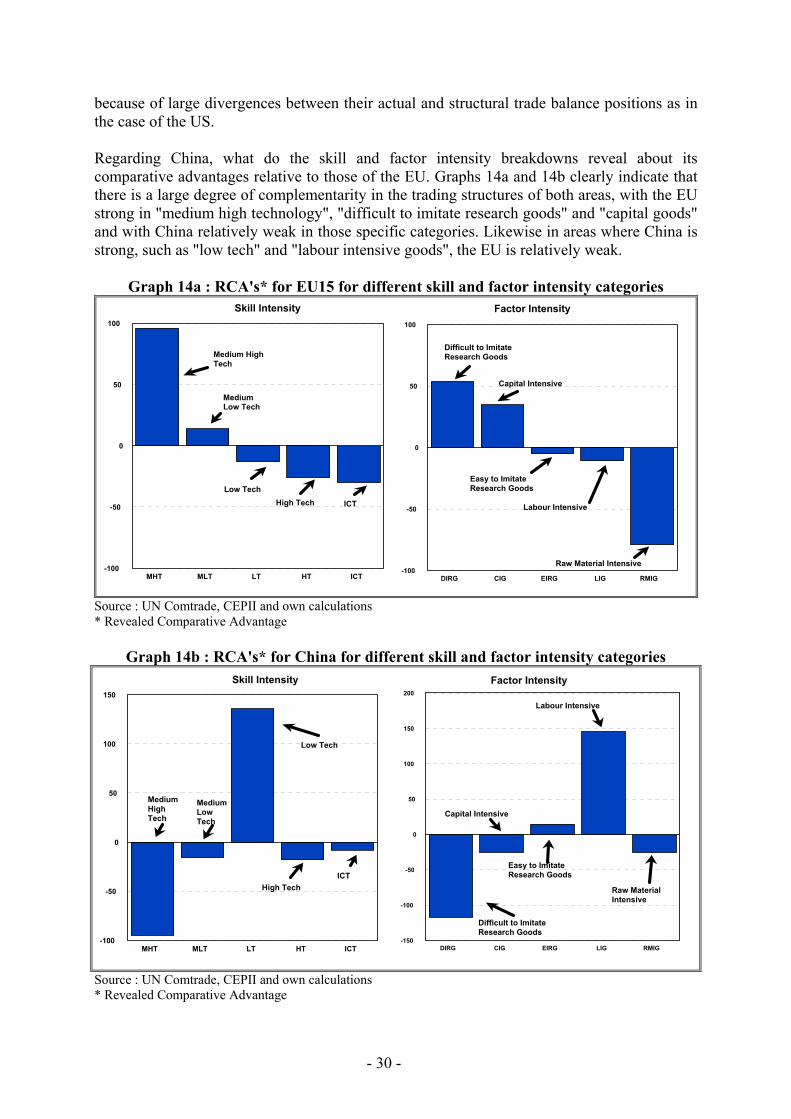
- 30 -
because of large divergences between their actual and structural trade balance positions as in the case of the US. Regarding China, what do the skill and factor intensity breakdowns reveal about its comparative advantages relative to those of the EU. Graphs 14a and 14b clearly indicate that there is a large degree of complementarity in the trading structures of both areas, with the EU strong in "medium high technology", "difficult to imitate research goods" and "capital goods" and with China relatively weak in those specific categories. Likewise in areas where China is strong, such as "low tech" and "labour intensive goods", the EU is relatively weak.
Graph 14a : RCA's* for EU15 for different skill and factor intensity categories
MHT MLT LT HT ICT
0
50
100
-50
-100
Medium High Tech
MediumLow Tech
Low Tech
Skill Intensity Factor Intensity
DIRG CIG EIRG LIG RMIG
0
50
100
-50
-100
Difficult to Imitate Research Goods
Capital Intensive
Easy to Imitate Research Goods
Raw Material Intensive
Labour IntensiveICTHigh Tech
Source : UN Comtrade, CEPII and own calculations * Revealed Comparative Advantage
Graph 14b : RCA's* for China for different skill and factor intensity categories
MHT MLT LT HT ICT
0
50
100
150
-50
-100
Medium High Tech
MediumLow Tech
Low Tech
Skill Intensity Factor Intensity
DIRG CIG EIRG LIG RMIG
0
50
100
150
200
-50
-100
-150
Difficult to Imitate Research Goods
Capital Intensive
Easy to Imitate Research Goods
Raw MaterialIntensive
Labour Intensive
ICTHigh Tech
Source : UN Comtrade, CEPII and own calculations * Revealed Comparative Advantage

- 31 -
Table 9 : RCA’s for Skill and Factor Intensity Categories Skill Intensity Factor Intensity
HT ICT MHT MLT LT DIRG EIRG CIG LIG RMIG
EU15 -26.1 -30.1 95.9 13.8 -13.1 53.7 -5.2 34.8 -10.9 -79.0
EU10 -19.0 -13.1 -20.1 23.3 44.0 -15.3 -23.1 14.9 33.6 -14.5
EU Neighbours
-22.8 -20.7 -69.0 -0.4 -26.0 -44.6 -21.4 -34.2 -24.0 126.8
US 39.6 8.8 21.3 -6.9 -33.5 77.5 2.6 -27.9 -39.4 -14.0
Americas (excl US)
-31.3 -25.6 -63.5 1.4 30.5 -72.0 -30.5 18.0 -8.5 92.9
Japan 56.7 53.8 159.9 12.7 -114.4 122.5 26.4 85.0 -51.5 -189.8
China -18.0 -8.1 -94.9 -15.8 135.7 -117.2 14.4 -25.4 145.5 -25.6
S.E. Asia 16.2 25.3 -49.0 -3.9 42.7 -43.8 18.6 -15.0 32.3 6.5
Source : UN Comtrade, own calculations
Overall Global Trends : The technology / research content of trade has increased sharply over time (R&D intensive products are driving world trade)
RCA Analysis : Key Insights
EU does particularly well in the medium-
high technology segment of the
global market but very poorly in terms of high technology goods where parts
of Asia / US are dominant
Are the EU15’s growing trade deficits with Asia indicative of structural deficiencies in terms of the skills / technology content of EU products ?
The RCA measures calculated in the study take account of developments at the net, trade balance,
level (i.e. exports less imports) – This measure is becoming more relevant as
the outsourcing phenomenon gathers pace
RCA measures confirm the analysis in terms of export
shares – the EU has a strong medium-high
technology specialisation, with a significant proportion
of its internal resources directed towards a range of industries which use R&D
and capital intensively
RCA analysis also confirms the large degree of
complementarity in the trading structures of the EU
& China
In terms of factor intensities, the EU is the largest world
player in the « difficult-to-
imitate research goods » and
« capital intensive goods » categories
Amongst the developed
economies, Japan has by far the
highest concentration of its external trade
in medium technology & high technology goods
China’s relatively large presence in
the high technology area reflects its role
in the labour intensive stages of the production of
such goods, many of which draw on
imported technology (FDI) &
on imported parts & components which
have a high skill content

- 32 -
3.3 : What are the 20 most dynamic global product groupings and is there evidence of a worldwide shift in the comparative advantage of the EU in these areas ?
While breakdowns of trade into specific skill or factor intensity groupings are enlightening, it is important to supplement this with an overview at the product level. At the 3 digit SITC level, there are 266 product groupings. It is not feasible of course to provide an analysis of each of these groupings and consequently one must rank them using particular criteria. For this specific exercise, it was decided to rank the 266 products on the basis of their overall contribution to the non-fuel export growth rate. This ranking involves taking both the export growth rate for each product as well as its overall share in total non-fuel exports to calculate its respective contribution. The top 20 products which emerge from this ranking exercise are shown in table 10. Table 10 indicates that semiconductors was the single most important non-fuel export product grouping over the period 1994-2003. This reflects both its very high rate of growth (13.6%) as well as its large weight in non-fuel world exports (it has a 4.4% overall share). This single industry contributed nearly 8% to the overall growth of non-fuel exports over the period 1994-2003, well in excess of the next most important industry, passenger cars. The table shows that the top 20 products (out of the total of 266) contributed over 50% of the overall export growth rate. This growing degree of concentration of world trade flows on such a small group of “super” products is a relatively new phenomenon. These products grew on average by about 2% points more than the total and collectively have a weight of close to 40% in total non-fuel exports. One very clear message from this table is the importance of the ICT industry as a major driving force behind the growth in exports since the early 1990’s. Four of the top 5 product groupings belong to ICT, with these four products on their own contributing over 20% of the total growth in non-fuel exports over the 10 year period covered. Table 10 also gives a breakdown of these products into their skill and factor intensities as well as their “final use”. Regarding “final use”, intermediate and capital goods are particularly well represented in the top 20 grouping which is what one would expect given the trends described earlier in section 2. Both trade categories have increased their share of overall world trade since the early 1990’s, with parallel upward trends in these categories of trade linked with the growth in externally-sourced capital formation (i.e. FDI) and with the outsourcing phenomenon. Intermediate goods accounted for 60% of the growth in the top 20 as a group compared with a share of just 54% for overall non-fuel exports. Capital goods displayed an even higher degree of dynamism, with a share of the top 20 which is almost double their contribution to overall non-fuel exports. By contrast, the consumption goods category is poorly represented, with just 12% of the growth rate of the top 20 attributable to this particular type of goods. The skill intensity breakdown (table 10) shows the clear upskilling which is taking place in world trading patterns, with all of the top 12 products belonging to the high-tech or medium-high tech sectors. This dominance is reflected in the overall weightings for the top 20 group as a whole which shows that high-tech plus medium-high tech accounted for 86% of the growth rate of the top 20 (compared with just 55% for total non-fuel exports). Medium low-tech and low-tech accounted for 5% and 9% respectively compared with 19% and 26% for total non-fuel exports. Given the skewed nature of the skill intensity breakdown, it is not surprising to find that research intensive goods totally dominate the top 20 rankings, with both "difficult-to-imitate" and "easy-to-imitate" research goods accounting for 13 of the top 20 product groupings. Two capital intensive industry groupings (cars and parts and accessories
- 33 -
for cars) make it into the top 20, with five labour intensive industries (furniture, paper and paperboard, clothing, base metal manufactures and plastics) included in the bottom half of the table. How has the EU been performing in the top 20 product groupings ? Table 11 gives the export and import market shares for the EU15 for all of the 20 products as well as the actual trade balance. On the export side, it shows that the EU is highly specialised in a few key industries, with export market shares far in excess of the EU’s overall world export market share. 6 industries are particularly important, with 3 having shares well in excess of 20% of the world total (measuring equipment, aircraft and specialised equipment) and 3 in excess of 30% (pharmaceuticals, chemicals and engines and motors). The EU is in the opposite position regarding 3 important ICT industries, namely semiconductors; computers; and parts and accessories for computers; as well as in clothing. While a low world market share in clothing is what one would expect for a developed group of countries such as the EU, the extremely low shares for the ICT related industries is very disturbing, with shares for each of the 3 industries of only 7½%-8½% compared with the 15%-16% overall market share held by the EU for all export industries. When one allows for imports, one sees that the most important EU industries from a trade balance perspective are passenger cars (annual average surplus of €24 billion from exports averaging €50 billion over the 1998-2003 period); pharmaceuticals (surplus €19.5 billion); specialised equipment (surplus €12.3 billion); chemicals (surplus €9.2 billion); and parts and accessories for motor vehicles (surplus €8.8 billion).
How does the EU compare with other areas of the world in terms of export market shares for the 20 products? : Table 12 gives the top 3 countries / country groupings for the 20 product groupings ranked by their average export market shares over the period 1992-2003. While the additional informational content for the EU is relatively small given the overlap with table 11, it nevertheless puts the EU’s performance into context at the world level. Given its size, it is not surprising to find that the EU is in the top 3 rankings for 17 of the 20 product groupings, the exception again being the 3 ICT related industries. What is more interesting is that the EU is number 1 in the world in 9 of the 20 groupings (extra-EU markets). By comparison, the US is number 1 in just three categories (parts and accessories for motor vehicles; aircraft and measuring equipment). Japan is also number 1 in three areas (passenger cars; electrical machinery and piston engines). The top spot in the remaining five areas all go to South East Asia (semiconductors; telecommunications equipment; computers; parts and accessories for computers; and clothing).
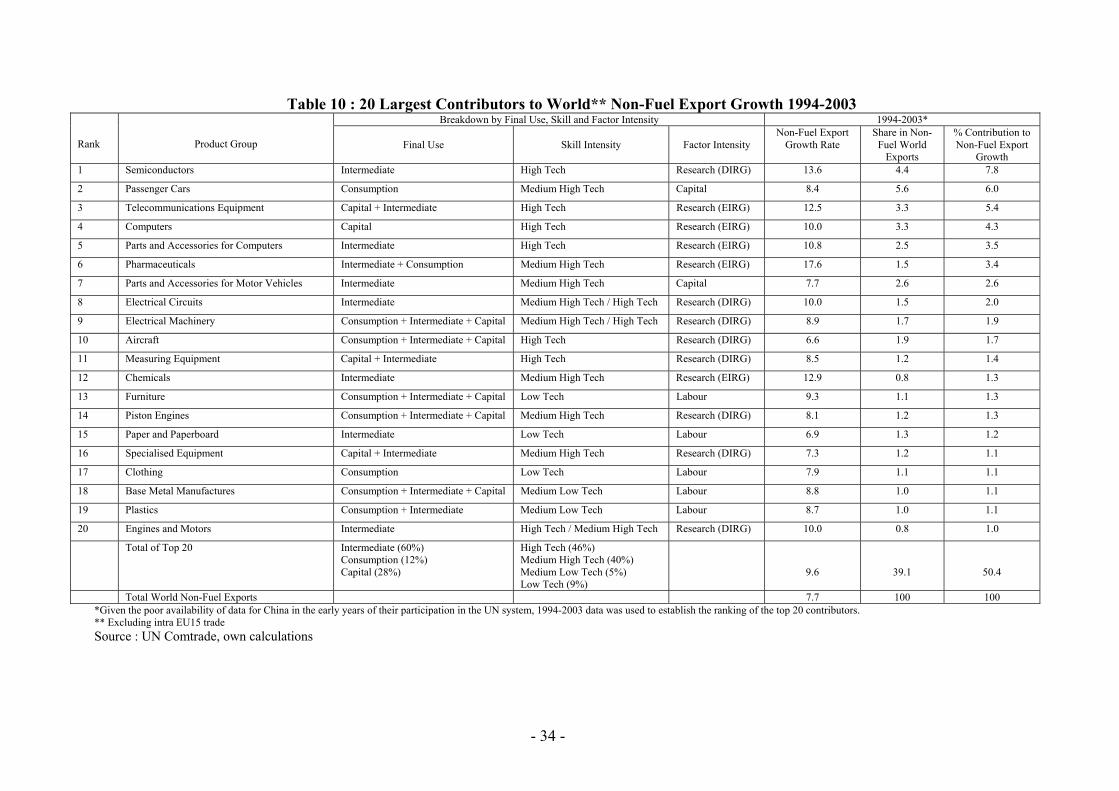
- 34 -
Table 10 : 20 Largest Contributors to World** Non-Fuel Export Growth 1994-2003 Breakdown by Final Use, Skill and Factor Intensity 1994-2003*
Rank
Product Group
Final Use
Skill Intensity
Factor Intensity Non-Fuel Export
Growth Rate Share in Non-
Fuel World Exports
% Contribution to Non-Fuel Export
Growth 1 Semiconductors Intermediate High Tech Research (DIRG) 13.6 4.4 7.8
2 Passenger Cars Consumption Medium High Tech Capital 8.4 5.6 6.0
3 Telecommunications Equipment Capital + Intermediate High Tech Research (EIRG) 12.5 3.3 5.4
4 Computers Capital High Tech Research (EIRG) 10.0 3.3 4.3
5 Parts and Accessories for Computers Intermediate High Tech Research (EIRG) 10.8 2.5 3.5
6 Pharmaceuticals Intermediate + Consumption Medium High Tech Research (EIRG) 17.6 1.5 3.4
7 Parts and Accessories for Motor Vehicles Intermediate Medium High Tech Capital 7.7 2.6 2.6
8 Electrical Circuits Intermediate Medium High Tech / High Tech Research (DIRG) 10.0 1.5 2.0
9 Electrical Machinery Consumption + Intermediate + Capital Medium High Tech / High Tech Research (DIRG) 8.9 1.7 1.9
10 Aircraft Consumption + Intermediate + Capital High Tech Research (DIRG) 6.6 1.9 1.7
11 Measuring Equipment Capital + Intermediate High Tech Research (DIRG) 8.5 1.2 1.4
12 Chemicals Intermediate Medium High Tech Research (EIRG) 12.9 0.8 1.3
13 Furniture Consumption + Intermediate + Capital Low Tech Labour 9.3 1.1 1.3
14 Piston Engines Consumption + Intermediate + Capital Medium High Tech Research (DIRG) 8.1 1.2 1.3
15 Paper and Paperboard Intermediate Low Tech Labour 6.9 1.3 1.2
16 Specialised Equipment Capital + Intermediate Medium High Tech Research (DIRG) 7.3 1.2 1.1
17 Clothing Consumption Low Tech Labour 7.9 1.1 1.1
18 Base Metal Manufactures Consumption + Intermediate + Capital Medium Low Tech Labour 8.8 1.0 1.1
19 Plastics Consumption + Intermediate Medium Low Tech Labour 8.7 1.0 1.1
20 Engines and Motors Intermediate High Tech / Medium High Tech Research (DIRG) 10.0 0.8 1.0
Total of Top 20 Intermediate (60%) Consumption (12%) Capital (28%)
High Tech (46%) Medium High Tech (40%) Medium Low Tech (5%) Low Tech (9%)
9.6
39.1
50.4
Total World Non-Fuel Exports 7.7 100 100 *Given the poor availability of data for China in the early years of their participation in the UN system, 1994-2003 data was used to establish the ranking of the top 20 contributors. ** Excluding intra EU15 trade Source : UN Comtrade, own calculations

- 35 -
Table 11 : Analysis of External Trade Product Groupings Top 20 Contributors to World Non-Fuel Export Growth 1992-2003
How well did the EU15 do in these 20 product groupings in World Markets (i.e. Extra EU15 markets) over the period 1992-2003 1992-1997 Period Averages 1998-2003 Period Averages
Product Group
% Share of World Exports
of Product
% Share of World Imports of Product
Trade Balance in Billions of
Euro (% of GDP)
% Share of World Exports of Product
% Share of World Imports of
Product
Trade Balance in Billions of Euro
(% of GDP)
1 Semiconductors 8.0 13.0 -6.3 (-0.09) 8.2 11.1 -8.8 (-0.10) 2 Passenger Cars 15.5 8.1 14.0 (0.21) 16.2 9.1 23.5 (0.27) 3 Telecommunications
Equipment 16.5 15.2 2.7 (0.04) 16.5 14.3 5.0 (0.06)
4 Computers 7.1 22.9 -16.3 (-0.25) 7.5 19.9 -25.9 (-0.30) 5 Parts and Accessories for Computers 8.5 21.4 -8.2 (-0.12) 8.5 19.9 -15.1 (-0.18) 6 Pharmaceuticals 33.0 11.1 7.6 (0.12) 32.7 11.7 19.5 (0.22) 7 Parts and Accessories for Motor
Vehicles 14.0 6.1 7.3 (0.11) 14.1 8.0 8.8 (0.10)
8 Electrical Circuits 17.9 12.5 2.7 (0.04) 17.1 13.0 3.6 (0.04) 9 Electrical Machinery 13.4 17.7 -2.0 (-0.03) 12.8 17.3 -4.6 (-0.05) 10 Aircraft 26.0 21.1 5.2 (0.08) 25.6 27.1 3.9 (0.05) 11 Measuring Equipment 22.1 19.0 1.1 (0.02) 21.9 18.0 2.3 (0.03) 12 Chemicals 27.2 17.2 1.6 (0.02) 34.7 13.6 9.2 (0.10) 13 Furniture 17.1 13.6 1.4 (0.02) 15.7 17.1 -1.4 (-0.01) 14 Piston Engines 14.5 10.7 1.8 (0.03) 15.0 14.2 0.4 (0.0) 15 Paper and Paperboard 16.1 7.2 4.2 (0.06) 17.4 7.4 6.9 (0.08) 16 Specialised Equipment 30.7 7.9 9.8 (0.15) 28.3 9.0 12.3 (0.14) 17 Clothing 9.8 24.5 -6.0 (-0.09) 8.8 25.6 -12.3 (-0.14) 18 Base Metal Manufactures 16.0 10.8 1.8 (0.03) 16.6 12.2 2.3 (0.03) 19 Plastics 13.1 11.3 0.7 (0.01) 13.3 11.8 0.7 (0.01) 20 Engines and Motors 34.9 35.2 0.2 (0.0) 34.9 37.1 0.4 (0.0) Total of Top 20 15.8 14.2 23.3 (0.35) 16.1 14.6 31.0 (0.35) Total Non-Fuel Trade 16.0 14.4 59.5 (0.89) 15.9 14.8 46.7 (0.53) * Excl. intra EU15 trade Source : UN Comtrade, own calculations
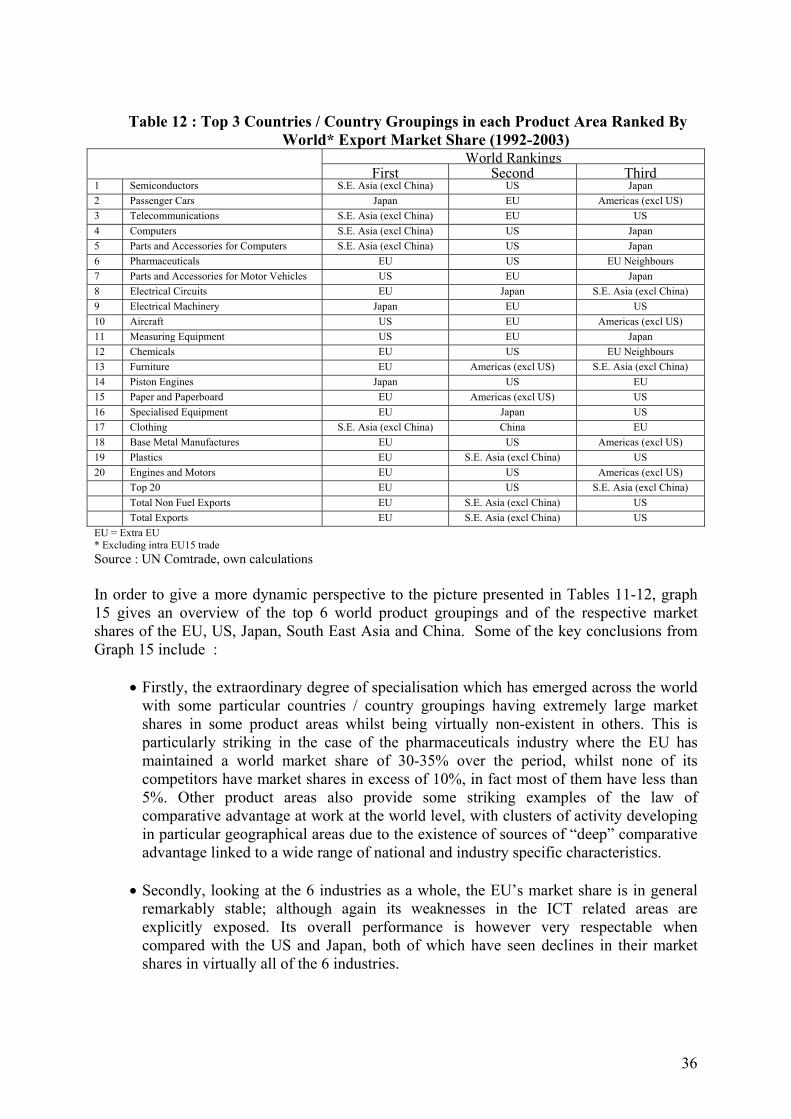
36
Table 12 : Top 3 Countries / Country Groupings in each Product Area Ranked By
World* Export Market Share (1992-2003) World Rankings
First Second Third1 Semiconductors S.E. Asia (excl China) US Japan 2 Passenger Cars Japan EU Americas (excl US) 3 Telecommunications S.E. Asia (excl China) EU US 4 Computers S.E. Asia (excl China) US Japan 5 Parts and Accessories for Computers S.E. Asia (excl China) US Japan 6 Pharmaceuticals EU US EU Neighbours 7 Parts and Accessories for Motor Vehicles US EU Japan 8 Electrical Circuits EU Japan S.E. Asia (excl China) 9 Electrical Machinery Japan EU US 10 Aircraft US EU Americas (excl US) 11 Measuring Equipment US EU Japan 12 Chemicals EU US EU Neighbours 13 Furniture EU Americas (excl US) S.E. Asia (excl China) 14 Piston Engines Japan US EU 15 Paper and Paperboard EU Americas (excl US) US 16 Specialised Equipment EU Japan US 17 Clothing S.E. Asia (excl China) China EU 18 Base Metal Manufactures EU US Americas (excl US) 19 Plastics EU S.E. Asia (excl China) US 20 Engines and Motors EU US Americas (excl US) Top 20 EU US S.E. Asia (excl China) Total Non Fuel Exports EU S.E. Asia (excl China) US Total Exports EU S.E. Asia (excl China) US EU = Extra EU * Excluding intra EU15 trade Source : UN Comtrade, own calculations
In order to give a more dynamic perspective to the picture presented in Tables 11-12, graph 15 gives an overview of the top 6 world product groupings and of the respective market shares of the EU, US, Japan, South East Asia and China. Some of the key conclusions from Graph 15 include :
• Firstly, the extraordinary degree of specialisation which has emerged across the world with some particular countries / country groupings having extremely large market shares in some product areas whilst being virtually non-existent in others. This is particularly striking in the case of the pharmaceuticals industry where the EU has maintained a world market share of 30-35% over the period, whilst none of its competitors have market shares in excess of 10%, in fact most of them have less than 5%. Other product areas also provide some striking examples of the law of comparative advantage at work at the world level, with clusters of activity developing in particular geographical areas due to the existence of sources of “deep” comparative advantage linked to a wide range of national and industry specific characteristics.
• Secondly, looking at the 6 industries as a whole, the EU’s market share is in general
remarkably stable; although again its weaknesses in the ICT related areas are explicitly exposed. Its overall performance is however very respectable when compared with the US and Japan, both of which have seen declines in their market shares in virtually all of the 6 industries.
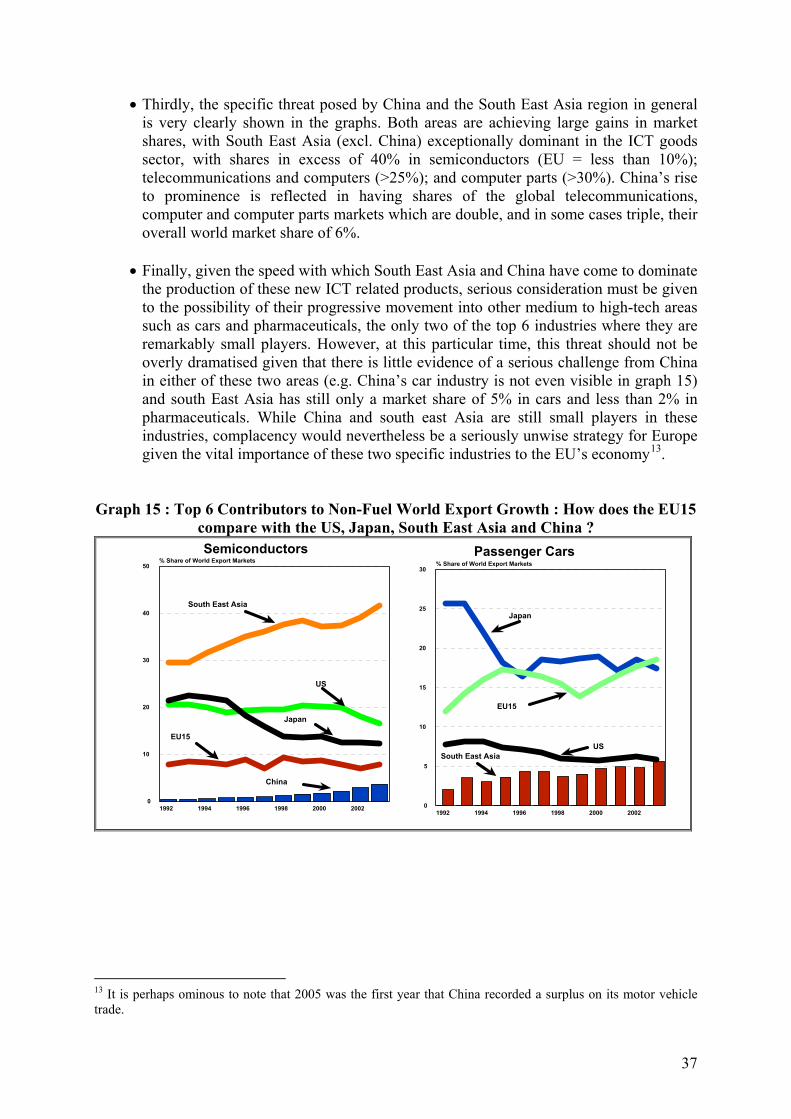
37
• Thirdly, the specific threat posed by China and the South East Asia region in general is very clearly shown in the graphs. Both areas are achieving large gains in market shares, with South East Asia (excl. China) exceptionally dominant in the ICT goods sector, with shares in excess of 40% in semiconductors (EU = less than 10%); telecommunications and computers (>25%); and computer parts (>30%). China’s rise to prominence is reflected in having shares of the global telecommunications, computer and computer parts markets which are double, and in some cases triple, their overall world market share of 6%.
• Finally, given the speed with which South East Asia and China have come to dominate
the production of these new ICT related products, serious consideration must be given to the possibility of their progressive movement into other medium to high-tech areas such as cars and pharmaceuticals, the only two of the top 6 industries where they are remarkably small players. However, at this particular time, this threat should not be overly dramatised given that there is little evidence of a serious challenge from China in either of these two areas (e.g. China’s car industry is not even visible in graph 15) and south East Asia has still only a market share of 5% in cars and less than 2% in pharmaceuticals. While China and south east Asia are still small players in these industries, complacency would nevertheless be a seriously unwise strategy for Europe given the vital importance of these two specific industries to the EU’s economy13.
Graph 15 : Top 6 Contributors to Non-Fuel World Export Growth : How does the EU15
compare with the US, Japan, South East Asia and China ?
1992 1994 1996 1998 2000 20020
10
20
30
40
50% Share of World Export Markets
EU15
China
South East Asia
Semiconductors
1992 1994 1996 1998 2000 20020
5
10
15
20
25
30% Share of World Export Markets
EU15
South East Asia
Passenger Cars
US
Japan
US
Japan
13 It is perhaps ominous to note that 2005 was the first year that China recorded a surplus on its motor vehicle trade.
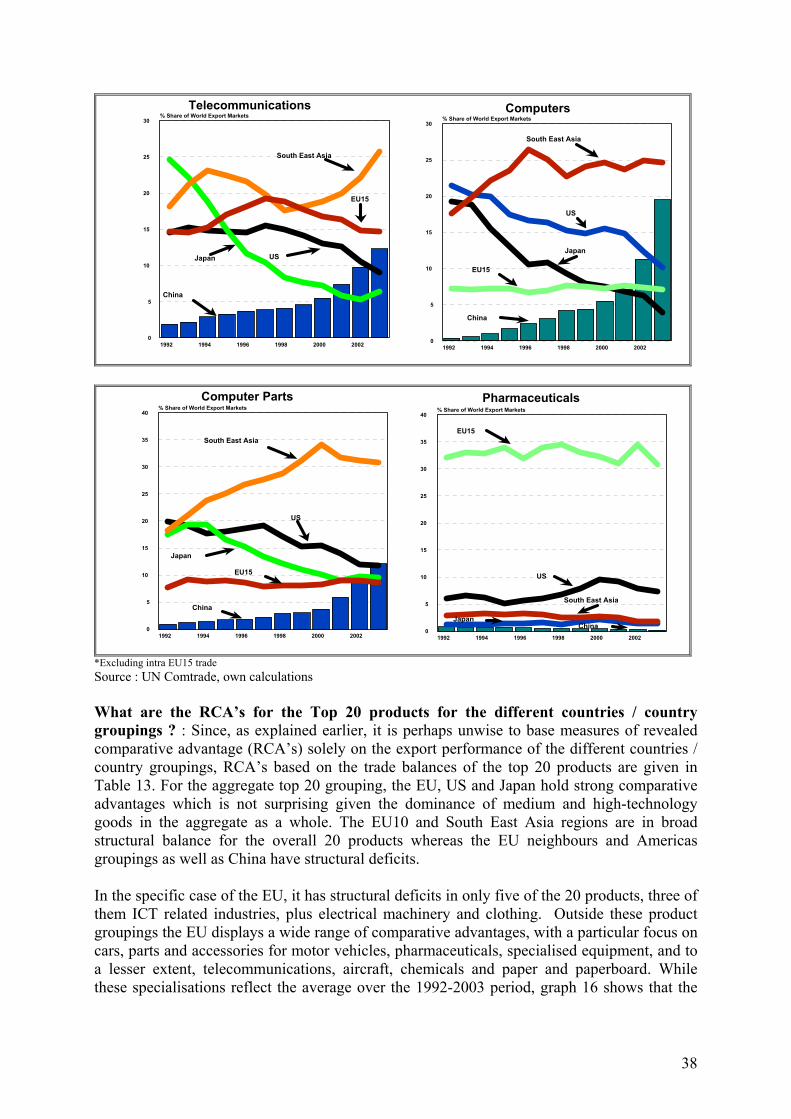
38
1992 1994 1996 1998 2000 20020
5
10
15
20
25
30% Share of World Export Markets
EU15
China
South East Asia
Telecommunications
1992 1994 1996 1998 2000 20020
5
10
15
20
25
30% Share of World Export Markets
Computers
EU15
China
South East Asia
South East Asia
Japan USJapan
US
1992 1994 1996 1998 2000 20020
5
10
15
20
25
30
35
40% Share of World Export Markets
EU15
China
Computer Parts Pharmaceuticals
South East Asia
1992 1994 1996 1998 2000 20020
5
10
15
20
25
30
35
40% Share of World Export Markets
EU15
China
South East Asia
US
Japan
US
Japan
*Excluding intra EU15 trade Source : UN Comtrade, own calculations What are the RCA’s for the Top 20 products for the different countries / country groupings ? : Since, as explained earlier, it is perhaps unwise to base measures of revealed comparative advantage (RCA’s) solely on the export performance of the different countries / country groupings, RCA’s based on the trade balances of the top 20 products are given in Table 13. For the aggregate top 20 grouping, the EU, US and Japan hold strong comparative advantages which is not surprising given the dominance of medium and high-technology goods in the aggregate as a whole. The EU10 and South East Asia regions are in broad structural balance for the overall 20 products whereas the EU neighbours and Americas groupings as well as China have structural deficits. In the specific case of the EU, it has structural deficits in only five of the 20 products, three of them ICT related industries, plus electrical machinery and clothing. Outside these product groupings the EU displays a wide range of comparative advantages, with a particular focus on cars, parts and accessories for motor vehicles, pharmaceuticals, specialised equipment, and to a lesser extent, telecommunications, aircraft, chemicals and paper and paperboard. While these specialisations reflect the average over the 1992-2003 period, graph 16 shows that the

39
EU has either improved or broadly maintained its position in many of these industries over the last 10-12 years. For the EU10, it too has a strong comparative advantage in cars but it is also very focussed on low technology sectors such as furniture and clothing. The EU neighbours grouping shows very few specialisations in the top 20 product areas, with a small comparative advantage in clothing and chemicals but disadvantages in the remaining 18 areas. For the US, it has to a considerable extent focussed its resources on semiconductors, aircraft, measuring equipment and parts and accessories for motor vehicles. Although the US specialises in motor vehicle parts, it has a large comparative disadvantage in the assembly of motor vehicles, with the exact opposite pattern emerging for the car industry in the Americas, with the latter group of countries displaying structural trade deficits in car parts and trade surpluses in cars. These trends are clearly interlinked with strong car related FDI investments by US multinationals in Mexico and Brazil undoubtedly playing a large role. Japan shows very strong specialisation patterns, with significant resources being directed towards a range of medium to high-technology and skill intensive sectors such as cars, semiconductors, electrical machinery, telecommunications and specialised machinery. Its areas of disadvantage include aircraft, pharmaceuticals and a range of low tech industries such as furniture and clothing. While China has an overall structural deficit for the 20 products as a whole, there are sharp differences in the performances of its individual industries. For example, China has a strong comparative advantage in computers, but this is more than offset by negative RCA’s for semiconductors and to a lesser extent for computer parts and components. This data further confirms China as essentially an assembly point for the mainly labour intensive stages of the global computer industry. China also has large structural trade deficits in aircraft and specialised equipment. As against this, it is strong in a range of low technology industries such as furniture and especially clothing. Finally, south east Asia (excl. China) has a similar pattern of specialisation to that of China, with computers being the single most important positive for the region as a whole.
Table 13 : RCA’s for the Top 20 Product Groupings EU15 EU10 EU Neigh-
bours US Americas Japan China S.E. Asia
Semiconductors -4.8 -3.1 -2.1 11.5 -10.7 18.8 -24.6 -2.2 Passenger Cars 12.8 7.4 -18.6 -29.1 17.9 50.8 -4.0 -0.1 Telecommunications Equipment
2.9 -4.0 -5.5 2.0 -4.0 9.0 -5.0 1.8
Computers -14.1 -3.3 -6.7 -3.5 -5.6 1.4 10.3 13.3 Parts and Accessories for Computers
-7.5 -2.2 -3.0 1.6 -0.8 8.0 -0.3 5.7
Pharmaceuticals 8.9 -4.8 -2.2 -0.1 -3.8 -2.5 -0.4 -1.6 Parts and Accessories for Motor Vehicles
5.9 -0.3 -4.5 7.0 -12.7 16.8 -2.8 -2.5
Electrical Circuits 2.4 -1.5 -2.2 1.9 -5.1 8.8 -4.0 -2.6 Electrical Machinery -1.9 2.1 -2.3 1.3 -3.5 11.5 0.5 -2.1 Aircraft 3.8 -0.6 -6.1 23.9 1.3 -4.4 -8.3 -5.2 Measuring Equipment 1.3 -2.9 -0.7 7.4 -4.4 2.6 -5.3 -4.0 Chemicals 3.3 0.4 1.2 -2.1 -3.4 -1.3 0.3 -0.6 Furniture 0.4 13.7 -2.8 -4.0 2.1 -4.2 7.2 1.4 Piston Engines 1.1 2.8 -1.9 1.3 -4.0 11.7 -2.1 -2.2 Paper and Paperboard 3.9 -1.8 -2.9 -0.7 5.2 -0.4 -6.7 -1.5 Specialised Equipment 7.9 -4.2 -2.4 3.4 -4.6 8.9 -18.5 -5.8 Clothing -5.9 2.9 2.5 -6.3 0.2 -8.2 20.7 4.3 Base Metal Manufactures
1.5 2.3 -1.7 0.9 -4.0 0.3 3.1 -1.4
Plastics 0.6 -1.5 -1.6 0.6 -3.5 -1.3 6.3 0.3 Engines and Motors 0.5 0.1 -0.8 4.9 -0.5 -1.6 -0.7 -1.4 Total of Top 20 22.9 1.4 -64.5 21.8 -43.9 124.7 -34.4 -6.1 Source : UN Comtrade, own calculations
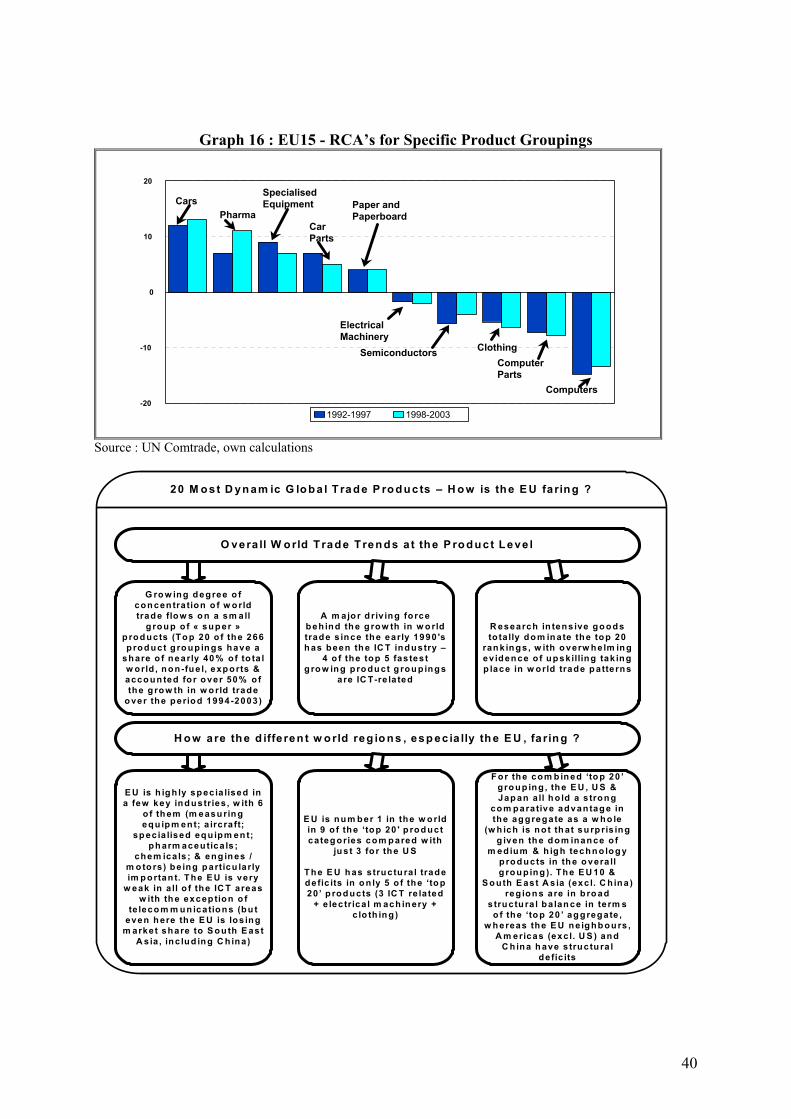
40
Graph 16 : EU15 - RCA’s for Specific Product Groupings
0
10
20
-10
-201992-1997 1998-2003
CarsPharma
Specialised Equipment
Car Parts
Paper and Paperboard
ElectricalMachinery
Semiconductors ClothingComputer Parts
Computers
Source : UN Comtrade, own calculations
O vera ll W o rld T rad e T ren d s a t th e P ro d u ct Leve l
G ro w ing d egree o f con cen tra tion o f w o rld trad e flow s o n a sm all
g rou p o f « sup er » p rod ucts (To p 20 o f the 266 p rod uct g ro up in gs have a
share o f nearly 40 % o f to ta l w orld , n on -fu e l, exp orts & acco un ted fo r over 50% o f the g row th in w o rld trade
o ver the period 1994 -2003 )
H o w are th e d iffe ren t w o rld reg io n s , esp ec ia lly th e E U , fa rin g ?
20 M o st D yn am ic G lo b a l T ra d e P ro d u c ts – H o w is th e E U fa rin g ?
A m ajo r d riv ing fo rce b eh ind th e g row th in w o rld trad e s ince the early 1990 's h as been th e IC T ind ustry –
4 o f the top 5 fas test g ro w in g pro du ct g rou p ing s
are IC T-re la ted
R esearch in tens ive go od s to ta lly do m in ate the top 20
ran k in gs , w ith o verw helm in g ev idence o f up skilling tak ing p lace in w orld trade p atterns
E U is h ig h ly sp ec ia lised in a few key ind ustries , w ith 6
o f th em (m easu rin g equ ip m ent; a ircra ft;
sp ec ia lised eq u ipm en t; ph arm aceutica ls ;
chem ica ls ; & eng in es / m o to rs) be ing p articu larly im p ortan t. T he E U is very
w eak in a ll o f the IC T areas w ith th e excep tion o f
te leco m m un ication s (bu t even h ere the E U is los ing
m arket share to S ou th E ast A s ia , inc lud in g C h ina)
E U is nu m ber 1 in the w o rld in 9 o f th e ‘top 20 ' p rod uct categ ories com p ared w ith
ju st 3 fo r th e U S
T he E U h as structu ra l trade defic its in o n ly 5 o f the ‘to p 20’ p rod ucts (3 IC T re la ted
+ e lectrica l m ach in ery + c lo th in g )
F or th e com b in ed ‘to p 20 ’ g ro up in g , th e E U , U S & Jap an a ll h o ld a s tron g
co m parative advantag e in the ag gregate as a w ho le
(w h ich is n o t th at su rp ris ing g iven th e d om inan ce o f
m ed ium & h ig h techn o log y p rod ucts in th e o vera ll g rou p ing ). Th e E U 10 &
S o uth E ast A s ia (exc l. C h ina) reg ion s are in b ro ad
s tructu ra l ba lan ce in term s o f the ‘to p 20 ’ ag gregate ,
w h ereas the E U n e ig hb ou rs , A m ericas (excl. U S ) and
C h ina h ave s tructu ra l defic its

41
Section 4 : Summary and concluding remarks
Two of the outstanding, and interrelated, features of the post-1990 globalisation phase have been the rapid deepening in global trade integration and the cost-induced, and ICT-enabled, acceleration in the worldwide relocation of production processes. While global relocation (i.e. the shifting of labour intensive manufacturing and business-related services to lower cost locations around the globe) has been an aspect of the integration process for decades, it has accelerated dramatically since the early 1990’s with the fall of the iron curtain in Europe and with the opening up of China, India and parts of central and Latin America. World trade flows over this period have continued to grow at rates well in excess of world output, with the increase not only confined to the exchange of finished goods and services but with the growth in production relocation ensuring a significant expansion in the share of intermediate inputs (both goods and services) which are traded internationally. Global relocation has been driven (and still is being driven) by multinationals seeking to take advantage of changes in worldwide specialisation patterns and by the need to focus their developed economy activities on the higher value added parts of their production processes. For the last 10-15 years, production relocation patterns have ensured that world trade has been dominated by rapid increases in two-way trade flows between developed and developing economies. Such two-way flows have a strong sectoral and regional dimension. At the sectoral level, global production sharing has been a notable aspect of the ICT and car industries, with trade in parts and components for these industries featuring prominently in the world's top 20 most dynamic product categories since the early 1990's. The regional dimension has also been noteworthy, with the emergence of large regional production networks in a range of high, medium and even low technology industries significantly increasing the degree of production complementarities between the traditional TRIAD grouping (EU15, US and Japan) and their relatively less developed geographical hinterlands. While the evidence in terms of factor intensities suggests that the relatively more developed economies have, in general, retained their comparative advantage in the capital, skill and technology intensive stages of these global / regional production networks, there is some evidence to suggest that their partners in S.E. Asia (including China), the Americas (excluding the US) and the EU10 are beginning to upgrade their involvement in these networks to more than just low skilled, labour intensive, type of activities. Even with this growing internationalisation of production and the emerging concerns regarding the outsourcing phenomenon, the present study suggests (from a trade perspective at least) that Europe has handled the post-1990 upsurge in worldwide integration in a relatively successful way. While the problems at the intra-EU level are well documented, insufficient attention is focussed in the media on the comparatively good performance of EU exporters on the global stage, with EU producers doing surprisingly well on extra-EU15 world markets over the period as a whole. Unlike the US and Japan, the EU has managed to maintain its dominant world market share position over the years 1992-2003 despite the emergence of countries such as China as major

42
trading powers. This global trade domination, to a large extent, reflects the fact that the EU is the market leader in a variety of medium technology and capital intensive goods industries, with EU member states being particularly strong globally in cars, pharmaceuticals and specialised equipment. Regarding the trade challenge posed by Asia, the paper shows that the EU has indeed a large and growing trade deficit both with China and with Asia as a whole (although these deficits have been more than compensated for by surpluses with the rest of the world). All 3 areas of Asia (which are examined in the analysis) have opened up significant trade surpluses with the EU, with our deficit with China now at similar levels to that of Japan. On the question of services trade, the paper shows that the US, India and the EU are presently the big winners from services outsourcing, with the US and the EU gaining from their natural comparative advantages in this area and India benefiting enormously from the growing tradeability of services, made possible by the widespread adoption of the internet. In fact the internet appears to have had a profound effect on "other services" trade (i.e. essentially business services), with the 1/3 upward level shift in global "other services" trade in the mid-1990's (equivalent in 2005 prices to an increase of close to $450 billion) largely a reflection of the influence of the internet. In terms of a breakdown of the world market in "other services" trade, the EU and the US are by far the biggest players, with the EU having a global share of 35% in 2003 (more than double its worldwide share in goods) and the US with 25%. While the EU and the US clearly continue to dominate the world's "business services" market (and indeed the total services market), India was undoubtedly the big winner in terms of gains in market share over the period 1992-2003. India witnessed a 6-fold increase in its share over this period, from ½% of the world market in 1992 to 3% in 2003. This growth in the success of India on world services markets does not however appear to have been at the expense of the EU, since the EU's surplus on its "other services" trade has been rising over the same period, particularly in recent years. In addition, the challenge of India should be put in perspective since it represents only a tiny fraction of the EU's overall "other services" trade (India has in fact less than a 1% share of total EU "other services" imports compared with well over 40% for the US) and we are in broad balance with India in relation to such trade (Annex 6). Such imports in fact are equivalent to only 0.01% of EU GDP. Consequently, while the future potential for such trade is enormous, on the basis of present levels, the media attention being devoted to services outsourcing to India, at least from the EU's perspective, is disproportionate to its macroeconomic significance. In overall terms, the study stresses that the EU has managed to retain its long-established title as the number 1 global trading power in both goods and services. In addition, it suggests that the EU has been a net gainer in terms of the outsourcing part of the production relocation phenomenon over the period 1992-2003, with the EU increasing its net surplus with the rest of the world in terms of its trade in intermediate goods and services from a ½% of GDP in 1992 to close to 1 ½% in 2003. With regard to more policy related issues, the study shows that the EU and China enjoy strong complementarities in terms of their trade structures, with the EU specialising in medium-high technology and capital goods, and with China focussing on low-technology, labour intensive and ICT related product areas. This complementarity pattern translates directly into
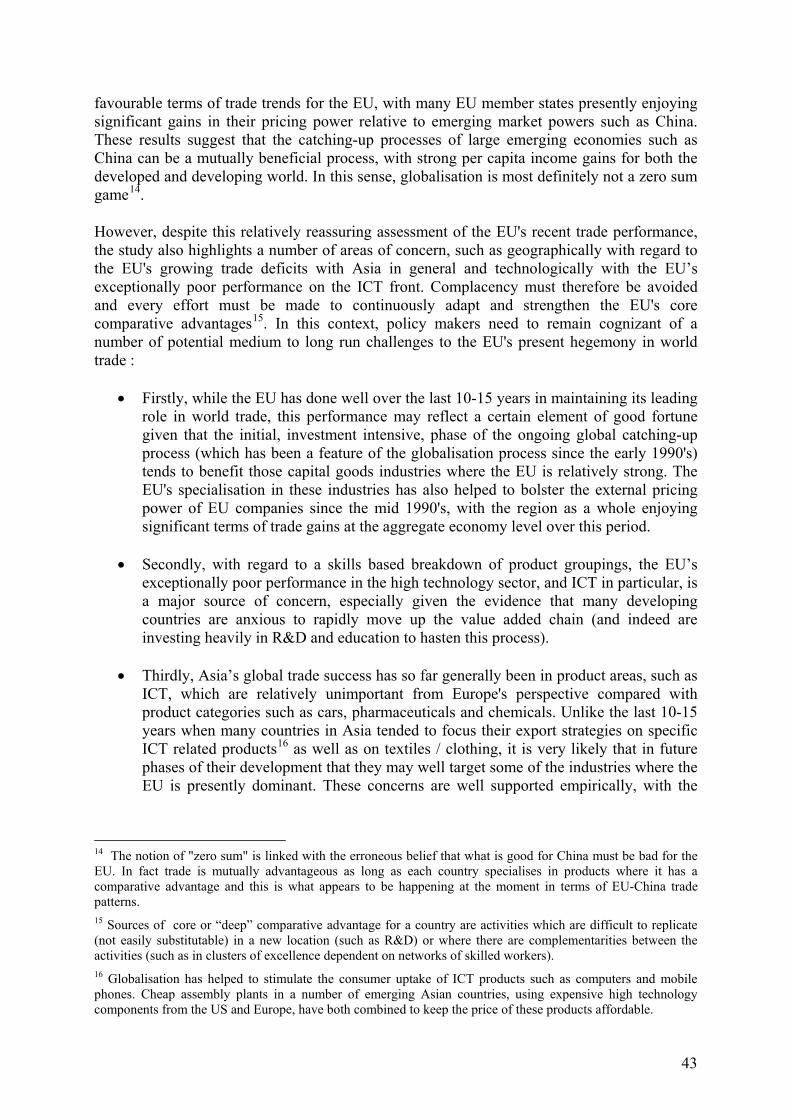
43
favourable terms of trade trends for the EU, with many EU member states presently enjoying significant gains in their pricing power relative to emerging market powers such as China. These results suggest that the catching-up processes of large emerging economies such as China can be a mutually beneficial process, with strong per capita income gains for both the developed and developing world. In this sense, globalisation is most definitely not a zero sum game14. However, despite this relatively reassuring assessment of the EU's recent trade performance, the study also highlights a number of areas of concern, such as geographically with regard to the EU's growing trade deficits with Asia in general and technologically with the EU’s exceptionally poor performance on the ICT front. Complacency must therefore be avoided and every effort must be made to continuously adapt and strengthen the EU's core comparative advantages15. In this context, policy makers need to remain cognizant of a number of potential medium to long run challenges to the EU's present hegemony in world trade :
• Firstly, while the EU has done well over the last 10-15 years in maintaining its leading role in world trade, this performance may reflect a certain element of good fortune given that the initial, investment intensive, phase of the ongoing global catching-up process (which has been a feature of the globalisation process since the early 1990's) tends to benefit those capital goods industries where the EU is relatively strong. The EU's specialisation in these industries has also helped to bolster the external pricing power of EU companies since the mid 1990's, with the region as a whole enjoying significant terms of trade gains at the aggregate economy level over this period.
• Secondly, with regard to a skills based breakdown of product groupings, the EU’s
exceptionally poor performance in the high technology sector, and ICT in particular, is a major source of concern, especially given the evidence that many developing countries are anxious to rapidly move up the value added chain (and indeed are investing heavily in R&D and education to hasten this process).
• Thirdly, Asia’s global trade success has so far generally been in product areas, such as
ICT, which are relatively unimportant from Europe's perspective compared with product categories such as cars, pharmaceuticals and chemicals. Unlike the last 10-15 years when many countries in Asia tended to focus their export strategies on specific ICT related products16 as well as on textiles / clothing, it is very likely that in future phases of their development that they may well target some of the industries where the EU is presently dominant. These concerns are well supported empirically, with the
14 The notion of "zero sum" is linked with the erroneous belief that what is good for China must be bad for the EU. In fact trade is mutually advantageous as long as each country specialises in products where it has a comparative advantage and this is what appears to be happening at the moment in terms of EU-China trade patterns. 15 Sources of core or “deep” comparative advantage for a country are activities which are difficult to replicate (not easily substitutable) in a new location (such as R&D) or where there are complementarities between the activities (such as in clusters of excellence dependent on networks of skilled workers). 16 Globalisation has helped to stimulate the consumer uptake of ICT products such as computers and mobile phones. Cheap assembly plants in a number of emerging Asian countries, using expensive high technology components from the US and Europe, have both combined to keep the price of these products affordable.
44
speed of the changes over the 1990’s in certain product categories17 and the EU’s inexplicably large gap in specific high technology areas suggesting that extrapolating forward a continuation of the relatively strong 1990’s performance could be a serious misjudgement.
• Fourthly, the product-based analysis of trade patterns in the paper suggests that while
geographical distance / transportation costs are key factors in explaining the heavily regionalised outsourcing trends for specific industries such as cars (EU15 to EU10; the US to Mexico and Brazil; and Japan to south east Asia, including China), they are less of an issue for the newer ICT related industries (US to China and south east Asia). This changing role for transportation / communication costs in the outsourcing decision-making process should alert the developed world to the potentially large economic impact of services outsourcing. If geographical distance is no longer an insurmountable obstacle, the adjustment costs could be considerable for those relatively advanced economies unable or unwilling to make the structural reforms necessary to ensure that they continue to gain from, technology and policy driven, services liberalisation.
• Finally, regarding the specific challenge of China, given the estimates of over 100
million low skilled agricultural workers needing to move into the manufacturing sector over the next 1-2 decades18, it appears that China’s comparative advantage is likely to remain in labour intensive products for many years to come. Given that the EU has a relatively high share of its exports in these low technology / labour intensive areas compared with the US or Japan, it is particularly vulnerable to the almost inevitable shift of global production in these industries to China (or other low cost producers) based on the principle of comparative advantage19.
17 The EU has experienced sharp turnarounds over this period in a number of product areas which have traditionally been EU strongholds. 18 See Lardy (2005) 19 The Financial Times in an editorial in January 2006 stressed the importance of reacting appropriately to the growing Chinese trade surplus in relatively low skilled sectors. It stated "….In shoes as in textiles something very different is happening : the natural shift of global production to countries with a comparative advantage after decades of rationing by quota. The EU and the US should distinguish between the desirable increase in China's surplus in these once-protected sectors (which increases efficiency and benefits consumers) and the undesirable increase in its overall surplus. They should focus not on sectoral protectionism but on encouraging China to boost domestic demand, modernise its inefficient financial system, reduce the need for saving and let the renminbi appreciate".
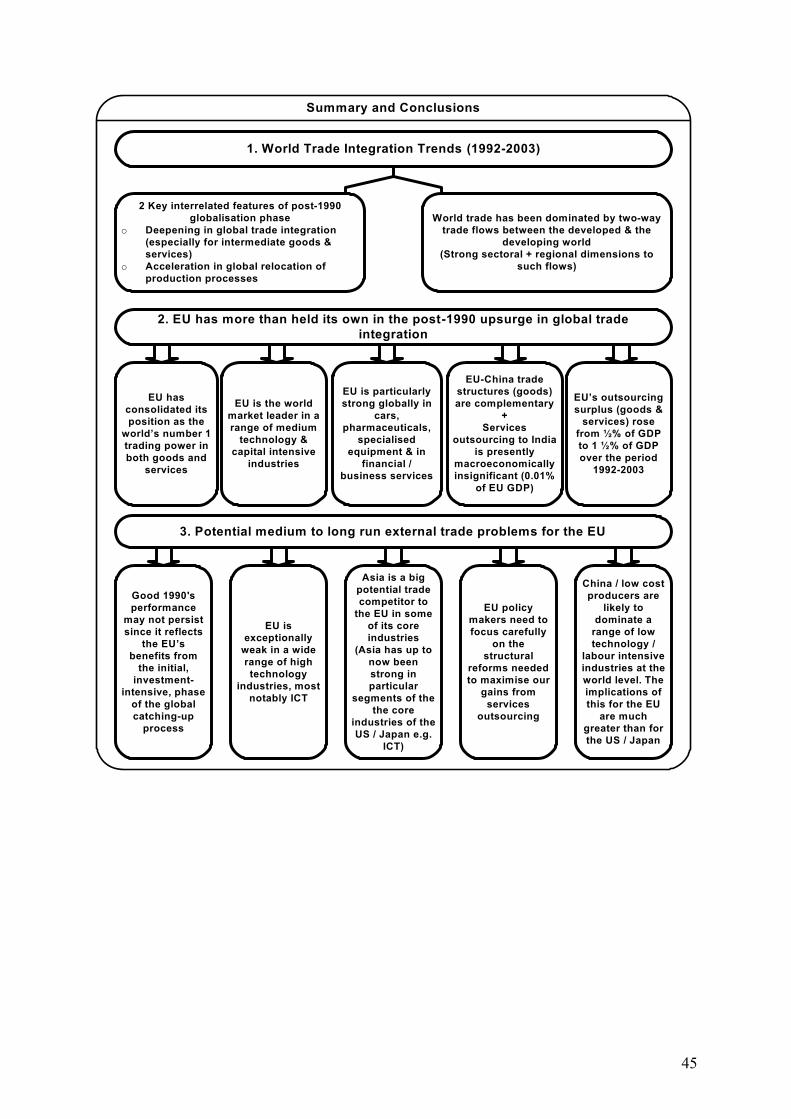
45
1. World Trade Integration Trends (1992-2003)
2 Key interrelated features of post-1990 globalisation phase
o Deepening in global trade integration (especially for intermediate goods & services)
o Acceleration in global relocation of production processes
World trade has been dominated by two-way trade flows between the developed & the
developing world(Strong sectoral + regional dimensions to
such flows)
EU has consolidated its position as the
world’s number 1 trading power in both goods and
services
2. EU has more than held its own in the post-1990 upsurge in global trade integration
Summary and Conclusions
EU is the world market leader in a range of medium
technology & capital intensive
industries
EU is particularly strong globally in
cars, pharmaceuticals,
specialised equipment & in
financial / business services
EU-China trade structures (goods) are complementary
+ Services
outsourcing to India is presently
macroeconomically insignificant (0.01%
of EU GDP)
EU’s outsourcing surplus (goods &
services) rose from ½% of GDP to 1 ½% of GDP over the period
1992-2003
3. Potential medium to long run external trade problems for the EU
Good 1990's performance
may not persist since it reflects
the EU’s benefits from
the initial, investment-
intensive, phase of the global catching-up
process
EU is exceptionally
weak in a wide range of high technology
industries, most notably ICT
Asia is a big potential trade competitor to
the EU in some of its core industries
(Asia has up to now been strong in particular
segments of the the core
industries of the US / Japan e.g.
ICT)
EU policy makers need to focus carefully
on the structural
reforms needed to maximise our
gains from services
outsourcing
China / low cost producers are
likely to dominate a
range of low technology /
labour intensive industries at the world level. The implications of this for the EU
are much greater than for the US / Japan
46
Annexes
1. Correspondence of the Broad Economic Categories (BEC) classification of imports with the basic classes of goods used in the national accounts 2. Classification of manufacturing industries based on technology intensity 3. Breakdown of total trade by factor intensity 4. Calculation method for the trade balance-based comparative advantage indicator (CEPII) 5. Trade analysis for the individual EU15 Member States - 1992-2003 (Goods) 6. Data on World Services Trade

47
Annex 1 : Correspondence of the Broad Economic Categories (BEC) classification of imports with the basic classes of goods used in the national accounts
THE CLASSIFICATION BY BROAD BASIC CLASSES OF GOODS ECONOMIC CATEGORIES (19 BEC Categories) IN THE NATIONAL ACCOUNTS (SNA) 1 FOOD AND BEVERAGES 11 PRIMARY 111* Mainly for industry (1) Intermediate goods 112* Mainly for household consumption (2) Consumption goods 12 PROCESSED 121* Mainly for industry (3) Intermediate goods (Semi-Finished) 122* Mainly for household (4) Consumption goods 2 INDUSTRIAL SUPPLIES N.E.C 21 PRIMARY (5) Intermediate goods 22 PROCESSED (6) Intermediate goods (Semi-Finished) 3 FUELS AND LUBRICANTS 31 PRIMARY (7) Intermediate goods 32 PROCESSED 321* Motor Spirit (8) Intermediate/Consumption goods [Dual Use Goods]* 322*Other (9) Intermediate goods (Semi-Finished) 4 CAPITAL GOODS (Except Transport + parts and accessories) 41 Capital goods (ex. transport) (10) Capital goods 42 Parts and accessories (11) Intermediate goods (Parts & Components) 5 TRANSPORT EQUIPMENT AND PARTS AND ACCESSORIES THEREOF 51 Passenger motor cars (12) Capital / Consumption goods [DUAL USE GOODS]* 52 Other 521* Industrial (13) Capital goods 522* Non-industrial (14) Consumption goods 53 Parts and accessories (15) Intermediate goods (Parts & Components) 6 CONSUMER GOODS N.E.C. 61 Durable (16) Consumption goods 62 Semi-durable (17) Consumption goods 63 Non-durable (18) Consumption goods 7 GOODS not elsewhere specified (19) Mix of national accounts classes*
(includes military equipment, postal packages and special transactions) * These three BEC categories are not allocated to specified national accounts classes of end-use. They are dual use goods categories such as BEC 8 (motor spirit); BEC 12 (passenger motor cars); and BEC 19 (goods NES). Source : UN
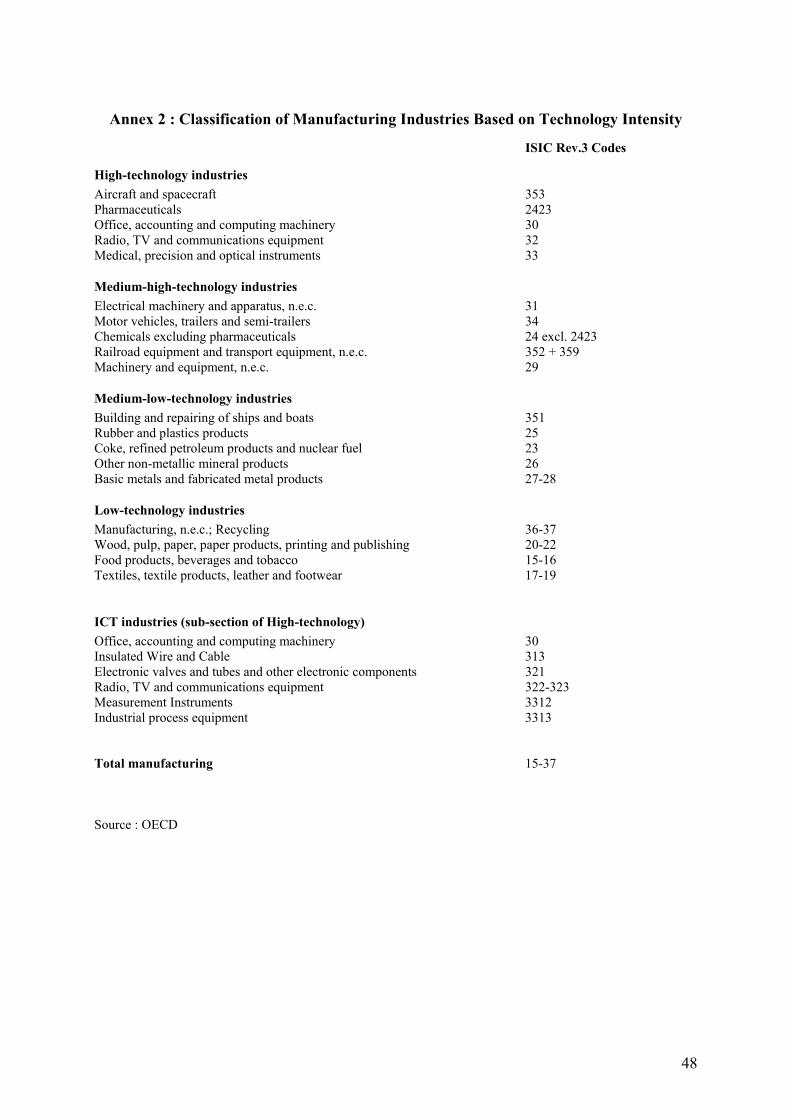
48
Annex 2 : Classification of Manufacturing Industries Based on Technology Intensity
ISIC Rev.3 Codes
High-technology industries Aircraft and spacecraft 353 Pharmaceuticals 2423 Office, accounting and computing machinery 30 Radio, TV and communications equipment 32 Medical, precision and optical instruments 33
Medium-high-technology industries Electrical machinery and apparatus, n.e.c. 31 Motor vehicles, trailers and semi-trailers 34 Chemicals excluding pharmaceuticals 24 excl. 2423 Railroad equipment and transport equipment, n.e.c. 352 + 359 Machinery and equipment, n.e.c. 29
Medium-low-technology industries Building and repairing of ships and boats 351 Rubber and plastics products 25 Coke, refined petroleum products and nuclear fuel 23 Other non-metallic mineral products 26 Basic metals and fabricated metal products 27-28
Low-technology industries Manufacturing, n.e.c.; Recycling 36-37 Wood, pulp, paper, paper products, printing and publishing 20-22 Food products, beverages and tobacco 15-16 Textiles, textile products, leather and footwear 17-19
ICT industries (sub-section of High-technology) Office, accounting and computing machinery 30 Insulated Wire and Cable 313 Electronic valves and tubes and other electronic components 321 Radio, TV and communications equipment 322-323 Measurement Instruments 3312 Industrial process equipment 3313 Total manufacturing 15-37 Source : OECD

49
Annex 3 : Breakdown of total trade by factor intensity Raw Material Intensive Goods
SITC 0 Food and Live Animals SITC 2 Crude Material, Inedible, Except Fuels (excluding 26) SITC 3 Mineral Fuels, Lubricants and Related Materials (excluding 35) SITC 4 Animal and Vegetable Oils, Fats and Waxes SITC 56 Fertilizers
Labour-Intensive Goods
SITC 26 Textile Fibres SITC 6 Manufactured Goods Classified Chiefly by Material (excluding 62, 67, 68) SITC 8 Miscellaneous Manufactured Articles (excluding 88, 87)
Capital-Intensive Goods
SITC 1 Beverages and Tobacco SITC 35 Electric Current SITC 53 Dyeing, Tanning and Colouring Materials SITC 55 Essential Oils and Resinoids and Perfume Materials; Cleansing Preparations SITC 62 Rubber Manufactures, n.e.s. SITC 67 Iron and Steel SITC 68 Non-Ferrous Metals SITC 78 Road Vehicles
Easy-to-Imitate Research-Intensive Goods
SITC 51 Organic Chemicals SITC 52 Inorganic Chemicals SITC 54 Medicinal and Pharmaceutical Products SITC 58 Plastics in Non-Primary Forms SITC 59 Chemical Materials and Products, n.e.s. SITC 75 Office Machines and Automatic Data-Processing Machines SITC 76 Telecommunications and Sound Apparatus and Equipment
Difficult-to-Imitate Research-Intensive Goods
SITC 57 Plastics in Primary Forms SITC 7 Machinery and Transport Equipment (includes semiconductors / excludes 75, 76, 78) SITC 87 Professional, Scientific and Controlling Instruments and Apparatus, n.e.s. SITC 88 Photographic Apparatus, Optical Goods n.e.s; Watches and Clocks.
Source : Yilmaz (2002) based on earlier work by Hufbauer and Chilas (1974)
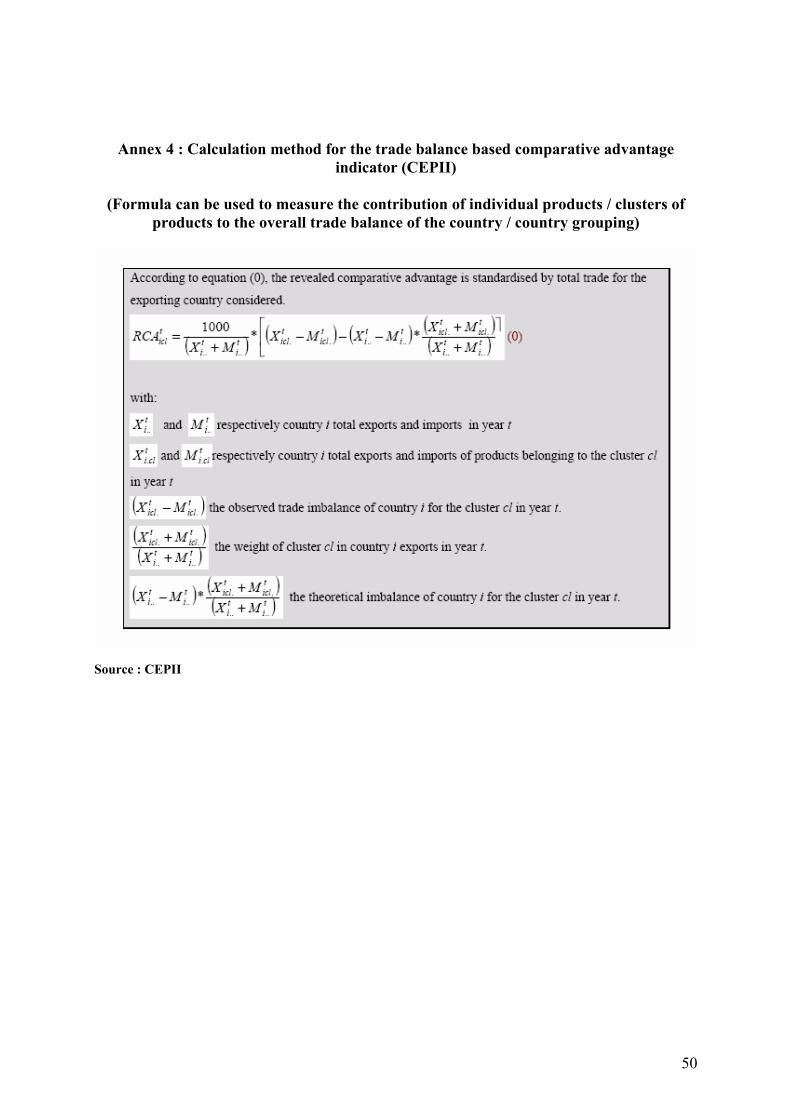
50
Annex 4 : Calculation method for the trade balance based comparative advantage indicator (CEPII)
(Formula can be used to measure the contribution of individual products / clusters of
products to the overall trade balance of the country / country grouping)
Source : CEPII

51
Annex 5 : Trade analysis for the individual EU15 Member States 1992-2003 (Goods)
Table 1 : % Share of Extra-EU15 World Exports 1992-1997 1998-2003 1992-1997 1998-2003
Top 20 Top 20 Total Excl Fuel Total Excl Fuel Belgium - 3.6 - 4.7 Denmark 1.5 1.4 2.7 2.3 Germany 31.3 31.7 29.1 29.7 Greece 0.2 0.2 0.5 0.6 Spain 2.4 2.7 3.4 3.8 France 16.1 14.4 13.8 12.8 Ireland 2.4 5.2 1.7 3.3 Italy 10.7 8.9 13.2 12.6 Netherlands 5.0 4.8 6.4 5.6 Austria 2.3 2.4 2.7 2.8 Portugal 0.3 0.3 0.6 0.5 Finland 2.3 2.6 2.1 2.4 Sweden 5.7 5.2 4.3 4.1 UK 16.4 16.0 14.0 13.9 EU15 100 100 100 100 Source : UN Comtrade, own calculations (Note : columns do not add to 100 due to an absence of data for Belgium / Luxembourg for certain years)

52
Graph 1 : % Shares of Extra-EU15 World Exports (France, Germany, Italy and UK)
1992 1994 1996 1998 2000 200210
12
14
16
18
20% Share of Extra-EU15 World Exports
Top 20
1992 1994 1996 1998 2000 200225
27
29
31
33
35% Share of Extra-EU15 World Exports
Total Non-Fuel
Top 20
Total Non-Fuel
France Germany
1992 1994 1996 1998 2000 20026
8
10
12
14
16% Share of Extra-EU15 World Exports
1992 1994 1996 1998 2000 200212
14
16
18
20% Share of Extra-EU15 World Exports
Total Non-Fuel
Top 20 Total Non-Fuel
Top 20
Italy UK
Source : UN Comtrade, own calculations

53
Graph 2 : Germany : Export Market Shares for the top 20 products
Semico
nductors
Motor Cars
Teleco
mmunicatio
ns Equipmen
t
Computers
Parts A
nd Acc
esso
ries f
or computer
s
Pharmac
eutic
als
Parts a
nd Acc
esso
ries f
or Motor V
ehicl
es
Electri
cal C
ircuits
Electri
cal M
achinery
Aircraf
t
0
20
40
60
% Share of Extra-EU15 World Exports
1992-1997 1998-2003 Change
Measu
ring Equipmen
t
Chemica
ls
Furnitu
re
Piston Engines
Paper
And Paperb
oard
Special
ized m
achinery
Clothing
Manufac
tures O
f Bas
e Meta
l
Plastic
s
Engines A
nd Motors
0
20
40
60
-20
% Share of Extra-EU15 World Exports
1992-1997 1998-2003 Change
Source : UN Comtrade, own calculations
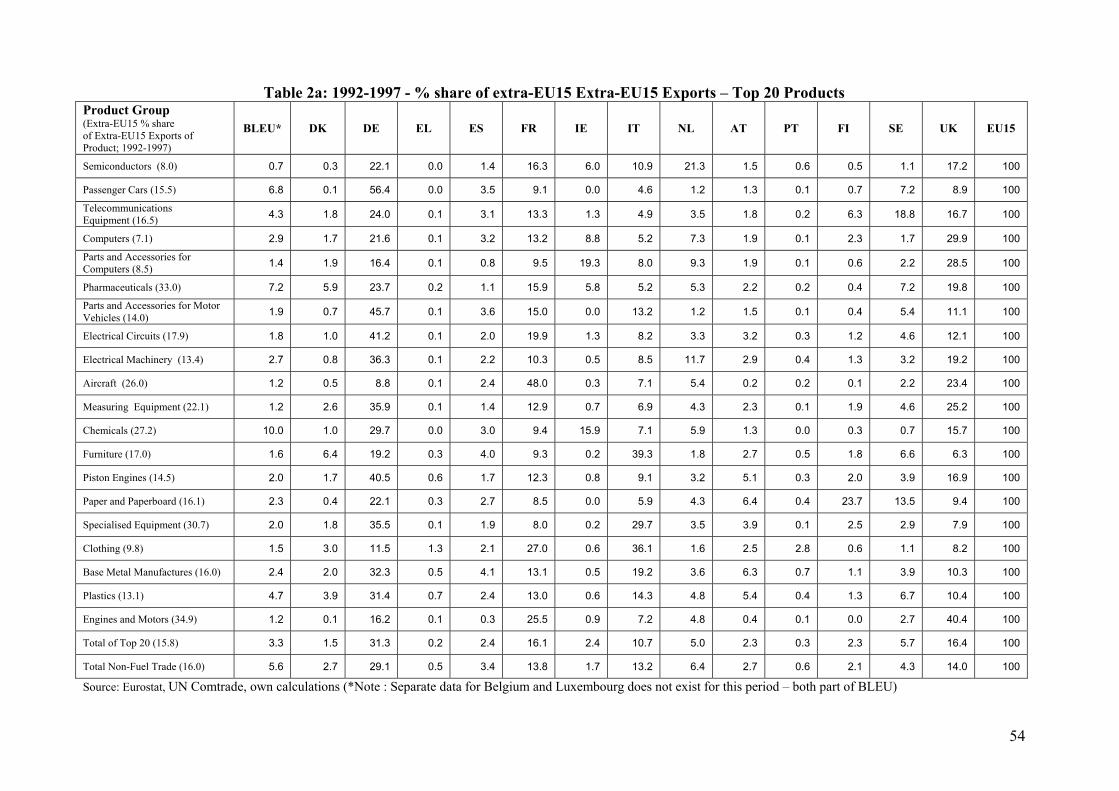
54
Table 2a: 1992-1997 - % share of extra-EU15 Extra-EU15 Exports – Top 20 Products Product Group (Extra-EU15 % share of Extra-EU15 Exports of Product; 1992-1997)
BLEU* DK DE EL ES FR IE IT NL AT PT FI SE UK EU15
Semiconductors (8.0) 0.7 0.3 22.1 0.0 1.4 16.3 6.0 10.9 21.3 1.5 0.6 0.5 1.1 17.2 100
Passenger Cars (15.5) 6.8 0.1 56.4 0.0 3.5 9.1 0.0 4.6 1.2 1.3 0.1 0.7 7.2 8.9 100
Telecommunications Equipment (16.5) 4.3 1.8 24.0 0.1 3.1 13.3 1.3 4.9 3.5 1.8 0.2 6.3 18.8 16.7 100
Computers (7.1) 2.9 1.7 21.6 0.1 3.2 13.2 8.8 5.2 7.3 1.9 0.1 2.3 1.7 29.9 100
Parts and Accessories for Computers (8.5) 1.4 1.9 16.4 0.1 0.8 9.5 19.3 8.0 9.3 1.9 0.1 0.6 2.2 28.5 100
Pharmaceuticals (33.0) 7.2 5.9 23.7 0.2 1.1 15.9 5.8 5.2 5.3 2.2 0.2 0.4 7.2 19.8 100
Parts and Accessories for Motor Vehicles (14.0) 1.9 0.7 45.7 0.1 3.6 15.0 0.0 13.2 1.2 1.5 0.1 0.4 5.4 11.1 100
Electrical Circuits (17.9) 1.8 1.0 41.2 0.1 2.0 19.9 1.3 8.2 3.3 3.2 0.3 1.2 4.6 12.1 100
Electrical Machinery (13.4) 2.7 0.8 36.3 0.1 2.2 10.3 0.5 8.5 11.7 2.9 0.4 1.3 3.2 19.2 100
Aircraft (26.0) 1.2 0.5 8.8 0.1 2.4 48.0 0.3 7.1 5.4 0.2 0.2 0.1 2.2 23.4 100
Measuring Equipment (22.1) 1.2 2.6 35.9 0.1 1.4 12.9 0.7 6.9 4.3 2.3 0.1 1.9 4.6 25.2 100
Chemicals (27.2) 10.0 1.0 29.7 0.0 3.0 9.4 15.9 7.1 5.9 1.3 0.0 0.3 0.7 15.7 100
Furniture (17.0) 1.6 6.4 19.2 0.3 4.0 9.3 0.2 39.3 1.8 2.7 0.5 1.8 6.6 6.3 100
Piston Engines (14.5) 2.0 1.7 40.5 0.6 1.7 12.3 0.8 9.1 3.2 5.1 0.3 2.0 3.9 16.9 100
Paper and Paperboard (16.1) 2.3 0.4 22.1 0.3 2.7 8.5 0.0 5.9 4.3 6.4 0.4 23.7 13.5 9.4 100
Specialised Equipment (30.7) 2.0 1.8 35.5 0.1 1.9 8.0 0.2 29.7 3.5 3.9 0.1 2.5 2.9 7.9 100
Clothing (9.8) 1.5 3.0 11.5 1.3 2.1 27.0 0.6 36.1 1.6 2.5 2.8 0.6 1.1 8.2 100
Base Metal Manufactures (16.0) 2.4 2.0 32.3 0.5 4.1 13.1 0.5 19.2 3.6 6.3 0.7 1.1 3.9 10.3 100
Plastics (13.1) 4.7 3.9 31.4 0.7 2.4 13.0 0.6 14.3 4.8 5.4 0.4 1.3 6.7 10.4 100
Engines and Motors (34.9) 1.2 0.1 16.2 0.1 0.3 25.5 0.9 7.2 4.8 0.4 0.1 0.0 2.7 40.4 100
Total of Top 20 (15.8) 3.3 1.5 31.3 0.2 2.4 16.1 2.4 10.7 5.0 2.3 0.3 2.3 5.7 16.4 100
Total Non-Fuel Trade (16.0) 5.6 2.7 29.1 0.5 3.4 13.8 1.7 13.2 6.4 2.7 0.6 2.1 4.3 14.0 100
Source: Eurostat, UN Comtrade, own calculations (*Note : Separate data for Belgium and Luxembourg does not exist for this period – both part of BLEU)

55
Table 2b: 1998-2003 - % share of extra-EU15 Extra-EU15 Exports – Top 20 Products Product Group (Extra-EU15 % share of Extra-EU15 Exports of Product; 1998-2003)
BE DK DE EL ES FR IE IT LU NL AT PT FI SE UK EU15
Semiconductors (8.2) 1.0 0.4 27.9 0.0 1.3 19.0 11.7 8.2 0.0 14.7 1.7 1.1 1.2 1.2 10.6 100
Passenger Cars (16.2) 6.6 0.2 59.6 0.0 4.0 7.9 0.0 2.7 0.0 1.7 1.8 0.0 0.6 4.3 10.6 100
Telecommunications Equipment (16.5) 3.1 1.5 19.5 0.5 1.9 14.1 3.1 4.9 0.0 3.4 1.5 0.2 11.7 18.6 16.0 100
Computers (7.5) 3.9 1.0 19.9 0.1 1.5 12.3 15.2 2.1 0.0 19.2 1.8 0.1 1.4 1.6 19.9 100
Parts and Accessories for Computers (8.5) 2.0 1.6 16.8 0.2 0.9 6.6 27.2 5.3 0.0 14.0 1.6 0.4 0.6 1.4 21.4 100
Pharmaceuticals (32.7) 11.6 4.8 23.0 0.2 1.2 14.8 6.6 6.6 0.0 4.2 2.5 0.2 0.5 6.0 17.8 100
Parts and Accessories for Motor Vehicles (14.1) 2.8 0.6 41.1 0.1 7.2 14.7 0.1 13.8 0.0 1.7 2.0 0.3 0.4 4.4 10.8 100
Electrical Circuits (17.1) 2.3 0.9 40.7 0.2 2.6 18.1 1.9 7.5 0.3 2.7 3.7 0.4 1.7 4.2 13.1 100
Electrical Machinery (12.8) 4.5 1.2 39.9 0.2 3.0 10.8 0.7 6.4 0.1 6.2 2.6 0.7 1.5 4.1 18.2 100
Aircraft (25.6) 1.1 0.5 16.1 0.3 2.2 39.2 0.6 6.8 0.1 1.2 0.5 0.4 0.3 1.4 29.4 100
Measuring Equipment (21.9) 1.5 2.3 37.0 0.1 1.4 11.3 1.0 6.2 0.1 4.7 2.2 0.1 2.4 4.3 25.5 100
Chemicals (34.7) 13.8 0.1 18.0 0.0 2.2 6.5 38.3 4.7 0.0 2.9 1.4 0.1 0.2 0.3 11.5 100
Furniture (15.7) 2.3 5.8 18.5 0.2 4.9 9.0 0.2 40.2 0.0 1.5 2.9 0.5 1.2 6.4 6.4 100
Piston Engines (15.0) 2.4 1.4 49.0 0.6 2.3 8.0 1.1 7.4 0.0 2.7 5.9 0.3 2.4 3.1 13.4 100
Paper and Paperboard (17.4) 2.1 0.3 27.2 0.3 3.1 7.9 0.1 6.5 0.1 4.9 5.3 0.6 21.9 13.1 6.7 100
Specialised Equipment (28.3) 2.1 1.6 36.4 0.1 2.1 8.0 0.5 26.9 0.2 3.7 4.7 0.2 2.6 3.1 8.0 100
Clothing (8.8) 1.8 3.2 11.8 1.6 5.2 25.5 0.2 37.1 0.0 1.5 1.7 1.8 0.5 1.2 6.9 100
Base Metal Manufactures (16.6) 2.4 1.8 36.0 0.5 4.4 11.6 0.2 17.8 0.1 3.7 5.9 0.5 1.2 3.8 10.2 100
Plastics (13.3) 5.0 3.4 33.0 0.8 4.0 12.2 0.9 14.8 0.4 3.9 5.0 0.4 1.2 5.7 9.7 100
Engines and Motors (34.9) 1.5 0.1 22.6 0.1 0.4 20.1 0.7 5.9 0.1 4.8 0.7 0.1 0.0 3.7 39.3 100
Total of Top 20 (16.1) 4.2 1.4 31.7 0.2 2.7 14.4 5.2 8.9 0.1 4.8 2.4 0.3 2.6 5.2 16.0 100
Total Non-Fuel Trade (15.9) 5.6 2.3 29.7 0.6 3.8 12.8 3.3 12.6 0.1 5.6 2.8 0.5 2.4 4.1 13.9 100
Source: Eurostat, UN Comtrade, own calculations

56
Annex 6 : Data on World Services Trade
6 A : EU15 Total Services Trade with World
(Total = Transportation + Tourism + "Other Services"20) EU15 total services trade with world
(Billions of Euros - €)
CREDIT 1992 1993 1994 1995 1996 1997 1998 1999 2000 2001 2002 2003 2004WORLD 352,8 372,8 393,4 397,8 441,6 498,7 522,9 580,5 677,6 720,4 748,8 748,5 812,5Intra EU15 193,6 206,2 219,1 221,6 241,3 263,0 281,8 315,8 368,0 393,5 414,4 412,9 445,2Extra EU15 159,2 166,6 174,3 176,3 200,3 235,8 241,1 264,7 309,6 327,0 334,4 335,6 367,3USA 59,6 61,9 64,8 60,2 65,7 82,2 80,9 96,2 117,8 117,2 119,6 107,4 113,1China 1,0 1,4 1,5 1,5 1,8 2,4 2,6 2,7 3,5 4,3 5,3 6,7 8,7Japan 9,9 10,7 10,9 11,0 13,4 14,7 14,7 16,3 18,6 18,1 17,6 16,4 18,2India 1,2 1,1 1,6 1,4 1,9 2,5 2,8 2,5 2,5 2,7 2,6 2,8 3,4ROW 87,5 91,5 95,5 102,1 117,5 134,0 140,0 147,0 167,2 184,7 189,2 202,3 223,8
DEBIT 1992 1993 1994 1995 1996 1997 1998 1999 2000 2001 2002 2003 2004WORLD 345,5 361,1 384,0 392,4 428,5 478,5 507,7 575,4 671,3 715,6 731,0 719,6 764,3Intra EU15 200,1 207,4 221,5 228,1 241,8 260,4 278,5 316,5 366,9 396,2 417,7 413,7 431,7Extra EU15 145,4 153,7 162,4 164,2 186,8 218,1 229,2 258,9 304,4 319,5 313,3 305,9 332,6USA 54,5 57,0 59,2 57,6 63,5 75,7 81,7 101,6 116,0 119,2 109,6 97,6 101,3China 1,0 1,2 1,5 1,7 2,1 2,6 3,1 2,9 3,5 4,3 5,1 4,9 7,1Japan 6,1 6,4 6,6 6,9 7,2 7,8 7,9 8,8 10,3 11,3 9,3 9,9 10,0India 1,2 1,2 1,5 1,5 1,6 2,0 2,2 2,4 2,5 2,9 2,7 3,0 3,8ROW 82,5 87,8 93,6 96,5 112,3 130,0 134,3 143,2 172,1 181,8 186,5 190,5 210,4
NET 1992 1993 1994 1995 1996 1997 1998 1999 2000 2001 2002 2003 2004WORLD 7,3 11,7 9,4 5,5 13,1 20,2 15,2 5,1 6,4 4,8 17,8 29,0 48,2Intra EU15 -6,5 -1,2 -2,5 -6,6 -0,5 2,6 3,3 -0,7 1,2 -2,7 -3,3 -0,8 13,5Extra EU15 13,8 12,9 11,9 12,0 13,5 17,6 11,9 5,8 5,2 7,5 21,1 29,7 34,7USA 5,1 4,9 5,6 2,6 2,2 6,5 -0,7 -5,4 1,8 -2,0 10,0 9,8 11,8China 0,0 0,2 -0,1 -0,2 -0,2 -0,2 -0,4 -0,1 -0,1 0,0 0,2 1,8 1,6Japan 3,8 4,2 4,3 4,1 6,2 6,9 6,8 7,5 8,4 6,8 8,3 6,5 8,2India 0,0 -0,1 0,2 -0,1 0,2 0,5 0,7 0,1 0,1 -0,2 -0,1 -0,2 -0,4ROW 5,0 3,7 1,8 5,6 5,2 3,9 5,6 3,8 -4,9 2,8 2,6 11,8 13,5
EU15 total services trade with world(% of GDP)
CREDIT 1992 1993 1994 1995 1996 1997 1998 1999 2000 2001 2002 2003 2004WORLD 5,75 6,06 6,09 5,93 6,27 6,73 6,75 7,12 7,78 7,98 8,00 7,86 8,15Intra EU15 3,15 3,35 3,39 3,30 3,43 3,55 3,64 3,87 4,22 4,36 4,43 4,34 4,47Extra EU15 2,59 2,71 2,70 2,63 2,84 3,18 3,11 3,25 3,55 3,62 3,57 3,53 3,69USA 0,97 1,01 1,00 0,90 0,93 1,11 1,04 1,18 1,35 1,30 1,28 1,13 1,13China 0,02 0,02 0,02 0,02 0,03 0,03 0,03 0,03 0,04 0,05 0,06 0,07 0,09Japan 0,16 0,17 0,17 0,16 0,19 0,20 0,19 0,20 0,21 0,20 0,19 0,17 0,18India 0,02 0,02 0,03 0,02 0,03 0,03 0,04 0,03 0,03 0,03 0,03 0,03 0,03ROW 1,42 1,49 1,48 1,52 1,67 1,81 1,81 1,80 1,92 2,04 2,02 2,13 2,25
DEBIT 1992 1993 1994 1995 1996 1997 1998 1999 2000 2001 2002 2003 2004WORLD 5,63 5,87 5,95 5,85 6,08 6,45 6,55 7,06 7,71 7,92 7,81 7,56 7,67Intra EU15 3,26 3,37 3,43 3,40 3,43 3,51 3,59 3,88 4,21 4,39 4,46 4,35 4,33Extra EU15 2,37 2,50 2,52 2,45 2,65 2,94 2,96 3,18 3,49 3,54 3,35 3,21 3,34USA 0,89 0,93 0,92 0,86 0,90 1,02 1,05 1,25 1,33 1,32 1,17 1,03 1,02China 0,02 0,02 0,02 0,03 0,03 0,04 0,04 0,04 0,04 0,05 0,05 0,05 0,07Japan 0,10 0,10 0,10 0,10 0,10 0,11 0,10 0,11 0,12 0,13 0,10 0,10 0,10India 0,02 0,02 0,02 0,02 0,02 0,03 0,03 0,03 0,03 0,03 0,03 0,03 0,04ROW 1,34 1,43 1,45 1,44 1,59 1,75 1,73 1,76 1,98 2,01 1,99 2,00 2,11
NET 1992 1993 1994 1995 1996 1997 1998 1999 2000 2001 2002 2003 2004WORLD 0,119 0,190 0,145 0,081 0,186 0,273 0,196 0,063 0,073 0,053 0,190 0,304 0,483Intra EU15 -0,107 -0,019 -0,038 -0,098 -0,006 0,035 0,042 -0,009 0,013 -0,030 -0,036 -0,008 0,135Extra EU15 0,225 0,210 0,184 0,179 0,192 0,238 0,154 0,072 0,060 0,083 0,226 0,312 0,348USA 0,083 0,080 0,087 0,039 0,031 0,088 -0,009 -0,067 0,020 -0,022 0,107 0,103 0,118China 0,000 0,003 -0,001 -0,003 -0,004 -0,002 -0,006 -0,002 -0,001 0,000 0,002 0,019 0,016Japan 0,062 0,069 0,066 0,061 0,088 0,092 0,087 0,092 0,096 0,076 0,089 0,068 0,082India 0,000 -0,001 0,003 -0,001 0,003 0,007 0,009 0,002 0,001 -0,002 -0,001 -0,002 -0,004ROW 0,081 0,060 0,029 0,083 0,073 0,053 0,073 0,047 -0,057 0,031 0,028 0,124 0,135 Source : Eurostat
20 Other services is made up of a range of essentially business related services and is broken down into 9 sub-components (communications, construction, insurance, financial, computer and information, royalties and license fees, other business services, personal and cultural, and government).
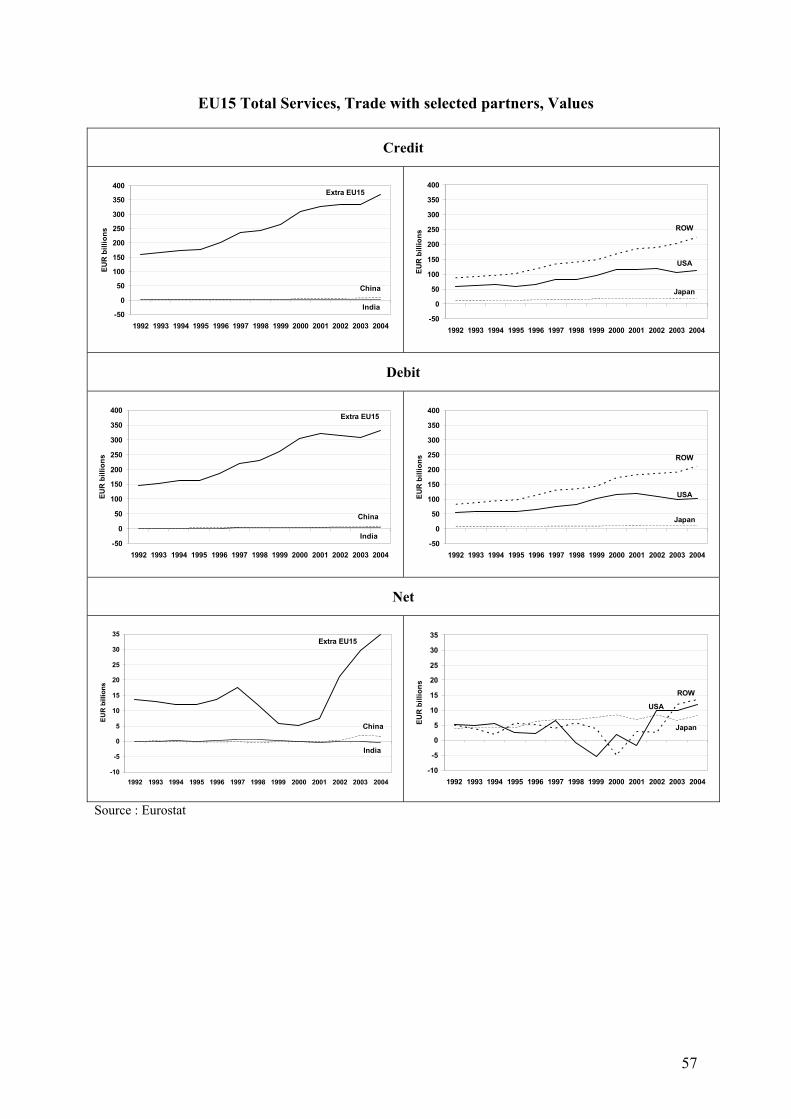
57
EU15 Total Services, Trade with selected partners, Values
Credit
-50
0
50
100
150
200
250
300
350
400
1992 1993 1994 1995 1996 1997 1998 1999 2000 2001 2002 2003 2004
EUR
bill
ions
Extra EU15
China
India-50
0
50
100
150
200
250
300
350
400
1992 1993 1994 1995 1996 1997 1998 1999 2000 2001 2002 2003 2004
EUR
bill
ions
ROW
USA
Japan
Debit
-50
0
50
100
150
200
250
300
350
400
1992 1993 1994 1995 1996 1997 1998 1999 2000 2001 2002 2003 2004
EUR
bill
ions
Extra EU15
China
India-50
0
50
100
150
200
250
300
350
400
1992 1993 1994 1995 1996 1997 1998 1999 2000 2001 2002 2003 2004
EUR
bill
ions ROW
USA
Japan
Net
-10
-5
0
5
10
15
20
25
30
35
1992 1993 1994 1995 1996 1997 1998 1999 2000 2001 2002 2003 2004
EUR
bill
ions
Extra EU15
China
India
-10
-5
0
5
10
15
20
25
30
35
1992 1993 1994 1995 1996 1997 1998 1999 2000 2001 2002 2003 2004
EUR
bill
ions
ROW
USA
Japan
Source : Eurostat
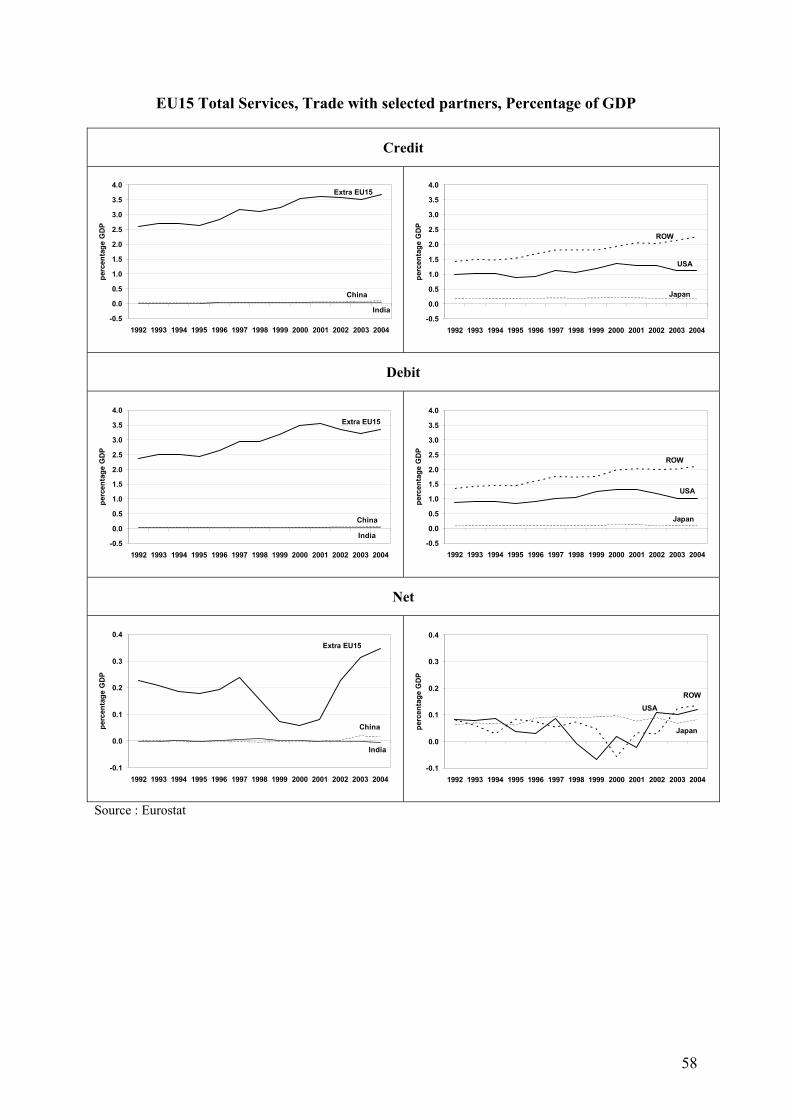
58
EU15 Total Services, Trade with selected partners, Percentage of GDP
Credit
-0.5
0.0
0.5
1.0
1.5
2.0
2.5
3.0
3.5
4.0
1992 1993 1994 1995 1996 1997 1998 1999 2000 2001 2002 2003 2004
perc
enta
ge G
DP
Extra EU15
China
India-0.5
0.0
0.5
1.0
1.5
2.0
2.5
3.0
3.5
4.0
1992 1993 1994 1995 1996 1997 1998 1999 2000 2001 2002 2003 2004
perc
enta
ge G
DP
ROW
USA
Japan
Debit
-0.5
0.0
0.5
1.0
1.5
2.0
2.5
3.0
3.5
4.0
1992 1993 1994 1995 1996 1997 1998 1999 2000 2001 2002 2003 2004
perc
enta
ge G
DP
Extra EU15
China
India-0.5
0.0
0.5
1.0
1.5
2.0
2.5
3.0
3.5
4.0
1992 1993 1994 1995 1996 1997 1998 1999 2000 2001 2002 2003 2004
perc
enta
ge G
DP
ROW
USA
Japan
Net
-0.1
0.0
0.1
0.2
0.3
0.4
1992 1993 1994 1995 1996 1997 1998 1999 2000 2001 2002 2003 2004
perc
enta
ge G
DP
Extra EU15
China
India
-0.1
0.0
0.1
0.2
0.3
0.4
1992 1993 1994 1995 1996 1997 1998 1999 2000 2001 2002 2003 2004
perc
enta
ge G
DP
Japan
USA
ROW
Source : Eurostat
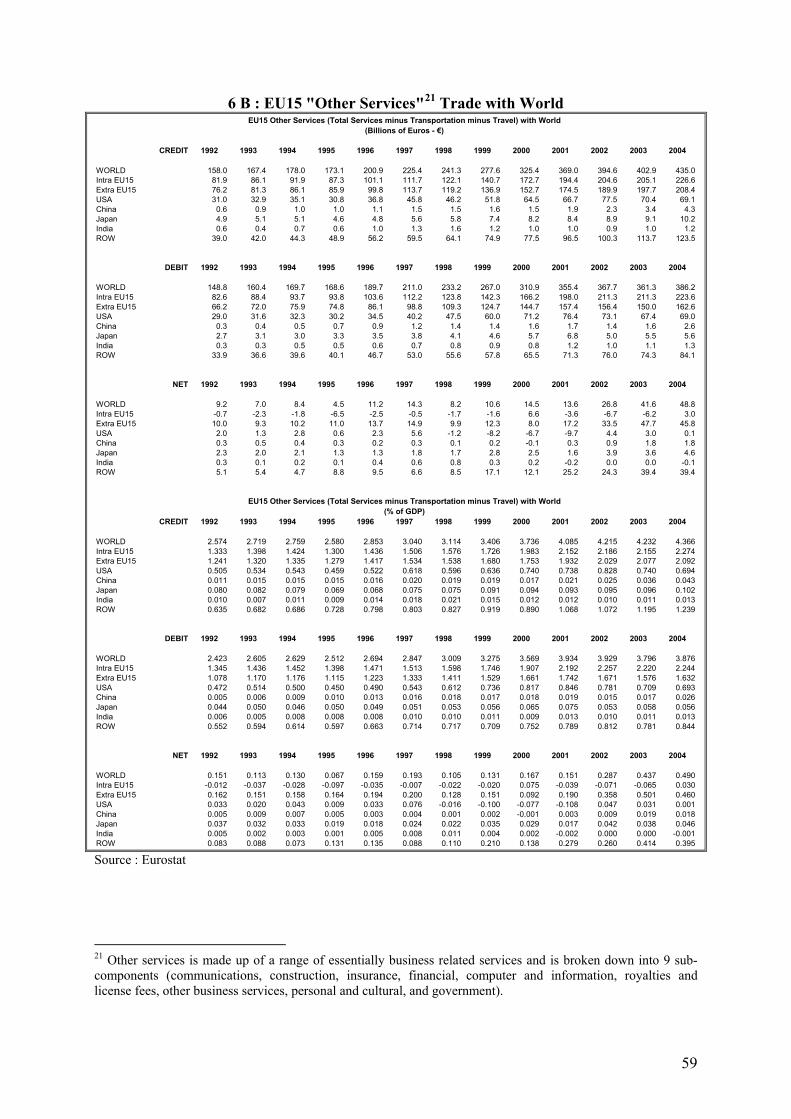
59
6 B : EU15 "Other Services"21 Trade with World EU15 Other Services (Total Services minus Transportation minus Travel) with World
(Billions of Euros - €)
CREDIT 1992 1993 1994 1995 1996 1997 1998 1999 2000 2001 2002 2003 2004
WORLD 158.0 167.4 178.0 173.1 200.9 225.4 241.3 277.6 325.4 369.0 394.6 402.9 435.0Intra EU15 81.9 86.1 91.9 87.3 101.1 111.7 122.1 140.7 172.7 194.4 204.6 205.1 226.6Extra EU15 76.2 81.3 86.1 85.9 99.8 113.7 119.2 136.9 152.7 174.5 189.9 197.7 208.4USA 31.0 32.9 35.1 30.8 36.8 45.8 46.2 51.8 64.5 66.7 77.5 70.4 69.1China 0.6 0.9 1.0 1.0 1.1 1.5 1.5 1.6 1.5 1.9 2.3 3.4 4.3Japan 4.9 5.1 5.1 4.6 4.8 5.6 5.8 7.4 8.2 8.4 8.9 9.1 10.2India 0.6 0.4 0.7 0.6 1.0 1.3 1.6 1.2 1.0 1.0 0.9 1.0 1.2ROW 39.0 42.0 44.3 48.9 56.2 59.5 64.1 74.9 77.5 96.5 100.3 113.7 123.5
DEBIT 1992 1993 1994 1995 1996 1997 1998 1999 2000 2001 2002 2003 2004
WORLD 148.8 160.4 169.7 168.6 189.7 211.0 233.2 267.0 310.9 355.4 367.7 361.3 386.2Intra EU15 82.6 88.4 93.7 93.8 103.6 112.2 123.8 142.3 166.2 198.0 211.3 211.3 223.6Extra EU15 66.2 72.0 75.9 74.8 86.1 98.8 109.3 124.7 144.7 157.4 156.4 150.0 162.6USA 29.0 31.6 32.3 30.2 34.5 40.2 47.5 60.0 71.2 76.4 73.1 67.4 69.0China 0.3 0.4 0.5 0.7 0.9 1.2 1.4 1.4 1.6 1.7 1.4 1.6 2.6Japan 2.7 3.1 3.0 3.3 3.5 3.8 4.1 4.6 5.7 6.8 5.0 5.5 5.6India 0.3 0.3 0.5 0.5 0.6 0.7 0.8 0.9 0.8 1.2 1.0 1.1 1.3ROW 33.9 36.6 39.6 40.1 46.7 53.0 55.6 57.8 65.5 71.3 76.0 74.3 84.1
NET 1992 1993 1994 1995 1996 1997 1998 1999 2000 2001 2002 2003 2004
WORLD 9.2 7.0 8.4 4.5 11.2 14.3 8.2 10.6 14.5 13.6 26.8 41.6 48.8Intra EU15 -0.7 -2.3 -1.8 -6.5 -2.5 -0.5 -1.7 -1.6 6.6 -3.6 -6.7 -6.2 3.0Extra EU15 10.0 9.3 10.2 11.0 13.7 14.9 9.9 12.3 8.0 17.2 33.5 47.7 45.8USA 2.0 1.3 2.8 0.6 2.3 5.6 -1.2 -8.2 -6.7 -9.7 4.4 3.0 0.1China 0.3 0.5 0.4 0.3 0.2 0.3 0.1 0.2 -0.1 0.3 0.9 1.8 1.8Japan 2.3 2.0 2.1 1.3 1.3 1.8 1.7 2.8 2.5 1.6 3.9 3.6 4.6India 0.3 0.1 0.2 0.1 0.4 0.6 0.8 0.3 0.2 -0.2 0.0 0.0 -0.1ROW 5.1 5.4 4.7 8.8 9.5 6.6 8.5 17.1 12.1 25.2 24.3 39.4 39.4
EU15 Other Services (Total Services minus Transportation minus Travel) with World(% of GDP)
CREDIT 1992 1993 1994 1995 1996 1997 1998 1999 2000 2001 2002 2003 2004
WORLD 2.574 2.719 2.759 2.580 2.853 3.040 3.114 3.406 3.736 4.085 4.215 4.232 4.366Intra EU15 1.333 1.398 1.424 1.300 1.436 1.506 1.576 1.726 1.983 2.152 2.186 2.155 2.274Extra EU15 1.241 1.320 1.335 1.279 1.417 1.534 1.538 1.680 1.753 1.932 2.029 2.077 2.092USA 0.505 0.534 0.543 0.459 0.522 0.618 0.596 0.636 0.740 0.738 0.828 0.740 0.694China 0.011 0.015 0.015 0.015 0.016 0.020 0.019 0.019 0.017 0.021 0.025 0.036 0.043Japan 0.080 0.082 0.079 0.069 0.068 0.075 0.075 0.091 0.094 0.093 0.095 0.096 0.102India 0.010 0.007 0.011 0.009 0.014 0.018 0.021 0.015 0.012 0.012 0.010 0.011 0.013ROW 0.635 0.682 0.686 0.728 0.798 0.803 0.827 0.919 0.890 1.068 1.072 1.195 1.239
DEBIT 1992 1993 1994 1995 1996 1997 1998 1999 2000 2001 2002 2003 2004
WORLD 2.423 2.605 2.629 2.512 2.694 2.847 3.009 3.275 3.569 3.934 3.929 3.796 3.876Intra EU15 1.345 1.436 1.452 1.398 1.471 1.513 1.598 1.746 1.907 2.192 2.257 2.220 2.244Extra EU15 1.078 1.170 1.176 1.115 1.223 1.333 1.411 1.529 1.661 1.742 1.671 1.576 1.632USA 0.472 0.514 0.500 0.450 0.490 0.543 0.612 0.736 0.817 0.846 0.781 0.709 0.693China 0.005 0.006 0.009 0.010 0.013 0.016 0.018 0.017 0.018 0.019 0.015 0.017 0.026Japan 0.044 0.050 0.046 0.050 0.049 0.051 0.053 0.056 0.065 0.075 0.053 0.058 0.056India 0.006 0.005 0.008 0.008 0.008 0.010 0.010 0.011 0.009 0.013 0.010 0.011 0.013ROW 0.552 0.594 0.614 0.597 0.663 0.714 0.717 0.709 0.752 0.789 0.812 0.781 0.844
NET 1992 1993 1994 1995 1996 1997 1998 1999 2000 2001 2002 2003 2004
WORLD 0.151 0.113 0.130 0.067 0.159 0.193 0.105 0.131 0.167 0.151 0.287 0.437 0.490Intra EU15 -0.012 -0.037 -0.028 -0.097 -0.035 -0.007 -0.022 -0.020 0.075 -0.039 -0.071 -0.065 0.030Extra EU15 0.162 0.151 0.158 0.164 0.194 0.200 0.128 0.151 0.092 0.190 0.358 0.501 0.460USA 0.033 0.020 0.043 0.009 0.033 0.076 -0.016 -0.100 -0.077 -0.108 0.047 0.031 0.001China 0.005 0.009 0.007 0.005 0.003 0.004 0.001 0.002 -0.001 0.003 0.009 0.019 0.018Japan 0.037 0.032 0.033 0.019 0.018 0.024 0.022 0.035 0.029 0.017 0.042 0.038 0.046India 0.005 0.002 0.003 0.001 0.005 0.008 0.011 0.004 0.002 -0.002 0.000 0.000 -0.001ROW 0.083 0.088 0.073 0.131 0.135 0.088 0.110 0.210 0.138 0.279 0.260 0.414 0.395 Source : Eurostat
21 Other services is made up of a range of essentially business related services and is broken down into 9 sub-components (communications, construction, insurance, financial, computer and information, royalties and license fees, other business services, personal and cultural, and government).
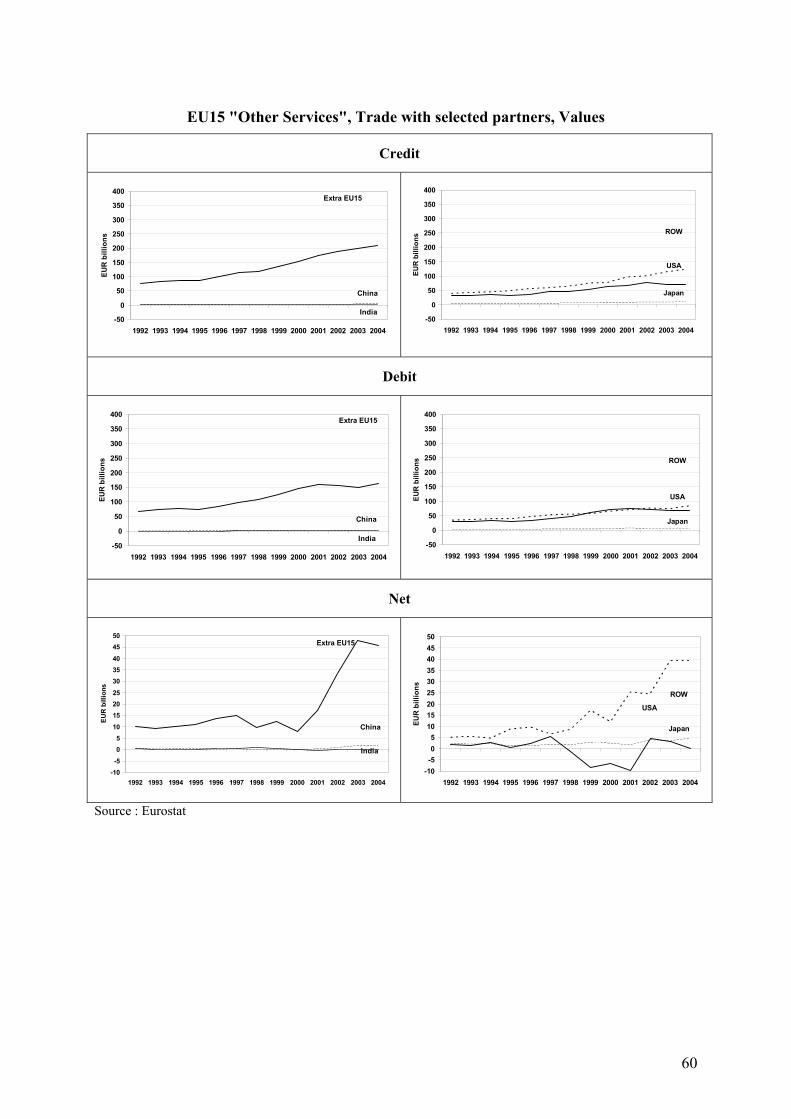
60
EU15 "Other Services", Trade with selected partners, Values
Credit
-50
0
50
100
150
200
250
300
350
400
1992 1993 1994 1995 1996 1997 1998 1999 2000 2001 2002 2003 2004
EUR
bill
ions
Extra EU15
China
India-50
0
50
100
150
200
250
300
350
400
1992 1993 1994 1995 1996 1997 1998 1999 2000 2001 2002 2003 2004
EUR
bill
ions
ROW
USA
Japan
Debit
-50
0
50
100
150
200
250
300
350
400
1992 1993 1994 1995 1996 1997 1998 1999 2000 2001 2002 2003 2004
EUR
bill
ions
Extra EU15
China
India-50
0
50
100
150
200
250
300
350
400
1992 1993 1994 1995 1996 1997 1998 1999 2000 2001 2002 2003 2004
EUR
bill
ions ROW
USA
Japan
Net
-10-505
10152025303540
4550
1992 1993 1994 1995 1996 1997 1998 1999 2000 2001 2002 2003 2004
EUR
bill
ions
Extra EU15
China
India
-10-505
101520253035404550
1992 1993 1994 1995 1996 1997 1998 1999 2000 2001 2002 2003 2004
EUR
bill
ions
ROW
USA
Japan
Source : Eurostat

61
EU15 "Other Services", Trade with selected partners, Percentage of GDP
Credit
-0.5
0.0
0.5
1.0
1.5
2.0
2.5
3.0
3.5
4.0
1992 1993 1994 1995 1996 1997 1998 1999 2000 2001 2002 2003 2004
perc
enta
ge G
DP
Extra EU15
China
India-0.5
0.0
0.5
1.0
1.5
2.0
2.5
3.0
3.5
4.0
1992 1993 1994 1995 1996 1997 1998 1999 2000 2001 2002 2003 2004
perc
enta
ge G
DP
ROW
USA
Japan
Debit
-0.5
0.0
0.5
1.0
1.5
2.0
2.5
3.0
3.5
4.0
1992 1993 1994 1995 1996 1997 1998 1999 2000 2001 2002 2003 2004
perc
enta
ge G
DP
Extra EU15
China
India-0.5
0.0
0.5
1.0
1.5
2.0
2.5
3.0
3.5
4.0
1992 1993 1994 1995 1996 1997 1998 1999 2000 2001 2002 2003 2004
perc
enta
ge G
DP
ROW
USA
Japan
Net
-0.2
-0.1
0.0
0.1
0.2
0.3
0.4
0.5
0.6
1992 1993 1994 1995 1996 1997 1998 1999 2000 2001 2002 2003 2004
perc
enta
ge G
DP
Extra EU15
China
India
-0.2
-0.1
0.0
0.1
0.2
0.3
0.4
0.5
0.6
1992 1993 1994 1995 1996 1997 1998 1999 2000 2001 2002 2003 2004
perc
enta
ge G
DP
Japan
USA
ROW
Source : Eurostat
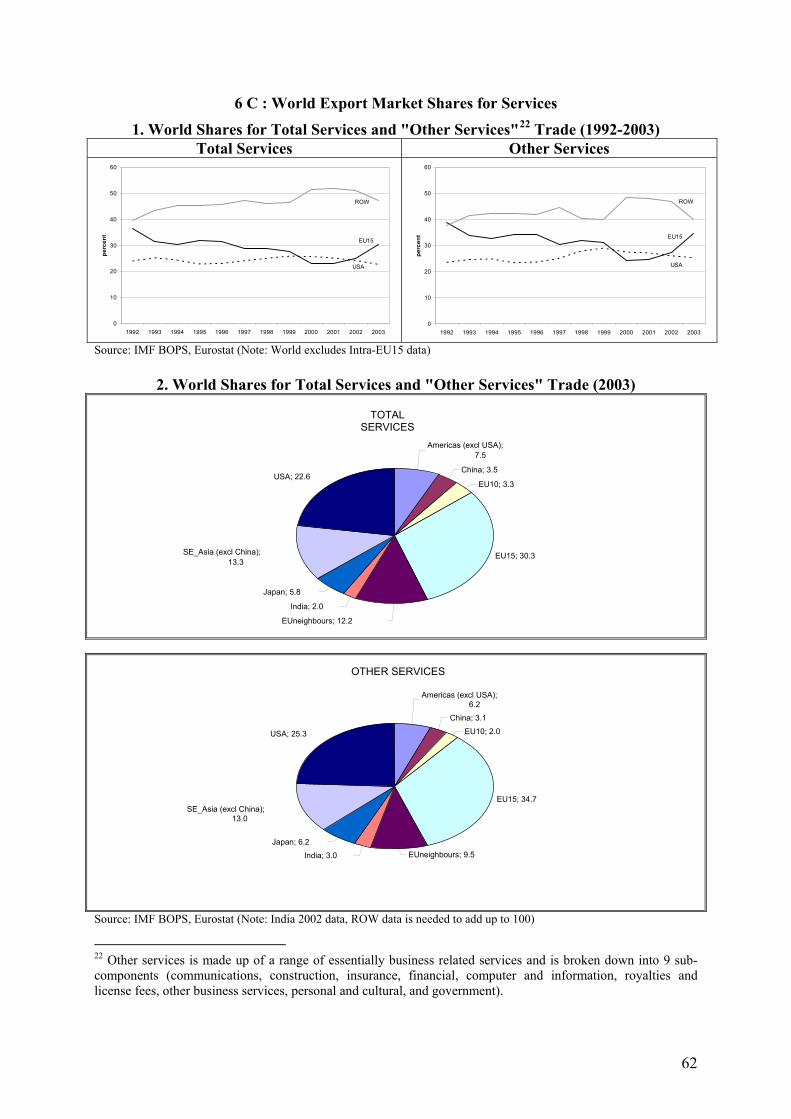
62
6 C : World Export Market Shares for Services
1. World Shares for Total Services and "Other Services"22 Trade (1992-2003) Total Services Other Services
0
10
20
30
40
50
60
1992 1993 1994 1995 1996 1997 1998 1999 2000 2001 2002 2003
perc
ent
ROW
EU15
USA
0
10
20
30
40
50
60
1992 1993 1994 1995 1996 1997 1998 1999 2000 2001 2002 2003
perc
ent EU15
USA
ROW
Source: IMF BOPS, Eurostat (Note: World excludes Intra-EU15 data)
2. World Shares for Total Services and "Other Services" Trade (2003)
Source: IMF BOPS, Eurostat (Note: India 2002 data, ROW data is needed to add up to 100)
22 Other services is made up of a range of essentially business related services and is broken down into 9 sub-components (communications, construction, insurance, financial, computer and information, royalties and license fees, other business services, personal and cultural, and government).
TOTAL SERVICES
Americas (excl USA); 7.5
China; 3.5
EU10; 3.3
EU15; 30.3
EUneighbours; 12.2
India; 2.0
Japan; 5.8
SE_Asia (excl China); 13.3
USA; 22.6
OTHER SERVICES
Americas (excl USA); 6.2
China; 3.1
EU10; 2.0
EU15; 34.7
EUneighbours; 9.5India; 3.0
Japan; 6.2
SE_Asia (excl China); 13.0
USA; 25.3

63
References
Amiti, M. and S. Wei (2004), “Fear of service outsourcing – is it justified?”, Economic Policy (April). Amiti, M. and S. Wei (2006), “Services Offshoring, Productivity and Employment : Evidence from the US”, CEPR Discussion Paper No. 5475. Anderton, R. et al (2004), “Understanding the impact of the external dimension on the Euro area: Trade, capital flows and other international linkages”, ECB Occasional Paper Series, No 12. Armington, P. (1969), "A theory of demand for products distinguished by place of production", IMF Staff Papers. Barrell, R. and S. Dees (2005), “World trade and global integration in production processes: a re-assessment of import demand equations”, ECB Working Paper, No. 503 Bhagwati, J. et al (2004), “The muddles over outsourcing”, Journal of Economic perspectives. ECB (2005), “Competitiveness and the export performance of the Euro area”, Task force of the monetary policy committee, Occasional Paper Series, No 30. Egger, H. and P. Egger (2001), "International outsourcing and the productivity of low-skilled labour in the EU", WIFO Working Paper, No.152. European Commission (2004), “European Competitiveness Report 2004”. European Commission (2005), “EU Economy 2005 Review : Rising International Economic Integration – Opportunities and Challenges”. Fontagné, L. et al (2004), “European industry’s place in the international division of labour: situation and prospects”, CEPII-CIREM. Fontagné, L. and M. Pajot (1997), “How foreign direct investment affects international trade and competitiveness: An empirical assessment” CEPII, Document de travail, No 97-17. Freudenberg, M. and F. Lemoine (1999), “Central and Eastern European Countries in the International Division of Labour in Europe”, CEPII. Hufbauer, C.G. and J.C. Chilas (1974), “Specialization by industrial countries: extent and consequences” in H. Giersch (Ed) “The international division of labour: problems and perspectives”. International Trade Centre (2000), “The trade performance index”, Background paper ITC (Draft of April 2000) Konings, J. (2005), "Trade liberalization, intermediate inputs and productivity", CEPR Discussion Papers.
64
Krugman, (1990), "Rethinking International Trade", MIT Press. Lardy, N. (2005), "China : The Great New Economic Challenge" published in "The United States and the World Economy", Institute for International Economics. Lemoine, F. and D. Unal-Kesenci (2002), “China in the international segmentation of production processes”, CEPII Mayer, J. et al (2002), “Dynamic products in world exports”, UNCTAD Discussion papers No. 159. Nicoletti G. et al (2003), “Policies and international integration: influences on trade and foreign direct investment”, OECD Working Paper No 359. OECD (2003), “Measuring the information economy”. OECD (2005), “Intertwined: FDI in manufacturing and trade in services”, Working party of the trade committee. Pain, N. and D. van Welsum (2004), “International production relocation and exports of services”, OECD Economic Studies, NO 38. Samuelson, P (2004), “Where Ricardo and Mill rebut and confirm arguments of mainstream economists supporting globalization”, Journal of Economic Perspectives, Tseng, W. and H. Zebregs (2002), “Foreign direct investment in China: Some lessons for other countries”, IMF Policy Discussion Paper UN (1989), “Classification by broad economic categories”, (ST/ESA/STAT/SER.M/53/REV.3*) UNCTAD (2003), “Trade and Development report”. UNCTAD (2004), “Trade and Development report”. Williamson, J. (2004), “The tariff response to world market integration in the periphery before the modern era”, paper presented to the “Market Integration Workshop”, European University Institute, Italy. World Bank (2005), “2005 World Development Indicators”. Yilmaz, B. (2002), “Turkey’s competitiveness in the EU”, Russian and East European Finance and Trade