economic forecast spring 2007 - european...
TRANSCRIPT

Economic forecast Spring 2007


Contents
- vii -
Overview 1
Chapter 1: The world economy 11 1. Some moderation of global growth 13
Chapter 2: The economic situation in the euro area and the EU 19 1. Solid growth in the face of headwinds 21 2. Interest rate assumption and financial conditions 24 3. Continued brisk growth 27 4. Robust labour market performance 32 5. Inflation developments and outlook 36 6. Public finances 39 7. Risks to the forecast 42
Chapter 3: Member States 45 1. Belgium: Robust growth supported by increasing employment 46 2. Bulgaria: Catching-up driven by investment 48 3. The Czech Republic: Firm growth accompanied by fiscal pressures 50 4. Denmark: Healthy growth expected to moderate 52 5. Germany: Solid growth increasingly driven by domestic factors 54 6. Estonia: Growth still strong with domestic demand as main engine 57 7. Ireland: Domestic demand drives growth, with some easing ahead 59 8. Greece: Growth returns to a more sustainable pace 61 9. Spain: Strong growth, high fiscal surpluses and rising external deficits 63 10. France: GDP continues to grow close to its potential 66 11. Italy: Protracted growth in a context of reduced fiscal imbalances 69 12. Cyprus: Stable growth and inflation contained 72 13. Latvia: Booming domestic demand deepens external imbalances 74 14. Lithuania: Inflationary pressures and worsening external balance 76 15. Luxembourg: Strong growth in 2006, mild slowdown in 2007 and 2008 78 16. Hungary: Export boom, domestic demand slows down 80 17. Malta: Public finances on a sounder footing 82 18. The Netherlands: Continued strong economic prospects 84 19. Austria: Brisk investment supporting robust economic growth 87 20. Poland: Growth driven by domestic demand, but minor improvement in public finances 89 21. Portugal: Economic growth resumes but prospects remain contained 92 22. Romania: Strong domestic expansion and loose fiscal policy 94 23. Slovenia: Solid economic growth with steady consumption and decelerating investment 96 24. Slovakia: Strong growth expected to peak in 2007 98 25. Finland: Buoyant and balanced growth to be maintained 100 26. Sweden: Continued steady growth and high fiscal surpluses 102 27. The United Kingdom: Continued robust economic growth 104

- viii -
Chapter 4: Candidate Countries 107 1. Croatia: Mild moderation amid robust performance 108 2. The Former Yugoslav Republic of Macedonia: Catching-up... but how fast? 110 3. Turkey: Monetary tightening triggers a slowdown in private consumption 112
Chapter 5: Other non-EU Countries 115 1. The United States of America: Housing downturn continues - growth below potential 116 2. Japan: Out of the soft patch... once more 118 3. China: Surpluses skyrocketing 120
Statistical Annex 123
Tables 0.1 Main features of the Spring 2007 forecast - EU27 3 0.2 Main features of the Spring 2007 forecast - euro area 6 1.1 International environment 17 2.1 Composition of growth in 2006 - euro area 21 2.2 Composition of growth - EU27 27 2.3 Composition of growth - euro area 28 2.4 Labour market outlook - euro area and EU27 35 2.5 Inflation outlook - euro area and EU27 38 2.6 General government structural budget balance 40 2.7 General government budgetary position - euro area and EU27 41 3.1 Main features of country forecast - BELGIUM 47 3.2 Main features of country forecast - BULGARIA 49 3.3 Main features of country forecast - THE CZECH REPUBLIC 51 3.4 Main features of country forecast - DENMARK 53 3.5 Main features of country forecast - GERMANY 56 3.6 Main features of country forecast - ESTONIA 58 3.7 Main features of country forecast - IRELAND 60 3.8 Main features of country forecast - GREECE 62 3.9 Main features of country forecast - SPAIN 65 3.10 Main features of country forecast - FRANCE 68 3.11 Main features of country forecast - ITALY 71 3.12 Main features of country forecast - CYPRUS 73 3.13 Main features of country forecast - LATVIA 75 3.14 Main features of country forecast - LITHUANIA 77 3.15 Main features of country forecast - LUXEMBOURG 79 3.16 Main features of country forecast - HUNGARY 81 3.17 Main features of country forecast - MALTA 83 3.18 Main features of country forecast - THE NETHERLANDS 86 3.19 Main features of country forecast - AUSTRIA 88 3.20 Main features of country forecast - POLAND 91 3.21 Main features of country forecast - PORTUGAL 93 3.22 Main features of country forecast - ROMANIA 95 3.23 Main features of country forecast - SLOVENIA 97

- ix -
3.24 Main features of country forecast - SLOVAKIA 99 3.25 Main features of country forecast - FINLAND 101 3.26 Main features of country forecast - SWEDEN 103 3.27 Main features of country forecast - THE UNITED KINGDOM 106 4.1 Main features of country forecast - CROATIA 109 4.2 Main features of country forecast - THE FORMER YUGOSLAV REPUBLIC OF MACEDONIA 111 4.3 Main features of country forecast - TURKEY 113 5.1 Main features of country forecast - THE UNITED STATES 117 5.2 Main features of country forecast - JAPAN 119 5.3 Main features of country forecast - CHINA 121
Boxes 2.1 New methodology for interest rate assumptions 26 2.2 Some specificities behind the forecasts 31
Graphs 1.1 Global manufacturing PMI and world trade growth 13 1.2 Contribution to growth of world imports of goods and services (excl. EU 27) by regions 14 1.3 Stock prices on world markets 14 1.4 Oil prices (Brent) in USD and € 15 1.5 Long-term interest rates, euro area and US 15 1.6 Yield curve, euro area and US 16 1.7 Euro exchange rate, USD and JPY 16 2.1 Dispersion of GDP growth rates, four larger euro-area Member States 22 2.2 Domestic demand (excl. stocks) in the current and past recoveries, euro area 22 2.3 Private consumption and the labour market euro area 23 2.4 Labour productivity and real unit labour costs, euro area four larger euro-area Member
States area and selected countries 23 2.5 Debt ratio and interest rate payments, household sector, euro area 24 2.6 Debt ratio and interest rate payments in the non-financial corporate sector, euro area 25 2.7 Real annual GDP growth in the euro area, 1992-2008 27 2.8 The saving rate, euro area 29 2.9 Capacity utilisation rate and investment in equipment, euro area 29 2.10 Loans for house purchase and investment in construction, euro area 30 2.11 Growth of GDP and employment by sector, euro area 32 2.12 Euro-area employment expectations 33 2.13 Unemployed persons and unemployment rate, euro area 33 2.14 Real compensation of employee per head across cycles, euro area 34 2.15 Labour productivity growth, euro area 35 2.16 Headline and core inflation, euro area 36 2.17 Industrial producer prices, euro area 37 2.18 Euro-area tax elasticity with respect to GDP 39 2.19 Uncertainty linked to the euro-area GDP growth forecast 43 3.1 Belgium - Gross capital formation by Local Authorities as % of GDP 46 3.2 Bulgaria - Real GDP growth, investment ratio and external deficit 48 3.3 The Czech Republic - General government finances 50 3.4 Denmark - Unemployment rate, HICP inflation and wage growth 52

- x -
3.5 Germany - GDP and growth contributors 54 3.6 Germany - Consumption and employment 54 3.7 Estonia - External balance and components 57 3.8 Ireland - GDP growth compared to euro area and contributions 59 3.9 Greece - Net lending & consolidated gross debt 61 3.10 Spain - GDP growth and current account deficit 63 3.11 Spain - General government accounts 63 3.12 France - GDP and domestic demand 66 3.13 France - General government gross debt and deficit 66 3.14 Italy - Gross value added at constant prices 69 3.15 Italy - Budgetary developments in structural terms 69 3.16 Greece - Net lending & consolidated gross debt 72 3.17 Latvia - Inflation, unit labour cost and output gap 74 3.18 Lithuania - GDP growth, unemployment rate, HICP inflation and external balance 76 3.19 Luxembourg - Employment and GDP growth 78 3.20 Hungary - Contribution to GDP growth 80 3.21 Malta - General government finances 82 3.22 The Netherlands - Private sector gross saving 84 3.23 The Netherlands - Unemployment and vacancies 84 3.24 Austria - Total labour force and total employment ( 87 3.25 Poland - Government total revenue and expenditure 89 3.26 Poland - Actual and potential GDP growth, output gap 89 3.27 Portugal - Demand and prices 92 3.28 Romania - GDP growth and its contributors 94 3.29 Slovenia - Price and wage developments 96 3.30 Slovakia - GDP growth, unemployment rate and inflation 98 3.31 Finland - Nominal unit labour cost development 100 3.32 Sweden - GDP growth, growth contributions and output gap and HICP inflation 102 3.33 The United Kingdom - Contributions to GDP growth 104 3.34 The United Kingdom - Labour market developments 104 4.1 Croatia - GDP and current account 108 4.2 The Former Yugoslav Republic of Macedonia - Real GDP growth and labour market
performance 110 4.3 Turkey - GDP growth and contributions 112 5.1 The United States of America - Housing investment cycle 116 5.2 Japan - Current account balance 118 5.3 China - GDP growth 120

Overview
- 1 -
The EU and the euro area economies performed better than expected in 2006, thanks to brisk global growth and favourable domestic conditions. Moreover, the impact of high oil prices and the slowdown of the US economy were relatively muted. Real GDP growth quickened to a rate of 0.9% quarter-on-quarter (QoQ) in the fourth quarter in both areas, well above estimates of potential growth. For 2006 as a whole, economic activity expanded by 3.0% in the EU and 2.7% in the euro area. This is more than 1 percentage point (pp.) above the growth recorded in 2005 and somewhat stronger than expected in the autumn 2006 economic forecast.
The expansion was largely driven by domestic demand, especially by a marked improvement in investment in equipment. Private consumption grew more moderately, as labour markets started to improve considerably. Economic activity was also supported by a positive net contribution from the external sector. Indeed, the rebound in the fourth quarter of 2006 was due in part to surging exports.
Real GDP growth in 2007 is forecast at 2.9% in the EU and 2.6% in the euro area, broadly unchanged compared to 2006. This constitutes an upward revision of ½ pp. compared to the autumn 2006 forecast for both areas. In 2008, prospects are for a slight deceleration in activity, to 2.7% in the EU and 2.5% in the euro area, which would still be above potential.
The international environment is expected to remain supportive. World GDP growth (excluding the EU) should ease somewhat from 5.8% in 2006 to slightly below 5½% over the forecast period. This is mainly explained by a slowdown in the manufacturing sector at the global level. The outlook for the United States is scaled down by the ongoing cooling in the housing sector, while prospects for most other regions, notably the emerging markets, remain bright.
In the United States, the economy shifted into lower gear in the course of 2006. So far, the slowdown has mainly hit the housing sector, with residential investment falling by almost 20% annualised in the second half of 2006. A correction of inventories, especially in the automotive sector, also dampened GDP growth in the fourth quarter of 2006. On the other hand, real consumer spending has held up well on the back of solid wage and employment gains and falling energy prices in the second half of the year. The downturn in the housing market is likely to continue for a while, and, together with a renewed rise in energy prices and a weakening labour market, will act to slow consumer spending. Real GDP growth is thus projected to decline from 3.3% in 2006 to 2.2% in 2007. A gradual turnaround in the housing sector should make for a recovery of the economy in 2008, which is, however, likely to be relatively shallow. This outlook implies that the current account deficit, which amounted to around 6% of GDP in 2006, will change little over the forecast period.
Economic activity in Japan rebounded in the last quarter of 2006 after a soft patch in the third quarter. Buoyed by a pick-up in private consumption, GDP growth accelerated to 1.3% QoQ in the last quarter. Revisions of historical GDP data reduced the annual growth rate for 2006 to 2.2%. GDP
The EU economy started the year 2007 on a positive note...
...and is forecast to grow above potential in 2007-2008
World growth sustained at more than 5%...
...despite a slowdown in the US...

Economic forecast, spring 2007
- 2 -
growth is forecast to broadly maintain this pace over the period 2007-2008, implying that the Japanese economy will continue to exceed its estimated potential growth rate. Deflation is expected to come to an end, with headline inflation flat this year and around ½% in 2008.
The Chinese economy surprised, yet again, on the upside in 2006, with GDP growth accelerating to 10.7%. This is explained by continued strong exports, but also buoyant investment activity despite the government's measures to dampen it. The current account surplus widened further to around 9% of GDP. GDP growth is predicted to edge down marginally over the forecast period, although staying above 10%. This reflects, above all, ongoing tightening measures by the government.
Among the other emerging regions, economic activity is generally forecast to maintain its robust pace. Growth in the Middle East and North Africa should stay at around 5½% this year, while it should accelerate to 6½% in sub-Saharan Africa. On the other hand, economic growth in Latin America is expected to decelerate somewhat to 4½%, partly reflecting the slowdown in the US economy and a maturing of the recovery in some countries.
In the candidate countries, output growth is projected to decelerate by 1 pp. to around 5% in 2007, which is attributable to a deterioration in the outlook for the Turkish economy. This follows, in particular, from the impact of the financial turbulence in early 2006, which caused a significant rise in inflation triggering e.g. higher interest rates that, in turn, weakened private consumption. The outlook is for a gradual, successful disinflation process, bringing consumer price inflation below 6½% by the end of this year, and a subsequent rebound of economic activity in 2008.
Spurred by the rapid growth of the world economy, world trade picked up to a growth rate of almost 9% last year. However, in the wake of a cooling global manufacturing sector, trade growth is projected to slow down to 7½% this year and to some 7¼% in 2008.
Oil prices fluctuated widely in 2006. Following a peak of almost 80 USD per barrel for Brent crude in August at the height of the Lebanon war, oil prices fell back significantly as the risk of an extended conflict in the Middle East receded and perceptions of the global outlook turned less optimistic. However, as from early 2007 a number of factors caused a reversal of the slide in prices, including a spell of cold(er) winter weather in the US, an improved economic outlook globally, an unusually disciplined reaction of OPEC in response to the previous fall in prices and increasing tensions over Iran's nuclear programme. In April 2007, the oil price was trading in the range of USD 65-70 per barrel. Looking ahead, accelerating global demand for oil in combination with slow growth of supply suggests that the oil market will remain tight. Consequently, oil prices are assumed to stay high in the near term, ranging between USD 67 and 70 per barrel, based on futures prices. This corresponds to an annual average of 66.2 in 2007, i.e. unchanged compared to last year, rising by around 6% in 2008 to USD 70.3.
...amid a bright outlook for other regions, especially China
Robust world trade
Oil prices to stay high

Overview
- 3 -
Non-fuel commodity prices increased significantly in 2006, by 28% in USD terms, reflecting, in particular, high demand for minerals and metals amid supply constraints. Average prices are expected to increase a further 14% this year compared to the average of 2006, due to continued rising prices for some agricultural products and an overhang from last year's large price increases for metals and minerals, before easing marginally in 2008.
Since 2003, commodity prices have almost doubled (rising by 94%). Despite such headwinds, world GDP growth has remained robust, while consumer price inflation has remained contained. The predominantly demand-driven nature of the rise in commodity prices in combination with credible macroeconomic frameworks appears to be one of the reasons why the impact on the global economy has been relatively benign.
Turning to financing conditions, both real and nominal short-term interest rates are still at relatively low levels (despite the gradual increase in policy rates by the major central banks in the EU since 2005), money and credit growth continues to be brisk and liquidity is ample by all measures. Long-term bond yields have increased less, remaining low by historical standards. The yield curve thus flattened significantly during the second half of 2006. Despite mounting imbalances at the global level, risk premia have stayed close to their historical lows. Although the recent turbulence in equity markets prompted a reassessment of risks, the impact was mostly short-lived. Overall, financing conditions should remain supportive to real-sector activity in the near term.
Looking ahead, survey data generally point to continued robust growth in the first half of this year. The upturn appears broad-based. All sectors except construction have contributed to the improvement in the economic sentiment indicator in the Commission's recent business and consumer surveys. Although volatile on a monthly basis, almost all sectoral confidence indices have been on an upward trend since mid-2005. The
Financing conditions remain growth-supportive
Table 0.1
Main features of the Spring 2007 forecast - EU27 (Real annual percentage change Spring 2007 Difference vs unless otherwise stated) forecast ¹ Autumn 2006 (a)
2003 2004 2005 2006 2007 2008 2007 2008 GDP 1.3 2.5 1.7 3.0 2.9 2.7 0.5 0.3 Consumption 1.7 2.1 1.7 2.2 2.5 2.6 0.5 0.3 Total investment 1.1 3.2 3.1 5.6 5.2 4.2 1.5 0.8 Employment 0.4 0.8 0.9 1.5 1.4 1.1 0.4 0.2 Unemployment rate (b) 9.0 9.0 8.7 7.9 7.2 6.7 -0.4 -0.6 Inflation (c) 2.1 2.3 2.3 2.3 2.2 2.1 -0.1 0.1 Government balance (% GDP) (d) -3.1 -2.7 -2.4 -1.7 -1.2 -1.0 0.4 0.4 Government debt (% GDP) 61.8 62.2 62.9 61.7 59.9 58.3 -1.0 -1.6 Current account balance (% GDP) 0.1 0.2 -0.5 -0.7 -0.7 -0.8 -0.2 -0.3
¹ The Commission services' Spring 2007 Forecast is based on available data up to April 23, 2007. (a) A "+" ("-") sign means a higher (lower) positive figure or a lower (higher) negative one compared to Autumn 2006. (b) Percentage of the labour force. (c) Harmonised index of consumer prices, nominal change. (d) Including proceeds relative to UMTS licences.
Economic forecast, spring 2007
- 4 -
exception is again the construction sector where confidence seems to have peaked in the autumn of last year.
National business surveys have given mixed signals in recent months, but even those that have eased lately are still at elevated levels, suggesting economic expansion will progress at a healthy clip in the short term. As a benchmark, when taking into account recent hard and soft data, DG ECFIN's Dynamic Factor Model projects euro-area GDP growth of, on average, 0.6-0.7% QoQ during the first three quarters of 2007.
Against this backdrop, output is projected to grow in 2007 at 2.9% in the EU and 2.6% in the euro area, marginally lower than last year. Economic activity will be supported by buoyant domestic demand and continued strong, though somewhat more tempered export market growth. For 2008, prospects are for a further slight moderation in economic activity, to 2.7% in the EU and 2.5% in the euro area. This follows, in particular, from the impact of the progressive withdrawal of monetary stimulus on domestic demand.
Growth in equipment investment should maintain its vigorous pace over the forecast period, bolstered by upbeat demand expectations, high corporate profitability, supportive financing conditions, a high rate of capacity utilisation and an increased need to invest in new technologies. Construction investment was supported by unusually warm winter weather at the start of this year. However, a slowdown in mortgage lending due to rising borrowing costs and an expected cooling of house price inflation in some countries are likely to gradually dampen growth in construction investment in the two forecast years. In Germany, the impact of the VAT increase will temporarily curb housing investment in 2007, albeit not as much as earlier foreseen.
Private consumption is predicted to pursue its steady upward trend, establishing itself progressively as the mainstay of growth. In the euro area, the growth contribution of this demand component is expected to rise from 1 pp. in 2006 to an estimated 1½ pps. by 2008. Rapid employment growth and accelerating wages in combination with a moderate inflation outlook are underpinning the outlook for real labour income growth. Moreover, consumer confidence has perked up, boosted by falling unemployment. With the households saving rate projected to stabilise over the forecast period, private consumption will expand at a rate commensurate with the growth of household income. In Germany, the negative impact of the increase in the VAT is likely to be eclipsed by the impressive turnaround in the labour market.
Exporters in the EU and the euro area should continue to benefit from still-robust world growth over the forecast horizon. However, the projected moderation of world trade and an appreciation in nominal effective terms will limit the growth contribution from net exports for both the euro area and the EU as a whole. Market shares of EU and euro-area exporters are assumed to revert to their trend decline. This decline, which can be mainly attributed to losses to emerging market economies, was interrupted last
Survey data point to firm growth in the quarters ahead
3 years of growth well above potential...
...driven by brisk investment growth...
...and a pick-up in private consumption

Overview
- 5 -
year by exceptionally strong gains for Germany. There are sustained differences between Member States with respect to the evolution of market shares, only part of which can be explained by differences in cost competitiveness.
The solid momentum in the European cycle masks a significant dispersion of growth rates across Member States. Although the growth dispersion declined between 2005 and 2006, not least due to the pick-up in some of the larger euro-area countries, real GDP growth in 2007 is projected to range from 1¾% to almost 10% in the EU. Part of this can be explained by the ongoing process of real convergence in the recently-acceded Member States, but there are also sizeable differences among the euro-area countries.
In line with the usual lagged response, the current economic upturn reached the labour market, at last, in 2006. Compared to the year before, employment growth almost doubled, to 1.5% in the EU and 1.4% in the euro area. This is the fastest pace since 2000 and corresponds to 3.3 million new jobs in the EU (2.0 million of which were in the euro area). The improvement appears broad-based across both sectors and countries. Prospects are for a continued robust labour market performance over the forecast period, with employment growth of around 1¼% on average in both the EU and the euro area. This corresponds to a total of 5.5 million new jobs in the EU in the period 2007-08 (3.8 million in the euro area).
Against a background of robust employment growth, the employment rate will rise to around 65½% of the working-age population in the EU by 2008 (about 66% in the euro area), which would, however, still be low by international standards. This may be partly explained by labour supply. In 2005, labour force participation in the euro-area was around 5 pps. lower than in the US, where it exceeded 75%. Nevertheless, the labour force has increased markedly in several Member States, particularly in Spain. This improvement follows from an increase in the female participation rate, the impact of earlier pension reforms and, in some Member States, a regularisation of undeclared workers.
The unemployment rate improved substantially last year when it fell below 8% of the labour force in both the EU and the euro area. The unemployment rate is expected to drop further, to reach 6.7% in the EU and 6.9% in the euro area by 2008. This is explained above all by an improved performance in the larger Member States and can be attributed to a large extent to the strong cyclical upswing. However, estimates also point to a reduction in the structural unemployment rate (NAWRU), which is projected to fall to around 7% by 2008, ½ pp. lower than in 2006.
As a consequence of the improved labour market outlook, nominal wage growth is set to accelerate over the forecast period. However, past reform efforts, which have made European labour markets more flexible, and ongoing competitive pressures from globalisation are expected to have a moderating effect on wages. Furthermore, the rise in unit labour costs is
5½ million new jobs in the EU in 2007-2008...
...with the unemployment rate falling to around 6½% by 2008

Economic forecast, spring 2007
- 6 -
limited by the recent pick-up in labour productivity growth which is projected to continue going forward.
There are significant cross-country differences in the evolution of unit labour costs. This is true also for the countries in the euro area, where relative competitive positions as measured by unit labour costs have drifted apart over past years. While, in a monetary union, this process should reverse at some stage, according to the forecast there will be no such turnaround in the period 2007-2008.
The revised outlook, which indicates a stronger growth momentum than previously projected, raises questions as to where the EU and the euro-area economies actually stand in terms of the business cycle. When comparing the current economic upswing with the average of the past four recoveries, the compound growth rate of GDP is still some 1½ pps. lower than that reached at the same stage in earlier cycles. The difference is explained by private consumption, for which a substantial gap exists between its growth in this cycle and that of past cycles. This seems to be due in turn to a subdued rise in real wages, while employment growth has been largely in line with the pattern of previous cycles. As a counterpart to moderate wage increases, profits have seen a sustained rise which, in combination with benign financing conditions, has boosted investment. Indeed, investment spending is currently higher than at the same stage in past cycles (although this is to some extent also explained by the current housing boom in some of the Member States).
The deviation of the cyclical evolution of GDP from past patterns is mirrored by estimates of the output gap. Almost four years after the start of this recovery in 2003, and despite the improvement in 2006, the output gap is estimated to be still in negative territory. By contrast, the gap between the actual and the structural unemployment rate has narrowed significantly. Similarly, indicators of capacity utilisation rates point to incipient capacity
The current upswing is not exceptionally strong, so far
Table 0.2
Main features of the Spring 2007 forecast - euro area (Real annual percentage change Spring 2007 Difference vs unless otherwise stated) forecast ¹ Autumn 2006 (a)
2003 2004 2005 2006 2007 2008 2007 2008 GDP 0.8 2.0 1.4 2.7 2.6 2.5 0.5 0.3 Consumption 1.2 1.5 1.5 1.8 2.1 2.4 0.5 0.3 Total investment 1.1 2.2 2.5 4.7 4.4 3.6 1.4 0.6 Employment 0.4 0.8 0.8 1.4 1.4 1.2 0.2 0.1 Unemployment rate (b) 8.7 8.8 8.6 7.9 7.3 6.9 -0.4 -0.5 Inflation (c) 2.1 2.1 2.2 2.2 1.9 1.9 -0.2 0.0 Government balance (% GDP) (d) -3.0 -2.8 -2.5 -1.6 -1.0 -0.8 0.5 0.5 Government debt (% GDP) 69.2 69.7 70.5 69.0 66.9 65.0 -1.1 -1.9 Current account balance (% GDP) 0.5 0.8 0.0 0.0 0.2 0.1 0.1 0.0
¹ The Commission services' Spring 2007 Forecast is based on available data up to April 23, 2007. (a) A "+" ("-") sign means a higher (lower) positive figure or a lower (higher) negative one compared to Autumn 2006. (b) Percentage of the labour force. (c) Harmonised index of consumer prices, nominal change. (d) Including proceeds relative to UMTS licences.

Overview
- 7 -
shortages. There is therefore a discrepancy between different measures of slack, with the output gap indicating the existence of a certain degree of economic slack in a broad sense, while input-based measures point to emerging shortages for labour and capital and hence potential price pressures further ahead.
In the short term, however, inflationary pressures remain well contained. Rising energy prices until late summer of last year kept consumer price inflation above 2% (year-on-year). With oil and energy prices reversing thereafter, headline HICP inflation fell below 2% in the autumn of 2006 (resulting in annual average inflation of some 2¼% in both the EU and the euro area). While headline inflation has stayed below this threshold since, core inflation, i.e. changes in the HICP excluding energy and unprocessed food, has started to edge up recently, thereby closing the gap between headline and core inflation observed over the last two years. The rise in core inflation appears to be due mainly to the price effects of the VAT hike in Germany, while indirect and second-round effects of high oil prices have been very limited so far.
Looking ahead, average annual HICP inflation is projected to decline to 2.2% in the EU and 1.9% in the euro area in 2007. This represents a downward revision of 0.2 pp. for the euro area compared to the autumn 2006 forecast. Factors explaining this downward revision are lower oil prices at the turn of the year, favourable base effects in the first half of 2007 and a more muted initial impact of the German VAT hike. In 2008, headline inflation is expected to remain broadly unchanged. However, if the impact of the German VAT hike on consumer prices is excluded (estimated to add around 0.3 pp. to euro-area inflation in 2007), the profile of inflation shows a clear acceleration between 2007 and 2008 (of around ¼-½ pp.), reflecting an underlying rise, if limited, of price pressures.
Inflation rates across Member States show substantial variation. Within the euro area, inflation in the country with the highest inflation rate in 2006 was more than 2 pp. higher than in the country with the lowest inflation rate, with this gap narrowing somewhat in the two forecast years (to around 1½ pp. in 2008). Differences are even larger within the group of countries which have linked their exchange rate to the euro (ERM II Member States, Bulgaria). The gap between the maximum and minimum inflation rate was 5½ pps. in 2006 for this group and is forecast to rise to almost 6 pps. in 2007, before declining to around 4 pps. in 2008.
The current account is broadly in balance in the EU and the euro area, but varies across Member States. Large and growing deficits are, in particular, projected for some of the catching-up economies, with the highest values topping 20% of GDP. The use of external savings can play an important role in facilitating income convergence, especially if capital comes in the form of foreign direct investment. However, persistent sizeable current account deficits can raise concern about sustainability, particularly if investment and productivity growth are low and capital inflows are directed into consumption or real estate or if external borrowing is at levels that could trigger financial stress.
Contained inflationary pressure, at least in the short term
Sizeable current account deficits in some countries

Economic forecast, spring 2007
- 8 -
On the back of the economic recovery, public finances improved markedly last year with the general government budget deficit falling from 2.4% in 2005 to 1.7% of GDP in 2006 in the EU (from 2.5% to 1.6% in the euro area). This follows from the impact of stronger economic growth and a pick-up in the so-called tax elasticities (i.e. a higher responsiveness of tax revenues to changes in the tax bases). The better-than-expected outturn in 2006 is set to have a positive impact throughout the forecast period with the deficit declining to 1.2% of GDP in the EU this year (1% of GDP in the euro area). A further decline, albeit small, is foreseen for 2008 on the usual no-policy-change assumption.
The projected improvement in public finances is relatively broad-based across Member States. There are ten countries currently in the excessive deficit procedure (EDP), but the deficit is expected to fall below 3% of GDP in six of them. This was achieved already in 2006 in the Czech Republic, Germany, Greece, Malta and the United Kingdom. The deficit should fall below the threshold in Italy and Slovakia this year. In the euro area, only Portugal is predicted to have a deficit above 3% of GDP in 2007 and, in the absence of further measures, also in 2008. Marked improvements were also observed in Hungary and, to a lesser extent, in Poland, whereas the deficit in the Czech Republic is predicted to deteriorate again this year. Outside the countries currently in the EDP, Romania is expected to post a deficit above 3% of GDP this year and next.
Taking into account temporary measures and cyclical factors, the structural deficit also fell markedly last year: from 2% in both areas in 2005 to 1.1% of GDP in the euro area and 1.3% in the EU in 2006. However, the improvement in 2007-2008 is more muted than that of the nominal balance, which raises the issue of how to foster fiscal consolidation in economically good times.
In contrast to the increasing trend of recent years, the improvement in public finances in 2006 was sufficient to allow for a fall in general government gross debt, which declined by more than 1 pps. to 61.7% of GDP in the EU (down by 1½ pps. to 69% in the euro area). This positive development is set to continue with the debt gradually falling to 58.3% of GDP by 2008 in the EU (65% in the euro area). This downward trend is relatively broad-based across Member States, with increases limited to seven countries (and by as much as 2 pps. in Hungary). However, differences in debt levels are sizeable, with the level of gross debt ranging from below 10% of GDP in Estonia, Latvia and Luxembourg to above 100% in Italy by 2008.
Summing up, the economic outlook in the EU and the euro area is for continued robust growth, above potential in both forecast years, albeit with a slight deceleration in economic activity in 2008. However, there are several risk factors to the outlook that need to be considered. These risks seem broadly balanced in 2007, but tilted to the downside in 2008.
Upside risks are primarily related to domestic demand, which could turn out more buoyant than projected. In particular, the favourable labour
Public finances better than expected in 2006...
...and 6 out of 10 EDP countries post deficits below 3%
Debt to fall below 60% in the EU by 2008
Risks to the GDP outlook are broadly balanced in 2007

Overview
- 9 -
market developments may give a further boost to both labour income and consumer confidence. This could unleash some of the pent-up demand that accumulated during this cycle of unusually restrained consumer spending. The saving rate would thereby return to its trend decline following a temporary sharp rise after the bursting of the dot-com bubble.
The major downside risk to the baseline scenario, already identified in the autumn, is a more pronounced slowdown in the US economy. Although a relatively limited slowdown of the US economy now appears more likely, recent data have sent rather mixed signals on the depth and breadth of the downturn in the housing market. For instance, while problems in the sub-prime mortgage market have accumulated in recent months, they have not extended to the high-quality segments so far. If they do, the implications for US mortgage lending and housing markets could be serious, with inevitable knock-on effects on the US banking sector and the performance of the broader economy. Moreover, a sharper-than-expected US economic slowdown could be a catalyst for a return to a more normal pricing of risks and possibly also a correspondingly abrupt unwinding of financial imbalances globally. The recent equity-market turbulence once more demonstrated the heightened sensitivity of investors to adverse developments in the global economy. Further ahead, the domestic side also poses some downside risks. In particular, a sharper slowdown of housing investment in some Member States cannot be excluded on the back of easing house price inflation and higher borrowing costs.
Regarding the inflation outlook, inflationary pressures are expected to remain moderate in 2007. But as the cycle matures and the labour market tightens, wage pressures may emerge towards the end of the forecast period that go beyond the assumptions of this forecast. Moreover, oil prices have been on the rise recently due in part to renewed geo-political tensions. In the absence of a solution to these conflicts, upside risks to the oil price assumption are likely to outweigh downside risks. While the economy has so far weathered the strong rise in oil prices since 2003 surprisingly well, it cannot be excluded that, at some stage, a further rise in the oil price level would also have a significant negative impact on the real economy.


Chapter 1 The world economy


1. Some moderation of global growth
- 13 -
The outlook for the global economy remains positive. In the US, annual GDP growth reached 3.3% in 2006. In Asia, a slight deceleration was observed in the course of the year, but growth remains robust in most countries, including Japan. In Eastern Europe, Latin America, Africa and the Middle East, economies continue to expand at a robust pace. All in all, world GDP growth is expected to moderate only slightly over the forecast period, from 5.2% in 2006 to 4.8% in both 2007 and 2008.
The expected scenario from the autumn of a soft landing in the US remains in place. In spite of the housing market downturn and the accompanying sharp decline in residential investment, GDP growth was above 2% (in annualised terms) in the last three quarters of 2006. Manufacturing production decelerated, mainly due to an adjustment in inventories. At the same time, consumption remained resilient, supported by a solid rise in disposable income, a further fall in the personal saving rate, and the impact of lower energy prices. Going forward, the main downside risks are a deeper and longer-lasting correction in the housing sector than expected and more serious spillovers to the rest of the economy. There also continue to be risks associated with the large current account deficit.
GDP growth supported by emerging economies
In spite of a certain deceleration of world output growth in the fourth quarter of 2006, indicators point to still-vigorous activity in early 2007. While the US economy has slowed down to a growth path below trend, the momentum of many other economies, especially in Asia, appears to have limited the moderation of world growth. The robustness of the global economy is confirmed by the latest data, in particular the rebound of the global manufacturing PMI index, which is normally a good leading indicator of world trade growth.
The slight easing projected in global activity is thus mainly explained by the situation in the US, where the correction in the housing market will continue to exert a drag on economic activity. As a consequence, output growth in the US is expected to remain below the long-term potential in 2007, with an annual growth rate of 2.2%. The manufacturing cycle is also easing at the global level. However, in the most dynamic economies, such as China, the CIS countries and Latin America, growth will moderate only slightly,
4042
4446
485052
5456
5860
01 02 03 04 05 06 07-10
-5
0
5
10
15
20
PMI global manufacturingWorld trade growth (rhs)
Graph 1.1: Global manufacturing PMI and world trade growth
yoy % ch.
supported by a solid pace of exports. In Japan, the expansion should continue, as consumption will be sustained by a favourable labour market situation, while investment might benefit from a high level of capacity utilisation and strong corporate profits.
Growth in global imports of goods and services (excl. EU-27) is expected to remain relatively buoyant at an average of 7½% in 2007 and 7¾% in 2008, down from 8.4% in 2006. A certain slowdown follows from the reduced contribution of the US to global import growth, which is projected to decline from 1.6 pps. in 2006 to 0.9 pp. in 2007. The contribution of Latin America and sub-Saharan Africa should also decrease from the very high levels reached in 2006. On the other hand, the contribution of Asia and other industrialised countries will remain broadly constant.
The saving rate of US households is projected to improve only slightly, remaining negative in 2007. Consequently, global imbalances are not expected to diminish, with the US current account deficit remaining above 6% of GDP in both 2007 and 2008. Oil-exporting countries and China will absorb an increasing share of the corresponding surpluses.
The correction in equity markets reflected concerns about the US economy…
Global equity prices registered a sharp correction in February-March 2007. While initially triggered by a decline in Chinese stock prices, the subsequent decrease in main indices across the globe essentially reflected concerns about the US economy. First, weaker US economic data were issued, leading to a

Economic forecast, spring 2007
- 14 -
0
1
2
3
4
5
6
7
8
9
2006 2007 2008
US Other industrialised Non-Japan AsiaCIS+MENA Other
Graph 1.2: Contribution to growth of world imports of goods and services (excl. EU 27) by regions
%
deterioration of growth expectations. Second, nervousness was amplified by reports that Alan Greenspan had spoken of a possible recession in the US economy in 2007. Lastly, rising default rates in the sub-prime mortgage market increased concerns that a transmission to the much larger high-quality mortgage segment could trigger a credit crunch.
However, equity markets proved resilient, as losses have been mostly recovered. Hence, the turbulence may have just been a technical correction which might even be welcomed as a necessary 'shake-out' of the international equity markets. On the other hand, it may also signal increased sensitivity of investors to any deterioration in global economic conditions in a context of historically low levels of credit-risk premia. A widespread and durable widening of risk premia in the international financial system would have a significant impact on real-sector activity.
…while the slide in oil prices came to an end
After having peaked at almost USD 80/bl. in early August 2006, oil prices trended downwards until January 2007, when they reached a low of USD 51.8/bl. The decline was mainly attributable to the end of the hostilities in Lebanon, an unusually calm hurricane season, mild weather conditions in early winter and concerns about the prospects for global growth. However, prices have risen again since February, spurred by upward revisions to future oil demand growth (oil demand is estimated to grow by 1.8% in 2007 after rising by only 1.0% in 2006, according to the International Energy Agency), a spell of cold weather in the US, supply cuts by OPEC
50
60
70
80
90
100
110
120
130
140
01 02 03 04 05 06 07
Dow Jones Eurostoxx Nikkei
index 01.01.1999=100
Graph 1.3: Stock prices on world markets
following the previous fall in prices and rising tensions regarding Iran's nuclear programme.
Against this background, oil prices are assumed to remain relatively high over the forecast period. Contracts in the futures market indicate that prices may range from USD 67 to 70 per barrel in the near to medium term. Based on such contracts, the forecast assumes the price of a barrel of Brent to average USD 66.2 in 2007 and USD 70.3 in 2008.
The rebound in oil prices could reinforce the slowdown of the US economy, which is particularly energy-intensive and benefits to a comparatively lesser degree from exports to the oil-producing countries. Furthermore, it could lead to a re-acceleration of consumer prices, thereby weighing on the purchasing power of households.
Long-term interest rates remain close to historically low levels
Long-term interest rates have followed a quite similar pattern in the euro area and in the US, but with a narrowing of the spread between the two regions resulting from a reassessment of risks. In the euro area, 10-year benchmark yields increased from 3.6% at the beginning of October 2006 to roughly 4.2% at the end of April 2007, in line with the improved growth outlook. Due to the ongoing withdrawal of monetary stimulus, the euro yield curve has flattened but remains slightly upward sloping.

Chapter 1 The world economy
- 15 -
0
10
20
30
40
50
60
70
80
01 02 03 04 05 06 07
Brent (USD/bl.) Brent (Euro/bl.)
level
Graph 1.4: O il prices (Brent) in USD and €
In the USA, the 10-year benchmark yields have remained roughly stable since last autumn, oscillating around 4.60%. At the end of January 2007, the higher-than-expected resilience of the US economy pushed yields temporarily up to 4.90%, but subsequent worries about the sub-prime mortgage market have led investors to look for safe assets. The US yield curve remains inverted up to a 5-year maturity, and the 10-year/3-month yield spread amounts to about 50 basis points. This is partly explained by continued high demand for longer-dated government bonds, especially from institutional investors.
The real exchange rate of the euro has slightly appreciated
The ongoing withdrawal of monetary stimulus in the euro area has reduced the interest rate differential with the US. This, in conjunction with the improved growth outlook for the euro area, has led to a sustained appreciation of the euro against the US dollar. The euro has also appreciated against the Japanese yen. While monetary tightening in Japan is taking place very gradually, the low level of Japanese interest rates, together with low volatility in foreign exchange markets, has further increased the yen's attractiveness as a funding currency. However, with the British pound and other European currencies remaining broadly stable vis-à-vis the euro, the appreciation of the euro in effective terms has been limited.
2.5
3.0
3.5
4.0
4.5
5.0
5.5
6.0
01 02 03 04 05 06 07
Euro area (10-year bond) US (10-year bond)
level
Graph 1.5: Long-term interest rates, euro area and US
Outlook by region
World GDP growth remained strong in 2006 at about 5¼%. This was slightly more than expected in the 2006 autumn forecast, the discrepancy stemming essentially from better-than-expected growth in Asia (excl. Japan) and Latin America. As the deceleration of the world economy is expected to be moderate, world output growth is projected to continue to expand at a rate close to 5% in 2007 and 2008. World trade growth is also expected to ease slightly from an average annual rate of around 8½% in 2006 to around 7¾% in 2007 and 2008. However, most of this decline reflects a decrease in import growth in the Americas, while import growth in Asia should remain broadly stable.
The US economy, which had expanded above its long-term potential for three years, slowed down significantly from the second quarter of 2006, with average annualised growth falling to below 2½%. The downturn was concentrated in the housing sector, with a sharp contraction of residential investment. Manufacturing has also cooled down, reflecting an adjustment of business inventories.
Private consumption has so far been supported by solid employment growth, rising wages, a fall in energy prices since last summer, and lower household saving. In the current year, however, a fall in consumer spending growth seems inevitable. Furthermore, business investment has softened considerably and residential investment could fall further. Although an improving trade performance

Economic forecast, spring 2007
- 16 -
2.5
3.0
3.5
4.0
4.5
5.0
5.5
6.0
3m 9m 2y 4y 6y 8y 10y 30y
US 20/04/2007 US 20/10/2006Euro Area 20/04/2007 Euro area 20/10/2006
Graph 1.6: Yield curve, euro area and US
will provide some offset in the near term, annual GDP growth is expected to decline to 2.2% in 2007, with risks tilted to the downside. For 2008, the forecast is for US GDP to edge up to 2.7% as the housing correction peters out.
The Japanese economy grew at an average annual rate of 2.2% in 2006, which is above Japan's potential growth rate but still ½ pp below the autumn forecast. This outcome is mainly explained by a sharp decline in private consumption in the third quarter of 2006 and significant data revisions for previous quarters. Private domestic demand is projected to remain the main driver of GDP growth, as consumption will be supported by rising confidence, a favourable situation in the labour market and a reduction in the tax burden on households. As for investment, business confidence and the rate of capacity utilisation rate are on the rise. Overall, this should lead to GDP growth exceeding 2% in both 2007 and 2008.
Economic growth in the rest of Asia is expected to continue on a strong footing over the forecast period. After growing by an estimated 8.7% in 2007, real GDP growth is expected to moderate slightly to 8.3% in 2007 and 8.4% in 2008. This is in line with the impact of decelerating export growth to the US, and the impact of past oil price increases. However, the aggregated regional growth figures mask variations across the different economies.
China's economic growth remained very strong in 2006. Following a revised GDP growth rate of 10.4% in 2005, GDP growth accelerated to an estimated 10.7% in 2006. Key factors behind this higher-than-
1.1
1.2
1.3
1.4
04 05 06 07120
130
140
150
160
USD/EUR (lhs) JPY/EUR (rhs)
level
Graph 1.7: Euro exchange rate , USD and JPY
expected growth were net merchandise exports and still-buoyant investment spending, which the tightening measures introduced by the government last year have not been able to rein in. China's economic growth is expected to ease somewhat in 2007, to 10.5%, as the further tightening measures introduced by the Chinese administration take effect in the course of the year. In 2008, as external demand should remain resilient and private consumption should accelerate slightly, GDP growth is expected to remain above 10.0%. The trade and current account surpluses are set to exceed last year's record in 2007 and to keep growing also in 2008.
Growth in India is also projected to moderate gradually over the forecast period, from 8.7% in 2006 to 7.6% in 2007 and 7.4% in 2008. This slowdown is explained by strong but somewhat easing domestic demand due to the monetary tightening which began in October 2004. In the rest of Asia, economic growth is expected to remain slightly above 5% in 2007 and 2008. While divergences exist across countries, the contribution of domestic demand to GDP growth generally tends to decline somewhat while exports remain buoyant. This could be a source of vulnerability in the event of a sharp slowdown in the USA. Even if the intra-regional trade linkages have increased and the share of the USA in Asian exports has decreased, there is still no clear evidence that the Asian economies have become more resilient to the American cycle.
Economic growth in the EFTA countries remains robust. In Norway it reached 2.9% in 2006 and
Chapter 1 The world economy
- 17 -
should increase to 3.2% in 2007, before moderating somewhat to 2.7% in 2008. Domestic activity should continue to be the main driver of growth, in spite of tax increases which are expected to dampen consumption growth in 2007, and the completion of investment projects in the oil and gas sector. Switzerland's GDP growth increased to 2.9% in 2006, reflecting a strengthening of external demand. In 2007 and 2008, growth is expected to return to rates around 2%, mainly due to a slowdown of exports.
Economic growth in Turkey reached about 6% last year. In spite of a certain slowdown of domestic demand after the financial market turbulences in spring 2006, the Turkish economy seems sufficiently resilient and dynamic to expand at a pace of around 5% in 2007 and 6% in 2008, broadly in line with its potential. In Croatia, economic growth is expected to remain at around 4½% in 2007-08 while in the former Yugoslav Republic of Macedonia GDP growth is likely to experience an acceleration from 3.1% in 2006 to 4.3% in 2007 and 5.3% in 2008. However, as this momentum is driven by strong domestic demand growth, trade imbalances are projected to rise. They are expected to be offset by capital inflows (mainly FDI) and workers'
remittances.
The CIS region is the second-fastest-growing region after developing Asia, with economic growth of some 7.5% in 2006 and expectations at 7% for 2007-08. Economic growth in Russia reached 6.7% in 2006 thanks to the robust growth in domestic demand which offset the fall in energy prices at the end of the year. Even if this fall leads to a decline in the contribution of exports in 2007, GDP growth is expected to remain buoyant at about 6½% in 2007-08. Economic growth in the other CIS countries rebounded to 10% in 2006 and is expected to remain around 7.5% in 2007-08. The strengthening of growth in the region mainly reflects Ukraine's recovery, with GDP growth projected at 7.1% in 2007 compared to 2.6% in 2006.
Economic growth in Latin America reached 5.4% in 2006, marking the fourth consecutive year of economic expansion. External conditions remain favourable with strong global demand, high commodity prices and benign financing conditions, while domestic demand is strengthening thanks to improving labour markets. In line with the expected moderation in the world economy and a stabilisation of some commodity prices, GDP growth in the region
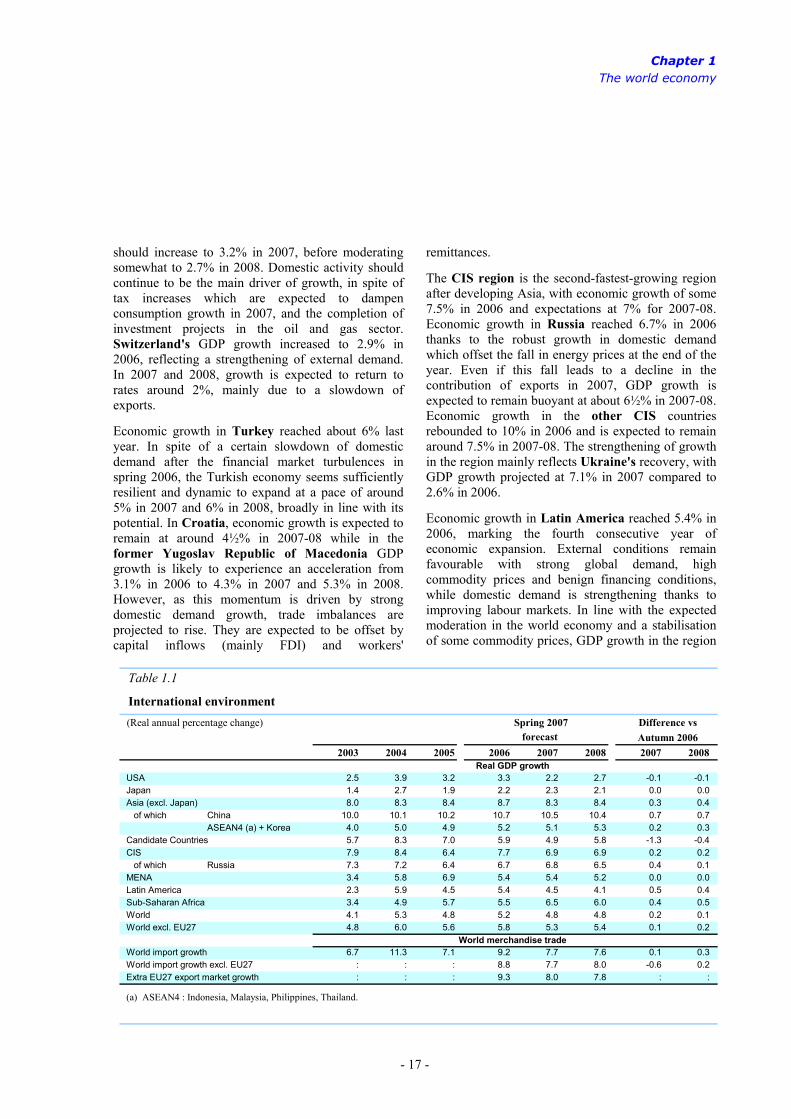
Table 1.1
International environment (Real annual percentage change) Spring 2007 Difference vs
forecast Autumn 20062003 2004 2005 2006 2007 2008 2007 2008
Real GDP growth USA 2.5 3.9 3.2 3.3 2.2 2.7 -0.1 -0.1 Japan 1.4 2.7 1.9 2.2 2.3 2.1 0.0 0.0 Asia (excl. Japan) 8.0 8.3 8.4 8.7 8.3 8.4 0.3 0.4 of which China 10.0 10.1 10.2 10.7 10.5 10.4 0.7 0.7
ASEAN4 (a) + Korea 4.0 5.0 4.9 5.2 5.1 5.3 0.2 0.3 Candidate Countries 5.7 8.3 7.0 5.9 4.9 5.8 -1.3 -0.4 CIS 7.9 8.4 6.4 7.7 6.9 6.9 0.2 0.2 of which Russia 7.3 7.2 6.4 6.7 6.8 6.5 0.4 0.1 MENA 3.4 5.8 6.9 5.4 5.4 5.2 0.0 0.0 Latin America 2.3 5.9 4.5 5.4 4.5 4.1 0.5 0.4 Sub-Saharan Africa 3.4 4.9 5.7 5.5 6.5 6.0 0.4 0.5 World 4.1 5.3 4.8 5.2 4.8 4.8 0.2 0.1 World excl. EU27 4.8 6.0 5.6 5.8 5.3 5.4 0.1 0.2
World merchandise trade World import growth 6.7 11.3 7.1 9.2 7.7 7.6 0.1 0.3 World import growth excl. EU27 : : : 8.8 7.7 8.0 -0.6 0.2 Extra EU27 export market growth : : : 9.3 8.0 7.8 : :
(a) ASEAN4 : Indonesia, Malaysia, Philippines, Thailand.

Economic forecast, spring 2007
- 18 -
is expected to decrease slightly, to around 4½% in 2007 and 4% in 2008. However, while the resilience of some economies has increased due to improved fiscal positions and larger official reserves, the region remains vulnerable to external shocks, such as an unexpectedly sharp slowdown in the US or Asia and variations in commodity prices.
GDP growth in the MENA (Middle East and North Africa) region was 5.4% in 2006 and is expected to remain above 5% in 2008. In Saudi Arabia and the United Arab Emirates, domestic demand and public spending are underpinned by rising oil export revenues. However, as the economic impact of ongoing geopolitical uncertainties and regional conflicts cannot be excluded, risks continue to be high.
In sub-Saharan Africa, GDP growth in 2006 was around 5½%, almost the same rate as in the preceding year. Domestic demand was supported by oil revenues in oil-exporting countries, although oil production basically stagnated due to technical and political problems. At the same time, external demand for other commodities, especially metals, helped sustain growth also in oil-importing countries. In 2007, GDP growth is expected to increase to 6½%, still supported by external demand and an easing of some of the production constraints seen in 2006. Following this exceptional effect, in 2008 growth should decelerate slightly, to about 6%.
Lastly, Canada's economy slowed down in the course of 2006 due to reduced US demand. However, domestic demand should continue to support GDP growth, which fell to 2.7 % in 2006 and is projected to decline further to 2.4% in 2007 before edging up to 2.9% in 2008. In Australia, GDP growth was 2.6% in 2005 and 2006, after years of rates above 4%. Looking ahead, growth should accelerate gradually to 2.9% in 2007 and 3.1% in 2008, due to resilient consumption, favourable financing conditions, and an improving contribution from net exports.

Chapter 2 The economic situation in the euro area and the EU

1. Solid growth in the face of headwinds
- 21 -
The recovery gains traction …
The economy of the European Union shifted gear in 2006 as output growth picked up markedly after a prolonged period of sluggishness. In both the euro area and the EU, average quarter-on-quarter GDP growth rose to an annualised rate of more than 3%. In the first half of the year, output growth even reached an annualised 3½% in the euro area, moderating to 3% in the second half (from 3¾% to 3¼% in the EU). However, as quarterly growth rates tend to be volatile, the significance of the slowdown in the second half of 2006 should not be overstated, particularly as it was largely due to a deceleration in a single country, namely France, where economic activity almost stagnated in the third quarter.
For the year as a whole, GDP grew by 2.7% in the euro area and 3% in the EU, which represents an upward revision by 0.1 and 0.2 pp., respectively, compared to the autumn forecast. For both areas, this was the best performance since 2000 and a robust acceleration compared to the preceding three years when growth averaged a modest 1.4% in the euro area and 1.8% in the EU.
The strength of output growth in 2006 surprised on the upside as it took place against a background of persistently high oil prices, less accommodative monetary conditions and concerns over a slowdown of US growth. While the US slowdown turned out somewhat milder than expected, the favourable growth performance of the EU economy also seems to reflect an improved resilience against adverse external developments. As a result of the EU decoupling from the US, the growth gap between the US and the EU narrowed significantly, from an average of 1.5 pps. in the period 2003-2005 to 0.6 pp. in 2006. On a per- capita basis, growth in 2006 in the EU (at 2.6%) exceeded US growth (2.3%) for the first time since 2002.
In 2006, again for the first time since the beginning of the decade actual output growth was clearly above the estimated potential growth rate. While the output gap narrowed therefore, it remained in negative territory for both areas, suggesting the continued existence of economic slack in a broad sense. However, this stands in some contrast with survey information indicating that, by the end of 2006, the rate of capacity utilisation reached the peak levels observed in the 1998-2000 boom.
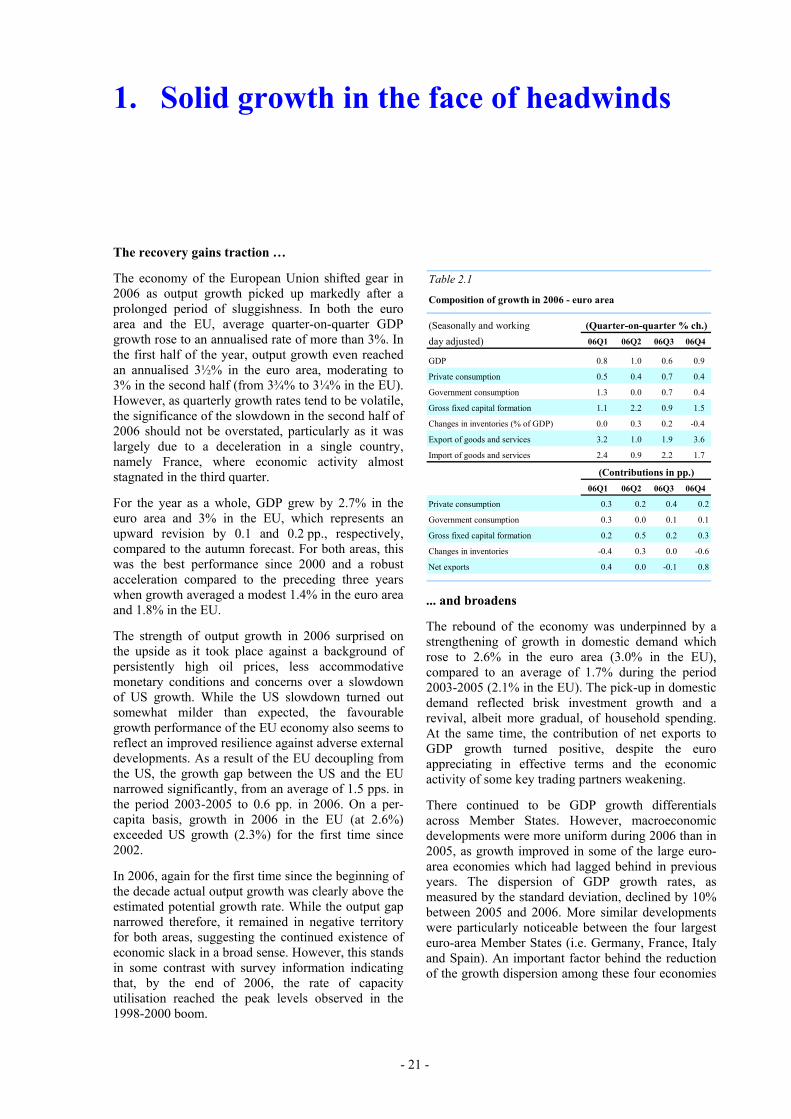
Table 2.1
(Seasonally and workingday adjusted) 06Q1 06Q2 06Q3 06Q4
GDP 0.8 1.0 0.6 0.9
Private consumption 0.5 0.4 0.7 0.4
Government consumption 1.3 0.0 0.7 0.4
Gross fixed capital formation 1.1 2.2 0.9 1.5
Changes in inventories (% of GDP) 0.0 0.3 0.2 -0.4
Export of goods and services 3.2 1.0 1.9 3.6
Import of goods and services 2.4 0.9 2.2 1.7
06Q1 06Q2 06Q3 06Q4
Private consumption 0.3 0.2 0.4 0.2
Government consumption 0.3 0.0 0.1 0.1
Gross fixed capital formation 0.2 0.5 0.2 0.3
Changes in inventories -0.4 0.3 0.0 -0.6
Net exports 0.4 0.0 -0.1 0.8
Composition of growth in 2006 - euro area
(Quarter-on-quarter % ch.)
(Contributions in pp.)
... and broadens
The rebound of the economy was underpinned by a strengthening of growth in domestic demand which rose to 2.6% in the euro area (3.0% in the EU), compared to an average of 1.7% during the period 2003-2005 (2.1% in the EU). The pick-up in domestic demand reflected brisk investment growth and a revival, albeit more gradual, of household spending. At the same time, the contribution of net exports to GDP growth turned positive, despite the euro appreciating in effective terms and the economic activity of some key trading partners weakening.
There continued to be GDP growth differentials across Member States. However, macroeconomic developments were more uniform during 2006 than in 2005, as growth improved in some of the large euro-area economies which had lagged behind in previous years. The dispersion of GDP growth rates, as measured by the standard deviation, declined by 10% between 2005 and 2006. More similar developments were particularly noticeable between the four largest euro-area Member States (i.e. Germany, France, Italy and Spain). An important factor behind the reduction of the growth dispersion among these four economies

Economic forecast, spring 2007
- 22 -
0.00.20.40.60.81.01.21.41.61.8
Q3 Q4 Q1 Q2 Q3 Q4 Q1 Q2 Q3 Q4
2004 2005 2006
q-o-q y-o-y
Graph 2.1: Dispersion of GDP growth rates, four larger euro-area Member States
standard deviation in pp..
was the behaviour of private consumption, which saw a rebound in both Germany and Italy following several years of sluggishness.
An improving labour market supports consumption
Private consumption gathered pace in 2006 across Member States. Most significantly, private consumption grew by 0.8% in Germany and by 1.5% in Italy. While these are hardly awe-inspiring figures, they represent a clear improvement over the preceding three-year period where private consumption stagnated in Germany and grew by an annual average of 0.8% in Italy. The pace of private consumption was somewhat slower in the euro area (1.7%) than in the EU (2.1%), partly due to the impact of a reclassification of health-care spending in the Netherlands (which statistically lowered private consumption, whilst raising public consumption) and a weakening of household spending in Portugal.
Despite the improved performance in 2006, private consumption remains 2 pps. below the level reached at this stage in previous cycles. The low growth of private consumption since 2003 mirrors the pace of wage growth, which remained exceptionally subdued over a prolonged period in some Member States, particularly in Germany. While this was welcome as a means to restore external competitiveness in these countries, it also acted as a brake on the growth rate of household income and, thereby, on private consumption. The slow deceleration in headline inflation, which was kept up by soaring energy prices,
98
100
102
104
106
108
1 2 3 4 5 6 7 8 9 10 11 12 13 14 15 16 17
average previous recoveries (82Q4, 87Q3, 93Q2, 99Q1)current recovery (03Q3)
Index=100 at trough
Graph 2.2: Domestic demand (excl. stocks) in the current and past recoveries, euro area
Quarters from trough
was an additional factor weighing on the purchasing power of households.
Investment becomes a key driver of growth
A second important pillar of demand growth last year was gross fixed capital formation. Investment spending rose by 4.7% in the euro area (5.6% in the EU), contributing 1.0 pp. to overall GDP growth (1.1 pps. in the EU).
Corporate investment was underpinned by several factors. First, as suggested by the Commission’s investment survey, corporate investment was supported by an improved outlook for overall demand. Second, capacity utilisation in the manufacturing sector had steadily increased since late 2005, to stand at 84.8% in the second quarter of 2007 in the euro area (84.5% in the EU), exceeding the peak observed in late 2000. Third, firms benefited from still-favourable financing conditions. Long-term interest rates moved up only moderately, while risk spreads remained narrow. Moreover, according to the ECB’s bank lending survey, credit standards were broadly stable throughout the year, following their earlier easing. Fourth, companies could count on ample own resources to carry out their investment plans. Finally, profitability stayed high. The gross operating surplus of the corporate sector (adjusted for compensations of self-employed) rose to 30.2% of GDP in 2006, a record high in this decade. Real unit labour costs, which can be interpreted as an inverted measure for profit margins, dropped by 0.9% in the euro area(1.1% in the EU), accelerating their decline compared to the preceding three years. These positive

Chapter 2 The economic situation in the euro area and the EU
- 23 -
0.0
0.5
1.0
1.5
2.0
2.5
Q3 Q4 Q1 Q2 Q3 Q4 Q1 Q2 Q3 Q4
2004 2005 2006
7.0
7.5
8.0
8.5
9.0
private consumption (lhs) employment (lhs)unemployment rate (rhs)
Graph 2.3: Private consumption and the labour market euro area
yoy % ch. % of labour force
fundamentals were reflected in business survey results which showed optimism in the business sector close to or above the peak values observed in 2000.
Strong construction activity was a further element behind the recovery of fixed investment in 2006. Helped by a revived construction sector in Germany, euro-area construction investment accelerated to 4.5% last year, from an average of 1.2% in the period 2003-2005. Although quarterly data for construction activity tend to be volatile, the broad picture of an ongoing expansion prevailed throughout the year, with construction investment in the second half of 2006 expanding at an annualised rate of almost 4½%. This is consistent with data from surveys which continued to point to strong construction activity in the second half of 2006. Confidence in the construction sector, as measured by the Commission survey, trended upwards during most of 2006 and, despite some easing in the fourth quarter, ended the year well above its long-term average.
Strong contribution from net exports
In 2006, world trade (excluding the EU) is estimated to have grown by 8.4%, slightly above the value registered in 2005. According to the latest estimates of the CPB Netherlands, world trade accelerated to around 10% (annualised) in the second half of 2006, compared to less than 7% in the first half.
Exporters in the EU clearly benefited from this dynamic trade environment. The volume of exports, which decelerated between the first and second quarter of 2006, rebounded in the second half of the
-1.5
-1.0
-0.5
0.0
0.5
1.0
1.5
2.0
2.5
99 00 01 02 03 04 05 06 07real unit labour costs Labour productivity
yoy % ch..
Graph 2.4: Labour productivity and real unit labour costs, euro area
year to reach annualised growth rates of more than 10% in the euro area and 6½% in the EU. For the year as a whole, exports grew by 8.2% in the euro area and 9.2% in the EU.
Expectations of a deceleration in EU exports in conjunction with a slowdown of the US economy have not materialised, so far. This may be explained by the fact that the cooling of the US economy appears largely limited to the housing sector which has a low import intensity. In addition, the share of euro-area exports to the US has declined in recent years. The share of exports of goods, for instance, came down from 17% in 1999 to 15% in 2006.
Reflecting the robust pace of expansion in domestic demand, euro-area imports accelerated during 2006, from less than 7% (annualised) in the first half of 2006 to above 8% in the second half. On the year, imports rose by 7.7% in the euro area compared to 5.2% the year before (9.1% versus 5.8% in the EU).
Despite the acceleration of imports, the contribution of net trade to GDP growth improved in 2006 (by 0.5 pp. in the euro area and 0.2 pp. in the EU). The strength of global trade more than offset the effects of the moderate appreciation of the euro in effective terms (+0.8%). However, the picture is very different for individual Member States. Looking at the larger economies, the contribution of net trade to GDP growth was +1.1 pps. in Germany, +0.3 pp. in Italy, -0.2 pp. in Poland, -0.3 pp. in France and -0.4 pp. in the UK, while in Spain net trade subtracted as much as 1 pp. from growth.

2. Interest rate assumption and financial conditions
- 24 -
Financing conditions remain favourable, despite tighter monetary policy
Since December 2005, the ECB has raised interest rates by a total of 175 basis points to 3.75 percent for the euro area. Despite these interest rate increases, both real and nominal short-term interest rates are still at relatively low levels, money and credit growth continues to be strong, and liquidity in the euro area is ample by all measures. Moreover, long-term interest rates remain low by historical standards. Recent equity market turbulence was short-lived. Although short-term bank interest rates have increased substantially, ECB interest rates have not been fully passed through, as regards both short-term and especially long-term bank interest rates. All in all, financing conditions remain favourable.
Financial markets widely expect that in the near term the ECB will pursue its policy of progressively withdrawing monetary stimulus and further normalising interest rates. At present, financial market prices imply that a high probability is being given to at least one further ECB rate increase by 25 basis points in the course of 2007.
Household sector credit growth is decelerating, driven by a slowdown in mortgage lending
On the back of rising interest rates, high and rising indebtedness and the solid house price gains of recent years, household sector funding demand is easing. The annual growth rate of bank lending to the household sector in the euro area declined from roughly 10% in March 2006 to a still robust growth rate of about 8% at the beginning of 2007. Over the same period, the growth rate of mortgage lending decelerated from more than 12% to around 9%. The year-on-year growth rate in mortgage lending (which accounts for more than 70 percent of all outstanding household loans) has slowed down in almost all euro-area countries and most notably in Ireland, Greece and the Netherlands.
In the fourth quarter of 2006, the ratio of outstanding household debt to GDP in the euro area reached a record high of 59% of GDP. The combination of high debt levels and rising interest rates, particularly at the short end, has implied an increase in household net interest payments (i.e. the difference between payments received on bank deposits and interest payments due for loans) vis-à-vis banks. Net interest
43
47
51
55
59
98 99 00 01 02 03 04 05 062.15
2.20
2.25
2.30
2.35
debt to GDP* (lhs) net interest payments (rhs)
% % of GDP**
Graph 2.5: Debt ratio* and interest rate payments**, household sector, euro area
* co m pared with annual GDP** per quarter co m pared with quarterly GDP , data fo r Q4/2006 are partly es tim ated; S o urce: ECB , o wn calculatio ns
payments in the euro area are estimated to have exceeded 2.3% of GDP in the fourth quarter of 2006, slightly up from just above 2.1% of GDP during the year 2005.
While household debt levels and debt-servicing costs in the euro area as a whole remain low in an international context, the situation varies significantly across Member States. Countries where variable-interest-rate contracts are widespread are likely to be affected more strongly, as household balance sheets are more vulnerable to the rising trend in short-term interest rates. Household sector debt levels vis-à-vis banks in those countries range from 40% to 80% of GDP, namely 41% in Greece, 46% in Finland, 74% in Portugal, 77% in Spain and 80% in Ireland.
In addition to rising short-term interest rates, a cooling down in housing markets could have implications for highly-indebted households. House price increases in the euro area softened from 7.9% in 2005 to 6.4% in 2006, the lowest price increases since 2001. Additional evidence of a cooling down in housing markets is provided by a slowdown in residential building permits in a number of euro-area countries. A slowdown in housing demand together with the progressive rise in debt-servicing costs for variable-rate mortgage holders suggest that the outlook for household balance sheets is likely to deteriorate in a number of Member States.
Outside the euro area, lending to households continued to be buoyant in most EU countries. In the beginning of 2007, lending to households increased

Chapter 2 The economic situation in the euro area and the EU
- 25 -
by roughly 10% year-on-year in the UK, Sweden and Denmark. When measured against GDP, household sector debt exceeds 100% in Denmark, is close to this threshold in the UK and amounts to 70% in Sweden. Household sector credit growth is also very strong in most new Member States, amounting to more than 50% year-on-year in the Baltic countries, about 35% in Poland and roughly 30% in Hungary, the Czech Republic and Slovakia. Nevertheless, despite its rapid rise, the amount of debt outstanding in relation to GDP remains relatively low in the new Member States.
External funding in the corporate sector has remained buoyant
Demand for external funding within the corporate sector has been buoyant throughout 2006 and into 2007. As net issuance of equity has been relatively modest, funding demand is being met primarily through borrowing. While bond issuance has been rising, the growth in bank lending to the corporate sector accelerated sharply to more than 13% year-on-year in January 2007 – a record high – before slowing down to 12.6% in February. The euro-area countries with the highest rates of non-financial corporate sector credit growth were Spain and Ireland with year-on-year growth amounting to about 30%, while in Germany credit growth was a mere 3.4%.
Amid the revival in corporate borrowing, the ratio of corporate debt to GDP increased from 64% at the end of 2005 to 70% at the end of 2006, while the net interest burden vis-à-vis banks rose from 1.5% of GDP to more than 1.8% of GDP over the same period. Evidence of continued strong demand for corporate borrowing is provided by the ECB bank lending
46
52
58
64
70
98 99 00 01 02 03 04 05 061.5
1.6
1.7
1.8
1.9
debt to GDP (lhs) net interest payments (rhs)
% % of GDP
Graph 2.6: Debt ratio* and interest rate payments** in the non-financial corporate sector, euro area
* co m pared to annual GDP** per quarter co m pared with quarterly GDP , debt inc ludes lo ans fro m the euro area and an es tim ate o f lo ans fro m o uts ide the euro area and no n-s hare s ecurities , data fo r Q4/2006 are partly es tim ated; S o urce: ECB , o wn calculatio ns
survey for the fourth quarter of 2006. The survey indicates that borrowing is related to fixed investments, accumulation of inventories and a need for working capital. Banks reported that M&A financing and corporate restructuring contributed to additional demand for external funding by corporates. The survey does not provide information on the relative importance of each factor in determining total loan demand.
In non-euro area countries, lending to the non-financial sector advanced rapidly as well. In 2006, credit growth to the non-financial corporate sector increased by roughly 15% in the UK and in Denmark and by about 10% in Sweden. In the new Member States, bank lending to the non-financial corporate sector varied widely, with growth rates of more than 50% in Estonia and Latvia, at the one extreme, and more moderate rates of around 10% year-on-year in Hungary and Poland, at the other.
Economic forecast, spring 2007
- 26 -
Box 2.1: New methodology for interest rate assumptions
With the spring 2007 interim forecast, interest rates assumptions were for the first time altered from a judgemental approach to a market-based approach. With this change, the set of external assumptions (oil prices, exchange rates and interest rates) is now fully market-based. As a result, the consistency of the Commission forecast's external assumptions has been improved.
For the euro area, short-term interest rates are derived from future contracts, while long-term interest rates are derived from implicit forward swap rates. The latter are corrected for the actual spread between the 10-year government bond yield and the 10-year swap rate.
None of the interest rate assumptions have been corrected for risk premia which would raise technical difficulties and would not be straightforward as there is no single optimal methodology.
For the other Member States, both short- and long-term interest rates are derived from implicit forward swap rates, following the methodology for the euro area described above. In cases where no market instruments were available, a fixed spread vis-à-vis euro area interest rates was taken for both short- and long-term interest rates.
To shield the assumptions from daily fluctuations, 10-working-days averages were used. The cut-off date for interest rate assumptions was 18 April 2007.

3. Continued brisk growth
- 27 -
A better starting point combined with stronger underlying momentum
Due to better-than-expected activity in the second half of 2006, average annual output growth was revised upwards for the year as a whole compared to the autumn forecast. At the same time, the statistical overhang for GDP into 2007 increased to 1.2% for both regions, compared to projections of 0.9% for the euro area and 1.0% for the EU in the autumn. Furthermore, survey data suggest that the better momentum at the end of last year was carried over into 2007. The forecast therefore raises quarterly growth in 2007 to an average rate of around 0.6% QoQ in both regions, from 0.5% in the autumn forecast.
The most sizeable revision to the quarterly growth profile in 2007 was made for the first quarter, where the euro-area economy is now expected to grow by 0.6% QoQ rather than 0.2% as projected in the autumn (similar revisions were made for the EU as a whole). This large revision mainly stems from a much higher growth rate for Germany, where GDP growth for the first quarter is now projected to be +0.6% QoQ instead of -0.9%. The revision for Germany is partly
-1
0
1
2
3
4
92 93 94 95 96 97 98 99 00 01 02 03 04 05 06 07 08
Graph 2.7: Real annual GDP growth in the euro area, 1992-2008
% ch. forecast
due to the VAT rise having a weaker impact than earlier assumed. Exceptionally warm weather conditions in the first quarter also boosted construction activity. Above all, the underlying growth momentum proved significantly stronger.
Owing to these revisions, real GDP growth in 2007 is forecast at 2.6% in the euro area and 2.9% in the EU, up by 0.5 pp. compared to the autumn 2006 projections. In 2008, GDP growth is expected to decelerate slightly to 2.5% in the euro area and 2.7% in the EU. This nevertheless represents an upward revision by 0.3 pp. for both areas. With growth in
Table 2.2
Composition of growth - EU27 (Real annual percentage change) Spring 2007
forecast2005 2001 2002 2003 2004 2005 2006 2007 2008
bn Euro curr. prices % GDP Real percentage change Private consumption 6383.9 58.2 2.2 1.6 1.7 2.1 1.7 2.2 2.5 2.6 Government consumption 2296.4 20.9 2.0 2.6 2.2 1.6 1.7 2.1 1.8 1.8 Gross fixed capital formation 2182.2 19.9 0.7 -0.6 1.1 3.2 3.1 5.6 5.2 4.2 Change in stocks as % of GDP 37.1 0.3 0.3 0.0 0.2 0.4 0.3 0.4 0.7 0.5 Exports of goods and services 4090.5 37.3 3.7 1.9 1.8 7.2 5.3 9.2 7.0 6.2 Final demand 14990.0 136.7 2.1 1.2 1.8 3.7 2.8 4.7 4.3 3.7 Imports of goods and services 4024.2 36.7 2.4 1.4 3.4 7.4 5.8 9.1 7.2 6.6 GDP 10965.7 100.0 2.0 1.2 1.3 2.5 1.7 3.0 2.9 2.7 GNI 10946.9 99.8 1.9 1.2 1.5 2.7 1.6 3.2 2.7 2.6 p.m. GDP euro area 8041.6 73.3 1.9 0.9 0.8 2.0 1.4 2.7 2.6 2.5
Contribution to change in GDP Consumption 1.7 1.4 1.4 1.6 1.3 1.7 1.8 1.9 Investment 0.1 -0.1 0.2 0.6 0.6 1.1 1.1 0.9 Inventories -0.3 -0.3 0.2 0.2 -0.1 0.0 0.0 0.0 Exports 1.3 0.7 0.6 2.5 1.9 3.4 2.8 2.6 Final demand 2.8 1.7 2.4 5.0 3.8 6.4 5.8 5.4 Imports (minus) -0.8 -0.5 -1.1 -2.5 -2.0 -3.3 -2.9 -2.7 Net exports 0.5 0.2 -0.5 0.0 -0.1 0.1 -0.1 -0.1
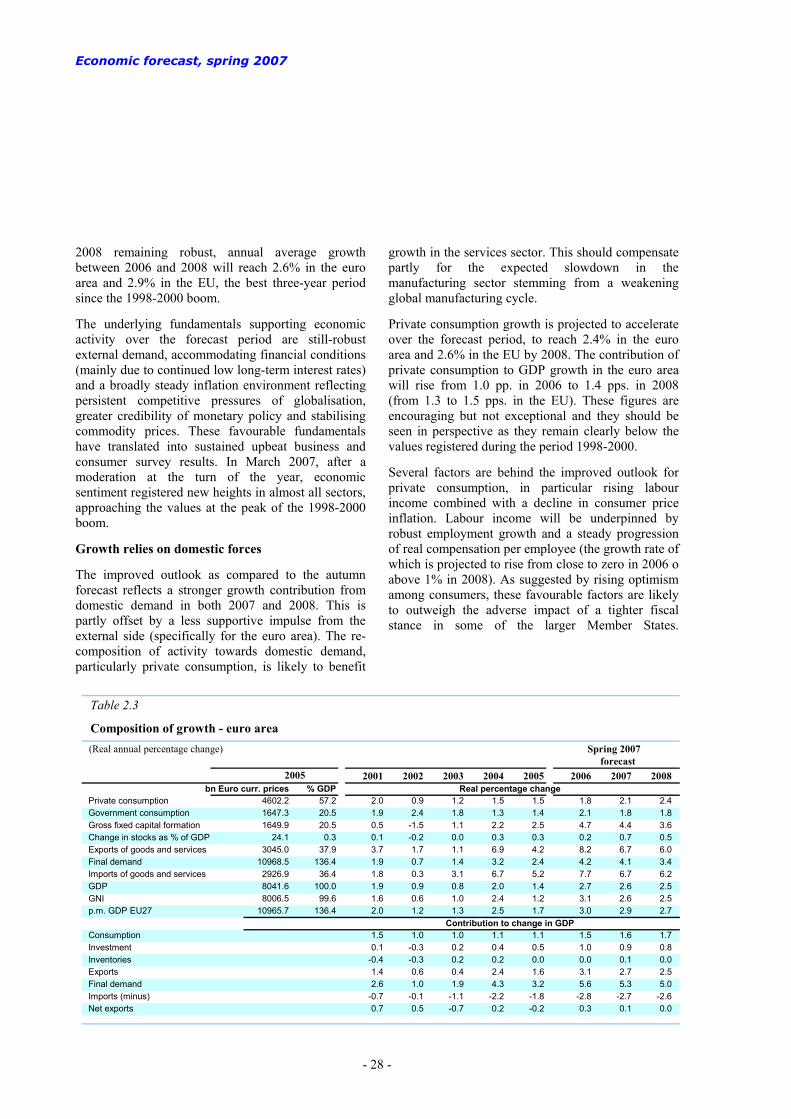
Economic forecast, spring 2007
- 28 -
2008 remaining robust, annual average growth between 2006 and 2008 will reach 2.6% in the euro area and 2.9% in the EU, the best three-year period since the 1998-2000 boom.
The underlying fundamentals supporting economic activity over the forecast period are still-robust external demand, accommodating financial conditions (mainly due to continued low long-term interest rates) and a broadly steady inflation environment reflecting persistent competitive pressures of globalisation, greater credibility of monetary policy and stabilising commodity prices. These favourable fundamentals have translated into sustained upbeat business and consumer survey results. In March 2007, after a moderation at the turn of the year, economic sentiment registered new heights in almost all sectors, approaching the values at the peak of the 1998-2000 boom.
Growth relies on domestic forces
The improved outlook as compared to the autumn forecast reflects a stronger growth contribution from domestic demand in both 2007 and 2008. This is partly offset by a less supportive impulse from the external side (specifically for the euro area). The re-composition of activity towards domestic demand, particularly private consumption, is likely to benefit
growth in the services sector. This should compensate partly for the expected slowdown in the manufacturing sector stemming from a weakening global manufacturing cycle.
Private consumption growth is projected to accelerate over the forecast period, to reach 2.4% in the euro area and 2.6% in the EU by 2008. The contribution of private consumption to GDP growth in the euro area will rise from 1.0 pp. in 2006 to 1.4 pps. in 2008 (from 1.3 to 1.5 pps. in the EU). These figures are encouraging but not exceptional and they should be seen in perspective as they remain clearly below the values registered during the period 1998-2000.
Several factors are behind the improved outlook for private consumption, in particular rising labour income combined with a decline in consumer price inflation. Labour income will be underpinned by robust employment growth and a steady progression of real compensation per employee (the growth rate of which is projected to rise from close to zero in 2006 o above 1% in 2008). As suggested by rising optimism among consumers, these favourable factors are likely to outweigh the adverse impact of a tighter fiscal stance in some of the larger Member States.
Table 2.3
Composition of growth - euro area (Real annual percentage change) Spring 2007
forecast2005 2001 2002 2003 2004 2005 2006 2007 2008
bn Euro curr. prices % GDP Real percentage change Private consumption 4602.2 57.2 2.0 0.9 1.2 1.5 1.5 1.8 2.1 2.4 Government consumption 1647.3 20.5 1.9 2.4 1.8 1.3 1.4 2.1 1.8 1.8 Gross fixed capital formation 1649.9 20.5 0.5 -1.5 1.1 2.2 2.5 4.7 4.4 3.6 Change in stocks as % of GDP 24.1 0.3 0.1 -0.2 0.0 0.3 0.3 0.2 0.7 0.5 Exports of goods and services 3045.0 37.9 3.7 1.7 1.1 6.9 4.2 8.2 6.7 6.0 Final demand 10968.5 136.4 1.9 0.7 1.4 3.2 2.4 4.2 4.1 3.4 Imports of goods and services 2926.9 36.4 1.8 0.3 3.1 6.7 5.2 7.7 6.7 6.2 GDP 8041.6 100.0 1.9 0.9 0.8 2.0 1.4 2.7 2.6 2.5 GNI 8006.5 99.6 1.6 0.6 1.0 2.4 1.2 3.1 2.6 2.5 p.m. GDP EU27 10965.7 136.4 2.0 1.2 1.3 2.5 1.7 3.0 2.9 2.7
Contribution to change in GDP Consumption 1.5 1.0 1.0 1.1 1.1 1.5 1.6 1.7 Investment 0.1 -0.3 0.2 0.4 0.5 1.0 0.9 0.8 Inventories -0.4 -0.3 0.2 0.2 0.0 0.0 0.1 0.0 Exports 1.4 0.6 0.4 2.4 1.6 3.1 2.7 2.5 Final demand 2.6 1.0 1.9 4.3 3.2 5.6 5.3 5.0 Imports (minus) -0.7 -0.1 -1.1 -2.2 -1.8 -2.8 -2.7 -2.6 Net exports 0.7 0.5 -0.7 0.2 -0.2 0.3 0.1 0.0

Chapter 2 The economic situation in the euro area and the EU
- 29 -
1314151617181920212223
80 82 84 86 88 90 92 94 96 98 00 02 04 06 08
EA8: average of BE, DE, EL, ES, FR, IT , NL, AT
EA3: average of FR, IT and DE (WD before '91)
Gross saving as % of gross disposable income
Graph 2.8: The saving rate , euro area
trend
Consumer confidence surpassed its long-term average at the end of 2005 and is gradually heading for the peak values reached in 2000.
In 2006, private consumption was also supported by a drop in the households saving rate, which returned to the historical minimum value recorded in 2000. The forecast assumes a stable saving rate over the period 2006-2008. Since the saving rate has followed a trend decline over the longer-term – due to factors such as demographic changes, easier access to credit and lower interest rates – the forecast thus takes a cautious stance with regard to private consumption growth. This may be justified by the fact that the labour income component of households’ disposable income is growing sub par despite its acceleration over the forecast period, while concerns about the sustainability of social security systems in many Member States may have led households to increase their precautionary saving.
Investment strength: more to come
Since 2004, investment in equipment has been the fastest growing component of domestic demand. The forecast expects this to continue also during 2007-2008, despite a certain easing over the projection period. In fact, growth is expected to weaken already in the course of 2007, but the annual growth rate for 2007 is boosted by a large carry-over from 2006. As a result, the annual growth rate of equipment investment in 2007 is projected to rise to 5.9% in the euro area, from 5.5% in 2006, before slowing down to 4.9% in 2008.
79
80
81
82
83
84
85
95 96 97 98 99 00 01 02 03 04 05 06 07 08-8-6-4-2024681012
Capacity utilisation in manufacturing (lhs)Investment in equipment (rhs)
% yoy % ch.
Graph 2.9: Capacity utilisation rate and investment in equipment, euro area
forecast
The strength of equipment investment is underpinned by robust domestic and external demand, continued high, albeit somewhat moderated, earnings expectations by corporates, accommodating financing conditions and the recent steep rise in the capacity utilisation rate in manufacturing. In line with this, bank lending to non-financial corporations continued to expand rapidly throughout 2006 to reach an annual growth rate of 13.2% in January 2007 (a slight deceleration to 12.6% was noted in February). Additionally, the ECB’s January 2007 bank lending survey shows that loans for fixed investment have become the most dynamic component of bank lending in the euro area after M&A and corporate restructuring. Furthermore, the European Commission’s latest investment survey indicates that the extension of the production capacity has become the dominant investment motive, followed by the need to replace an ageing capital stock.
Equipment investment will therefore remain a key driver of growth over the forecast horizon, even though the recent increase in indebtedness and the still-preponderant weight of bank loans in total liabilities of the corporate sector makes companies sensitive to further increases in interest rates.
Construction investment has also been revised upwards in the euro area, to 3.3% in 2007 (up from 1.7% in autumn) and to 2.7% in 2008 (up from 2.3%). Corporate construction investment will be boosted by
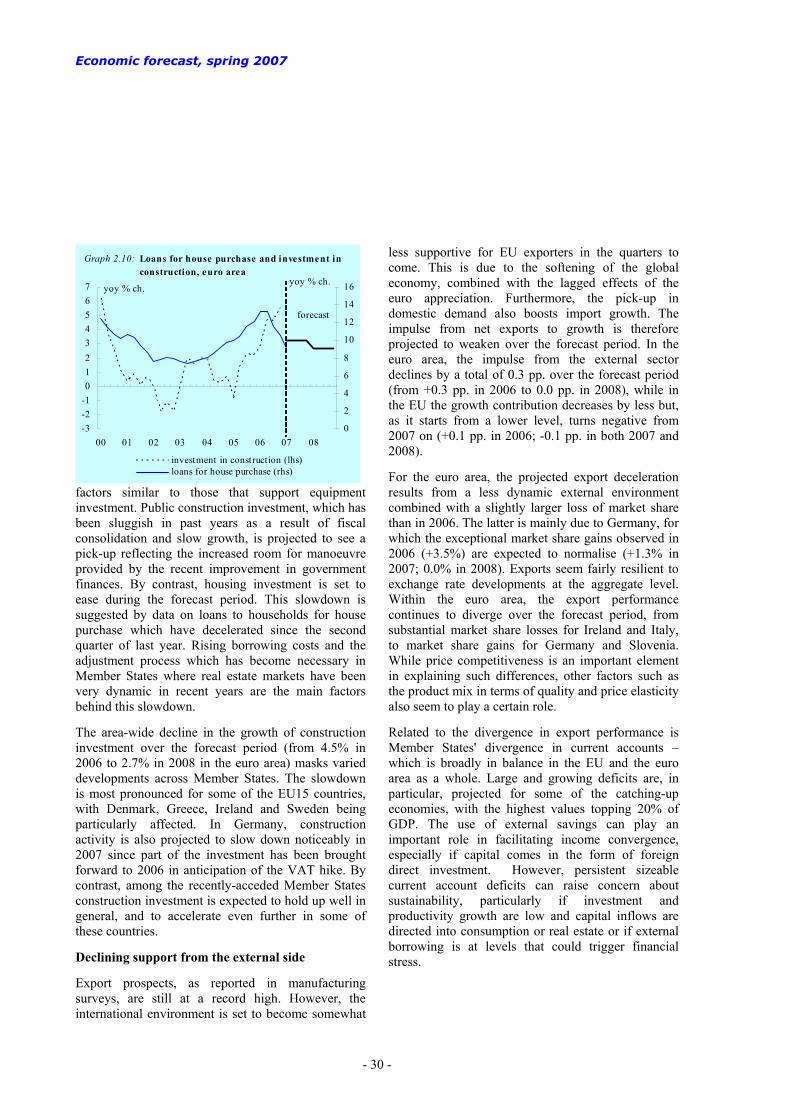
Economic forecast, spring 2007
- 30 -
-3-2-101234567
00 01 02 03 04 05 06 07 080
2
4
6
8
10
12
14
16
investment in construction (lhs)loans for house purchase (rhs)
forecast
yoy % ch.
Graph 2.10: Loans for house purchase and investment in construction, euro area
yoy % ch.
factors similar to those that support equipment investment. Public construction investment, which has been sluggish in past years as a result of fiscal consolidation and slow growth, is projected to see a pick-up reflecting the increased room for manoeuvre provided by the recent improvement in government finances. By contrast, housing investment is set to ease during the forecast period. This slowdown is suggested by data on loans to households for house purchase which have decelerated since the second quarter of last year. Rising borrowing costs and the adjustment process which has become necessary in Member States where real estate markets have been very dynamic in recent years are the main factors behind this slowdown.
The area-wide decline in the growth of construction investment over the forecast period (from 4.5% in 2006 to 2.7% in 2008 in the euro area) masks varied developments across Member States. The slowdown is most pronounced for some of the EU15 countries, with Denmark, Greece, Ireland and Sweden being particularly affected. In Germany, construction activity is also projected to slow down noticeably in 2007 since part of the investment has been brought forward to 2006 in anticipation of the VAT hike. By contrast, among the recently-acceded Member States construction investment is expected to hold up well in general, and to accelerate even further in some of these countries.
Declining support from the external side
Export prospects, as reported in manufacturing surveys, are still at a record high. However, the international environment is set to become somewhat
less supportive for EU exporters in the quarters to come. This is due to the softening of the global economy, combined with the lagged effects of the euro appreciation. Furthermore, the pick-up in domestic demand also boosts import growth. The impulse from net exports to growth is therefore projected to weaken over the forecast period. In the euro area, the impulse from the external sector declines by a total of 0.3 pp. over the forecast period (from +0.3 pp. in 2006 to 0.0 pp. in 2008), while in the EU the growth contribution decreases by less but, as it starts from a lower level, turns negative from 2007 on (+0.1 pp. in 2006; -0.1 pp. in both 2007 and 2008).
For the euro area, the projected export deceleration results from a less dynamic external environment combined with a slightly larger loss of market share than in 2006. The latter is mainly due to Germany, for which the exceptional market share gains observed in 2006 (+3.5%) are expected to normalise (+1.3% in 2007; 0.0% in 2008). Exports seem fairly resilient to exchange rate developments at the aggregate level. Within the euro area, the export performance continues to diverge over the forecast period, from substantial market share losses for Ireland and Italy, to market share gains for Germany and Slovenia. While price competitiveness is an important element in explaining such differences, other factors such as the product mix in terms of quality and price elasticity also seem to play a certain role.
Related to the divergence in export performance is Member States' divergence in current accounts – which is broadly in balance in the EU and the euro area as a whole. Large and growing deficits are, in particular, projected for some of the catching-up economies, with the highest values topping 20% of GDP. The use of external savings can play an important role in facilitating income convergence, especially if capital comes in the form of foreign direct investment. However, persistent sizeable current account deficits can raise concern about sustainability, particularly if investment and productivity growth are low and capital inflows are directed into consumption or real estate or if external borrowing is at levels that could trigger financial stress.

Chapter 2 The economic situation in the euro area and the EU
- 31 -
Box 2.2: Some specificities behind the forecasts
The cut-off date to take new information into account when preparing this macroeconomic outlook was 23 April 2007.
External assumptions
This forecast is based on a set of external assumptions. These assumptions reflect the market expectations at the time of the forecast. To shield the assumptions from possible volatility during one specific trading day, averages from a 10-day reference period have been used for exchange and interest rates as well as for oil prices.
Exchange rates
The technical assumption as regards exchange rates has been standardised using fixed nominal exchange rates for all currencies. They are kept constant based on the averages from 3 to 18 April. This technical assumption leads to implied average USD/EUR rates of 1.33 in 2007 and 1.34 in 2008, and average JPY/EUR rates of 158.9 in 2007 and 160.0 in 2008.
Interest rates
Interest rate assumptions are now market-based instead of judgemental as it was the case in the autumn 2006 forecast. Short-term interest rates for the euro area are derived from future contracts. Long-term interest rates for the euro area, as well as short- and long-term interest rates for other Member States, are calculated using implicit forward swap rates, corrected for the spread between the 3-month interbank interest rate and the 3-month swap rate. In cases where no market instrument is available, a fixed spread vis-à-vis euro- area interest rates is taken for both short- and long-term rates. As a result, short- and long-term interest rates are at 4.1% on average in 2007 and 4.2% in 2008 in the euro area.
Commodity prices
Commodity prices are also forecast taking into account market conditions. In the case of oil prices special attention is paid to futures prices. Prices for Brent oil are, accordingly, projected to be 66.2 USD/bl in 2007 and 70.3 USD/bl in 2008. Prices of primary commodities, excluding fuels, are assumed to increase by 13.7% in 2007 and to decline by 0.6% in 2008. In 2007, the prices of all groups excluding fuels are expected to increase compared to 2006.
Chain linking
In order to improve the accuracy of GDP growth estimates, National Accounts have moved to ‘chain linking’ in most Member States to incorporate more up-to-date price weights. Chain-linking uses previous year’s prices (instead of prices from a given base year) which are then ‘chained’ together.
Budgetary data
Data for 2006 are based on government debt and deficit data transmitted by Member States to the European Commission in April 2007. In publishing these data, Eurostat has amended the deficit and debt data reported by Belgium for 2005 and 2006, and more marginally the deficit for Portugal (2005) and the United Kingdom (2003-2006). Eurostat is currently verifying the revised Greek GDP series. The Commission continues to use the unrevised GDP series, also provided by the Greek authorities, for analytical and administrative purposes until this verification is complete.
For 2007, budgets adopted or presented to parliaments and all other measures known in sufficient detail are taken into consideration. For 2008, the "no-policy change" assumption used in the forecasts implies the extrapolation of revenue and expenditure trends and the inclusion of measures that are known in sufficient detail.
The general government balances reported by Member States to the European Commission may be slightly different from those published in the national accounts. The difference concerns settlements under swaps and forward rate agreements (FRA). According to ESA95 (amended by regulation n°2558/2001), swaps and FRA-related swaps are financial transactions and therefore excluded from the calculation of the government balance. However, for the purposes of the excessive deficit procedure, those flows are still booked as interest.
According to a Eurostat decision of 2 March 2004, funded defined-contribution pension schemes should be classified in the financial sector by April 2007. Three Member States (i.e. Denmark, Poland, and Sweden), which benefited from a transitory period as reported in the autumn 2006 forecast, revised their net lending and general government debt accordingly at the end of this period.
Calendar effects on GDP growth and output gaps
The number of working days may differ from one year to another. For example, 2004 was a leap year with 2.8 additional working days compared to the average number of working days. This translated into an estimated impact of 0.24 pp. on the GDP growth rate for the euro area. For 2005 and 2006, the effects were negative of around -0.1 pp. each year, while it is estimated to be close to neutral in 2007.
Annual GDP figures are not adjusted for the number of working days, while quarterly figures mostly are. The calculation of potential growth and the output gap does not adjust for working days. Since it is considered temporary, it should not affect the cyclically-adjusted balances.

4. Robust labour market performance
- 32 -
European labour markets continued to improve in 2006 in line with the projections in the autumn forecast. With employment growing at a healthy pace and unemployment rates falling rapidly, the labour market has moved into a strong recovery phase, adding significantly to the picture of a generally brighter outlook for the EU economy.
Robust employment growth in 2006
On the back of the pick-up in economic activity in 2006, employment grew by 1.4% in the euro area and 1.5% in the EU, up by 0.6 pp. on the previous year in both areas. This was the strongest increase in employment since 2000. Euro-area employment growth picked up markedly in the first half of 2006, to an annualised 2% QoQ, slowing down somewhat to 1.2% in the second half of the year.
The improvement in 2006 was broad-based across sectors. While a large bulk of all new jobs was created in the private services sector, more positive developments were also registered in industry in some Member States, where employment had previously fallen for a number of years.
In addition, the employment content of growth has increased in some Member States. This is likely to be due notably to the increased share of services in EU economies, to structural reforms in some Member States, but also to increasingly differentiated types of employment (e.g. an increasing share of part-time employment).
Employment expectations still pointing up
On the basis of survey data up to April 2007, expectations still indicate sustained employment growth going forward. Employment prospects as reported in the Commission's business and consumer surveys (BCS) suggest that employment creation will continue into the second half of the year. The employment component of the Purchasing Managers' Index is at its highest in six years.
Employment outlook for 2007-08
Employment is foreseen to grow by 1.4% in 2007 and 1.2% in 2008 in the euro area, which represents an upward revision of 0.2 pp. for 2007 and 0.1 pp. for 2008 compared to the autumn forecast. For the EU, the forecast points to growth rates of 1.4% in 2007, and 1.1% in 2008 (+0.4 pp. and +0.1 pp., respectively,
-1.0-0.50.00.51.01.52.02.53.03.54.04.5
96 97 98 99 00 01 02 03 04 05 06
Industry Construction Services GDP (lhs)
Graph 2.11: Growth of GDP and employment by sector, euro area
yoy % ch.
compared to the autumn forecast). Employment growth is thus projected to decelerate only slightly between 2006 and 2008, due to economic activity that is set to remain above potential. Spain, Germany, Poland, Italy and France will contribute most to the nearly 5.5 million jobs which the EU is expected to create in 2007 and 2008 (3.8 million in the euro area).
Employment and participation rates improve…
Robust employment growth in 2006 assisted in raising the employment rate to 64.4% in the euro area and to 64.3% in the EU, up from 63.5% and 63.4% the year before. Over the forecast period, the employment rate is projected to increase further to settle at 65.9% in the euro area and 65.6% in the EU in 2008. Despite this increase, the employment rate remains low by international standards, pointing to a persistent under-utilisation of the EU's labour potential.
This under-utilisation of the labour force becomes even more striking in the light of participation rates in the euro area. In 2005, for instance, the participation rate was 69.5% compared to a rate of above 75% in the US. Nevertheless, it improved by 0.4 pp. in 2006 and is forecast to increase by a further 0.8 pp. over the forecast period. Moreover, in some countries, in particular in Spain, it has increased substantially while it already stands above 75% in Denmark, the Netherlands, Sweden, Finland and the United Kingdom.

Chapter 2 The economic situation in the euro area and the EU
- 33 -
-25-20-15-10
-505
1015202530
99 00 01 02 03 04 05 06 070
0.1
0.2
0.3
0.4
0.5
0.6
services expectations (lhs)industry expectations (lhs)trend employment growth (rhs)
Graph 2.12: Euro-area employment expectations
qoq % ch.balance
…due to structural reforms and composition effects
The rise in the participation rate in recent years is partly due to structural reforms. In particular, pension reforms in a number of Member States have started to produce effects by increasing the age of exit from the labour force. On top of this, the ageing structure of the workforce together with cohort effects (as baby boomers move into the older worker bracket) may have contributed to the fact that the participation rate of older workers (55-64 years of age) has increased most rapidly in the past few years.
Above-average increases in the labour force have been observed in Spain, Ireland, Austria, and to a degree also in the UK and Italy, which likely reflect recent immigration and the regularisation of undeclared workers in addition to a rising female labour participation.
Finally, more flexible labour markets have seen the share of part-time and fixed-term contracts soar, especially in Spain, Germany, and Italy. Such atypical contracts constitute the bulk (around 60%) of all jobs created in the EU and their share in total employment could rise further.
Drop in unemployment rates…
The harmonised unemployment rate has been on a continuous downward trend since the second half of 2004, when it peaked at 8.8% in the euro area (9% in the EU). For 2006 as a whole, the unemployment rate averaged 7.9% in the euro area and in the EU. In
6
7
8
9
10
11
93 94 95 96 97 98 99 00 01 02 03 04 05 06 07 08-1.5
-1.0
-0.5
0.0
0.5
1.0
Change in number of unemployed persons (rhs)EA unemployment rate (lhs)
Graph 2.13: Unemployed persons and unemployment rate , euro area
% million
forecast
March 2007, the unemployment rate declined to 7.2% in the euro area (7.3% in the EU), compared to 8.2% in both regions a year earlier.
…especially in some of the larger Member States
In the euro area, this performance in 2006 was driven by the larger Member States. Compared with 2005, the unemployment rate in Germany fell markedly by 1.1 pps., while Italy and the Netherlands also saw falls of 0.9 pp. and 0.8 pp., respectively, and the Spanish unemployment rate dropped by 0.6 pp. At the EU level, the improvement in 2006 was also due to an impressive decrease in the unemployment rates in Poland (by almost 4 pps.) and in some of the smaller EU Member States.
However, differences remain. The unemployment rates among euro-area Member States ranged from around 4% in the Netherlands to around 9½% in France for 2006 as a whole.
While the drop in the unemployment rate is largely attributable to the strong cyclical upswing, there is also evidence pointing to a reduction in the structural unemployment rate. Estimates by DG ECFIN using the NAWRU concept (i.e. the unemployment rate below which inflationary pressures coming from the cost side are theoretically kicking in) suggest that the structural unemployment rate fell to about 7½% in 2006, from around 8% in 2004-2005.
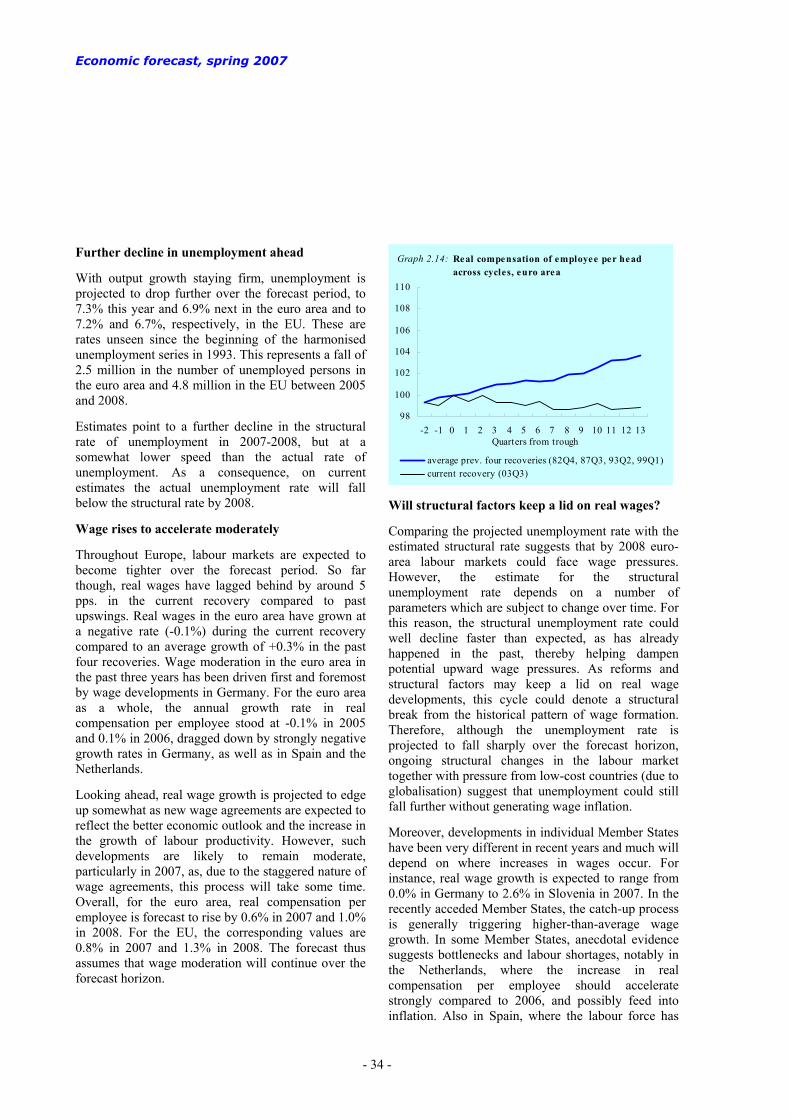
Economic forecast, spring 2007
- 34 -
Further decline in unemployment ahead
With output growth staying firm, unemployment is projected to drop further over the forecast period, to 7.3% this year and 6.9% next in the euro area and to 7.2% and 6.7%, respectively, in the EU. These are rates unseen since the beginning of the harmonised unemployment series in 1993. This represents a fall of 2.5 million in the number of unemployed persons in the euro area and 4.8 million in the EU between 2005 and 2008.
Estimates point to a further decline in the structural rate of unemployment in 2007-2008, but at a somewhat lower speed than the actual rate of unemployment. As a consequence, on current estimates the actual unemployment rate will fall below the structural rate by 2008.
Wage rises to accelerate moderately
Throughout Europe, labour markets are expected to become tighter over the forecast period. So far though, real wages have lagged behind by around 5 pps. in the current recovery compared to past upswings. Real wages in the euro area have grown at a negative rate (-0.1%) during the current recovery compared to an average growth of +0.3% in the past four recoveries. Wage moderation in the euro area in the past three years has been driven first and foremost by wage developments in Germany. For the euro area as a whole, the annual growth rate in real compensation per employee stood at -0.1% in 2005 and 0.1% in 2006, dragged down by strongly negative growth rates in Germany, as well as in Spain and the Netherlands.
Looking ahead, real wage growth is projected to edge up somewhat as new wage agreements are expected to reflect the better economic outlook and the increase in the growth of labour productivity. However, such developments are likely to remain moderate, particularly in 2007, as, due to the staggered nature of wage agreements, this process will take some time. Overall, for the euro area, real compensation per employee is forecast to rise by 0.6% in 2007 and 1.0% in 2008. For the EU, the corresponding values are 0.8% in 2007 and 1.3% in 2008. The forecast thus assumes that wage moderation will continue over the forecast horizon.
98
100
102
104
106
108
110
-2 -1 0 1 2 3 4 5 6 7 8 9 10 11 12 13
average prev. four recoveries (82Q4, 87Q3, 93Q2, 99Q1)current recovery (03Q3)
Quarters from trough
Graph 2.14: Real compensation of employee per head across cycles, euro area
Will structural factors keep a lid on real wages?
Comparing the projected unemployment rate with the estimated structural rate suggests that by 2008 euro-area labour markets could face wage pressures. However, the estimate for the structural unemployment rate depends on a number of parameters which are subject to change over time. For this reason, the structural unemployment rate could well decline faster than expected, as has already happened in the past, thereby helping dampen potential upward wage pressures. As reforms and structural factors may keep a lid on real wage developments, this cycle could denote a structural break from the historical pattern of wage formation. Therefore, although the unemployment rate is projected to fall sharply over the forecast horizon, ongoing structural changes in the labour market together with pressure from low-cost countries (due to globalisation) suggest that unemployment could still fall further without generating wage inflation.
Moreover, developments in individual Member States have been very different in recent years and much will depend on where increases in wages occur. For instance, real wage growth is expected to range from 0.0% in Germany to 2.6% in Slovenia in 2007. In the recently acceded Member States, the catch-up process is generally triggering higher-than-average wage growth. In some Member States, anecdotal evidence suggests bottlenecks and labour shortages, notably in the Netherlands, where the increase in real compensation per employee should accelerate strongly compared to 2006, and possibly feed into inflation. Also in Spain, where the labour force has

Chapter 2 The economic situation in the euro area and the EU
- 35 -
been growing sharply, due in part to immigration trends coupled with large increases in female participation, tensions related to labour supply could appear.
Labour productivity still firming
Real wage increases have to be assessed also against the acceleration of productivity growth in 2006, which had a dampening effect on unit labour costs. Compared to the previous four economic recoveries and notwithstanding recent positive developments, a productivity gap of around 1½% nevertheless remains. Consequently, further increases in the near term seem likely.
Labour productivity growth (measured in output per person) will stay firm going into 2008 in the euro area (1.3% in 2006, 1.2% thereafter) and increase in the EU (from 1.4% in 2006 to 1.5% in 2008). Such growth is distinctly faster than the longer-term average (below 1%). Whether the acceleration in actual labour productivity reflects at the same time an improvement in the underlying trend is debatable. Only developments over the course of the next few years will allow for a proper assessment of whether this recent improvement is sustainable. A simple trend extraction using standard methods (see chart) shows some evidence of an interruption of the downward trend of labour productivity growth at the turn of 2003 and, subsequently, of a mild pick-up.
Among the larger Member States, particularly high productivity gains are expected in Germany (with an upward revision of +1 pp. in 2007 and +0.5 pp. in 2008 compared to the autumn forecast). In the cases
-1.0-0.50.00.51.01.52.02.53.03.54.0
80 82 84 86 88 90 92 94 96 98 00 02 04 06 08
actual lab. prod.(per person)trend*
*HP filter applied on quarterly data.
Graph 2.15: Labour productivity growth, euro area
yoy % ch.
of Germany and Italy, these strong increases in productivity clearly dampen growth in unit labour costs.
Despite harmonised wage indicators pointing to a pick-up compared to past wage restraint, due to the strengthening of labour productivity competitiveness indicators continue to signal a relatively healthy competitive position at the aggregate level. Real unit labour costs in the euro area and the EU are still declining and, despite some headwinds, export performance is set to be vigorous.
Overall, it seems that the cyclical upswing has positively affected European labour markets. Both the cyclical and the structural part of unemployment have declined across countries. Differences in the structural rate of unemployment remain, however.
Table 2.4
Labour market outlook - euro area and EU27 (Annual percentage change) Difference vs Difference vs
Euro area Autumn 2006 EU27 Autumn 20062005 2006 2007 2008 2007 2008 2005 2006 2007 2008 2007 2008
Population in working age (15-64) 0.4 0.2 0.2 0.2 -0.1 0.0 0.4 0.2 0.3 0.2 0.0 0.0 Labour force 0.9 0.8 0.9 0.8 0.0 0.1 0.8 0.8 0.7 0.6 0.1 0.0 Employment 0.8 1.4 1.4 1.2 0.2 0.1 0.9 1.5 1.4 1.1 0.4 0.2 Employment (change in million) 1.1 1.9 2.0 1.8 1.8 1.6 2.0 3.3 3.0 2.5 0.8 0.6 Unemployment (levels in millions) 12.7 11.7 11.0 10.4 -0.6 -0.8 20.1 18.5 17.0 15.9 -0.9 -1.4 Unemployment rate (% of labour force) 8.6 7.9 7.3 6.9 -0.4 -0.5 8.7 7.9 7.2 6.7 -0.4 -0.6 Labour productivity, whole economy 0.6 1.3 1.2 1.2 0.3 0.0 0.8 1.4 1.5 1.5 0.1 -0.1 Employment rate (a) 63.5 64.4 65.2 65.9 0.4 0.5 63.4 64.3 65.0 65.6 0.4 0.6
(a) As a percentage of population of working age. Definition according to structural indicators.

5. Inflation developments and outlook
- 36 -
Euro-area headline inflation remained below 2% since last autumn …
Headline HICP inflation in the EU has remained well contained since the autumn. Following a period of nearly 12 months when it fluctuated around 2½%, annual inflation dropped markedly in the autumn, reaching a low of 1.8% in the EU and 1.6% in the euro area in October. The drop reflected a combination of favourable base effects and declines in oil and energy prices. Inflation has since drifted up somewhat, fluctuating closely around 2% in the EU, while it remained below that threshold in the euro area, despite the VAT increase in Germany on 1 January 2007. This marked the first time since 1999 that the euro area has registered a period of seven consecutive months with inflation below 2%.
Developments in oil and energy prices had a strong impact on the short-run inflation dynamics. After running at two-digit levels during the first half of last year, energy price inflation in the euro area decelerated markedly to 1½% in September 2006, and energy prices even declined in October (-0.5%), reflecting the strong easing of oil prices in those months. Following a mild rebound at the end of the year, energy price inflation decelerated again to around 1-2% in the first months of 2007. The sharp decline over the last few months turned the contribution of this component to headline inflation from about 1 pp. in the first half to 2006 to 0.1 pp. in the first months of 2007. This decline was an important element behind the relatively muted overall inflation outturns at the beginning of 2007.
Inflation in the other main non-core component, i.e. unprocessed food, also eased recently. Due to adverse weather conditions last summer this component exerted upward price pressure in the final months of 2006. As this pressure abated, inflation in unprocessed food in the euro area declined from 4½% last September to just below 3% in March 2007.
…while core inflation picked up somewhat
In contrast, euro-area core inflation (HICP excluding energy and unprocessed food) recently edged up to almost 2%, after hovering around 1½% for nearly two years. As a consequence, the wide gap observed over the last two years between headline and core inflation has closed.
1.0
1.5
2.0
2.5
3.0
3.5
01 02 03 04 05 06 07
Total HICP
Core inflation
Graph 2.16: Headline and core inflation, euro area
yoy % ch.
The rise of core inflation can be traced mainly to developments in the services component, which increased by 0.3 pp. in January 2007, interrupting a period of about a year with inflation steady at around 2%. Most of the increase can be attributed to developments in Germany, where services inflation was affected by the increase in the standard rate of VAT in Germany from 16% to 19% in January 2007.
Developments in the two other main core inflation components were somewhat different. There was an up-tick in the annual rate of price increases in processed food last October, mainly due to an increase in tobacco prices in Germany, in anticipation of the VAT hike. Since then, inflation in this component has been steady at around 2%, not much different from the inflation rates observed earlier last year.
On the other hand, inflation in non-energy industrial goods continued on the gentle upward trend started in mid-2005, reflecting the gradual pass-through of past increases in oil and non-oil commodity prices. Inflation increased by 0.4 pp. from last autumn in this component, to stand at 1.2% in March 2007. More aggressive seasonal discounting in January than in previous years in several Member States, particularly in clothing and footwear, appears to have offset to some extent the impact of the German VAT hike on this component of core inflation. Overall, official estimates indicate that the German VAT increase added about 1 pp. to national inflation, including anticipation effects. This means a 0.3 pp. effect at the euro-area level. However, there is still some

Chapter 2 The economic situation in the euro area and the EU
- 37 -
-10
-5
0
5
10
15
20
25
01 02 03 04 05 06 07EnergyIntermediate goodsTotal industry (excl.constr.)Consumer goodsCapital goods
yoy % ch.
Graph 2.17: Industrial producer prices, euro area
uncertainty regarding the final price impact, and lagged effects might still materialise later this year.
Looking at developments at the production stage, there are still some signs of pipeline inflationary pressures despite the continued easing of the headline index. Overall industrial producer price inflation (PPI, excluding construction) in the euro area fell from a peak at 6% (y-o-y) last July to just below 3% in February 2007. This was mainly the result of the sharp decline in the energy component, which plunged to 1% in February 2007, from close to 15% last July. At the same time, inflation in industrial consumer goods, the most immediately relevant component for consumer prices, decelerated by about ½ pp. from its 2.0% peak in August 2006. However, the picture is less favourable in the other non-energy- related components. In particular, the annual rate of price increases in intermediate goods, the largest component of the index, declined only marginally since the autumn, and is still at an elevated level (6% in February 2007).
On the side of labour costs, as mentioned in the previous section, the overall picture remains one of continued moderation. The annual growth rate in compensation per employee in the euro area eased to 1.8% in the fourth quarter of 2006, from 2.4% in the previous quarter. This strong decline was to a large extent driven by some country-specific temporary developments. For the year as a whole, compensation per employee is estimated to have grown by 2.2%, after 1.9% in 2005. This suggests the absence of significant second-round effects, so far, from the past oil price rise. Other labour cost indicators also point to
only a modest acceleration in the course of last year. The ECB's indicator of negotiated wages moved up from 2.0% in the fourth quarter of 2005 to 2.4% in the fourth quarter of 2006. However, this indicator showed noticeable volatility throughout the year due to the effects of temporary factors, making it difficult to interpret quarterly developments. On average, negotiated wages in the euro area grew by 2.2% in 2006, compared with 2.1% in 2005. The annual growth rate in Eurostat's hourly labour cost index shows a slight acceleration in the first half of 2006 followed by a slowdown in the second half, ending the year at 2.5%, unchanged from the same quarter in the previous year. The continued moderation in wage growth is remarkable as it takes place against a brisker pace of economic growth.
The rebound in labour productivity in 2006 meant that the slight acceleration of wage growth had no inflationary impact. It is estimated that productivity in the euro area rose by 1.3% in 2006, more than double the average gains of the last four years. Accordingly, growth in unit labour costs is estimated to have eased from 1.3% in 2005 to 0.9% in 2006.
On the side of inflation expectations, short-term inflation expectations in the euro area, based on the Commission's consumer surveys, almost reached a five-year high in November 2006, but have since declined continuously, posting values somewhat below their historical average since February 2007. After increasing somewhat at the end of last year, long-term inflation expectations in the euro area derived from French government inflation-indexed bonds declined slightly to 2.14% in March, from 2.15% in December.
A benign inflation outlook at the aggregate level
Looking ahead, average annual HICP inflation in the euro area is projected to decline from 2.2% last year to 1.9% this year, and to remain unchanged at that level in 2008. In the EU, inflation is expected to decline from 2.3% in 2006 to 2.2% this year and to 2.1% in 2008. Compared to the autumn, the new projections entail a slight downward revision for 2007 (0.2 pp. for the euro area and 0.1 pp. for the EU), reflecting lower energy price inflation in the first months of this year. For 2008, the inflation projection is unchanged for the euro area and revised up by 0.1 pp. for the EU.

Economic forecast, spring 2007
- 38 -
In terms of quarterly profiles, inflation is now expected to increase much more moderately in the euro area in the first quarter of 2007, compared to the autumn (a 0.1 pp. increase, compared to an increase of 0.4 pp. in the autumn). Further on, inflation is projected to decline marginally, before picking-up somewhat at the end of the year. This pattern reflects in part base effects stemming from the energy price developments of last year. A similar, but less pronounced patter is expected in the EU, where inflation should remain at, or just above, 2.0%.
The new inflation projection is supported externally by reduced inflationary impulses from commodity and import prices and domestically by continued moderation in unit labour cost gains, despite the strong cyclical momentum. The annual rate of increase in total primary commodity prices (including fuels) is assumed to fall sharply from over 20% last year to about 3.0% at the end of the forecast period. Excluding fuels, prices of primary commodities are actually set to decline by roughly ½ pp. in 2008. Meanwhile, the annual rate of increase of import prices is projected to ease from 4½% in 2006 to somewhat below 1½ % in 2008.
On the domestic side, growth in nominal unit labour costs in the euro area is expected to accelerate from 0.8% in 2006 to 1.6% in 2008. This profile is explained chiefly by the projected acceleration by about ½ pp. in compensation per employee over the forecast horizon (to 2.8% in 2008), while productivity gains remain unchanged (at 1.2%). The acceleration of wage growth appears to be in line with the maturing cyclical position of the euro area and the tightening labour market. The euro-area unemployment rate is foreseen to decline to below the NAWRU in 2008, when unemployment should reach 6.9%, the lowest rate since the early 1990s. At the
same time, the (negative) output gap is projected to nearly close by the end of the forecast horizon.
Inflation prospects differ across Member States
At the level of Member States, the largest downward revisions for 2007 among euro-area countries have been registered in Germany, Spain, France and the Netherlands. Inflation in Germany, is now projected to edge up marginally this year (to 1.9%), before easing to 1.7% in 2008. However, the new projection for 2008 represents a 0.5 pp. upward revision compared to the autumn. Excluding the VAT hike, underlying inflation in Germany is thus set to pick up over the forecast horizon. Inflation in France is now set to fall to 1½% this year, before edging up to 1.7% in 2008. Inflation in the Netherlands should also ease this year to 1½%, before rising to about 2% in 2008. In Spain, inflation is expected to decelerate more sharply in 2007 (by 1.2 pps., to 2.4%), reflecting inter alia stable growth of compensations, before increasing somewhat in 2008.
Outside the euro area, inflation for 2007 has been revised up sizeably in four countries, which also happen to display some of the highest inflation rates in the EU: Bulgaria, Estonia, Latvia and Hungary. Of these countries, inflation is projected to decline in 2008 only in Latvia and Hungary. Romania, one of the two countries that joined the EU this year, is expected to record a decline in inflation from 6½% in 2006 to 4½% in 2008. In the other non-euro area Member States, inflation was generally revised down in 2007, compared to the autumn. Among the larger non-euro area Member States, inflation in the UK is expected to ease in 2008 to 2%, while it should increase to 2½% in Poland.
Table 2.5
Inflation outlook - euro area and EU27 (Annual percentage change) Difference vs Difference vs
Euro area Autumn 2006 EU27 Autumn 20062005 2006 2007 2008 2007 2008 2005 2006 2007 2008 2007 2008
Private consumption deflator 2.0 2.0 1.8 1.8 -0.3 0.0 2.2 2.3 2.2 2.0 0.0 0.1 GDP deflator 1.9 1.7 2.1 1.9 0.1 0.1 2.0 2.1 2.6 2.1 0.4 0.1 HICP 2.2 2.2 1.9 1.9 -0.2 0.0 2.3 2.3 2.2 2.1 -0.1 0.1 Compensation per employee 1.9 2.2 2.4 2.8 0.2 0.3 2.5 2.4 3.1 3.3 0.1 0.1 Unit labour costs 1.3 0.8 1.2 1.6 0.0 0.3 1.7 1.0 1.5 1.8 -0.1 0.2 Import prices of goods 4.0 4.7 0.7 1.3 -0.9 -0.3 3.6 4.4 1.0 1.3 -0.8 -0.3

6. Public finances
- 39 -
A further improvement in the budgetary situation
In 2006, public finances in the EU benefited from a significant economic upturn, as well as the sharp recovery in tax elasticities, particularly reflecting corporate tax buoyancy, that started in 2005. Starting with the headline figures, the budget deficit for the euro area in 2006 was at 1.6% of GDP, down from 2.5% in 2005. Based on the usual no-policy-change assumption, the deficit is forecast to remain on a declining path in the following two years reaching 1.0% in 2007 and 0.8% of GDP in 2008. A broadly similar picture is expected for the EU27 as a whole, with a deficit set to decline from 1.7% of GDP in 2006 to 1.2% in 2007 and 1.0% in 2008.
Compared to the autumn forecast, the current estimates point to a better-than-expected outturn in 2006, which by and large carries over in the forecast years 2007 and 2008.
The more favourable public finance outcome for 2006 mainly reflects better-than-expected revenues compared to the estimates made in the autumn: in the euro area, revenue growth was revised significantly upward (from 4.8% to 6.1%) against a marginal upward revision of expenditure growth. Broadly similar revisions took place for the EU27 as a whole.
The revenue-to-GDP ratio in the euro area should decline gradually from 45.7% in 2006 to 45.4% in 2008 (and similarly for the EU27, from 45.2% to 44.8%). With significantly more favourable GDP growth prospects than earlier assumed (especially in 2007), this reflects tax elasticities returning to a more normal level as well as tax reductions in a number of countries. The expenditure ratio is expected to decline from 47.3% of GDP in 2006 to 46.2% in 2008 in the euro area, and from 46.9% to 45.8% for the EU27 as a whole, largely due to unchanged trends in expenditure growth against higher-than-earlier-assumed GDP growth.
In structural terms (i.e. corrected for cyclical factors and net of one-off and other temporary measures), the budgetary adjustment in the euro area between 2006 and 2008 is more muted than the nominal improvement (from a structural deficit of slightly above 1% of GDP in 2006 to ¾% in 2008), in view of the narrowing, though still negative, output gap. A similar pattern can also be observed for the EU27 as a whole, with a cyclically-adjusted deficit moving from
0.0
0.2
0.4
0.6
0.8
1.0
1.2
1.4
1.6
01 02 03 04 05 06 07 08
Observed tax elasticity Baseline
Graph 2.18 : Euro-area tax elasticity with respect to GDP
1¼ % of GDP in 2006 to about 1% in 2008.
Euro area: deficits fall below the 3%-of-GDP threshold but the structural improvement is muted
At country level, the projected improvement of public finances in the euro area seems to reflect a relatively broad-based trend throughout the forecast period.
For countries currently in the excessive deficit procedure (EDP), the 2006 outcomes confirm that the deficit has been brought below the 3% of GDP threshold in both Greece and Germany, and in the case of the latter by a much larger margin than previously expected. A better-than-expected reduction of the deficit was also achieved for Portugal and Italy (net of a large deficit increasing one-off). This is expected to be broadly carried over in the forecasts for 2007 and 2008. By 2007, only Portugal is expected to present a deficit above 3% of GDP and, in the absence of further measures, this would still be the case in 2008.
Among the other euro-area countries, Ireland and Spain are projected to significantly reduce their surplus. The small surplus posted by the Netherlands in 2006 is forecast to turn into a 0.7% of GDP deficit in 2007, before a move to a balanced budget in 2007. A gradual reduction of the deficit - to close to 2% of GDP at the end of the forecast period - is expected for France.

Economic forecast, spring 2007
- 40 -
In structural terms, the limited improvement foreseen for the euro area results from substantially different developments at country level. Broadly in line with the improvement in the nominal balances, structural balances are expected to strengthen over the forecast period in Belgium, Germany, Greece, France and Italy. In Ireland and Spain, the structural deterioration reflects continued projected strong growth of expenditure. Strong expenditure growth is also the main cause of the structural deterioration in the Netherlands in 2007, where expenditure overruns are expected against the background of rapidly improving cyclical conditions.
Against the background of overall limited improvement in the structural balances in the euro area, including examples of pro-cyclical loosening, Finance Ministers meeting in the Eurogroup of 20 April 2007 committed "to pursue more ambitious budgetary targets than those set in the 2006 Stability programmes ... using unexpected extra revenues to reduce government deficit and debt... " and to "design fiscal policy plans for 2008 so as to accelerate adjustment towards the medium term objective (MTO) for Member States which have not reached it, and for those which have reached it, to avoid feeding macroeconomic imbalances overall".
Uneven budgetary performances outside the euro area
Outside the euro area, concerning countries currently in EDP, the outcome for 2006 confirms that the deficit is brought below 3% for Malta and the United Kingdom. Better-than-expected deficit outcomes were observed in Hungary and Poland, which also carry over into 2007 and 2008. As a result, the projected deficit improves particularly for Hungary (by 4.3 percentage points between 2006 and 2008), while in the case of Poland the deficit approaches the 3% threshold towards the end of the forecast horizon. Following a deterioration in 2006, in Slovakia the deficit is projected to fall below 3% of GDP from 2007 onwards. By contrast, after a temporary improvement in 2006, the deficit in the Czech Republic increases again to close to 4% of GDP in 2007, before diminishing slightly in 2008.
As regards the other countries, Bulgaria, Estonia, Denmark and Sweden continue to present sizeable surpluses throughout the forecast period (although significantly declining in the case of Bulgaria), while
Cyprus, Latvia and Lithuania are also expected to remain well below the 3%-of-GDP deficit threshold. On the other hand, based on current information and under the usual no-policy-change assumption, the deficit in Romania is forecast to rise from 1.9% of GDP in 2006 to above 3% of GDP from 2007 onwards.
In structural terms, the deficit is likely to deteriorate significantly between 2006 and 2008 in Romania and the Czech Republic (reflecting in the latter country the absence of overall improvement together with improving cyclical conditions). A structural deterioration, but starting from a strong surplus position, is also expected in Bulgaria. A large improvement in the structural balance is expected for Hungary. Smaller improvements occur in Estonia, Malta, Poland and the United Kingdom.
Table 2.6
General government structural budget balance (% of GDP) 2004 2005 2006 2007 2008Belgium -0.9 0.2 -0.4 -0.1 0.1Germany -3.0 -2.4 -1.5 -0.8 -0.7Greece -8.6 -6.1 -3.9 -3.6 -3.4Spain 0.1 1.6 2.3 1.8 1.7France -3.7 -3.2 -2.3 -2.1 -1.5Ireland 2.0 0.8 3.0 1.8 1.6Italy -4.5 -3.9 -2.6 -1.6 -1.8Luxembourg -0.1 1.0 0.5 0.6 0.8The Netherlands -1.2 0.7 1.1 -0.4 0.1Austria -0.6 -1.1 -1.0 -1.1 -1.2Portugal -4.8 -5.0 -2.9 -2.7 -2.6Slovenia -1.8 -1.1 -1.5 -1.7 -1.7Finland 3.0 3.6 3.7 3.5 3.6
Euro area -2.8 -2.0 -1.1 -0.8 -0.7Bulgaria 1.6 1.3 2.8 1.6 1.8Czech Republic -1.2 -2.0 -2.8 -4.1 -3.8Denmark 2.7 4.8 3.7 3.3 3.8Estonia 2.8 2.4 3.3 3.5 3.8Cyprus -4.8 -2.8 -1.2 -1.1 -1.1Latvia -0.7 -0.2 0.0 0.0 0.4Lithuania -2.0 -0.9 -0.6 -0.6 -1.0Hungary -6.7 -8.4 -9.4 -6.1 -4.6Malta -4.3 -3.8 -2.7 -2.6 -1.6Poland -5.8 -4.2 -4.0 -3.6 -3.3Romania -1.7 -1.2 -2.2 -3.5 -3.3Slovakia -1.7 -1.2 -3.3 -3.4 -3.3Sweden 0.7 2.1 2.1 1.9 1.9United Kingdom -3.4 -3.2 -2.6 -2.5 -2.1
EU27 -2.7 -2.0 -1.3 -1.1 -0.9

Chapter 2 The economic situation in the euro area and the EU
- 41 -
Debt continues its downward trend
In the euro area the debt ratio continues its decline that started in 2006. Between 2006 and 2008, it is projected to fall by 4 pps. to 65% of GDP. A broadly similar development is forecast for EU27, where the debt ratio is now expected to fall below the 60% of GDP reference value already in 2007.
The downward trend is shared in varying degrees in all euro area countries, except for Portugal where the debt is expected to increase slightly. Compared to the autumn forecast, the debt projections for most individual countries were revised downward in each of the forecast years.
Outside the euro area, the main exception to the general downward trend in government debt is Hungary, where on the back of high deficit projections the debt is projected to increase from 66.0% of GDP in 2006 to 68.1% in 2008. Nevertheless, compared to the autumn forecast this is still a sizeable downward revision. Smaller increases are expected for the Czech Republic, Lithuania, Poland, Romania and the United Kingdom.
Table 2.7
General government budgetary position - euro area and EU27 (% of GDP) Difference vs Difference vs
Euro area Autumn 2006 EU27 Autumn 20062005 2006 2007 2008 2007 2008 2005 2006 2007 2008 2007 2008
Total receipts (1) 45.1 45.7 45.5 45.4 0.3 0.3 44.5 45.2 44.9 44.8 -0.2 -0.2 Total expenditure (2) 47.6 47.3 46.5 46.2 -0.2 -0.3 46.9 46.9 46.1 45.9 -0.6 -0.4 Actual balance (3) = (1)-(2) -2.5 -1.6 -1.0 -0.8 0.5 0.5 -2.4 -1.7 -1.2 -1.0 0.4 0.4 Interest expenditure (4) 2.9 2.9 2.9 2.8 0.0 0.0 2.7 2.6 2.6 2.6 0.0 0.0 Primary balance (5) = (3)+(4) 0.5 1.3 1.9 2.0 0.5 0.5 0.3 1.0 1.4 1.6 0.3 0.4 Cyclically adjusted budget balance -1.8 -1.2 -0.8 -0.7 0.4 0.3 -1.8 -1.4 -1.1 -0.9 : : Cyclically adjusted primary balance 1.1 1.7 2.1 2.2 0.4 0.4 0.9 1.3 1.6 1.7 : : Structural budget balance -2.0 -1.1 -0.8 -0.7 0.4 0.3 -2.0 -1.3 -1.1 -0.9 : : Change in structural budget balance 0.8 0.9 0.3 0.1 -0.2 0.0 0.7 0.7 0.2 0.2 0.2 0.2 Gross debt 70.5 69.0 66.9 65.0 -1.1 -1.9 62.9 61.7 59.9 58.3 -1.0 -1.6
The structural budget balance is the cyclically-adjusted budget balance net of one-off and other temporary measures estimatedby the Commission services.

7. Risks to the forecast
- 42 -
Summing up, the economic outlook in the EU and the euro area is for a continuation of robust growth above potential with a slight deceleration of economic activity later in the forecast period, in line with the moderate slowing of the global economy and the progressive withdrawal of monetary stimulus. Inflationary pressures are expected to remain moderate in 2007, but as the cycle matures and labour markets tighten wage pressures may emerge towards the end of the forecast period.
Risks to the growth forecast stem from both domestic and external factors. In 2007, an upside risk is related to domestic demand which could turn out more buoyant than projected. In particular, the favourable labour market developments may give a further boost to consumer confidence, thereby unleashing some of the pent-up demand that accumulated during this cycle of unusually restrained consumer spending. While, in the near term, this could probably only be realised through a fall in the households saving rate – the forecast being based on a broadly stable saving rate – this would simply mean that the saving rate would continue its decline of past years, following its sharp rise after the bursting of the dot-com bubble. A decline in households' saving relative to disposable income would be particularly plausible in countries with major fiscal retrenchment programmes since inter-temporal optimisation by consumers would suggest that the effects on real consumption are spread over a longer time period. More generally, recent progress in fiscal consolidation and substantial reforms of social security systems in many Member States over the past years may have raised confidence in the longer-term sustainability of public finances which could induce consumers to adjust their precautionary savings downwards.
Beyond the near term, the turnaround in the labour market could boost labour income by more than what is factored into the forecast, particularly if labour productivity continues to surprise on the upside. Higher household incomes would trigger higher household spending which in turn would foster employment growth, eventually turning this upswing into a durable, domestically-led recovery. In the current framework of a stable macro-economic policy environment supported by a more credible monetary policy there is a non-negligible probability of such a “Goldilocks”-scenario materialising.
Risks also pertain to investment spending in 2007, in particular for construction. The substantial carry-over from 2006 and the warm weather in the first quarter skew the risks for the growth of construction investment in 2007 slightly to the upside. However, going forward downside risks for construction activity are getting larger, due in particular to housing investment. House price inflation has started to slow down in those Member States where price rises in past years have been most pronounced. With borrowing cost on the rise, some households with variable-interest-rate mortgages may face increasing difficulties in repaying their housing loans. In addition to the effects this would have on consumer spending, in cases of defaults banks may repossess houses and put them back on the market, thereby adding to supply and thus to the downward pressure on prices. While for most countries concerned a soft landing is the most likely scenario, a more sizeable downscaling of construction activity is inevitable in those countries where the share of the construction sector in the economy has swollen significantly beyond the longer-term average.
Risks are also related to developments in financial markets. The recent episode of equity-market turbulence in February-March has once more demonstrated the heightened sensitivity of investors to adverse developments in the global economy. As the equity market has again stabilised, the turbulence may have been simply a technical correction, following a period of steady gains since mid-2006. It could, however, also be the prelude to a normalisation (i.e. a sustained increase) in global risk aversion going forward, contributing to a more normal pricing of risk. Against the background of highly leveraged balance sheets of households and companies, such a deterioration in macro-financial conditions could feed back into real-sector activity in the EU economy via reductions in the level of investment and household spending.
A further downside risk to the baseline scenario already identified before is a more pronounced slowdown in the US economy. Recent US economic data have sent rather mixed signals. While activity in the services sector remains strong, there are signs of weakening in the manufacturing sector. Consumer confidence appears to have been negatively affected by higher short-term interest rates and a cooling in the housing market. Most importantly, rapidly rising

Chapter 2 The economic situation in the euro area and the EU
- 43 -
default rates in the sub-prime mortgage market have resulted in a serious credit crunch in this market segment and have disturbed the market for collateralised debt obligations. The problems in the sub-prime mortgage market have not extended to the high-quality segments of the mortgage market so far. If this were to happen, the implications for US mortgage lending and the housing market more generally could be serious, with inevitable knock-on effects on the profitability of the US banking sector and the performance of the broader economy.
The possible implications of a stronger-than-expected downturn in the US economy for global economic growth and, more specifically, for the EU economy were discussed in more detail in the autumn 2006 forecast. An additional aspect of this discussion is that a sharp US economic slowdown could also bring global imbalances back into focus. Concern about a disorderly unwinding of global financial imbalances has eased in recent months, as the distribution of growth across the global economy has become more balanced. However, the more optimistic view of a gradual rebalancing in the international financial system has been predicated on expectations of a moderate US economic slowdown, accompanied by a sustained recovery in Europe and continued strong growth in Asia. If the US economy were to slow sharply, however, the pattern of growth in the global economy of recent months would be severely disrupted. This could act as a catalyst for a normalisation of risk aversion in the financial markets and, possibly also an abrupt unwinding of financial imbalances globally. The negative implications of such a scenario for exchange rates, trade and eventually financial stability could be far-reaching.
Oil prices have been on the rise recently due in part to renewed geo-political tensions. In the absence of a solution to these conflicts and given continued strong demand growth, upside risks to the oil price assumption are likely to outweigh downside risks. While the economy has so far weathered the strong rise in oil prices since 2003 surprisingly well, it cannot be excluded that, at some stage, a further rise in the oil price level would also have a significant negative impact on the real economy.
Oil prices also seem to be the most important risk to the inflation outlook in the short term. Beyond the near term, resource constraints in the EU economy,
0.0
0.5
1.0
1.5
2.0
2.5
3.0
3.5
4.0
99 00 01 02 03 04 05 06 07 08
%
90% confidence 70% confidence40% confidence central forecastactual
Graph 2.19: Uncertainty linked to the euro-area GDP growth forecast
particularly on the labour market, may put upward pressure on prices although this may be balanced to some extent by competitive pressures from globalisation and/or by stronger productivity gains.
Taking everything together, risks to the growth outlook for the EU and the euro area appear broadly balanced in 2007 but, with risks form the external side becoming more prominent, tilted to the downside in 2008. This is depicted in Graph 2.19 which provides a quantification of the above-presented risk assessment in terms of possible deviations from the central scenario. The chart shows the impact various combinations of risks could have on euro-area GDP growth, the outcomes being weighted by the probability of their occurrence. At a 90% confidence interval, GDP growth in the euro area could be, in the extreme case, up to 0.4 pp. higher or lower in 2007, in line with the assessment of balanced risks. In 2008, risks to the forecast become more pronounced and at the same time skewed to the downside. Taking again the 90% confidence interval, euro-area GDP growth could be up to 0.6 pp. higher in the event of a confluence of positive factors, but also as much as 0.8 pp. lower if only negative factors materialise.


Chapter 3 Member States

1. Belgium Robust growth supported by increasing employment
- 46 -
0.4%
0.5%
0.6%
0.7%
0.8%
0.9%
1.0%
1.1%
90 92 94 96 98 00 02 04 06 08
Graph 3.1 : Belgium - Gross capital formation by Local Authorities as % of GDP (Election years marked in grey) Forecasts
Activity in 2006
Economic activity in 2006 turned out to be stronger than anticipated, resulting in annual GDP growth of around 3%.
Domestic demand was the main driver of economic growth in the first half of the year. Private consumption benefited from increasing real household disposable income, mainly because of the implementation of the final stage of the 2001 personal income tax reform but also due to higher employment growth. After correcting for real estate sales by the federal government (recorded as negative investments, but with no impact on economic activity), gross fixed capital formation was boosted by high public investment in the run-up to local elections in October (see graph), and by a continued high level of corporate investment (after a year of exceptionally high investment growth in 2005). Export growth is picking up after a period of significant losses in market share, although for 2006 as a whole it remains below the growth in imports. Therefore the contribution of net exports to GDP growth was still (slightly) negative.
Prospects for 2007 and 2008
Economic growth is expected to stabilise at above 0.5% on a quarterly basis, resulting in an annual growth rate of 2.3% in 2007 and 2.2% in 2008.
Now that the personal income tax reform has been fully implemented, household real disposable income growth is expected to return to more moderate growth levels. Nevertheless, increased employment in
the wake of the sound economic growth in 2006 and relatively strong wage developments continue to support fairly robust private consumption expenditure. The household savings rate is expected to settle at above 13%.
Investment expenditure is forecast to slow down in 2007, in particular due to a stabilisation of investment in inventories (after a year of exceptional growth in 2006) and by lower public investment. Excluding the one-off effect related to the government's real estate sales, the latter is expected to return to its trend level as a percentage of GDP after the 2006 local elections, a pattern observed also in the past. The anticipated slowdown in household disposable income combined with rising interest rates is exerting downward pressure on housing investment, which is expected to slow down after buoyant growth in 2006.
After a couple of years of significant losses of market share, the strengthening of export growth in the second half of 2006 seems to point to some degree of recovery. For 2007 and 2008 Belgian exports are forecast to grow more in line with the import markets of the main trading partners. Although imports are expected to follow exports closely, external demand is expected to make a positive contribution to GDP growth of almost 0.3 percentage points in both 2007 and 2008, after two consecutive years of a negative contribution. A strong euro should also support some improvement of the terms of trade as well as an increase in the external balance of goods and services.
Labour market, costs and prices
Strong economic growth in 2006 and high business confidence result in robust employment growth. This also implies a decrease in unemployment, although the impact is partly offset by a growing labour force. Wages are expected to accelerate in 2007 and 2008 in view of the more favourable labour market conditions, also following similar developments in Germany and the Netherlands.
After reaching 2.3% in 2006, HICP inflation is likely to moderate to around 1.8% in 2007 and 2008, supported by favourable import price and exchange rate developments. Although in 2006 inflation as measured by the national CPI was significantly lower than HICP inflation (due to a revision of the national CPI), it is expected to follow a pattern similar to HICP inflation in 2007 and 2008.

Chapter 3 Member States, Belgium
- 47 -
Table 3.1 Main features of country forecast - BELGIUM
2005 Annual percentage changebn Euro Curr. prices % GDP 92-02 2003 2004 2005 2006 2007 2008
GDP at constant prices 298.5 100.0 2.0 1.0 3.0 1.1 3.1 2.3 2.2 Private consumption 158.7 53.1 1.7 0.9 1.5 0.9 2.4 2.1 1.6 Public consumption 68.5 22.9 1.7 2.2 2.1 -0.6 1.3 1.7 2.4 Gross fixed capital formation 59.0 19.8 1.9 -0.7 7.9 4.0 4.3 2.8 2.3 of which : equipment 27.0 9.0 2.2 -3.0 8.8 2.2 4.1 3.0 2.5 Exports (goods and services) 257.7 86.3 4.2 2.9 5.9 2.8 3.5 5.6 5.1 Final demand 547.3 183.3 2.8 1.9 4.4 2.1 3.4 3.8 3.4 Imports (goods and services) 248.8 83.3 4.0 3.0 6.3 3.5 3.8 5.4 4.9 GNI at constant prices (GDP deflator) 301.1 100.9 2.1 1.1 2.5 1.0 3.0 2.3 2.1 Contribution to GDP growth : Domestic demand 1.7 0.8 2.8 1.1 2.4 2.1 1.9
Stockbuilding 0.0 0.1 0.2 0.4 0.8 0.0 0.0Foreign balance 0.3 0.1 0.0 -0.5 -0.1 0.3 0.3
Employment 0.7 0.0 0.6 1.0 1.1 1.1 0.9 Unemployment rate (a) 8.4 8.2 8.4 8.4 8.2 7.8 7.6 Compensation of employees/head 3.2 1.6 2.0 2.4 2.7 2.5 2.5 Real unit labour costs -0.1 -1.0 -2.6 0.3 -1.0 -0.9 -0.8 Savings rate of households (b) - - 13.2 13.2 13.2 13.3 13.3 GDP deflator 1.9 1.6 2.4 2.0 1.8 2.2 2.0 Private consumption deflator 1.7 1.7 2.4 2.9 2.2 1.8 1.8 Harmonised index of consumer prices 1.9 1.5 1.9 2.5 2.3 1.8 1.8 Trade balance (c) 3.3 3.5 2.7 1.6 1.4 1.7 1.9 Current account balance (c) 4.7 4.5 3.6 2.5 2.3 2.7 2.9 Net lending(+) or borrowing(-) vis-à-vis ROW (c) 4.6 4.4 3.6 2.5 2.4 2.7 3.1 General government balance (c)(d) -2.6 0.1 0.0 -2.3 0.2 -0.1 -0.2 Cyclically-adjusted budget balance (c)(d) -2.5 0.5 -0.1 -1.7 0.5 0.1 0.1 Structural budget balance (c) - -1.0 -0.9 0.2 -0.4 -0.1 0.1 General government gross debt (c) 120.1 98.6 94.3 93.2 89.1 85.6 82.6 (a) Eurostat definition. (b) gross saving divided by gross disposable income. (c) as a percentage of GDP. (d) Including proceeds relative to UMTS licences (see for more details note 10 on concepts and sources).
Public finances
Public finances in 2006 benefited from the higher-than-anticipated economic growth, in particular through indirect tax revenue. Higher revenue from one-off measures compensated the loss in direct income tax revenue related to the final stage of the personal income tax reform. The 2006 government accounts thus recorded a small surplus.
The better-than-anticipated outcome for 2006 partially carries over to 2007. Reduced public investment (after the local elections in 2006) and lower interest expenditure, combined with some new revenue-increasing measures, are planned to replace a substantial package of one-offs (over 0.8% of GDP) from the 2006 budget. However, a new tax on packing material (with an initially planned revenue of 0.1% of GDP in 2007 and 0.2% in 2008) turned out to be difficult to implement and its expected impact was
downsized considerably during the latest budget control exercise. The forecast further includes the one-off effect of the advance collection of social contributions on holiday allowances and a first package of real estate sales (about 0.2% of GDP). Further one-off measures have been announced (some 0.3% of GDP, in particular a second round of real estate sales and the take-over of pension funds), but are not included in the projections, because they are not yet sufficiently specified. Overall, a deficit of around 0.1% can be expected for 2007. As for 2008, on a no-policy-change basis, a slight deterioration of the deficit to around 0.2% of GDP is forecast, mainly due to the expiry of the one-off measures in the 2007 budget (retained in the forecast), which is only partially compensated by a reduction of interest expenditure.
The debt-to-GDP ratio is forecast to remain on a downward path, falling from 89.1% to 82.6% in 2008.

2. Bulgaria Catching-up driven by investment
- 48 -
0
5
10
15
20
25
30
02 03 04 05 06 07 083.5
4.0
4.5
5.0
5.5
6.0
6.5
7.0
Net borrowing from ROW (lhs)Investment ratio (GFCF in % of GDP, lhs)Real GDP growth (rhs)
Graph 3.2: Bulgaria - Real GDP growth, investment ratio and external deficit
% of GDP Forecast %
Activity in 2006
Real GDP growth remained robust in 2006 at around 6%, mainly driven by strong domestic demand. Relatively strong employment growth and higher real incomes continued boosting private consumption, which increased by around 7½%, up from about 6% in 2005. On the back of very high FDI inflows of above 16% of GDP, gross fixed capital formation remained buoyant and increased by around 17½% in 2006. The composition of growth remained fairly unbalanced with a strong negative contribution from net exports, mainly because of high import growth and lower exports of services.
Merchandise export growth picked up again in 2006, but remained below import growth. As a result, the trade deficit widened further to around 21½% of GDP. A decrease in the surplus of the services balance (due to lower growth of tourism revenues), lower current transfers and lower net incomes from abroad further added to the increase in the current account deficit. Net borrowing vis-à-vis the rest of the world thus increased to around 15% of GDP in 2006, up from around 11% in 2005.
Prospects for 2007 and 2008
Underlying economic trends are expected to remain largely unchanged in 2007 and 2008, with real GDP growing at around 6% in both years. The catching-up of the Bulgarian economy will continue to be supported by strong investment growth, both to expand capacity and to upgrade the existing capital stock. Moreover, absorption of EU Structural Funds starting in 2007 will give a boost to investment in
public infrastructure.
Noticeably higher real wage growth (backed by productivity gains) and sustained job creation will imply a gradual increase in disposable incomes and thus private consumption growth in the coming years. At the same time, some fiscal expansion over the forecast period could lead to somewhat higher growth in public consumption than has been the case in 2006.
Final demand will therefore continue to expand strongly at rates of around 9% per year. In line with robust domestic demand, imports are expected to outpace exports despite a gradual strengthening of the export potential of the Bulgarian economy which is reflected in persistent gains in market shares. The trade deficit is thus expected to widen to above 22% of GDP in 2007 and 2008. The current account deficit will further increase as a result of higher repatriated profits weighing on the income balance. Stronger current and capital transfers from the EU will, however, imply that the net borrowing of the economy will stabilise at around 15½% of GDP over the forecast period.
Labour market, costs and prices
Strong private sector job creation, which was also boosted by a reduction in pension contributions, and an increase in participation rates led to higher-than-expected employment growth of around 2½% in 2006. Thanks to an increase in participation rates, relatively solid employment growth of above 1% per year is expected over the forecast period despite a drop in the working-age population due to negative demographic trends. The unemployment rate is projected to fall further, to around 7½%, in 2008.
An increasingly tight labour market will entail certain upward pressures on nominal wage growth. However, in line with a substantial increase in the investment ratio and ongoing economic restructuring, labour productivity is projected to accelerate steadily from around 3½% in 2005 to 5% in 2008. This will mitigate the effect of the increase in wages on nominal unit labour costs.
HICP inflation increased from an average 6% in 2005 to 7.4% in 2006, mainly owing to higher excise duties on alcohol and tobacco. Thanks to lower oil prices HICP inflation decreased during the year, but seasonally higher food prices caused a slight re-

Chapter 3 Member States, Bulgaria
- 49 -
Table 3.2 Main features of country forecast - BULGARIA
2005 Annual percentage changebn BGN Curr. prices % GDP 92-02 2003 2004 2005 2006 2007 2008
GDP at constant prices 42.8 100.0 0.1 5.0 6.6 6.2 6.1 6.1 6.2 Private consumption 30.0 70.2 0.9 5.5 5.9 6.1 7.5 7.8 8.0 Public consumption 7.7 18.0 -4.8 7.7 3.8 2.5 2.4 3.5 4.0 Gross fixed capital formation 10.3 24.2 - 13.9 13.5 23.3 17.6 16.0 14.0 of which : equipment - - - - - - - - - Exports (goods and services) 25.5 59.5 - 10.7 12.7 8.5 9.0 10.0 9.6 Final demand 75.3 176.0 - 9.0 9.0 9.4 9.8 8.8 8.7 Imports (goods and services) 32.5 76.0 - 16.4 14.5 13.1 15.1 12.1 11.6 GNI at constant prices (GDP deflator) 43.1 100.7 - 4.2 6.2 5.7 5.5 5.9 6.1 Contribution to GDP growth : Domestic demand - 8.2 8.6 8.8 10.4 10.2 10.2
Stockbuilding - 1.1 0.6 1.5 1.9 -0.5 -0.5Foreign balance - -4.3 -2.5 -4.1 -6.2 -3.6 -3.6
Employment -0.9 3.0 2.6 2.7 2.4 1.4 1.2 Unemployment rate (a) 15.5 13.7 12.0 10.1 9.0 8.2 7.4 Compensation of employees/head - 5.1 4.9 5.9 7.8 9.0 9.5 Real unit labour costs - 1.2 -4.0 -1.3 -3.8 0.2 0.1 Savings rate of households (b) - - - - - - - GDP deflator 64.4 1.8 5.1 3.8 8.1 4.0 4.2 Private consumption deflator 67.1 0.2 4.4 5.2 5.2 3.2 3.5 Harmonised index of consumer prices - 2.3 6.1 6.0 7.4 4.2 4.3 Trade balance (c) -4.7 -13.7 -14.9 -20.2 -21.5 -22.1 -22.7 Current account balance (c) -3.4 -5.5 -6.6 -12.0 -15.8 -16.6 -17.2 Net lending(+) or borrowing(-) vis-à-vis ROW (c) -3.5 -5.9 -5.1 -10.8 -15.1 -15.6 -15.8 General government balance (c)(d) - -0.9 2.2 1.9 3.3 2.0 2.0 Cyclically-adjusted budget balance (c)(d) - -0.9 1.6 1.3 2.8 1.6 1.8 Structural budget balance (c) - -0.9 1.6 1.3 2.8 1.6 1.8 General government gross debt (c) - 45.9 37.9 29.2 22.8 20.9 19.0 (a) Eurostat definition. (b) gross saving divided by gross disposable income. (c) as a percentage of GDP. (d) Including proceeds relative to UMTS licences (see for more details note 10 on concepts and sources).
acceleration to 6½% at the end of the year. In 2007, inflation is expected to decline to around 4¼% on average thanks to lower oil prices and because of the base effect of the excise duty increase in 2006. Somewhat higher oil prices and some upward pressure from wage developments could, however, imply slightly higher inflation in 2008. Real unit labour costs are expected to remain more or less stable over the forecast period.
Public finances
The general government surplus reached 3¼% of GDP in 2006, up from around 2% of GDP in 2005. Strong revenue growth and improved tax collection limited the effect of the 6-percentage-point reduction in pension contributions in 2006 on the revenue-to-GDP ratio. At the same time, expenditure restraint – especially as regards current primary spending – and lower interest payments helped reduce the expenditure-to-GDP ratio by almost 3% of GDP.
Reductions in corporate and personal income tax rates in 2007 are expected to lead to a decrease in the revenue-to-GDP ratio despite further improved revenue collection and compliance. The forecast also takes into account the re-allocation of part of the VAT revenue to the EU budget after accession, Bulgaria’s contribution to the EU budget and higher capital expenditures. A fiscal expansion is thus expected in 2007. The general government budget surplus will be reduced to around 2% of GDP in 2007 and remain at this level in 2008 on a no-policy-change basis.
In line with strong GDP growth and fiscal surpluses, general government gross debt is expected to drop to below 20% of GDP in 2008.

3. The Czech Republic Firm growth accompanied by fiscal pressures
- 50 -
2526272829303132333435
02 03 04 05 06 07 080
1
2
3
4
5
6
7
8
General government deficit (rhs)General government debt ratio (lhs)
Forecast
% of GDP
Graph 3.3: Czech Republic - General government finances
% of GDP
Activity in 2006
The Czech economy continued to grow strongly in 2006, at about 6% of GDP, equalling the record level of 2005. The main impetus was provided by domestic demand, in particular gross fixed capital formation, with a declining contribution from net exports.
Growth in gross fixed capital was driven by strong inflows of mainly export-oriented foreign direct investment and boosted by an increase in EU funds for infrastructure development. Private consumption also rose strongly on the back of increasing employment, rising salaries, cuts in direct taxation and expanding consumer credit. Mortgage lending also grew rapidly helped by low interest rates. The increase in consumer spending contributed to a strong rise in imports which reduced the contribution of net exports. On the supply side, the main contribution to the economic expansion continued to come from manufacturing, particularly transport related, as well as trade and commercial services.
Prospects for 2007 and 2008
The exceptional growth of the previous two years is expected to moderate in 2007 and 2008 to just below 5% of GDP while the pattern of growth is expected to stay broadly similar. Domestic demand should provide the greater stimulus whereas the growth contribution of the external balance is likely to be partly affected by an appreciating koruna. Private consumption expenditure is projected to rise at above 4%. Household and corporate borrowing is likely to continue growing rapidly while remaining moderate compared with euro-area levels. Investment is still
expected to provide the main impetus based on new measures to encourage domestic investment, a stronger injection of EU funds and a buoyant housing market. The construction sector has started to show robust growth which is set to continue through 2007.
The trade balance is set to continue to register a surplus, despite increasing mineral prices, with continued strong export growth in the automobile and high-technology sectors. Net borrowing is forecast to fall slightly while continuing to reflect a large proportion of repatriated and reinvested profits from foreign investment. This is partly due to higher transfers which will be boosted by an increase in EU funds from 2007 onwards.
Labour market, costs and prices
The labour market should further tighten in 2007 due to continuing firm growth in the Czech economy, with improving employment opportunities expected in most sectors. While private sector salaries are expected to respond to the tightening labour market, public sector wages are likely be more restrained. Overall, due to rising productivity real unit labour costs are forecast to continue falling. The potential impact of the increase in the minimum wage level in 2006 on employment should be partially counterbalanced in 2007 by changes to benefit entitlement criteria that will encourage more active job seeking. However, structural factors, in particular the relatively high tax wedge on labour, still temper long-term employment growth.
The two rises in excise duties in 2007, and the pre-announced hike in electricity prices at the beginning of 2008, are expected to add to inflationary pressure while the overall outlook should also be mitigated by falling real unit labour costs. Inflation is predicted to rise through 2007 and 2008 to just below the 3% target of the CNB.
In March, the CNB announced a downward revision of the inflation target to 2%, effective from January 2010. In spite of the revision of the CPI basket at the beginning of 2007 which will reduce measured inflation by up to a third of a percentage point, the move may imply monetary tightening given the overall outlook.

Chapter 3 Member States, The Czech Republic
- 51 -
Table 3.3 Main features of country forecast - THE CZECH REPUBLIC
2005 Annual percentage changebn CZK Curr. prices % GDP 92-02 2003 2004 2005 2006 2007 2008
GDP at previous year prices 2970.3 100.0 1.8 3.6 4.2 6.1 6.1 4.9 4.9 Private consumption 1473.6 49.6 3.7 6.0 2.6 2.8 4.6 4.7 4.4 Public consumption 663.1 22.3 0.7 7.1 -3.2 1.0 0.3 0.6 1.1 Gross fixed capital formation 740.9 24.9 5.4 0.4 4.7 1.3 7.3 7.6 7.8 of which : equipment 319.1 10.7 10.9 -5.9 4.5 1.9 7.9 6.8 6.5 Exports (goods and services) 2130.6 71.7 9.3 7.2 21.1 10.4 14.6 12.1 10.4 Final demand 5044.0 169.8 5.6 5.3 10.2 5.7 8.7 7.5 7.2 Imports (goods and services) 2073.7 69.8 13.9 8.0 18.2 4.8 14.2 11.0 10.0 GNI at previous year prices (GDP deflator) 2838.5 95.6 - 3.9 2.7 7.5 5.6 3.4 4.7 Contribution to GDP growth : Domestic demand 3.5 4.8 1.9 2.0 4.2 4.3 4.4
Stockbuilding 0.3 -0.5 1.0 0.1 1.4 -0.5 0.0Foreign balance -2.0 -0.6 1.4 4.0 0.5 1.1 0.5
Employment - -1.3 0.1 1.6 1.3 1.0 0.7 Unemployment rate (a) - 7.8 8.3 7.9 7.1 6.4 6.1 Compensation of employees/head - 8.6 5.8 4.3 4.1 3.9 3.8 Real unit labour costs - 2.5 -1.8 -0.8 -2.3 -1.8 -3.1 Savings rate of households (b) - - 5.5 5.8 6.6 4.8 4.0 GDP deflator 8.8 0.9 3.5 0.7 1.7 1.8 2.7 Private consumption deflator 7.6 -0.4 3.0 1.7 2.3 2.3 2.7 Harmonised index of consumer prices - -0.1 2.6 1.6 2.1 2.4 2.9 Trade balance (c) -5.1 -2.7 -1.0 1.3 1.1 2.3 3.1 Current account balance (c) -3.4 -6.5 -6.3 -2.7 -4.1 -3.0 -2.7 Net lending(+) or borrowing(-) vis-à-vis ROW (c) -3.6 -6.3 -6.2 -3.2 -4.7 -3.5 -3.3 General government balance (c)(d) - -6.6 -2.9 -3.5 -2.9 -3.9 -3.6 Cyclically-adjusted budget balance (c)(d) - -5.5 -1.9 -3.1 -3.1 -4.1 -3.8 Structural budget balance (c) - -5.5 -1.2 -2.0 -2.8 -4.1 -3.8 General government gross debt (c) - 30.1 30.7 30.4 30.4 30.6 30.9 (a) Eurostat definition. (b) gross saving divided by gross disposable income. (c) as a percentage of GDP. (d) Including proceeds relative to UMTS licences (see for more details note 10 on concepts and sources).
Public finances
The government deficit fell to 2.9% of GDP in 2006, well below the annual target of 3.8% of GDP set out in the consolidation path of the July 2004 Council Recommendation of the Excessive Deficit Procedure (EDP). However, this is mainly due to stronger growth than previously anticipated rather than sustainable spending cuts.
The budget for 2007, which was agreed upon before the election of the new government, implies a pronounced fiscal expansion, mainly due to increases in social expenditure estimated at over 1% of GDP, without significant cuts in other areas, again overshooting the medium-term expenditure ceiling.
Based on the outturn in 2006, the 2007 budget and the medium-term budgetary outlook for 2007/2008, the forecast is for a deficit of 3.9% of GDP in 2007 and 3.6% of GDP in 2008. This will imply a marked divergence from the target in the 2004 EDP
consolidation path of 3.3% of GDP for 2007, as well as significantly increasing the likelihood of missing the deficit target of 2.7% of GDP in 2008, the correction year in the current EDP, despite the likely benefit of higher-than-anticipated revenues. This is based on a broadly positive macroeconomic scenario, an increased injection of EU funds, and the expectation that the share of public consumption as a percentage of GDP will fall. It also assumes the stabilisation of the use of reserve funds, in line with government policy, which have been estimated to have accumulated to about 2% of GDP.
The government debt ratio is projected to increase steadily to about 31% of GDP by 2008.

4. Denmark Healthy growth expected to moderate
- 52 -
0
1
2
3
4
5
6
99 00 01 02 03 04 05 06 07 080
1
2
3
4
5
6
Unemployment rate Inflat ion Wage growth
Graph 3.4: Denmark - Unemployment rate , HICP inflation and wage growth
yoy % ch. %
Activity in 2006
In 2006, economic activity maintained its momentum, with real GDP growth reaching 3.2%, slightly higher than in 2005. Private consumption continued to be the main driving force and grew by 3.4%. This was supported in particular by the ongoing increase in employment, a strong housing market and still relatively low interest rates. Investment provided a further impetus to the economy and grew overall by about 11%. Both export and import growth accelerated further in 2006. Due to buoyant private consumption, high capacity utilisation in the domestic economy and a prominent import content in exports, imports grew more than exports, resulting in a negative growth contribution of net exports.
Prospects for 2007 and 2008
Over the forecast period, the economy is expected to keep on growing at a healthy pace, but somewhat more slowly than in recent years. A slowdown in economic activity already became visible in the second half of 2006, with real GDP growing by only 0.3 and 0.4% in the third and fourth quarter (quarter-on-quarter). The main reasons for the slowdown are widespread capacity constraints in the domestic economy and a moderation in private consumption. Overall GDP growth is foreseen to decelerate to respectively 2¼% and 2% in 2007 and 2008.
Private consumption is expected to moderate as interest rates increase and as the housing market cools off. After sharp price hikes for one-family homes in the past two years of about 20% a year, the rate of increase slowed down markedly in the second half of
2006. In the fourth quarter, prices stagnated overall. While prices have shown a tendency to fall in areas where the earlier price increases have been most pronounced and a general price fall cannot be completely disregarded, there are currently few signs of a major forthcoming correction in real estate prices. Nonetheless, the housing market remains a downside risk to the economic outlook.
Investment is expected to slow down over the forecast period, partly due to higher interest rates and a slowdown in housing construction. However, capacity utilisation at a very high level, widespread labour shortages and good profitability in the private sector are expected to provide a continued impetus to business investment.
Given the capacity pressure in the economy, imports are expected to continue to grow somewhat faster than exports this year and to contribute negatively to growth. Only in 2008 is growth of exports and imports expected to balance as domestic demand growth should ease further.
Overall, the projected scenario for the slowdown of GDP growth to below potential, with a moderation of domestic demand and a cooling of the housing market, is set to ease the pressures on the economy. It should ensure that healthy economic growth is maintained, albeit at a lower level.
Labour market, cost and prices
In 2006, the labour market continued to strengthen. Employment increased further and unemployment fell to a historically low level well below 4% of the labour force. At the same time, capacity utilisation is persistently high in the industrial sector and most sectors are reporting shortages of labour.
Nevertheless, the increase in wage growth has so far been rather limited in the overall economy. Looking ahead, however, wage growth is eventually set to accelerate, judging from the outcome of the 2007 wage negotiation round. The current indications seem to point to wages rising at a rate about 1.5-2% per year faster over the next three-year period than in the previous period.
Domestically determined inflation has gradually been increasing due to higher cost pressures, albeit from a very low level. Consumer price inflation has therefore remained subdued and slightly below the euro-area

Chapter 3 Member States, Denmark
- 53 -
Table 3.4 Main features of country forecast - DENMARK
2005 Annual percentage changebn DKK Curr. prices % GDP 92-02 2003 2004 2005 2006 2007 2008
GDP at constant prices 1552.0 100.0 2.3 0.4 2.1 3.1 3.1 2.3 2.0 Private consumption 754.1 48.6 1.7 1.0 4.7 4.2 3.4 2.4 1.8 Public consumption 401.4 25.9 2.4 0.7 1.6 1.1 1.2 1.5 1.2 Gross fixed capital formation 319.2 20.6 4.1 -0.2 5.6 9.6 11.2 6.2 3.2 of which : equipment 125.7 8.1 4.2 -4.0 5.6 12.1 16.9 10.1 4.9 Exports (goods and services) 757.1 48.8 5.2 -0.9 2.2 7.2 9.6 5.7 5.2 Final demand 2235.7 144.1 3.3 -0.2 3.5 5.3 6.7 3.7 3.2 Imports (goods and services) 683.8 44.1 5.9 -1.6 6.9 10.7 14.0 6.4 5.3 GNI at constant prices (GDP deflator) 1565.1 100.8 2.5 1.0 3.2 3.5 3.7 1.8 1.9 Contribution to GDP growth : Domestic demand 2.3 0.6 3.7 4.2 4.4 3.0 2.0
Stockbuilding 0.1 -0.5 0.1 -0.1 0.6 -0.4 0.0Foreign balance 0.0 0.2 -1.7 -1.0 -1.9 -0.4 0.0
Employment 0.5 -1.3 0.0 0.7 1.9 0.4 -0.1 Unemployment rate (a) 6.1 5.4 5.5 4.8 3.9 3.3 3.3 Compensation of employees/head 3.5 4.0 2.7 3.3 3.8 4.5 4.3 Real unit labour costs -0.1 0.6 -1.4 -2.2 0.2 -0.4 -0.6 Savings rate of households (b) - - 5.8 2.5 3.2 4.7 5.8 GDP deflator 1.8 1.6 2.0 3.2 2.4 3.0 2.8 Private consumption deflator 1.9 1.3 1.5 2.2 2.1 1.9 2.2 Harmonised index of consumer prices 2.0 2.0 0.9 1.7 1.9 1.9 2.2 Trade balance (c) 3.9 4.6 3.7 3.1 0.4 0.2 0.3 Current account balance (c) 1.6 3.4 3.1 3.6 2.5 1.9 2.3 Net lending(+) or borrowing(-) vis-à-vis ROW (c) 1.7 3.4 3.1 3.7 2.5 1.9 2.3 General government balance (c)(d) -0.7 0.0 2.0 4.7 4.2 3.7 3.6 Cyclically-adjusted budget balance (c)(d) -0.6 1.0 2.9 5.0 4.0 3.6 3.8 Structural budget balance (c) - 1.0 2.7 4.8 3.7 3.3 3.8 General government gross debt (c) 63.2 45.8 44.0 36.3 30.2 25.0 20.0 (a) Eurostat definition. (b) gross saving divided by gross disposable income. (c) as a percentage of GDP. (d) Including proceeds relative to UMTS licences (see for more details note 10 on concepts and sources).
average. Over the forecast period, capacity constraints and growing wage pressures in the economy are expected to result in upward pressure on inflation in 2008. At the same time, counter-effects from lower energy prices should contribute to maintaining consumer price inflation just under 2% in 2007.
Public finances
In 2006, the general government recorded a sizeable surplus 4.2% of GDP (taking into account the reclassification of second-pillar funded pension schemes in the private sector as from April 2007). The strong public finances are partly a consequence of healthy economic growth and a fall in unemployment, implying higher tax revenue and lower transfer payments. However, the relatively large surpluses are also due to certain windfall revenues. Notably, energy prices that have remained at a high level resulted in strong tax revenue from the oil and gas activities in the North Sea.
Looking forward, a moderation in economic growth is projected to translate into somewhat lower general government surpluses of around 3 ¾ % of GDP in 2007 and 2008. The projections are however subject to major uncertainty due to volatility of certain revenues.
In 2006, the gross debt ratio was reduced to just above 30% of GDP. Owing to continued strong budget surpluses the gross debt ratio is expected to be reduced further, to about 20% of GDP in 2008.

5. Germany Solid growth increasingly driven by domestic factors
- 54 -
-1.6-1.2-0.8-0.40.00.40.81.2
1.62.0
06Q4 07Q1 07Q2 07Q3 07Q4 08Q1 08Q2 08Q3 08Q4
%
private consumption GFCFinventories net external demandGDP
Graph 3.5: Germany - GDP and growth contributors
98
99
100
101
102
103
104
105
106
00 01 02 03 04 05 06 07 08Private consumption (real) Employment
Graph 3.6: Germany - Consumption and employment
index 2000=100
Forecast
Activity in 2006
After several years of sluggish growth, demand and output rebounded strongly, attaining a rate of 2.7%, the highest since the beginning of the decade. Once again, exports were the driving force, rising at double-digit rates. Nevertheless, growth became more balanced, with relative contributions shifting somewhat from foreign towards internal demand, as both domestic investment and consumption strengthened, leading also to a pick-up in import growth.
Activity revived sharply as from the beginning of the year, and the momentum was largely maintained thereafter. Towards the end of the year, demand was boosted further by a number of temporary factors. Thus, the imminent sizeable VAT increase prompted many households to carry purchases forward, notably of motor cars and other durable goods, while stable oil prices and unusually warm weather helped them save on energy cost. The prospect of the VAT increase stimulated also construction output; moreover, the sector benefited from the abolition of subsidies for owner-occupied homes which had led to a boom in applications for building permits in late 2005 and now translated into higher building activity. On the other hand, the front-loading of demand led to a run-down of inventories that was exceptionally strong in the final quarter.
Prospects for 2007 and 2008
The VAT increase at the beginning of 2007 is leading to a demand shortfall corresponding to the purchases carried forward into 2006. This is already reflected in
latest data on new car registrations and retail sales. However, the temporary setback should be short-lived, since the underlying positive trend observed in 2006 in consumption as well as investment is expected to continue in 2007 and beyond. Notably the construction sector, where the negative echo effect on housing investment was over-compensated by the unusually warm weather in the 1st quarter, appears to have definitely overcome its decade-long recession and should return to a sustainable growth path as from the second half of the year. It will benefit not only from higher corporate spending on structures, but also from improved public finances, enhancing the scope for investment particularly at the local level.
Corporate investment will keep its strong momentum, supported by several factors: the high level of capacity utilisation, the completion of balance sheet restructuring that has weighed on investment in recent years, and the continuous buoyant profit situation. In addition, the phasing out of the accelerated depreciation rules at the end of this year should have a temporary beneficial effect, followed by a corresponding negative echo effect at the beginning of 2008. Consequently, investment will continue to contribute significantly to growth in 2007 and, to a lesser degree, in 2008.
Accelerating growth of disposable income as a result of an improved labour market situation is supporting a revival of consumer confidence. With gains in non-labour income remaining strong, private consumption expenditure is expected to become the main growth driver in 2008.

Chapter 3 Member States, Germany
- 55 -
Despite the expected gradual cooling down of world trade, German exports should continue to grow strongly, as they are benefiting from the country’s improved competitiveness. The current account surplus should increase by nearly a full percent of GDP in 2007, partly because imports will be dampened by temporary factors such as weather-related lower energy imports and the VAT-induced dampening of domestic demand. Finally, given that production grew more steadily than demand around the turn of the year 2006/07, enterprises have started to replenish their stocks at the beginning of the current year. This rebound should more than offset the significant rundown of stocks in the last quarter of 2006, making a significant positive growth contribution.
In all, GDP growth is set to stay robust at a projected pace of 2½% each in 2007 and 2008, thereby raising also potential growth to an estimated 1¾% p.a.
Labour market, costs and prices
Germany's economic upswing has finally reached the labour market. In 2006 the nearly 500 000 new jobs created were almost exclusively made up of employment subject to social security contributions. This stands in stark contrast to recent years when overall employment remained broadly stable but full-time employment declined. Given the current strong economic trend, enterprises will continue to recruit, and total employment is projected to rise further by more than 2% in 2007 and 2008 taken together. As a consequence, unemployment is expected to fall considerably, by around 2 percentage points, until 2008. This improved situation will induce higher wages, mainly in the private sector in 2007 and taken up in the public sector in 2008. Nevertheless, continued strong increases in productivity will mean that unit labour costs will not start to increase until 2008, and then only slightly.
More than half of the VAT increase has been passed through to consumer prices, partly already in 2006. While in January the effect was somewhat smaller than expected, albeit also masked by lower energy prices, inflation data for the months thereafter suggest that this process is still ongoing. Nevertheless, as this effect is expected to phase out quickly, inflation is projected to stay below 2% in Germany in 2007 and 2008, despite higher wages and the expected slight increase in commodity prices.
Public finances
The general government deficit fell from 3.2% of GDP in 2005 to 1.7% in 2006 and hence below the 3%-of-GDP reference value for the first time since 2002, and well below the Commission’s projection one year ago of a deficit of 3.1% of GDP in 2006.
The principal contribution to the better outturn comes from the revenue side. More favourable cyclical conditions led to higher-than-anticipated revenues. In addition, direct taxes, especially those related to profits, yielded substantially stronger revenues than the growth in the tax base would have suggested. As a result, taxes as a percentage of GDP increased by more than ½ percentage point in 2006 compared with 2005. The higher tax ratio is thus not the outcome of tax policy measures. It is driven rather by payments of tax arrears and early payments in direct taxes, thus mirroring the relatively low direct tax ratio of the past.
General government expenditure was kept under control in 2006. Total expenditure grew by 0.6%, slightly less than projected last spring. With high GDP growth, the expenditure-to-GDP ratio fell by more than one percentage point. Positive labour market developments led to a reduction in related expenditure, especially in unemployment insurance (Arbeitslosengeld I). This is administered by the Federal Employment Agency, which has continued to reduce spending on active labour market policy. The higher-than-anticipated revenues were used for deficit reduction in 2006, which improved the 2006 structural budget balance by almost one percentage point.
In 2007, the general government deficit is projected to fall below 1% of GDP on current policiesi. The increase in the standard VAT rate should boost revenues by about 1% of GDP. The pension contribution rate was raised from 19.5% to 19.9% and public health insurers are expected to increase contribution rates on average by ½ percentage point. On the other hand, the unemployment insurance contribution rate has been reduced from 6.5% to 4.2%, so that the overall social contribution burden will decline. Despite the positive economic environment, revenue-rich tax bases are developing less dynamically than nominal GDP, so that – despite the increase in the VAT rate – the tax burden is expected to decline. The expenditure ratio should decline by more than one percentage point, reflecting public sector wage restraint and reduced labour-

Economic forecast, spring 2007 Germany
- 56 -
Table 3.5 Main features of country forecast - GERMANY
2005 Annual percentage changebn Euro Curr. prices % GDP 92-02 2003 2004 2005 2006 2007 2008
GDP at previous year prices 2241.0 100.0 1.6 -0.2 1.2 0.9 2.7 2.5 2.4 Private consumption 1321.1 58.9 1.7 -0.1 0.1 0.1 0.8 1.0 2.3 Public consumption 419.6 18.7 1.7 0.4 -1.3 0.6 1.8 1.0 0.9 Gross fixed capital formation 386.9 17.3 0.6 -0.8 -0.4 0.8 5.6 4.9 3.7 of which : equipment 159.4 7.1 0.6 -0.3 4.1 6.1 7.3 7.1 4.7 Exports (goods and services) 912.3 40.7 5.8 2.4 9.6 6.9 12.5 8.7 7.1 Final demand 3037.3 135.5 2.2 1.1 2.7 2.4 5.1 4.2 3.9 Imports (goods and services) 796.3 35.5 4.7 5.4 6.9 6.5 11.1 8.5 7.6 GNI at previous year prices (GDP deflator) 2248.2 100.3 1.4 0.3 2.1 1.1 2.9 2.6 2.5 Contribution to GDP growth : Domestic demand 1.5 -0.1 -0.3 0.3 1.8 1.7 2.2
Stockbuilding -0.3 0.7 0.3 0.1 -0.2 0.2 0.0Foreign balance 0.4 -0.8 1.2 0.5 1.1 0.5 0.2
Employment -0.7 -1.7 -0.4 -0.6 0.3 0.7 0.5 Unemployment rate (a) 8.0 9.0 9.5 9.5 8.4 7.3 6.5 Compensation of employees/f.t.e. 3.7 2.5 1.5 0.5 1.1 1.6 2.4 Real unit labour costs -0.2 -0.1 -1.1 -1.6 -1.5 -1.9 -0.3 Savings rate of households (b) - - 16.2 16.3 16.2 16.4 16.2 GDP deflator 1.5 1.0 0.9 0.6 0.3 1.8 0.9 Private consumption deflator 1.7 1.5 1.6 1.3 1.3 1.6 1.3 Harmonised index of consumer prices - 1.0 1.8 1.9 1.8 1.9 1.7 Trade balance (c) 3.2 6.1 7.0 7.0 7.1 7.8 7.6 Current account balance (c) -0.7 2.0 3.9 4.2 4.7 5.6 5.7 Net lending(+) or borrowing(-) vis-à-vis ROW (c) -0.7 2.0 3.9 4.2 4.7 5.6 5.7 General government balance (c)(d) -2.4 -4.0 -3.7 -3.2 -1.7 -0.6 -0.3 Cyclically-adjusted budget balance (c)(d) -2.5 -3.2 -2.9 -2.3 -1.5 -0.8 -0.7 Structural budget balance (c) - -3.2 -3.0 -2.4 -1.5 -0.8 -0.7 General government gross debt (c) 55.4 63.9 65.7 67.9 67.9 65.4 63.6 (a) Eurostat definition. (b) gross saving divided by gross disposable income. (c) as a percentage of GDP. (d) Including proceeds relative to UMTS licences (see for more details note 10 on concepts and sources).
market-related spending, resulting from measures already implemented, such as the reduced benefit duration for older recipients, and favourable labour market developments. However, public investment is projected to pick up, in view of better fiscal positions at all levels of government. The cyclically-adjusted balance should improve by ¾ percentage point.
Under the assumption of unchanged policies, including social contribution rates, in 2008 the general government deficit is projected to decline further, albeit entirely due to persistent favourable cyclical conditions. Lagged consolidation effects of measures already in force will be more than offset by the budgetary burden from the reform of company taxation amounting to more than 0.3% of GDP.
Moreover, pension outlays are projected to rise in 2008, and public sector wage rates by even more. As a consequence, no further improvement of the cyclically-adjusted balance is expected in 2008 unless additional consolidation measures are adopted.
The government debt ratio is projected to fall over the forecast period, from 67.9% of GDP in 2006 to 63.6% of GDP in 2008. As in 2006, below-the-line operations will lower the debt ratio in 2007, while such transactions are still uncertain for 2008.
i In March 2007, the European Court of Justice ruled that the taxation of foreign dividend income in the German tax system in force until 2000 was not compatible with EU law. Due to uncertainties over likely amounts of retroactive reimbursements, an impact on the government deficit for 2007 could not be considered in these projections. Therefore, the forecast may somewhat underestimate the government deficit for 2007.

6. Estonia Growth still strong with domestic demand as main engine
- 57 -
-25-20
-15-10
-5
05
1015
01 02 03 04 05 06 07 08Net capital transactionsNet current transfersNet primary incomeNet exports of servicesNet exports of goodsBalance on current transactions
Graph 3.7: Estonia - External balance and components% of GDP
Activity in 2006
GDP growth exceeding 11% has continued for a year and a half in Estonia, with the outcome for 2006 reaching 11.4%. Growth was driven to a large extent by private consumption and investments, which were in turn supported by high credit growth, increasing employment and rises in real wages and households' disposable income. The contribution of net exports turned negative with the contribution of exports declining due to their slower growth, while imports grew level with domestic demand. The contribution of the public sector was customarily modest with growth rates well below private sector activity.
External imbalances widened in 2006 with the current account deficit above 14% of GDP and external net borrowing around 12% of GDP. A growing merchandise deficit was the main reason behind the worsening of the external balance; another factor contributing to higher current account imbalances is the income account with gross reinvested earnings reaching 6.5% of GDP last year. Gross external debt of Estonia continued growing and exceeded 90% of GDP at end-2006 with net external debt below 30% of GDP. FDI inflow in Estonia continued last year, although the main financing inflow took place through the banking sector.
Prospects for 2007 and 2008
A slowdown in economic growth has been delayed, but is nonetheless unavoidable due to constraints in supply factors, especially labour supply, and the fact that investments have been largely made in the real estate and related sectors where the market now
shows signs of having peaked. Recent developments confirm that, while demand is still strong, credit growth shows signs of moderating and the real estate market is gradually cooling down. Thus growth of economic activity is expected to decrease from the recent exceptionally high levels to more moderate annual rates of around 8-9%.
Growth will continue to be domestic-demand-driven. Although the real estate boom seems to be receding, investment is projected to stay at relatively high levels and private consumption growth will not decrease notably in 2007 and 2008. The main reasons behind buoyant private consumption and investment are still-high credit growth, rising households' disposable income, partly due to further cuts in the personal income tax, and wealth effects from higher real estate prices. The contribution of net exports to GDP growth is projected to be negative throughout the forecast period despite strong export demand. The external deficit will not improve either, as the underlying factors – strong credit growth and associated import demand, partially due to the continuing catching-up process – will remain in place. It is projected that the current account deficit will remain at levels above 14% of GDP over the forecast period with a peak in 2007.
Labour market, costs and prices
2006 was an exceptional year for the Estonian labour market in many respects. Total employment increased by over 5% with brisk economic activity bringing many discouraged and retired people back into the labour market. Persistently high employment growth points to a higher-than-expected elasticity of supply. Nonetheless there are signs of labour shortages in certain sectors, in particular construction, with a net outflow of labour aggravating these trends.
The tighter labour market has led to rapidly rising wages. This trend is projected to accelerate in 2007, as resources of labour dry up, even though the demographic situation still remains relatively favourable over the forecast period. Rising nominal unit labour costs thus constitute a significant risk, although there are as yet no clear signs of loss of competitiveness and there is room for absorbing productivity and wage differentials through some paring of profit margins.

Economic forecast, spring 2007 Estonia
- 58 -
Table 3.6 Main features of country forecast - ESTONIA
2005 Annual percentage changebn EEK Curr. prices % GDP 92-02 2003 2004 2005 2006 2007 2008
GDP at constant prices 173.1 100.0 - 7.1 8.1 10.5 11.4 8.7 8.2 Private consumption 89.7 51.8 - 6.9 6.9 8.2 15.7 15.1 12.6 Public consumption 30.1 17.4 - 0.3 2.2 1.1 2.8 3.3 3.0 Gross fixed capital formation 53.8 31.1 - 7.0 13.5 12.7 19.7 14.7 12.2 of which : equipment - - - - - - - - - Exports (goods and services) 138.4 80.0 - 7.6 17.1 21.5 10.0 8.7 7.8 Final demand 322.0 186.1 - 7.4 12.6 13.5 13.0 11.0 9.5 Imports (goods and services) 149.0 86.1 - 10.6 15.2 15.9 14.8 13.3 10.8 GNI at constant prices (GDP deflator) 164.3 95.0 - 5.6 8.5 10.7 11.9 8.9 8.6 Contribution to GDP growth : Domestic demand - 8.4 6.4 8.1 15.4 14.1 12.5
Stockbuilding - 1.8 1.8 -0.7 1.1 0.0 0.0Foreign balance - -3.1 -0.1 3.1 -5.2 -5.4 -4.3
Employment - 0.8 0.1 1.8 5.6 1.2 0.9 Unemployment rate (a) - 10.0 9.7 7.9 5.9 6.6 6.2 Compensation of employees/f.t.e. - 13.5 12.6 11.5 11.8 14.3 12.5 Real unit labour costs - 4.5 2.1 -3.8 -0.1 -1.7 -1.5 Savings rate of households (b) - - 2.3 5.2 8.0 6.0 5.3 GDP deflator - 2.3 2.1 6.8 6.1 8.2 6.6 Private consumption deflator - 0.9 1.8 2.9 3.2 4.3 4.8 Harmonised index of consumer prices - 1.4 3.0 4.1 4.4 5.1 5.3 Trade balance (c) - -16.3 -17.4 -13.5 -16.3 -17.2 -17.3 Current account balance (c) - -11.5 -12.5 -11.1 -14.2 -15.1 -14.7 Net lending(+) or borrowing(-) vis-à-vis ROW (c) - -10.5 -13.0 -8.4 -11.7 -12.9 -11.9 General government balance (c)(d) - 2.0 2.3 2.3 3.8 3.7 3.5 Cyclically-adjusted budget balance (c)(d) - 2.4 2.8 2.4 3.3 3.5 3.8 Structural budget balance (c) - 2.4 2.8 2.4 3.3 3.5 3.8 General government gross debt (c) - 5.7 5.2 4.4 4.1 2.7 2.3 (a) Eurostat definition. (b) gross saving divided by gross disposable income. (c) as a percentage of GDP. (d) Including proceeds relative to UMTS licences (see for more details note 10 on concepts and sources).
Annual HICP inflation increased from 4.1% in 2005 to 4.4% in 2006, mainly reflecting a pick-up in core inflation, as well as an increase in food prices in the second half of the year due to drought, while the contribution of oil prices turned negative at the end of the year. Domestic inflationary pressures will remain strong in the forecast period due to high economic growth and the tightening labour market. Consumer prices are projected to increase by over 5% in 2007 and 2008 with core inflation rising steadily in 2007 to the levels of around 5% and remaining high in 2008. In 2007 and especially in 2008 consumer prices will also be strongly influenced by administrative price increases, in particular the increase in VAT applied to heating scheduled for July 2007, as well as the tobacco and alcohol excise increases scheduled for January 2008.
Public finances
The general government budget surplus reached 3.8%
of GDP in 2006, mainly due to better-than-expected tax revenues and lower-than-budgeted expenditures, despite a supplementary budget that was adopted in September 2006. The total amount of the supplementary budget was 2.5% of GDP, of which one third was placed in the pension reserve and the remaining part mainly used for investments. The budgetary situation is projected to remain sound over the forecast period and should help to moderate pressures coming from high domestic demand arising from the private sector.
General government debt of just above 4% of GDP at end-2006, which is the lowest in the EU, will decline further over the forecast period to a level below 3% of GDP, as existing debt is repaid. The net financial position is already positive with financial assets of the general government above 10% of GDP as of end-2006.

7. Ireland Domestic demand drives growth, with some easing ahead
- 59 -
-1.5
0.0
1.5
3.0
4.5
6.0
7.5
9.0
10.5
00 01 02 03 04 05 06 07 08
Net exports Other domestic demand Housing investment GDPGDP euro area
Forecast
yoy %ch.
Graph 3.8: Ire land - GDP growth compared to euro area and contributions
Activity in 2006
Economic growth in 2006 was very robust, with real GDP growth of 6% over the year, driven mainly by domestic demand. Private consumption continued its strong performance, supported by solid growth in employment and per capita disposable income. Growth in investment expenditure slowed down from the high pace recorded in 2005, as the rebound in non-residential construction was more than offset by a deceleration in housing and equipment investment, particularly transport. This reflects, in particular, a much higher base in the previous year for both housing stock investments and equipment (including purchases of aircraft). On the external side, merchandise export performance was relatively muted, whereas services exports performed strongly, reflecting notably robust growth in business and financial services. The growth rate of imports decelerated somewhat but remained strong, in line with the strength of private consumption. Overall, the contribution of net exports to real GDP growth was just slightly positive.
The labour market performed very strongly in 2006, as employment grew by 4.4%. The construction and services sectors accounted for most of this increase, whereas the manufacturing sector recorded a fall in employment, although this largely reflected a negative carry-over effect. A pick up in productivity growth, to 1.5%, implied a deceleration in the growth of unit labour costs, which was however still high relative to that of its trading partners.
The strong growth in domestic demand has been
reflected in a pick-up of inflationary pressures. HICP inflation rose to 2.7% in 2006, from 2.2% in 2005, also a result of adverse energy price developments and the relatively high unit labour cost increases.
Prospects for 2007 and 2008
The Irish economy is expected to continue growing at a high rate of around 5% in 2007 and to decelerate to 4% in 2008. In 2007, domestic demand growth is expected to remain very solid, with a further acceleration of private consumption growth, supported notably by the release of SSIA funds (a government-sponsored saving scheme) into the economy. In 2008, however, this stimulus will not be repeated. Concerning investment, a pick-up in house improvements (also stimulated by the SSIA release), strong infrastructure and commercial construction and a rebound in equipment investment in 2007 are together expected to partly offset the impact of the easing in new residential construction. In 2008, investment growth is projected to slow down, as the moderation in housing construction becomes more visible. On the external side, merchandise exports are projected to strengthen somewhat in both 2007 and 2008, whereas exports of services should continue to perform strongly. Import growth is projected to remain strong in 2007 and to moderate in 2008, in line with the expected course of domestic demand. As net profit outflows are set to remain on an upward trend, the implied growth rate of gross national income (GNI) is somewhat lower than that of GDP. While the most recent data suggest that robust growth will continue over the short term, risks to this outlook persist. In particular, the high reliance of recent output and employment growth on the construction sector, coupled with the significant increases in household indebtedness, are noteworthy risks over the medium term; any marked slowdown in the US economy would also weigh heavily on the Irish economy.
Labour market, cost and prices
Employment growth is forecast to ease somewhat while remaining solid in 2007, at 3.4%, and to moderate further in 2008, to around 2%. Labour force growth, still fuelled by increased participation and inward migration, is not expected to be matched fully by employment growth in either 2007 or 2008, resulting in a slight rise in the unemployment rate, to 4.6% in 2008. Taking account of the pay element of the new social partnership agreement negotiated in

Economic forecast, spring 2007 Ireland
- 60 -
Table 3.7 Main features of country forecast - IRELAND
2005 Annual percentage changebn Euro Curr. prices % GDP 92-02 2003 2004 2005 2006 2007 2008
GDP at previous year prices 161.2 100.0 7.7 4.3 4.3 5.5 6.0 5.0 4.0 Private consumption 71.5 44.4 4.9 3.2 3.8 6.6 6.2 7.4 4.4 Public consumption 25.5 15.9 6.9 3.2 2.0 4.9 4.3 4.0 3.7 Gross fixed capital formation 43.6 27.0 8.6 5.8 7.4 12.8 3.9 5.0 3.5 of which : equipment 9.9 6.2 9.5 0.3 9.1 20.8 -7.0 12.5 10.0 Exports (goods and services) 129.8 80.5 14.5 0.5 7.3 3.9 4.9 5.3 4.9 Final demand 270.6 167.9 9.8 2.4 5.4 5.9 5.4 5.3 4.4 Imports (goods and services) 110.3 68.4 13.2 -1.2 8.7 6.5 5.3 5.8 5.1 GNI at previous year prices (GDP deflator) 136.8 84.9 6.7 7.4 4.3 5.8 7.4 4.4 3.7 Contribution to GDP growth : Domestic demand 5.5 2.3 5.0 6.8 4.5 5.4 3.6
Stockbuilding 0.0 0.6 -0.7 -0.1 0.6 -0.7 -0.2Foreign balance 2.3 1.5 0.3 -1.2 0.4 0.2 0.4
Employment 3.8 2.0 3.1 4.6 4.4 3.4 2.1 Unemployment rate (a) 9.6 4.7 4.5 4.3 4.4 4.5 4.6 Compensation of employees/head 5.3 5.0 6.6 5.0 4.9 4.6 4.5 Real unit labour costs -2.2 0.2 3.5 0.6 0.4 0.0 0.0 Savings rate of households (b) - - - - - - - GDP deflator 3.8 2.5 1.8 3.5 2.9 3.0 2.6 Private consumption deflator 4.0 3.7 1.5 1.2 2.6 2.7 2.4 Harmonised index of consumer prices - 4.0 2.3 2.2 2.7 2.6 2.2 Trade balance (c) 20.0 21.8 19.6 16.7 15.5 13.7 12.4 Current account balance (c) 0.3 0.0 -1.0 -3.1 -3.3 -3.9 -4.4 Net lending(+) or borrowing(-) vis-à-vis ROW (c) 1.3 0.0 -0.8 -3.0 -3.2 -3.8 -4.3 General government balance (c)(d) 0.3 0.4 1.4 1.0 2.9 1.5 1.0 Cyclically-adjusted budget balance (c)(d) 0.4 -0.2 1.3 1.1 3.0 1.8 1.6 Structural budget balance (c) - -0.2 2.0 0.8 3.0 1.8 1.6 General government gross debt (c) 63.6 31.2 29.7 27.4 24.9 23.0 21.7 (a) Eurostat definition. (b) gross saving divided by gross disposable income. (c) as a percentage of GDP. (d) Including proceeds relative to UMTS licences (see for more details note 10 on concepts and sources).
2006, "Towards 2016", annual growth in per capita compensation is estimated to stabilise at around 4½% over the forecast period.
The annual inflation rate is expected to stabilise in 2007, despite a projected pick-up in private consumption, and to fall again into 2008, also reflecting the expected deceleration in unit labour costs. CPI inflation is set to remain above that of the HICP over the forecast period; the gap between these mainly reflects the expected increase in average mortgage repayments.
Public finances
In 2006, the general government surplus registered 2.9% of GDP, a significantly better outcome compared to the initial official target of a 0.6% deficit and to the expected surplus of 2.3% in the update of Ireland's Stability Programme presented in December 2006. This rather positive outcome reflects, in particular, an increase in capital tax receipts by the
housing property market and, to a much lesser extent, lower-than-budgeted expenditure. Over the forecast period, the government surplus is projected to shrink, while remaining positive, at 1.5% of GDP in 2007 and 0.9% in 2008. Besides the expansionary impact of the 2007 budget, the reduction of the surplus is anticipated to be driven by slowing tax revenues as a result of the easing in the property market and the anticipated deceleration in economic activity, particularly in 2008. Compared with these projections, the macroeconomic risks, if realised, have the potential to worsen the general government balance significantly.
Government debt is projected to fall from 24.9% of GDP in 2006 to below 22% of GDP in 2008.

8. Greece Growth returns to a more sustainable pace
- 61 -
-11
-9-7
-5
-3
-11
3
5
98 99 00 01 02 03 04 05 06 07 08
707580859095100105110115120
Deficit : gen.gov.Deficit excl. interest: gen. gov.Cyclically-adjusted balanceConsolidated gross debt
Forecast
% of GDP
Graph 3.9: Greece - Net lending & consolidated gross debt
Activity in 2006i
Economic activity accelerated to 4¼% in 2006, from 3¾% in 2005. Private consumption remained robust, while investment bounced sharply up in 2006 and was largely responsible for the buoyancy of domestic demand. On the other hand, the contribution of public consumption to GDP growth was marginal, reflecting fiscal consolidation efforts. The extraordinary investment growth of around 12½% was driven by investment in housing, and, to a lesser extent, in other construction and equipment. The reforms in real estate taxation launched in 2005 and continued in 2006, sustained credit expansion and still very low real interest rates induced the strong acceleration recorded by residential investment. Public investment also recovered, while the improving business climate and corporations' healthy financial position benefited corporate investment. Overall, domestic demand contributed by almost 6 percentage points to growth. The sustained performance of exports of goods, as well as the rebound that took place in the tourism and transportation sectors, were more than outweighed by the strong import increase, after the contraction recorded last year. Thus, the external sector contributed negatively to growth.
Prospects for 2007 and 2008
Economic growth is projected to decelerate over the forecast horizon, with real GDP growing at around 3¾% in both 2007 and 2008. Changes in the growth composition compared with the 2006 outcome are expected to be marginal, except investment growth,
which is foreseen to trend down, returning smoothly to historical levels. Economic activity is likely to remain almost exclusively domestic-demand-driven. Rising interest rate expectations and more moderate wage growth are expected to outweigh positive developments in employment and direct income tax cuts, thus inducing a marginal slowdown in private consumption growth, which will remain at around 3½% per year until 2008. Government consumption growth is expected to move closer to GDP growth. Corporate investment would accelerate, while growth in residential investments should slow down. Overall, domestic demand is forecast to contribute about 4% per year to GDP growth. On the external front, imports are projected to keep pace with domestic demand, while the differential with Greece’s main trade partners in terms of unit labour costs is expected to further worsen competitiveness and, consequently, slow down exports of goods. On the other hand, exports of services are expected to retain strong growth rates, on the back of a dynamic performance by tourism and shipping services in 2007. As a result, the contribution of the external sector to GDP growth is projected to become less negative in 2007 and 2008. Consistent with the developments in the external sector, the current external balance is projected to reach 10½% of GDP in 2008, compared with 11½% this year.
Labour market, costs and prices
In line with economic activity, employment grew by 1½% in 2006. At 6%, nominal wage growth was well above HICP inflation (3¼%), which, along with productivity growth at 2¾%, kept on pushing unit labour cost growth above that of the euro area. Until 2008, employment is projected to grow at above 1¼% per year, while unemployment would decrease to below 9%. HICP inflation is expected to decelerate further, in line with more limited oil price hikes and wage growth moderation. Albeit still growing above productivity, wages would decelerate. As a result, the country’s competitive position would further deteriorate, although the differential with the euro area in terms of unit labour costs growth would be lower.

Economic forecast, spring 2007 Greece
- 62 -
Table 3.8 Main features of country forecast - GREECE
2005 Annual percentage changebn Euro Curr. prices % GDP 92-02 2003 2004 2005 2006 2007 2008
GDP at constant prices 181.0 100.0 2.7 4.8 4.7 3.7 4.3 3.7 3.7 Private consumption 121.5 67.1 2.4 4.5 4.7 3.7 3.8 3.6 3.4 Public consumption 29.0 16.0 2.9 -2.0 2.8 3.1 0.6 1.3 3.3 Gross fixed capital formation 42.9 23.7 4.2 13.7 5.7 -1.4 12.6 6.6 5.3 of which : equipment 16.9 9.3 9.5 18.3 8.2 0.5 3.8 6.7 5.8 Exports (goods and services) 37.7 20.8 6.0 1.0 11.7 2.9 6.2 6.1 5.9 Final demand 231.8 128.0 3.3 4.7 5.7 2.5 5.6 4.4 4.2 Imports (goods and services) 50.8 28.0 5.8 4.5 9.3 -1.2 9.8 6.5 5.4 GNI at constant prices (GDP deflator) 177.7 98.2 2.3 4.4 5.0 2.5 3.4 3.9 3.9 Contribution to GDP growth : Domestic demand 3.1 5.9 5.1 2.7 5.9 4.5 4.2
Stockbuilding 0.0 0.0 0.0 0.0 0.1 0.0 0.0Foreign balance -0.4 -1.2 -0.4 1.0 -1.7 -0.8 -0.5
Employment 0.7 1.3 2.9 1.3 1.5 1.4 1.3 Unemployment rate (a) 9.9 9.7 10.5 9.8 8.9 8.5 8.1 Compensation of employees/head 9.2 4.6 5.8 6.5 5.9 5.3 5.0 Real unit labour costs -0.4 -2.2 0.6 0.4 -0.3 -0.2 -0.8 Savings rate of households (b) - - 7.3 6.8 4.1 3.7 3.6 GDP deflator 7.5 3.5 3.4 3.7 3.4 3.2 3.3 Private consumption deflator 7.4 2.8 2.5 3.7 3.4 3.0 3.1 Harmonised index of consumer prices - 3.4 3.0 3.5 3.3 3.2 3.1 Trade balance (c) -14.3 -16.7 -17.7 -16.2 -17.3 -17.2 -16.9 Current account balance (c) -3.8 -10.0 -9.5 -9.2 -11.4 -11.0 -10.5 Net lending(+) or borrowing(-) vis-à-vis ROW (c) - -8.6 -7.7 -7.7 -9.7 -9.4 -9.0 General government balance (c)(d) -7.5 -6.2 -7.9 -5.5 -2.6 -2.4 -2.7 Cyclically-adjusted budget balance (c)(d) -6.9 -6.4 -8.6 -6.1 -3.3 -3.1 -3.4 Structural budget balance (c) - -6.4 -8.6 -6.1 -3.9 -3.6 -3.4 General government gross debt (c) 109.1 107.8 108.5 107.5 104.6 100.9 97.6 (a) Eurostat definition. (b) gross saving divided by gross disposable income. (c) as a percentage of GDP. (d) Including proceeds relative to UMTS licences (see for more details note 10 on concepts and sources).
Public finances
The general government deficit outcome for 2006 was 2.6% of GDP, including one-off revenues of 0.6 percentage point of GDP. The latter is related to payments and deferred payments by banks in exchange of the assumption by social security of pension commitments. For 2007, the deficit should decline by ¼ percentage point of GDP to 2.4% of GDPii, including one-off revenues of ½ percentage point of GDP. The adjustment in 2007 is mainly expenditure-driven. Total expenditures are projected to decrease by around ½ percentage points of GDP, mainly driven by lower interest expenditure, public consumption and investment. The structural balance (i.e. the cyclically-adjusted balance net of one-offs) would improve by ¼% of GDP. Under the customary assumption of unchanged policies, the 2008 deficit would be about 2¾% of GDP. After reaching 104½% of GDP in 2006, the general government debt ratio is
projected to decrease to below 100% of GDP by 2008.
i This forecast is based on the old GDP series and not on the "revised" GDP data reported by the Greek authorities in the EDP notification tables in April 2007. Using the latter would lead to an upward revision of nominal GDP by around 26% per year. Given the magnitude and complexity of the revision, is still undergoing complete examination by Eurostat.
ii Should the Eurostat examination confirm in full the 26% upward revision of nominal GDP figures, the denominator effect of a higher GDP would reduce the deficit just below 2%. However, the concomitant revision of the gross national income (GNI) would lead to a permanent increase of Greece's contribution to the EU budget, as well as a one-off payment of arrears on such contribution that would accrue to the 2007 balance. According to preliminary estimates, this would result in a deficit close to, but below, 3% of GDP.

9. Spain Strong growth, high fiscal surpluses and rising external deficits
- 63 -
0
1
2
3
4
5
6
99 00 01 02 03 04 05 06 07 080
2
4
6
8
10
12
Current account balance (rhs) GDP growth
Forecast
yoy % ch. % of GDP
Graph 3.10: Spain - GDP growth and current account deficit
-1.5
-1.0
-0.5
0.0
0.5
1.0
1.5
2.0
99 00 01 02 03 04 05 06 07 0830
35
40
45
50
55
60
65
Net lending (+) /net borrowing (-) according to EDP definitionGross debt (rhs)
Forecast
Graph 3.11: Spain - General government accounts
% of GDP % of GDP
Activity in 2006
From 3½% in 2005, economic activity accelerated in 2006 to just below 4%. Growth was underpinned by dynamic domestic demand, while net exports continued to contribute negatively to growth, albeit by less than in the previous year. Private consumption remained robust, supported by strong job creation and by significant wealth effects. It grew above real disposable income, thus further lowering the households’ saving rate to around 10% in 2006, from 10½% in 2005. Gross fixed capital formation remained strong. Investment in construction grew at a similar rate as in 2005, and investment in equipment kept expanding at close to the two-digit mark. Domestic demand contributed around 4¾ percentage points to GDP growth in 2006.
Exports recorded a strong rebound during 2006, largely led by the recovery of activity in the euro area and grew by around 6%. Imports remained very dynamic but they did not accelerate substantially compared with 2005 and increased by 8½%. As a result, the negative contribution of net exports to growth declined from 1¾ percentage points recorded in 2005 to around 1 percentage point. The trade deficit widened to 8% of GDP by the end of the year from 7½% one year earlier.
Prospects for 2007 and 2008
In 2007, GDP growth is projected to slightly fall to 3¾%. Economic activity should still be based on buoyant domestic demand. Higher real interest rates should put some dampening impact on consumer demand and, therefore, private consumption would
continue to moderate in line with GDP growth. Less dynamic private consumption would imply a slight increase of the households' saving ratio to 10¼% of gross disposable income. Investment growth is projected to remain robust at around 6%. Residential construction growth is expected to slowdown and, as a result, households' debt increase should also decelerate, attaining 130% of annual gross disposable income. Overall, domestic demand is projected to contribute with 4¾ percentage points to GDP growth in 2007, marginally below the previous year.
Export growth might remain at around 6%, on the back of good prospects for the euro area economic activity. Import growth, although projected to slowdown in line with private consumption, should still increase well above GDP on the back of strong investment in equipment. Overall, the moderation of both imports and exports should broadly cancel out and, as a result, the negative contribution from net exports to GDP growth is projected to remain broadly unchanged at 1 percentage point, while the trade deficit should continue widening to 8½% of GDP.
GDP growth is projected to further slowdown in 2008 to just below 3½%. The increase of real interest rates between 2004 and 2006 should still weigh on private consumption and investment in dwellings. Thus, gross fixed capital formation growth is projected to decelerate due to a moderation of construction activity. Overall, domestic demand would still contribute to GDP growth by around 4½ percentage points.
The expected deceleration of domestic demand should

Economic forecast, spring 2007 Spain
- 64 -
continue moderating import growth to 7%. The slight slowdown of economic growth projected for the Spanish main trading partners in the euro area would affect exports, the growth of which might decline to 5½%, insufficient to compensate rising imports and, as a result, the trade deficit might pick up to nearly 9% of GDP. All in all, the negative contribution to GDP growth from the external sector should stabilize at around one percentage point.
Therefore, external imbalances should worsen over the forecasting horizon. On top of the expected widening of the trade deficit, the surplus recorded by services is expected to decline marginally. The projected rising deficit of the balance of primary incomes mainly reflects payments on cumulated Spanish external debt vis-à-vis its foreign lenders. The deficit in the balance of current transfers should increase on the back of larger remittances abroad by migrants. As the surplus of services would not offset anymore the aggregate deficits in the primary incomes and current transfers' accounts, the current account deficit is expected to be larger than the trade deficit and should rise to reach almost 10% of GDP in 2008. The net borrowing position vis-à-vis the rest of the world is projected slightly above 9% of GDP, on account of the expected reduction of EU transfers. Since there is no evidence supporting a rebound in foreign direct investment inflows, portfolio investments, mainly channelled by domestic financial institutions, should continue to represent the main source of financing for the external deficit in Spain.
There are risks to this scenario. Some of the current developments on households' indebtedness and external imbalances could finally put a brake to economic activity and, as a consequence, the slowdown in GDP growth might be stronger-than-projected. Specifically, higher household indebtedness increases their exposure to interest rate rises and unemployment developments. Furthermore, persistent inflation differentials with the euro area, coupled with slow productivity growth could lead to higher market share losses, lower-than-expected exports and higher external imbalances.
Nevertheless, the most recent coincident and leading indicators do not give support to a strong deceleration of economic activity in the short term. Additionally, in spite of the rising borrowing position of households, mortgage repayment failures remain at
the lowest historical level, underpinning the short-term solvency of the private banking system. Finally, while the external deficit is not projected to recede, the stock of debt of the country could approach 150% of GDP in 2008.
Labour market, costs and prices
Job creation is projected to remain healthy over the forecast period. In 2006, employment growth was robust above 3% (full time equivalent). Construction and services were again the main job sources, whereas in the manufacturing sector, employment broadly stagnant. As labour intensive sectors, such as housing, are expected to contribute to a lesser extent to an expansion of activity, lower employment dynamism is projected in 2007 and 2008, when jobs would be created at rates of about 2¾% and 2½% respectively. The unemployment rate should continue to fall over the forecast period, to around 7¾% of the labour force by 2008.
In 2006, inflation attained an annual average rate of 3½%, ¼ pp higher than in 2005. However, price pressures eased substantially in the second half of the year driven by lower oil prices. As a result, price increase bottomed out at 2¾% in December. The inflation differential with the euro area picked up to 1½pp for the year as a whole, although, following the inflation decline of the second half of the year, it narrowed to ¾% at the end of the year.
On an annual basis, HICP inflation is expected to ease to 2.4% in 2007, but to increase to 2.6% in 2008. The inflation differential with the euro area should remain stable at around ¾ of one percentage point over the forecasting horizon, mainly due to structural factors related to insufficient competition in certain sectors, such as utilities and services, coupled with indexation clauses and a bargaining system that does not take full account of productivity differentials across sectors.
Compensation of employees' growth is projected to moderate in 2007 and 2008, reflecting lower dynamism in employment creation. However, in 2007 real disposable income would increase slightly, from 3¼% in 2006 to 3¾% in 2007, due to both lower inflationary pressures and the reduction of the personal income tax. In 2008, real disposable income growth is projected to decline to 3%. Productivity growth for the economy as a whole should increase to around 1% per year, driven by an acceleration of

Chapter 3 Member States, Spain
- 65 -
Table 3.9 Main features of country forecast - SPAIN
2005 Annual percentage changebn Euro Curr. prices % GDP 92-02 2003 2004 2005 2006 2007 2008
GDP at previous year prices 905.5 100.0 2.9 3.0 3.2 3.5 3.9 3.7 3.4 Private consumption 524.1 57.9 2.7 2.8 4.2 4.2 3.7 3.5 3.3 Public consumption 162.6 18.0 3.1 4.8 6.3 4.8 4.4 4.6 4.8 Gross fixed capital formation 265.4 29.3 3.5 5.9 5.0 7.0 6.3 6.0 5.0 of which : equipment 63.8 7.0 3.7 4.1 4.4 9.0 9.7 9.9 7.7 Exports (goods and services) 231.0 25.5 8.9 3.7 4.1 1.5 6.2 5.8 5.4 Final demand 1185.1 130.9 4.0 3.8 4.7 4.3 4.9 4.7 4.3 Imports (goods and services) 279.6 30.9 8.4 6.2 9.6 7.0 8.4 7.6 7.0 GNI at previous year prices (GDP deflator) 892.1 98.5 2.8 3.4 3.1 3.5 3.8 3.7 3.4 Contribution to GDP growth : Domestic demand 3.0 4.0 4.9 5.2 4.8 4.7 4.3
Stockbuilding 0.0 -0.1 0.0 0.0 0.1 0.0 0.0Foreign balance -0.1 -0.8 -1.7 -1.7 -1.0 -0.9 -0.9
Employment 1.9 2.4 2.6 3.1 3.1 2.8 2.5 Unemployment rate (a) 15.0 11.1 10.6 9.2 8.6 8.1 7.8 Compensation of employees/f.t.e. 4.2 3.6 3.1 2.6 3.4 3.2 2.7 Real unit labour costs -0.7 -1.1 -1.5 -1.8 -1.1 -0.8 -1.1 Savings rate of households (b) - - 11.4 10.6 10.1 10.3 10.0 GDP deflator 3.9 4.1 4.0 4.1 3.8 3.1 2.9 Private consumption deflator 3.8 3.1 3.5 3.4 3.6 2.6 2.4 Harmonised index of consumer prices - 3.1 3.1 3.4 3.6 2.4 2.6 Trade balance (c) -4.0 -5.1 -6.3 -7.5 -8.1 -8.5 -8.7 Current account balance (c) -2.1 -4.0 -5.9 -7.5 -8.5 -9.1 -9.7 Net lending(+) or borrowing(-) vis-à-vis ROW (c) -1.2 -2.9 -4.8 -6.5 -7.7 -8.5 -9.1 General government balance (c)(d) -3.4 0.0 -0.2 1.1 1.8 1.4 1.2 Cyclically-adjusted budget balance (c)(d) -3.0 -0.1 0.1 1.6 2.3 1.8 1.7 Structural budget balance (c) - -0.1 0.1 1.6 2.3 1.8 1.7 General government gross debt (c) 59.1 48.8 46.2 43.2 39.9 37.0 34.6 (a) Eurostat definition. (b) gross saving divided by gross disposable income. (c) as a percentage of GDP. (d) Including proceeds relative to UMTS licences (see for more details note 10 on concepts and sources).
productivity in the manufacturing sector over the forecast horizon. However, unit labour costs would still grow above those of the euro area.
Public finances
In 2006, the general government surplus reached 1¾% of GDP. This is well above the target in the 2006 Budget Law (0.2% of GDP). Higher-than-expected revenues are behind the better result. In 2007, the Budget Law targets a surplus of ¾% of GDP compared to 1% of GDP assumed in the updated 2006 Stability Programme. However, due to somewhat conservative revenue projections, the final outcome could be close to 1½% of GDP. Specifically, revenues in 2007 would grow at around 7%, matching nominal GDP growth in spite of a reform of personal and corporate income taxes aiming at reducing tax rates. Regarding central government expenditure, the 2007 Budget Law gives priority to R&D, which is projected to grow in nominal terms by around 25%
(0.6% of GDP). Overall, total expenditures are projected to increase by around 7½%, thus above nominal GDP.
In 2008, based on the customary no-policy-change scenario, the general government surplus could narrow to just below 1¼% of GDP. Revenues are projected to grow at around 6½%, slightly below nominal GDP, reflecting fewer indirect taxes associated with lower dynamism of both private consumption and investment in dwellings. Total expenditures are assumed to follow previous trends and increase by around 7%.
Although primary surpluses should decline from 3¼% in 2006 to 2¾% in 2008, the debt-to-GDP ratio is projected to continue on a decreasing path, from 40% of GDP in 2006 to around 35% in 2008.

10. France GDP continues to grow close to its potential
- 66 -
-3%
-2%
-1%
0%
1%
2%
3%
4%
5%
6%
90 92 94 96 98 00 02 04 06 08
contribution of domestic demand to GDP growthGDP growth
Graph 3.12: France - GDP and domestic demand
50%
52%
54%
56%
58%
60%
62%
64%
66%
68%
98 99 00 01 02 03 04 05 06 07 08-4.5%
-4.0%
-3.5%
-3.0%
-2.5%
-2.0%
-1.5%
-1.0%
-0.5%
0.0%
Gross Debt (lhs) Debt threshold (60%)Deficit (rhs) Deficit threshold (3%)
Graph 3.13: France - General government gross debt and deficit
Activity in 2006
In 2006, economic growth gained momentum and real GDP grew by 2.0% in real terms, compared with 1.2% in 2005. This improvement largely stems from an expansion of domestic demand, while net exports contributed negatively to GDP growth by about 0.8 percentage points.
GDP growth was therefore still driven exclusively by domestic demand and especially by private consumption, which both rose by 2.6%. Private consumption continued to be driven by buoyant wage increases and favourable monetary and financial conditions. The past increase in minimum wages still supported wages in 2006, but this process is now completed. The recovery of employment also sustained households’ disposable income. Inflation was fairly moderate despite the surge in oil prices and also helped strengthen households' purchasing power. In a macroeconomic context still characterised by uncertainties, firms remained cautious with respect to their investment plans. Nevertheless, boosted by favourable financial conditions, construction accelerated in 2006. Exports were also on an upward trend as a result of the economic recovery in Europe. Nevertheless, in response to the robustness of final demand, net trade once again made a negative contribution to GDP growth, albeit by much less (-0.3%) than over the two previous years.
Prospects for 2007 and 2008
Real GDP growth is forecast to accelerate somewhat in 2007 and to reach its potential in 2008. Economic activity is expected to be largely driven by domestic demand, while the contribution of net exports to GDP growth will remain slightly negative.
Private consumption is forecast to be the main driving force of economic growth. Consumption will increase in line with households' disposable income, reflecting the expected rise in the demand for labour and cuts in personal income tax planned in 2007. The projected benign inflation outlook should also support households’ purchasing power.
Companies are likely to focus their efforts on cutting costs due to the strong past increase in input prices. But considering the fact that the capacity utilisation rate is now slightly above its long-term average and the need for some firms to upgrade and replace their capacity of production, investment in equipment is expected to accelerate from 3.5% in 2006 to around 5% in 2008. In addition, continuing supportive financial conditions and a still-robust economic outlook should lead firms to implement their investment plans. Although slightly less dynamic than in 2006, investment in construction is expected to remain robust over the forecast period.
Export volumes are projected to slow down in line with the downturn in external demand and the deterioration in price competitiveness linked to the past appreciation of the euro. Moreover, export growth will still be constrained by the unfavourable product and geographical specialisation. In this

Chapter 3 Member States, France
- 67 -
context, and given that imports are forecast to remain buoyant as a result of robust final demand, the external sector should again dampen GDP growth, albeit by much less than in previous years.
Labour markets, costs and prices
Despite modest GDP growth, employment showed encouraging signs in 2006 (+0.8%). The recovery of employment has been partly supported by the gradual implementation of the "emergency plan" which aims to facilitate recruitment by small companies and encourage people to return to work. In 2007 and in 2008, employment growth is set to be below 1% since the expected rebound of economic activity is rather modest and productivity growth should pick up modestly.
Given the still-high unemployment rate, wage moderation is expected to continue over the forecast horizon. In addition, the moderate underlying inflation and the slow recovery in employment should exert a dampening effect on wages. As productivity growth is expected to slightly increase over the next two years, unit labour costs increase should slow down to 1½% in 2007 and 2008. With second-round effects from high prices of raw materials having been contained up to now, prices of manufactured goods are expected to rise modestly. In view of the expected decrease in oil prices in the course of 2007, HICP inflation should drop to close to 1½% in 2007. In 2008, this tendency is likely to be reversed due to an expected increase in oil prices, though inflationary pressures should remain subdued due to the persistent negative output gap and HICP inflation should be slightly below 2% in 2008.
Public finances
Following a decline from 3.7% of GDP in 2004 to 3.0% of GDP in 2005, the general government deficit was further reduced to 2.5% in 2006, thanks to one-off revenues and higher-than-expected revenues. One-off revenues totalled 0.3% of GDP, in connection with the transfer to social security of pension commitments vis-à-vis postal sector employees (0.1% of GDP), the advanced collection of social contributions on specific saving plans (0.1% of GDP) and exceptional revenues from the extension of the December 2005 change in the corporate tax code to more firms (0.1% of GDP). The budgetary outturn also benefited from higher-than-expected revenues in connection with buoyant consumption (VAT) and higher corporate profits
(corporate tax), which resulted in an increase in the tax burden to 44.4% of GDP (from 43.8% in 2005) despite the implementation of tax cuts (increased employment premium, tax exemption for new investment, etc). The ratio of total revenues to GDP increased by 0.3 percentage point to 51.0% of GDP in 2006. On the expenditure side, the target was respected at the central government level but some slippages were recorded for health-care expenditure so that growth in total public expenditure overshot its official target, as it did also in connection with the continued rapid rise in local governments' expenditures. Still, the expenditure-to-GDP ratio decreased by 0.1 percentage point to 53.5% of GDP. The structural balance (the cyclically-adjusted-balance net of one-offs) improved by 1 pp.
The deficit forecast for 2007 of 2.4% of GDP incorporates the measures in the 2007 finance law, i.e. the income tax reductioni (0.2% of GDP), an increase in the employment premium and lower tax rates on new capital expenditure. Together with other small items, these measures will increase the deficit by about 0.4% of GDP. However, as revenues are expected to be strong – the tax-to-GDP elasticity will remain slightly above the historical average of 1 – the revenue-to-GDP ratio is forecast to only decrease by 0.2% of GDP. On the expenditure side, the expenditure-to-GDP ratio is projected to decrease by 0.4% of GDP. This stems from opposite movements. It includes the implementation of a stricter expenditure ceiling for the State as contained in the 2007 budget bill: after four years of zero growth in real terms, State expenditure is set to decrease by 1% in real terms (about -0.2% of GDP). Moreover, the budget bill foresees a reduction in the number of civil servants, which is expected to have a lasting positive impact on the deficit (about 0.03% of GDP) and thus help support the implementation of the new expenditure ceiling. A significant decrease in social expenditure is also foreseen notably thanks to the better employment performance. In contrast, expenditure from local administrations, which did not agree on any new expenditure rule and/or ceiling, contrary to what was announced earlier, are expected to continue growing, although at a less rapid pace. Concerning health-care expenditure, the annual increase in spending is projected to be slightly higher than that anticipated by the government (3% instead of 2.6%) on the basis of a prudent assessment of some of the measures announced in the 2007 draft budget

Economic forecast, spring 2007 France
- 68 -
Table 3.10 Main features of country forecast - FRANCE
2005 Annual percentage changebn Euro Curr. prices % GDP 92-02 2003 2004 2005 2006 2007 2008
GDP at previous year prices 1717.9 100.0 2.0 1.1 2.3 1.2 2.0 2.4 2.3 Private consumption 976.0 56.8 2.0 2.0 2.3 2.0 2.6 2.6 2.3 Public consumption 408.3 23.8 1.4 2.0 2.3 1.1 1.9 2.1 1.5 Gross fixed capital formation 336.6 19.6 1.8 2.2 3.0 3.6 3.7 3.7 3.4 of which : equipment 93.2 5.4 3.7 1.4 1.2 5.2 3.5 4.0 5.0 Exports (goods and services) 446.3 26.0 6.1 -1.2 3.9 3.1 6.0 5.5 5.6 Final demand 2179.1 126.8 2.6 1.1 3.2 2.2 3.1 3.2 3.1 Imports (goods and services) 462.6 26.9 5.5 1.1 6.6 6.1 6.7 6.0 5.6 GNI at previous year prices (GDP deflator) 1726.9 100.5 2.0 1.4 2.3 1.1 2.7 2.6 2.4 Contribution to GDP growth : Domestic demand 1.8 2.0 2.4 2.1 2.6 2.7 2.4
Stockbuilding 0.0 -0.3 0.6 -0.1 -0.2 -0.1 0.0Foreign balance 0.2 -0.6 -0.6 -0.8 -0.3 -0.2 -0.1
Employment 0.6 0.0 0.0 0.2 0.8 0.9 0.9 Unemployment rate (a) 10.4 9.4 9.6 9.7 9.4 8.9 8.5 Compensation of employees/f.t.e. 2.5 2.9 3.3 2.8 3.2 3.2 3.0 Real unit labour costs -0.3 -0.1 -0.6 0.0 0.1 -0.3 -0.2 Savings rate of households (b) - - 15.5 14.7 14.8 15.0 14.9 GDP deflator 1.5 1.9 1.7 1.9 2.0 1.9 1.8 Private consumption deflator 1.2 1.9 1.9 2.0 1.2 1.3 1.8 Harmonised index of consumer prices 1.7 2.2 2.3 1.9 1.9 1.5 1.7 Trade balance (c) 0.8 0.1 -0.4 -1.4 -2.2 -2.3 -2.3 Current account balance (c) 1.2 0.2 -0.6 -2.1 -2.0 -1.9 -1.8 Net lending(+) or borrowing(-) vis-à-vis ROW (c) 1.2 -0.2 -0.6 -2.1 -2.0 -1.9 -1.8 General government balance (c)(d) -3.4 -4.1 -3.6 -3.0 -2.5 -2.4 -1.9 Cyclically-adjusted budget balance (c)(d) -3.3 -4.1 -3.7 -2.6 -2.0 -2.0 -1.5 Structural budget balance (c) - -4.1 -3.7 -3.2 -2.3 -2.1 -1.5 General government gross debt (c) 54.0 62.4 64.3 66.2 63.9 62.9 61.9 (a) Eurostat definition. (b) gross saving divided by gross disposable income. (c) as a percentage of GDP. (d) Including proceeds relative to UMTS licences (see for more details note 10 on concepts and sources).
bill for the social security sector. In structural terms, the 2007 deficit forecast implies an improvement of 0.4% of GDPii.
The deficit forecast for 2008 of 1.9% of GDP follows the conventional assumption of unchanged policies. Notably, contrary to the official forecast, it does not include a stricter rule for State expenditure growth (-1.25% in real terms) but maintains the rule applied in 2007 (-1% in real terms). Also, it is based on no significant change for the health-care sector and projects a slowdown in local administration' investment in view of the usual slowdown in the year of local elections, although to a lesser extent than assumed by the official forecast.
After a rise in the debt-to-GDP ratio by nearly 2 percentage points to 66.2% of GDP in 2005, the government committed itself to reduce this ratio by 2% and 1% in 2006 and 2007 respectively. Based on the full allocation of privatisation receipts to debt
reduction (about 0.1% of GDP in 2006) and a better overall management of the debt (notably of the cash-flow) of the different general government entities, debt reduction objectives were achieved in 2006 and are forecast to be achieved in 2007. For 2008, the forecast includes EUR 7.5bn of privatisation receipts, i.e. the middle of the range presented in the latest update of the stability programme.
i The income tax reform reduces the number of income brackets and marginal tax rates, notably the highest, which is reduced from 48.9% to 40%. ii The reduction in the deficit includes 0.05% of GDP of one-off revenues in connection with a change in the corporate tax code and the advanced collection of social contribution on saving plans.
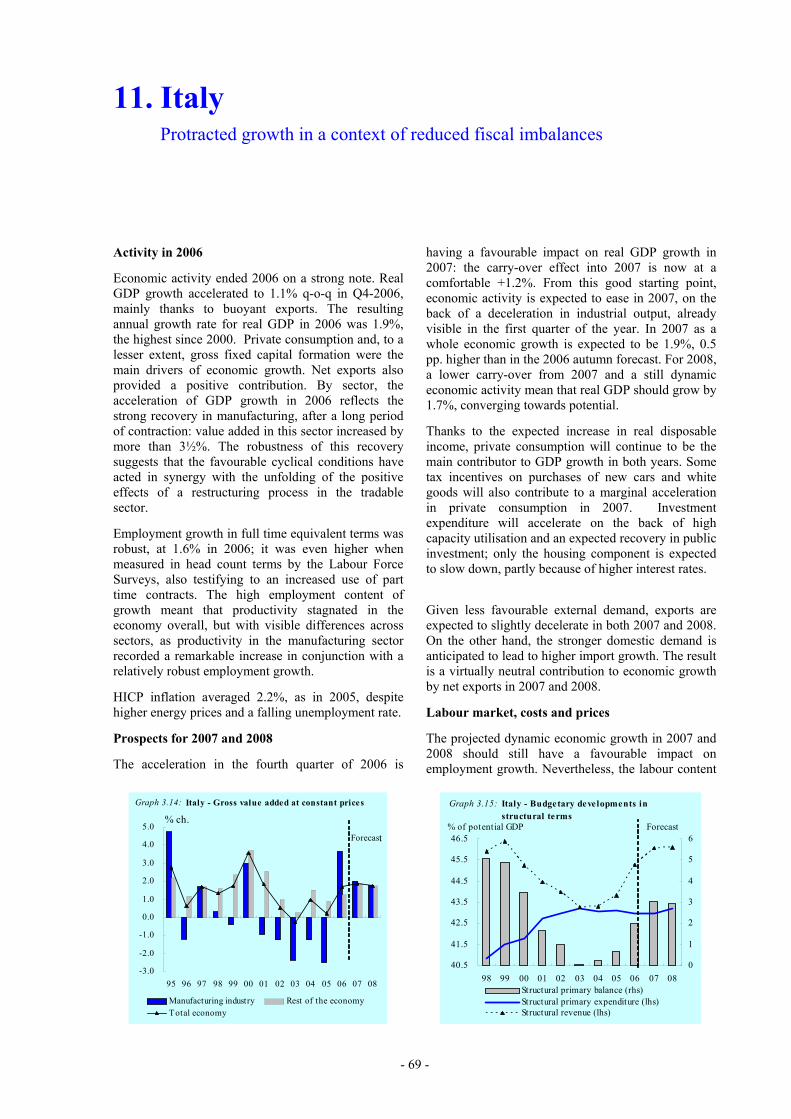
11. Italy Protracted growth in a context of reduced fiscal imbalances
- 69 -
-3.0
-2.0
-1.0
0.0
1.0
2.0
3.0
4.0
5.0
95 96 97 98 99 00 01 02 03 04 05 06 07 08
Manufacturing industry Rest of the economyTotal economy
Forecast
% ch.
Graph 3.14: Italy - Gross value added at constant prices
40.5
41.5
42.5
43.5
44.5
45.5
46.5
98 99 00 01 02 03 04 05 06 07 080
1
2
3
4
5
6
Structural primary balance (rhs)Structural primary expenditure (lhs)Structural revenue (lhs)
Forecast
Graph 3.15: Italy - Budgetary developments in structural terms% of potential GDP
Activity in 2006
Economic activity ended 2006 on a strong note. Real GDP growth accelerated to 1.1% q-o-q in Q4-2006, mainly thanks to buoyant exports. The resulting annual growth rate for real GDP in 2006 was 1.9%, the highest since 2000. Private consumption and, to a lesser extent, gross fixed capital formation were the main drivers of economic growth. Net exports also provided a positive contribution. By sector, the acceleration of GDP growth in 2006 reflects the strong recovery in manufacturing, after a long period of contraction: value added in this sector increased by more than 3½%. The robustness of this recovery suggests that the favourable cyclical conditions have acted in synergy with the unfolding of the positive effects of a restructuring process in the tradable sector.
Employment growth in full time equivalent terms was robust, at 1.6% in 2006; it was even higher when measured in head count terms by the Labour Force Surveys, also testifying to an increased use of part time contracts. The high employment content of growth meant that productivity stagnated in the economy overall, but with visible differences across sectors, as productivity in the manufacturing sector recorded a remarkable increase in conjunction with a relatively robust employment growth.
HICP inflation averaged 2.2%, as in 2005, despite higher energy prices and a falling unemployment rate.
Prospects for 2007 and 2008
The acceleration in the fourth quarter of 2006 is
having a favourable impact on real GDP growth in 2007: the carry-over effect into 2007 is now at a comfortable +1.2%. From this good starting point, economic activity is expected to ease in 2007, on the back of a deceleration in industrial output, already visible in the first quarter of the year. In 2007 as a whole economic growth is expected to be 1.9%, 0.5 pp. higher than in the 2006 autumn forecast. For 2008, a lower carry-over from 2007 and a still dynamic economic activity mean that real GDP should grow by 1.7%, converging towards potential.
Thanks to the expected increase in real disposable income, private consumption will continue to be the main contributor to GDP growth in both years. Some tax incentives on purchases of new cars and white goods will also contribute to a marginal acceleration in private consumption in 2007. Investment expenditure will accelerate on the back of high capacity utilisation and an expected recovery in public investment; only the housing component is expected to slow down, partly because of higher interest rates.
Given less favourable external demand, exports are expected to slightly decelerate in both 2007 and 2008. On the other hand, the stronger domestic demand is anticipated to lead to higher import growth. The result is a virtually neutral contribution to economic growth by net exports in 2007 and 2008.
Labour market, costs and prices
The projected dynamic economic growth in 2007 and 2008 should still have a favourable impact on employment growth. Nevertheless, the labour content

Economic forecast, spring 2007 Italy
- 70 -
of economic growth is expected to normalise at lower levels than in 2006. The unemployment rate is projected to continue decreasing to 6.6% in 2007 and 6.4% in 2008.
Labour productivity is forecast to increase by 1.0% in 2007 and 0.9% in 2008, values which, although not outstanding, represent a clear break compared to the stagnation recorded in the five-year period since 2000. Growth in compensation per employee in full time equivalent terms is expected to remain stable in 2007, in spite of higher social contribution rates for some categories of workers and the regularisation of undeclared work foreseen in the 2007 budget law, and to accelerate in 2008 due to scheduled contract renewals. However, higher labour productivity growth will result in a slowdown in the growth of unit labour costs, in particular in 2007. Firms will also benefit from the cut in the labour tax wedge through a reduction of the labour base of the regional tax on productive activity (IRAP) envisaged in the 2007 budget law. This will have a positive impact on the competitive position of the Italian economy and mitigate somewhat the pace of market share losses.
Moderate labour cost growth, together with decelerating import prices and the effects of the adopted liberalisation measures will help reduce HICP inflation to 1.9% in 2007. A slight acceleration of inflation, to 2%, is expected for 2008 on the back of higher production and energy costs.
Public finances
The deficit increased to 4.4% of GDP in 2006, up from 4.2% of GDP in 2005. However, this is a clearly better outturn than the 5.7% deficit that was projected in the stability programme 2006 update. The primary surplus decreased to 0.1% of GDP. Buoyant revenue partly offset the significant deficit-increasing impact of the ruling issued in September 2006 by the European Court of Justice (ECJ) against Italy's VAT regime for company cars. The latter implied additional expenditure officially estimated at 1.1% of GDP, due to the refunding of unduly paid VAT over the 2003 September 2006 period (of which ¾% of GDP relating to the years 2003 to 2005 is considered to be one off), as well as a future permanent reduction in VAT revenue. The cancellation of the railway company's debt related to the high speed project (Ferrovie dello Stato – RFI/TAV) added another 0.9% of GDP of one-off capital expenditure.
Overall, the net budgetary impact of one-off and temporary measures in 2006 increased the deficit by 1¼% of GDP, as temporary revenues from taxes on the revaluation of companies' assets and proceeds from the sale of real estate partly offset the above mentioned deficit-increasing one off capital expenditure. The structural deficit (defined as the cyclically-adjusted deficit net of one off and temporary measures) improved by 1¼% of GDP relative to 2005.
The December 2006 update of Italy's stability programme projected a reduction in the deficit to 2.8% of GDP in 2007. In the light of the positive economic and budgetary developments, a new report published on 16 March 2007 revised the official forecast for the 2007 deficit downwards to 2.3% of GDP. This result would be achieved also thanks to (i) around ½% of GDP deficit-reducing measures adopted at the end of June 2006; (ii) about ¼% of GDP in additional direct taxes compensating for the permanent loss in VAT revenues linked to the ECJ ruling; and (iii) the measures adopted with the 2007 budget law, approved by Parliament on 27 December 2006, and its accompanying legislation, whose net impact is officially estimated at around 1% of GDP. The budgetary correction is essentially revenue based.
The 2007 deficit is forecast at 2.1% of GDP, with a primary surplus at 2.7% of GDP. Higher interest rates imply a rise in the interest expenditure share by more than 0.1 pp. of GDP. The structural budget balance is forecast to improve by about 1% of GDP in 2007, of which one third is expected to result from the transfer of the severance pay scheme (TFR) flows to the social security institution (INPS), a measure that does not improve public finance sustainability. Over 2006- 2007, the overall structural adjustment will exceed 2% of GDP, above the 1.6% required in the Council's Article 104(7) recommendation of July 2005.
Starting from the better-than-expected base following the 2006 budgetary outturn, this forecast does not incorporate the full and effective implementation of some measures in the 2007 budget. On the revenue side, this is notably the case for the measures aimed at fighting tax evasion/elusion. Moreover, the planned harmonisation of taxation of financial assets has been postponed. On the expenditure side, the planned cuts do not seem entirely achievable. In particular, savings in health care expenditure are not fully taken into

Chapter 3 Member States, Italy
- 71 -
Table 3.11 Main features of country forecast - ITALY
2005 Annual percentage changebn Euro Curr. prices % GDP 92-02 2003 2004 2005 2006 2007 2008
GDP at constant prices 1423.0 100.0 1.5 0.0 1.2 0.1 1.9 1.9 1.7 Private consumption 839.7 59.0 1.3 1.0 0.7 0.6 1.5 1.7 1.7 Public consumption 290.6 20.4 0.4 2.0 1.6 1.5 -0.3 0.6 1.3 Gross fixed capital formation 292.6 20.6 1.6 -1.7 1.6 -0.5 2.3 3.1 2.5 of which : equipment 120.8 8.5 2.4 -5.8 2.3 -0.8 2.3 3.8 3.5 Exports (goods and services) 370.7 26.1 4.1 -2.4 3.3 -0.5 5.3 4.9 4.5 Final demand 1794.8 126.1 1.8 0.2 1.5 0.2 2.4 2.5 2.4 Imports (goods and services) 371.8 26.1 3.1 0.8 2.7 0.5 4.3 4.6 4.5 GNI at constant prices (GDP deflator) 1416.8 99.6 1.6 0.0 1.5 0.2 2.0 1.8 1.7 Contribution to GDP growth : Domestic demand 1.2 0.6 1.1 0.6 1.3 1.8 1.8
Stockbuilding 0.1 0.2 0.0 -0.2 0.3 0.0 0.0Foreign balance 0.2 -0.8 0.2 -0.3 0.3 0.1 0.0
Employment 0.2 0.6 0.4 -0.2 1.6 0.9 0.8 Unemployment rate (a) 10.3 8.4 8.0 7.7 6.8 6.6 6.4 Compensation of employees/f.t.e. 3.4 3.7 3.3 3.1 2.5 2.5 3.3 Real unit labour costs -1.2 1.2 -0.4 0.5 0.5 -0.5 0.1 Savings rate of households (b) - - 16.4 16.5 16.1 16.1 16.4 GDP deflator 3.3 3.1 2.9 2.2 1.8 2.1 2.2 Private consumption deflator 3.7 2.8 2.6 2.4 2.7 2.0 2.1 Harmonised index of consumer prices 3.3 2.8 2.3 2.2 2.2 1.9 2.0 Trade balance (c) 2.3 0.7 0.6 0.0 -0.7 -0.3 -0.3 Current account balance (c) 1.0 -0.9 -0.5 -1.2 -2.0 -1.7 -1.7 Net lending(+) or borrowing(-) vis-à-vis ROW (c) 1.1 -0.7 -0.4 -1.1 -1.8 -1.5 -1.5 General government balance (c)(d) -5.0 -3.5 -3.5 -4.2 -4.4 -2.1 -2.2 Cyclically-adjusted budget balance (c)(d) -5.0 -3.4 -3.2 -3.4 -3.8 -1.6 -1.8 Structural budget balance (c) - -5.1 -4.5 -3.9 -2.6 -1.6 -1.8 General government gross debt (c) 114.0 104.3 103.8 106.2 106.8 105.0 103.1 (a) Eurostat definition. (b) gross saving divided by gross disposable income. (c) as a percentage of GDP. (d) Including proceeds relative to UMTS licences (see for more details note 10 on concepts and sources).
account in the forecast, also due to the relaxation of some relevant budgetary provisions.
Risks are on both sides. On the one hand, the mechanisms to curb expenditure foreseen in the present and previous budgets and the measures to fight tax evasion/elusion could prove more effective than assumed. On the other hand, the current financial needs of the publicly-owned companies might call for additional transfers from the government. In addition, there are strong pressures to redistribute already in 2007 part of the tax windfalls recorded in 2006, even though Italy is still a long way away from the medium-term objective of a balanced budget that is needed to reduce the very high debt ratio at a fast pace before the budgetary impact of ageing. Finally, the size of additional revenues stemming from the above mentioned TFR diversion to INPS is subject to considerable uncertainty in both directions.
The 2008 deficit forecast at 2.2% of GDP is based on
the customary no-policy-change assumption. It includes the effects of the agreement recently reached with the unions on public sector wages.
The government debt increased to 106.8% of GDP in 2006, from 106.2% in 2005, due, inter alia, to the accumulation of deposits to finance the future cash disbursements related to the ECJ ruling on VAT. The debt ratio is expected to decline to 105% in 2007 and, assuming unchanged policy, to continue diminishing in 2008.

12. Cyprus Stable growth and inflation contained
- 72 -
-7-6-5-4-3-2-1012
98 99 00 01 02 03 04 05 06 07 08
55
60
65
70
75
Deficit: gen.gov.Deficit excl. interest: gen. gov.Cyclically-adj. balanceConsolidated gross debt
Forecast
% of GDP
Graph 3.16: Cyprus - Net lending & consolidated gross debt
Activity in 2006
Economic activity remained strong in 2006, posting a real GDP growth rate of 3.8%, unchanged with respect to 2005, and mainly driven by strong domestic demand. Although slightly decelerating compared with last year, private consumption remained strong supported by historically low interest rates and sustained credit expansion, as well as by continued employment and wage growth. In parallel, buoyant private investment in construction, and a rebound in equipment accelerated growth in investment to 5¼%. Overall, domestic demand is estimated to have contributed just above 4 percentage points to GDP growth, which was only marginally offset by a negative contribution of net exports. Reflecting weak re-export activity, exports of goods fell substantially in comparison with the past two years. Concurrently, export-oriented services have benefited from the positive outlook in the main export markets, while revenue growth from tourism decelerated. Total exports are now estimated to have grown by just above 2% in real terms, at the same rate estimated for total imports, with the latter being dragged by the poor re-export performance.
Prospects for 2007 and 2008
GDP is projected to continue growing solidly at 3.8% in 2007 and 3.9% in 2008, still driven by domestic demand, which would contribute around 4 percentage points to GDP growth. Increasing disposable income, supported by sustained wage and employment growth, will keep private consumption growing at still high rates, albeit lower than this year on account of rising
interest rate expectations. Investment should remain robust and continue growing just below 5% per year until 2008. This expansion of investment will be mainly driven by construction, underpinned by a strong demand for dwellings by non-residents and by other large infrastructure projects. Furthermore, confidence effects linked to the prospects of joining the euro area should also sustain total investment through higher investment in machinery and equipment. Although the projected deceleration in private consumption should have a moderating impact on imports, higher investment in equipment should keep imports growing at high rates until 2008. Nonetheless, based on a stronger growth outlook for the EU and Cyprus’ other main trading partners, exports should accelerate; especially exports of business and financial services, tourism, and re-exports of goods. As a result, the net borrowing vis-à-vis the rest of the world is projected to inch down to 5¼% of GDP by 2008.
Labour market, costs and prices
Labour market conditions remained tight, at nearly full employment, with unemployment at around 4¾%. In line with buoyant economic activity, employment will continue growing at around 1½% per year until 2008. However, higher participation would keep the unemployment rate around its current level. Higher participation by foreign workers, combined with moderate wage growth in the public sector, should also keep wage pressures relatively contained, in spite of tight labour market conditions. Since productivity growth is expected to rise by just above 2½% by 2008, unit labour costs will rise, but at lower rates than in the recent past.
Following closely the developments in the oil markets, i.e. the price hike at the beginning of the year and the lower oil prices in the second half, average HICP inflation in 2006 was 2.2%. Due to oil price base effects and the reduction in car excises enacted in October 2006, overall HICP inflation is expected to moderate to 1.3% in 2007 before picking up to 2% in 2008 against the background of buoyant domestic demand. This projection does not take account of the impact on the inflation and the budget of VAT increases in foodstuff, pharmaceuticals and restaurants required to comply with the Community acquis, since their precise timing and implementation modalities are not yet known. The resulting total

Chapter 3 Member States, Cyprus
- 73 -
Table 3.12 Main features of country forecast - CYPRUS
2005 Annual percentage changemio CYP Curr. prices % GDP 92-02 2003 2004 2005 2006 2007 2008
GDP at constant prices 7861.5 100.0 4.6 1.8 4.2 3.9 3.8 3.8 3.9 Private consumption 5116.1 65.1 - 2.0 6.3 4.7 4.0 3.5 3.5 Public consumption 1420.5 18.1 - 6.0 -5.5 3.4 2.4 3.5 3.9 Gross fixed capital formation 1486.9 18.9 - 1.2 10.0 2.7 5.2 4.8 4.8 of which : equipment 409.3 5.2 - -13.0 10.3 -5.1 7.9 6.0 6.0 Exports (goods and services) 3808.0 48.4 - -0.7 5.1 4.7 2.1 4.0 4.0 Final demand 11871.0 151.0 - 0.8 6.0 3.6 3.2 3.7 3.9 Imports (goods and services) 4009.4 51.0 - -1.0 9.6 3.1 2.2 3.6 3.9 GNI at constant prices (GDP deflator) 7602.7 96.7 4.5 3.0 2.3 4.7 3.8 4.1 4.1 Contribution to GDP growth : Domestic demand - 2.6 4.8 4.2 4.1 3.8 3.9
Stockbuilding - -0.9 1.8 -1.0 -0.2 -0.2 0.0Foreign balance - 0.1 -2.2 0.7 -0.1 0.1 0.0
Employment - 3.8 3.8 3.6 1.5 1.5 1.5 Unemployment rate (a) - 4.1 4.6 5.2 4.7 4.8 4.8 Compensation of employees/head - 7.4 2.0 1.6 3.5 3.5 3.5 Real unit labour costs - 4.2 -1.7 -1.1 -1.4 -1.0 -1.2 Savings rate of households (b) - - - - - - - GDP deflator 3.1 5.1 3.3 2.4 2.6 2.3 2.3 Private consumption deflator - 4.0 1.9 2.7 2.6 1.9 2.4 Harmonised index of consumer prices - 4.0 1.9 2.0 2.2 1.3 2.0 Trade balance (c) - -23.9 -25.6 -25.0 -27.0 -26.8 -26.6 Current account balance (c) - -2.2 -5.0 -5.6 -5.9 -5.6 -5.4 Net lending(+) or borrowing(-) vis-à-vis ROW (c) - - - - -5.6 -5.4 -5.2 General government balance (c)(d) - -6.3 -4.1 -2.3 -1.5 -1.4 -1.4 Cyclically-adjusted budget balance (c)(d) - -6.1 -3.8 -1.9 -1.2 -1.1 -1.1 Structural budget balance (c) - -7.9 -4.8 -2.8 -1.2 -1.1 -1.1 General government gross debt (c) - 69.1 70.3 69.2 65.3 61.5 54.8 (a) Eurostat definition. (b) gross saving divided by gross disposable income. (c) as a percentage of GDP. (d) Including proceeds relative to UMTS licences (see for more details note 10 on concepts and sources).
cumulated increase in HICP inflation is estimated at around one percentage point.
Public finances
The general government deficit for 2006 is estimated at 1½% of GDP, about ½ percentage point of GDP lower than the target in the Budget Law. The initially budgeted ¼% of GDP from temporary revenues from building permits has not materialised, but this was more than compensated by higher-than-expected tax revenues associated with the buoyant performance of the real estate sector as well as improved tax administration and collection. The structural balance (the cyclically-adjusted balance net of one-offs) improved by around 1¾% of GDP in 2006. The 2007 Budget Law targets a deficit of just above 1½% of GDP. No one-off measures are planned. The fiscal adjustment is still mainly driven by tax revenues, partially offset by the reduction of EU funds. Total revenues are projected to rise by almost ¼% of GDP.
However, expenditures will remain unchanged in terms of GDP, as the reduction in the interest payments is offset by higher social transfers. The Commission services project an almost unchanged deficit (1½% of GDP), despite the better-than-anticipated outturn for 2006, to account for the announced package of social transfers amounting to about ¼% of GDP. In structural terms, the fiscal adjustment in 2007 is expected to be marginal, which would correspond to a broadly neutral fiscal stance. This also reflects the deterioration of Cyprus’ net position vis-à-vis the EU budget as temporary compensating grants associated with EU accession came to an end in 2006, and are only partially compensated in the 2007 budget. In 2008, on a no-policy-change basis, the deficit is projected to inch down to slightly below 1½% of GDP. The debt-to-GDP ratio is projected to keep on a decreasing path, attaining about 55% by 2008, driven by the planned reduction of deposits with the central bank.

13. Latvia Booming domestic demand deepens external imbalances
- 74 -
-4
0
4
8
12
16
20
99 00 01 02 03 04 05 06 07 08-2
0
2
4
6
8
10
Output gap (rhs) HICP ULC
Graph 3.17: Latvia - Inflation, unit labour cost and output gap
yoy % ch. % of potential GDP
Activity in 2006
In 2006, real GDP growth reached 11.9%, which is by far the fastest growth since Latvia regained independence and is also the highest GDP growth in the EU. Growth was driven by private consumption and investment and the economy showed clear signs of overheating. The supply side struggled to keep up with the extraordinary increase in demand stemming from high growth in private lending, rapid wage development and strong consumer confidence. Accordingly, net exports absorbed a large share of the increase in domestic demand.
On the production side, GDP growth was strongest in sectors satisfying domestic demand. The highest growth rates were registered in the two largest sectors of real estate, renting and business activities (18%) and retail and wholesale (17%). Hotels and restaurants and construction (both 14%) also outperformed the average. Manufacturing output rose by 6.2%, unchanged from average annual growth in the 2003-2005 period.
Export growth declined in 2006, mainly due to the negative development in two commodity product groups (mineral and wood products). On the other hand, imports increased at an unprecedentedly fast pace, due to the huge increase in domestic demand. Nevertheless, the sharp deterioration in the current account deficit to more than 20% of GDP was caused not only by the worsening trade balance, but also by weak performance of almost all other current account items. On the positive side, net FDI inflows increased substantially to around 7% of GDP, though inflows
were predominantly into financial intermediation, real estate, renting and business activities rather than in sectors which would expand the tradeable capacity.
Prospects for 2007 and 2008
Growth will remain robust in 2007 and 2008 with overheating remaining the greatest challenge. Final domestic demand led by investment is expected to continue to drive overall growth. Private consumption should grow robustly, given significant wage and employment growth. Investment is likely to regain its position as the fastest growing component, supported by a substantial increase in EU-funds. However, the economy is expected to slowly lose momentum as the growth of domestic demand moderates. The departure of real estate prices from levels substantiated by realistic long-term local income potential increases the risks in purchasing real estate properties and borrowing against their value. Similarly, private consumption should lose some of its steam as the debt level of households is approaching critical limits. Measures announced in March 2007 in the government's plan to combat inflation should facilitate a stabilisation. These measures should help to reduce price increases already in the short run and taken together with an expected catch-up on the supply side should lead to a normalization of the real estate market. The plan is also likely to impact on consumer confidence by raising awareness of the risks of indebtedness and moderate the fiscal impulse in domestic demand.
However, the slow return to a more sustainable development path will not produce an immediate relief for the external balance. The current account deficit will remain extremely high in 2007-2008, with the deficit in the goods and services balance set to stay around 20% of GDP and the large external debt continuing to increase.
Labour market, costs and prices
High economic growth in 2006 was made possible by an unexpected 4.6% increase in employment which was coming from a large increase in the activity rate and a pronounced reduction in unemployment. Trade and manufacturing registered the highest employment growth. Although employment growth is expected to remain significant in 2007-2008, it is constrained by an already high activity rate, low regional mobility

Chapter 3 Member States, Latvia
- 75 -
Table 3.13 Main features of country forecast - LATVIA
2005 Annual percentage changemio LVL Curr. prices % GDP 92-02 2003 2004 2005 2006 2007 2008
GDP at constant prices 9058.9 100.0 -0.8 7.2 8.7 10.6 11.9 9.6 7.9 Private consumption 5666.1 62.5 - 8.2 9.5 11.5 19.8 12.0 8.0 Public consumption 1580.8 17.4 - 1.9 2.1 2.7 4.0 3.0 3.0 Gross fixed capital formation 2773.8 30.6 - 12.3 23.8 23.6 18.3 14.0 9.0 of which : equipment - - - - - - - - - Exports (goods and services) 4334.7 47.8 - 5.2 9.4 20.3 5.3 8.7 9.0 Final demand 14696.7 162.2 - 9.2 11.4 12.1 14.0 10.8 8.1 Imports (goods and services) 5637.8 62.2 - 13.1 16.6 14.8 17.5 12.6 8.4 GNI at constant prices (GDP deflator) 8937.3 98.7 -0.9 6.5 6.6 11.6 10.2 9.0 7.3 Contribution to GDP growth : Domestic demand - 8.8 13.0 15.2 19.8 13.9 9.5
Stockbuilding - 2.9 0.7 -4.4 0.2 0.0 0.0Foreign balance - -4.5 -5.1 -0.2 -8.1 -4.3 -1.7
Employment -3.2 1.7 1.1 1.7 4.6 1.4 0.9 Unemployment rate (a) 13.7 10.5 10.4 8.9 6.8 6.3 6.0 Compensation of employees/head - 11.3 14.3 25.5 21.7 18.0 15.0 Real unit labour costs - 2.0 -0.6 4.8 2.4 -1.9 -1.6 Savings rate of households (b) - - - - - - - GDP deflator 39.6 3.6 7.0 10.2 11.1 11.2 9.3 Private consumption deflator - 3.1 7.0 8.7 8.3 8.0 6.5 Harmonised index of consumer prices - 2.9 6.2 6.9 6.6 7.2 6.2 Trade balance (c) -11.4 -17.8 -20.2 -18.9 -24.4 -24.7 -22.6 Current account balance (c) -1.2 -8.2 -12.9 -12.6 -21.1 -22.4 -21.0 Net lending(+) or borrowing(-) vis-à-vis ROW (c) 1.7 -7.5 -11.9 -11.2 -20.0 -20.3 -18.7 General government balance (c)(d) - -1.6 -1.0 -0.2 0.4 0.2 0.1 Cyclically-adjusted budget balance (c)(d) - -1.3 -0.7 -0.2 0.0 0.0 0.4 Structural budget balance (c) - -1.3 -0.7 -0.2 0.0 0.0 0.4 General government gross debt (c) - 14.4 14.5 12.0 10.0 8.0 6.7 (a) Eurostat definition. (b) gross saving divided by gross disposable income. (c) as a percentage of GDP. (d) Including proceeds relative to UMTS licences (see for more details note 10 on concepts and sources).
and high emigration. Unemployment is expected to decrease further, reaching 6% by 2008.
Wage growth is poised to remain high throughout the forecast period, but is expected to moderate as the government plans to restrict public sector wages and as overheating eases in the economy. Nominal unit labour costs increased by over 13% in 2006, and wage developments are likely to weaken further external competitiveness.
HICP inflation has risen since October 2006 and reached 8.5% in March, despite a VAT reduction in January 2007 on some products and services. Core inflation has also picked up, as a possible consequence of overheating, quickly approaching the headline figure. In this situation, the planned energy tariff and other regulated price increases plus the scheduled excise tax harmonization with the EU will probably push the annual average inflation in 2007 well above the level of the previous year. Inflation in
2008 is likely to stay slightly above 6%, due to strong domestic demand, base effects from 2007 and a large increase in the excise duty on tobacco products.
Public finances
The fiscal outturn for 2006 is estimated to be a surplus of around ½% of GDP, better than expected due to higher than expected tax revenues. Budget revenues are set to continue to increase robustly over the forecast period, given the outlook for domestic demand. Taking account of tighter fiscal goals set in March, marginal surpluses are foreseen in 2007 and 2008. In 2007 this outlook assumes the absence of spending all additional revenues in an autumn supplementary budget (a break with recent practice). The foreseen lower expenditure base for 2007, relative to earlier expectations, should then contribute to a stronger 2008 outturn. Government debt is projected to drop well below 10% of GDP by the end of the forecast period.

14. Lithuania Inflationary pressures and worsening external balance
- 76 -
-15
-10
-5
0
5
10
15
20
00 01 02 03 04 05 06 07 08-9
-6
-3
0
3
6
9
12
GDP growth (rhs)External balance (% of GDP)Unemployment rateInflation (rhs)
Graph 3.18: Lithuania - GDP growth, unemployment rate, HICP inflation and external balance
yoy % ch.%
Activity in 2006
In 2006, economic activity maintained its momentum with real GDP growth reaching 7.5%, domestic demand remaining the driver for growth. However, disruption of crude oil supply by pipeline and an accident in the oil-refining industry led to some deceleration in industrial output and export dynamics at the end of the year.
Investment provided a further impetus to the economy and grew overall by just under 12%. Private consumption accelerated to 13½%, stimulated by an increase in household disposable income following the cut in the personal income tax rate in July 2006, rapid expansion of credit, extensive wage growth and increasing employment. However, the fast pace of domestic growth contributed to the fast-growing external deficit. Net borrowing vis-à-vis the rest of the world widened to 9.5% of GDP compared to just under 6% in 2005, due to a higher merchandise trade deficit, a lower services surplus and a worsening of the income balance, while net current and capital transfers, mainly due to EU funds and workers' remittances, exerted a moderating influence.
Prospects for 2007 and 2008
Over the forecast period, the outlook for growth remains favourable. Real GDP growth is projected to slow somewhat but should still remain above 7% in 2007 and 6% in 2008. Domestic demand should continue to be the growth engine while the external contribution stays negative. Delays in restoring oil refinery capacity and the continuing disruption of oil supply pose some downward risk to industrial output
in 2007. There are also signs that this disruption could become permanent and supply not be restored.
Investment activity is forecast to remain strong. Some moderation of credit growth could contribute to a cooling of the housing market, but new opportunities for construction should occur in infrastructure projects and in the non-residential sector.
Private consumption growth is forecast to remain high, buoyed by high wage growth, higher amounts paid in March 2007 as compensation for earlier savings losses during the shift from the Russian rouble to the national currency and a further cut in personal income tax in January 2008.
The outlook for exports should stay benign, reflecting positive prospects for Lithuania's major trading partners, with probably expanding opportunities in the eastern neighbouring countries, while import growth is forecast to remain robust on the back of strong domestic demand. A widening trade deficit will result in net borrowing vis-à-vis the rest of the world widening to around 11-12% of GDP. Positive effects should come from EU funds (depending on the absorption rate) and from an expected increase in expatriate remittances.
Labour market, costs and prices
The labour market tightened rapidly in 2006. The labour force declined, partly reflecting emigration flows, while shortages in several sectors created upward pressures on labour costs. Employment growth picked up, while the unemployment rate declined markedly, to just below 6% from 8.3% in 2005. Structural unemployment ameliorated, as long-term unemployment nearly halved.
Looking forward, the labour market is likely to tighten further and nominal wage growth is expected to remain high. Employment growth is expected to remain positive although somewhat lower than in 2006, reflecting tightening supply conditions. Unemployment is expected to continue to decrease, although at a slower pace, and to stabilise at below 5%. Against this background, labour costs are increasing at a relatively fast rate.
Annual average HICP inflation accelerated to 3.8% in 2006, mostly reflecting rising prices for utilities (heating and energy), food, healthcare and service prices. Core inflation rose. Lithuania's sole gas

Chapter 3 Member States, Lithuania
- 77 -
Table 3.14 Main features of country forecast - LITHUANIA
2005 Annual percentage changebn LTL Curr. prices % GDP 92-02 2003 2004 2005 2006 2007 2008
GDP at constant prices 71.2 100.0 -1.1 10.3 7.3 7.6 7.5 7.3 6.3 Private consumption 46.5 65.3 - 10.2 12.2 9.8 13.6 12.3 9.1 Public consumption 11.9 16.7 - 3.8 7.7 4.9 7.3 6.3 5.5 Gross fixed capital formation 15.9 22.4 - 14.1 15.5 9.2 11.9 10.6 9.1 of which : equipment 6.1 8.5 - 7.5 31.9 9.2 10.8 10.0 9.5 Exports (goods and services) 41.5 58.3 - 6.9 4.4 14.5 15.4 10.2 11.1 Final demand 117.7 165.3 - 10.3 10.1 10.7 10.2 10.4 9.1 Imports (goods and services) 46.5 65.3 - 10.4 14.9 16.0 15.4 14.9 12.9 GNI at constant prices (GDP deflator) 70.1 98.4 - 8.7 7.7 8.2 6.6 7.2 6.0 Contribution to GDP growth : Domestic demand - 10.3 13.0 9.7 13.3 11.7 9.3
Stockbuilding - 2.6 1.1 0.2 -4.2 0.0 -0.3Foreign balance - -2.4 -6.3 -2.0 -1.1 -4.3 -2.7
Employment -1.8 2.2 0.0 2.5 1.7 0.7 0.1 Unemployment rate (a) 9.5 12.4 11.4 8.3 5.6 4.8 4.3 Compensation of employees/head - 8.9 10.9 8.5 13.4 15.1 11.0 Real unit labour costs - 1.9 0.7 -2.3 0.2 2.8 0.0 Savings rate of households (b) - - - - - - - GDP deflator 56.7 -0.9 2.7 5.8 7.1 5.1 4.5 Private consumption deflator - -0.9 -0.3 3.7 2.4 3.8 3.5 Harmonised index of consumer prices - -1.1 1.2 2.7 3.8 4.7 4.4 Trade balance (c) - -9.0 -10.6 -11.1 -13.9 -15.8 -16.7 Current account balance (c) - -6.8 -7.5 -6.9 -10.7 -12.4 -13.4 Net lending(+) or borrowing(-) vis-à-vis ROW (c) - -6.4 -6.8 -5.9 -9.5 -11.1 -12.1 General government balance (c)(d) - -1.3 -1.5 -0.5 -0.3 -0.4 -1.0 Cyclically-adjusted budget balance (c)(d) - -1.8 -2.0 -0.9 -0.6 -0.6 -1.0 Structural budget balance (c) - -1.8 -2.0 -0.9 -0.6 -0.6 -1.0 General government gross debt (c) - 21.2 19.4 18.6 18.2 18.6 19.9 (a) Eurostat definition. (b) gross saving divided by gross disposable income. (c) as a percentage of GDP. (d) Including proceeds relative to UMTS licences (see for more details note 10 on concepts and sources).
supplier increased wholesale gas prices in July 2006 and again in January 2007, resulting in price levels about 60% above those of 2005, and thus increasing the price of gas supplied to Lithuania towards the level of Western Europe. Regulated prices for heating have not yet been fully adjusted to reflect the higher gas prices and thus the main impact on consumer prices and possible second-round effects have yet to be registered. Electricity prices rose at the beginning of 2007 (by 7%). An increase of the excise duties on tobacco and fuel in March 2007 also add to inflation, while the favourable evolution of oil prices could ease inflationary pressure somewhat. Against this background, annual average inflation in 2007 is projected to rise to above 4½% in 2007. In 2008, inflation is expected to ease only slightly because of a new round of administered price increases, higher excise duties and an expected further gas price increase at the beginning of 2008, as well as the process of continued convergence to EU price levels and higher cost pressures, especially in the services
sector. Core inflation is expected to continue to rise.
Public finances
In 2006, the general government deficit was 0.3% of GDP, lower than the initial government target of 1.4%. Exceptionally good revenues, largely from improved revenues from tax on land and inheritance, but also personal and corporate income tax helped to reduce the deficit. The expected stronger outturn occurred despite the supplementary budget adopted in July 2006 which increased government expenditure by around ½% of GDP. The deficit is forecast to remain similar in 2007 and then to widen in 2008, mainly due to tax and pension reforms (including the cut in personal income tax from 2008 noted above) and higher primary spending, partly offset by improved tax collection, particularly of VAT and property taxes, and higher excise taxes. The general government debt-to-GDP ratio is expected to remain broadly stable at slightly below 20% of GDP.

15. Luxembourg Strong growth in 2006, mild slowdown in 2007 and 2008
- 78 -
01
23
45
67
89
96 98 00 02 04 06 08
employment real GDP growth
% ch.
Forecast
Graph 3.19: Luxembourg - Employment and GDP growth
Activity in 2006
GDP growth accelerated in the course of 2006 and reached 6.2% over the year, up from 4% in 2005. Final domestic demand remained rather dynamic: private consumption grew at about 4%, boosted by strong employment growth and, linked to it, the considerable rise in the total wage bill (more than 6½% in 2006). On the other hand, investment remained rather subdued and government consumption, which had been rather dynamic in 2005, decelerated as a result of the budgetary adjustment measures decided by the government in April-May. The main source of the strong GDP growth was an exceptionally buoyant foreign trade performance: total exports grew by about 15% in real terms and imports by about 12½%, with exports and imports of services growing even faster. The contribution of net exports to GDP growth, which was slightly negative in 2005, was very strongly positive in 2006 (about 6%).
Prospects for 2007 and 2008
Real GDP growth is forecast to remain fairly strong in the coming years though somewhat less than in 2006. Domestic demand is likely to remain buoyant: investment is expected to accelerate in 2007 and to slow down only marginally in 2008. Private consumption is forecast to decelerate slightly and government consumption should continue to grow more slowly as a result of the recent adjustment measures. However, the main reason for the slight slowdown in GDP growth is foreign trade, which is not expected to remain as buoyant as in 2006, because
of decelerating demand from the country's main trading partners. Overall, GDP growth could reach between 4½% and 5% in both 2007 and 2008.
Labour market, costs and prices
After rising by slightly less than 3% in 2005, employment growth accelerated in the course of 2006 to about 4% year-on-year in the last months. In the year as a whole, it expanded by about 3¾%. In 2007 and 2008, employment growth is expected to slow down slightly, thus only partially reflecting the (limited) deceleration in output, following a pattern already observed in 2001-2003.
Employment growth since the beginning of the decade had mostly benefited non-residents, who now exceed one third of the total labour force in Luxembourg and have represented about two thirds of its increase in recent years. As a result, residents' unemployment has been rising since mid-2002. However, with the acceleration in job creation, the rise in unemployment significantly slowed down in the course of 2006. With employment growth projected to remain strong over the period, unemployment should stabilise, probably already in the course of 2007 and then begin declining in 2008.
Due mostly to the large increase in oil prices that occurred in the first half of 2006, inflation accelerated in the course of the year, with the national CPI rising by 2.7% compared to 2.5% in 2005. However, the subsequent decline in oil prices led to a strong deceleration in inflation in the second half of the year. This deceleration was more pronounced for the HICP than for the national CPI, which excludes consumption by non-residents and especially their large purchases of car fuel, alcohol and tobacco products. As a result, the HICP slowed down on a yearly average in 2006, rising by 3.0% compared to 3.8% in 2005. Under the assumption of a more limited increase in oil prices in 2007 and 2008 than in 2005-2006, inflation is projected to slightly decrease in 2007, before reaccelerating somewhat in 2008.
Public finances
After reaching 1.2% of GDP in 2004, the deficit decreased to 0.3% in 2005 and then turned into a slight surplus (0.1% of GDP) in 2006. This improvement was essentially due to higher-than-expected revenues, especially from direct taxes,

Chapter 3 Member States, Luxembourg
- 79 -
Table 3.15 Main features of country forecast - LUXEMBOURG
2005 Annual percentage changemio Euro Curr. prices % GDP 92-02 2003 2004 2005 2006 2007 2008
GDP at constant prices 29396.0 100.0 4.4 1.3 3.6 4.0 6.2 5.0 4.7 Private consumption 11873.0 40.4 3.3 2.1 2.8 3.4 3.9 3.0 3.0 Public consumption 4995.0 17.0 4.4 4.4 3.2 4.8 2.3 2.8 2.8 Gross fixed capital formation 5777.0 19.7 4.6 1.9 0.5 2.2 3.0 7.1 6.2 of which : equipment 1553.0 5.3 1.8 -14.5 8.0 9.5 3.4 10.7 8.0 Exports (goods and services) 46820.0 159.3 7.0 3.5 10.1 8.0 14.9 9.0 8.4 Final demand 69954.0 238.0 5.6 3.6 7.4 7.0 10.2 7.7 7.2 Imports (goods and services) 40558.0 138.0 6.7 5.5 10.3 9.3 12.7 9.5 8.6 GNI at constant prices (GDP deflator) 24338.0 82.8 3.4 -5.0 5.3 3.3 6.7 5.0 4.7 Contribution to GDP growth : Domestic demand 3.2 2.0 1.8 2.7 2.7 3.1 2.9
Stockbuilding -0.2 0.9 0.1 1.2 -2.4 0.5 0.2Foreign balance 1.4 -1.6 1.8 0.1 6.0 1.3 1.6
Employment 3.5 1.8 2.3 2.9 3.7 3.6 3.2 Unemployment rate (a) 2.6 3.7 5.1 4.5 4.7 4.6 4.4 Compensation of employees/head 3.6 1.9 4.2 3.7 2.3 3.0 2.8 Real unit labour costs 0.3 -2.4 1.1 -2.0 -5.7 -2.8 -2.3 Savings rate of households (b) - - - - - - - GDP deflator 2.4 4.9 1.7 4.7 5.9 4.6 3.7 Private consumption deflator 2.4 2.4 2.5 3.6 3.1 2.3 2.5 Harmonised index of consumer prices - 2.5 3.2 3.8 3.0 2.4 2.7 Trade balance (c) -11.3 -11.2 -10.2 -11.1 -8.0 -7.7 -7.5 Current account balance (c) 11.4 8.0 11.8 11.1 8.6 10.5 11.9 Net lending(+) or borrowing(-) vis-à-vis ROW (c) - - - - 8.6 10.5 11.9 General government balance (c)(d) 3.0 0.4 -1.2 -0.3 0.1 0.4 0.6 Cyclically-adjusted budget balance (c)(d) - 1.3 -0.1 1.0 0.5 0.6 0.8 Structural budget balance (c) - 1.3 -0.1 1.0 0.5 0.6 0.8 General government gross debt (c) 6.6 6.3 6.6 6.1 6.8 6.7 6.0 (a) Eurostat definition. (b) gross saving divided by gross disposable income. (c) as a percentage of GDP. (d) Including proceeds relative to UMTS licences (see for more details note 10 on concepts and sources).
generated by strong output and employment growth, but also to adjustment measures decided in April 2006 by the government and the business and labour organisations in order to cope with the deterioration in public finances and to reinforce the competitiveness of the economy. These measures mainly consist of increases in several contributions and taxes and a temporary (up to 2009) suspension of the normal indexation of wages and social benefits on consumer prices, which will be replaced by an indexation at predetermined dates. Moreover, government investment, which had been rising very fast in 2005, decreased by 2.3% in 2006. In 2007, the surplus is projected to increase thanks to still robust output and employment growth and to the lasting effects of the adjustment measures decided in 2006, which should result in some slowdown in expenditure growth. Under an unchanged policy assumption – implying in particular that the adjustment measures decided in spring 2006 will continue to be carried out as planned despite the better-than-expected 2006 outcome – the
consolidation is forecast to continue in 2008. The government debt, though remaining very low (6.1% of GDP in 2005) rose by 0.7 percentage point of GDP in 2006 because several loans related to road and railway infrastructure projects were issued during the year for a total of about 1 percentage point of GDP.

16. Hungary Export boom, domestic demand slows down
- 80 -
-1
0
1
2
3
4
5
6
2004 2005 2006 2007 2008
Net exports Domestic components GDP
% GDP
Forecast
Graph 3.20: Hungary - Contribution to GDP growth
Activity in 2006
In 2006, GDP growth slightly decreased to 3.9% from 4.2% in 2005. The domestic deceleration was mainly driven by a marked decline in private investment and in government consumption; household consumption also decelerated, albeit to a lesser extent. Confidence indicators showed a strong deterioration after the adoption of a fiscal consolidation package in summer 2006. Net exports were the primary driver of GDP growth reflecting a spectacular 18% expansion of exports along with a smaller but still significant increase in imports of 12.6%. The current account deficit is expected to decline to 5.9% of GDP in 2006, from 6.8% of GDP in 2005 (national accounts definition).
Prospects for 2007 and 2008
The economic slowdown is expected to continue in 2007 when real GDP growth is forecast to fall to 2.4% with a large part of the budgetary consolidation measures entering into force at the beginning of the year. Tax increases and cuts in price subsidies are likely to contribute to a decline in households' real disposable income, leading to a contraction of household consumption by 0.6%; government consumption should also continue decreasing. Investment is projected to pick up slightly, mainly driven by the strong growth in the export-oriented manufacturing sector; by contrast, public investment should drop significantly. Net exports are likely to continue driving GDP growth, with exports benefiting from favourable external conditions while the deceleration of domestic demand may be expected to
slow down the growth of imports.
A modest recovery of domestic demand is expected for 2008. Consumption should start increasing slightly and investment may grow at around 4% in the wake of an increasing inflow of EU structural funds. GDP is projected to grow at 2.6%, mainly driven by a sustained strong foreign trade performance. The current account deficit could fall to close to 2% of GDP by 2008.
Labour market, costs and prices
Employment is projected to stagnate over the next two years as a result of downsizing measures in the public sector and relatively unfavourable cyclical conditions. Recently adopted regulatory measures should support the increasing trend in the labour force. Consequently, the unemployment rate, which rose to 7.5% in 2006, is projected to continue increasing above the EU average in 2007. Public sector wage freezes and the slowdown of economic activity are likely to contribute to curbing private sector wage inflation. The compensation of employees in the total economy is therefore expected to grow at rate below HICP inflation in 2007 and slightly above it in 2008.
Consumer price inflation (HICP) rose to an annual average of 4% from 3.5% in 2005, mainly resulting from the large increase in administered prices in the second half of the year. Inflation is projected to peak above 8% in the first half of 2007 and to start decreasing thereafter. The expected annual average inflation rate is 7.5%. The disinflation in the second half of 2007 should result on the one hand from the progressive running-out of the major one-shot impact of fiscal measures introduced in the second half of 2006 (VAT hike, cuts of price subsidies), and on the other hand from the recent appreciation of the forint back to its January 2006 level. Annual inflation of 3.9% is projected in 2008, in the light of possible second-round effects.
Public finances
The government deficit increased to 9.2% of GDP in 2006, up from 7.8% in 2005. The fiscal deterioration was due to significant slippages on the expenditure side, which were only partly compensated by consolidation measures adopted in the second half of the year by the re-elected Government. In 2007, the deficit is expected to decrease markedly, to 6.8% of

Chapter 3 Member States, Hungary
- 81 -
Table 3.16 Main features of country forecast - HUNGARY
2005 Annual percentage changebn HUF Curr. prices % GDP 92-02 2003 2004 2005 2006 2007 2008
GDP at constant prices 22026.8 100.0 2.7 4.1 4.9 4.2 3.9 2.4 2.6 Private consumption 12204.4 55.4 - 8.4 3.1 3.9 1.6 -0.6 0.5 Public consumption 4975.0 22.6 0.7 5.4 1.9 1.9 -2.6 -1.7 -1.4 Gross fixed capital formation 4995.3 22.7 5.8 2.1 7.7 5.6 -1.8 1.1 4.0 of which : equipment 2002.3 9.1 - - - - -1.3 4.0 6.8 Exports (goods and services) 14626.2 66.4 13.0 6.2 15.7 11.6 18.0 13.5 10.5 Final demand 36958.8 167.8 - 6.1 9.1 5.9 8.7 5.7 5.2 Imports (goods and services) 14932.0 67.8 13.7 9.3 14.1 6.8 12.6 10.1 8.6 GNI at constant prices (GDP deflator) 20759.1 94.2 - 4.6 3.9 4.4 2.4 1.6 2.2 Contribution to GDP growth : Domestic demand 2.7 6.2 3.9 3.8 -0.1 -0.5 0.8
Stockbuilding 0.5 0.1 0.5 -2.4 0.7 0.1 0.0Foreign balance -0.4 -2.1 0.5 2.8 3.4 2.8 1.8
Employment - 0.8 -0.5 0.4 0.9 -0.3 -0.2 Unemployment rate (a) 8.5 5.9 6.1 7.2 7.5 7.8 7.8 Compensation of employees/f.t.e. - 9.9 11.4 6.2 6.7 7.1 5.0 Real unit labour costs - 0.7 1.3 0.3 0.7 -1.8 -1.3 Savings rate of households (b) - - - - - - - GDP deflator 15.7 5.7 4.3 2.0 3.0 6.2 3.4 Private consumption deflator - 4.0 4.5 3.6 3.2 7.5 3.9 Harmonised index of consumer prices - 4.7 6.8 3.5 4.0 7.5 3.8 Trade balance (c) -4.8 -3.9 -3.0 -1.7 -0.5 1.6 2.8 Current account balance (c) - -7.9 -8.4 -6.8 -5.9 -3.5 -2.2 Net lending(+) or borrowing(-) vis-à-vis ROW (c) - -8.0 -8.1 - - - - General government balance (c)(d) - -7.2 -6.5 -7.8 -9.2 -6.8 -4.9 Cyclically-adjusted budget balance (c)(d) - -6.9 -6.5 -8.0 -9.6 -6.9 -4.7 Structural budget balance (c) - -6.7 -6.7 -8.4 -9.4 -6.1 -4.6 General government gross debt (c) - 58.0 59.4 61.7 66.0 67.1 68.1 (a) Eurostat definition. (b) gross saving divided by gross disposable income. (c) as a percentage of GDP. (d) Including proceeds relative to UMTS licences (see for more details note 10 on concepts and sources).
GDP, due to the fiscal adjustment. Based on the usual no-policy-change assumption, the forecast projects a continued improvement in 2008 to 4.9% of GDP, thanks to a further reduction in expenditure on social transfers and government consumption already incorporated in the 2007 budget and in a series of reform laws and Government decisions. In structural terms the deficit is expected to fall from 9.4% in 2006 to 6.1% of GDP in 2007 and to 4½% of GDP in 2008.
The decrease in the budget deficit in 2007 is partly explained by increases in taxes and social contributions adopted by Parliament in July 2006, entailing an increase in the tax burden of 0.8 percentage point in 2007 to 38.1% of GDP. On the expenditure side, a number of freezes in operational and wage expenditure as well as cuts in investment (totalling around 1¼% of GDP in 2007) are to be continued until end-2008. Moreover, initial structural reform measures, especially in the areas of health care and public administration, are also considered.
However, it is assumed that not all of the planned savings in social transfers and government consumption will be achieved, since it may be difficult to fully enforce the envisaged cuts in preventive care and in public administration, particularly in 2008. The impact of the February 2007 public wage agreement is only reflected in higher pension expenditure (through the indexation mechanism) in both 2007 and 2008, in the absence of a decision on the conditional top-up payments in 2008. The forecast does not include any debt assumption from the state-guaranteed debt (over 1% of GDP) of the national railway (MÁV), nor any additional capital injections to cover the possible losses of MÁV, although there is a risk that both may happen at some point.
After a significant increase in 2006 to 66% of GDP, the debt ratio is projected to continue to increase although more moderately.

17. Malta Public finances on a sounder footing
- 82 -
0.0
10.0
20.0
30.0
40.0
50.0
60.0
70.0
80.0
99 00 01 02 03 04 05 06 07 08
-12
-10
-8
-6
-4
-2
0
Government debt (lhs) Government balance (rhs)
% of GDP % of GDP
Forecast
Graph 3.21: Malta - General government finances
Activity in 2006
Following a period of weak economic performance, Malta’s GDP continued to grow at a sustained pace for a second consecutive year in 2006. Real GDP grew by 2.9%, driven by dynamic domestic demand, in particular private and public consumption and a significant contribution of the external sector. Private consumption increased by 2.6%, as the depressing effect of higher energy prices was outweighed by sustained employment creation and a continued expansion in consumer credit. Gross fixed capital formation contracted by 1% due to lower public investment, mainly reflecting constraints in the capacity to absorb EU funds. Overall, final domestic demand contributed around 2.4 percentage points to GDP growth.
After contracting in 2005, real exports of goods and services grew by 1.4% in 2006 mainly on account of higher exports of electronics and pharmaceuticals. Imports contracted by 0.5% in 2006, pulled down by the fall in investment and despite strong consumption and a turnaround in exports, which are characterised by a relatively high import content.
Prospects for 2007 and 2008
GDP is expected to continue to grow at a healthy pace of 3% in 2007 and to slow marginally to 2.8% in 2008. Economic activity is forecast to be mainly domestically-driven in both years, although the small negative contribution of the external sector in 2007 is projected to turn positive in 2008. Private consumption is anticipated to grow at a slightly faster pace, 2.8% in 2007, on account of an improvement in
the disposable income brought about by lower personal income taxes, a continuation of high employment and lower energy prices. The dissipation of the effect of the tax cut, as well as the assumed higher oil prices for 2008 are expected to lead to a small deceleration in the rate of increase of private consumption in 2008. Public consumption is projected to increase at low rates in 2007 and 2008 reflecting the continuation of fiscal consolidation. Gross fixed capital formation is foreseen to expand significantly in 2007, by around 6%, reflecting higher capital spending linked to the completion of the Mater Dei hospital, whereas in 2008, investment is anticipated to decelerate to 0.3% due to a fall in public investment. Overall, final domestic demand is expected to contribute by slightly more than 3 percentage points to GDP growth in 2007 and 2 percentage points in 2008.
The recovery of exports of goods and services is anticipated to accelerate in 2007 on account of an expected improved performance of services, specifically in the remote gaming sector and tourism. For 2008, the growth in exports is expected to remain practically unchanged. Imports are foreseen to increase by 2.7% in 2007, reflecting the relatively high increase in private consumption, buoyant investment and a higher expansion of exports. In 2008, import growth is forecast to decelerate to 1.8% on account of the deceleration in private consumption and investment activity.
Following a decline to 6.3% of GDP in 2006, the current account deficit is projected to improve further to 5.6% of GDP in 2007 on the back of higher exports. For 2008, a deceleration of imports and a continued strong performance of services exports are forecast to lead to a further fall in the current account deficit to 4.4% of GDP. As a result of the improvement in the current account, net borrowing vis-à-vis the rest of the world is foreseen to decline to 1.5% of GDP by 2008.
Labour market, costs and prices
Employment growth reached 0.9% in 2006 in line with historical trends. The pace of employment creation is anticipated to remain unchanged in 2007 and 2008. Over the forecast horizon, jobs are expected to be mainly generated by the services sector, in particular information technology, financial services and activities arising from the utilisation of new

Chapter 3 Member States, Malta
- 83 -
Table 3.17 Main features of country forecast - MALTA
2005 Annual percentage changemio MTL Curr. prices % GDP 92-02 2003 2004 2005 2006 2007 2008
GDP at constant prices 1990.5 100.0 4.0 -2.3 0.4 3.0 2.9 3.0 2.8 Private consumption 1295.5 65.1 - 3.4 1.9 2.2 2.6 2.8 2.6 Public consumption 419.1 21.1 - 2.9 1.3 -0.4 3.9 0.3 0.5 Gross fixed capital formation 401.8 20.2 - 26.4 0.7 8.5 -1.0 6.1 0.3 of which : equipment - - - - - - - - - Exports (goods and services) 1534.5 77.1 - -2.3 4.9 -2.6 1.4 2.7 2.9 Final demand 3678.8 184.8 - 2.1 2.9 2.1 1.2 2.9 2.3 Imports (goods and services) 1688.3 84.8 - 7.0 5.4 1.3 -0.5 2.7 1.8 GNI at constant prices (GDP deflator) 1923.4 96.6 3.5 -3.1 -0.8 1.0 5.1 3.1 2.8 Contribution to GDP growth : Domestic demand - 6.8 1.7 3.1 2.4 3.2 2.0
Stockbuilding - -0.5 -0.5 3.8 -1.3 0.1 0.0Foreign balance - -8.6 -0.8 -3.9 1.8 -0.2 0.8
Employment 1.1 1.0 -0.8 1.8 0.9 0.9 1.0 Unemployment rate (a) 6.1 7.6 7.4 7.3 7.4 7.4 7.3 Compensation of employees/head 5.8 3.9 2.5 1.1 1.2 1.6 1.9 Real unit labour costs 0.5 2.8 -0.2 -2.4 -3.2 -2.8 -2.1 Savings rate of households (b) - - - - - - - GDP deflator 2.4 4.6 1.4 2.4 2.6 2.3 2.2 Private consumption deflator - 0.6 2.4 2.6 2.0 1.4 2.1 Harmonised index of consumer prices - 1.9 2.7 2.5 2.6 1.4 2.1 Trade balance (c) -18.9 -14.0 -16.5 -19.6 -19.8 -19.0 -18.3 Current account balance (c) - -2.8 -6.4 -8.3 -6.3 -5.6 -4.4 Net lending(+) or borrowing(-) vis-à-vis ROW (c) - -2.4 -4.9 -4.9 -3.3 -2.5 -1.5 General government balance (c)(d) - -10.0 -4.9 -3.1 -2.6 -2.1 -1.6 Cyclically-adjusted budget balance (c)(d) - -9.2 -3.6 -2.2 -2.0 -1.9 -1.6 Structural budget balance (c) - -6.4 -4.3 -3.8 -2.7 -2.6 -1.6 General government gross debt (c) - 70.4 73.9 72.4 66.5 65.9 64.3 (a) Eurostat definition. (b) gross saving divided by gross disposable income. (c) as a percentage of GDP. (d) Including proceeds relative to UMTS licences (see for more details note 10 on concepts and sources).
opportunities such as remote gaming and call centres. As a result, the unemployment rate is foreseen to decline to 7.3% by 2008. HICP inflation increased to 2.6% in 2006, mainly due to higher energy prices. It is forecasted to slow down to slightly below 1.5% in 2007, and rise marginally above 2% in 2008 on account of assumed energy price developments as well as the assumption that the exceptionally low underlying inflation recorded in the recent months will return to historical trends.
Public finances
The budgetary consolidation that commenced in 2004, continued in 2006, when the general government deficit fell to 2.6% of GDP as a result of lower-than-planned capital expenditure. The structural balance (cyclically-adjusted balance net of one-offs) improved by slightly more than 1% point of GDP in 2006.
For 2007, the deficit is projected to decline further to 2.1% of GDP. The fall in the general government
deficit is explained by a deceleration in current expenditure primarily due to a significantly slower rise in wages and salaries in the public sector than nominal GDP and reflects the government's drive to contain spending. The adjustment in 2007 is also projected to be facilitated by lower interest expenditure on account of the large reduction in the debt ratio in 2006.
For 2008, under the no-policy-change scenario, which excludes one-off operations, the deficit is expected to decline further to 1.6% of GDP. The improvement in the fiscal stance will result mainly from lower government gross fixed capital formation linked with the completion of a large healthcare facility.
General government debt in 2006 stood at around 66.5% of GDP and is anticipated to decline to slightly below 66% of GDP in 2007. Under the no-policy-change scenario, the debt ratio is foreseen to fall to 64.3% of GDP in 2008.

18. The Netherlands Continued strong economic prospects
- 84 -
10
12
14
16
18
20
22
95 97 99 01 03 05 07
Saving rate, gross; corporationsSaving rate, gross; households and NPISH
Forecast
% of GDP
Graph 3.22: The Netherlands - Private sector gross saving
100
150
200
250
00Q1 02Q1 04Q1 06Q1 08Q10%
1%
2%
3%
4%
5%
6%
Vacancies (4-quarter moving average)Unemployment rate (rhs)
Forecast
Graph 3.23: The Netherlands - Unemployment and vacancies
'000
Activity in 2006
Economic growth was strong throughout 2006, posting on average 0.7% growth quarter-on-quarter. Annual economic growth came out well above potential, at 2.9%, benefiting from both resilient domestic demand and vigorous international trade developments.
Adjusted for statistical effects related to the health-care reformi, private consumption expenditure showed robust growth of around 2.4% on average in 2006, significantly outpacing disposable household income growth in the first half of the year. In the second half of 2006, private consumption expenditure growth stagnated, mainly as a result of durable goods consumption returning to more normal levels. Other factors explaining the mid-year consumption slowdown include lower consumption of beverages and tobacco and a fall in household energy consumption on account of high average temperatures in the autumn.
Total investment was also robust in 2006, posting annual growth of 6.7%. Investment in equipment grew particularly strongly, by around 14%, but construction growth was also solid at 4.3%. The increase in investment demand predominantly originated in the private sector, which responded to high levels of capacity utilisation and good future demand prospects.
Exports of goods and services increased by 7.5% in 2006 on the back of solid international trade developments. The contribution from net exports was nonetheless small as import growth outpaced export
growth, propelled by improving private investments and consumption expenditure.
Consumer price developments remained relatively subdued, despite a high average contribution of energy to HICP of 0.7 percentage point in 2006. Headline HICP inflation was 1.7% and fell slightly within the year, mainly on account of falling oil prices, which reduced the contribution of energy components towards the end of 2006.
Prospects for 2007 and 2008
Over the forecast horizon, GDP growth is expected to remain well above current estimates of potential growth (around 2%). GDP is projected at 2.8% in 2007, easing only slightly to 2.6% in 2008. Domestic demand is likely to be the main driver of economic growth in both years, while the contribution from net exports is expected to fall.
Although private consumption growth in 2007 will be affected by a relatively low carry-over from 2006 (stemming from the stagnation in the second half of the year) and remain below 2% on an annual basis, the underlying quarterly growth pattern is projected to be robust. Building on expected strong household disposable income developments, private consumption growth will somewhat strengthen from 0.7% quarter-on-quarter in early 2007 to 0.8% quarter-on-quarter at the end of 2008. In 2008, annual private consumption growth will probably come out slightly below 3%.
The household saving rate (Graph 3.22) has shown a steady decline over the past decade, influenced inter

Chapter 3 Member States, The Netherlands
- 85 -
alia by positive wealth effects from rising house prices. In 2007 and 2008, the saving rate is expected to recover slightly from its all-time low of 11.3% in 2006 and come out at around 11¾% in both years.
As the economic cycle matures, total investment growth is expected to slow somewhat from the high growth in 2006. The prospects for investment are nevertheless held up by regained producer confidence, strong profit developments in recent years and slightly elevated capacity utilisation rates.
On the external side, net trade should provide a slight positive contribution to growth in 2007, turning marginally negative in 2008. The main factors behind this development are the expected softening of world import growth over the forecast horizon, a small loss in international competitiveness of Dutch exports, and strong domestic demand factors pushing up imports of goods and services.
Labour markets, costs and prices
Despite an almost stable total population over the forecast horizon, labour supply is expected to grow by around 1% per year as labour participation increases in line with strong economic activity. Furthermore, the above-potential economic growth performance is likely to result in continued high demand for labour throughout the forecast horizon. With an unemployment rate already starting at a low level of 3.9% in 2006 and the number of unfilled vacancies nearing its all-time high towards the end of 2006 (Graph 3.23), the labour market is expected to tighten further in 2007 and 2008. Already in early 2007, this is becoming visible as several industries are now reporting that labour shortages are restricting an expansion of production. Over the course of the forecast horizon, the unemployment rate is expected to fall to 2¾% of the labour force, its lowest level since 2001.
The tensions building up in the labour market are expected to exert significant upward pressure on wages. At the start of 2007, evidence is mounting that contractual wages are accelerating. Compensation of employees per full-time equivalent is forecast to increase by around 3½% in 2007 and more vigorously by 3¾% in 2008. Towards the end of the forecast horizon, the rise in compensation of employees is expected to dampen labour demand growth.
Employment growth in 2008 is therefore likely to slow to 1% in 2008, from 1¼% in 2007.
The strong increase in the compensation of employees will outpace expected labour productivity growth, raising unit labour costs by around 1½% in 2007 and 2% in 2008. Despite the increase in unit labour costs, consumer price inflation as measured by the HICP is foreseen to remain relatively benign in 2007, at 1½%, on account of a falling contribution from energy prices. In 2008, HICP inflation is forecast at around 2%, reflecting a steady upward trend in underlying inflation which will accelerate towards the end of 2008.
Public finances
The general government balance posted a surplus of 0.6% of GDP in 2006, which is 0.9 percentage points better than the budgetary outturn in 2005. The main factors contributing to the improved outcome were higher tax revenues on account of the improved economic situation, a better outturn of the balance of local governments and higher gas revenues. The 2006 outcome is more than 2 percentage points better than the targeted deficit of 1.5% of GDP in the stability programme update of December 2005.
In 2007, the general government balance is foreseen to come out at a deficit of 0.7% of GDP. Factors contributing to the worsening of the budget balance are expenditure overruns in the execution of the budget of around ½% of GDP, social benefits coming out ¼% of GDP higher and lower mineral gas production related to weather conditions. Furthermore, the good budgetary outcome that local governments have attained in 2006 is not expected to carry over into 2007. The recent agreement on the upcoming constitutional reform of the Dutch Antilles included a takeover of debt, which worsens the nominal government balance in 2007 by 0.1% of GDP. Finally, the new government increased the generosity of the disability scheme, leading to additional expenditure of around 0.1% of GDP annually from 2007 onwards. In structural terms, the government balance is projected to deteriorate by 1½% of GDP, which implies a clearly pro-cyclical fiscal stance in 2007 at a time of strong economic growth.

Economic forecast, spring 2007 The Netherlands
- 86 -
Table 3.18 Main features of country forecast - THE NETHERLANDS
2005 Annual percentage changebn Euro Curr. prices % GDP 92-02 2003 2004 2005 2006 2007 2008
GDP at previous year prices 505.6 100.0 2.7 0.3 2.0 1.5 2.9 2.8 2.6 Private consumption 247.1 48.9 2.7 -0.2 0.6 0.7 -1.2 1.9 2.8 Public consumption 121.8 24.1 2.2 2.9 0.1 0.3 8.6 2.3 2.2 Gross fixed capital formation 97.7 19.3 2.8 -1.5 -0.8 3.6 6.7 4.2 3.6 of which : equipment 27.7 5.5 3.9 5.0 -0.5 4.3 13.8 5.5 4.8 Exports (goods and services) 353.6 69.9 6.5 1.5 8.0 5.5 7.5 6.0 5.5 Final demand 820.3 162.2 4.0 0.9 3.8 3.0 4.9 4.4 4.1 Imports (goods and services) 314.6 62.2 6.5 1.8 6.4 5.1 8.1 6.3 6.2 GNI at previous year prices (GDP deflator) 510.2 100.9 2.8 0.6 3.7 -0.4 5.8 2.1 2.7 Contribution to GDP growth : Domestic demand 2.5 0.3 0.1 1.1 2.7 2.3 2.6
Stockbuilding -0.1 0.1 0.4 -0.2 -0.2 0.4 0.0Foreign balance 0.3 -0.1 1.4 0.7 0.1 0.2 -0.1
Employment 1.5 -1.1 -1.4 -0.3 1.0 1.1 1.0 Unemployment rate (a) 4.6 3.7 4.6 4.7 3.9 3.2 2.7 Compensation of employees/f.t.e. 3.7 4.2 3.8 1.5 1.0 3.4 3.8 Real unit labour costs -0.2 0.5 -0.4 -2.0 -2.3 0.0 0.1 Savings rate of households (b) - - 13.1 12.4 11.3 11.7 11.8 GDP deflator 2.6 2.2 0.7 1.7 1.5 1.7 2.1 Private consumption deflator 2.6 2.4 0.8 1.6 1.9 1.4 2.0 Harmonised index of consumer prices 2.4 2.2 1.4 1.5 1.7 1.5 2.1 Trade balance (c) 5.5 6.5 7.1 7.6 7.7 7.8 7.7 Current account balance (c) 4.9 6.1 8.6 7.1 9.9 9.2 9.0 Net lending(+) or borrowing(-) vis-à-vis ROW (c) 4.6 5.9 8.4 6.8 9.5 8.8 8.6 General government balance (c)(d) -1.7 -3.1 -1.8 -0.3 0.6 -0.7 0.0 Cyclically-adjusted budget balance (c)(d) -1.8 -2.2 -1.0 0.7 1.1 -0.4 0.1 Structural budget balance (c) - -2.2 -1.2 0.7 1.1 -0.4 0.1 General government gross debt (c) 66.5 52.0 52.6 52.7 48.7 47.7 45.9 (a) Eurostat definition. (b) gross saving divided by gross disposable income. (c) as a percentage of GDP. (d) Including proceeds relative to UMTS licences (see for more details note 10 on concepts and sources).
On a no-policy-change basis, the nominal budgetary balance is expected to improve again in 2008 to reach a balanced budget. The significant improvement compared with 2007 is in part explained by an expected increase in gas receipts resulting from the assumed rise in oil and gas prices towards the end of the forecast horizon. Furthermore, the elasticity of social contributions to the compensation of employees is expected to fully return to its long-term value and no further debt takeovers are currently foreseen for 2008.
The no-policy-change assumption implies that the planned measures of the new government, which are set out in the new government's programme, are not taken on board in the forecast as many details of the planned measures are not yet available. If all the measures that are planned for 2008 were implemented, this would further improve the government balance by around 0.4% of GDP in 2008.
The debt-to-GDP ratio is expected to fall from 48.7% in 2006 to 47.7% in 2007 and 45.9% in 2008, mainly as a result of the increase in nominal GDP and the development of the nominal government balance, while stock-flow adjustment is likely to exert some upward influence on the government debt level in 2007.
i The reform of the health-care sector in 2006 led to a reclassification of health-care expenditures from private to public consumption, downwardly distorting private consumption growth by around 3½ percentage points in that year.

19. Austria Brisk investment supporting robust economic growth
- 87 -
-20
-10
0
10
20
30
40
50
60
00 01 02 03 04 05 06 07 08
Total labour force Total employment (national)
Graph 3.24: Austria - Total labour force and total employment (changes in 1000 persons)
Activity in 2006
The Austrian economy grew by 3.1% in 2006 with quarter-on-quarter growth rates remaining high until the end of the year. The fourth quarter saw Austria's economy growing by 0.8% q-o-q in real terms after 1.0% in the third quarter.
Dynamic exports and buoyant industrial activity were the twin engines powering the growing investment dynamics. The rebound was particularly spectacular for equipment investment, supported by the current high capacity utilisation. Similarly, construction investment grew much more strongly than in the previous years. Exports, for their part, benefited from the recovery in Europe and notably in Germany, as well as from a strong competitive position. With both private and government consumption remaining subdued during the year, net exports provided the major contribution to GDP growth.
Lively activity gave an impetus to the labour market, with total employment rising by around 1½% from the previous year. A substantial part of this increase was accounted for by part-time workers. Because of a strong rise in labour supply (both domestic and from abroad), however, the corresponding fall in unemployment was less pronounced.
Prospects for 2007 and 2008
Buoyant activity is expected to continue in 2007, followed by a more moderate growth performance in 2008. The output gap almost closed in 2006 and is expected to turn positive in 2007 and 2008. While in 2006 net exports were the key driving force, growth
should be more balanced over the forecast period. Especially in 2007, gross fixed capital formation is expected to speed up further, with both construction and equipment investment being strongly upward bound. In 2008, capital formation is expected to lose momentum.
The favourable competitive situation, with unit labour cost staying in line with those of Austrian’s major trading partners, is supporting net exports. Exports will maintain their strong upward trend, thanks to the accelerating demand in Europe. The high import intensity of what is expected to be brisk investment in 2007 will give rise to higher imports. Nevertheless, the current account will stay in comfortable surplus.
Despite the lack of snow in low-lying areas, the winter tourism season has been promising so far, such that tourism services should continue to provide a positive contribution to economic growth.
Having lagged behind the other demand components, private consumption is expected to accelerate, supported by rising employment. The household saving ratio is projected to moderate slightly in 2008.
Labour market, costs and prices
Employment is expected to remain upward bound, with a higher number of full-time jobs likely to be created than during the last few years, as the cyclical upswing typically favours full-time job sectors such as manufacturing and construction. In full-time-equivalents, employment is estimated to rise by 1¼% in 2007 . However, the ongoing increase in labour supply will limit the decrease in unemployment. The unemployment rate should abate to 4¼% by the end of the forecast period.
Wage and price movements so far developed only moderately with a Harmonised Consumer Price Index (HICP) increase of 1.7%. The cyclical upturn is likely to be accompanied by slightly higher wage growth. Compensation of employees per head is expected to increase by 2½% in 2007 compared with the previous year. Unit labour costs are rising only slowly and are even declining in the manufacturing industry. With the HICP expected to increase by 1¾ in both years, inflation will maintain its moderate pace.

Economic forecast, spring 2007 Austria
- 88 -
Table 3.19 Main features of country forecast - AUSTRIA
2005 Annual percentage changebn Euro Curr. prices % GDP 92-02 2003 2004 2005 2006 2007 2008
GDP at previous year prices 244.6 100.0 2.1 1.1 2.4 2.0 3.1 2.9 2.5 Private consumption 137.6 56.2 1.7 1.3 1.9 1.7 1.8 2.0 2.1 Public consumption 44.5 18.2 2.0 1.2 1.4 1.9 0.9 1.8 2.1 Gross fixed capital formation 50.3 20.5 1.0 5.9 0.6 0.3 4.7 5.2 3.2 of which : equipment 19.6 8.0 1.4 7.2 -1.6 0.2 5.3 7.5 3.8 Exports (goods and services) 133.1 54.4 5.7 2.0 10.0 6.4 8.5 7.4 6.9 Final demand 366.0 149.6 2.8 2.3 4.3 3.1 4.5 4.4 4.0 Imports (goods and services) 121.4 49.6 4.6 5.1 8.7 5.2 6.8 7.3 6.7 GNI at previous year prices (GDP deflator) 242.1 99.0 2.1 1.4 2.2 2.2 3.2 2.3 2.1 Contribution to GDP growth : Domestic demand 1.7 2.2 1.5 1.3 1.9 2.5 2.2
Stockbuilding 0.0 0.2 0.0 -0.1 -0.1 0.0 -0.2Foreign balance 0.5 -1.3 0.9 0.9 1.3 0.4 0.5
Employment 0.3 0.2 0.3 1.3 1.1 1.2 0.7 Unemployment rate (a) 4.0 4.3 4.8 5.2 4.8 4.4 4.3 Compensation of employees/f.t.e. 2.8 2.0 1.7 1.6 2.3 2.4 2.5 Real unit labour costs -0.6 -0.3 -2.1 -0.9 -1.2 -1.1 -1.0 Savings rate of households (b) - - 13.2 13.5 13.9 14.0 13.8 GDP deflator 1.6 1.3 1.7 1.9 1.6 1.8 1.7 Private consumption deflator 2.0 1.6 1.9 1.7 1.4 1.6 1.4 Harmonised index of consumer prices 1.9 1.3 2.0 2.1 1.7 1.8 1.7 Trade balance (c) -2.0 0.5 1.2 1.0 2.0 2.2 2.2 Current account balance (c) -0.9 1.7 2.1 2.9 3.7 3.2 3.1 Net lending(+) or borrowing(-) vis-à-vis ROW (c) -1.1 1.7 1.9 2.8 3.5 3.2 3.0 General government balance (c)(d) -2.6 -1.6 -1.2 -1.6 -1.1 -0.9 -0.8 Cyclically-adjusted budget balance (c)(d) -2.7 -0.9 -0.6 -1.1 -1.0 -1.1 -1.2 Structural budget balance (c) - -0.9 -0.6 -1.1 -1.0 -1.1 -1.2 General government gross debt (c) 64.3 64.6 63.9 63.5 62.2 60.6 59.2 (a) Eurostat definition. (b) gross saving divided by gross disposable income. (c) as a percentage of GDP. (d) Including proceeds relative to UMTS licences (see for more details note 10 on concepts and sources).
Public finances
In 2006, the general government deficit, amounting to 1.1% of GDP, turned out lower than previously estimated. The favourable outturn is due to higher-than-expected receipts from corporate tax and indirect taxes. The projected favourable cyclical conditions are set to ensure healthy growth of revenues over the entire forecast period.
The federal budget for 2007 and 2008 was presented by the new Government at the end of March. Indirect taxes on fuel are expected to increase in 2007, as are social security contributions in 2008. Regarding additional government spending, the new budget gives priority to R&D, education and social affairs. Additionally, expenditures on military equipment are likely to burden the budget.
Both revenues and expenditure continue their downward trend as % of GDP. Nevertheless, despite buoyant growth of nominal revenues, expenditure is
set to rise unabated, keeping the government deficit close to 1% of GDP, with no improvement in the structural budget balance. The debt ratio is expected to ease down further, dipping below the 60%-of-GDP reference value in 2008.

20. Poland Growth driven by domestic demand, but minor improvement in public finances
- 89 -
36
37
38
39
40
41
42
43
44
45
46
03 04 05 06 07 08
Total expenditure
Total revenue
Forecast
Graph 3.25: Poland - Government total revenue and expenditure
% of GDP
0
1
2
3
4
5
6
7
03 04 05 06 07 08
% ch.
-1.5
-1.0
-0.5
0.0
0.5
1.0
1.5
2.0
2.5
3.0
3.5
% of potential
GDP
Output gap (rhs)Actual GDPPotential GDP
Forecast
Graph 3.26: Poland - Actual and potential GDP growth, output gap
Activity in 2006
At 6.1%, GDP growth in 2006 surprised positively compared to previous expectations (5.3% in the Commission services' autumn 2006 forecast). Economic activity accelerated markedly in the final quarter of 2006 when economic growth reached 6.3% year-on-year on the back of a strong pick-up in investments. A mild winter allowed continuing construction activities and drove up gross fixed capital formation by 16.5% in 2006 as a whole. Domestic demand grew by a strong 6.6% in 2006, also thanks to strong private consumption.
Export growth nearly doubled to 14.5% in comparison with 2005, and import growth surged to 15.8%, up from 4.7% in 2005. Overall, GDP growth in 2006 was supported by domestic demand. The contribution of net exports to GDP growth turned negative (-0.5 percentage points), which can be explained by rising investment- and consumption-driven imports.
Prospects for 2007 and 2008
GDP growth is likely to grow at 6.1% in 2007, moderating to 5.5% in 2008. Domestic demand is expected to be the main driving force in both years. Investment growth is anticipated to remain strong over the forecast period, contributing to rising potential GDP growth, while private consumption should remain robust. This outlook is underpinned by short-term indicators which point to industrial production, retail sales and construction activity reaching historically high levels in the first quarter of 2007. Companies have recorded large profits in 2006 (the highest since 2004) which should spur investment
as capacity utilisation is stretched. The solid financial position of enterprises is also reflected in improved profitability and liquidity ratios across all sectors and a lower total cost ratio. In particular, the situation is better among construction companies, in the services sector and also among exporters. The projected growth of overall investments can reach nearly 18% in 2007 and moderate to about 14% in 2008. It will be supported by increasing absorption of EU funds.
Private consumption is likely to benefit from growing real wages, improving labour market conditions and direct payments to farmers. The planned tax wedge cuts and the reintroduction of the indexation of personal income tax brackets to inflation will also provide a stimulus to consumption.
Growing imports in line with strengthening domestic demand are projected to lead to an increase in the trade and current account deficits this year and next. The deficit in goods trade in 2007 is expected to almost double to 2¾% of GDP and deepen further to about 4% of GDP in 2008. The surplus in services should stabilise at around ¾% of GDP. However, higher transfers from the EU will have a moderating impact on both the current and capital accounts. After reaching 2.1% in 2006, the current account deficit is expected to widen to about 3% in 2007 and 4¼% in 2008. This deficit will continue to be largely financed by a stable inflow of foreign direct investments which in 2006 amounted to about PLN 43 bn (over 4% of GDP).

Economic forecast, spring 2007 Poland
- 90 -
Labour market, costs and prices
Labour market conditions improved substantially in 2006. Employment grew by 3.4%, and is expected to stay on an upward trend over the forecast horizon, though the employment rate will remain low, at 56.5% in 2008. Projected employment growth should translate into a lower unemployment rate, which will come down in 2008 to below 10%, the lowest rate since the beginning of the economic transformation from a centrally planned to a market economy. However, part of the decrease in the unemployment rate is due to a falling participation rate associated with outward labour migration and early retirement. The planned reduction of taxes on labour should also have a favourable impact on employment, though its effect in some sectors may not be very significant within the forecast horizon due to emerging labour shortages.
Unit labour costs fell by 0.7% in 2006. Despite strong productivity growth in the manufacturing sector, rapid wage growth in the non-manufacturing sector will increase unit labour costs in the whole economy by about 1½% in 2007 and ½% in 2008. However, real unit labour costs are expected to fall in the forecast period, increasing the profitability of Polish enterprises. An upside risk for the real unit labour cost stems from the service sector where most jobs are likely to be created and where it is difficult to increase productivity.
HICP inflation fell to 1.3% in 2006 despite relatively high food prices. Planned excise duty hikes and higher wage demands, fuelled partly by labour shortages in certain segments of the market, will put upward pressure on inflation in 2007 and 2008. However, an ample supply of labour, especially among the young, increased competition, falling prices of durable goods and lower fuel prices should mitigate the impact. Furthermore, the Polish Central Bank will keep a tight grip on monetary policy in order to keep the inflation rate around its medium-term target of 2.5%. Thus, inflation is forecast to reach 2.0% in 2007 and 2.5% in 2008.
Public finances
The prospects for public finances have improved since the 2006 autumn forecast as a result of much better than expected growth leading to higher revenues. Additionally, expenditure plans were not
fully executed. At present, the 2006 general government deficit is estimated at 3.9% of GDP compared to an earlier prediction of 4.2% (pension reform costs includedi). In particular, the central government deficit was much lower than budgeted and revenues from social contributions were higher than projected. Expenditures turned out lower because of smaller-than-expected absorption of EU funds, which resulted in less investment. The lower-than-budgeted social expenditure caused by a sharp decline in registered unemployment also contributed to the expenditure savings.
The general government deficit is expected to reach 3.4% of GDP in 2007, as planned in the November 2006 convergence programme. This reflects the better 2006 outturn and expectations of much stronger tax-rich GDP growth than in autumn 2006. The government intends to bring forward social contribution cuts to mid-2007. The reintroduction of the indexation of personal income tax brackets and pro-family tax relief will be the other revenue-reducing measure. However, these tax reductions will be offset by still-high growth of the social contributions’ base thanks to fast rising wages and employment and smaller incentives to stay in the unregistered economy. Besides, as a consequence of social contribution cuts, there will be larger personal income tax revenues, thanks to higher taxable income, and slower increase in expenditure on gross wages in the public sector. Hikes of excise duties on fuel and cigarettes are the main revenue-increasing measures in 2007.
In 2008, based on the customary no policy change assumption, the general government deficit ratio is expected to improve only marginally, to 3.3% of GDP, compared to a target of 3.1% of GDP in the November 2006 convergence programme. The current forecast takes the announced cuts in contributions to the disability funds into consideration. They are estimated at about 1% of GDP and will be partly offset by the same mechanisms as in 2007, namely a wider tax base. If the reorganisation of the public administration starts in 2008, as intended by the government, the outturn may be better than forecast. On the other hand, if costly annual indexation of pensions and social benefits to wage growth is restored, the general government balance may turn out worse.

Chapter 3 Member States, Poland
- 91 -
Table 3.20 Main features of country forecast - POLAND
2005 Annual percentage changebn PLN Curr. prices % GDP 92-02 2003 2004 2005 2006 2007 2008
GDP at previous year prices 982.6 100.0 4.3 3.8 5.3 3.5 6.1 6.1 5.5 Private consumption 619.5 63.0 4.6 1.9 4.2 1.9 5.2 5.9 5.8 Public consumption 177.8 18.1 2.7 4.9 3.1 5.3 3.9 1.6 1.5 Gross fixed capital formation 178.4 18.2 6.8 -0.1 6.4 6.5 16.5 17.9 14.2 of which : equipment 70.7 7.2 - -1.5 8.0 6.5 16.5 17.5 14.2 Exports (goods and services) 364.7 37.1 10.4 14.2 14.0 8.0 15.1 10.1 9.0 Final demand 1350.6 137.5 5.5 5.2 7.9 3.7 8.4 8.2 7.6 Imports (goods and services) 368.0 37.5 11.6 9.3 15.2 4.7 15.4 13.4 12.4 GNI at previous year prices (GDP deflator) 946.3 96.3 4.6 3.0 2.6 4.3 5.8 6.4 5.7 Contribution to GDP growth : Domestic demand 4.8 2.1 4.4 3.4 6.8 7.5 7.0
Stockbuilding -0.1 0.6 1.6 -0.9 -0.8 0.0 0.2Foreign balance -0.4 1.1 -0.8 1.1 -0.2 -1.4 -1.7
Employment - -1.2 1.3 2.3 3.4 2.4 1.9 Unemployment rate (a) 14.2 19.6 19.0 17.7 13.8 11.0 9.0 Compensation of employees/head 22.9 1.7 1.8 2.1 2.0 5.1 3.9 Real unit labour costs - -3.6 -6.0 -1.7 -2.0 -0.9 -2.1 Savings rate of households (b) - - 8.2 9.1 11.1 12.2 14.5 GDP deflator 17.2 0.4 4.1 2.6 1.5 2.3 2.5 Private consumption deflator 18.2 0.4 3.0 2.2 0.9 1.9 2.5 Harmonised index of consumer prices - 0.7 3.6 2.2 1.3 2.0 2.5 Trade balance (c) -3.3 -2.6 -2.3 -0.9 -1.4 -2.6 -3.9 Current account balance (c) -1.9 -2.1 -4.4 -1.7 -2.3 -3.1 -4.3 Net lending(+) or borrowing(-) vis-à-vis ROW (c) -1.0 -2.1 -4.2 -1.4 -1.7 -2.1 -3.3 General government balance (c)(d) - -6.3 -5.7 -4.3 -3.9 -3.4 -3.3 Cyclically-adjusted budget balance (c)(d) - -5.7 -5.8 -4.2 -4.0 -3.6 -3.3 Structural budget balance (c) - -5.7 -5.8 -4.2 -4.0 -3.6 -3.3 General government gross debt (c) - 47.1 45.7 47.1 47.8 48.4 49.1 (a) Eurostat definition. (b) gross saving divided by gross disposable income. (c) as a percentage of GDP. (d) Including proceeds relative to UMTS licences (see for more details note 10 on concepts and sources).
The debt-to-GDP ratio is projected to increase by approximately 1 percentage point between 2006 and 2008 to about 49% of GDP. The stock-flow adjustment – which include lower than planned privatisation proceeds – is expected to have a debt-increasing impact on the debt ratio for the whole forecast period.
i The previous Commission forecasts of government deficits did not include the budgetary cost of the pension reform (about 2% of GDP per year within the forecast horizon), since Poland benefited from the transition period concerning the sectoral classification of the second-pillar pension schemes. The impact of this re-classification in the government debt is estimated at almost 7% of GDP in 2006 and is expected to increase in the following years.

21. Portugal Economic growth resumes but prospects remain contained
- 92 -
-3-2-1012345678
95 96 97 98 99 00 01 02 03 04 05 06 07 08Domestic demand HICPHousehold consumption
Graph 3.27: Portugal - Demand and prices
yoy % ch.
Forecast
Activity in 2006
In 2006, economic activity accelerated by 1.3%, after growing by 0.5% in 2005, with the external sector providing the bulk of GDP growth. Specifically, having gradually improved since late 2005, exports expanded swiftly, helped by lively world demand.
Domestic demand added little to economic activity. Investment receded again, though its components showed divergent behaviour: the downsizing of construction seen since the start of the decade continued, whereas equipment investment growth entered positive territory. A marked contraction in public investment was key in the total investment outturn. Household consumption moderated compared with 2005 and government consumption fell slightly.
The trade developments in 2006 allowed an improvement in the goods and services balance. Yet, and despite also a recovery of current transfers, a widening of the external borrowing was observed, reflecting a sharp deterioration in the primary income balance and, to a lesser extent, in capital transfers.
Prospects for 2007 and 2008
Activity is expected to continue on a moderate upward path, with growth rates projected to come close to 1¾% in 2007 and possibly more in 2008.
In 2007 and 2008, domestic demand is expected to show more resilience than in 2006. Investment will no longer dragging down GDP growth already in 2007, though its pace will crucially depend on the strength of demand prospects and the degree of consolidation
in firms' balance sheets. At the same time, the adjustment in the construction sector does not seem to be fully over. The projected behaviour of household consumption assumes tighter financial conditions against high levels of indebtedness and limited growth of labour income and social transfers.
The external sector is projected to continue making a positive contribution to GDP growth over the forecast period, though lower than in 2006. Benefiting from a still favourable external demand outlook, exports could grow at a quick pace, albeit less rapidly than in 2006, possibly helped also by an apparent orientation towards fast-growing markets. Yet the ongoing adjustments in a number of exporting sectors add uncertainty to this scenario. Import expansion is forecast to be moderate, reflecting the domestic demand outlook.
The projected trade developments, together with the assumed more benign oil prices developments in 2007, should contribute to a gradually narrowing current account deficit. However, the improvement will be partly offset by a higher primary income deficit deriving from the rising external debt.
Labour market, costs and prices
After climbing in recent years, the unemployment rate is now expected to stabilise at almost 7¾% over the forecast period, possibly declining somewhat in 2008. Thus, wage growth is projected to remain contained.
In 2006, inflation rebounded to 3% as a result of high import prices and tax hikes in 2005. In 2007 and 2008, inflation is forecast to fall to some 2¼%, helped by subdued demand at home and moderation in import prices. Overall, price, and to some extent cost, developments continue to be more adverse than in a number of trade partners, albeit by a narrowing margin.
Public finances
In 2006, the general government deficit represented 3.9% of GDP, down from 6.1% of GDP in 2005 and better than the 4.6% of GDP targeted in the stability programme of December 2005. Tax proceeds were brisk, especially thanks to the increase in the VAT standard rate by 2 percentage points in mid-2005, with the revenue buoyancy being further helped by increases in other indirect taxes, cuts on tax benefits and improvements in revenue collection. At the same
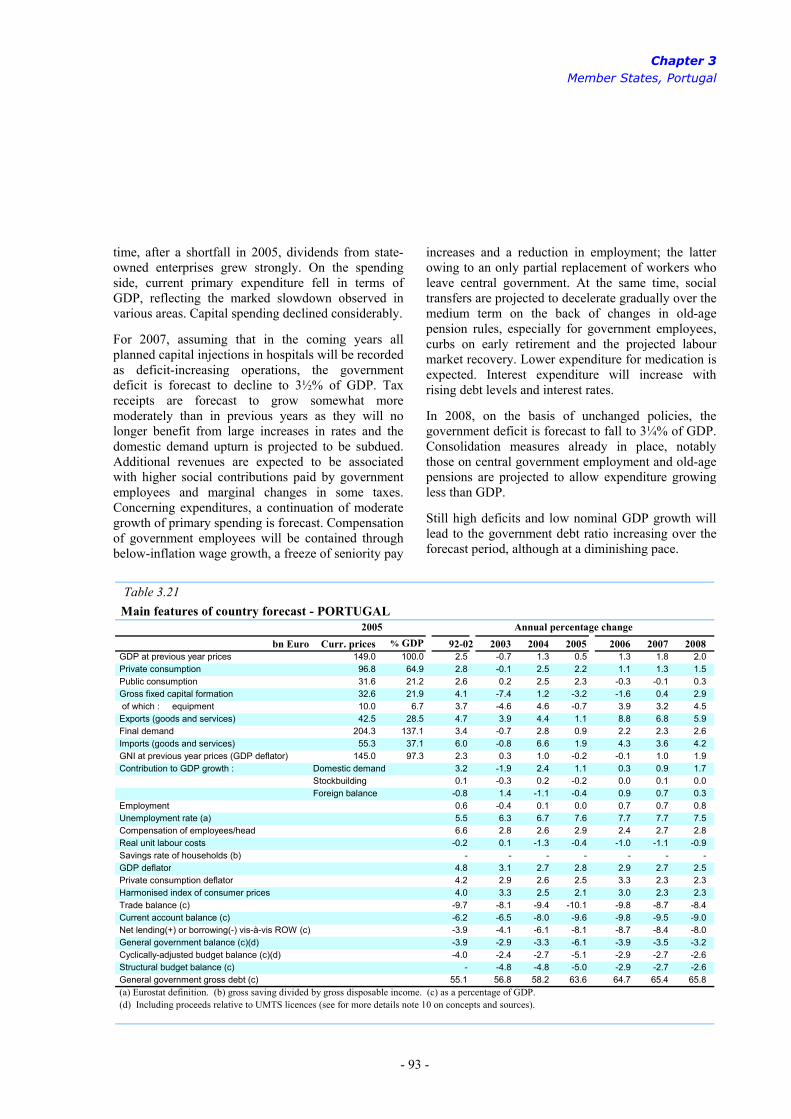
Chapter 3 Member States, Portugal
- 93 -
Table 3.21 Main features of country forecast - PORTUGAL
2005 Annual percentage changebn Euro Curr. prices % GDP 92-02 2003 2004 2005 2006 2007 2008
GDP at previous year prices 149.0 100.0 2.5 -0.7 1.3 0.5 1.3 1.8 2.0 Private consumption 96.8 64.9 2.8 -0.1 2.5 2.2 1.1 1.3 1.5 Public consumption 31.6 21.2 2.6 0.2 2.5 2.3 -0.3 -0.1 0.3 Gross fixed capital formation 32.6 21.9 4.1 -7.4 1.2 -3.2 -1.6 0.4 2.9 of which : equipment 10.0 6.7 3.7 -4.6 4.6 -0.7 3.9 3.2 4.5 Exports (goods and services) 42.5 28.5 4.7 3.9 4.4 1.1 8.8 6.8 5.9 Final demand 204.3 137.1 3.4 -0.7 2.8 0.9 2.2 2.3 2.6 Imports (goods and services) 55.3 37.1 6.0 -0.8 6.6 1.9 4.3 3.6 4.2 GNI at previous year prices (GDP deflator) 145.0 97.3 2.3 0.3 1.0 -0.2 -0.1 1.0 1.9 Contribution to GDP growth : Domestic demand 3.2 -1.9 2.4 1.1 0.3 0.9 1.7
Stockbuilding 0.1 -0.3 0.2 -0.2 0.0 0.1 0.0Foreign balance -0.8 1.4 -1.1 -0.4 0.9 0.7 0.3
Employment 0.6 -0.4 0.1 0.0 0.7 0.7 0.8 Unemployment rate (a) 5.5 6.3 6.7 7.6 7.7 7.7 7.5 Compensation of employees/head 6.6 2.8 2.6 2.9 2.4 2.7 2.8 Real unit labour costs -0.2 0.1 -1.3 -0.4 -1.0 -1.1 -0.9 Savings rate of households (b) - - - - - - - GDP deflator 4.8 3.1 2.7 2.8 2.9 2.7 2.5 Private consumption deflator 4.2 2.9 2.6 2.5 3.3 2.3 2.3 Harmonised index of consumer prices 4.0 3.3 2.5 2.1 3.0 2.3 2.3 Trade balance (c) -9.7 -8.1 -9.4 -10.1 -9.8 -8.7 -8.4 Current account balance (c) -6.2 -6.5 -8.0 -9.6 -9.8 -9.5 -9.0 Net lending(+) or borrowing(-) vis-à-vis ROW (c) -3.9 -4.1 -6.1 -8.1 -8.7 -8.4 -8.0 General government balance (c)(d) -3.9 -2.9 -3.3 -6.1 -3.9 -3.5 -3.2 Cyclically-adjusted budget balance (c)(d) -4.0 -2.4 -2.7 -5.1 -2.9 -2.7 -2.6 Structural budget balance (c) - -4.8 -4.8 -5.0 -2.9 -2.7 -2.6 General government gross debt (c) 55.1 56.8 58.2 63.6 64.7 65.4 65.8 (a) Eurostat definition. (b) gross saving divided by gross disposable income. (c) as a percentage of GDP. (d) Including proceeds relative to UMTS licences (see for more details note 10 on concepts and sources).
time, after a shortfall in 2005, dividends from state-owned enterprises grew strongly. On the spending side, current primary expenditure fell in terms of GDP, reflecting the marked slowdown observed in various areas. Capital spending declined considerably.
For 2007, assuming that in the coming years all planned capital injections in hospitals will be recorded as deficit-increasing operations, the government deficit is forecast to decline to 3½% of GDP. Tax receipts are forecast to grow somewhat more moderately than in previous years as they will no longer benefit from large increases in rates and the domestic demand upturn is projected to be subdued. Additional revenues are expected to be associated with higher social contributions paid by government employees and marginal changes in some taxes. Concerning expenditures, a continuation of moderate growth of primary spending is forecast. Compensation of government employees will be contained through below-inflation wage growth, a freeze of seniority pay
increases and a reduction in employment; the latter owing to an only partial replacement of workers who leave central government. At the same time, social transfers are projected to decelerate gradually over the medium term on the back of changes in old-age pension rules, especially for government employees, curbs on early retirement and the projected labour market recovery. Lower expenditure for medication is expected. Interest expenditure will increase with rising debt levels and interest rates.
In 2008, on the basis of unchanged policies, the government deficit is forecast to fall to 3¼% of GDP. Consolidation measures already in place, notably those on central government employment and old-age pensions are projected to allow expenditure growing less than GDP.
Still high deficits and low nominal GDP growth will lead to the government debt ratio increasing over the forecast period, although at a diminishing pace.

22. Romania Strong domestic expansion and loose fiscal policy
- 94 -
-10
-5
0
5
10
15
20
03 04 05 06 07 08Domestic InventoriesExternal Total growth
Graph 3.28: Romania - GDP growth and its contributors
Forecastyoy % ch.
Activity in 2006
After a slowdown in 2005, mainly due to the negative impact of floods, real GDP growth picked up to 7.7% in 2006, as compared to 4.1% in the previous year. This above-potential growth performance is mainly driven by strong domestic demand, especially private consumption, due to wage growth and a sharp increase in domestic credit availability. Also investment was strong, supported by considerable FDI inflows, flood repairs and the acceleration of public investment projects. From the supply side, whereas services were the largest contributor to GDP growth, the highest growth rates were recorded in the construction sector.
Strong domestic demand has resulted in a further widening of the trade deficit to 12.1% of GDP in 2006, up from 9.8% in 2005. Thus, net exports contributed negatively to growth, notwithstanding increasing current transfers from abroad. The current account deficit widened, reaching 10.3% of GDP in 2006, 90% of which was covered by FDI and capital transfers.
Consumer price inflation declined to 6.6%, but the disinflation process slowed despite the drop in food prices, the lowering of the world market price of oil and the fall in import prices caused by the real appreciation of the domestic currency.
In spite of the contraction of several labour-intensive industries (especially textiles and clothing), employment recorded a high growth rate in 2006 of 2.8%, the increase coming on the back of buoyant economic activity, sustained FDI inflows and a
reduction of the informal labour market due to the tax reform in 2005.
Prospects for 2007 and 2008
Real GDP growth is expected to decelerate from 7.7% in 2006 to 6.3% in 2008. Industrial activity is projected to remain resilient against the backdrop of the challenges posed by EU accession and the redirection of output growth towards higher value-added sectors.
Strong domestic demand dynamics are foreseen to persist over the forecast period. Gross fixed capital formation is expected to grow robustly, by around 14% annually, outpacing the growth in consumption expenditure, on the back of continued FDI inflows and public investment. Private consumption growth will remain buoyant due to high wage growth and surging credit growth, both in leu and foreign currency. Public consumption is expected to record a steady expansion, mainly driven by an increase in wages and social transfers.
Annual average consumer price inflation is expected to gradually decline to around 4.5% in 2008, consistent with a relatively tight monetary policy. In addition, falling import prices thanks to the appreciation of the currency and a slow adjustment of administered prices towards cost-recovery levels will help contain inflation. However, the fiscal stimulus, the evolution of credit growth and the evolution of public sector wages will put some upward pressures on inflation from the demand side.
An increase in employment of about 1% is anticipated over the forecast period, which is lower than in 2006, but higher than the modest increases of around 0.3% in 2004-2005. The job creation process in the private sector will be sustained by high foreign investments and a further reduction of the informal economy, offsetting the ongoing lay-offs in state-owned enterprises and some labour-intensive industries.
Robust domestic demand, supported by buoyant credit expansion and the appreciation of the currency fuelling imports as well as the envisaged loosening of fiscal policy are likely to contribute to a further widening of the current account deficit, which is expected to reach 12.3% of GDP in 2008, in spite of increased EU transfers and higher remittances from

Chapter 3 Member States, Romania
- 95 -
Table 3.22 Main features of country forecast - ROMANIA
2005 Annual percentage changebn RON Curr. prices % GDP 92-02 2003 2004 2005 2006 2007 2008
GDP at constant prices 288.0 100.0 0.7 5.2 8.5 4.1 7.7 6.7 6.3 Private consumption 200.0 69.4 2.0 8.4 14.6 9.6 13.8 11.9 9.9 Public consumption 52.4 18.2 2.1 7.7 -4.9 9.0 2.5 4.8 5.1 Gross fixed capital formation 66.5 23.1 5.9 8.6 11.1 12.6 16.1 14.6 13.7 of which : equipment 32.4 11.3 7.6 18.0 8.2 12.9 14.5 13.8 13.5 Exports (goods and services) 94.9 32.9 11.2 8.4 13.9 8.1 10.6 9.4 8.1 Final demand 412.7 143.3 2.2 8.4 12.5 8.0 12.3 11.3 9.7 Imports (goods and services) 124.7 43.3 10.3 16.0 22.1 16.6 23.0 21.6 17.1 GNI at constant prices (GDP deflator) 279.7 97.1 0.6 3.9 6.4 5.5 7.5 6.9 6.6 Contribution to GDP growth : Domestic demand 3.7 8.8 11.1 10.9 13.8 12.8 11.3
Stockbuilding -2.3 0.1 1.9 -2.2 0.3 0.5 0.2Foreign balance -0.5 -3.6 -4.5 -4.5 -6.4 -6.6 -5.2
Employment -2.3 -0.3 0.4 0.2 2.8 1.2 1.0 Unemployment rate (a) 6.2 7.0 8.1 7.2 7.4 7.2 7.1 Compensation of employees/head 84.8 22.7 17.8 19.3 17.8 16.7 14.0 Real unit labour costs -0.3 -6.2 -5.2 2.2 1.8 0.8 0.1 Savings rate of households (b) - - - - - - - GDP deflator 79.9 24.0 15.0 12.2 10.4 9.8 8.1 Private consumption deflator 79.6 15.2 13.9 7.1 5.1 4.3 3.8 Harmonised index of consumer prices - 15.3 11.9 9.1 6.6 4.6 4.5 Trade balance (c) -6.8 -7.6 -8.7 -9.8 -12.1 -13.9 -14.8 Current account balance (c) - -4.8 -5.0 -8.7 -10.3 -12.1 -12.3 Net lending(+) or borrowing(-) vis-à-vis ROW (c) -4.0 -4.3 -4.1 - -10.3 -11.2 -11.4 General government balance (c)(d) - -1.5 -1.5 -1.4 -1.9 -3.2 -3.2 Cyclically-adjusted budget balance (c)(d) - -0.6 -1.7 -1.2 -2.2 -3.5 -3.3 Structural budget balance (c) - -0.6 -1.7 -1.2 -2.2 -3.5 -3.3 General government gross debt (c) - 21.5 18.8 15.8 12.4 12.8 13.1 (a) Eurostat definition. (b) gross saving divided by gross disposable income. (c) as a percentage of GDP. (d) Including proceeds relative to UMTS licences (see for more details note 10 on concepts and sources).
abroad. Capital transfers linked to EU funds will mitigate the impact on the external balance.
Public finance
Despite higher revenues thanks to higher-than-expected growth, the 2006 general government deficit increased to 1.9% of GDP, compared with 1.4% in 2005, mainly owing to an increase in public wages, government consumption of goods and services and social transfersi. The 2007 budget foresees a pro-cyclical expansion. As a consequence, the deficit may increase to 3.2% of GDP and is expected to remain at the same level in 2008. Over the forecast period, revenues from direct taxes are projected to increase relative to GDP, fuelled by favourable macroeconomic conditions and the continued efforts to broaden the tax base and to improve tax collection. However, the increasingly relaxed expenditure policy will cause considerably higher current spending, notably on social transfers and wages, as well as in
capital expenditure, even though implementation difficulties might not allow the government's ambitious investment programme to be met. Furthermore, uncertainties over the additional budgetary impact of the Property Fund scheme for compensation of citizens for the non-return of confiscated property may exacerbate budgetary pressures. The stock of public debt is expected to remain stable at around 13% of GDP, mainly thanks to strong nominal GDP growth.
i It should be noted that from 2003 onwards the level of the revenue- and expenditure ratios are lower than in the autumn 2006 forecast due to a change in the consolidation method.

23. Slovenia Solid economic growth with steady consumption and decelerating investment
- 96 -
0
2
4
6
8
10
12
14
98 99 00 01 02 03 04 05 06 07 08labour productivityHICPnominal compensation per employee
Forecast yoy % ch
Graph 3.29: Slovenia - Price and wage developments
Activity xin 2006
The GDP growth of the Slovenian economy in 2006 was 5.2% in real terms. It was its highest growth rate since 1999, despite the rise in oil prices.
The main impetus for the economy in 2006 came from an impressive build-up of gross fixed capital. In particular, investment in equipment, related to production restructuring to improve competitiveness in the context of the adoption of the euro, was buoyant. In addition, construction increased at a similar pace, inter alia, thanks to the booming housing component as well as intense motorway construction. At the same time, private consumption remained strong. On the other hand, external demand acted as a drag on GDP growth because of the increased import penetration, partly linked to the strong demand for investment goods.
Prospects for 2007 and 2008
In 2007, real GDP growth is projected to decelerate to 4.3%. Households are likely to continue increasing their consumption at a solid pace, thanks in part to the impact of the personal income tax reform, which curbs taxation progression by reducing the number of tax brackets from five to three and capping the top tax rate at 41%, down from 50%. Investment expenditure by firms is expected to decelerate significantly after the exceptionally high growth rate in 2006. Gross fixed capital formation, however, is anticipated to stay robust on account of strong construction activity. Housing construction, in particular, is forecast to continue increasing strongly until 2008, when the transition period allowing a reduced VAT rate for
housing expires. Furthermore, a major investment in highway construction is planned. Export expansion is expected to decelerate slightly in view of a somewhat less favourable external environment. However it will remain robust due inter alia to the increased production capacity of the car industry. Imports are projected to decelerate to a greater extent on the back of the slowdown of investment, resulting in a small positive contribution of net exports to GDP growth.
The projections foresee a further slight deceleration of economic growth in 2008 with output increasing by 4.0%, in line with the production potential of the Slovenian economy. Private consumption is forecast to weaken somewhat but remaining buoyant. Similarly, investment is expected to continue to slow down due to the anticipated decrease in public investment activity. Consequently, imports are projected to slowdown moderately matching the deceleration in external demand, so that the small positive contribution of net exports to GDP growth will remain stable. The current account deficit is projected to decline, approaching 2% of GDP.
Labour market, costs and prices
During the first eight months of 2006, a smooth disinflationary trend was interrupted by rising oil prices. Nonetheless, the annual inflation rate for 2006 was 2.5%, unchanged compared with 2005. The possibility of counteracting the adverse effects of high oil prices by adjusting the excise taxes on energy products has not been available since July 2005, when the lowest level of taxes allowed by EU legislation was reached.
The consumer price level increase is projected to stabilise around its 2006 level throughout the forecast period, given the moderation of aggregate demand and the containment of unit labour cost increases at relatively low levels. Apart from oil prices, however, inflation prospects are vulnerable to the liberalisation of the electricity and natural gas market for households planned for 1 July 2007. Moreover, there are uncertainties related to the potential increase in VAT rates, which could add some 0.8 percentage points to the rate of inflation in the year when the new regime comes into effect.
The unemployment rate of 6% in 2006 is a result of the situation in the labour market having markedly improved on the back of solid economic activity. The

Chapter 3 Member States, Slovenia
- 97 -
Table 3.23 Main features of country forecast - SLOVENIA
2005 Annual percentage changebn Euro Curr. prices % GDP 92-02 2003 2004 2005 2006 2007 2008
GDP at previous year prices 27.6 100.0 3.1 2.7 4.4 4.0 5.2 4.3 4.0 Private consumption 15.2 54.9 3.8 3.5 2.6 3.4 3.3 3.6 3.4 Public consumption 5.4 19.6 2.9 1.6 3.4 2.2 3.8 3.4 3.2 Gross fixed capital formation 6.7 24.4 7.2 7.1 7.9 1.5 11.8 6.0 5.5 of which : equipment 2.8 10.0 9.7 11.5 7.6 3.0 12.3 5.5 5.0 Exports (goods and services) 17.8 64.6 3.1 3.1 12.5 10.5 10.0 9.0 8.1 Final demand 45.6 165.1 4.1 4.2 8.0 5.3 7.5 6.1 5.6 Imports (goods and services) 18.0 65.1 5.3 6.7 13.4 7.0 10.4 8.7 7.9 GNI at previous year prices (GDP deflator) 27.4 99.1 3.1 2.4 4.0 4.3 4.9 4.3 4.0 Contribution to GDP growth : Domestic demand 4.1 4.0 4.2 2.5 5.5 4.1 3.9
Stockbuilding 0.3 0.8 1.0 -0.6 0.1 0.0 0.0Foreign balance -1.3 -2.0 -0.5 2.0 -0.3 0.1 0.1
Employment - -0.4 0.5 0.3 1.2 0.7 0.5 Unemployment rate (a) - 6.7 6.3 6.5 6.0 5.8 5.6 Compensation of employees/head - 6.6 7.6 5.4 4.8 5.2 5.5 Real unit labour costs - -2.2 0.3 0.1 -1.5 -1.2 -0.8 Savings rate of households (b) - - - - - - - GDP deflator 24.1 5.8 3.3 1.5 2.3 2.8 2.8 Private consumption deflator 23.5 5.4 3.3 2.2 2.4 2.5 2.6 Harmonised index of consumer prices - 5.7 3.7 2.5 2.5 2.6 2.7 Trade balance (c) -2.6 -2.2 -3.8 -3.7 -3.7 -3.3 -3.0 Current account balance (c) 0.7 -0.8 -2.6 -2.0 -2.7 -2.4 -2.3 Net lending(+) or borrowing(-) vis-à-vis ROW (c) 0.7 -0.8 -2.5 -1.9 -2.5 -2.2 -2.1 General government balance (c)(d) - -2.8 -2.3 -1.5 -1.4 -1.5 -1.5 Cyclically-adjusted budget balance (c)(d) - -2.0 -1.8 -1.1 -1.5 -1.7 -1.7 Structural budget balance (c) - -2.0 -1.8 -1.1 -1.5 -1.7 -1.7 General government gross debt (c) - 28.6 28.9 28.4 27.8 27.5 27.2 (a) Eurostat definition. (b) gross saving divided by gross disposable income. (c) as a percentage of GDP. (d) Including proceeds relative to UMTS licences (see for more details note 10 on concepts and sources).
unemployment rate is expected to decrease slightly following moderate increases in employment and labour supply throughout the forecast period. Wage developments are expected to mirror the strong increase in labour productivity and moderating inflation expectations.
Public finances
In 2006, the general government deficit was 1.4% of GDP, broadly unchanged compared to 2005. Thanks to positive economic development current revenues continued to be buoyant; however this was almost entirely offset by a significant increase in current expenditure. A similar deficit at 1½% of GDP is forecast for 2007 as the deceleration in the tax revenue linked to the extensive tax reforms will be matched by moderate increase in expenditure. The government deficit ratio in 2008 is expected to be maintained at the 2006 and 2007 level. The main risks to this budgetary forecast are linked to the uncertainty
about the final impact of the above-mentioned tax reforms, which can result in lower or higher revenues compared to official projections. Over the forecast horizon, the general government debt is expected to stay stable below 30% of GDP.

24. Slovakia Strong growth expected to peak in 2007
- 98 -
0
1
2
3
4
5
6
7
8
9
03 04 05 06 07 0802468101214161820
Unemployment rate (lhs) GDP growth Inflation
yoy % ch.
Forecast
Graph 3.30: Slovakia - GDP growth, unemployment rate and inflation
% of lab. force
Activity in 2006
Economic growth in 2006 accelerated rapidly, to around 8¼% from the 6% recorded in 2005. It was mainly driven by domestic demand, particularly by investment and private consumption, but the external growth contribution also entered positive territory.
Private consumption expenditure increased by some 6% benefiting from strong wage and employment growth. Gross fixed capital formation growth decelerated by some 10 percentage points, as some big investment projects in the corporate sector were finalised in the first half of the year, but remained strong at around 7¼%. The positive contribution of net exports was induced by a rapid acceleration of real export growth to above 20% as newly built export capacities in the automotive and electronics sectors entered production in the course of the year.
Accelerating real exports have had only a limited positive impact on the goods and services balance which, nevertheless, contributed to a decline in net borrowing from the rest of the world to below 8% of GDP in 2006.
Prospects for 2007 and 2008
Economic expansion is expected to accelerate to around 8½% in 2007 and then to decelerate to around 6½% in 2008. Domestic demand is likely to remain the main driving force, while the positive external contribution should peak in 2007, when the growth contribution of new export capacities should be fully realised.
A further improving labour market situation combined with strong credit growth is expected to continue to support private consumption growth, which, despite slowing down, should remain at well above 5% over the forecast period. Gross fixed capital formation should remain healthy at around 7% and 6% in 2007 and 2008 thanks to additional foreign direct investments in the electronics sector.
Decelerating investment and consumption should contribute to a slowdown in import growth. As exports are expected to continue to outpace imports over the forecast horizon the trade deficit should decrease significantly and thus contribute to a decrease in net borrowing in 2007 and 2008.
Labour market, costs and prices
Total employment increased by 2¼% in 2006 while the unemployment rate fell by almost 3 percentage points to below 14%. Similar, though slower, trends are anticipated in 2007 and 2008 as strong domestic demand and newly built export production capacities are expected to continue to provide additional employment opportunities. Thanks to significant productivity increases, nominal unit labour costs are expected to only increase moderately over the forecast horizon despite strong wage growth.
Adjustments in administered prices at the end of 2005 induced by rising energy prices led to an increase in average annual HICP inflation to some 4¼% in 2006. Due to lower increases in regulated prices in the energy sector and substantial exchange rate appreciation over the last six months, HICP inflation is anticipated to drop to below 2% in 2007. Assuming that only moderate adjustments in administered prices are implemented in 2008 and that the exchange rate remains around current levels, annual average HICP inflation is forecast to increase to around 2½% in 2008.
Public finances
A pension reform was launched in 2005, affecting social contributions by redirecting 9% of gross wages to a funded (second) pension pillar. Due to a gradual transition and strong participation in this scheme, these revenue transfers are estimated to have increased from some ¾% of GDP in 2005 to almost 1¼% of GDP in 2006 and should stay at that level in 2007 and 2008.

Chapter 3 Member States, Slovakia
- 99 -
Table 3.24 Main features of country forecast - SLOVAKIA
2005 Annual percentage changebn SKK Curr. prices % GDP 92-02 2003 2004 2005 2006 2007 2008
GDP at constant prices 1471.1 100.0 - 4.2 5.4 6.0 8.3 8.5 6.5 Private consumption 844.2 57.4 - 0.2 4.2 7.0 6.1 6.6 5.6 Public consumption 272.2 18.5 - 3.9 2.0 -0.6 4.1 3.9 3.3 Gross fixed capital formation 394.6 26.8 - -2.3 5.0 17.5 7.3 7.1 6.1 of which : equipment 196.1 13.3 - -0.2 -0.5 24.0 15.2 10.9 8.8 Exports (goods and services) 1136.9 77.3 - 15.9 7.9 13.8 20.7 19.0 11.9 Final demand 2682.7 182.4 - 5.7 7.0 10.9 13.0 12.0 8.4 Imports (goods and services) 1211.5 82.4 - 7.6 8.8 16.6 17.8 15.8 10.5 GNI at constant prices (GDP deflator) 1433.6 97.4 - 3.6 6.7 2.9 7.7 8.7 6.6 Contribution to GDP growth : Domestic demand - 0.3 4.0 8.2 6.1 6.4 5.3
Stockbuilding - -1.6 2.3 0.6 0.4 0.1 0.1Foreign balance - 5.5 -0.9 -2.8 1.7 2.0 1.1
Employment - 1.8 -0.3 1.4 2.3 1.7 0.9 Unemployment rate (a) - 17.6 18.2 16.3 13.4 12.2 11.7 Compensation of employees/head - 8.1 9.2 5.1 7.7 7.4 6.9 Real unit labour costs - 0.8 -2.7 -1.8 -1.0 -2.6 -1.0 Savings rate of households (b) - - 7.4 7.8 9.6 10.6 10.6 GDP deflator - 4.7 6.0 2.4 2.7 3.3 2.3 Private consumption deflator - 6.6 7.4 2.6 5.1 2.7 3.3 Harmonised index of consumer prices - 8.4 7.5 2.8 4.3 1.7 2.4 Trade balance (c) - -2.5 -3.8 -5.9 -5.9 -3.0 -2.6 Current account balance (c) - -2.1 -2.5 -7.9 -7.7 -4.2 -3.7 Net lending(+) or borrowing(-) vis-à-vis ROW (c) - -2.5 -2.3 -8.1 -7.8 -4.0 -3.5 General government balance (c)(d) - -2.7 -2.4 -2.8 -3.4 -2.9 -2.8 Cyclically-adjusted budget balance (c)(d) - -1.9 -1.7 -2.1 -3.3 -3.4 -3.3 Structural budget balance (c) - -1.5 -1.7 -1.2 -3.3 -3.4 -3.3 General government gross debt (c) - 42.4 41.5 34.5 30.7 29.7 29.4 (a) Eurostat definition. (b) gross saving divided by gross disposable income. (c) as a percentage of GDP. (d) Including proceeds relative to UMTS licences (see for more details note 10 on concepts and sources).
The January 2006 increases in excise taxes on cigarettes and alcohol induced a large accumulation of stocks of these products by consumers and enterprises at the end of 2005 which was not foreseen in the 2006 budget and had a negative impact on tax revenues in 2006 of around ¼% of GDP. Nevertheless, higher-than-expected GDP and employment growth combined with lower interest expenditure ensured that the 2006 general government deficit (including the pension reform costs) ended up at around 3½% of GDP, some ¾ percentage point below the level foreseen in the 2006 budget, in spite of increases in some public expenditure. The latter were mitigated by the fact that a lower-than-expected absorption of EU funds eased demands on public expenditure through co-financing.
Thanks to strong economic activity and restrained public expenditure growth, the general government deficit (including the pension reform costs) is anticipated to fall to below 3% of GDP in 2007 if the
government thoroughly implements the 2007 budget. In order to respect the 3% deficit limit the government decided to introduce spending cuts in different areas, while increasing expenditures available to the education and social affairs ministries below nominal GDP growth. Nevertheless, increased health spending represents a downside risk for the budget.
Under the customary no-policy-change assumption the budget deficit (including the pension reform costs) is projected to decrease to around 2¾% in 2008.
Gross public debt is expected to continue falling over the forecast period thanks mainly to strong GDP growth.
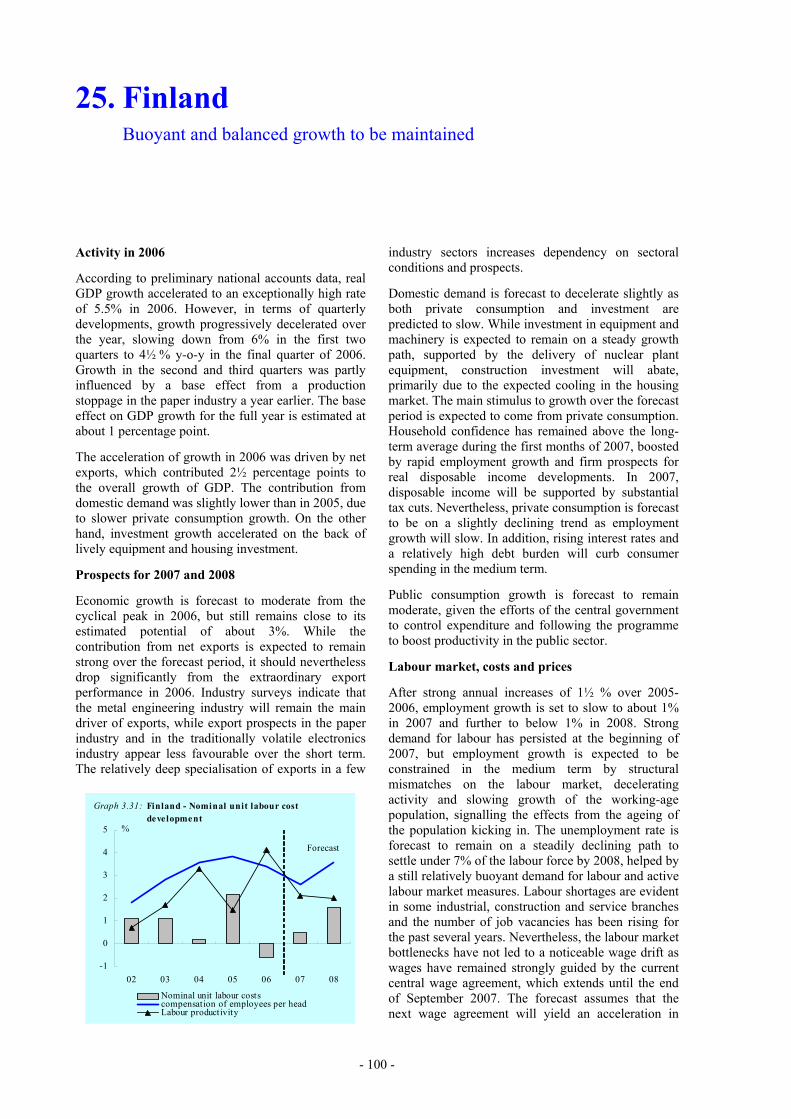
25. Finland Buoyant and balanced growth to be maintained
- 100 -
-1
0
1
2
3
4
5
02 03 04 05 06 07 08
Nominal unit labour costscompensation of employees per headLabour productivity
%
Forecast
Graph 3.31: Finland - Nominal unit labour cost development
Activity in 2006
According to preliminary national accounts data, real GDP growth accelerated to an exceptionally high rate of 5.5% in 2006. However, in terms of quarterly developments, growth progressively decelerated over the year, slowing down from 6% in the first two quarters to 4½ % y-o-y in the final quarter of 2006. Growth in the second and third quarters was partly influenced by a base effect from a production stoppage in the paper industry a year earlier. The base effect on GDP growth for the full year is estimated at about 1 percentage point.
The acceleration of growth in 2006 was driven by net exports, which contributed 2½ percentage points to the overall growth of GDP. The contribution from domestic demand was slightly lower than in 2005, due to slower private consumption growth. On the other hand, investment growth accelerated on the back of lively equipment and housing investment.
Prospects for 2007 and 2008
Economic growth is forecast to moderate from the cyclical peak in 2006, but still remains close to its estimated potential of about 3%. While the contribution from net exports is expected to remain strong over the forecast period, it should nevertheless drop significantly from the extraordinary export performance in 2006. Industry surveys indicate that the metal engineering industry will remain the main driver of exports, while export prospects in the paper industry and in the traditionally volatile electronics industry appear less favourable over the short term. The relatively deep specialisation of exports in a few
industry sectors increases dependency on sectoral conditions and prospects.
Domestic demand is forecast to decelerate slightly as both private consumption and investment are predicted to slow. While investment in equipment and machinery is expected to remain on a steady growth path, supported by the delivery of nuclear plant equipment, construction investment will abate, primarily due to the expected cooling in the housing market. The main stimulus to growth over the forecast period is expected to come from private consumption. Household confidence has remained above the long-term average during the first months of 2007, boosted by rapid employment growth and firm prospects for real disposable income developments. In 2007, disposable income will be supported by substantial tax cuts. Nevertheless, private consumption is forecast to be on a slightly declining trend as employment growth will slow. In addition, rising interest rates and a relatively high debt burden will curb consumer spending in the medium term.
Public consumption growth is forecast to remain moderate, given the efforts of the central government to control expenditure and following the programme to boost productivity in the public sector.
Labour market, costs and prices
After strong annual increases of 1½ % over 2005-2006, employment growth is set to slow to about 1% in 2007 and further to below 1% in 2008. Strong demand for labour has persisted at the beginning of 2007, but employment growth is expected to be constrained in the medium term by structural mismatches on the labour market, decelerating activity and slowing growth of the working-age population, signalling the effects from the ageing of the population kicking in. The unemployment rate is forecast to remain on a steadily declining path to settle under 7% of the labour force by 2008, helped by a still relatively buoyant demand for labour and active labour market measures. Labour shortages are evident in some industrial, construction and service branches and the number of job vacancies has been rising for the past several years. Nevertheless, the labour market bottlenecks have not led to a noticeable wage drift as wages have remained strongly guided by the current central wage agreement, which extends until the end of September 2007. The forecast assumes that the next wage agreement will yield an acceleration in

Chapter 3 Member States, Finland
- 101 -
Table 3.25 Main features of country forecast - FINLAND
2005 Annual percentage changebn Euro Curr. prices % GDP 92-02 2003 2004 2005 2006 2007 2008
GDP at constant prices 157.2 100.0 2.8 1.8 3.7 2.9 5.5 3.1 2.7 Private consumption 81.2 51.7 1.9 4.8 3.0 3.8 3.0 2.8 2.7 Public consumption 34.8 22.1 0.6 1.5 1.8 1.7 0.9 1.2 1.3 Gross fixed capital formation 29.8 18.9 1.2 4.0 3.6 3.7 5.1 4.1 3.3 of which : equipment 8.2 5.2 1.9 7.0 0.4 0.7 5.4 5.2 4.9 Exports (goods and services) 65.7 41.8 9.9 -1.7 8.6 7.1 10.7 6.6 6.2 Final demand 214.1 136.2 3.7 2.0 4.8 5.4 5.5 3.9 3.7 Imports (goods and services) 57.0 36.2 6.4 3.3 7.8 12.2 5.4 6.2 6.4 GNI at constant prices (GDP deflator) 157.8 100.4 3.2 0.1 5.9 2.7 5.5 3.1 2.7 Contribution to GDP growth : Domestic demand 1.2 3.6 2.5 3.0 2.7 2.5 2.3
Stockbuilding 0.3 0.0 0.2 1.1 0.0 0.0 0.0Foreign balance 1.5 -1.7 1.0 -1.1 2.5 0.6 0.3
Employment 0.0 0.1 0.4 1.4 1.4 1.0 0.7 Unemployment rate (a) 12.4 9.0 8.8 8.4 7.7 7.2 6.8 Compensation of employees/head 2.8 2.8 3.6 3.8 3.4 2.6 3.6 Real unit labour costs -1.9 1.5 -0.4 2.0 -1.9 -1.2 0.0 Savings rate of households (b) - - 9.2 7.7 6.6 6.0 5.5 GDP deflator 2.0 -0.4 0.6 0.2 1.3 1.8 1.6 Private consumption deflator 2.2 -0.4 1.0 0.1 1.9 1.7 1.7 Harmonised index of consumer prices 1.9 1.3 0.1 0.8 1.3 1.5 1.7 Trade balance (c) 8.8 7.8 6.7 4.9 5.7 5.7 5.1 Current account balance (c) 4.5 5.9 7.7 4.9 5.9 6.1 5.8 Net lending(+) or borrowing(-) vis-à-vis ROW (c) 4.6 6.0 7.8 5.1 6.6 6.8 6.5 General government balance (c)(d) -1.0 2.5 2.3 2.7 3.9 3.7 3.6 Cyclically-adjusted budget balance (c)(d) -0.2 3.4 3.0 3.6 3.7 3.5 3.6 Structural budget balance (c) - 3.4 3.0 3.6 3.7 3.5 3.6 General government gross debt (c) 49.2 44.3 44.1 41.4 39.1 37.0 35.2 (a) Eurostat definition. (b) gross saving divided by gross disposable income. (c) as a percentage of GDP. (d) Including proceeds relative to UMTS licences (see for more details note 10 on concepts and sources).
wage growth in 2008, reflecting the tight labour market conditions in some sectors. As a result, unit labour costs will embark on a clearly rising trend.
Finland recorded the lowest HICP inflation rates in the euro area in 2004-2006. Apart from special one-off factors, this has resulted from Finnish price levels being about one fifth higher than in the euro area on average, which has left room for competition-induced price moderation. HICP inflation is forecast to increase marginally over the forecast period from the 1.3% recorded in 2006, mainly driven by housing-related costs and services price rises. In 2008, the predicted hike in unit labour costs will add to inflationary pressures.
Public finances
The general government surplus in 2006 reached 3.9% of GDP, 1 percentage point higher than what was expected in the previous autumn forecast. Over half of the difference originates from the social
security sector, which benefited from a sharp rise in revenue from social contributions. The central and local governments also recorded stronger fiscal balances on the back of strong tax and non-tax revenues and expenditure restraint. The higher surplus will carry over to 2007 and 2008. The surplus is forecast to remain slightly above 3½ % of GDP over 2007-2008 under a no-policy-change assumption. No new tax or expenditure measures (which might be taken by the new government that took office in spring 2007) are assumed for 2008, apart from the usual inflation adjustment to income tax scales.
The government debt ratio is projected to decline steeply, to about 35% of GDP, by the end of the forecast period.

26. Sweden Continued steady growth and high fiscal surpluses
- 102 -
-3
-2
-1
0
12
3
4
5
6
99 00 01 02 03 04 05 06 07 08-3
-2
-1
0
12
3
4
5
6
Output gap (rhs) Domestic demandNet exports GDP growth
Graph 3.32: Sweden - GDP growth, growth contributions and output gap
%yoy % ch.
Activity in 2006
In 2006, economic activity accelerated strongly, with real GDP growing by 4.4% compared with 2.9% in 2005. The pick-up has been broad-based with both solid private consumption growth and a positive investment cycle supporting domestic demand. In addition, net exports contributed significantly to growth owing notably to higher exports of goods.
Prospects for 2007 and 2008
In the coming two years, the economy is projected to continue growing steadily, though at a slower speed. GDP growth is projected to decelerate gradually to about 3¾% in 2007 and 3¼% in 2008, slightly above potential growth. Private consumption is expected to accelerate further and consolidate its position as the main driver of GDP growth. Investments are bound to subside somewhat after expanding strongly in recent years, but high capacity utilisation and strong balance sheets in the private sector are still anticipated to provide continued momentum. Moreover, net exports are expected to further add to growth, albeit only marginally, as export market growth is set to moderate and strong domestic demand will support imports.
The steady growth in private consumption is supported by the resumption of employment growth, lower taxes on labour income and higher real wages, which contribute positively to household disposable income. While households have taken on more debt, financial wealth has benefited from rising equity and property prices, contributing to the maintenance of a relatively strong net wealth position. A gradual
reduction of the saving rate is likely to materialise over the forecast period.
Finally, growth of public consumption is projected to add support to GDP growth, reflecting in particular the strong public finance situation at local level.
Labour market, costs and prices
The continuing strong pace of economic activity over the forecast period is expected to be accompanied by a moderation in labour productivity growth as the cyclical impulse moderates. After a period of weakness, private sector employment growth is expected to build on the improved situation in 2006 and to remain dynamic over the forecast period. The measures adopted by the new government in the autumn of 2006 are set to provide additional impetus to the labour market. The measures are mainly aimed at increasing labour supply and employment via changes in tax and benefit systems. Overall, employment is foreseen to grow strongly over the forecast period and unemployment is expected to fall to below 6% of the labour force in 2008.
The weak developments in the labour market over the last few years have helped to contain wage demands. High profitability in the private sector together with the improving labour market situation and emerging labour shortages in a few sectors (construction and services) is estimated to lead to higher wage growth over the forecast period. This pick-up is corroborated by the outcome of the sectoral agreements in the 2007 private sector wage negotiation round that have been concluded so far.
Overall, inflationary pressures remain relatively subdued with underlying inflation rising gradually over the forecast period. In the near term, lower energy prices, a stronger Swedish krona and price pressure on imported goods will help keep inflation low. In the second half of 2007, however, inflation is expected to increase as these effects fade out and domestic inflationary pressures build up, following in particular from continued robust growth and higher real wages. Given the outlook for inflation, the Riksbank started to raise interest rates in 2006 and is expected to go on raising rates in 2007 and 2008 towards more neutral levels. In line with the newly adopted communication policy to publish its own forecast for the repo rate, this path towards higher

Chapter 3 Member States, Sweden
- 103 -
Table 3.26 Main features of country forecast - SWEDEN
2005 Annual percentage changebn SEK Curr. prices % GDP 92-02 2003 2004 2005 2006 2007 2008
GDP at constant prices 2670.5 100.0 2.1 1.7 4.1 2.9 4.4 3.8 3.3 Private consumption 1285.2 48.1 1.4 1.8 2.2 2.4 2.8 3.9 3.6 Public consumption 723.9 27.1 0.7 0.7 0.4 0.3 1.8 1.5 1.3 Gross fixed capital formation 460.3 17.2 0.8 1.1 6.4 8.1 8.2 7.3 4.3 of which : equipment 198.1 7.4 4.3 3.3 6.5 12.9 4.7 8.0 6.0 Exports (goods and services) 1300.6 48.7 7.4 4.5 11.1 6.6 9.1 7.0 6.2 Final demand 3767.4 141.1 2.8 2.6 5.1 4.1 5.4 5.1 4.2 Imports (goods and services) 1096.8 41.1 5.1 5.0 7.0 6.9 7.8 8.2 6.4 GNI at constant prices (GDP deflator) 2663.4 99.7 2.4 3.0 3.0 2.8 5.0 3.8 3.2 Contribution to GDP growth : Domestic demand 1.1 1.2 2.0 2.4 3.3 3.6 2.8
Stockbuilding 0.1 0.3 -0.4 -0.1 0.0 0.1 0.0Foreign balance 1.1 0.1 2.3 0.4 1.2 0.1 0.4
Employment -0.3 -0.3 -0.6 0.4 2.0 2.1 0.9 Unemployment rate (a) 7.5 5.6 6.3 7.4 7.0 6.4 5.9 Compensation of employees/head 4.3 3.0 3.7 3.2 1.5 4.1 4.4 Real unit labour costs 0.0 -1.0 -1.1 -0.5 -2.6 0.0 0.0 Savings rate of households (b) - - 12.4 11.7 11.2 11.7 11.0 GDP deflator 1.9 2.0 0.2 1.2 1.8 2.5 2.0 Private consumption deflator 2.4 1.8 0.8 1.3 1.3 1.0 1.7 Harmonised index of consumer prices 2.0 2.3 1.0 0.8 1.5 1.2 1.9 Trade balance (c) 5.9 6.1 6.7 5.5 5.5 5.6 5.4 Current account balance (c) 2.8 6.6 6.5 5.8 7.0 7.5 7.5 Net lending(+) or borrowing(-) vis-à-vis ROW (c) 2.5 6.6 6.5 5.9 6.3 7.4 7.3 General government balance (c)(d) -3.1 -0.9 0.8 2.1 2.2 2.2 2.4 Cyclically-adjusted budget balance (c)(d) -2.2 0.2 1.2 2.5 2.1 1.9 1.9 Structural budget balance (c) - 0.2 0.7 2.1 2.1 1.9 1.9 General government gross debt (c) 64.6 53.5 52.4 52.2 46.9 42.1 37.7 (a) Eurostat definition. (b) gross saving divided by gross disposable income. (c) as a percentage of GDP. (d) Including proceeds relative to UMTS licences (see for more details note 10 on concepts and sources).
rates has been confirmed by the Riksbank and further moderate hikes have been signalled for 2007.
Public finances
In 2006, public finances developed favourably. Despite a somewhat expansionary budget for 2006 (including tax cuts and increases in certain active labour market programmes), strong economic growth, higher-than-foreseen tax revenues and lower expenditures for unemployment and illness at work limited the net impact on the budget balance. As a result, the 2006 budget surplus slightly exceeded the surplus recorded the previous year, at 2.2% of GDP compared with 2.1% in 2005 (taking into account the reclassification of second-pillar funded pension schemes in the private sector as from April 2007).
This positive underlying trend is projected to spill over to both 2007 and 2008, allowing surpluses to remain high despite the fairly expansionary 2007 budget proposed by the new government. The budget
includes substantial tax cuts, notably reduction in taxation of labour income of about 1.3% of GDP, a lowering of property taxes and an abolition of wealth taxes, which are only partially financed through other revenue-increasing and expenditure-decreasing measures. Overall the budget surplus is expected to remain at between 2-2½% of GDP in 2007 and 2008.
General government gross debt, mainly central government liabilities, is projected to continue to fall over the forecast period, to below 40% of GDP in 2008. This reduction is supported by the government's plans to sell off stakes in various state-owned enterprises estimated to amount to roughly 2% of GDP per year.

27. The United Kingdom Continued robust economic growth
- 104 -
-2
-1
0
1
2
3
4
5
2001 2002 2003 2004 2005 2006 2007 2008Domestic Demand (% pts)Net exports (%pts)Euro area GDP growth (%yoy)UK GDP growth (% yoy)
%
Graph 3.33: The United Kingdom - Contributions to GDP growth
Forecast
0
1
2
3
4
5
6
2001 2002 2003 2004 2005 2006 2007 20080,0
0,2
0,4
0,6
0,8
1,0
1,2
Unemployment (lhs)Compensation of employees per head (lhs)Employment growth (rhs)
Forecast
% %
Graph 3.34: The United Kingdom - Labour market
Activity in 2006
GDP grew by 2.8% in 2006, up from 1.9% in 2005 and close to its average growth over the past ten years. The expansion mirrored buoyant private consumption expenditure and higher gross fixed capital formation, which contributed 1.3 p.p. and 1.0 p.p. respectively.
On the output side of the economy, the service sector (70% of GDP) remained the main driver of economic growth, with the financial and business services' sectors expanding the most rapidly. Manufacturing activity (13% of GDP) was up by 1½%, only slightly more than reversing the previous year's drop in output. By contrast, output from the extraction of oil and gas shrank by 7.9%, reducing GDP growth by about 0.2 percentage points.
Growth in private consumption recovered to 2.0%, after its sharp slowing in 2005, mainly on the back of further gains in households' financial and housing wealth. During 2006, the FTSE all-share index rose by 17% and house prices increased by about 10%. Household disposable income rose at a slower pace than in 2005, contributing to a drop in the saving rate from 5.3% in 2005 to 4.8%.
Investment was up by 6.5%, following weak growth during the first half of the decade, amidst signs that companies were building up their productive capacity in response to favourable demand and cost conditions.
Trade figures continued to be seriously affected by missing trader intra-Community (MTIC) fraud. As a result, import and export growth figures were highly
volatile during the year. Overall the increase in imports, fuelled by strong domestic demand, outpaced export growth, leading to a negative contribution of net trade to growth by 0.4 percentage point. This, coupled with a drop in investment income, led to a marked widening of the current account deficit to almost 3½% of GDP.
Prospects for 2007 and 2008
Real GDP in 2007 is expected to grow at a similar rate to 2006, matching potential growth, driven by higher private consumption and, to a lesser extent, investment. A shallow slowdown in the pace of economic expansion to around 2½% is forecast in 2008, with earlier monetary tightening weighing on demand.
On the output side, services are expected to grow closely in line with total GDP. Manufacturing output growth is expected to rise to a little more than 2% in 2007, sustained by improved export orders, falling back slightly in 2008. By 2008, oil and gas extraction is expected to have increased by about 5% on 2006 (still below the level in 2005), as production from a new large field and a number of smaller start-ups gather momentum, notwithstanding an underlying decline in North Sea output.
On the demand side, private consumption expenditure in 2007 is expected to accelerate somewhat, though growth will remain significantly less than the average over the past ten years. The gains in housing and financial wealth in the second part of 2006, coupled with higher real disposable income, are expected to feed through to stronger private consumption in 2007.
Chapter 3 Member States, The United Kingdom
- 105 -
In 2008, however, consumption growth is expected to weaken, as higher interest rates should boost savings and the wealth effect from the increases in house prices is expected to diminish.
Business investment is expected to remain strong in 2007, as firms continue to build up capacity and add to the capital stock. Capacity constraints should become less conspicuous in 2008, though the increase in corporate and total investment is still expected to outpace GDP growth.
On the external side, net trade is expected to constitute a small negative contribution to growth over the forecast period. Strong growth in the UK's main export markets is expected to contribute to an increase in exports (in underlying terms, excluding MTIC fraud) of around 5½-6% in 2007 and 2008. In 2007, the increase in the share of private consumption in domestic demand will dampen import growth to slightly less than the increase in exports, as consumption tends to be less import-intensive than investment spending.
Meanwhile, increasing UK net overseas liabilities, given continuing significant external deficits, are expected to reduce net investment income flows, still positive given average rates of return on recorded assets continuing to well exceed those on liabilities. Coupled with an expected increase in net current transfers overseas, this is projected to lead to a gradual further widening of the external deficit.
Labour market, costs and prices
In 2005 and 2006 the labour market was characterised by record inflows of migrant labour and higher participation rates among older and female workers. Notwithstanding strong employment growth in 2006, the remarkable increase in the labour supply contributed to a rise in the unemployment rate to 5.3%. Unutilised labour resources rose steadily in the first half of the year, but stabilised thereafter.
Although great uncertainty on the extent of future immigration remains, particularly given its unanticipated scale over past three years, lower labour force growth and robust employment growth are expected to lead to a tighter labour market during the forecast period. Nevertheless, unemployment will remain higher than the natural rate and contribute to dampen upward pressures on wages. Labour
productivity growth is also expected to remain high, as firms seek to maximise utilisation of their present staffing levels.
Underlying the HICP inflation rate of 2.3% for 2006 as a whole was a sharp rise through the year from an average of 1.9% in the first quarter to 2.8% in the final quarter. Although the inflation rate rose to 2.9% in the first quarter of 2007, , it is expected to subside throughout 2007, as the impact of higher food and energy prices in 2006 should unwind. An average inflation rate of 2¼% is projected for 2007, with moderate wage growth curbing second-round inflationary effects. A more stable profile is forecast for 2008, with the rate of increase in the HICP falling back to the government's 2% target.
Public finances
Preliminary estimates indicate that the deficit for the 2006-07 financial year1 fell to 2.7% of GDP. Overall, lower-than-projected capital spending is expected to have compensated for weaker revenue growth and an overshoot in current expenditure. The deficit includes a capital transfer in relation to the cancellation of the debts owed by developing countries amounting to 0.1% of GDP in 2006-07; in line with recent discussion between Eurostat and the Office for National Statistics on the recording of these transactions.
The table below shows the projections for general government deficit and debt on a financial year basis. A progressive reduction in the deficit is forecast for 2007-08 and 2008-09.
2005-06 2006-07 2007-08 2008-09
GG Deficit 2.9 2.7* 2.6 2.4
GG Gross debt 41.8 42.5* 43.3 43.9*estimates are based on data up to March 2007
Public finances projections on a financial year basis (% GDP)
1 The EDP applies to the UK on a financial year basis. Actual UK general government balance data reported here apply the Eurostat decision of 14 July 2000 on the allocation of UMTS receipts. The UK has not generally applied this decision in domestic publication of its deficit data, which results in the net lending balance on a Eurostat basis being approximately 0.1% points of GDP per annum lower than reported in UK national accounts from respectively 2001 and 2001/02 onwards.
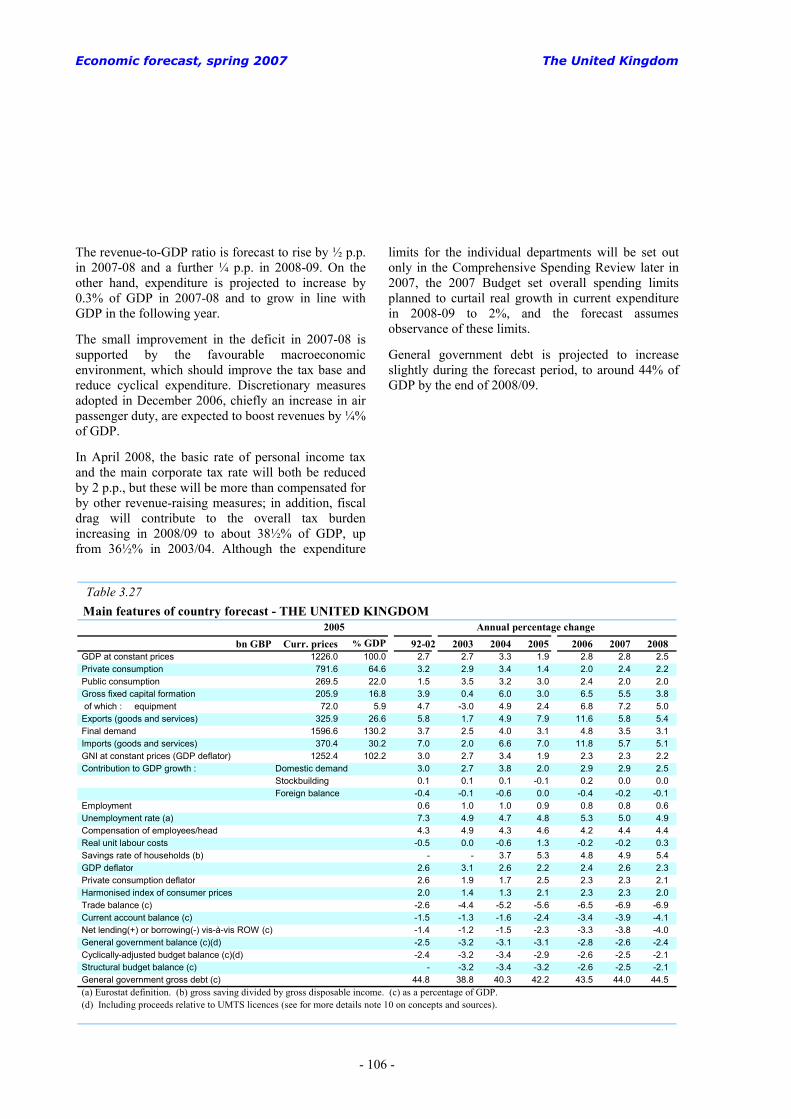
Economic forecast, spring 2007 The United Kingdom
- 106 -
Table 3.27 Main features of country forecast - THE UNITED KINGDOM
2005 Annual percentage changebn GBP Curr. prices % GDP 92-02 2003 2004 2005 2006 2007 2008
GDP at constant prices 1226.0 100.0 2.7 2.7 3.3 1.9 2.8 2.8 2.5 Private consumption 791.6 64.6 3.2 2.9 3.4 1.4 2.0 2.4 2.2 Public consumption 269.5 22.0 1.5 3.5 3.2 3.0 2.4 2.0 2.0 Gross fixed capital formation 205.9 16.8 3.9 0.4 6.0 3.0 6.5 5.5 3.8 of which : equipment 72.0 5.9 4.7 -3.0 4.9 2.4 6.8 7.2 5.0 Exports (goods and services) 325.9 26.6 5.8 1.7 4.9 7.9 11.6 5.8 5.4 Final demand 1596.6 130.2 3.7 2.5 4.0 3.1 4.8 3.5 3.1 Imports (goods and services) 370.4 30.2 7.0 2.0 6.6 7.0 11.8 5.7 5.1 GNI at constant prices (GDP deflator) 1252.4 102.2 3.0 2.7 3.4 1.9 2.3 2.3 2.2 Contribution to GDP growth : Domestic demand 3.0 2.7 3.8 2.0 2.9 2.9 2.5
Stockbuilding 0.1 0.1 0.1 -0.1 0.2 0.0 0.0Foreign balance -0.4 -0.1 -0.6 0.0 -0.4 -0.2 -0.1
Employment 0.6 1.0 1.0 0.9 0.8 0.8 0.6 Unemployment rate (a) 7.3 4.9 4.7 4.8 5.3 5.0 4.9 Compensation of employees/head 4.3 4.9 4.3 4.6 4.2 4.4 4.4 Real unit labour costs -0.5 0.0 -0.6 1.3 -0.2 -0.2 0.3 Savings rate of households (b) - - 3.7 5.3 4.8 4.9 5.4 GDP deflator 2.6 3.1 2.6 2.2 2.4 2.6 2.3 Private consumption deflator 2.6 1.9 1.7 2.5 2.3 2.3 2.1 Harmonised index of consumer prices 2.0 1.4 1.3 2.1 2.3 2.3 2.0 Trade balance (c) -2.6 -4.4 -5.2 -5.6 -6.5 -6.9 -6.9 Current account balance (c) -1.5 -1.3 -1.6 -2.4 -3.4 -3.9 -4.1 Net lending(+) or borrowing(-) vis-à-vis ROW (c) -1.4 -1.2 -1.5 -2.3 -3.3 -3.8 -4.0 General government balance (c)(d) -2.5 -3.2 -3.1 -3.1 -2.8 -2.6 -2.4 Cyclically-adjusted budget balance (c)(d) -2.4 -3.2 -3.4 -2.9 -2.6 -2.5 -2.1 Structural budget balance (c) - -3.2 -3.4 -3.2 -2.6 -2.5 -2.1 General government gross debt (c) 44.8 38.8 40.3 42.2 43.5 44.0 44.5 (a) Eurostat definition. (b) gross saving divided by gross disposable income. (c) as a percentage of GDP. (d) Including proceeds relative to UMTS licences (see for more details note 10 on concepts and sources).
The revenue-to-GDP ratio is forecast to rise by ½ p.p. in 2007-08 and a further ¼ p.p. in 2008-09. On the other hand, expenditure is projected to increase by 0.3% of GDP in 2007-08 and to grow in line with GDP in the following year.
The small improvement in the deficit in 2007-08 is supported by the favourable macroeconomic environment, which should improve the tax base and reduce cyclical expenditure. Discretionary measures adopted in December 2006, chiefly an increase in air passenger duty, are expected to boost revenues by ¼% of GDP.
In April 2008, the basic rate of personal income tax and the main corporate tax rate will both be reduced by 2 p.p., but these will be more than compensated for by other revenue-raising measures; in addition, fiscal drag will contribute to the overall tax burden increasing in 2008/09 to about 38½% of GDP, up from 36½% in 2003/04. Although the expenditure
limits for the individual departments will be set out only in the Comprehensive Spending Review later in 2007, the 2007 Budget set overall spending limits planned to curtail real growth in current expenditure in 2008-09 to 2%, and the forecast assumes observance of these limits.
General government debt is projected to increase slightly during the forecast period, to around 44% of GDP by the end of 2008/09.

Chapter 4 Candidate Countries

1. Croatia Mild moderation amid robust performance
- 108 -
3.5
4
4.5
5
2004 2005 2006 2007 20083
5
7
9
GDP growth Current account deficit (rhs)
Forecast
Graph 4.1: Croatia - GDP and current account
% of GDP %
Developments in 2006
In 2006, annual real GDP growth accelerated to 4.8%, up from 4.3% in 2005. Private consumption grew moderately by 3.5%, similar to 2005, whereas public consumption recorded a stronger growth rate. Investment spending accelerated markedly to 11% on the back of strong private sector activity. Imports of goods and services grew more strongly than exports, leading to a negative contribution of net exports to growth. High frequency indicators suggest a continuation of strong economic activity in early 2007.
Average annual consumer price inflation (CPI) slightly declined to 3.2% by end-2006 (2005: 3.3%), and further to 2.7% in March 2007, supported by a moderation of price dynamics in the areas of food, energy and transport.
According to preliminary data, the current account deficit widened to around 7.7% of GDP in 2006, up from 6.4% in 2005. A higher merchandise trade deficit as well as lower surpluses in the trade with services and in transfers contributed to the higher current account deficit.
Prospects for 2007and 2008
In 2007, real GDP growth is expected to remain at around 4.8%, mainly driven by strong domestic demand. Private consumption growth accelerates to 4%, as consumer confidence remains generally strong. Moreover, disposable incomes are set to further increase on the back of higher expected wages and social transfers. Also, sizeable one-off payments to
pensioners are scheduled in the context of a significant debt repayment scheme. Public consumption growth is expected to be stronger, due to an already announced increase in public sector employment and wages. Private investors' confidence will continue to be positively affected by the EU accession process. Therefore, investment growth remains strong at around 8.5%, despite a high base in 2006. Growth dynamics are set to somewhat moderate in 2008, as domestic demand pressures will start to ease. A relatively favourable external environment will support some acceleration of export growth, also supported by a stronger tourism sector. The growth of imports is expected to slow towards the end of the forecast horizon in line with decelerating domestic demand. As a result, by 2008 net exports will cease to post a negative contribution to growth. The current account deficit is expected to widen to above 8% of GDP in 2007, in line with stronger domestic demand and persistent capital inflows. Net FDI inflows will be somewhat smaller, but are expected to "finance" a significant part of the current account deficit.
Labour market, costs and prices
Growth and investment dynamics will have some favourable effects on the labour market. The labour force participation rate is set to increase by one percentage point per year. Total employment will continue to rise, by 1.7% on average. As a result, the unemployment rate (LFS) is expected to decline mildly by around 0.5 percentage points over the forecast horizon. Real wage growth remains stronger than productivity growth, leading to an increase in real unit labour costs, which is particularly pronounced in 2007. A continuation of a stability-oriented monetary framework will help maintaining price stability. Due to base effects and very low inflation in the first quarter of 2007, annual average inflation (CPI) will temporarily decline to below 2.5% in 2007, but further adjustments of administrative prices and catching up effects will push inflation again up to around 3% towards the end of the forecast horizon.
Public finances
In 2006, the general government deficit has significantly declined to 2.2% of GDP (from 3.9%), driven by particularly strong revenue growth and some moderation of spending. In 2007, stronger
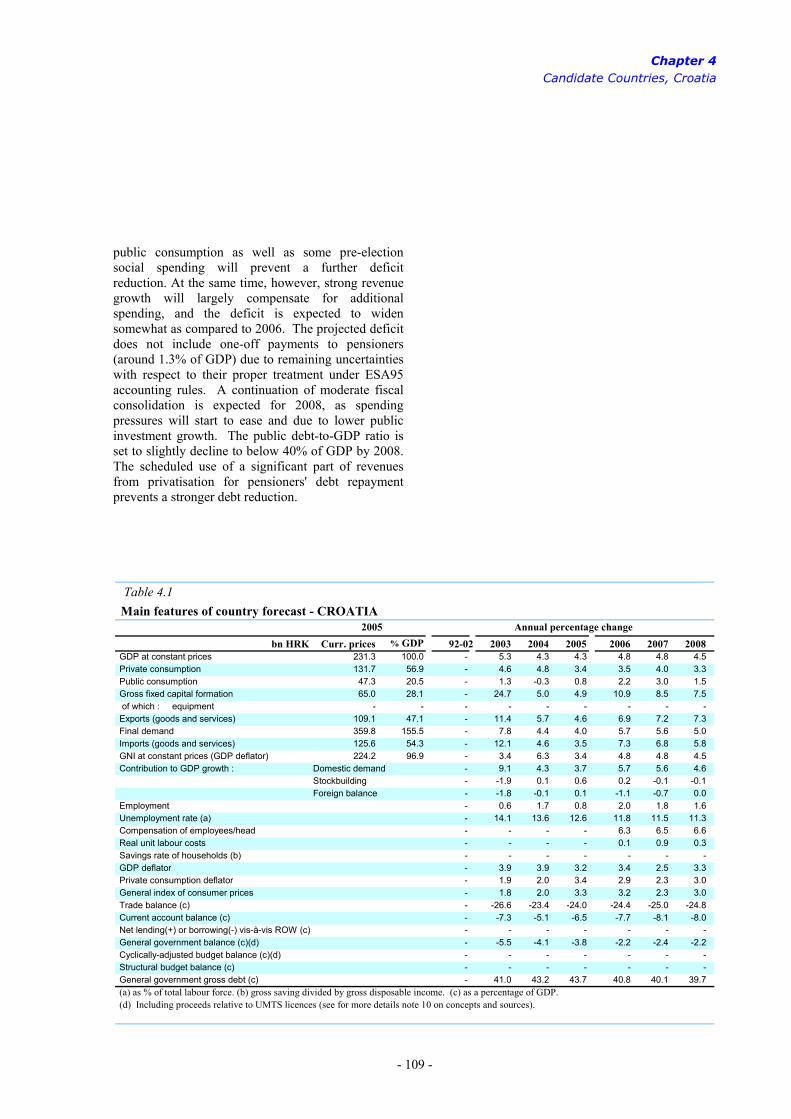
Chapter 4 Candidate Countries, Croatia
- 109 -
Table 4.1 Main features of country forecast - CROATIA
2005 Annual percentage changebn HRK Curr. prices % GDP 92-02 2003 2004 2005 2006 2007 2008
GDP at constant prices 231.3 100.0 - 5.3 4.3 4.3 4.8 4.8 4.5 Private consumption 131.7 56.9 - 4.6 4.8 3.4 3.5 4.0 3.3 Public consumption 47.3 20.5 - 1.3 -0.3 0.8 2.2 3.0 1.5 Gross fixed capital formation 65.0 28.1 - 24.7 5.0 4.9 10.9 8.5 7.5 of which : equipment - - - - - - - - - Exports (goods and services) 109.1 47.1 - 11.4 5.7 4.6 6.9 7.2 7.3 Final demand 359.8 155.5 - 7.8 4.4 4.0 5.7 5.6 5.0 Imports (goods and services) 125.6 54.3 - 12.1 4.6 3.5 7.3 6.8 5.8 GNI at constant prices (GDP deflator) 224.2 96.9 - 3.4 6.3 3.4 4.8 4.8 4.5 Contribution to GDP growth : Domestic demand - 9.1 4.3 3.7 5.7 5.6 4.6
Stockbuilding - -1.9 0.1 0.6 0.2 -0.1 -0.1Foreign balance - -1.8 -0.1 0.1 -1.1 -0.7 0.0
Employment - 0.6 1.7 0.8 2.0 1.8 1.6 Unemployment rate (a) - 14.1 13.6 12.6 11.8 11.5 11.3 Compensation of employees/head - - - - 6.3 6.5 6.6 Real unit labour costs - - - - 0.1 0.9 0.3 Savings rate of households (b) - - - - - - - GDP deflator - 3.9 3.9 3.2 3.4 2.5 3.3 Private consumption deflator - 1.9 2.0 3.4 2.9 2.3 3.0 General index of consumer prices - 1.8 2.0 3.3 3.2 2.3 3.0 Trade balance (c) - -26.6 -23.4 -24.0 -24.4 -25.0 -24.8 Current account balance (c) - -7.3 -5.1 -6.5 -7.7 -8.1 -8.0 Net lending(+) or borrowing(-) vis-à-vis ROW (c) - - - - - - - General government balance (c)(d) - -5.5 -4.1 -3.8 -2.2 -2.4 -2.2 Cyclically-adjusted budget balance (c)(d) - - - - - - - Structural budget balance (c) - - - - - - - General government gross debt (c) - 41.0 43.2 43.7 40.8 40.1 39.7 (a) as % of total labour force. (b) gross saving divided by gross disposable income. (c) as a percentage of GDP. (d) Including proceeds relative to UMTS licences (see for more details note 10 on concepts and sources).
public consumption as well as some pre-election social spending will prevent a further deficit reduction. At the same time, however, strong revenue growth will largely compensate for additional spending, and the deficit is expected to widen somewhat as compared to 2006. The projected deficit does not include one-off payments to pensioners (around 1.3% of GDP) due to remaining uncertainties with respect to their proper treatment under ESA95 accounting rules. A continuation of moderate fiscal consolidation is expected for 2008, as spending pressures will start to ease and due to lower public investment growth. The public debt-to-GDP ratio is set to slightly decline to below 40% of GDP by 2008. The scheduled use of a significant part of revenues from privatisation for pensioners' debt repayment prevents a stronger debt reduction.

2. The Former Yugoslav Republic of Macedonia Catching-up... but how fast?
- 110 -
-5.0
-2.5
0.0
2.5
5.0
00 01 02 03 04 05 06 07 0829
31
33
35
37
Unemployment rate (rhs) Real GDP growth (lhs)
Graph 4.2: The Former Yugoslav Republic of Macedonia - Real GDP growth and labour market
Forecast %%
Developments in 2006
Preliminary data point to a relatively moderate growth of 3.1% in 2006, compared to 3.8% in 2005. The main reason for this relatively moderate performance was lower than expected expansion in manufacturing, agriculture and construction. In particular, industrial production increased by only 2.5% in 2006. However, a number of indicators suggest that the final data will show stronger economic activity for 2006.
Employment increased by some 4% in 2006, which helped to bring unemployment down to about 36% of the labour force. However, labour supply increased by slightly above 3%, which partly offset the impact of job growth on the unemployment rate.
Inflation accelerated from 0.5% in 2005 to 3.2% in 2006. The main factors for this strong increase were higher energy prices and the increase of excise taxes on alcohol and tobacco towards EU levels.
External imbalances continued to narrow during 2006. Like in 2005 - when high workers remittances and cash exchanges had helped to reduce the current account deficit from 7.7% of GDP in 2004 to -1.4% of GDP - the same factors helped to reduce the current account deficit by nearly another percentage point of GDP.
Public finances continue to remain close to balance. After a slight surplus of 0.2% of GDP in 2005, the spring notification reported a preliminary deficit of -0.6% of GDP in 2006. The General government debt declined from 46.9% of GDP in 2005 to 39.4% at the end of 2006. The main factor behind this strong
decline was the early repayment of Paris Club debt in early 2006.
Prospects in 2007 and 2008
For 2007 and 2008, the overall scenario from the autumn forecast still holds. After years of weak growth, recent measures to proceed with structural reforms have resulted in an improved business environment and have strengthened consumer confidence. Thus, like in many other candidate countries before, domestic demand will be the main driving force for stronger output growth. Furthermore, when compared to the autumn forecast, the international environment should offer a somewhat stronger support to the country's growth dynamics, resulting from stronger than expected global demand, but also from improved perspectives for regional trade, due to the country's membership to CEFTA 2006.
Given this growth supporting environment, a further acceleration of economic activity is expected by about one percentage point annually. This will bring GDP growth to about 4¼% in 2007 and 5¼% in 2008. The biggest contribution to this acceleration will come from private (domestic and foreign) investment, reaping the benefits of the recent measures to improve the business environment, to facilitate company registration, to simplify and accelerate administrative procedures and to reduce the tax burden by lowering tax rates on income and profits. As a result, the investment-to-GDP ratio is expected to converge towards levels observed in other catching-up economies. Private consumption will be another important pillar for the growth acceleration, benefiting from improving consumer confidence, increased employment and low inflation, which will translate into a stronger increase in real disposable income. Public consumption will remain subdued, reflecting the government's commitment to maintain a prudent fiscal policy.
The stronger growth of domestic demand and in particular the high import content of investment will lead to a negative contribution of net-exports to GDP growth. As a result, the trade balance is likely to deteriorate However, workers remittances and other capital inflows, such as increasing FDI, are expected to largely finance those deficits.

Chapter 4 Candidate Countries, The Former Yugoslav Republic of Macedonia
- 111 -
Table 4.2 Main features of country forecast - THE FORMER YUGOSLAV REPUBLIC OF MACEDONIA
2005 Annual percentage changebn MKD Curr. prices % GDP 92-02 2003 2004 2005 2006 2007 2008
GDP at constant prices 284.3 100.0 -0.6 2.8 4.1 3.8 3.1 4.3 5.3 Private consumption 216.2 76.0 - - - - 4.0 4.5 4.6 Public consumption 55.1 19.4 - - - - 3.0 3.0 3.0 Gross fixed capital formation 50.6 17.8 - - - - 9.0 12.0 15.0 of which : equipment - - - - - - - - - Exports (goods and services) 130.0 45.7 - - - - 15.2 14.5 15.9 Final demand 461.9 162.5 - - - - 7.3 8.1 9.2 Imports (goods and services) 177.6 62.5 - - - - 14.5 13.5 14.3 GNI at constant prices (GDP deflator) 281.6 99.0 - 2.9 4.1 3.6 3.1 4.3 5.3 Contribution to GDP growth : Domestic demand - -3.2 8.1 3.3 5.2 6.3 7.1
Stockbuilding - -0.7 0.0 0.0 0.0 0.0 0.0Foreign balance - 6.7 -4.4 0.5 -2.1 -2.0 -1.8
Employment - -2.9 -2.4 4.3 3.9 3.3 3.6 Unemployment rate (a) - 36.7 37.2 37.3 36.6 35.8 34.7 Compensation of employees/head - - - - 4.2 3.0 3.5 Real unit labour costs - - - - 1.2 -0.9 -1.0 Savings rate of households (b) - - - - - - - GDP deflator 67.1 0.3 1.3 3.2 3.8 2.9 2.9 Private consumption deflator - - - - 3.2 2.2 2.6 General index of consumer prices - 1.1 -0.4 0.5 3.2 2.0 2.5 Trade balance (c) - -18.4 -20.7 -16.2 -17.6 -19.3 -20.5 Current account balance (c) - -3.2 -7.7 -1.4 -0.7 -2.0 -2.6 Net lending(+) or borrowing(-) vis-à-vis ROW (c) - - - - - - - General government balance (c)(d) - -1.1 0.0 0.2 -0.6 -1.2 -1.5 Cyclically-adjusted budget balance (c)(d) - - - - - - - Structural budget balance (c) - - - - - - - General government gross debt (c) - 42.9 40.0 46.9 39.5 32.9 31.8 (a) as % of total labour force. (b) gross saving divided by gross disposable income. (c) as a percentage of GDP. (d) Including proceeds relative to UMTS licences (see for more details note 10 on concepts and sources).
Labour market, costs and prices
The acceleration in economic activity will create additional employment. However, unemployment is likely to remain high, as a part of the new jobs might be filled by increased labour supply. As a result, the official unemployment rate might only slightly decline from some 36% in 2006 to about 35% in 2008. Wage growth is expected to remain largely in line with productivity developments.
Consumer price inflation is likely to remain below the level in 2006, as the inflationary impulse from higher energy prices and the increase in excise taxes is bound to fade away. During the forecast period, the absence of domestic demand pressures and the stability of the exchange rate towards the euro should help to contain inflation. However, the growth acceleration and the need to adjust electricity prices to international levels and excise duties to EU levels, should lead to somewhat higher price increases during 2007 and
2008. In view of year-on-year inflation below 1% during the first quarter of 2007, annual inflation might reach some 2% in 2007, which could further rise to some 2½ % in 2008.
Public finances
The plans of the new government to reduce the tax burden and to promote economic growth could lead to a temporary increase in the general government deficit to slightly above 1% in 2007. The plans to increase spending in human capital and administrative capacities could lead to a further rise in the deficit to some 1½% of GDP in 2008. The combination of strong economic growth, early debt repayments and relatively low deficits will lead to a further reduction of the debt ratio towards 32% of GDP by 2008.
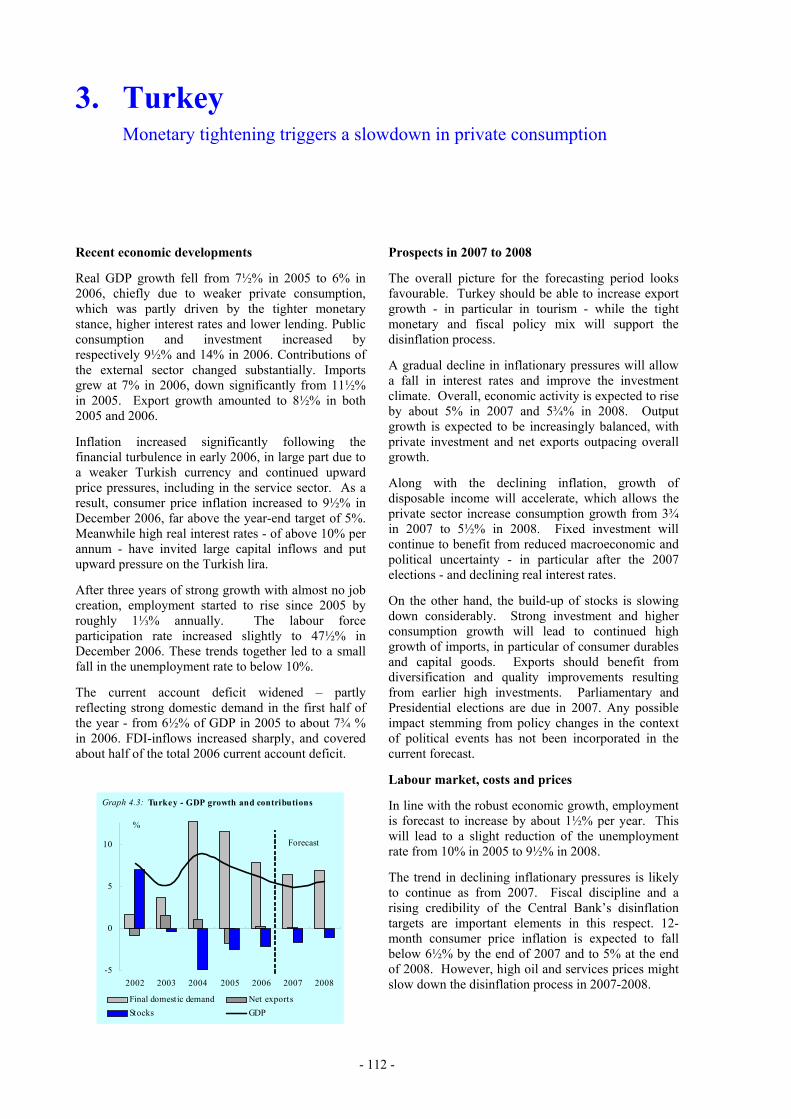
3. Turkey Monetary tightening triggers a slowdown in private consumption
- 112 -
-5
0
5
10
2002 2003 2004 2005 2006 2007 2008
Final domestic demand Net exports Stocks GDP
Graph 4.3: Turkey - GDP growth and contributions
%
Forecast
Recent economic developments
Real GDP growth fell from 7½% in 2005 to 6% in 2006, chiefly due to weaker private consumption, which was partly driven by the tighter monetary stance, higher interest rates and lower lending. Public consumption and investment increased by respectively 9½% and 14% in 2006. Contributions of the external sector changed substantially. Imports grew at 7% in 2006, down significantly from 11½% in 2005. Export growth amounted to 8½% in both 2005 and 2006.
Inflation increased significantly following the financial turbulence in early 2006, in large part due to a weaker Turkish currency and continued upward price pressures, including in the service sector. As a result, consumer price inflation increased to 9½% in December 2006, far above the year-end target of 5%. Meanwhile high real interest rates - of above 10% per annum - have invited large capital inflows and put upward pressure on the Turkish lira.
After three years of strong growth with almost no job creation, employment started to rise since 2005 by roughly 1⅓% annually. The labour force participation rate increased slightly to 47½% in December 2006. These trends together led to a small fall in the unemployment rate to below 10%.
The current account deficit widened – partly reflecting strong domestic demand in the first half of the year - from 6½% of GDP in 2005 to about 7¾ % in 2006. FDI-inflows increased sharply, and covered about half of the total 2006 current account deficit.
Prospects in 2007 to 2008
The overall picture for the forecasting period looks favourable. Turkey should be able to increase export growth - in particular in tourism - while the tight monetary and fiscal policy mix will support the disinflation process.
A gradual decline in inflationary pressures will allow a fall in interest rates and improve the investment climate. Overall, economic activity is expected to rise by about 5% in 2007 and 5¾% in 2008. Output growth is expected to be increasingly balanced, with private investment and net exports outpacing overall growth.
Along with the declining inflation, growth of disposable income will accelerate, which allows the private sector increase consumption growth from 3¾ in 2007 to 5½% in 2008. Fixed investment will continue to benefit from reduced macroeconomic and political uncertainty - in particular after the 2007 elections - and declining real interest rates.
On the other hand, the build-up of stocks is slowing down considerably. Strong investment and higher consumption growth will lead to continued high growth of imports, in particular of consumer durables and capital goods. Exports should benefit from diversification and quality improvements resulting from earlier high investments. Parliamentary and Presidential elections are due in 2007. Any possible impact stemming from policy changes in the context of political events has not been incorporated in the current forecast.
Labour market, costs and prices
In line with the robust economic growth, employment is forecast to increase by about 1½% per year. This will lead to a slight reduction of the unemployment rate from 10% in 2005 to 9½% in 2008.
The trend in declining inflationary pressures is likely to continue as from 2007. Fiscal discipline and a rising credibility of the Central Bank’s disinflation targets are important elements in this respect. 12-month consumer price inflation is expected to fall below 6½% by the end of 2007 and to 5% at the end of 2008. However, high oil and services prices might slow down the disinflation process in 2007-2008.

Chapter 4 Candidate Countries, Turkey
- 113 -
Table 4.3 Main features of country forecast - TURKEY
2005 Annual percentage changebn TRY Curr. prices % GDP 92-02 2003 2004 2005 2006 2007 2008
GDP at constant prices 564.3 100.0 3.1 5.8 8.9 7.4 6.1 4.9 5.9 Private consumption 313.3 55.5 2.0 7.2 10.6 9.1 5.2 3.8 5.0 Public consumption 56.8 10.1 3.9 -2.4 0.5 2.4 9.6 9.0 3.5 Gross fixed capital formation 95.3 16.9 0.3 10.0 32.4 24.0 14.0 11.2 10.9 of which : equipment 51.2 9.1 0.8 34.4 55.4 23.8 8.7 11.0 10.5 Exports (goods and services) 113.3 20.1 11.1 16.0 12.5 8.5 8.5 6.7 6.4 Final demand 604.0 107.0 4.3 11.3 13.6 8.7 6.4 5.2 5.8 Imports (goods and services) 153.7 27.2 8.4 27.1 24.7 11.5 7.1 6.0 5.5 GNI at constant prices (GDP deflator) 566.8 100.4 3.0 5.9 9.5 7.6 6.0 4.7 5.9 Contribution to GDP growth : Domestic demand 2.3 6.5 13.0 11.1 7.9 6.4 6.9
Stockbuilding 0.5 2.4 0.9 -2.0 -2.1 -1.6 -1.1Foreign balance 0.2 -2.8 -4.2 -1.6 0.3 0.1 0.2
Employment 0.7 -1.0 3.0 1.4 1.2 1.3 1.5 Unemployment rate (a) 7.8 10.5 10.3 10.2 9.9 9.9 9.6 Compensation of employees/head 67.2 27.9 16.5 12.1 12.3 12.7 11.5 Real unit labour costs -3.2 -2.3 0.3 0.5 -3.9 1.0 0.9 Savings rate of households (b) - - - - - - - GDP deflator 68.6 22.5 9.9 5.4 11.5 7.8 5.9 Private consumption deflator 69.5 21.2 7.4 5.8 10.7 8.1 5.8 General index of consumer prices - 25.3 10.1 8.1 9.3 8.2 5.8 Trade balance (c) -8.4 -8.1 -10.3 -10.9 -9.9 -9.0 -8.1 Current account balance (c) -0.9 -3.4 -5.2 -6.3 -7.7 -7.2 -6.6 Net lending(+) or borrowing(-) vis-à-vis ROW (c) - - - - - - - General government balance (c)(d) - -11.3 -5.8 -0.3 -0.6 -2.2 -1.8 Cyclically-adjusted budget balance (c)(d) - - - - - - - Structural budget balance (c) - - - - - - - General government gross debt (c) - 85.1 76.9 69.6 60.7 56.6 54.3 (a) as % of total labour force. (b) gross saving divided by gross disposable income. (c) as a percentage of GDP. (d) Including proceeds relative to UMTS licences (see for more details note 10 on concepts and sources).
Growth of imports will remain strong, partially reflecting a rather high import content of exports. Exports will gradually start benefiting from a weaker currency. The current account deficit is therefore forecast to stabilize around 7% of GDP in 2007-2008. A higher surplus of the services balance should contribute to maintain positive medium-term prospects in the external sector.
Public finances
Public finances remained largely on track, achieving a primary surplus of 6½% of GDP in 2006. This substantial surplus and strong GDP growth led to a reduction in the debt ratio, from 69½% of GDP at the end of 2005 to 60½% at the end of 2006. General government interest payments have fallen from about 17% of GDP in 2003 to 7½% of GDP in 2006. In the election year 2007 and in 2008, public sector balances will be affected by higher interest rates, higher public spending and a slowdown in privatisation.
Conversely, the ongoing public finance reforms will help to widen the tax base and to increase the efficiency of tax collection. Non-interest expenditures are seen to remain largely constant relative to GDP. The general government balance is expected to change from a surplus of ½% of GDP in 2006 to a deficit of 1% of GDP in 2007-2008.
General government debt is expected to further decline gradually, albeit at a decelerating pace, to about 55% in 2008. The government has been making progress in lengthening the average maturity and swapping foreign denominated into lira denominated debt. However, Turkey pays relatively high interest rates on its debt, which highlights Turkey's relative high vulnerability to interest and exchange rate volatility and rollover risk as the average maturity of its domestic debt remains short (at 28 months).


Chapter 5 Other non-EU Countries

1. The United States of America Housing downturn continues - growth below potential
- 116 -
-15
-10
-5
0
5
10
15
00 01 02 03 04 05 06 07 080
1
2
3
4
5
6
Residential investment (lhs)Residential investment (2000 prices, rhs)
Graph 5.1: US - Housing investment cycle
% of GDPyoy % ch.)
Forecast
Less housing investment lowered growth in 2006
After three years of rapid expansion the US economy moved to a growth path below trend in 2006. The 3.3% annual growth rate reflects the very high growth rate in the first quarter and hides the subsequent downshifting of the expansion.
The slowdown was concentrated in the housing sector which cooled down substantially from the preceding boom years. Residential investment dropped by close to 20% annualised in the second half of the year which subtracted 1.2 percentage points from quarterly GDP growth rates. But manufacturing, in particular the automotive sector, also cooled down as companies tried to reduce their elevated inventories.
House price appreciation declined significantly in the course of 2006. Some data indicate that the average level of house prices even started to fall. Nevertheless, consumer spending continued to increase briskly based on solid gains in real disposable income and a further decline in the personal saving rate. While non-residential construction activity picked up after many years of sluggish growth, business equipment investment started to show signs of weakness. The trade performance improved as export growth rose and import growth fell in volume terms. However, the contribution of net exports to GDP growth was zero.
Solid employment growth reduced the unemployment rate to new lows for the cycle in 2006, but generated only little upward pressure on wages. Inflationary pressures remained contained with the price index of core personal consumption expenditure showing a 2.1% year-on-year increase in December. The current
account deficit remained broadly unchanged above 6% of GDP while the fiscal deficit of general government receded to 2.3% of GDP. The improvement in the fiscal position was due to continued strength in tax revenue growth.
The mid-cycle slowdown continues in 2007
The outlook for this year and next depends crucially on how much more the housing sector will cool down and how strong the spill-over effects to the rest of the economy will be. In view of the large overhang of unsold homes, the forecast projects that residential construction will decline throughout 2007. Its share of GDP will fall from the historically high level of 5.5% in 2005 to 4.3% this year (in 2000 prices), which is slightly below the level before the onset of the recent building boom. This correction alone would subtract two thirds of a percentage point from annual GDP growth. Following the pattern of previous building cycles, it is assumed that the sector will rebound next year (see Graph 5.1). This should be instrumental in lifting GDP growth back to around potential in 2008 and thereby ending the mid-cycle slowdown.
The downsizing of residential investment started to spill over into business equipment investment in the second half of last year. This GDP component is expected to remain weak in 2007 although favourable financial conditions and relatively high capacity utilisation will be supportive. Consumer spending growth was still solid in the first quarter of 2007, but should gradually be dampened down by falling house prices and slower employment growth.
Export growth should remain at a relatively high level over the forecast period helped by solidly expanding world markets. Import growth, on the other hand, is expected to be relatively subdued, reflecting mainly the path of domestic demand. The lagged effects of previous dollar depreciation are supporting these trends in export and import growth. The contribution of net exports to GDP growth should be positive in 2007 before returning to neutral in the following year.
Although GDP growth is expected to remain below long-term potential through 2007, the economy is not expected to enter a downward spiral into recession. Since inflationary pressures have remained relatively contained and should moderate over time, the Federal Reserve is likely to support output growth by lowering short-term interest rates.

Chapter 5 Other non-EU Countries, The United States of America
- 117 -
Table 5.1 Main features of country forecast - THE UNITED STATES
2005 Annual percentage changebn USD Curr. prices % GDP 92-02 2003 2004 2005 2006 2007 2008
GDP at constant prices 12456.0 100.0 3.2 2.5 3.9 3.2 3.3 2.2 2.7 Private consumption 8742.4 70.2 3.7 2.8 3.9 3.5 3.2 2.9 2.0 Public consumption 1975.8 15.9 1.4 2.8 2.5 1.0 1.7 2.4 2.0 Gross fixed capital formation 2433.1 19.5 5.5 3.0 6.0 6.5 3.6 -1.2 4.5 of which : equipment 1075.2 8.6 8.0 2.7 7.0 8.7 6.4 1.5 5.0 Exports (goods and services) 1303.2 10.5 5.1 1.3 9.2 6.8 9.0 7.0 7.2 Final demand 14475.8 116.2 3.8 2.7 4.8 3.6 3.8 2.3 3.0 Imports (goods and services) 2019.8 16.2 8.5 4.1 10.8 6.1 5.8 3.2 5.1 GNI at constant prices (GDP deflator) 12487.8 100.3 3.2 2.8 3.8 3.1 3.3 1.9 2.5 Contribution to GDP growth : Domestic demand 3.7 2.9 4.2 3.8 3.2 2.2 2.6
Stockbuilding 0.0 0.0 0.4 -0.3 0.2 -0.2 0.1Foreign balance -0.5 -0.4 -0.6 -0.3 0.0 0.3 0.0
Employment (*) 1.5 0.9 1.1 1.7 1.9 1.3 0.6 Unemployment rate (a) 5.4 6.0 5.5 5.1 4.6 4.7 5.0 Compensation of employees/head 3.6 4.3 4.2 3.7 4.3 4.1 5.3 Real unit labour costs -0.1 0.5 -1.5 -0.9 -0.1 0.9 1.6 Savings rate of households (b) - - 2.1 -0.4 -1.1 -0.6 0.7 GDP deflator 1.9 2.1 2.8 3.0 2.9 2.2 1.6 Private consumption deflator 2.0 2.0 2.6 2.9 2.7 1.9 2.0 General index of consumer prices - 2.3 2.7 3.4 3.2 2.3 1.9 Trade balance (c) -3.0 -5.1 -5.8 -6.4 -6.4 -5.9 -6.0 Current account balance (c) -2.2 -4.7 -5.6 -6.2 -6.1 -5.8 -6.0 Net lending(+) or borrowing(-) vis-à-vis ROW (c) -2.2 -4.7 -5.6 -6.3 -6.2 -5.9 -6.0 General government balance (c)(d) -2.1 -4.9 -4.6 -3.7 -2.3 -2.6 -2.9 Cyclically-adjusted budget balance (c)(d) - - - - - - - Structural budget balance (c) - - - - - - - General government gross debt (c) 65.5 61.2 62.0 62.2 61.5 62.2 62.7 (a) as % of total labour force. (b) gross saving divided by gross disposable income. (c) as a percentage of GDP. (*) Employment data from the BLS household survey.
Prospects for 2007 and 2008
The forecast projects the annualised quarterly GDP growth rates to remain below 2½% throughout 2007 resulting in a 2.2% annual growth rate. Next year, when the contractionary effects of the housing correction subside, GDP growth should be half a percentage point higher and thereby close to its long-run potential. Consumer spending growth is expected to fall substantially in the coming quarters and remain below disposable income growth also in 2008. Consequently, the household saving rate would return to a small positive number by next year.
Unemployment is projected to react with a considerable lag to the mid-cycle slowdown and rise to 5% only next year when headline inflation falls below 2%. The fiscal deficit of general government will widen again to almost 3% of GDP, particularly because tax revenues are projected to normalise to single-digit growth rates. The improving trade
performance will reduce the current account deficit slightly this year. But next year, a deteriorating net investment income balance will raise the current account deficit back to 6% of GDP in national account terms.
The risks to the growth forecast seem to be tilted to the downside. The housing correction may have to be deeper and longer-lasting than projected. Its spill-over to the rest of the economy could also be stronger than assumed, particularly if the current problems in the sub-prime mortgage market should worsen and spread. Inflationary pressures may turn out to be more stubborn than anticipated and postpone an easing of monetary policy. There also continue to be risks associated with the large current account deficit and a possible disruptive adjustment. On the upside, there is the possibility that the housing correction and its overall impact will be weaker than outlined above.

2. Japan Out of the soft patch... once more
- 118 -
-2,000
-1,000
0
1,000
2,000
3,000
4,000
5,000
6,0007,000
0.00.51.01.52.02.53.03.54.04.55.0
00 01 02 03 04 05 06Current transferts Trade balanceServices balance Income balanceCurrent account bal. (rhs)
Graph 5.2: Japan - Current account balance
% of GDPbn JPY
Economic expansion showed resilience in 2006
Annual GDP growth in Japan remained robust at 2.2% in 2006, despite going through a soft patch in the third quarter of the year, when the economy barely grew at all. GDP growth recovered strongly in the fourth quarter, mainly thanks to a rebound in private consumption, which unexpectedly declined in the third quarter. In 2006 as a whole, private domestic demand, and business investment in particular, remained the main engine of GDP growth, while net exports also contributed positively. Economic growth in 2006 turned out significantly lower than previously assumed, but this is mainly explained by significant data revisions.
Favourable fundamentals for 2007 and 2008
Looking ahead, Japan's economic expansion is set to continue. Private consumption is forecast to re-accelerate in 2007 and 2008, on the back of a favourable situation in the labour market. The unemployment rate is at an eight-year low of 4%. This, combined with a healthy situation in the corporate sector, means that average wage income is expected to start rising in the near future. In addition, the tax burden on households is expected to decrease in the financial year 2007, which should contribute to stronger growth in household disposable income.
On the corporate front, the quarterly April 2007 Tankan survey showed continued high and widespread confidence in all sectors. Capacity utilisation rate in the manufacturing sector is high, especially in the machinery industry sector. Corporate earnings are strong, in particular in the export sector,
and are expected to remain so in the coming quarters. The inventory correction seems to be proceeding gradually. Although there are still some concerns about the inventory situation in the IT sector, the adjustment in the manufacturing sector as a whole seems well under way. In combination with a sound corporate financial situation and resilient external demand, mainly from the rest of Asia, business investment is forecast to remain dynamic. On the back of rising land prices after several years of decline, residential investment growth is forecast to resume.
On the external side, net exports are expected to continue to support GDP growth in the near future, partly as a result of the lagged effect of last year's yen depreciation. The contribution of the external sector to the economic expansion is, however, projected to decelerate thereafter, as the acceleration in imports will partially offset the strength of exports. With the income account now accounting for 2/3 of the Japanese current account surplus and expected to further increase in the forecast horizon, the current account surplus is also forecast to continue to enlarge from 3.9% of GDP in 2006 to around 4.0% in 2007 and 2008.
All in all, GDP growth is expected to accelerate slightly from 2.2% to 2.3% in 2007, before moderating to 2.1% in 2008 – still above Japan's potential growth rate.
Price developments and monetary policy
Deflation has almost come to an end. The CPI has been fluctuating around zero for some months but the GDP deflator remains slightly negative. Headline and core CPI were back in negative territory in February. Excluding food and energy, consumer prices also continue to decline. The negative developments in inflation figures are expected to be temporary. While the various measures of annual inflation are forecast to be close to zero on average in 2007, they are expected increase gradually in the course of 2008, albeit remaining below 0.5%.
In February 2007, the Bank of Japan raised its policy rate by 25 basis points to 0.5% in a move mainly intended to safeguard its forward-looking approach, but the accompanying statement was widely perceived as dovish. While the Bank of Japan is engaged in a process of gradual normalisation of monetary policy, recent weak data on inflation makes it unlikely that it

Chapter 5 Other non-EU Countries, Japan
- 119 -
Table 5.2 Main features of country forecast - JAPAN
2005 Annual percentage changebn YEN Curr. prices % GDP 92-02 2003 2004 2005 2006 2007 2008
GDP at constant prices 501343.4 100.0 0.9 1.4 2.7 1.9 2.2 2.3 2.1 Private consumption 286530.2 57.2 1.4 0.4 1.6 1.6 0.9 1.4 1.7 Public consumption 90684.3 18.1 2.9 2.3 1.9 1.7 0.3 1.0 0.7 Gross fixed capital formation 115972.9 23.1 -1.3 -0.5 1.4 2.4 3.7 5.1 3.7 of which : equipment - - 0.3 5.5 7.7 - - - - Exports (goods and services) 66286.3 13.2 3.6 9.2 13.9 7.0 9.5 7.3 6.6 Final demand 560673.7 111.8 1.0 1.6 3.2 2.3 2.5 2.7 2.6 Imports (goods and services) 56660.3 11.3 3.5 3.9 8.1 5.8 4.5 7.3 7.4 GNI at constant prices (GDP deflator) 513192.2 102.4 1.0 1.5 2.9 2.3 2.5 2.3 2.0 Contribution to GDP growth : Domestic demand 0.9 0.5 1.6 1.8 1.4 2.1 1.9
Stockbuilding -0.1 0.2 0.3 -0.1 0.1 -0.2 0.0Foreign balance 0.1 0.7 0.8 0.3 0.8 0.3 0.2
Employment -0.2 -0.3 0.2 0.4 0.4 0.3 0.3 Unemployment rate (a) 3.8 5.3 4.7 4.4 4.1 4.1 4.2 Compensation of employees/head 0.4 -1.4 -1.3 0.2 0.7 1.3 1.7 Real unit labour costs -0.3 -1.6 -2.7 0.0 -0.2 -0.8 -0.4 Savings rate of households (b) - - 10.6 10.1 9.8 9.7 9.2 GDP deflator -0.4 -1.6 -1.1 -1.3 -0.9 0.1 0.3 Private consumption deflator -0.2 -0.9 -0.7 -0.8 -0.3 -0.1 0.3 General index of consumer prices - -0.3 0.0 -0.3 0.2 0.0 0.4 Trade balance (c) 2.6 2.5 2.9 2.1 2.5 2.7 2.7 Current account balance (c) 2.5 3.2 3.7 3.6 3.9 4.2 4.1 Net lending(+) or borrowing(-) vis-à-vis ROW (c) 2.4 3.1 3.6 3.5 3.8 4.1 4.0 General government balance (c)(d) -5.2 -7.9 -6.2 -6.4 -4.6 -3.9 -3.5 Cyclically-adjusted budget balance (c)(d) - - - - - - - Structural budget balance (c) - - - - - - - General government gross debt (c) 107.8 160.3 167.3 173.1 175.7 175.7 175.3 (a) as % of total labour force. (b) gross saving divided by gross disposable income. (c) as a percentage of GDP.
will tighten monetary policy aggressively in the coming months.
Public finances remain on a long-term unsustainable path
After several years of fiscal consolidation, the prospects for further consolidation are disappointing. First, according the Japanese Cabinet Office's own estimates, under the most optimistic medium-term scenario (with highest productivity growth and significant public expenditure reductions), the surplus for the general government primary balance will only reach 0.2% of GDP by FY2011. In this case, the central government would still show a primary deficit of 1.2% of GDP in that year. Under the other scenarios, the general government primary balance remains in deficit in FY2011.
A more ambitious medium-term fiscal consolidation programme should be envisaged. Stabilising the debt-to-GDP ratio will require the achievement of a
significant primary surplus. While the reduction in expenditure should continue, a significant increase in fiscal revenues (beyond that stemming from faster economic growth) seems necessary. Increasing fiscal revenues will be all the more urgent given that the central government’s contribution to the basic pension programme will increase in 2009 from one third to one half of the costs. This is expected to cost an additional 1% of GDP per year. The possibility of increasing taxes will be discussed after the July elections but higher-than-expected fiscal revenues in FY2006 might make this harder.

3. China Surpluses skyrocketing
- 120 -
0
2
4
6
8
10
12
14
16
90 92 94 96 98 00 02 04 06 08
yoy % ch. Forecast
Graph 5.3: China - GDP growth
Economic growth remained very strong in 2006.
After a (revised) growth rate of 10.4% in 2005, GDP growth accelerated to 10.7% y-o-y in 2006. The key factors behind this higher-than-expected growth were net merchandise exports and a reacceleration of investment in fixed assets (accounting actually for almost 50% of overall GDP). Driven by rising per capita disposable income, private consumption growth accelerated slightly to 13.7% yoy. While there seems to have been a slight growth deceleration in the second half of 2006 (average annual growth rate of 10.5%), in the first quarter of 2007 growth accelerated again to a rate of 11.1% yoy.
Restricted investment rules and tightened monetary policy…
As the investment rate has continued to be very high, especially in the construction and real estate sectors, the Chinese authorities have since April 2006 introduced tightening measures, including 'administrative guidance'. These measures also include attempts to tighten domestic liquidity, which continues to be driven up by the massive increase in the current account surplus. The authorities have reacted not only through moral suasion on banks to strictly control credit flows to the overly invested sectors, but also by four increases in the benchmark lending rate and five increases in the reserve requirement ratio as of end March 2007.
…only had a temporary impact
The growth rate of investment and industrial production, however, which had somewhat slowed in
the second half of 2006, responding to the policy actions to curb investment, have reaccelerated again in the beginning of the current year. The same is true for money supply growth figures which are still growing above targets. Given the so far modest impact of the previous measures, further tightening measures are projected.
Inflation accelerating…
Inflation, which had been benign in the three first quarters of 2006 (average CIP rise by 1.3% yoy) started accelerating in the fourth quarter, brining the 2006 average to 1.5%. Due primarily to rising food prices, the CPI accelerated to 2.7% yoy in February and 3.3% in March. As consumer prices are not expected to accelerate further in the course of 2007, the average rise in CPI is forecast to reach 2.7%. With the renminbi (RMB) expected to appreciate further, the rate of inflation in 2008 is projected to accelerate only slightly compared to the 2007 rate, in spite of on going double-digit growth, higher property prices, further hikes in administered energy and public utility prices, and higher raw material and production costs.
…against the background of skyrocketing trade and current account surpluses
After reaching a record surplus of slightly more than $100 bn. (6% of GDP) in 2005, implying an unprecedented current account surplus of 7.2% of GDP, China's trade surplus continued to rise in 2006. According to Chinese statistics, imports in 2006 rose by 23.8% compared to the previous year and exports jumped by 27.2%, resulting in another jump in the trade balance by around 75% to $177.5 bn., bringing the current account surplus to more than $200 bn. last year. Not surprisingly under these conditions, foreign exchange reserves reached $ 1066.3 bn. at the end of 2006, an increase by $247.3 bn. compared to the end of 2005; as of end-March 2007, foreign exchange reserves had even risen to $1202 billion.
Outlook for 2007 and 2008
China's growth is expected to ease slightly to 10.5% in 2007 and 10.4% in 2008, reflecting earlier policy measures to rein in investment growth as well as likely further tightening moves. Given, however, that exports in the first three months of 2007 were up by an average 28% on the same period of last year, the overall export growth rate is projected to remain high
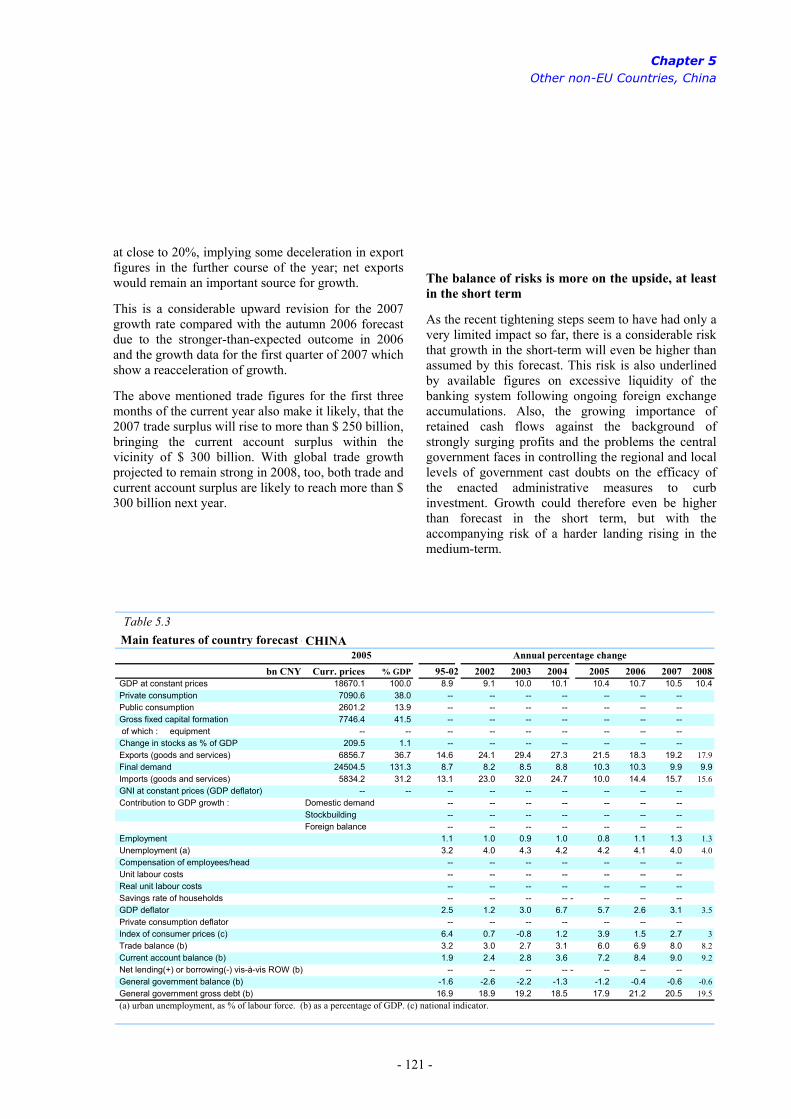
Chapter 5 Other non-EU Countries, China
- 121 -
Table 5.3 Main features of country forecast -CHINA
2005 Annual percentage changebn CNY Curr. prices % GDP 95-02 2002 2003 2004 2005 2006 2007 2008
GDP at constant prices 18670.1 100.0 8.9 9.1 10.0 10.1 10.4 10.7 10.5 10.4 Private consumption 7090.6 38.0 -- -- -- -- -- -- -- Public consumption 2601.2 13.9 -- -- -- -- -- -- -- Gross fixed capital formation 7746.4 41.5 -- -- -- -- -- -- -- of which : equipment -- -- -- -- -- -- -- -- -- Change in stocks as % of GDP 209.5 1.1 -- -- -- -- -- -- -- Exports (goods and services) 6856.7 36.7 14.6 24.1 29.4 27.3 21.5 18.3 19.2 17.9 Final demand 24504.5 131.3 8.7 8.2 8.5 8.8 10.3 10.3 9.9 9.9 Imports (goods and services) 5834.2 31.2 13.1 23.0 32.0 24.7 10.0 14.4 15.7 15.6 GNI at constant prices (GDP deflator) -- -- -- -- -- -- -- -- -- Contribution to GDP growth : Domestic demand -- -- -- -- -- -- --
Stockbuilding -- -- -- -- -- -- --Foreign balance -- -- -- -- -- -- --
Employment 1.1 1.0 0.9 1.0 0.8 1.1 1.3 1.3 Unemployment (a) 3.2 4.0 4.3 4.2 4.2 4.1 4.0 4.0 Compensation of employees/head -- -- -- -- -- -- -- Unit labour costs -- -- -- -- -- -- -- Real unit labour costs -- -- -- -- -- -- -- Savings rate of households -- -- -- ---- -- -- -- GDP deflator 2.5 1.2 3.0 6.7 5.7 2.6 3.1 3.5 Private consumption deflator -- -- -- -- -- -- -- Index of consumer prices (c) 6.4 0.7 -0.8 1.2 3.9 1.5 2.7 3 Trade balance (b) 3.2 3.0 2.7 3.1 6.0 6.9 8.0 8.2 Current account balance (b) 1.9 2.4 2.8 3.6 7.2 8.4 9.0 9.2 Net lending(+) or borrowing(-) vis-à-vis ROW (b) -- -- -- ---- -- -- -- General government balance (b) -1.6 -2.6 -2.2 -1.3 -1.2 -0.4 -0.6 -0.6 General government gross debt (b) 16.9 18.9 19.2 18.5 17.9 21.2 20.5 19.5 (a) urban unemployment, as % of labour force. (b) as a percentage of GDP. (c) national indicator.
at close to 20%, implying some deceleration in export figures in the further course of the year; net exports would remain an important source for growth.
This is a considerable upward revision for the 2007 growth rate compared with the autumn 2006 forecast due to the stronger-than-expected outcome in 2006 and the growth data for the first quarter of 2007 which show a reacceleration of growth.
The above mentioned trade figures for the first three months of the current year also make it likely, that the 2007 trade surplus will rise to more than $ 250 billion, bringing the current account surplus within the vicinity of $ 300 billion. With global trade growth projected to remain strong in 2008, too, both trade and current account surplus are likely to reach more than $ 300 billion next year.
The balance of risks is more on the upside, at least in the short term
As the recent tightening steps seem to have had only a very limited impact so far, there is a considerable risk that growth in the short-term will even be higher than assumed by this forecast. This risk is also underlined by available figures on excessive liquidity of the banking system following ongoing foreign exchange accumulations. Also, the growing importance of retained cash flows against the background of strongly surging profits and the problems the central government faces in controlling the regional and local levels of government cast doubts on the efficacy of the enacted administrative measures to curb investment. Growth could therefore even be higher than forecast in the short term, but with the accompanying risk of a harder landing rising in the medium-term.


Statistical Annex


Contents
- 125 -
Output: GDP and its components 1. Gross Domestic Product 127 2. Profiles (qoq) of quarterly GDP 127 3. Profiles (yoy) of quarterly GDP 128 4. GDP per capita 128 5. Final domestic demand 129 6. Final demand 129 7. Private consumption expenditure 130 8. Government consumption expenditure 130 9. Total investment 131 10. Investment in construction 131 11. Investment in equipment 132 12. Public investment 132 13. Potential output gap 133
Prices 14. Deflator of GDP 133 15. Deflator of private consumption 134 16. Consumer prices index 134 17. Consumer prices quarterly profiles 135 18. Deflator of exports of goods 135 19. Deflator of imports of goods 136 20. Terms of trade of goods 136
Wages, population and labour market 21. Compensation of employees per head 137 22. Real compensation of employees per head 137 23. Labour productivity 138 24. Unit labour costs, whole economy 138 25. Real unit labour costs 139 26. Total population 139 27. Total employment 140 28. Number of unemployed 140
Interest and exchange rates 29. Nominal bilateral exchange rates 141 30. Nominal effective exchange rates 141 31. Relative unit labour costs 142 32. Real effective exchange rates 142 33. Short term interest rates 143 34. Long term interest rates 143

- 126 -
General Government 35. Total expenditure 144 36. Total revenue 144 37. Net lending (+) or net borrowing (-) 145 38. Interest expenditure 145 39. Primary balance 146 40. Cyclically adjusted net lending (+) or net borrowing (-) 146 41. Cyclically adjusted primary balance 147 42. Gross debt 147
Saving 43. Gross national saving 148 44. Gross saving of the private sector 148 45. Gross saving of general government 149
Trade and international payments 46. Exports of goods and services 149 47. Imports of goods of services 150 48. Merchandise trade balance (% of GDP) 150 49. Current account balance (% of GDP) 151 50. Net lending(+) or net borrowing(-) 151 51. Merchandise trade balance (billion Ecu/euro) 152 52. Current account balance (billion Ecu/euro) 152 53. Export markets (goods) 153 54. Export performance (goods) 153
World economy 55. World GDP 154 56. World exports of goods and services 155 57. Export shares (goods) in EU trade 155 58. World imports of goods and services 156 59. Import shares (goods) in EU trade 156 60. World merchandise trade balances (billion USD) 157 61. World current account balances (billion USD) 157 62. Primary commodity prices 157
Note on concepts and sources 158
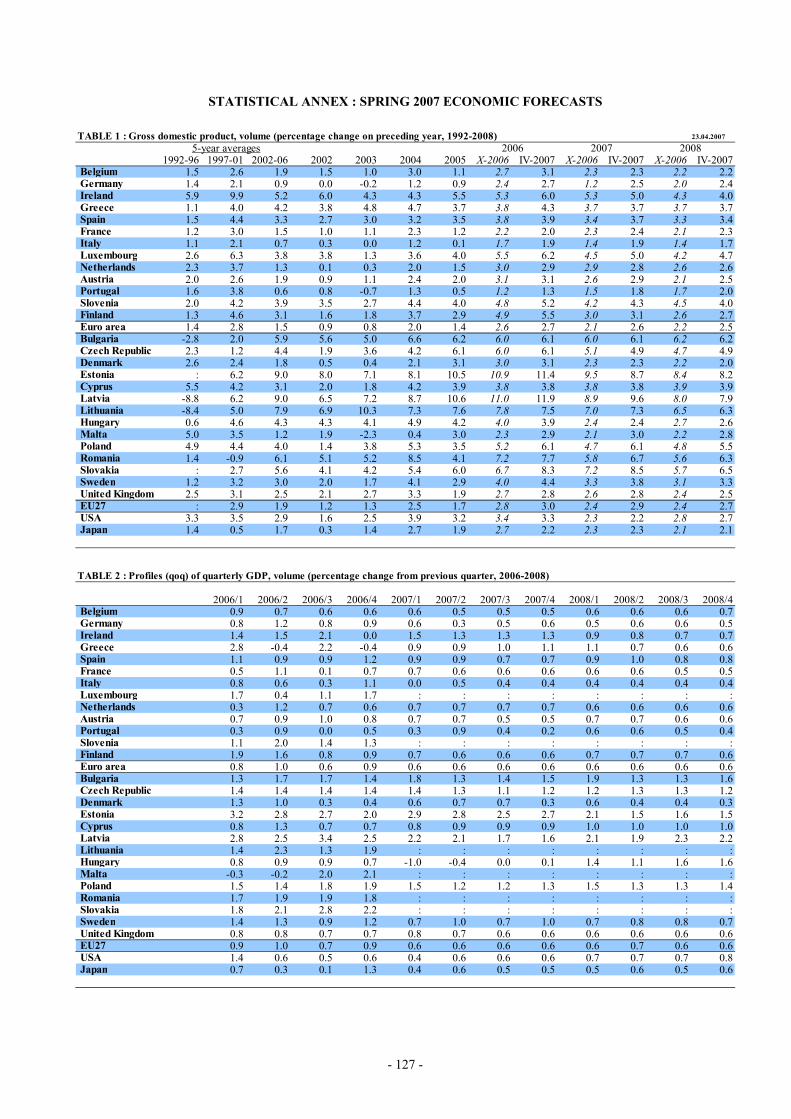
- 127 -
STATISTICAL ANNEX : SPRING 2007 ECONOMIC FORECASTS
TABLE 1 : Gross domestic product, volume (percentage change on preceding year, 1992-2008) 23.04.2007
5-year averages 2006 2007 20081992-96 1997-01 2002-06 2002 2003 2004 2005 X-2006 IV-2007 X-2006 IV-2007 X-2006 IV-2007
Belgium 1.5 2.6 1.9 1.5 1.0 3.0 1.1 2.7 3.1 2.3 2.3 2.2 2.2 Germany 1.4 2.1 0.9 0.0 -0.2 1.2 0.9 2.4 2.7 1.2 2.5 2.0 2.4 Ireland 5.9 9.9 5.2 6.0 4.3 4.3 5.5 5.3 6.0 5.3 5.0 4.3 4.0 Greece 1.1 4.0 4.2 3.8 4.8 4.7 3.7 3.8 4.3 3.7 3.7 3.7 3.7 Spain 1.5 4.4 3.3 2.7 3.0 3.2 3.5 3.8 3.9 3.4 3.7 3.3 3.4 France 1.2 3.0 1.5 1.0 1.1 2.3 1.2 2.2 2.0 2.3 2.4 2.1 2.3 Italy 1.1 2.1 0.7 0.3 0.0 1.2 0.1 1.7 1.9 1.4 1.9 1.4 1.7 Luxembourg 2.6 6.3 3.8 3.8 1.3 3.6 4.0 5.5 6.2 4.5 5.0 4.2 4.7 Netherlands 2.3 3.7 1.3 0.1 0.3 2.0 1.5 3.0 2.9 2.9 2.8 2.6 2.6 Austria 2.0 2.6 1.9 0.9 1.1 2.4 2.0 3.1 3.1 2.6 2.9 2.1 2.5 Portugal 1.6 3.8 0.6 0.8 -0.7 1.3 0.5 1.2 1.3 1.5 1.8 1.7 2.0 Slovenia 2.0 4.2 3.9 3.5 2.7 4.4 4.0 4.8 5.2 4.2 4.3 4.5 4.0 Finland 1.3 4.6 3.1 1.6 1.8 3.7 2.9 4.9 5.5 3.0 3.1 2.6 2.7 Euro area 1.4 2.8 1.5 0.9 0.8 2.0 1.4 2.6 2.7 2.1 2.6 2.2 2.5 Bulgaria -2.8 2.0 5.9 5.6 5.0 6.6 6.2 6.0 6.1 6.0 6.1 6.2 6.2 Czech Republic 2.3 1.2 4.4 1.9 3.6 4.2 6.1 6.0 6.1 5.1 4.9 4.7 4.9 Denmark 2.6 2.4 1.8 0.5 0.4 2.1 3.1 3.0 3.1 2.3 2.3 2.2 2.0 Estonia : 6.2 9.0 8.0 7.1 8.1 10.5 10.9 11.4 9.5 8.7 8.4 8.2 Cyprus 5.5 4.2 3.1 2.0 1.8 4.2 3.9 3.8 3.8 3.8 3.8 3.9 3.9 Latvia -8.8 6.2 9.0 6.5 7.2 8.7 10.6 11.0 11.9 8.9 9.6 8.0 7.9 Lithuania -8.4 5.0 7.9 6.9 10.3 7.3 7.6 7.8 7.5 7.0 7.3 6.5 6.3 Hungary 0.6 4.6 4.3 4.3 4.1 4.9 4.2 4.0 3.9 2.4 2.4 2.7 2.6 Malta 5.0 3.5 1.2 1.9 -2.3 0.4 3.0 2.3 2.9 2.1 3.0 2.2 2.8 Poland 4.9 4.4 4.0 1.4 3.8 5.3 3.5 5.2 6.1 4.7 6.1 4.8 5.5 Romania 1.4 -0.9 6.1 5.1 5.2 8.5 4.1 7.2 7.7 5.8 6.7 5.6 6.3 Slovakia : 2.7 5.6 4.1 4.2 5.4 6.0 6.7 8.3 7.2 8.5 5.7 6.5 Sweden 1.2 3.2 3.0 2.0 1.7 4.1 2.9 4.0 4.4 3.3 3.8 3.1 3.3 United Kingdom 2.5 3.1 2.5 2.1 2.7 3.3 1.9 2.7 2.8 2.6 2.8 2.4 2.5 EU27 : 2.9 1.9 1.2 1.3 2.5 1.7 2.8 3.0 2.4 2.9 2.4 2.7 USA 3.3 3.5 2.9 1.6 2.5 3.9 3.2 3.4 3.3 2.3 2.2 2.8 2.7 Japan 1.4 0.5 1.7 0.3 1.4 2.7 1.9 2.7 2.2 2.3 2.3 2.1 2.1
TABLE 2 : Profiles (qoq) of quarterly GDP, volume (percentage change from previous quarter, 2006-2008)
2006/1 2006/2 2006/3 2006/4 2007/1 2007/2 2007/3 2007/4 2008/1 2008/2 2008/3 2008/4 Belgium 0.9 0.7 0.6 0.6 0.6 0.5 0.5 0.5 0.6 0.6 0.6 0.7 Germany 0.8 1.2 0.8 0.9 0.6 0.3 0.5 0.6 0.5 0.6 0.6 0.5 Ireland 1.4 1.5 2.1 0.0 1.5 1.3 1.3 1.3 0.9 0.8 0.7 0.7 Greece 2.8 -0.4 2.2 -0.4 0.9 0.9 1.0 1.1 1.1 0.7 0.6 0.6 Spain 1.1 0.9 0.9 1.2 0.9 0.9 0.7 0.7 0.9 1.0 0.8 0.8 France 0.5 1.1 0.1 0.7 0.7 0.6 0.6 0.6 0.6 0.6 0.5 0.5 Italy 0.8 0.6 0.3 1.1 0.0 0.5 0.4 0.4 0.4 0.4 0.4 0.4 Luxembourg 1.7 0.4 1.1 1.7 : : : : : : : : Netherlands 0.3 1.2 0.7 0.6 0.7 0.7 0.7 0.7 0.6 0.6 0.6 0.6 Austria 0.7 0.9 1.0 0.8 0.7 0.7 0.5 0.5 0.7 0.7 0.6 0.6 Portugal 0.3 0.9 0.0 0.5 0.3 0.9 0.4 0.2 0.6 0.6 0.5 0.4 Slovenia 1.1 2.0 1.4 1.3 : : : : : : : : Finland 1.9 1.6 0.8 0.9 0.7 0.6 0.6 0.6 0.7 0.7 0.7 0.6 Euro area 0.8 1.0 0.6 0.9 0.6 0.6 0.6 0.6 0.6 0.6 0.6 0.6 Bulgaria 1.3 1.7 1.7 1.4 1.8 1.3 1.4 1.5 1.9 1.3 1.3 1.6 Czech Republic 1.4 1.4 1.4 1.4 1.4 1.3 1.1 1.2 1.2 1.3 1.3 1.2 Denmark 1.3 1.0 0.3 0.4 0.6 0.7 0.7 0.3 0.6 0.4 0.4 0.3 Estonia 3.2 2.8 2.7 2.0 2.9 2.8 2.5 2.7 2.1 1.5 1.6 1.5 Cyprus 0.8 1.3 0.7 0.7 0.8 0.9 0.9 0.9 1.0 1.0 1.0 1.0 Latvia 2.8 2.5 3.4 2.5 2.2 2.1 1.7 1.6 2.1 1.9 2.3 2.2 Lithuania 1.4 2.3 1.3 1.9 : : : : : : : : Hungary 0.8 0.9 0.9 0.7 -1.0 -0.4 0.0 0.1 1.4 1.1 1.6 1.6 Malta -0.3 -0.2 2.0 2.1 : : : : : : : : Poland 1.5 1.4 1.8 1.9 1.5 1.2 1.2 1.3 1.5 1.3 1.3 1.4 Romania 1.7 1.9 1.9 1.8 : : : : : : : : Slovakia 1.8 2.1 2.8 2.2 : : : : : : : : Sweden 1.4 1.3 0.9 1.2 0.7 1.0 0.7 1.0 0.7 0.8 0.8 0.7 United Kingdom 0.8 0.8 0.7 0.7 0.8 0.7 0.6 0.6 0.6 0.6 0.6 0.6 EU27 0.9 1.0 0.7 0.9 0.6 0.6 0.6 0.6 0.6 0.7 0.6 0.6 USA 1.4 0.6 0.5 0.6 0.4 0.6 0.6 0.6 0.7 0.7 0.7 0.8 Japan 0.7 0.3 0.1 1.3 0.4 0.6 0.5 0.5 0.5 0.6 0.5 0.6

- 128 -
TABLE 3 : Profiles (yoy) of quarterly GDP, volume (percentage change from corresponding quarter in previous year, 2006-2008) 23.04.2007
2006/1 2006/2 2006/3 2006/4 2007/1 2007/2 2007/3 2007/4 2008/1 2008/2 2008/3 2008/4 Belgium 2.8 3.1 3.1 2.9 2.5 2.3 2.1 2.0 2.0 2.1 2.3 2.5 Germany 1.9 2.8 3.1 3.7 3.5 2.6 2.2 2.0 1.9 2.2 2.3 2.2 Ireland 5.8 5.5 7.6 5.1 5.2 5.0 4.2 5.5 4.9 4.4 3.8 3.1 Greece 4.1 4.1 4.4 4.3 2.3 3.6 2.4 4.0 4.2 4.0 3.5 3.0 Spain 3.7 3.8 3.8 4.0 3.9 4.0 3.8 3.3 3.3 3.4 3.4 3.5 France 1.4 2.6 2.0 2.5 2.6 2.0 2.5 2.4 2.3 2.3 2.3 2.3 Italy 1.7 1.7 1.6 2.8 2.0 1.9 2.0 1.3 1.7 1.6 1.6 1.6 Luxembourg 7.7 6.3 5.7 5.0 : : : : : : : : Netherlands 2.6 3.0 3.0 2.9 3.3 2.8 2.8 3.0 2.8 2.6 2.5 2.3 Austria 3.2 3.4 3.5 3.6 3.4 3.2 2.7 2.4 2.4 2.4 2.5 2.6 Portugal 1.0 0.9 1.5 1.7 1.7 1.7 2.1 1.8 2.2 1.8 1.9 2.0 Slovenia 4.9 5.2 5.9 5.8 1.5 1.2 1.2 1.4 1.1 1.0 0.9 0.9 Finland 4.8 6.5 5.4 5.3 4.1 3.0 2.8 2.5 2.5 2.6 2.7 2.7 Euro area 2.2 2.9 2.8 3.3 3.1 2.7 2.6 2.3 2.3 2.4 2.4 2.4 Bulgaria 5.8 6.1 6.6 6.2 6.7 6.3 6.0 6.2 6.3 6.3 6.1 6.2 Czech Republic 6.4 6.1 6.0 5.8 5.7 5.6 5.2 5.0 4.8 4.8 5.0 5.0 Denmark 3.9 3.2 2.7 3.1 2.3 2.0 2.4 2.3 2.3 2.0 1.8 1.7 Estonia 11.6 11.8 11.0 11.2 3.4 3.9 3.7 2.1 2.5 2.9 3.0 3.1 Cyprus 3.5 4.2 3.8 3.6 3.5 3.1 3.3 3.5 3.8 3.9 4.0 4.1 Latvia : : : : : : : : : : : : Lithuania 7.8 8.4 6.9 7.0 6.7 7.4 7.1 6.7 6.5 6.5 6.5 6.3 Hungary 4.4 4.0 3.9 3.4 1.5 0.3 -0.7 -1.3 1.1 2.6 4.2 5.7 Malta 1.4 2.6 2.3 3.6 : : : : : : : : Poland 4.8 5.6 5.9 6.6 1.5 1.2 1.2 1.3 1.5 1.3 1.3 1.4 Romania 7.3 7.7 7.7 7.6 6.7 6.9 6.6 6.7 6.5 6.4 6.2 6.2 Slovakia 7.2 7.6 9.1 9.2 9.7 9.5 7.6 7.5 7.1 6.8 6.2 6.0 Sweden 4.4 5.0 4.5 4.9 4.1 3.9 3.7 3.5 3.5 3.3 3.4 3.1 United Kingdom 2.5 2.8 3.0 3.0 3.0 2.9 2.9 2.7 2.6 2.4 2.4 2.4 EU27 2.6 3.1 3.1 3.5 3.3 2.9 2.8 2.5 2.5 2.5 2.6 2.5 USA 3.7 3.5 3.0 3.1 2.2 2.1 2.2 2.2 2.5 2.6 2.7 2.9 Japan 2.7 2.1 1.5 2.5 2.1 2.4 2.7 1.9 2.1 2.0 2.1 2.1
TABLE 4 : Gross domestic product per capita (percentage change on preceding year, 1992-2008)5-year averages 2006 2007 2008
1992-96 1997-01 2002-06 2002 2003 2004 2005 X-2006 IV-2007 X-2006 IV-2007 X-2006 IV-2007 Belgium 1.2 2.4 1.5 1.0 0.6 2.5 0.5 2.5 2.7 2.1 2.1 2.0 2.0 Germany 0.9 1.9 0.9 -0.2 -0.2 1.3 1.0 2.4 2.8 1.1 2.6 2.0 2.5 Ireland 5.3 8.5 3.2 4.2 2.6 2.6 3.2 2.7 3.4 3.0 2.7 2.6 2.3 Greece 0.2 3.5 3.9 3.5 4.4 4.3 3.5 3.5 4.0 3.3 3.3 3.4 3.4 Spain 1.3 3.7 1.7 1.2 1.4 1.6 1.8 2.5 2.6 2.4 2.7 2.7 2.7 France 0.8 2.4 0.9 0.4 0.4 1.7 0.6 1.6 1.4 1.7 1.9 1.5 1.7 Italy 1.1 2.1 0.1 0.0 -0.7 0.2 -0.6 1.4 1.5 1.2 1.7 1.2 1.6 Luxembourg 1.1 5.1 2.9 2.8 0.5 2.9 3.1 4.9 5.2 3.9 4.0 3.6 3.7 Netherlands 1.7 3.1 1.0 -0.6 -0.1 1.6 1.3 2.9 2.7 3.0 2.7 2.6 2.5 Austria 1.4 2.4 1.4 0.3 0.7 1.7 1.3 2.6 2.7 2.2 2.5 1.7 2.1 Portugal 1.4 3.3 0.1 0.0 -1.4 0.8 0.0 0.6 0.9 0.9 1.4 1.1 1.6 Slovenia 2.1 4.2 3.8 3.3 2.6 4.4 3.8 4.6 5.0 4.0 4.1 4.3 3.8 Finland 0.8 4.3 2.8 1.4 1.5 3.4 2.6 4.7 5.0 2.9 2.9 2.5 2.6 Euro area 1.1 2.5 1.0 0.3 0.2 1.4 0.8 2.1 2.3 1.7 2.3 1.9 2.2 Bulgaria -2.2 3.1 6.5 6.2 5.6 7.2 6.8 6.3 6.6 6.3 6.6 6.6 6.7 Czech Republic 2.3 1.4 4.3 2.1 3.6 4.2 5.8 5.9 5.9 5.0 4.8 4.6 4.8 Denmark 2.2 2.1 1.5 0.1 0.1 1.9 2.8 2.9 2.8 2.3 2.0 2.2 1.8 Estonia : 7.1 9.3 8.5 7.5 8.1 11.2 11.3 11.6 9.9 9.0 8.7 8.4 Cyprus 3.3 3.0 1.1 0.7 0.1 1.8 1.4 1.8 1.8 1.8 1.7 1.9 1.9 Latvia -7.3 7.1 9.6 7.2 7.8 9.3 11.2 11.6 12.5 9.4 10.2 8.5 8.4 Lithuania -7.9 5.7 8.5 7.3 10.8 7.9 8.3 8.3 8.1 7.2 7.6 6.5 6.4 Hungary 0.7 4.8 4.5 4.6 4.4 5.1 4.5 4.2 4.1 2.6 2.6 2.9 2.8 Malta 4.1 2.8 0.5 1.2 -2.9 -0.2 2.4 1.3 2.3 1.1 2.1 1.3 1.9 Poland 4.7 4.6 4.1 1.5 3.9 5.4 3.6 5.3 6.2 4.8 6.2 4.9 5.6 Romania 1.9 -0.7 6.9 8.1 5.5 8.8 4.4 7.4 8.0 6.0 7.0 5.8 6.8 Slovakia : 2.7 5.5 4.1 4.1 5.4 5.9 6.6 8.2 7.1 8.4 5.6 6.4 Sweden 0.6 3.0 2.6 1.7 1.3 3.7 2.5 3.6 3.7 2.9 3.3 2.8 3.0 United Kingdom 2.2 2.8 2.0 1.7 2.3 2.8 1.3 2.1 2.2 2.2 2.3 2.0 2.0 EU27 : 2.7 1.5 0.9 0.9 2.0 1.3 2.5 2.7 2.1 2.6 2.2 2.4 USA 2.0 2.4 1.9 0.6 1.5 2.9 2.2 2.4 2.3 1.3 1.2 1.8 1.7 Japan 1.1 0.3 1.6 0.0 1.2 2.7 1.9 2.8 2.3 2.4 2.4 2.2 2.2

- 129 -
TABLE 5 : Domestic demand, volume (percentage change on preceding year, 1992-2008) 23.04.2007
5-year averages 2006 2007 20081992-96 1997-01 2002-06 2002 2003 2004 2005 X-2006 IV-2007 X-2006 IV-2007 X-2006 IV-2007
Belgium 1.3 2.4 1.9 0.7 1.0 3.1 1.6 2.3 3.3 2.2 2.1 2.0 1.9 Germany 1.5 1.6 0.2 -2.0 0.7 0.0 0.5 1.8 1.6 0.4 2.0 1.7 2.3 Ireland 4.0 8.8 5.3 4.1 3.4 5.1 8.0 6.3 5.8 6.0 5.2 4.0 3.9 Greece 1.2 4.1 4.5 4.7 5.4 4.7 2.5 3.9 5.4 3.6 4.0 3.7 3.8 Spain 0.8 5.0 4.3 3.2 3.8 4.8 5.0 4.5 4.6 4.1 4.4 3.7 4.0 France 0.7 3.0 2.0 1.1 1.7 3.0 1.9 2.4 2.4 2.5 2.5 2.2 2.4 Italy -0.1 2.8 1.0 1.3 0.9 1.1 0.3 1.4 1.6 1.3 1.8 1.4 1.7 Luxembourg 1.6 5.9 2.7 2.5 3.7 2.4 4.9 2.5 0.3 4.0 4.7 3.7 4.1 Netherlands 1.8 3.9 0.8 -0.4 0.5 0.5 0.9 2.4 2.7 2.6 3.0 2.1 2.8 Austria 2.1 1.8 1.2 -1.0 2.5 1.6 1.2 2.6 1.9 2.1 2.6 1.7 2.1 Portugal 2.1 4.6 0.3 0.0 -2.0 2.4 0.9 0.1 0.2 0.9 1.0 1.2 1.6 Slovenia 5.3 4.1 3.9 2.3 4.9 5.2 1.9 3.9 5.5 3.7 4.1 3.8 3.9 Finland 0.0 3.3 3.1 1.4 4.0 3.0 4.5 3.1 2.8 2.6 2.7 2.4 2.5 Euro area 1.0 2.8 1.6 0.4 1.5 1.9 1.7 2.5 2.6 2.1 3.0 2.1 2.3 Bulgaria : 5.6 8.5 5.8 8.6 8.3 9.3 8.0 10.6 7.5 8.2 8.0 8.2 Czech Republic 6.2 1.2 3.7 3.8 4.2 2.8 2.1 4.0 5.6 4.1 3.9 3.9 4.5 Denmark 2.9 2.2 3.1 1.7 0.2 4.1 4.3 4.9 5.2 2.6 2.7 2.1 2.0 Estonia : 5.9 10.1 11.3 9.4 7.4 6.8 11.6 15.6 11.5 12.9 9.9 10.9 Cyprus : 3.6 3.9 4.3 1.7 6.5 3.1 3.8 3.8 3.5 3.5 3.7 3.8 Latvia : 6.9 11.0 6.0 10.7 12.1 9.3 13.2 17.3 10.5 11.5 8.1 7.7 Lithuania : 5.5 9.9 6.6 12.2 13.2 9.3 10.1 8.5 9.0 10.6 8.5 8.0 Hungary 0.6 4.9 3.7 6.4 6.1 4.2 1.4 1.7 0.5 -0.1 -0.4 0.8 0.9 Malta : 1.5 1.9 -4.9 6.5 1.2 6.4 4.0 1.0 2.5 3.0 2.3 1.8 Poland 5.4 4.5 3.6 0.9 2.7 5.9 2.5 5.2 6.0 5.2 7.5 5.3 7.0 Romania 1.4 0.4 9.0 3.9 8.4 12.0 8.0 10.3 12.8 8.4 11.8 7.3 10.2 Slovakia : 2.6 4.7 4.1 -1.3 6.2 8.6 5.9 6.2 4.9 6.2 4.0 5.3 Sweden 0.1 2.6 2.1 0.8 1.6 1.8 2.6 3.4 3.5 3.3 4.0 2.8 3.1 United Kingdom 2.3 3.9 2.9 3.1 2.7 3.8 1.9 2.7 3.0 2.6 2.9 2.4 2.4 EU27 : 3.0 2.0 1.0 1.9 2.5 1.9 2.8 3.0 2.4 3.2 2.4 2.7 USA 3.4 4.2 3.2 2.2 2.8 4.4 3.3 3.3 3.2 2.2 1.8 2.7 2.6 Japan 1.6 0.3 1.1 -0.5 0.8 1.9 1.7 2.3 1.5 2.4 2.0 2.1 2.0
TABLE 6 : Final demand, volume (percentage change on preceding year, 1992-2008)5-year averages 2006 2007 2008
1992-96 1997-01 2002-06 2002 2003 2004 2005 X-2006 IV-2007 X-2006 IV-2007 X-2006 IV-2007 Belgium 2.3 3.6 2.5 0.9 1.9 4.4 2.1 3.7 3.4 3.5 3.8 3.2 3.4 Germany 1.7 3.2 2.2 -0.4 1.1 2.7 2.4 4.3 5.1 2.4 4.2 3.3 3.9 Ireland 8.3 12.4 4.7 4.3 2.4 5.4 5.9 5.6 5.4 5.6 5.3 4.5 4.4 Greece 1.6 5.1 4.2 2.5 4.7 5.7 2.5 4.4 5.6 4.0 4.4 4.0 4.2 Spain 2.3 5.8 4.1 2.9 3.8 4.7 4.3 5.0 4.9 4.2 4.7 4.1 4.3 France 1.5 4.0 2.1 1.2 1.1 3.2 2.2 3.6 3.1 3.2 3.2 3.0 3.1 Italy 1.4 2.6 0.9 0.2 0.2 1.5 0.2 2.3 2.4 1.9 2.5 2.0 2.4 Luxembourg 3.0 8.9 6.0 2.2 3.6 7.4 7.0 10.5 10.2 8.0 7.7 7.4 7.2 Netherlands 3.3 5.6 2.5 0.1 0.9 3.8 3.0 5.1 4.9 4.6 4.4 4.2 4.1 Austria 2.3 3.8 2.9 0.5 2.3 4.3 3.1 3.0 4.5 3.6 4.4 3.2 4.0 Portugal 2.7 4.8 1.1 0.3 -0.7 2.8 0.9 1.7 2.2 1.9 2.3 2.2 2.6 Slovenia 2.7 5.4 5.8 4.0 4.2 8.0 5.3 6.4 7.5 5.6 6.1 5.5 5.6 Finland 2.0 5.7 3.9 1.8 2.0 4.8 5.4 5.6 5.5 4.0 3.9 3.6 3.7 Euro area 1.9 4.0 2.4 0.7 1.4 3.2 2.4 4.0 4.2 3.2 4.1 3.2 3.4 Bulgaria : 5.8 8.6 5.9 9.0 9.0 9.4 9.6 9.8 8.8 8.8 9.1 8.7 Czech Republic 7.3 4.3 6.6 3.2 5.3 10.2 5.7 8.2 8.7 6.9 7.5 6.6 7.2 Denmark 3.0 3.7 3.5 2.5 -0.2 3.5 5.3 6.9 6.7 4.2 3.7 3.7 3.2 Estonia : 8.9 10.8 7.6 7.4 12.6 13.5 13.9 13.0 12.5 11.0 11.2 9.5 Cyprus : 4.5 2.9 1.0 0.8 6.0 3.6 4.4 3.2 4.4 3.7 4.5 3.9 Latvia : 6.6 10.5 5.9 9.2 11.4 12.1 13.5 14.0 11.8 10.8 9.5 8.1 Lithuania : 5.7 10.4 10.9 10.3 10.1 10.7 11.5 10.2 10.3 10.4 9.3 9.1 Hungary : 9.1 7.0 5.3 6.1 9.1 5.9 6.2 8.7 4.4 5.7 4.7 5.2 Malta : 2.6 1.7 0.2 2.1 2.9 2.1 2.5 1.2 2.3 2.9 2.3 2.3 Poland 6.4 5.4 5.3 1.7 5.2 7.9 3.7 8.3 8.4 6.9 8.2 6.6 7.6 Romania 0.9 2.6 9.6 7.1 8.4 12.5 8.0 11.3 12.3 8.9 11.3 8.4 9.7 Slovakia : 5.5 8.1 4.3 5.7 7.0 10.9 9.2 13.0 9.1 12.0 6.9 8.4 Sweden 1.8 4.2 3.6 0.9 2.6 5.1 4.1 5.1 5.4 4.4 5.1 4.0 4.2 United Kingdom 3.3 4.2 3.4 2.7 2.5 4.0 3.1 5.9 4.8 3.6 3.5 3.2 3.1 EU27 : 4.1 2.9 1.2 1.8 3.7 2.8 4.8 4.7 3.6 4.3 3.5 3.7 USA 3.8 4.2 3.3 1.8 2.7 4.8 3.6 3.8 3.8 2.7 2.3 3.1 3.0 Japan 1.7 0.5 2.0 0.3 1.6 3.2 2.3 3.2 2.5 3.0 2.7 2.7 2.6

- 130 -
TABLE 7 : Private consumption expenditure, volume (percentage change on preceding year, 1992-2008) 23.04.2007
5-year averages 2006 2007 20081992-96 1997-01 2002-06 2002 2003 2004 2005 X-2006 IV-2007 X-2006 IV-2007 X-2006 IV-2007
Belgium 1.3 2.3 1.3 0.8 0.9 1.5 0.9 2.3 2.4 2.1 2.1 1.9 1.6 Germany 1.9 1.9 0.0 -0.8 -0.1 0.1 0.1 1.0 0.8 -0.1 1.0 1.9 2.3 Ireland 3.8 6.2 4.7 3.8 3.2 3.8 6.6 6.6 6.2 7.0 7.4 4.6 4.4 Greece 1.8 2.8 4.1 3.6 4.5 4.7 3.7 3.4 3.8 3.2 3.6 3.0 3.4 Spain 1.1 4.3 3.5 2.8 2.8 4.2 4.2 3.6 3.7 3.4 3.5 3.1 3.3 France 1.1 2.8 2.2 2.4 2.0 2.3 2.0 2.8 2.6 2.5 2.6 2.3 2.3 Italy 0.5 2.4 0.8 0.2 1.0 0.7 0.6 1.6 1.5 1.0 1.7 1.3 1.7 Luxembourg 1.7 4.3 3.7 6.1 2.1 2.8 3.4 3.5 3.9 3.0 3.0 3.0 3.0 Netherlands 1.9 3.9 0.2 0.9 -0.2 0.6 0.7 -0.6 -1.2 1.8 1.9 2.1 2.8 Austria 2.1 1.7 1.4 0.1 1.3 1.9 1.7 2.0 1.8 2.1 2.0 1.8 2.1 Portugal 2.2 3.8 1.4 1.3 -0.1 2.5 2.2 1.1 1.1 1.3 1.3 1.4 1.5 Slovenia 5.1 2.9 2.8 1.3 3.5 2.6 3.4 3.6 3.3 3.5 3.6 3.6 3.4 Finland 0.5 3.2 3.3 2.2 4.8 3.0 3.8 3.7 3.0 2.9 2.8 2.6 2.7 Euro area 1.4 2.6 1.4 0.9 1.2 1.5 1.5 2.0 1.8 1.6 2.1 2.1 2.4 Bulgaria -1.4 2.0 6.4 7.2 5.5 5.9 6.1 6.0 7.5 6.5 7.8 7.0 8.0 Czech Republic 6.2 1.5 3.6 2.2 6.0 2.6 2.8 3.9 4.6 4.0 4.7 3.8 4.4 Denmark 2.4 1.0 3.0 1.5 1.0 4.7 4.2 3.9 3.4 2.3 2.4 2.0 1.8 Estonia : 6.0 9.7 11.2 6.9 6.9 8.2 14.4 15.7 12.3 15.1 11.5 12.6 Cyprus : 4.4 3.6 1.0 2.0 6.3 4.7 4.1 4.0 3.5 3.5 3.5 3.5 Latvia : 4.7 11.2 7.4 8.2 9.5 11.5 12.6 19.8 11.4 12.0 8.9 8.0 Lithuania : 4.9 10.3 6.0 10.2 12.2 9.8 11.5 13.6 9.5 12.3 8.6 9.1 Hungary : 4.8 5.4 10.5 8.4 3.1 3.9 3.0 1.6 -0.5 -0.6 0.5 0.5 Malta : 3.6 1.6 -2.2 3.4 1.9 2.2 2.3 2.6 2.5 2.8 2.6 2.6 Poland 4.8 4.6 3.3 3.3 1.9 4.2 1.9 4.6 5.2 3.9 5.9 3.6 5.8 Romania 3.1 0.3 10.3 5.2 8.4 14.6 9.6 11.5 13.8 9.0 11.9 7.5 9.9 Slovakia : 3.8 4.5 5.2 0.2 4.2 7.0 5.8 6.1 5.3 6.6 4.4 5.6 Sweden -0.1 2.9 2.1 1.5 1.8 2.2 2.4 3.4 2.8 3.5 3.9 3.4 3.6 United Kingdom 2.4 3.9 2.6 3.5 2.9 3.4 1.4 2.3 2.0 2.3 2.4 2.2 2.2 EU27 : 2.9 1.8 1.6 1.7 2.1 1.7 2.3 2.2 2.0 2.5 2.3 2.6 USA 3.3 4.2 3.2 2.7 2.8 3.9 3.5 3.2 3.2 2.4 2.9 2.2 2.0 Japan 2.2 0.6 1.1 1.1 0.4 1.6 1.6 1.8 0.9 1.9 1.4 1.9 1.7
TABLE 8 : Government consumption expenditure, volume (percentage change on preceding year, 1992-2008)5-year averages 2006 2007 2008
1992-96 1997-01 2002-06 2002 2003 2004 2005 X-2006 IV-2007 X-2006 IV-2007 X-2006 IV-2007 Belgium 1.2 2.0 1.6 2.9 2.2 2.1 -0.6 2.1 1.3 2.4 1.7 2.1 2.4 Germany 2.4 1.1 0.6 1.5 0.4 -1.3 0.6 1.2 1.8 0.8 1.0 0.7 0.9 Ireland 3.8 10.1 4.2 6.8 3.2 2.0 4.9 4.2 4.3 4.2 4.0 4.2 3.7 Greece 1.0 4.0 2.3 7.4 -2.0 2.8 3.1 1.9 0.6 1.7 1.3 3.8 3.3 Spain 2.1 3.8 5.0 4.5 4.8 6.3 4.8 4.5 4.4 4.4 4.6 4.4 4.8 France 1.8 1.0 1.8 1.9 2.0 2.3 1.1 1.5 1.9 0.9 2.1 0.7 1.5 Italy -1.0 1.5 1.4 2.1 2.0 1.6 1.5 0.7 -0.3 0.6 0.6 0.7 1.3 Luxembourg 4.1 4.8 3.8 4.2 4.4 3.2 4.8 3.8 2.3 3.6 2.8 3.1 2.8 Netherlands 1.3 2.9 3.0 3.3 2.9 0.1 0.3 7.0 8.6 2.3 2.3 2.0 2.2 Austria 2.6 1.5 1.4 1.8 1.2 1.4 1.9 1.7 0.9 1.6 1.8 1.6 2.1 Portugal 1.5 3.8 1.4 2.6 0.2 2.5 2.3 0.0 -0.3 0.0 -0.1 -0.3 0.3 Slovenia 2.2 3.6 2.9 3.2 1.6 3.4 2.2 3.0 3.8 2.9 3.4 3.1 3.2 Finland -0.6 1.5 1.7 2.7 1.5 1.8 1.7 1.1 0.9 1.0 1.2 1.5 1.3 Euro area 1.4 1.7 1.8 2.4 1.8 1.3 1.4 2.0 2.1 1.4 1.8 1.4 1.8 Bulgaria -15.4 5.2 4.2 4.5 7.7 3.8 2.5 2.5 2.4 3.0 3.5 3.0 4.0 Czech Republic -1.7 1.9 2.3 6.7 7.1 -3.2 1.0 0.8 0.3 0.7 0.6 0.8 1.1 Denmark 2.6 2.2 1.3 2.1 0.7 1.6 1.1 1.2 1.2 1.1 1.5 1.1 1.2 Estonia : 1.6 1.7 1.9 0.3 2.2 1.1 3.1 2.8 2.9 3.3 2.8 3.0 Cyprus : 5.3 2.5 6.9 6.0 -5.5 3.4 3.9 2.4 2.7 3.5 3.3 3.9 Latvia : 2.8 2.6 2.2 1.9 2.1 2.7 4.5 4.0 3.7 3.0 3.5 3.0 Lithuania : 1.7 5.0 1.6 3.8 7.7 4.9 6.4 7.3 6.1 6.3 5.9 5.5 Hungary -1.7 2.1 2.5 6.0 5.4 1.9 1.9 0.6 -2.6 -1.5 -1.7 -1.2 -1.4 Malta : 0.0 2.3 3.8 2.9 1.3 -0.4 1.0 3.9 0.4 0.3 1.1 0.5 Poland 3.3 2.4 3.7 1.3 4.9 3.1 5.3 2.5 3.9 3.3 1.6 3.6 1.5 Romania 3.6 0.5 3.4 3.2 7.7 -4.9 9.0 4.0 2.5 4.5 4.8 5.0 5.1 Slovakia : 1.4 2.9 5.2 3.9 2.0 -0.6 3.7 4.1 3.2 3.9 2.8 3.3 Sweden 0.3 0.8 1.1 2.3 0.7 0.4 0.3 1.6 1.8 1.6 1.5 1.5 1.3 United Kingdom 0.6 1.9 3.1 3.5 3.5 3.2 3.0 2.1 2.4 1.8 2.0 2.0 2.0 EU27 : 1.8 2.0 2.6 2.2 1.6 1.7 2.0 2.1 1.6 1.8 1.6 1.8 USA 0.0 2.3 2.5 4.7 2.8 2.5 1.0 1.6 1.7 2.2 2.4 2.0 2.0 Japan 3.1 2.8 1.7 2.4 2.3 1.9 1.7 0.4 0.3 0.7 1.0 0.7 0.7

- 131 -
TABLE 9 : Total investment, volume (percentage change on preceding year, 1992-2008) 23.04.2007
5-year averages 2006 2007 20081992-96 1997-01 2002-06 2002 2003 2004 2005 X-2006 IV-2007 X-2006 IV-2007 X-2006 IV-2007
Belgium 0.8 3.9 2.6 -2.2 -0.7 7.9 4.0 2.8 4.3 2.4 2.8 2.3 2.3 Germany 0.7 1.8 -0.2 -6.1 -0.8 -0.4 0.8 4.5 5.6 0.6 4.9 2.1 3.7 Ireland 7.5 10.9 6.6 3.4 5.8 7.4 12.8 7.0 3.9 5.4 5.0 3.0 3.5 Greece -0.2 8.6 7.1 5.7 13.7 5.7 -1.4 6.3 12.6 6.2 6.6 5.4 5.3 Spain -0.3 7.6 5.5 3.4 5.9 5.0 7.0 6.1 6.3 5.2 6.0 4.7 5.0 France -0.7 5.0 2.1 -1.7 2.2 3.0 3.6 3.4 3.7 3.5 3.7 3.6 3.4 Italy -0.9 3.6 1.1 4.0 -1.7 1.6 -0.5 3.3 2.3 2.2 3.1 2.0 2.5 Luxembourg 1.1 8.2 2.4 4.7 1.9 0.5 2.2 5.6 3.0 6.4 7.1 5.6 6.2 Netherlands 2.4 4.9 0.6 -4.5 -1.5 -0.8 3.6 4.5 6.7 4.4 4.2 2.3 3.6 Austria 1.1 2.4 1.0 -6.0 5.9 0.6 0.3 5.6 4.7 3.4 5.2 2.6 3.2 Portugal 2.7 7.2 -2.9 -3.5 -7.4 1.2 -3.2 -2.6 -1.6 0.4 0.4 2.2 2.9 Slovenia 7.2 8.4 5.7 0.9 7.1 7.9 1.5 8.1 11.8 4.8 6.0 3.9 5.5 Finland -3.8 7.5 2.6 -3.0 4.0 3.6 3.7 5.1 5.1 3.9 4.1 2.8 3.3 Euro area 0.1 4.1 1.8 -1.5 1.1 2.2 2.5 4.3 4.7 3.0 4.4 3.0 3.6 Bulgaria : 13.0 15.3 8.5 13.9 13.5 23.3 17.5 17.6 14.0 16.0 14.0 14.0 Czech Republic 10.9 0.3 3.7 5.1 0.4 4.7 1.3 6.6 7.3 7.6 7.6 6.5 7.8 Denmark 4.3 4.8 5.1 0.1 -0.2 5.6 9.6 12.0 11.2 4.4 6.2 3.2 3.2 Estonia : 7.7 15.3 24.1 7.0 13.5 12.7 14.5 19.7 12.9 14.7 11.4 12.2 Cyprus : 1.7 5.4 8.0 1.2 10.0 2.7 5.0 5.2 4.8 4.8 4.8 4.8 Latvia : 17.4 18.1 13.0 12.3 23.8 23.6 18.5 18.3 11.7 14.0 8.6 9.0 Lithuania : 8.1 12.3 10.9 14.1 15.5 9.2 12.1 11.9 9.7 10.6 9.5 9.1 Hungary 2.7 8.2 4.6 10.1 2.1 7.7 5.6 5.2 -1.8 2.2 1.1 3.6 4.0 Malta : -0.6 2.1 -18.7 26.4 0.7 8.5 7.5 -1.0 4.6 6.1 2.4 0.3 Poland 9.9 6.6 4.3 -6.3 -0.1 6.4 6.5 10.4 16.5 10.8 17.9 10.8 14.2 Romania 10.4 1.2 11.3 8.2 8.6 11.1 12.6 10.0 16.1 10.5 14.6 9.0 13.7 Slovakia : 1.4 5.3 0.3 -2.3 5.0 17.5 9.6 7.3 6.5 7.1 5.2 6.1 Sweden -1.5 4.0 4.1 -2.6 1.1 6.4 8.1 7.3 8.2 4.5 7.3 3.3 4.3 United Kingdom 2.3 5.6 3.9 3.7 0.4 6.0 3.0 5.2 6.5 4.7 5.5 3.1 3.8 EU27 : 4.3 2.4 -0.6 1.1 3.2 3.1 5.0 5.6 3.7 5.2 3.4 4.2 USA 6.9 6.0 3.0 -3.9 3.0 6.0 6.5 4.0 3.6 1.0 -1.2 4.8 4.5 Japan -0.3 -1.6 0.4 -4.9 -0.5 1.4 2.4 4.9 3.7 4.6 5.1 3.7 3.7
TABLE 10 : Investment in construction, volume (percentage change on preceding year, 1992-2008)5-year averages 2006 2007 2008
1992-96 1997-01 2002-06 2002 2003 2004 2005 X-2006 IV-2007 X-2006 IV-2007 X-2006 IV-2007 Belgium 1.4 1.4 2.8 -1.4 -0.5 6.4 5.3 3.7 4.6 0.1 2.5 2.1 2.0 Germany 2.9 -1.6 -2.2 -5.8 -1.6 -3.8 -3.6 3.1 4.2 -3.3 2.7 1.4 2.6 Ireland 7.1 10.3 7.6 5.1 7.4 7.3 10.4 6.2 7.8 4.6 2.9 1.3 1.4 Greece -3.1 6.4 6.5 3.6 11.0 3.7 -4.5 6.7 20.1 6.7 7.0 5.4 5.2 Spain -0.9 6.6 6.0 6.3 6.2 5.5 6.0 6.2 5.9 4.3 4.7 3.4 3.4 France -2.5 2.8 2.0 -1.5 2.2 3.2 2.3 3.9 3.8 3.2 2.7 2.9 2.4 Italy -2.2 2.2 2.0 4.8 1.4 1.5 0.4 2.3 2.1 1.1 2.5 1.1 1.4 Luxembourg 4.1 6.2 3.3 13.8 7.9 -4.2 -1.8 2.0 1.9 3.5 4.8 3.4 4.8 Netherlands 1.3 3.7 -0.6 -4.9 -3.9 -1.1 2.6 4.1 4.3 4.0 4.3 2.0 3.6 Austria 2.1 -0.4 1.4 -4.5 5.1 1.6 0.4 5.3 4.6 2.6 3.9 1.7 2.9 Portugal 3.3 6.5 -5.1 -3.3 -9.7 -1.3 -4.7 -5.0 -6.2 -1.6 -2.7 0.6 1.3 Slovenia 3.8 4.2 5.9 4.1 5.4 7.9 0.5 6.7 11.8 7.0 6.5 3.9 6.0 Finland -6.0 7.9 2.8 -1.7 1.4 5.0 4.2 5.0 5.5 3.0 4.0 2.5 2.9 Euro area : 1.8 1.4 -1.0 1.2 1.2 1.1 3.9 4.5 1.7 3.3 2.3 2.7 Bulgaria : : : : : : : : : : : : : Czech Republic 4.3 -4.9 4.7 2.4 7.9 4.7 1.5 6.5 6.9 7.9 8.4 6.6 8.9 Denmark 3.2 2.1 3.7 -4.5 2.5 4.8 7.6 7.9 8.7 4.8 3.0 3.1 1.6 Estonia : : : : : : : 14.5 : 12.9 : 11.4 : Cyprus : -0.1 7.2 6.1 9.6 10.0 6.5 4.5 4.1 4.3 4.3 4.3 4.3 Latvia : : : : : : : : : : : : : Lithuania : 4.1 11.8 11.3 19.7 5.8 9.9 11.0 12.8 9.0 11.2 8.0 9.0 Hungary : : : : : : : 7.6 -1.9 2.6 0.0 1.6 1.8 Malta : : : : : : : : : : : : : Poland : 5.6 4.6 -3.8 -0.3 5.4 6.5 10.0 16.5 10.0 18.2 10.0 14.2 Romania 15.0 4.4 11.1 9.5 4.1 11.4 12.6 : 18.1 : 15.5 : 14.0 Slovakia : 1.6 2.1 -5.5 -4.4 11.7 11.6 10.9 -1.7 7.0 1.9 5.7 2.2 Sweden -7.4 0.8 4.6 2.4 -2.2 6.3 4.8 8.1 12.2 5.2 6.4 4.0 2.4 United Kingdom 1.4 2.5 5.6 5.2 7.1 3.2 6.1 5.6 6.3 4.6 4.4 2.8 3.0 EU27 : : : : : : : : : : : : : USA 3.9 3.4 2.2 -2.3 3.3 5.2 4.7 0.7 0.5 -3.8 -4.3 4.1 3.9 Japan -1.5 -3.8 : -3.4 -2.1 -2.1 : : : : : : :
- 132 -
TABLE 11 : Investment in equipment, volume (percentage change on preceding year, 1992-2008) 23.04.2007
5-year averages 2006 2007 20081992-96 1997-01 2002-06 2002 2003 2004 2005 X-2006 IV-2007 X-2006 IV-2007 X-2006 IV-2007
Belgium -0.5 6.2 1.5 -4.0 -3.0 8.8 2.2 2.0 4.1 4.3 3.0 2.5 2.5 Germany -3.1 6.3 1.8 -7.5 -0.3 4.1 6.1 6.2 7.3 4.8 7.1 2.7 4.7 Ireland 9.6 11.1 4.5 1.4 0.3 9.1 20.8 9.5 -7.0 7.5 12.5 7.0 10.0 Greece 7.4 12.2 7.3 6.8 18.3 8.2 0.5 5.6 3.8 6.2 6.7 5.8 5.8 Spain -0.1 9.1 4.8 -2.9 4.1 4.4 9.0 7.4 9.7 7.4 9.9 7.0 7.7 France 1.0 8.0 1.4 -4.0 1.4 1.2 5.2 3.5 3.5 4.3 4.0 4.7 5.0 Italy -0.1 5.1 -0.1 2.0 -5.8 2.3 -0.8 4.3 2.3 3.1 3.8 2.6 3.5 Luxembourg -4.2 11.0 -1.3 -10.5 -14.5 8.0 9.5 10.6 3.4 10.7 10.7 8.0 8.0 Netherlands 3.6 6.0 3.4 -4.9 5.0 -0.5 4.3 5.2 13.8 4.9 5.5 2.7 4.8 Austria -0.5 5.5 0.2 -9.2 7.2 -1.6 0.2 6.4 5.3 4.6 7.5 4.0 3.8 Portugal 1.1 9.1 -1.1 -8.2 -4.6 4.6 -0.7 0.4 3.9 2.6 3.2 4.0 4.5 Slovenia 8.9 13.1 6.2 -2.7 11.5 7.6 3.0 10.4 12.3 2.0 5.5 4.1 5.0 Finland -1.4 6.7 1.6 -4.8 7.0 0.4 0.7 6.0 5.4 6.5 5.2 3.5 4.9 Euro area -0.6 6.8 1.8 -3.7 0.0 3.2 4.1 5.2 5.5 4.6 5.9 3.8 4.9 Bulgaria : : : : : : : : : : : : : Czech Republic 17.0 5.6 3.1 7.9 -5.9 4.5 1.9 7.0 7.9 7.5 6.8 6.5 6.5 Denmark 3.3 6.6 5.3 -2.6 -4.0 5.6 12.1 18.0 16.9 4.3 10.1 3.4 4.9 Estonia : : : : : : : 14.5 : 12.9 : 11.4 : Cyprus : 5.3 2.0 12.2 -13.0 10.3 -5.1 3.9 7.9 6.0 6.0 6.0 6.0 Latvia : : : : : : : : : : : : : Lithuania : 13.7 13.7 10.8 7.5 31.9 9.2 14.0 10.8 11.0 10.0 12.0 9.5 Hungary : : : : : : : 5.4 -1.3 4.1 4.0 7.8 6.8 Malta : : : : : : : : : : : : : Poland : 7.1 3.8 -8.5 -1.5 8.0 6.5 11.0 16.5 12.0 17.5 12.0 14.2 Romania 6.2 9.3 12.0 6.5 18.0 8.2 12.9 : 14.5 : 13.8 : 13.5 Slovakia : 2.5 7.9 3.0 -0.2 -0.5 24.0 7.9 15.2 5.8 10.9 4.6 8.8 Sweden 5.1 5.3 4.6 -3.6 3.3 6.5 12.9 7.0 4.7 4.0 8.0 3.0 6.0 United Kingdom 2.1 8.2 2.4 1.2 -3.0 4.9 2.4 4.7 6.8 4.9 7.2 3.5 5.0 EU27 : : : : : : : : : : : : : USA 10.3 8.6 3.7 -5.5 2.7 7.0 8.7 7.0 6.4 5.2 1.5 5.3 5.0 Japan 1.5 0.6 : -7.0 5.5 7.7 : : : : : : :
TABLE 12 : Public investment (as a percentage of GDP, 1992-2008)5-year averages 2006 2007 2008
1992-96 1997-01 2002-06 2002 2003 2004 2005 X-2006 IV-2007 X-2006 IV-2007 X-2006 IV-2007 Belgium 1.6 1.8 1.7 1.7 1.7 1.6 1.8 1.6 1.7 1.8 1.6 1.8 1.7 Germany 2.4 1.8 1.5 1.7 1.6 1.4 1.3 1.3 1.4 1.4 1.4 1.4 1.5 Ireland 2.2 3.3 3.9 4.2 3.8 3.7 3.7 3.3 3.9 3.5 4.1 3.7 4.3 Greece 3.2 3.7 3.9 3.7 4.2 4.2 3.5 3.5 3.6 3.5 3.5 3.5 3.5 Spain 3.7 3.2 3.5 3.5 3.6 3.4 3.6 3.6 3.6 3.6 3.6 3.7 3.7 France 3.2 3.0 3.2 2.9 3.1 3.1 3.3 3.3 3.4 3.4 3.4 3.5 3.4 Italy 2.4 2.3 2.2 1.7 2.5 2.4 2.3 2.5 2.3 2.6 2.4 2.6 2.4 Luxembourg 4.2 4.0 4.5 5.0 4.6 4.3 4.7 4.7 4.1 4.6 3.9 4.5 3.8 Netherlands 2.5 3.1 3.4 3.5 3.6 3.2 3.2 3.1 3.3 3.1 3.3 3.0 3.2 Austria 3.1 1.6 1.1 1.3 1.2 1.1 1.1 1.1 1.1 1.0 1.1 1.0 1.0 Portugal 3.6 3.9 3.0 3.5 3.1 3.1 2.8 2.5 2.3 2.3 2.2 2.3 2.2 Slovenia : : 3.4 3.0 3.3 3.5 3.4 3.8 3.7 3.9 3.6 3.8 3.0 Finland 2.9 2.8 2.8 2.7 2.9 2.9 2.6 2.6 2.6 2.5 2.6 2.5 2.7 Euro area : : 2.5 2.4 2.5 2.5 2.5 2.5 2.5 2.6 2.6 2.6 2.6 Bulgaria : 3.1 3.0 2.7 2.5 2.7 3.4 3.8 3.7 4.5 4.0 5.2 4.5 Czech Republic : 3.8 4.7 3.9 4.5 4.9 4.9 5.0 5.1 5.0 5.3 5.0 5.3 Denmark 1.8 1.7 1.7 1.8 1.6 1.8 1.8 1.8 1.7 1.6 1.6 1.7 1.5 Estonia : 4.2 3.8 4.9 4.2 3.1 3.2 3.4 3.6 3.5 3.8 3.5 4.0 Cyprus : : 3.4 3.0 3.4 4.0 3.1 3.1 3.3 3.1 3.3 3.1 3.3 Latvia : 1.5 2.7 1.3 2.4 3.1 3.3 3.4 3.4 3.9 3.8 4.6 4.2 Lithuania : 2.4 3.4 2.9 3.0 3.4 3.5 4.2 4.2 4.6 5.1 4.7 6.0 Hungary : 3.1 4.1 4.9 3.5 3.5 4.0 4.5 4.5 3.5 3.6 3.2 3.3 Malta : : 4.3 4.5 5.1 2.1 5.3 5.7 4.6 6.3 5.2 6.3 4.0 Poland : 3.4 3.5 3.4 3.3 3.4 3.4 3.8 4.1 4.1 4.6 4.2 4.7 Romania : : 3.2 3.1 3.2 3.0 3.8 3.1 2.9 3.2 3.8 3.3 4.1 Slovakia : 3.6 2.5 3.2 2.6 2.4 2.1 1.9 2.2 1.6 2.2 1.3 2.2 Sweden 2.7 3.1 3.1 3.2 3.1 3.0 3.0 3.0 3.2 3.0 3.2 3.0 3.2 United Kingdom 1.8 1.3 1.4 1.4 1.6 1.7 0.6 2.1 1.8 2.4 2.0 2.4 2.3 EU27 : : 2.4 2.3 2.4 2.4 2.2 2.5 2.5 2.6 2.6 2.7 2.7 USA 2.5 2.6 2.8 2.8 2.7 2.6 2.6 3.3 3.3 3.3 3.3 3.3 3.4 Japan 6.2 5.5 4.0 4.8 4.3 3.9 3.7 3.3 3.4 3.2 3.2 3.0 3.1

- 133 -
TABLE 13 : Output gap relative to potential GDP (deviation of actual output from potential output as % of potential GDP, 1992-2008) ¹ 23.04.2007
5-year averages 2006 2007 20081992-96 1997-01 2002-06 2002 2003 2004 2005 X-2006 IV-2007 X-2006 IV-2007 X-2006 IV-2007
Belgium -0.9 0.4 -0.4 0.1 -0.8 0.1 -1.0 -0.6 -0.5 -0.6 -0.5 -0.7 -0.6 Germany 0.3 0.2 -1.1 -0.2 -1.6 -1.5 -1.8 -0.2 -0.3 -0.4 0.4 0.1 0.9 Ireland -3.7 2.9 0.9 3.3 1.6 0.1 -0.3 -1.4 -0.4 -1.9 -0.9 -2.7 -1.6 Greece -1.7 -1.4 1.0 -0.1 0.6 1.5 1.4 1.5 1.7 1.5 1.5 1.8 1.6 Spain -2.5 0.4 -0.3 1.1 0.1 -0.6 -1.2 -0.9 -1.1 -1.1 -1.0 -1.3 -1.3 France -1.2 0.6 -0.2 0.9 -0.1 0.1 -0.8 -0.8 -1.0 -0.7 -0.9 -0.9 -0.9 Italy -1.0 0.6 -0.5 1.0 -0.3 -0.4 -1.6 -1.0 -1.3 -1.0 -1.0 -1.1 -0.9 Luxembourg -0.1 0.5 -1.2 1.3 -1.8 -2.2 -2.5 -0.9 -0.8 -0.7 -0.4 -0.9 -0.4 Netherlands -1.2 1.7 -1.2 -0.1 -1.7 -1.5 -1.8 -1.2 -1.0 -0.4 -0.4 0.0 -0.1 Austria -0.2 0.7 -0.9 -0.5 -1.6 -1.2 -1.1 -0.2 -0.2 0.2 0.5 0.0 0.8 Portugal -1.6 1.7 -1.1 1.3 -1.1 -1.3 -2.1 -2.0 -2.1 -1.8 -1.7 -1.5 -1.2 Slovenia : 0.6 -0.8 -0.6 -1.7 -1.2 -0.9 -0.3 0.2 0.0 0.5 0.4 0.4 Finland -4.7 1.9 -0.9 -0.1 -1.7 -1.3 -1.6 0.1 0.4 0.2 0.3 -0.2 -0.1 Euro area : 0.6 -0.6 0.5 -0.7 -0.7 -1.3 -0.6 -0.8 -0.7 -0.4 -0.6 -0.2 Bulgaria : -2.3 0.7 0.0 0.0 1.1 1.2 : 1.0 : 0.7 : 0.3 Czech Republic : -2.2 -1.8 -2.8 -2.9 -2.8 -1.1 0.9 0.4 1.4 0.5 1.5 0.5 Denmark -1.4 1.4 -0.7 -0.3 -1.6 -1.3 -0.5 -0.2 0.3 -0.4 0.1 -0.6 -0.4 Estonia : -1.2 -0.2 -0.3 -1.0 -1.5 -0.1 1.2 1.7 0.9 0.7 -0.6 -0.9 Cyprus : 0.5 -0.4 1.4 -0.5 -0.7 -1.2 -1.3 -1.0 -1.3 -0.8 -1.3 -0.6 Latvia : -0.3 -0.3 -0.5 -1.0 -1.0 -0.2 1.1 1.4 0.4 0.8 -1.0 -1.2 Lithuania : -1.3 1.1 -1.0 2.1 1.7 1.4 1.4 1.3 0.7 0.6 -0.6 -0.1 Hungary : -0.8 0.0 -0.8 -0.7 0.1 0.5 1.0 1.0 0.1 0.2 -0.5 -0.4 Malta : 2.4 -1.5 2.0 -2.1 -3.4 -2.5 -1.4 -1.5 -1.1 -0.6 -0.5 0.1 Poland : -0.1 -0.7 -2.1 -1.3 0.3 -0.4 0.4 0.1 0.3 0.4 0.1 -0.2 Romania : -4.9 -1.1 -3.8 -2.7 0.7 -0.5 : 0.9 : 0.9 : 0.2 Slovakia : -0.5 -2.1 -2.5 -2.8 -2.5 -2.4 -0.7 -0.4 1.1 1.7 1.6 1.8 Sweden -3.1 -0.1 -0.8 -0.7 -1.8 -0.7 -0.8 0.2 0.2 0.5 0.6 0.6 0.8 United Kingdom -1.5 0.6 0.0 0.1 0.0 0.5 -0.3 -0.4 -0.4 -0.5 -0.4 -0.7 -0.5 EU27 : 0.5 -0.5 0.2 -0.7 -0.5 -1.1 : -0.6 : -0.3 : -0.3¹ When comparing output gaps between the spring and the autumn forecast it has to be taken into account that the overall revisions to the forecast may have led to changes in the estimates for potential output.
TABLE 14 : Deflator of gross domestic product (percentage change on preceding year, 1992-2008)5-year averages 2006 2007 2008
1992-96 1997-01 2002-06 2002 2003 2004 2005 X-2006 IV-2007 X-2006 IV-2007 X-2006 IV-2007 Belgium 2.2 1.5 1.9 1.9 1.6 2.4 2.0 2.1 1.8 2.0 2.2 2.1 2.0 Germany 2.7 0.3 0.8 1.4 1.0 0.9 0.6 0.6 0.3 1.2 1.8 0.4 0.9 Ireland 2.8 4.6 3.1 5.0 2.5 1.8 3.5 2.5 2.9 3.1 3.0 2.5 2.6 Greece 11.5 4.5 3.6 3.8 3.5 3.4 3.7 3.6 3.4 3.2 3.2 3.3 3.3 Spain 4.7 3.0 4.1 4.3 4.1 4.0 4.1 3.9 3.8 3.2 3.1 3.1 2.9 France 1.7 1.1 2.0 2.4 1.9 1.7 1.9 2.0 2.0 1.8 1.9 1.9 1.8 Italy 4.4 2.3 2.7 3.4 3.1 2.9 2.2 2.2 1.8 2.2 2.1 2.2 2.2 Luxembourg 3.7 1.0 4.0 2.7 4.9 1.7 4.7 4.1 5.9 3.5 4.6 3.1 3.7 Netherlands 2.0 3.1 2.0 3.8 2.2 0.7 1.7 1.7 1.5 2.1 1.7 2.1 2.1 Austria 2.4 0.9 1.6 1.4 1.3 1.7 1.9 1.5 1.6 1.8 1.8 1.9 1.7 Portugal 6.4 3.5 3.1 3.9 3.1 2.7 2.8 2.2 2.9 2.1 2.7 2.3 2.5 Slovenia 47.9 7.1 4.1 7.9 5.8 3.3 1.5 1.6 2.3 3.3 2.8 2.6 2.8 Finland 1.7 2.4 0.6 1.3 -0.4 0.6 0.2 1.4 1.3 1.3 1.8 1.4 1.6 Euro area 3.2 1.6 2.0 2.6 2.1 1.9 1.9 1.9 1.7 2.0 2.1 1.8 1.9 Bulgaria 71.8 72.6 4.4 3.3 1.8 5.1 3.8 6.7 8.1 3.5 4.0 4.4 4.2 Czech Republic 13.4 5.7 1.9 2.8 0.9 3.5 0.7 1.4 1.7 2.4 1.8 2.4 2.7 Denmark 1.4 2.1 2.3 2.3 1.6 2.0 3.2 3.2 2.4 2.3 3.0 2.4 2.8 Estonia : 6.9 4.2 3.8 2.3 2.1 6.8 4.5 6.1 4.4 8.2 5.2 6.6 Cyprus 3.6 3.0 2.9 1.2 5.1 3.3 2.4 2.6 2.6 2.1 2.3 2.3 2.3 Latvia 98.3 4.4 7.0 3.6 3.6 7.0 10.2 8.7 11.1 8.8 11.2 7.8 9.3 Lithuania 160.7 3.1 2.9 0.1 -0.9 2.7 5.8 5.0 7.1 6.6 5.1 5.4 4.5 Hungary 21.8 11.5 4.6 7.9 5.7 4.3 2.0 2.9 3.0 4.7 6.2 3.4 3.4 Malta 3.0 1.6 2.7 2.7 4.6 1.4 2.4 3.1 2.6 2.9 2.3 2.7 2.2 Poland 30.3 8.3 2.1 2.2 0.4 4.1 2.6 1.0 1.5 1.9 2.3 2.5 2.5 Romania 115.1 62.2 16.9 23.4 24.0 15.0 12.2 10.9 10.4 8.3 9.8 5.8 8.1 Slovakia : 6.4 4.1 4.6 4.7 6.0 2.4 4.2 2.7 3.5 3.3 2.0 2.3 Sweden 2.4 1.4 1.3 1.6 2.0 0.2 1.2 1.7 1.8 2.3 2.5 2.1 2.0 United Kingdom 2.9 2.3 2.7 3.1 3.1 2.6 2.2 2.6 2.4 2.5 2.6 2.5 2.3 EU27 : 2.3 2.3 2.8 2.4 2.2 2.0 2.1 2.1 2.2 2.6 2.0 2.1 USA 2.1 1.8 2.5 1.8 2.1 2.8 3.0 3.2 2.9 2.7 2.2 1.7 1.6 Japan 0.1 -0.7 -1.3 -1.5 -1.6 -1.1 -1.3 -0.7 -0.9 -0.3 0.1 0.0 0.3

- 134 -
TABLE 15 : Price deflator of private consumption (percentage change on preceding year, 1992-2008) 23.04.2007
5-year averages 2006 2007 20081992-96 1997-01 2002-06 2002 2003 2004 2005 X-2006 IV-2007 X-2006 IV-2007 X-2006 IV-2007
Belgium 1.8 1.7 2.1 1.3 1.7 2.4 2.9 2.4 2.2 1.8 1.8 1.7 1.8 Germany 2.4 1.0 1.4 1.2 1.5 1.6 1.3 1.5 1.3 1.9 1.6 0.9 1.3 Ireland 2.9 4.8 2.8 5.0 3.7 1.5 1.2 2.3 2.6 2.2 2.7 2.0 2.4 Greece 11.6 4.4 3.0 2.5 2.8 2.5 3.7 3.5 3.4 3.0 3.0 3.1 3.1 Spain 4.9 2.8 3.3 2.8 3.1 3.5 3.4 3.6 3.6 2.8 2.6 2.7 2.4 France 1.6 0.9 1.6 1.0 1.9 1.9 2.0 1.6 1.2 1.7 1.3 1.9 1.8 Italy 5.1 2.4 2.7 2.9 2.8 2.6 2.4 2.5 2.7 2.2 2.0 2.0 2.1 Luxembourg 2.8 2.3 2.4 0.3 2.4 2.5 3.6 2.8 3.1 1.9 2.3 1.8 2.5 Netherlands 2.3 2.9 1.9 3.0 2.4 0.8 1.6 2.0 1.9 2.2 1.4 2.3 2.0 Austria 2.8 1.4 1.6 1.2 1.6 1.9 1.7 1.7 1.4 1.6 1.6 1.6 1.4 Portugal 5.7 2.8 2.9 3.0 2.9 2.6 2.5 3.0 3.3 2.2 2.3 2.1 2.3 Slovenia 45.7 7.5 4.2 7.9 5.4 3.3 2.2 2.3 2.4 2.4 2.5 2.6 2.6 Finland 1.9 2.5 1.0 2.2 -0.4 1.0 0.1 1.2 1.9 1.6 1.7 1.6 1.7 Euro area 3.3 1.7 2.0 1.9 2.1 2.1 2.0 2.1 2.0 2.1 1.8 1.8 1.8 Bulgaria 80.5 70.1 3.8 4.1 0.2 4.4 5.2 6.5 5.2 3.0 3.2 3.5 3.5 Czech Republic 11.2 5.3 1.6 1.2 -0.4 3.0 1.7 2.4 2.3 2.6 2.3 2.7 2.7 Denmark 1.7 2.1 1.7 1.7 1.3 1.5 2.2 2.0 2.1 1.9 1.9 1.9 2.2 Estonia : 6.4 2.3 2.9 0.9 1.8 2.9 4.4 3.2 4.2 4.3 4.6 4.8 Cyprus : 2.3 2.7 2.4 4.0 1.9 2.7 3.2 2.6 2.5 1.9 2.5 2.4 Latvia : 4.1 5.8 2.2 3.1 7.0 8.7 6.8 8.3 5.8 8.0 5.4 6.5 Lithuania : 3.0 0.9 -0.1 -0.9 -0.3 3.7 3.8 2.4 4.7 3.8 3.3 3.5 Hungary : 11.8 3.8 3.9 4.0 4.5 3.6 3.9 3.2 6.8 7.5 3.9 3.9 Malta : 1.7 1.9 2.1 0.6 2.4 2.6 3.1 2.0 2.8 1.4 2.4 2.1 Poland 31.6 9.0 1.9 3.3 0.4 3.0 2.2 1.4 0.9 2.3 1.9 2.7 2.5 Romania 117.3 60.5 12.4 21.4 15.2 13.9 7.1 5.5 5.1 5.0 4.3 4.5 3.8 Slovakia : 7.0 5.0 3.3 6.6 7.4 2.6 4.5 5.1 3.4 2.7 2.5 3.3 Sweden 3.5 1.4 1.4 1.7 1.8 0.8 1.3 1.3 1.3 2.0 1.0 1.7 1.7 United Kingdom 3.4 2.0 2.0 1.6 1.9 1.7 2.5 2.5 2.3 2.2 2.3 2.0 2.1 EU27 : 2.5 2.1 2.0 2.1 2.1 2.2 2.2 2.3 2.2 2.2 1.9 2.0 USA 2.3 1.8 2.3 1.4 2.0 2.6 2.9 3.1 2.7 2.3 1.9 1.8 2.0 Japan 0.2 -0.2 -0.8 -1.4 -0.9 -0.7 -0.8 -0.1 -0.3 0.1 -0.1 0.4 0.3
TABLE 16 : Harmonised index of consumer prices (national index if not available), (percentage change on preceding year, 1992-2008)5-year averages 2006 2007 2008
1992-96 1997-01 2002-06 2002 2003 2004 2005 X-2006 IV-2007 X-2006 IV-2007 X-2006 IV-2007 Belgium 2.2 1.7 2.0 1.6 1.5 1.9 2.5 2.4 2.3 1.8 1.8 1.7 1.8 Germany 2.7 1.2 1.6 1.4 1.0 1.8 1.9 1.8 1.8 2.2 1.9 1.2 1.7 Ireland 2.2 3.0 3.2 4.7 4.0 2.3 2.2 2.9 2.7 2.7 2.6 2.2 2.2 Greece 11.8 3.7 3.4 3.9 3.4 3.0 3.5 3.3 3.3 3.3 3.2 3.3 3.1 Spain 4.7 2.4 3.3 3.6 3.1 3.1 3.4 3.6 3.6 2.8 2.4 2.7 2.6 France 2.0 1.2 2.1 1.9 2.2 2.3 1.9 2.0 1.9 1.8 1.5 1.9 1.7 Italy 4.6 2.1 2.4 2.6 2.8 2.3 2.2 2.3 2.2 2.0 1.9 1.9 2.0 Luxembourg 2.5 1.9 2.9 2.1 2.5 3.2 3.8 3.2 3.0 2.2 2.4 1.8 2.7 Netherlands 2.5 2.6 2.1 3.9 2.2 1.4 1.5 1.6 1.7 1.8 1.5 2.3 2.1 Austria 2.9 1.3 1.7 1.7 1.3 2.0 2.1 1.8 1.7 1.8 1.8 1.7 1.7 Portugal 5.6 2.7 2.9 3.7 3.3 2.5 2.1 2.9 3.0 2.2 2.3 2.1 2.3 Slovenia : 8.0 4.3 7.5 5.7 3.7 2.5 2.5 2.5 2.5 2.6 2.6 2.7 Finland 1.6 1.9 1.1 2.0 1.3 0.1 0.8 1.3 1.3 1.5 1.5 1.6 1.7 Euro area : 1.7 2.2 2.3 2.1 2.1 2.2 2.2 2.2 2.1 1.9 1.9 1.9 Bulgaria : : 5.5 5.8 2.3 6.1 6.0 7.0 7.4 3.5 4.2 3.8 4.3 Czech Republic : 5.6 1.5 1.4 -0.1 2.6 1.6 2.5 2.1 2.7 2.4 2.9 2.9 Denmark 1.9 2.1 1.8 2.4 2.0 0.9 1.7 2.0 1.9 2.0 1.9 1.9 2.2 Estonia : 6.1 3.3 3.6 1.4 3.0 4.1 4.4 4.4 4.2 5.1 4.6 5.3 Cyprus : 2.7 2.6 2.8 4.0 1.9 2.0 2.4 2.2 2.0 1.3 2.4 2.0 Latvia : 3.9 4.9 2.0 2.9 6.2 6.9 6.7 6.6 5.8 7.2 5.4 6.2 Lithuania : 3.9 1.4 0.3 -1.1 1.2 2.7 3.8 3.8 4.6 4.7 3.3 4.4 Hungary : 12.3 4.8 5.2 4.7 6.8 3.5 3.9 4.0 6.8 7.5 3.9 3.8 Malta : 3.1 2.5 2.6 1.9 2.7 2.5 3.0 2.6 2.6 1.4 2.4 2.1 Poland : 9.8 1.9 1.9 0.7 3.6 2.2 1.4 1.3 2.5 2.0 2.8 2.5 Romania : 63.2 12.9 22.5 15.3 11.9 9.1 6.8 6.6 5.1 4.6 4.6 4.5 Slovakia : 8.5 5.3 3.5 8.4 7.5 2.8 4.5 4.3 3.4 1.7 2.5 2.4 Sweden 2.4 1.5 1.5 1.9 2.3 1.0 0.8 1.5 1.5 1.6 1.2 1.8 1.9 United Kingdom 2.7 1.3 1.7 1.3 1.4 1.3 2.1 2.4 2.3 2.2 2.3 2.0 2.0 EU27 : 4.3 2.3 2.5 2.1 2.3 2.3 2.3 2.3 2.3 2.2 2.0 2.1 USA 2.9 2.5 2.6 1.6 2.3 2.7 3.4 3.4 3.2 2.5 2.3 1.9 1.9 Japan 0.8 0.1 -0.3 -0.9 -0.3 0.0 -0.3 0.3 0.2 0.4 0.0 0.7 0.4

- 135 -
TABLE 17 : Profiles of quarterly harmonised index of consumer prices (percentage change on corresponding quarter in previous year, 200623.04.2007
2006/1 2006/2 2006/3 2006/4 2007/1 2007/2 2007/3 2007/4 2008/1 2008/2 2008/3 2008/4 Belgium 2.6 2.6 2.2 1.9 1.8 1.5 1.8 2.1 1.9 1.9 1.8 1.8 Germany 2.1 2.1 1.6 1.3 1.9 1.8 1.9 2.2 1.9 1.7 1.7 1.8 Ireland 2.7 2.9 2.8 2.5 2.8 2.6 2.6 2.6 2.2 2.2 2.2 2.2 Greece 3.2 3.4 3.5 3.2 3.0 3.2 3.2 3.1 3.2 3.2 3.1 3.0 Spain 4.1 4.0 3.6 2.6 2.4 2.3 2.3 2.4 2.7 2.7 2.5 2.3 France 2.0 2.2 1.9 1.5 1.3 1.5 1.6 1.8 1.9 1.5 1.4 2.0 Italy 2.2 2.3 2.3 2.0 2.0 1.9 1.9 1.9 1.9 1.9 2.0 2.1 Luxembourg 3.9 3.7 2.8 1.5 2.2 2.3 2.0 3.3 3.1 2.7 2.6 2.5 Netherlands 1.6 1.8 1.7 1.6 1.5 1.5 1.5 1.6 1.8 1.9 2.3 2.5 Austria 1.4 2.0 1.8 1.4 1.8 1.9 1.8 1.7 1.7 1.7 1.7 1.8 Portugal 3.2 3.6 2.9 2.5 2.4 2.2 2.1 2.5 2.8 1.9 2.3 2.1 Slovenia 2.3 3.1 2.5 2.3 2.6 2.5 2.7 2.7 2.8 2.8 2.7 2.7 Finland 0.9 1.5 1.4 1.3 1.4 1.5 1.6 1.6 1.7 1.7 1.7 1.7 Euro area 2.3 2.4 2.2 1.8 1.9 1.8 1.9 2.1 2.1 1.9 1.9 2.0 Bulgaria 8.7 8.6 6.7 5.7 5.3 3.7 4.0 3.9 3.6 4.3 4.6 4.6 Czech Republic 2.4 2.5 2.4 1.1 2.0 1.9 2.3 3.2 2.7 2.8 2.9 3.1 Denmark 2.0 2.0 1.8 1.6 1.9 1.6 1.9 2.2 2.3 1.9 2.2 2.4 Estonia 4.4 4.4 4.4 4.5 5.1 4.9 4.7 5.4 5.9 5.6 5.2 4.5 Cyprus 2.3 2.6 2.6 1.5 1.3 1.1 1.4 1.5 1.5 2.0 2.2 2.1 Latvia 7.0 6.5 6.6 6.2 7.6 7.4 6.8 7.0 6.7 6.3 6.2 5.6 Lithuania 3.3 3.6 4.0 4.2 4.4 4.6 4.8 4.9 4.7 4.3 4.3 4.5 Hungary 2.4 2.7 4.6 6.4 8.5 9.1 7.2 5.3 4.3 3.8 3.6 3.5 Malta 2.6 3.4 3.2 1.1 0.8 0.8 1.7 2.1 2.3 2.2 1.8 2.2 Poland 0.9 1.4 1.5 1.3 2.0 2.0 1.9 2.3 2.5 2.2 2.6 2.7 Romania 8.7 7.2 5.9 4.8 3.9 5.0 4.8 4.6 4.7 4.5 4.4 4.3 Slovakia 4.2 4.6 4.8 3.5 2.1 1.7 1.6 1.6 2.0 2.5 2.5 2.6 Sweden 1.2 1.9 1.5 1.4 1.5 0.9 1.1 1.2 1.5 1.9 2.1 2.2 United Kingdom 1.9 2.2 2.4 2.8 2.9 2.3 2.1 2.1 2.1 2.1 2.0 2.0 EU27 2.3 2.4 2.3 2.0 2.1 2.0 2.0 2.1 2.1 2.0 2.0 2.1 USA 3.7 3.9 3.4 2.0 2.4 2.0 1.8 2.9 2.4 2.0 1.7 1.6 Japan -0.1 0.2 0.6 0.3 -0.1 -0.1 -0.1 0.4 0.7 0.6 0.2 0.3
TABLE 18 : Price deflator of exports of goods in national currency (percentage change on preceding year, 1992-2008)5-year averages 2006 2007 2008
1992-96 1997-01 2002-06 2002 2003 2004 2005 X-2006 IV-2007 X-2006 IV-2007 X-2006 IV-2007 Belgium 0.0 3.2 1.5 -0.9 -2.9 2.1 4.7 4.6 4.6 1.7 0.5 1.2 1.2 Germany 0.4 0.5 0.0 -0.9 -1.0 -0.2 0.7 2.2 1.4 1.1 0.9 0.4 0.3 Ireland 1.1 3.3 -2.2 -1.5 -8.8 -2.4 1.3 2.3 0.8 1.5 2.4 1.7 1.5 Greece 7.5 4.0 3.1 2.0 0.3 2.8 5.2 5.5 5.5 2.4 2.4 2.4 2.4 Spain 3.5 2.1 1.6 -0.9 -1.3 1.3 5.0 3.9 4.2 2.5 2.9 2.7 2.7 France -0.8 0.0 -0.3 -2.5 -2.5 0.8 1.4 1.7 1.5 1.5 1.0 1.3 1.5 Italy 5.0 4.3 4.0 2.6 0.7 4.5 6.3 5.1 6.1 2.5 3.9 2.4 3.1 Luxembourg -0.2 0.5 2.4 -1.3 -0.8 5.9 4.0 4.0 4.2 3.0 2.5 2.5 2.0 Netherlands -0.6 0.9 0.5 -3.2 -1.6 0.3 3.4 5.1 3.8 1.3 -0.3 1.6 0.2 Austria 0.3 0.6 1.0 -0.5 -0.6 0.9 3.2 2.5 2.3 1.5 1.2 1.3 0.9 Portugal 0.7 1.9 0.7 -0.8 -2.5 0.5 2.1 3.6 4.2 1.9 1.7 1.7 1.6 Slovenia 39.9 5.3 3.2 3.7 2.0 2.6 2.7 2.4 5.2 1.1 1.9 1.0 1.9 Finland 3.7 -1.6 -0.4 -3.4 -2.0 -0.6 1.1 2.0 3.2 -0.8 0.7 -1.0 0.0 Euro area 1.3 1.4 0.7 -1.0 -1.6 0.9 2.6 3.2 2.9 1.5 1.3 1.2 1.1 Bulgaria : : 4.3 -4.9 -0.6 6.5 7.5 9.0 14.1 3.5 3.0 3.5 3.5 Czech Republic : 2.0 -1.6 -6.7 0.0 2.1 -2.8 -2.4 -0.5 0.2 1.1 0.7 1.2 Denmark 0.2 1.3 1.6 -0.4 -0.7 1.4 5.4 5.3 2.7 1.6 1.8 1.5 1.8 Estonia : 4.7 1.2 -4.0 0.9 -1.5 1.8 4.1 9.2 3.7 5.2 3.9 4.6 Cyprus : 3.6 0.1 -4.3 -3.6 2.3 2.5 5.0 3.6 2.5 2.0 2.5 2.1 Latvia : -0.2 8.8 2.8 7.9 13.6 10.1 5.1 9.6 3.7 4.5 1.9 3.0 Lithuania : 0.8 3.0 -6.3 -0.9 7.7 13.1 8.0 2.2 4.0 3.8 3.9 3.5 Hungary : 8.6 -0.4 -5.0 -0.4 -1.6 -0.8 9.2 6.3 5.2 -3.5 2.3 0.9 Malta : 1.4 0.2 3.1 -3.5 -6.4 0.1 5.0 8.4 3.5 1.8 2.5 1.7 Poland 21.1 6.5 3.9 4.8 5.9 9.4 -2.7 0.1 2.4 1.1 2.1 1.8 2.0 Romania 115.2 49.7 10.1 17.6 18.3 13.3 -2.7 6.4 5.2 5.8 4.6 6.9 4.5 Slovakia : 5.0 1.0 1.9 1.7 1.4 -2.1 1.4 2.5 3.6 -3.4 0.2 2.3 Sweden 2.1 0.0 0.1 -2.3 -2.3 -0.8 2.9 3.1 3.1 1.0 0.7 0.9 -0.6 United Kingdom 3.1 -2.7 0.5 -0.2 1.2 -0.2 1.5 2.4 0.2 2.3 0.0 1.4 1.5 EU27 : : 0.8 -0.9 -1.0 1.0 2.3 3.1 2.8 1.7 1.5 1.3 1.2 USA -0.3 -1.4 2.3 -0.6 2.0 3.7 3.1 3.2 3.3 2.8 2.5 2.1 2.0 Japan : -1.9 -0.2 -1.2 -3.6 -1.3 1.4 5.5 4.0 2.7 4.6 2.0 2.0
- 136 -
TABLE 19 : Price deflator of imports of goods in national currency (percentage change on preceding year, 1992-2008) 23.04.2007
5-year averages 2006 2007 20081992-96 1997-01 2002-06 2002 2003 2004 2005 X-2006 IV-2007 X-2006 IV-2007 X-2006 IV-2007
Belgium 0.2 3.9 1.6 -1.8 -2.3 2.8 4.9 5.2 4.5 1.6 0.3 1.0 1.1 Germany -1.2 1.2 -0.1 -3.4 -3.0 0.0 2.5 4.4 3.7 1.9 -0.3 1.7 0.6 Ireland 1.7 3.4 -2.2 -3.8 -8.4 -2.3 0.8 3.6 3.0 1.7 1.9 1.8 2.1 Greece 7.2 4.1 2.2 0.3 1.3 0.9 2.9 5.6 5.6 1.3 0.9 1.3 1.3 Spain 2.9 2.1 1.1 -3.0 -1.6 2.3 4.0 4.3 4.0 2.5 2.3 2.6 2.5 France -1.0 0.2 0.2 -4.2 -2.3 1.3 3.3 3.2 3.0 1.1 0.7 1.4 1.2 Italy 5.2 4.3 4.8 0.2 -0.4 5.0 9.0 8.6 10.5 1.4 2.7 1.3 3.0 Luxembourg 0.4 1.9 1.8 -2.6 -1.1 4.5 3.9 4.0 4.8 2.5 0.5 2.0 1.5 Netherlands -1.0 0.2 0.1 -4.6 -2.4 0.6 3.3 5.4 4.0 1.2 -0.8 1.5 0.0 Austria 0.4 0.7 0.9 -1.9 -1.4 1.0 3.5 3.4 3.4 1.5 1.3 1.1 1.1 Portugal 0.6 1.7 1.2 -2.3 -2.1 2.1 3.9 4.8 4.5 1.7 0.5 1.2 1.5 Slovenia 36.0 5.5 3.4 1.7 1.5 3.9 5.2 3.5 4.9 1.5 1.6 1.3 1.8 Finland 3.2 -1.0 2.0 -4.2 -0.4 2.2 5.7 4.4 7.3 1.0 1.2 0.8 1.4 Euro area 0.8 1.7 1.0 -2.9 -2.2 1.5 4.0 4.8 4.7 1.6 0.7 1.6 1.3 Bulgaria : : 3.6 -3.2 -3.2 5.9 10.0 6.0 9.0 1.5 1.3 1.5 1.7 Czech Republic : 1.9 -1.7 -8.6 -0.3 1.4 -1.0 -0.7 0.3 0.5 1.1 0.6 1.0 Denmark -0.7 0.2 0.9 -1.5 -1.3 0.7 3.8 4.4 2.8 1.5 1.0 1.0 0.9 Estonia : 2.6 2.4 -0.2 -0.9 1.8 4.1 5.6 7.6 4.2 1.9 4.5 1.5 Cyprus : 2.3 2.7 0.3 -0.9 4.0 6.4 7.3 3.8 3.0 1.2 3.0 1.4 Latvia : 2.2 8.6 6.0 6.9 8.2 12.3 8.5 9.7 4.5 4.0 2.5 2.0 Lithuania : -1.5 1.4 -4.7 -3.4 -0.5 9.0 6.9 7.4 1.5 2.0 1.0 2.4 Hungary : 9.1 0.5 -5.4 0.1 -0.9 1.4 11.3 7.9 5.6 -3.4 2.5 1.0 Malta : 2.6 1.6 2.5 -5.7 -3.3 3.1 4.6 12.2 3.0 1.0 2.8 2.1 Poland 19.3 7.7 3.4 5.2 9.1 4.9 -3.4 1.0 1.9 2.0 1.8 2.2 1.5 Romania 125.4 41.2 6.4 15.8 15.4 8.7 -5.3 3.2 -0.9 3.7 -2.0 6.0 -1.6 Slovakia : 4.6 1.3 0.9 0.9 2.4 -2.0 1.6 4.2 3.1 -3.9 0.8 3.1 Sweden 2.7 1.6 1.3 -0.5 -2.8 0.7 5.2 4.0 4.2 1.1 -1.0 1.0 -0.6 United Kingdom 3.4 -2.8 0.4 -2.8 -0.7 -0.6 3.7 3.1 2.4 2.2 1.3 1.4 1.3 EU27 : : 1.0 -2.6 -1.5 1.3 3.6 4.4 4.4 1.8 1.0 1.6 1.3 USA -0.2 -1.7 3.4 -1.8 2.9 5.0 6.5 4.6 4.5 2.1 1.1 1.9 2.8 Japan : -0.7 5.1 -1.6 -1.7 2.6 10.3 10.5 17.3 4.0 4.0 2.5 2.5
TABLE 20 : Terms of trade of goods (percentage change on preceding year, 1992-2008)5-year averages 2006 2007 2008
1992-96 1997-01 2002-06 2002 2003 2004 2005 X-2006 IV-2007 X-2006 IV-2007 X-2006 IV-2007 Belgium -0.2 -0.7 -0.1 1.0 -0.6 -0.7 -0.2 -0.6 0.0 0.1 0.2 0.2 0.1 Germany 1.6 -0.7 0.1 2.5 2.0 -0.2 -1.7 -2.1 -2.2 -0.9 1.2 -1.3 -0.4 Ireland -0.5 -0.2 0.0 2.4 -0.5 -0.2 0.4 -1.3 -2.1 -0.2 0.6 -0.1 -0.5 Greece 0.3 -0.1 0.9 1.7 -1.0 1.9 2.2 -0.1 -0.1 1.1 1.5 1.1 1.1 Spain 0.6 0.0 0.5 2.2 0.2 -1.0 1.0 -0.4 0.2 0.0 0.6 0.1 0.1 France 0.1 -0.2 -0.5 1.9 -0.2 -0.5 -1.8 -1.4 -1.5 0.4 0.3 -0.1 0.3 Italy -0.1 0.0 -0.7 2.5 1.1 -0.5 -2.5 -3.2 -3.9 1.1 1.2 1.1 0.1 Luxembourg -0.6 -1.4 0.5 1.3 0.3 1.3 0.1 0.0 -0.5 0.5 2.0 0.5 0.5 Netherlands 0.5 0.7 0.4 1.5 0.8 -0.3 0.1 -0.3 -0.2 0.1 0.5 0.1 0.2 Austria -0.1 -0.1 0.2 1.4 0.8 -0.1 -0.3 -0.9 -1.0 0.0 -0.1 0.2 -0.2 Portugal 0.1 0.2 -0.5 1.5 -0.3 -1.6 -1.6 -1.1 -0.3 0.2 1.2 0.5 0.1 Slovenia 2.9 -0.2 -0.2 2.0 0.5 -1.2 -2.4 -1.1 0.2 -0.4 0.3 -0.3 0.1 Finland 0.5 -0.6 -2.3 0.8 -1.5 -2.8 -4.3 -2.3 -3.8 -1.8 -0.5 -1.8 -1.4 Euro area 0.5 -0.3 -0.2 1.9 0.6 -0.6 -1.3 -1.6 -1.7 -0.1 0.6 -0.3 -0.2 Bulgaria : : 0.7 -1.8 2.6 0.6 -2.2 2.8 4.7 2.0 1.7 2.0 1.8 Czech Republic : 0.1 0.1 2.1 0.3 0.7 -1.8 -1.7 -0.8 -0.3 0.0 0.1 0.2 Denmark 1.0 1.0 0.7 1.1 0.6 0.7 1.6 0.8 -0.2 0.2 0.8 0.4 0.9 Estonia : 2.0 -1.2 -3.7 1.9 -3.2 -2.2 -1.4 1.5 -0.5 3.2 -0.6 3.1 Cyprus : 1.3 -2.6 -4.6 -2.7 -1.6 -3.7 -2.2 -0.2 -0.5 0.8 -0.5 0.7 Latvia : -2.3 0.2 -3.0 1.0 5.0 -2.0 -3.1 0.0 -0.7 0.5 -0.6 1.0 Lithuania : 2.3 1.5 -1.6 2.6 8.3 3.7 1.0 -4.8 2.5 1.8 2.9 1.1 Hungary : -0.4 -0.9 0.4 -0.5 -0.7 -2.2 -1.9 -1.5 -0.4 0.0 -0.2 -0.2 Malta : -1.2 -1.3 0.6 2.4 -3.2 -2.9 0.4 -3.4 0.5 0.8 -0.3 -0.4 Poland 1.5 -1.1 0.4 -0.4 -2.9 4.3 0.7 -0.9 0.5 -0.9 0.3 -0.4 0.5 Romania -4.5 6.0 3.5 1.6 2.5 4.3 2.8 3.1 6.2 2.0 6.7 0.8 6.2 Slovakia : 0.4 -0.2 0.9 0.7 -1.0 -0.1 -0.2 -1.7 0.5 0.5 -0.6 -0.8 Sweden -0.6 -1.6 -1.2 -1.8 0.5 -1.4 -2.1 -0.8 -1.0 0.0 1.7 -0.1 -0.1 United Kingdom -0.3 0.1 0.1 2.8 1.9 0.4 -2.2 -0.6 -2.1 0.1 -1.3 -0.1 0.2 EU27 : : -0.2 1.7 0.5 -0.3 -1.3 -1.3 -1.5 -0.1 0.4 -0.2 0.0 USA -0.1 0.4 -1.1 1.1 -0.9 -1.2 -3.2 -1.3 -1.1 0.6 1.4 0.2 -0.7 Japan : -1.2 -5.0 0.4 -1.9 -3.9 -8.1 -4.5 -11.3 -1.3 0.6 -0.5 -0.5

- 137 -
TABLE 21 : Compensation of employees per head (percentage change on preceding year, 1992-2008) 23.04.2007
5-year averages 2006 2007 20081992-96 1997-01 2002-06 2002 2003 2004 2005 X-2006 IV-2007 X-2006 IV-2007 X-2006 IV-2007
Belgium 3.4 2.8 2.5 3.8 1.6 2.0 2.4 2.5 2.7 2.1 2.5 2.2 2.5 Germany 5.4 2.3 1.5 1.9 2.5 1.5 0.5 0.4 1.1 0.5 1.6 1.5 2.4 Ireland 4.5 5.9 5.4 5.5 5.0 6.6 5.0 4.8 4.9 4.5 4.6 4.5 4.5 Greece 10.8 7.4 6.5 10.0 4.6 5.8 6.5 5.9 5.9 5.0 5.3 5.0 5.0 Spain 6.0 2.5 3.2 3.3 3.6 3.1 2.6 3.1 3.4 2.9 3.2 2.9 2.7 France 2.8 2.1 3.1 3.0 2.9 3.3 2.8 3.3 3.2 3.0 3.2 3.1 3.0 Italy 4.8 2.1 3.1 2.7 3.7 3.3 3.1 3.0 2.5 2.8 2.5 2.5 3.3 Luxembourg 3.9 3.2 3.1 3.6 1.9 4.2 3.7 3.7 2.3 3.5 3.0 3.5 2.8 Netherlands 2.9 4.1 3.1 5.2 4.2 3.8 1.5 1.5 1.0 3.1 3.4 3.3 3.8 Austria 3.9 1.9 2.0 2.1 2.0 1.7 1.6 2.8 2.3 2.2 2.4 2.1 2.5 Portugal 8.2 5.6 2.9 4.0 2.8 2.6 2.9 2.9 2.4 2.8 2.7 2.8 2.8 Slovenia : 10.6 6.6 8.5 6.6 7.6 5.4 5.4 4.8 5.8 5.2 5.8 5.5 Finland 2.5 3.3 3.1 1.8 2.8 3.6 3.8 3.0 3.4 2.6 2.6 3.2 3.6 Euro area : 2.4 2.4 2.8 2.8 2.5 1.9 2.1 2.2 2.2 2.4 2.5 2.8 Bulgaria : 73.8 5.9 5.9 5.1 4.9 5.9 10.2 7.8 9.8 9.0 10.3 9.5 Czech Republic : 7.8 6.1 7.7 8.6 5.8 4.3 5.6 4.1 6.2 3.9 5.7 3.8 Denmark 3.1 3.8 3.5 3.8 4.0 2.7 3.3 3.7 3.8 4.2 4.5 2.9 4.3 Estonia : 14.0 11.7 9.1 13.5 12.6 11.5 12.7 11.8 11.5 14.3 11.3 12.5 Cyprus : 4.6 3.9 4.9 7.4 2.0 1.6 3.5 3.5 3.5 3.5 3.5 3.5 Latvia : 7.3 15.1 4.0 11.3 14.3 25.5 18.2 21.7 15.0 18.0 12.0 15.0 Lithuania : 9.1 9.3 5.0 8.9 10.9 8.5 14.7 13.4 14.1 15.1 13.1 11.0 Hungary : 14.2 9.4 12.8 9.9 11.4 6.2 6.5 6.7 6.7 7.1 3.8 5.0 Malta 7.8 4.6 2.3 2.8 3.9 2.5 1.1 1.9 1.2 2.0 1.6 2.1 1.9 Poland 37.8 13.8 2.0 2.2 1.7 1.8 2.1 4.0 2.0 5.0 5.1 4.9 3.9 Romania 117.4 69.6 20.6 25.9 22.7 17.8 19.3 16.2 17.8 13.9 16.7 12.5 14.0 Slovakia : 10.7 7.9 9.3 8.1 9.2 5.1 7.8 7.7 7.2 7.4 6.3 6.9 Sweden 4.8 4.1 2.9 2.9 3.0 3.7 3.2 3.5 1.5 3.8 4.1 4.0 4.4 United Kingdom 3.6 5.1 4.2 3.3 4.9 4.3 4.6 4.9 4.2 4.4 4.4 4.6 4.4 EU27 : 4.0 2.9 3.3 3.3 2.9 2.5 2.8 2.4 3.0 3.1 3.2 3.3 USA 3.0 4.2 4.0 3.6 4.3 4.2 3.7 5.8 4.3 5.0 4.1 5.2 5.3 Japan 1.1 0.0 -0.7 -1.6 -1.4 -1.3 0.2 0.8 0.7 1.2 1.3 1.4 1.7
TABLE 22 : Real compensation of employees per head ¹ (percentage change on preceding year, 1992-2008)5-year averages 2006 2007 2008
1992-96 1997-01 2002-06 2002 2003 2004 2005 X-2006 IV-2007 X-2006 IV-2007 X-2006 IV-2007 Belgium 1.6 1.0 0.4 2.5 0.0 -0.5 -0.5 0.1 0.5 0.3 0.7 0.5 0.7 Germany 2.8 1.3 0.1 0.7 1.0 -0.1 -0.8 -1.1 -0.2 -1.4 0.0 0.6 1.2 Ireland 1.6 1.0 2.5 0.5 1.3 5.1 3.8 2.4 2.2 2.2 1.9 2.5 2.1 Greece -0.7 2.9 3.4 7.3 1.7 3.2 2.7 2.3 2.4 1.9 2.2 1.9 1.9 Spain 1.0 -0.3 -0.1 0.5 0.5 -0.4 -0.8 -0.5 -0.2 0.1 0.6 0.1 0.3 France 1.1 1.2 1.4 2.1 1.0 1.4 0.8 1.6 2.0 1.3 1.8 1.2 1.2 Italy -0.3 -0.3 0.4 -0.1 0.9 0.7 0.7 0.4 -0.2 0.6 0.5 0.5 1.2 Luxembourg 1.0 0.9 0.7 3.3 -0.5 1.6 0.0 0.9 -0.9 1.5 0.7 1.7 0.3 Netherlands 0.6 1.2 1.2 2.1 1.8 3.0 -0.1 -0.5 -0.9 0.9 1.9 0.9 1.8 Austria 1.1 0.5 0.4 0.9 0.4 -0.2 -0.1 1.1 0.9 0.6 0.9 0.5 1.0 Portugal 2.3 2.7 0.0 1.0 -0.2 0.0 0.4 -0.1 -0.9 0.5 0.4 0.7 0.5 Slovenia : 2.9 2.2 0.6 1.2 4.2 3.1 3.0 2.3 3.3 2.6 3.1 2.9 Finland 0.6 0.8 2.1 -0.4 3.2 2.6 3.6 1.8 1.4 1.0 0.9 1.6 1.9 Euro area : 0.6 0.4 0.9 0.7 0.4 -0.1 0.0 0.1 0.1 0.6 0.7 1.0 Bulgaria : 2.2 2.0 1.7 4.8 0.5 0.7 3.5 2.5 6.6 5.6 6.5 5.8 Czech Republic : 2.4 4.5 6.4 9.0 2.7 2.6 3.1 1.8 3.5 1.5 2.9 1.1 Denmark 1.4 1.7 1.7 2.0 2.7 1.2 1.1 1.7 1.7 2.2 2.5 1.0 2.1 Estonia : 7.1 9.1 6.0 12.5 10.6 8.4 8.0 8.4 7.0 9.5 6.4 7.4 Cyprus : 2.2 1.1 2.4 3.3 0.1 -1.1 0.3 0.9 1.0 1.6 1.0 1.1 Latvia : 3.1 8.8 1.8 8.0 6.8 15.5 10.7 12.4 8.7 9.3 6.2 8.0 Lithuania : 6.0 8.3 5.1 9.9 11.2 4.6 10.5 10.8 9.0 10.9 9.5 7.2 Hungary : 2.1 5.3 8.5 5.7 6.6 2.5 2.5 3.5 -0.1 -0.4 -0.1 1.0 Malta : 2.9 0.4 0.7 3.3 0.1 -1.4 -1.2 -0.8 -0.8 0.2 -0.3 -0.2 Poland 4.7 4.4 0.0 -1.0 1.3 -1.1 -0.1 2.6 1.1 2.6 3.1 2.1 1.4 Romania 0.0 5.7 7.3 3.7 6.5 3.4 11.4 10.1 12.1 8.5 11.9 7.7 9.8 Slovakia : 3.5 2.7 5.8 1.3 1.7 2.5 3.2 2.4 3.7 4.5 3.7 3.5 Sweden 1.3 2.7 1.5 1.1 1.2 2.9 1.9 2.2 0.3 1.8 3.1 2.3 2.6 United Kingdom 0.2 3.0 2.2 1.7 2.9 2.6 2.1 2.4 1.8 2.2 2.0 2.5 2.3 EU27 : 1.4 0.7 1.3 1.2 0.7 0.3 0.6 0.1 0.8 0.8 1.2 1.3 USA 0.7 2.4 1.6 2.1 2.3 1.5 0.8 2.7 1.5 2.6 2.1 3.3 3.3 Japan 0.9 0.3 0.2 -0.1 -0.5 -0.6 1.0 0.9 1.0 1.1 1.4 1.0 1.4
¹ Deflated by the price deflator of private consumption.

- 138 -
TABLE 23 : Labour productivity (real GDP per occupied person) (percentage change on preceding year, 1992-2008) 23.04.2007
5-year averages 2006 2007 20081992-96 1997-01 2002-06 2002 2003 2004 2005 X-2006 IV-2007 X-2006 IV-2007 X-2006 IV-2007
Belgium 1.3 1.3 1.4 1.6 1.0 2.3 0.1 1.8 2.0 1.3 1.2 1.3 1.3 Germany 2.8 2.0 1.6 1.1 1.5 1.7 1.5 2.0 2.3 0.7 1.7 1.3 1.8 Ireland 3.3 4.1 2.0 4.2 2.3 1.2 0.9 0.9 1.5 2.2 1.5 2.8 1.8 Greece 0.1 3.4 2.8 3.7 3.4 1.7 2.3 2.3 2.7 2.3 2.2 2.4 2.4 Spain 1.8 0.2 0.5 0.4 0.6 0.6 0.4 0.5 0.8 0.4 0.9 0.8 0.9 France 1.6 1.2 1.1 0.1 1.1 2.3 0.9 1.4 1.1 1.3 1.5 1.3 1.4 Italy 2.1 1.0 0.0 -0.9 -0.6 0.8 0.3 0.4 0.2 0.9 1.0 0.9 0.9 Luxembourg 0.1 1.5 1.0 0.9 -0.5 1.3 1.0 1.7 2.4 0.7 1.4 0.6 1.5 Netherlands 1.3 1.4 1.8 0.3 1.4 3.4 1.8 1.3 1.8 1.5 1.7 1.8 1.5 Austria 2.2 1.6 1.4 1.1 0.9 2.1 0.7 2.4 2.0 1.9 1.7 1.4 1.8 Portugal 2.4 1.8 0.4 0.3 -0.4 1.2 0.5 0.6 0.5 0.9 1.1 1.0 1.2 Slovenia : 4.1 3.3 1.9 3.1 3.9 3.7 4.0 4.0 3.8 3.6 3.9 3.4 Finland 3.7 2.2 2.2 0.7 1.7 3.3 1.5 3.4 4.0 2.5 2.0 2.4 2.0 Euro area : 1.1 0.7 0.2 0.4 1.2 0.6 1.2 1.3 0.9 1.2 1.2 1.2 Bulgaria -1.2 2.4 3.7 5.3 2.0 3.9 3.5 4.7 3.6 4.9 4.6 5.4 4.9 Czech Republic : 2.1 3.9 1.3 5.0 4.1 4.4 5.1 4.7 4.4 3.9 4.2 4.2 Denmark 2.4 1.5 1.6 0.5 1.7 2.1 2.4 1.8 1.2 2.1 1.9 2.1 2.1 Estonia : 8.2 6.9 6.3 6.2 8.0 8.6 7.5 5.4 7.4 7.4 7.2 7.2 Cyprus : 2.7 0.2 -0.1 -1.9 0.4 0.3 2.3 2.3 2.4 2.3 2.5 2.4 Latvia -1.5 5.9 6.7 4.8 5.4 7.5 8.7 8.2 7.0 7.8 8.1 7.2 6.9 Lithuania -5.9 7.2 5.8 3.2 7.9 7.3 5.0 5.8 5.7 6.4 6.6 6.3 6.2 Hungary : 3.2 4.0 4.4 3.3 5.4 3.8 3.8 3.0 2.6 2.7 2.6 2.8 Malta 3.5 2.7 0.5 1.4 -3.3 1.2 1.2 1.3 2.0 1.2 2.1 1.3 1.8 Poland : 5.5 3.5 4.5 5.1 4.0 1.2 1.8 2.6 3.5 3.6 4.0 3.5 Romania 4.3 0.9 6.1 8.1 5.5 8.0 3.9 7.0 4.8 5.5 5.4 5.5 5.3 Slovakia : 3.9 4.6 4.7 2.3 5.8 4.6 4.0 5.8 5.6 6.7 4.8 5.5 Sweden 3.2 1.8 2.7 1.8 2.0 4.7 2.5 2.4 2.4 1.9 1.6 2.1 2.3 United Kingdom 2.5 1.9 1.6 1.3 1.7 2.2 1.0 1.8 1.9 1.8 2.0 1.9 1.8 EU27 : 1.8 1.1 0.9 0.9 1.7 0.8 1.4 1.4 1.4 1.5 1.6 1.5 USA 1.6 1.8 1.8 1.9 1.6 2.8 1.5 1.6 1.4 1.6 0.9 2.0 2.1 Japan 1.0 1.1 1.9 1.9 1.7 2.5 1.5 2.3 1.8 2.0 2.0 1.8 1.8
TABLE 24 : Unit labour costs, whole economy ¹ (percentage change on preceding year, 1992-2008)5-year averages 2006 2007 2008
1992-96 1997-01 2002-06 2002 2003 2004 2005 X-2006 IV-2007 X-2006 IV-2007 X-2006 IV-2007 Belgium 2.1 1.5 1.1 2.1 0.6 -0.3 2.3 0.7 0.7 0.8 1.3 0.9 1.2 Germany 2.5 0.3 -0.1 0.9 1.0 -0.2 -1.0 -1.6 -1.2 -0.1 -0.1 0.1 0.6 Ireland 1.2 1.8 3.3 1.2 2.7 5.4 4.1 3.9 3.3 2.2 3.0 1.7 2.6 Greece 10.7 3.9 3.7 6.0 1.2 4.0 4.1 3.5 3.1 2.6 3.0 2.5 2.5 Spain 4.1 2.3 2.6 2.9 3.0 2.5 2.2 2.5 2.7 2.5 2.3 2.0 1.8 France 1.1 0.8 1.9 2.9 1.8 1.0 1.9 1.9 2.1 1.7 1.6 1.8 1.6 Italy 2.7 1.1 3.1 3.7 4.3 2.4 2.8 2.6 2.3 1.9 1.6 1.6 2.3 Luxembourg 3.8 1.7 2.1 2.7 2.4 2.8 2.6 2.0 -0.2 2.7 1.6 2.9 1.3 Netherlands 1.6 2.7 1.3 4.8 2.7 0.3 -0.3 0.2 -0.8 1.5 1.6 1.4 2.2 Austria 1.7 0.2 0.6 1.0 1.1 -0.4 0.9 0.4 0.3 0.3 0.7 0.7 0.7 Portugal 5.7 3.8 2.5 3.7 3.2 1.4 2.4 2.3 1.8 1.9 1.6 1.8 1.7 Slovenia : 6.3 3.2 6.5 3.5 3.6 1.6 1.4 0.8 1.9 1.6 1.8 2.0 Finland -1.1 1.1 0.8 1.1 1.1 0.2 2.2 -0.4 -0.6 0.1 0.5 0.8 1.6 Euro area : 1.3 1.7 2.5 2.4 1.3 1.3 0.9 0.8 1.2 1.2 1.3 1.6 Bulgaria : 69.7 2.2 0.5 3.0 1.0 2.4 5.2 4.1 4.6 4.2 4.6 4.3 Czech Republic : 5.6 2.1 6.3 3.4 1.7 -0.1 0.4 -0.6 1.7 0.0 1.4 -0.4 Denmark 0.6 2.4 1.9 3.2 2.3 0.5 0.9 1.9 2.5 2.0 2.5 0.7 2.2 Estonia : 5.4 4.5 2.6 6.9 4.2 2.7 4.9 6.1 3.8 6.3 3.8 5.0 Cyprus : 1.9 3.7 5.1 9.5 1.6 1.3 1.2 1.2 1.1 1.2 1.0 1.1 Latvia : 1.3 7.9 -0.8 5.6 6.4 15.5 9.3 13.8 6.7 9.1 4.5 7.5 Lithuania : 1.8 3.3 1.7 0.9 3.3 3.4 8.4 7.3 7.2 8.0 6.4 4.5 Hungary : 10.6 5.2 8.0 6.4 5.7 2.3 2.6 3.7 3.9 4.3 1.2 2.1 Malta 4.1 1.9 1.8 1.4 7.4 1.2 -0.1 0.6 -0.7 0.7 -0.5 0.8 0.1 Poland : 7.9 -1.5 -2.2 -3.2 -2.1 0.9 2.1 -0.6 1.5 1.4 0.9 0.4 Romania 108.4 68.1 13.7 16.5 16.3 9.0 14.7 8.6 12.4 7.9 10.7 6.6 8.2 Slovakia : 6.5 3.1 4.4 5.6 3.2 0.5 3.7 1.7 1.5 0.6 1.4 1.3 Sweden 1.6 2.3 0.2 1.0 1.0 -1.0 0.7 1.1 -0.8 1.9 2.4 1.8 2.1 United Kingdom 1.1 3.2 2.6 2.0 3.1 2.0 3.6 3.0 2.2 2.5 2.4 2.6 2.6 EU27 : 2.2 1.7 2.3 2.4 1.2 1.7 1.4 1.0 1.6 1.5 1.6 1.8 USA 1.4 2.3 2.1 1.6 2.7 1.3 2.1 4.1 2.9 3.3 3.2 3.2 3.2 Japan 0.1 -1.1 -2.5 -3.3 -3.1 -3.7 -1.2 -1.5 -1.1 -0.8 -0.7 -0.3 -0.1
¹ Compensation of employees per head divided by labour productivity per head, defined as GDP in volume divided by total employment.

- 139 -
TABLE 25 : Real unit labour costs ¹ (percentage change on preceding year, 1992-2008) 23.04.2007
5-year averages 2006 2007 20081992-96 1997-01 2002-06 2002 2003 2004 2005 X-2006 IV-2007 X-2006 IV-2007 X-2006 IV-2007
Belgium -0.2 0.0 -0.8 0.3 -1.0 -2.6 0.3 -1.4 -1.0 -1.2 -0.9 -1.2 -0.8 Germany -0.2 -0.1 -0.9 -0.5 -0.1 -1.1 -1.6 -2.1 -1.5 -1.3 -1.9 -0.2 -0.3 Ireland -1.6 -2.6 0.2 -3.5 0.2 3.5 0.6 1.4 0.4 -0.8 0.0 -0.7 0.0 Greece -0.7 -0.6 0.1 2.1 -2.2 0.6 0.4 -0.1 -0.3 -0.6 -0.2 -0.8 -0.8 Spain -0.6 -0.7 -1.4 -1.4 -1.1 -1.5 -1.8 -1.4 -1.1 -0.7 -0.8 -1.1 -1.1 France -0.5 -0.2 0.0 0.5 -0.1 -0.6 0.0 -0.1 0.1 -0.1 -0.3 -0.1 -0.2 Italy -1.6 -1.2 0.4 0.3 1.2 -0.4 0.5 0.4 0.5 -0.3 -0.5 -0.7 0.1 Luxembourg 0.1 0.7 -1.8 -0.1 -2.4 1.1 -2.0 -2.1 -5.7 -0.8 -2.8 -0.2 -2.3 Netherlands -0.3 -0.4 -0.6 1.0 0.5 -0.4 -2.0 -1.4 -2.3 -0.5 0.0 -0.7 0.1 Austria -0.6 -0.7 -1.0 -0.4 -0.3 -2.1 -0.9 -1.0 -1.2 -1.4 -1.1 -1.2 -1.0 Portugal -0.6 0.3 -0.6 -0.2 0.1 -1.3 -0.4 0.1 -1.0 -0.2 -1.1 -0.5 -0.9 Slovenia : -0.8 -0.9 -1.3 -2.2 0.3 0.1 -0.2 -1.5 -1.3 -1.2 -0.7 -0.8 Finland -2.8 -1.3 0.2 -0.1 1.5 -0.4 2.0 -1.8 -1.9 -1.2 -1.2 -0.6 0.0 Euro area : -0.3 -0.4 -0.1 0.3 -0.6 -0.6 -1.0 -0.9 -0.7 -0.9 -0.5 -0.3 Bulgaria : -1.7 -2.1 -2.7 1.2 -4.0 -1.3 -1.4 -3.8 1.1 0.2 0.3 0.1 Czech Republic : -0.1 0.2 3.4 2.5 -1.8 -0.8 -0.9 -2.3 -0.7 -1.8 -1.0 -3.1 Denmark -0.8 0.3 -0.4 0.9 0.6 -1.4 -2.2 -1.3 0.2 -0.3 -0.4 -1.6 -0.6 Estonia : -1.4 0.3 -1.2 4.5 2.1 -3.8 0.4 -0.1 -0.5 -1.7 -1.3 -1.5 Cyprus : -1.1 0.8 3.9 4.2 -1.7 -1.1 -1.4 -1.4 -1.0 -1.0 -1.2 -1.2 Latvia : -2.9 0.8 -4.2 2.0 -0.6 4.8 0.6 2.4 -1.9 -1.9 -3.1 -1.6 Lithuania : -1.2 0.4 1.7 1.9 0.7 -2.3 3.2 0.2 0.6 2.8 1.0 0.0 Hungary : -0.8 0.6 0.1 0.7 1.3 0.3 -0.3 0.7 -0.8 -1.8 -2.1 -1.3 Malta 1.1 0.2 -0.9 -1.2 2.8 -0.2 -2.4 -2.5 -3.2 -2.1 -2.8 -1.9 -2.1 Poland : -0.4 -3.5 -4.4 -3.6 -6.0 -1.7 1.1 -2.0 -0.4 -0.9 -1.6 -2.1 Romania -3.1 3.6 -2.7 -5.6 -6.2 -5.2 2.2 -2.1 1.8 -0.4 0.8 0.8 0.1 Slovakia : 0.1 -1.0 -0.2 0.8 -2.7 -1.8 -0.5 -1.0 -1.9 -2.6 -0.6 -1.0 Sweden -0.8 0.9 -1.2 -0.6 -1.0 -1.1 -0.5 -0.6 -2.6 -0.5 0.0 -0.3 0.0 United Kingdom -1.7 0.9 -0.1 -1.1 0.0 -0.6 1.3 0.4 -0.2 0.0 -0.2 0.2 0.3 EU27 : -0.1 -0.6 -0.5 0.0 -1.0 -0.3 -0.7 -1.1 -0.6 -1.0 -0.4 -0.3 USA -0.7 0.6 -0.4 -0.1 0.5 -1.5 -0.9 0.9 -0.1 0.6 0.9 1.5 1.6 Japan 0.0 -0.4 -1.2 -1.8 -1.6 -2.7 0.0 -0.8 -0.2 -0.5 -0.8 -0.3 -0.4
¹ Nominal unit labour costs divided by GDP price deflator.
TABLE 26 : Total population (percentage change on preceding year, 1992-2008)5-year averages 2006 2007 2008
1992-96 1997-01 2002-06 2002 2003 2004 2005 X-2006 IV-2007 X-2006 IV-2007 X-2006 IV-2007 Belgium 0.3 0.2 0.5 0.5 0.4 0.4 0.5 0.2 0.4 0.2 0.2 0.2 0.2 Germany 0.5 0.1 0.0 0.2 0.0 0.0 0.0 0.0 -0.1 0.1 -0.1 0.0 -0.1 Ireland 0.6 1.3 2.0 1.7 1.6 1.7 2.2 2.5 2.5 2.2 2.2 1.7 1.7 Greece 0.9 0.4 0.3 0.3 0.3 0.4 0.2 0.3 0.3 0.3 0.3 0.3 0.3 Spain 0.2 0.6 1.5 1.5 1.7 1.6 1.7 1.2 1.2 1.0 1.0 0.7 0.7 France 0.4 0.5 0.6 0.7 0.7 0.6 0.6 0.6 0.6 0.6 0.6 0.5 0.5 Italy 0.0 0.0 0.6 0.3 0.8 1.0 0.7 0.3 0.3 0.2 0.2 0.2 0.2 Luxembourg 1.4 1.2 0.9 1.1 0.9 0.7 0.9 0.6 1.0 0.6 1.0 0.6 1.0 Netherlands 0.6 0.7 0.4 0.6 0.5 0.3 0.2 0.1 0.2 0.0 0.1 0.0 0.1 Austria 0.5 0.2 0.5 0.5 0.4 0.7 0.7 0.5 0.4 0.4 0.4 0.4 0.4 Portugal 0.2 0.5 0.6 0.7 0.7 0.6 0.5 0.6 0.4 0.6 0.4 0.6 0.4 Slovenia -0.1 0.0 0.1 0.2 0.1 0.0 0.2 0.2 0.2 0.2 0.2 0.2 0.2 Finland 0.4 0.2 0.3 0.3 0.2 0.3 0.3 0.2 0.4 0.2 0.2 0.1 0.1 Euro area 0.3 0.3 0.6 0.6 0.6 0.6 0.6 0.4 0.4 0.4 0.3 0.3 0.3 Bulgaria -0.6 -1.2 -0.5 -0.6 -0.6 -0.5 -0.5 -0.3 -0.5 -0.3 -0.5 -0.3 -0.5 Czech Republic 0.0 -0.2 0.1 -0.2 0.0 0.1 0.3 0.1 0.2 0.1 0.2 0.1 0.1 Denmark 0.4 0.4 0.3 0.4 0.3 0.2 0.3 0.1 0.3 0.1 0.3 0.0 0.2 Estonia -2.0 -0.8 -0.3 -0.4 -0.4 0.0 -0.6 -0.4 -0.2 -0.4 -0.2 -0.4 -0.2 Cyprus 2.1 1.2 2.0 1.3 1.8 2.4 2.4 2.0 2.0 2.0 2.0 2.0 2.0 Latvia -1.6 -0.8 -0.6 -0.7 -0.6 -0.5 -0.5 -0.6 -0.5 -0.5 -0.5 -0.5 -0.5 Lithuania -0.6 -0.7 -0.5 -0.3 -0.4 -0.5 -0.6 -0.4 -0.6 -0.2 -0.3 0.0 -0.1 Hungary -0.1 -0.2 -0.2 -0.3 -0.3 -0.2 -0.2 -0.2 -0.2 -0.2 -0.2 -0.2 -0.2 Malta 0.9 0.7 0.6 0.7 0.6 0.7 0.6 0.9 0.5 0.9 0.9 0.9 0.9 Poland 0.2 -0.2 -0.1 0.0 -0.1 0.0 0.0 -0.1 -0.1 -0.1 -0.1 -0.1 -0.1 Romania -0.5 -0.2 -0.7 -2.7 -0.3 -0.3 -0.2 -0.2 -0.2 -0.2 -0.3 -0.2 -0.4 Slovakia 0.3 0.0 0.0 0.0 0.0 0.1 0.1 0.1 0.1 0.1 0.1 0.1 0.1 Sweden 0.5 0.1 0.4 0.3 0.4 0.4 0.4 0.4 0.7 0.4 0.4 0.3 0.2 United Kingdom 0.3 0.3 0.5 0.4 0.4 0.5 0.6 0.5 0.5 0.5 0.5 0.4 0.4 EU27 0.2 0.2 0.4 0.3 0.4 0.4 0.4 0.3 0.3 0.3 0.3 0.2 0.2 USA 1.2 1.1 1.0 1.0 1.0 1.0 1.0 0.9 1.0 1.0 1.0 1.0 1.0 Japan 0.3 0.2 0.1 0.2 0.2 0.0 0.0 -0.1 -0.1 -0.1 -0.1 -0.1 -0.1

- 140 -
TABLE 27 : Total employment (percentage change on preceding year, 1992-2008) 23.04.2007
5-year averages 2006 2007 20081992-96 1997-01 2002-06 2002 2003 2004 2005 X-2006 IV-2007 X-2006 IV-2007 X-2006 IV-2007
Belgium 0.1 1.3 0.5 -0.1 0.0 0.6 1.0 0.9 1.1 1.0 1.1 0.9 0.9 Germany -1.4 0.0 -0.7 -1.0 -1.7 -0.4 -0.6 0.4 0.3 0.5 0.7 0.6 0.5 Ireland 2.5 5.6 3.2 1.8 2.0 3.1 4.6 4.4 4.4 3.0 3.4 1.5 2.1 Greece 1.0 0.6 1.4 0.1 1.3 2.9 1.3 1.4 1.5 1.3 1.4 1.3 1.3 Spain -0.3 4.1 2.7 2.3 2.4 2.6 3.1 3.2 3.1 3.0 2.8 2.5 2.5 France -0.5 1.7 0.4 0.9 0.0 0.0 0.2 0.8 0.8 0.9 0.9 0.8 0.9 Italy -0.9 1.1 0.7 1.3 0.6 0.4 -0.2 1.3 1.6 0.5 0.9 0.5 0.8 Luxembourg 2.5 4.7 2.7 2.9 1.8 2.3 2.9 3.8 3.7 3.7 3.6 3.6 3.2 Netherlands 1.0 2.4 -0.4 -0.3 -1.1 -1.4 -0.3 1.6 1.0 1.4 1.1 0.8 1.0 Austria -0.2 0.9 0.5 -0.2 0.2 0.3 1.3 0.7 1.1 0.7 1.2 0.7 0.7 Portugal -0.8 1.9 0.2 0.5 -0.4 0.1 0.0 0.6 0.7 0.6 0.7 0.7 0.8 Slovenia : 0.1 0.6 1.5 -0.4 0.5 0.3 0.8 1.2 0.4 0.7 0.5 0.5 Finland -2.3 2.3 0.9 1.0 0.1 0.4 1.4 1.4 1.4 0.6 1.0 0.2 0.7 Euro area : 1.7 0.8 0.6 0.4 0.8 0.8 1.4 1.4 1.2 1.4 1.1 1.2 Bulgaria -1.6 -0.4 2.2 0.2 3.0 2.6 2.7 1.2 2.4 1.0 1.4 0.8 1.2 Czech Republic : -0.9 0.4 0.6 -1.3 0.1 1.6 0.8 1.3 0.7 1.0 0.5 0.7 Denmark 0.2 1.0 0.2 -0.1 -1.3 0.0 0.7 1.2 1.9 0.2 0.4 0.1 -0.1 Estonia : -1.8 1.9 1.6 0.8 0.1 1.8 3.2 5.6 2.0 1.2 1.1 0.9 Cyprus : 1.6 2.9 2.1 3.8 3.8 3.6 1.5 1.5 1.5 1.5 1.5 1.5 Latvia -7.4 0.3 2.1 1.6 1.7 1.1 1.7 2.6 4.6 1.0 1.4 0.7 0.9 Lithuania -2.7 -2.1 2.0 3.6 2.2 0.0 2.5 1.9 1.7 0.6 0.7 0.3 0.1 Hungary : 1.3 0.3 0.0 0.8 -0.5 0.4 0.2 0.9 -0.2 -0.3 0.1 -0.2 Malta 1.5 0.8 0.7 0.6 1.0 -0.8 1.8 1.0 0.9 0.8 0.9 0.9 1.0 Poland : -1.0 0.5 -3.0 -1.2 1.3 2.3 3.3 3.4 1.2 2.4 0.8 1.9 Romania -2.8 -1.8 0.1 -2.7 -0.3 0.4 0.2 0.2 2.8 0.2 1.2 0.1 1.0 Slovakia : -1.1 0.9 -0.5 1.8 -0.3 1.4 2.6 2.3 1.5 1.7 0.9 0.9 Sweden -2.0 1.3 0.3 0.2 -0.3 -0.6 0.4 1.6 2.0 1.4 2.1 1.0 0.9 United Kingdom 0.0 1.2 0.9 0.8 1.0 1.0 0.9 0.8 0.8 0.8 0.8 0.5 0.6 EU27 : 1.1 0.8 0.3 0.4 0.8 0.9 1.4 1.5 1.0 1.4 0.9 1.1 USA 1.7 1.7 1.1 -0.3 0.9 1.1 1.7 1.7 1.9 0.7 1.3 0.8 0.6 Japan 0.4 -0.6 -0.2 -1.6 -0.3 0.2 0.4 0.4 0.4 0.3 0.3 0.3 0.3
TABLE 28 : Number of unemployed (as a percentage of civilian labour force, 1992-2008) ¹5-year averages 2006 2007 2008
1992-96 1997-01 2002-06 2002 2003 2004 2005 X-2006 IV-2007 X-2006 IV-2007 X-2006 IV-2007 Belgium 8.9 8.1 8.1 7.5 8.2 8.4 8.4 8.6 8.2 8.5 7.8 8.4 7.6 Germany 7.8 8.1 8.9 8.2 9.0 9.5 9.5 8.9 8.4 8.4 7.3 7.8 6.5 Ireland 13.9 6.3 4.5 4.5 4.7 4.5 4.3 4.3 4.4 4.5 4.5 4.8 4.6 Greece 8.8 10.9 9.8 10.3 9.7 10.5 9.8 9.3 8.9 8.9 8.5 8.6 8.1 Spain 17.7 13.1 10.1 11.1 11.1 10.6 9.2 8.1 8.6 7.9 8.1 7.4 7.8 France 11.1 10.1 9.4 8.7 9.4 9.6 9.7 9.3 9.4 9.0 8.9 8.7 8.5 Italy 10.3 10.5 7.9 8.6 8.4 8.0 7.7 7.1 6.8 7.0 6.6 7.0 6.4 Luxembourg 2.7 2.4 4.1 2.7 3.7 5.1 4.5 4.6 4.7 4.4 4.6 4.1 4.4 Netherlands 6.2 3.4 3.9 2.8 3.7 4.6 4.7 3.9 3.9 3.0 3.2 2.7 2.7 Austria 3.9 4.0 4.7 4.2 4.3 4.8 5.2 5.1 4.8 5.1 4.4 5.1 4.3 Portugal 6.3 4.9 6.7 5.0 6.3 6.7 7.6 7.6 7.7 7.7 7.7 7.7 7.5 Slovenia : 6.9 6.4 6.3 6.7 6.3 6.5 6.1 6.0 6.1 5.8 6.0 5.6 Finland 14.9 10.6 8.6 9.1 9.0 8.8 8.4 7.7 7.7 7.4 7.2 7.3 6.8 Euro area : 9.1 8.4 8.2 8.7 8.8 8.6 8.0 7.9 7.7 7.3 7.4 6.9 Bulgaria 14.1 16.4 12.6 18.1 13.7 12.0 10.1 8.9 9.0 7.7 8.2 7.0 7.4 Czech Republic : 7.7 7.7 7.3 7.8 8.3 7.9 7.4 7.1 7.1 6.4 6.9 6.1 Denmark 7.8 4.8 4.8 4.6 5.4 5.5 4.8 3.8 3.9 3.5 3.3 3.5 3.3 Estonia : 11.1 8.8 10.3 10.0 9.7 7.9 5.4 5.9 3.8 6.6 3.1 6.2 Cyprus : 3.9 4.4 3.6 4.1 4.6 5.2 5.4 4.7 5.5 4.8 5.6 4.8 Latvia 13.8 14.0 9.8 12.2 10.5 10.4 8.9 7.4 6.8 7.2 6.3 7.0 6.0 Lithuania 5.0 13.3 10.2 13.5 12.4 11.4 8.3 5.9 5.6 5.2 4.8 5.2 4.3 Hungary 10.3 7.3 6.5 5.8 5.9 6.1 7.2 7.3 7.5 7.7 7.8 7.7 7.8 Malta 5.2 6.8 7.4 7.5 7.6 7.4 7.3 7.0 7.4 7.0 7.4 6.9 7.3 Poland 13.4 13.8 18.0 19.9 19.6 19.0 17.7 13.9 13.8 12.2 11.0 11.6 9.0 Romania 5.8 6.2 7.6 8.4 7.0 8.1 7.2 7.6 7.4 7.5 7.2 7.6 7.1 Slovakia : 15.8 16.8 18.7 17.6 18.2 16.3 14.3 13.4 13.3 12.2 12.9 11.7 Sweden 8.5 7.1 6.2 4.9 5.6 6.3 7.4 7.3 7.0 7.4 6.4 7.1 5.9 United Kingdom 9.1 5.8 5.0 5.1 4.9 4.7 4.8 5.3 5.3 5.0 5.0 4.8 4.9 EU27 : : 8.7 8.8 9.0 9.0 8.7 8.0 7.9 7.6 7.2 7.3 6.7 USA 6.3 4.5 5.4 5.8 6.0 5.5 5.1 4.7 4.6 5.1 4.7 5.4 5.0 Japan 2.8 4.4 4.8 5.4 5.3 4.7 4.4 4.3 4.1 4.3 4.1 4.3 4.2
¹ Series following Eurostat definition, based on the labour force survey.

- 141 -
TABLE 29 : Nominal bilateral exchange rates against Ecu/euro (1992-2008) 23.04.2007
5-year averages 2006 2007 20081992-96 1997-01 2002-06 2002 2003 2004 2005 X-2006 IV-2007 X-2006 IV-2007 X-2006 IV-2007
Belgium 39.91 40.43 : : : : : : : : : : : Germany 1.93 1.96 : : : : : : : : : : : Ireland 0.79 0.78 : : : : : : : : : : : Greece 282.43 328.65 : : : : : : : : : : : Spain 152.86 166.45 : : : : : : : : : : : France 6.62 6.58 : : : : : : : : : : : Italy 1888.18 1936.35 : : : : : : : : : : : Luxembourg 39.91 40.43 : : : : : : : : : : : Netherlands 2.17 2.21 : : : : : : : : : : : Austria 13.60 13.79 : : : : : : : : : : : Portugal 190.37 200.35 : : : : : : : : : : : Slovenia 143.42 197.20 235.62 225.98 233.85 239.09 239.57 239.60 239.60 : : : : Finland 6.05 5.94 : : : : : : : : : : : Euro area : : : : : : : : : : : : : Bulgaria 0.09 1.95 1.95 1.95 1.95 1.95 1.96 1.96 1.96 1.96 1.96 1.96 1.96 Czech Republic 34.86 35.71 30.53 30.80 31.85 31.89 29.78 28.39 28.34 28.31 27.98 28.47 27.96 Denmark 7.53 7.46 7.44 7.43 7.43 7.44 7.45 7.46 7.46 7.46 7.45 7.46 7.45 Estonia 15.36 15.68 15.65 15.65 15.65 15.65 15.65 15.65 15.65 15.65 15.65 15.65 15.65 Cyprus 0.59 0.58 0.58 0.58 0.58 0.58 0.58 0.58 0.58 0.59 0.58 0.59 0.58 Latvia 0.75 0.61 0.66 0.58 0.64 0.67 0.70 0.70 0.70 0.70 0.71 0.70 0.71 Lithuania 4.45 4.11 3.45 3.46 3.45 3.45 3.45 3.45 3.45 3.45 3.45 3.45 3.45 Hungary 152.74 244.33 252.11 242.96 253.62 251.66 248.05 266.94 264.26 276.26 247.53 280.32 245.89 Malta 0.45 0.42 0.42 0.41 0.43 0.43 0.43 0.43 0.43 0.43 0.43 0.43 0.43 Poland 2.88 3.91 4.14 3.86 4.40 4.53 4.02 3.92 3.90 3.92 3.85 3.92 3.84 Romania 0.20 1.61 3.62 3.13 3.76 4.05 3.62 3.54 3.53 3.66 3.35 3.84 3.34 Slovakia : 41.54 40.01 42.69 41.49 40.02 38.60 37.52 37.23 38.46 33.64 38.46 33.40 Sweden 8.73 8.81 9.19 9.16 9.12 9.12 9.28 9.29 9.25 9.28 9.26 9.29 9.29 United Kingdom 0.79 0.65 0.67 0.63 0.69 0.68 0.68 0.68 0.68 0.68 0.68 0.68 0.68 EU27 : : : : : : : : : : : : : USA 1.25 1.03 1.16 0.95 1.13 1.24 1.24 1.25 1.26 1.27 1.33 1.27 1.34 Japan 135.36 122.59 133.27 118.06 130.97 134.44 136.85 145.49 146.02 147.56 158.89 144.61 159.86
TABLE 30 : Nominal effective exchange rates to rest of a group ¹ of industrialised countries (percentage change on preceding year, 1992-2008)5-year averages 2006 2007 2008
1992-96 1997-01 2002-06 2002 2003 2004 2005 X-2006 IV-2007 X-2006 IV-2007 X-2006 IV-2007 Belgium : -1.1 1.4 1.2 4.5 1.1 -0.3 0.3 0.4 0.3 1.0 0.1 0.1 Germany : -1.1 1.8 1.7 5.9 1.7 -0.6 0.5 0.5 0.6 1.4 0.1 0.1 Ireland : -1.9 2.4 2.0 7.3 2.3 -0.1 0.5 0.6 0.4 1.9 0.1 0.2 Greece : 0.2 1.7 2.5 5.0 1.3 -0.8 0.6 0.6 0.8 0.9 0.4 0.1 Spain : -1.1 1.4 1.4 4.4 1.1 -0.4 0.4 0.4 0.4 1.0 0.1 0.1 France : -1.0 1.7 1.7 5.3 1.4 -0.3 0.5 0.6 0.5 1.4 0.1 0.1 Italy : 0.1 1.9 2.1 5.7 1.7 -0.6 0.5 0.6 0.6 1.3 0.1 0.1 Luxembourg : -1.1 1.4 1.2 4.5 1.1 -0.3 0.3 0.4 0.3 1.0 0.1 0.1 Netherlands : -1.0 1.2 1.1 3.9 0.9 -0.3 0.3 0.3 0.3 0.8 0.1 0.1 Austria : -0.1 1.1 0.9 3.7 1.0 -0.7 0.3 0.3 0.5 0.8 0.1 0.1 Portugal : -1.1 1.1 0.9 3.5 0.8 -0.2 0.2 0.3 0.3 0.8 0.1 0.1 Slovenia : -3.9 -1.1 -2.7 -0.6 -1.4 -1.1 0.2 0.2 0.4 0.2 0.2 0.0 Finland : -1.1 1.7 1.6 5.4 1.6 -0.4 0.5 0.5 0.5 1.3 0.0 0.1 Euro area : -1.5 3.2 3.0 10.9 2.9 -1.4 0.8 0.8 1.1 2.0 0.3 0.2 Bulgaria : -32.4 1.7 3.2 4.7 1.2 -1.2 0.8 0.8 1.0 0.8 0.5 0.1 Czech Republic : 0.8 4.5 11.6 -0.3 0.4 6.2 5.1 5.2 0.7 1.3 -0.5 0.1 Denmark : -1.0 1.4 1.4 4.7 1.2 -0.5 0.3 0.3 0.4 1.2 0.0 0.1 Estonia : -0.4 1.0 0.6 3.2 0.9 -0.1 0.3 0.2 0.4 0.6 0.0 0.1 Cyprus : 5.3 1.6 1.9 4.2 0.8 0.7 0.6 0.5 -1.5 -0.2 0.1 0.0 Latvia : 4.3 -3.4 -3.0 -5.9 -3.2 -5.0 0.1 0.0 -0.7 -0.9 0.1 -0.1 Lithuania : 8.3 2.1 5.1 5.0 1.1 -0.5 0.1 0.1 0.5 0.9 0.1 0.1 Hungary : -4.7 0.3 6.9 -1.2 1.5 0.7 -7.1 -6.1 -3.0 6.9 -1.2 0.7 Malta : 0.2 1.4 1.1 3.4 1.9 -0.4 0.9 1.0 0.5 2.2 0.0 0.2 Poland : -1.1 -0.5 -4.3 -10.1 -2.3 12.1 3.0 3.5 0.4 1.4 0.1 0.4 Romania : -30.2 -4.7 -15.3 -13.8 -6.6 11.2 3.2 3.5 -2.5 5.9 -4.5 0.4 Slovakia : -1.4 3.6 1.5 5.8 4.6 2.5 2.9 3.7 -2.1 10.7 0.2 0.7 Sweden : -2.6 1.8 2.4 6.2 2.1 -2.4 0.3 0.8 0.7 1.4 -0.2 -0.1 United Kingdom : 4.6 0.2 1.0 -3.9 4.5 -1.2 0.8 1.0 1.4 2.9 -0.7 -0.1 EU27 : -1.5 5.2 5.4 12.7 6.3 -0.7 : 2.5 : 5.8 : 0.4 USA : 5.0 -3.9 -0.9 -9.0 -6.5 -2.0 -0.5 -0.8 -0.7 -2.0 -0.3 -0.5 Japan : 1.5 -2.5 -5.1 -0.3 1.6 -2.4 -5.7 -5.8 -0.6 -5.5 2.3 -0.3
¹ 35 countries : EUR26 (excl. LU), TR, CH, NO, US, CA, JP, AU, MX and NZ.
- 142 -
TABLE 31 : Relative unit labour costs, to rest of a group ¹ of industrialised countries (nat. curr.) (percentage change on preceding year, 19923.04.2007
5-year averages 2006 2007 20081992-96 1997-01 2002-06 2002 2003 2004 2005 X-2006 IV-2007 X-2006 IV-2007 X-2006 IV-2007
Belgium : -0.7 -0.4 -0.1 -1.4 -1.2 1.0 -0.7 -0.4 -0.8 -0.3 : -0.6 Germany : -2.9 -2.0 -1.5 -1.2 -1.3 -2.8 -3.7 -2.9 -2.1 -2.0 : -1.4 Ireland : -0.4 1.8 -0.4 0.7 4.5 2.4 2.0 1.7 0.4 1.2 : 0.7 Greece : -1.7 1.3 2.8 -1.9 2.5 2.2 1.2 1.1 0.4 0.8 : 0.3 Spain : -0.3 0.8 0.5 0.6 1.3 0.5 0.7 1.2 0.7 0.6 : 0.0 France : -1.7 0.3 0.9 -0.4 0.0 0.4 0.2 0.8 0.0 -0.1 : -0.2 Italy : -2.1 1.4 1.4 2.3 1.4 1.2 0.8 0.8 0.1 -0.2 : 0.5 Luxembourg : -0.7 -0.4 -0.1 -1.4 -1.2 1.0 -0.7 -0.4 -0.8 -0.3 : -0.6 Netherlands : 0.6 -0.1 2.8 0.8 -0.6 -1.7 -1.1 -1.9 0.0 0.2 : 0.6 Austria : -2.4 -0.9 -1.2 -1.0 -1.3 -0.3 -0.6 -0.6 -0.9 -0.7 : -0.9 Portugal : 1.7 0.7 1.5 1.0 0.1 0.7 0.5 0.3 0.0 -0.2 : -0.2 Slovenia : 3.4 1.6 4.1 1.3 2.6 0.3 0.1 -0.4 0.4 0.1 : 0.4 Finland : -1.7 -0.6 -0.7 -0.8 -0.5 0.8 -2.1 -1.9 -1.7 -1.3 : -0.3 Euro area : -4.0 -0.8 0.2 -0.5 -0.4 -1.4 -2.5 -1.9 -1.6 -1.5 : -0.8 Bulgaria : 58.5 -0.6 -3.7 -0.8 -1.2 0.2 2.6 2.4 2.2 1.8 : 2.0 Czech Republic : 2.8 1.0 4.0 1.8 0.9 -1.2 -0.6 -0.7 0.4 -2.7 : -3.4 Denmark : 0.1 0.6 1.5 0.6 0.0 -0.4 0.5 1.3 0.4 0.9 : 0.4 Estonia : 2.3 2.8 0.9 4.9 3.3 0.6 3.1 4.4 1.9 4.1 : 2.8 Cyprus : -6.8 1.7 2.3 6.9 0.0 -0.9 -0.8 0.2 -0.8 -0.7 : -0.9 Latvia : -1.9 6.3 -2.7 3.6 5.4 13.8 7.3 12.1 4.6 6.8 : 5.5 Lithuania : -2.1 1.3 -0.3 -1.6 2.2 1.1 6.1 5.1 5.1 5.6 : 2.3 Hungary : 7.3 3.7 5.7 4.3 4.9 1.1 1.4 2.5 2.4 2.8 : 0.5 Malta : 0.0 0.5 -0.1 5.9 0.7 -1.4 -1.1 -2.1 -1.0 -2.1 : -1.7 Poland : 5.3 -2.6 -4.4 -5.3 -3.0 -0.3 0.8 0.3 -0.1 -0.1 : -1.3 Romania : 60.9 11.3 12.9 13.0 7.3 12.7 6.4 10.7 5.8 8.6 : 6.1 Slovakia : 3.1 1.7 2.0 3.5 2.5 -0.3 2.6 0.8 0.1 -0.7 : -0.1 Sweden : -0.5 -1.3 -0.8 -0.9 -1.8 -0.9 -0.7 -2.2 0.0 0.7 : 0.1 United Kingdom : 0.8 1.1 0.1 1.3 1.1 2.2 1.2 0.7 0.7 0.6 : 0.7 EU27 : -2.7 -0.2 0.5 0.2 0.1 -0.5 : -1.5 : -1.1 : -0.8 USA : -0.7 0.2 -0.1 -1.0 0.3 -0.1 2.6 1.7 1.7 1.6 : 1.6 Japan : -3.5 -4.2 -4.9 -5.1 -5.0 -3.1 -4.1 -3.1 -3.1 -3.0 : -2.4
¹ 35 countries : EUR26 (excl. LU), TR, CH, NO, US, CA, JP, AU, MX and NZ.
TABLE 32 : Real effective exchange rate : ulc relative to rest of a group ¹ of industrialised countries (usd) (% change on preceding year, 1992-2008)5-year averages 2006 2007 2008
1992-96 1997-01 2002-06 2002 2003 2004 2005 X-2006 IV-2007 X-2006 IV-2007 X-2006 IV-2007 Belgium : -1.8 1.0 1.2 3.1 -0.1 0.8 -0.4 0.0 -0.5 0.7 : -0.5 Germany : -3.9 -0.2 0.3 4.6 0.4 -3.4 -3.2 -2.4 -1.6 -0.7 : -1.2 Ireland : -2.3 4.2 1.6 8.1 6.9 2.4 2.5 2.2 0.8 3.1 : 0.9 Greece : -1.4 3.0 5.4 3.0 3.8 1.3 1.8 1.7 1.2 1.7 : 0.4 Spain : -1.4 2.2 1.9 5.0 2.4 0.1 1.1 1.5 1.2 1.6 : 0.1 France : -2.7 2.0 2.6 4.8 1.4 0.0 0.8 1.3 0.4 1.3 : 0.0 Italy : -2.0 3.3 3.6 8.1 3.1 0.6 1.4 1.3 0.7 1.1 : 0.6 Luxembourg : -1.8 1.0 1.2 3.1 -0.1 0.8 -0.4 0.0 -0.5 0.7 : -0.5 Netherlands : -0.4 1.0 3.9 4.8 0.3 -2.0 -0.8 -1.6 0.3 1.0 : 0.7 Austria : -2.6 0.2 -0.2 2.6 -0.3 -0.9 -0.2 -0.3 -0.5 0.1 : -0.8 Portugal : 0.6 1.8 2.4 4.5 1.0 0.6 0.8 0.5 0.3 0.6 : -0.1 Slovenia : -0.7 0.4 1.2 0.6 1.2 -0.8 0.2 -0.2 0.8 0.3 : 0.4 Finland : -2.7 1.1 0.9 4.6 1.0 0.4 -1.6 -1.4 -1.2 0.0 : -0.2 Euro area : -5.5 2.3 3.2 10.4 2.4 -2.7 -1.8 -1.1 -0.6 0.5 : -0.6 Bulgaria : 7.2 1.1 -0.7 3.9 0.0 -1.0 3.5 3.2 3.3 2.6 : 2.0 Czech Republic : 3.7 5.5 16.0 1.5 1.3 4.9 4.5 4.5 1.1 -1.4 : -3.4 Denmark : -0.9 2.0 2.9 5.3 1.2 -0.8 0.7 1.6 0.8 2.1 : 0.5 Estonia : 1.9 3.8 1.5 8.3 4.3 0.5 3.4 4.6 2.3 4.7 : 2.9 Cyprus : -1.8 3.3 4.3 11.5 0.9 -0.2 -0.2 0.7 -2.2 -0.9 : -0.9 Latvia : 2.4 2.6 -5.6 -2.5 2.1 8.1 7.4 12.1 3.8 5.9 : 5.4 Lithuania : 6.0 3.5 4.9 3.3 3.4 0.6 6.2 5.2 5.6 6.6 : 2.4 Hungary : 2.2 4.0 13.0 3.1 6.4 1.7 -5.8 -3.7 -0.7 9.9 : 1.2 Malta : 0.2 1.9 1.0 9.5 2.6 -1.9 -0.3 -1.1 -0.4 0.0 : -1.5 Poland : 4.1 -3.0 -8.5 -14.8 -5.2 11.7 3.9 3.8 0.3 1.3 : -0.9 Romania : 12.3 6.1 -4.4 -2.6 0.3 25.3 9.8 14.6 3.1 15.1 : 6.5 Slovakia : 1.7 5.3 3.5 9.5 7.2 2.2 5.6 4.5 -2.0 10.0 : 0.6 Sweden : -3.0 0.4 1.6 5.3 0.2 -3.2 -0.4 -1.5 0.8 2.1 : 0.0 United Kingdom : 5.5 1.3 1.0 -2.7 5.7 1.0 2.1 1.7 2.2 3.5 : 0.6 EU27 : -4.2 4.9 5.9 12.9 6.5 -1.2 : 1.0 : 4.6 : -0.4 USA : 4.2 -3.8 -1.0 -10.0 -6.2 -2.1 2.1 0.9 1.0 -0.5 : 1.1 Japan : -2.1 -6.6 -9.8 -5.4 -3.5 -5.4 -9.5 -8.8 -3.6 -8.4 : -2.7
¹ 35 countries : EUR26 (excl. LU), TR, CH, NO, US, CA, JP, AU, MX and NZ.

- 143 -
TABLE 33 : Short term interest rates (1992-2006) 23.04.2007
5-year averages1992-96 1997-01 2002-06 1997 1998 1999 2000 2001 2002 2003 2004 2005 2006
Belgium 6.2 3.7 2.6 3.4 3.5 3.0 4.4 4.3 3.3 2.3 2.1 2.2 3.1 Germany 6.0 3.7 2.6 3.3 3.5 3.0 4.4 4.3 3.3 2.3 2.1 2.2 3.1 Ireland 7.8 4.6 2.6 6.1 5.5 3.0 4.4 4.3 3.3 2.3 2.1 2.2 3.1 Greece 20.3 9.8 2.6 12.8 14.0 10.1 7.7 4.3 3.3 2.3 2.1 2.2 3.1 Spain 10.0 4.2 2.6 5.4 4.3 3.0 4.4 4.3 3.3 2.3 2.1 2.2 3.1 France 7.1 3.7 2.6 3.5 3.6 3.0 4.4 4.3 3.3 2.3 2.1 2.2 3.1 Italy 10.3 4.7 2.6 6.8 4.9 3.0 4.4 4.3 3.3 2.3 2.1 2.2 3.1 Luxembourg : : : : : : : : : : 2.1 2.2 3.1 Netherlands 5.7 3.7 2.6 3.3 3.4 3.0 4.4 4.3 3.3 2.3 2.1 2.2 3.1 Austria 5.9 3.7 2.6 3.5 3.6 3.0 4.4 4.3 3.3 2.3 2.1 2.2 3.1 Portugal 11.5 4.3 2.6 5.7 4.3 3.0 4.4 4.3 3.3 2.3 2.1 2.2 3.1 Slovenia : : 5.3 : 10.3 8.6 10.9 10.9 8.0 6.8 4.7 4.0 3.1 Finland 7.1 3.7 2.6 3.2 3.6 3.0 4.4 4.3 3.3 2.3 2.1 2.2 3.1 Euro area : : 2.6 : 4.2 3.1 4.5 4.3 3.3 2.4 2.1 2.2 3.1 Bulgaria : : 3.8 : 5.9 5.9 4.6 5.1 4.9 3.7 3.7 3.6 3.1 Czech Republic : 9.5 2.5 16.0 14.3 6.9 5.4 5.2 3.5 2.3 2.4 2.0 2.3 Denmark 7.8 4.2 2.7 3.7 4.3 3.4 5.0 4.7 3.5 2.4 2.2 2.2 3.2 Estonia : 8.3 3.0 8.6 13.9 7.8 5.7 5.3 3.9 2.9 2.5 2.4 3.2 Cyprus : : 4.1 : : 6.3 6.4 5.9 4.4 3.9 4.7 4.3 3.4 Latvia : 7.0 4.0 6.0 8.4 8.4 5.4 6.9 4.4 3.8 4.2 3.1 4.4 Lithuania : : 3.0 : : 13.9 8.6 5.9 3.7 2.8 2.7 2.4 3.1 Hungary : 15.1 8.6 20.4 17.9 15.1 11.4 10.9 9.2 8.5 11.5 6.7 7.0 Malta : 5.1 3.4 5.1 5.4 5.2 4.9 4.9 4.0 3.3 2.9 3.2 3.5 Poland : 18.7 6.1 23.7 20.4 14.7 18.8 16.1 9.0 5.7 6.2 5.3 4.2 Romania : 64.4 16.0 80.8 69.5 79.6 50.7 41.3 27.3 17.7 19.1 8.4 7.4 Slovakia : 15.0 5.2 21.8 21.1 15.7 8.6 7.8 7.8 6.2 4.7 2.9 4.3 Sweden 8.9 4.1 2.9 4.4 4.4 3.3 4.1 4.1 4.3 3.2 2.3 1.9 2.6 United Kingdom 6.8 6.2 4.4 6.9 7.4 5.6 6.2 5.0 4.1 3.7 4.6 4.8 4.8 EU27 : : 3.3 : : 5.0 5.9 5.4 4.1 3.0 3.1 2.9 3.5 USA 4.7 5.4 2.7 5.8 5.6 5.4 6.5 3.8 1.8 1.2 1.6 3.6 5.2 Japan 2.3 0.4 0.1 0.6 0.7 0.2 0.3 0.2 0.1 0.1 0.1 0.1 0.3
TABLE 34 : Long term interest rates (1992-2006)5-year averages
1992-96 1997-01 2002-06 1997 1998 1999 2000 2001 2002 2003 2004 2005 2006 Belgium 7.5 5.2 4.1 5.8 4.8 4.8 5.6 5.1 5.0 4.2 4.2 3.4 3.8 Germany 6.9 5.0 4.0 5.6 4.6 4.5 5.3 4.8 4.8 4.1 4.0 3.4 3.8 Ireland 8.0 5.3 4.1 6.3 4.8 4.7 5.5 5.0 5.0 4.1 4.1 3.3 3.7 Greece 20.0 7.3 4.3 10.2 8.5 6.3 6.1 5.3 5.1 4.3 4.3 3.6 4.1 Spain 10.4 5.3 4.1 6.4 4.8 4.7 5.5 5.1 5.0 4.1 4.1 3.4 3.8 France 7.3 5.0 4.1 5.6 4.6 4.6 5.4 4.9 4.9 4.1 4.1 3.4 3.8 Italy 11.3 5.4 4.2 6.9 4.9 4.7 5.6 5.2 5.0 4.3 4.3 3.6 4.0 Luxembourg 7.1 5.1 4.0 5.6 4.7 4.7 5.5 4.9 4.7 4.0 4.2 3.4 3.9 Netherlands 6.9 5.0 4.1 5.6 4.6 4.6 5.4 5.0 4.9 4.1 4.1 3.4 3.8 Austria 7.1 5.1 4.1 5.7 4.7 4.7 5.6 5.1 5.0 4.2 4.2 3.4 3.8 Portugal 11.1 5.4 4.1 6.4 4.9 4.8 5.6 5.2 5.0 4.2 4.1 3.4 3.9 Slovenia : : : : : : : : : 6.4 4.7 3.8 3.9 Finland 9.1 5.2 4.1 6.0 4.8 4.7 5.5 5.0 5.0 4.1 4.1 3.4 3.9 Euro area : : : : : : : : : 4.2 4.1 3.4 3.8 Bulgaria : : 5.6 : : : : : 8.3 6.4 5.3 3.8 4.4 Czech Republic : : 4.2 : : : 6.9 6.3 4.9 4.1 4.8 3.5 3.8 Denmark 7.9 5.4 4.2 6.3 4.9 4.9 5.6 5.1 5.1 4.3 4.3 3.4 3.8 Estonia : : 5.3 : 13.2 11.4 10.5 10.2 8.4 5.3 4.4 4.0 4.3 Cyprus : 7.2 5.1 6.9 6.7 7.4 7.6 7.6 5.7 4.7 5.8 5.2 4.1 Latvia : : 4.6 : : : : 7.6 5.4 4.9 4.9 3.9 4.1 Lithuania : : 4.7 : : : : 8.2 6.1 5.3 4.5 3.7 4.1 Hungary : : 7.2 : : 9.9 8.6 8.0 7.1 6.8 8.2 6.6 7.1 Malta : : 4.9 : : : 5.8 6.2 5.8 5.0 4.7 4.6 4.3 Poland : : 6.1 : : 9.5 11.8 10.7 7.4 5.8 6.9 5.2 5.2 Romania : : : : : : : : : : : : 7.3 Slovakia : : 5.0 : : : 8.3 8.0 6.9 5.0 5.0 3.5 4.4 Sweden 9.3 5.4 4.3 6.6 5.0 5.0 5.4 5.1 5.3 4.6 4.4 3.4 3.7 United Kingdom 8.2 5.6 4.7 7.1 5.6 5.0 5.3 5.0 4.9 4.6 4.9 4.5 4.4 EU27 : : : : : : : : : : : : 4.0 USA 6.7 5.7 4.4 6.5 5.3 5.6 6.0 5.0 4.6 4.0 4.3 4.3 4.8 Japan 4.0 1.7 1.4 2.2 1.3 1.8 1.8 1.3 1.3 1.0 1.5 1.4 1.8

- 144 -
TABLE 35 : Total expenditure, general government (as a percentage of GDP, 1992-2008) ¹ 23.04.2007
5-year averages 2006 2007 20081992-96 1997-01 2002-06 2002 2003 2004 2005 X-2006 IV-2007 X-2006 IV-2007 X-2006 IV-2007
Belgium 52.7 49.9 50.3 49.8 51.1 49.2 52.2 47.0 49.1 46.8 48.7 46.4 48.5 Germany 47.8 47.4 47.2 48.1 48.5 47.1 46.8 45.8 45.7 45.2 44.3 44.8 43.7 Ireland 39.4 34.2 33.9 33.6 33.5 34.1 34.4 35.0 34.1 35.0 35.1 35.4 35.5 Greece 48.5 50.0 48.3 49.1 49.4 49.9 47.1 44.9 45.8 44.7 45.4 44.4 45.2 Spain 44.6 39.9 38.5 38.7 38.2 38.7 38.2 38.2 38.4 38.3 38.3 38.5 38.5 France 53.3 52.4 53.2 52.6 53.3 53.2 53.6 53.5 53.5 53.1 53.2 52.8 52.7 Italy 53.2 48.3 48.3 47.2 48.3 47.7 48.2 49.5 50.1 48.6 48.1 48.6 48.3 Luxembourg : 39.3 42.0 41.4 42.0 43.2 42.8 43.1 40.4 41.9 39.0 41.4 38.0 Netherlands 52.0 45.9 46.3 46.2 47.1 46.3 45.4 46.6 46.6 46.2 47.0 45.7 46.2 Austria 53.3 52.2 50.1 50.5 50.9 50.2 49.8 48.8 49.1 48.3 48.3 47.7 47.9 Portugal 41.2 43.0 45.9 44.2 45.4 46.4 47.5 47.1 46.1 46.6 45.8 46.4 45.5 Slovenia : : 47.4 48.0 48.0 47.4 47.0 48.0 46.3 47.0 45.4 46.4 44.4 Finland 59.9 51.3 49.5 48.8 49.9 50.0 50.3 48.6 48.5 48.0 47.7 47.8 47.3 Euro area : : 47.7 47.7 48.2 47.6 47.6 47.2 47.3 46.7 46.5 46.5 46.2 Bulgaria : 1.1 39.1 39.2 40.9 39.3 39.5 37.3 36.6 38.0 37.3 37.8 37.6 Czech Republic : 43.0 44.9 46.3 47.3 44.4 44.0 43.6 42.5 43.8 43.1 43.8 43.0 Denmark 59.0 55.1 53.6 54.5 55.0 54.7 52.6 51.3 50.9 50.3 50.1 49.4 49.6 Estonia : 38.0 34.3 35.6 35.3 34.2 33.2 32.3 33.2 31.5 32.4 30.9 32.4 Cyprus : : 43.2 40.3 45.1 42.9 43.6 45.9 43.9 46.0 44.0 46.0 43.9 Latvia : 38.1 35.7 35.6 34.8 35.8 35.5 39.5 37.0 39.3 37.3 38.8 36.4 Lithuania : 41.1 33.7 34.8 33.2 33.4 33.6 34.0 33.6 33.0 34.8 31.9 36.0 Hungary : 48.9 50.4 51.2 49.1 48.9 50.0 51.7 52.9 50.3 50.9 48.6 49.0 Malta : : 46.1 43.8 48.6 46.8 46.0 47.0 45.2 47.1 44.3 47.3 43.4 Poland : 43.7 43.6 44.3 44.6 42.6 43.4 44.0 43.3 44.4 42.4 43.6 41.4 Romania : : 34.3 39.6 33.6 32.6 33.7 38.8 32.0 39.8 33.6 40.4 34.2 Slovakia : 47.3 39.3 43.3 40.0 37.7 38.1 36.5 37.3 35.4 36.0 35.0 35.6 Sweden 65.7 59.3 56.8 57.8 58.0 56.6 56.3 55.6 55.3 54.2 53.0 53.5 52.5 United Kingdom 42.8 39.3 42.8 41.0 42.4 42.7 43.7 44.6 44.1 44.6 44.2 44.6 44.3 EU27 : : 46.9 46.7 47.4 46.8 46.9 47.1 46.9 46.7 46.1 46.3 45.9 USA 35.9 33.1 34.6 34.4 34.8 34.5 34.8 34.5 34.5 34.8 34.8 35.1 35.1 Japan 36.5 49.5 47.7 50.5 50.0 48.5 50.0 38.7 39.6 38.7 39.2 38.8 39.0
¹ ESA 79 up to 1994, ESA 95 from 1995 onwards. Total expenditure includes one-off proceeds relative to UMTS licences (see note 10 on concepts and sources).Note : An unanticipated base effect caused both the Belgian revenue- and expenditure ratios for 2006-2008 to be underestimated by 2.3 pps. in the autumn 2006 forecast.
TABLE 36 : Total revenue, general government (as a percentage of GDP, 1992-2008) ¹5-year averages 2006 2007 2008
1992-96 1997-01 2002-06 2002 2003 2004 2005 X-2006 IV-2007 X-2006 IV-2007 X-2006 IV-2007 Belgium 47.4 49.3 49.9 49.8 51.1 49.2 49.9 46.8 49.3 46.3 48.5 45.9 48.2 Germany 44.8 45.9 44.0 44.4 44.5 43.4 43.5 43.5 44.0 43.6 43.7 43.6 43.4 Ireland 37.7 36.6 35.0 33.2 33.9 35.5 35.5 36.1 36.9 35.9 36.6 35.7 36.4 Greece 37.8 45.4 42.8 43.9 43.2 41.9 41.6 42.2 43.2 42.1 43.0 42.0 42.5 Spain 39.1 38.1 39.0 38.4 38.2 38.6 39.3 39.6 40.3 39.5 39.7 39.3 39.7 France 48.4 50.4 50.0 49.5 49.2 49.6 50.7 50.8 51.0 50.5 50.7 50.6 50.8 Italy 44.9 46.1 44.6 44.4 44.8 44.2 44.0 44.9 45.6 45.7 46.0 45.5 46.1 Luxembourg : 43.8 42.2 43.5 42.5 41.9 42.6 41.6 40.5 41.5 39.4 41.1 38.6 Netherlands 48.6 46.0 45.0 44.2 43.9 44.5 45.2 46.5 47.2 46.3 46.3 46.0 46.3 Austria 49.2 50.7 48.9 50.0 49.3 49.0 48.2 47.6 48.0 47.2 47.4 46.7 47.1 Portugal 36.4 39.7 42.1 41.4 42.5 43.1 41.4 42.5 42.2 42.5 42.3 42.5 42.3 Slovenia : : 45.3 45.5 45.3 45.1 45.6 46.4 44.8 45.4 43.9 44.8 42.9 Finland 54.0 54.1 52.6 52.9 52.4 52.3 53.0 51.5 52.3 50.9 51.3 50.7 50.9 Euro area : : 45.2 45.1 45.1 44.8 45.1 45.2 45.7 45.2 45.5 45.1 45.4 Bulgaria : 0.0 40.3 38.9 40.0 41.4 41.4 40.6 39.9 39.7 39.3 39.5 39.6 Czech Republic : 38.6 40.4 39.5 40.7 41.5 40.4 40.1 39.5 40.2 39.2 40.5 39.4 Denmark 56.5 56.0 55.8 54.7 55.0 56.7 57.2 55.3 55.1 54.6 53.8 53.6 53.1 Estonia : 37.4 36.5 36.0 37.4 36.6 35.5 34.8 37.0 33.1 36.2 32.1 35.9 Cyprus : : 39.4 35.9 38.8 38.8 41.2 44.0 42.4 44.3 42.6 44.3 42.6 Latvia : 36.3 34.8 33.4 33.2 34.7 35.2 38.5 37.4 38.1 37.5 37.6 36.5 Lithuania : 36.4 32.6 32.9 32.0 31.8 33.1 33.0 33.3 31.7 34.4 30.6 34.9 Hungary : 43.6 42.5 42.3 41.9 42.5 42.2 41.6 43.7 42.9 44.0 43.0 44.1 Malta : : 40.9 38.2 38.6 41.9 42.9 44.2 42.7 44.4 42.2 44.4 41.9 Poland : 39.8 38.6 39.3 38.4 36.9 39.0 41.8 39.4 42.3 39.0 41.8 38.0 Romania : : 32.7 37.6 32.1 31.1 32.4 37.5 30.1 37.1 30.4 37.8 31.0 Slovakia : 40.0 35.5 35.7 37.2 35.3 35.2 33.1 33.9 32.4 33.1 32.1 32.8 Sweden 57.9 60.6 57.4 56.6 57.1 57.4 58.4 58.4 57.5 56.6 55.2 56.0 54.9 United Kingdom 36.7 40.1 40.0 39.4 39.2 39.5 40.6 41.7 41.3 41.8 41.6 42.1 41.9 EU27 : : 44.5 44.3 44.3 44.1 44.5 45.1 45.2 45.1 44.9 45.0 44.8 USA 31.7 33.5 30.8 30.6 30.0 29.9 31.1 32.3 32.2 32.3 32.2 32.3 32.2 Japan 34.1 42.2 41.1 42.5 42.1 42.3 43.5 33.2 34.9 33.5 35.3 34.1 35.6
¹ ESA 79 up to 1994, ESA 95 from 1995 onwards.Note : An unanticipated base effect caused both the Belgian revenue- and expenditure ratios for 2006-2008 to be underestimated by 2.3 pps. in the autumn 2006 forecast.

- 145 -
TABLE 37 : Net lending (+) or net borrowing (-), general government (as a percentage of GDP, 1992-2008) ¹ 23.04.2007
5-year averages 2006 2007 20081992-96 1997-01 2002-06 2002 2003 2004 2005 X-2006 IV-2007 X-2006 IV-2007 X-2006 IV-2007
Belgium -5.3 -0.5 -0.4 0.0 0.1 0.0 -2.3 -0.2 0.2 -0.5 -0.1 -0.5 -0.2 Germany -3.0 -1.6 -3.3 -3.7 -4.0 -3.7 -3.2 -2.3 -1.7 -1.6 -0.6 -1.2 -0.3 Ireland -1.6 2.3 1.1 -0.4 0.4 1.4 1.0 1.2 2.9 0.9 1.5 0.4 1.0 Greece -10.7 -4.7 -5.5 -5.2 -6.2 -7.9 -5.5 -2.6 -2.6 -2.6 -2.4 -2.4 -2.7 Spain -5.6 -1.8 0.5 -0.3 0.0 -0.2 1.1 1.5 1.8 1.1 1.4 0.9 1.2 France -4.9 -2.1 -3.3 -3.2 -4.1 -3.6 -3.0 -2.7 -2.5 -2.6 -2.4 -2.2 -1.9 Italy -8.3 -2.2 -3.7 -2.9 -3.5 -3.5 -4.2 -4.7 -4.4 -2.9 -2.1 -3.1 -2.2 Luxembourg 1.6 4.5 0.2 2.1 0.4 -1.2 -0.3 -1.5 0.1 -0.5 0.4 -0.3 0.6 Netherlands -3.3 0.0 -1.3 -2.0 -3.1 -1.8 -0.3 0.0 0.6 0.1 -0.7 0.3 0.0 Austria -4.1 -1.5 -1.2 -0.5 -1.6 -1.2 -1.6 -1.3 -1.1 -1.2 -0.9 -1.0 -0.8 Portugal -4.7 -3.3 -3.8 -2.9 -2.9 -3.3 -6.1 -4.6 -3.9 -4.0 -3.5 -3.9 -3.2 Slovenia : : -2.1 -2.5 -2.8 -2.3 -1.5 -1.6 -1.4 -1.6 -1.5 -1.5 -1.5 Finland -5.8 2.8 3.1 4.1 2.5 2.3 2.7 2.9 3.9 2.9 3.7 2.9 3.6 Euro area : : -2.5 -2.5 -3.0 -2.8 -2.5 -2.0 -1.6 -1.5 -1.0 -1.3 -0.8 Bulgaria : 0.3 1.3 -0.2 -0.9 2.2 1.9 3.3 3.3 1.8 2.0 1.7 2.0 Czech Republic : -4.4 -4.6 -6.8 -6.6 -2.9 -3.5 -3.5 -2.9 -3.6 -3.9 -3.2 -3.6 Denmark -2.5 0.9 2.2 0.2 0.0 2.0 4.7 4.0 4.2 4.3 3.7 4.2 3.6 Estonia : -0.6 2.2 0.4 2.0 2.3 2.3 2.5 3.8 1.6 3.7 1.3 3.5 Cyprus : : -3.7 -4.4 -6.3 -4.1 -2.3 -1.9 -1.5 -1.7 -1.4 -1.7 -1.4 Latvia : -1.9 -0.9 -2.3 -1.6 -1.0 -0.2 -1.0 0.4 -1.2 0.2 -1.2 0.1 Lithuania : -4.6 -1.1 -1.9 -1.3 -1.5 -0.5 -1.0 -0.3 -1.2 -0.4 -1.3 -1.0 Hungary : -5.3 -7.9 -8.9 -7.2 -6.5 -7.8 -10.1 -9.2 -7.4 -6.8 -5.6 -4.9 Malta : : -5.2 -5.5 -10.0 -4.9 -3.1 -2.9 -2.6 -2.7 -2.1 -2.9 -1.6 Poland : -3.9 -5.0 -5.0 -6.3 -5.7 -4.3 -2.2 -3.9 -2.0 -3.4 -1.8 -3.3 Romania : : -1.7 -2.0 -1.5 -1.5 -1.4 -1.4 -1.9 -2.6 -3.2 -2.6 -3.2 Slovakia : -7.3 -3.8 -7.7 -2.7 -2.4 -2.8 -3.4 -3.4 -3.0 -2.9 -2.9 -2.8 Sweden -7.8 1.3 0.6 -1.2 -0.9 0.8 2.1 2.8 2.2 2.4 2.2 2.5 2.4 United Kingdom -6.1 0.8 -2.8 -1.6 -3.2 -3.1 -3.1 -2.9 -2.8 -2.8 -2.6 -2.5 -2.4 EU27 : : -2.5 -2.4 -3.1 -2.7 -2.4 -2.0 -1.7 -1.6 -1.2 -1.4 -1.0 USA -4.2 0.3 -3.8 -3.8 -4.9 -4.6 -3.7 -2.2 -2.3 -2.4 -2.6 -2.8 -2.9 Japan -2.5 -7.3 -6.6 -8.0 -7.9 -6.2 -6.4 -5.6 -4.6 -5.1 -3.9 -4.7 -3.5
¹ ESA 79 up to 1994, ESA 95 from 1995 onwards. The net lending (borrowing) includes one-off proceeds relative to UMTS licences (see note 10 on concepts and sources). For DK, PL and SE, the forecast of X-2006 did not include the pension reform costs, pursuant to a transitory period granted by Eurostat. Such a transitory period is now over. For those countries, data of X-2006 and IV-2007 are not comparable.
TABLE 38 : Interest expenditure, general government (as a percentage of GDP, 1992-2008) ¹5-year averages 2006 2007 2008
1992-96 1997-01 2002-06 2002 2003 2004 2005 X-2006 IV-2007 X-2006 IV-2007 X-2006 IV-2007 Belgium 9.5 7.0 4.8 5.7 5.3 4.7 4.2 4.1 4.1 3.9 3.9 3.7 3.8 Germany 3.3 3.2 2.9 2.9 3.0 2.8 2.8 2.7 2.8 2.7 2.8 2.7 2.8 Ireland 5.6 2.6 1.1 1.3 1.2 1.2 1.0 1.0 1.0 1.0 1.0 1.0 1.0 Greece 12.6 8.7 5.3 6.0 5.5 5.5 4.9 4.6 4.6 4.4 4.4 4.0 4.2 Spain 4.8 3.7 2.1 2.7 2.3 2.0 1.8 1.6 1.6 1.5 1.6 1.4 1.5 France 3.4 3.1 2.7 2.9 2.8 2.7 2.6 2.6 2.5 2.7 2.5 2.7 2.5 Italy 11.3 7.3 4.9 5.5 5.1 4.7 4.5 4.6 4.6 4.8 4.7 4.7 4.8 Luxembourg 0.3 0.4 0.2 0.3 0.2 0.2 0.2 0.2 0.2 0.2 0.2 0.2 0.1 Netherlands 5.7 4.1 2.5 2.8 2.6 2.5 2.4 2.3 2.3 2.2 2.2 2.1 2.0 Austria 4.0 3.5 2.9 3.1 2.9 2.8 2.9 2.7 2.7 2.6 2.6 2.5 2.6 Portugal 5.8 3.3 2.7 2.9 2.7 2.6 2.7 2.9 2.8 3.0 2.9 3.2 3.0 Slovenia : : 1.9 2.3 2.1 1.8 1.7 1.5 1.6 1.4 1.5 1.3 1.4 Finland 4.0 3.2 1.7 2.1 1.7 1.5 1.5 1.4 1.4 1.3 1.4 1.3 1.3 Euro area : : 3.1 3.5 3.3 3.1 2.9 2.9 2.9 2.9 2.9 2.8 2.8 Bulgaria : 4.8 1.8 2.1 2.2 1.8 1.6 1.4 1.3 1.2 1.2 1.0 1.1 Czech Republic : 1.0 1.2 1.2 1.2 1.2 1.2 1.2 1.1 1.1 1.1 1.1 1.0 Denmark 6.4 4.1 2.3 3.0 2.6 2.3 1.8 1.7 1.6 1.3 1.4 1.1 1.2 Estonia : 0.3 0.2 0.2 0.2 0.2 0.2 0.2 0.2 0.1 0.1 0.1 0.1 Cyprus : : 3.3 3.2 3.4 3.3 3.4 3.3 3.3 3.1 3.1 3.1 3.1 Latvia : 0.8 0.6 0.7 0.7 0.7 0.6 0.6 0.5 0.5 0.4 0.5 0.3 Lithuania : 1.3 1.0 1.3 1.3 0.9 0.8 0.8 0.5 0.8 0.6 0.8 0.8 Hungary : 6.8 4.1 4.0 4.1 4.4 4.1 4.0 3.9 4.5 4.1 4.3 3.9 Malta : : 3.7 3.6 3.5 3.7 3.8 3.8 3.7 3.5 3.3 3.5 3.3 Poland : 3.5 2.8 2.9 3.0 2.8 2.8 2.4 2.4 2.4 2.6 2.4 2.6 Romania : : 1.5 2.5 1.6 1.4 1.1 1.0 0.8 1.0 0.7 0.9 0.8 Slovakia : 3.3 2.2 3.5 2.5 2.2 1.5 1.7 1.4 2.0 1.3 2.0 1.3 Sweden 6.0 4.7 2.0 2.9 2.1 1.6 1.7 1.7 1.7 1.7 1.9 1.8 1.7 United Kingdom 3.2 3.0 2.0 2.0 2.0 2.0 2.1 2.0 2.0 2.0 2.1 2.1 2.1 EU27 : : 2.9 3.1 3.0 2.8 2.7 2.6 2.6 2.6 2.6 2.6 2.6 USA 4.8 4.0 2.8 3.0 2.8 2.7 2.8 2.9 2.8 3.0 2.8 3.1 2.8 Japan 3.6 3.4 2.7 3.0 2.7 2.5 2.4 3.7 2.6 4.0 2.7 4.3 3.0
¹ ESA 79 up to 1994, ESA 95 from 1995 onwards.

- 146 -
TABLE 39 : Primary balance, general government (as a percentage of GDP, 1992-2008) ¹ ² 23.04.2007
5-year averages 2006 2007 20081992-96 1997-01 2002-06 2002 2003 2004 2005 X-2006 IV-2007 X-2006 IV-2007 X-2006 IV-2007
Belgium 4.2 6.5 4.4 5.7 5.4 4.7 2.0 3.9 4.3 3.4 3.8 3.2 3.5 Germany 0.3 1.7 -0.4 -0.7 -1.1 -0.9 -0.5 0.4 1.1 1.1 2.2 1.5 2.5 Ireland 4.0 5.0 2.2 0.9 1.6 2.6 2.0 2.2 3.9 1.9 2.5 1.4 2.0 Greece 1.8 4.0 -0.2 0.8 -0.7 -2.5 -0.6 2.0 2.0 1.8 2.0 1.7 1.5 Spain -0.8 1.9 2.6 2.4 2.3 1.9 2.9 3.1 3.4 2.7 3.0 2.3 2.7 France -1.5 1.0 -0.6 -0.3 -1.3 -0.9 -0.3 -0.1 0.0 0.0 0.1 0.4 0.5 Italy 3.0 5.1 1.2 2.7 1.6 1.3 0.3 -0.1 0.1 1.8 2.7 1.7 2.5 Luxembourg 1.9 4.9 0.4 2.4 0.6 -1.1 -0.1 -1.3 0.3 -0.3 0.6 -0.1 0.8 Netherlands 2.4 4.1 1.2 0.8 -0.6 0.7 2.1 2.3 2.9 2.3 1.5 2.3 2.1 Austria -0.1 2.0 1.7 2.6 1.3 1.6 1.3 1.4 1.6 1.5 1.8 1.5 1.7 Portugal 1.1 0.0 -1.1 0.0 -0.2 -0.7 -3.4 -1.7 -1.1 -1.0 -0.6 -0.7 -0.2 Slovenia : : -0.2 -0.2 -0.7 -0.5 0.2 -0.1 0.2 -0.2 -0.1 -0.3 -0.1 Finland -1.8 6.0 4.8 6.2 4.2 3.8 4.2 4.3 5.3 4.2 5.1 4.1 4.9 Euro area : : 0.7 1.0 0.2 0.3 0.5 0.9 1.3 1.4 1.9 1.5 2.0 Bulgaria : 5.2 3.0 1.9 1.3 4.0 3.4 4.7 4.6 2.9 3.1 2.7 3.0 Czech Republic : -3.4 -3.4 -5.5 -5.5 -1.7 -2.4 -2.3 -1.8 -2.4 -2.8 -2.1 -2.6 Denmark 3.9 5.0 4.5 3.2 2.6 4.3 6.5 5.7 5.8 5.6 5.0 5.3 4.7 Estonia : -0.3 2.4 0.6 2.3 2.5 2.5 2.7 3.9 1.8 3.8 1.4 3.6 Cyprus : : -0.4 -1.2 -2.9 -0.8 1.1 1.4 1.7 1.4 1.7 1.4 1.7 Latvia : -1.0 -0.3 -1.5 -0.9 -0.3 0.3 -0.4 0.9 -0.7 0.6 -0.7 0.4 Lithuania : -3.3 -0.1 -0.6 0.0 -0.6 0.3 -0.2 0.2 -0.4 0.2 -0.5 -0.3 Hungary : 1.6 -3.8 -4.9 -3.2 -2.1 -3.7 -6.1 -5.3 -2.9 -2.7 -1.4 -1.0 Malta : : -1.6 -1.9 -6.5 -1.2 0.7 0.9 1.1 0.7 1.2 0.6 1.8 Poland : -0.3 -2.3 -2.1 -3.3 -2.9 -1.5 0.2 -1.5 0.4 -0.9 0.6 -0.8 Romania : : -0.2 0.5 0.1 -0.1 -0.3 -0.4 -1.1 -1.7 -2.5 -1.7 -2.5 Slovakia : -4.0 -1.6 -4.1 -0.2 -0.2 -1.3 -1.7 -2.0 -1.1 -1.5 -0.9 -1.5 Sweden -1.8 6.0 2.6 1.7 1.2 2.4 3.8 4.5 3.9 4.1 4.1 4.3 4.1 United Kingdom -2.9 3.9 -0.7 0.4 -1.2 -1.2 -1.0 -0.9 -0.7 -0.8 -0.6 -0.4 -0.2 EU27 : : 0.4 0.7 -0.1 0.1 0.3 0.7 1.0 1.1 1.4 1.2 1.6 USA 0.6 4.3 -1.0 -0.8 -2.1 -1.9 -0.9 0.7 0.6 0.6 0.3 0.3 -0.1 Japan 1.1 -3.9 -4.0 -5.0 -5.2 -3.6 -4.0 -1.9 -2.1 -1.2 -1.2 -0.4 -0.5
¹ ESA 79 up to 1994, ESA 95 from 1995 onwards. The primary balance includes one-off proceeds relative to UMTS licences (see note 10 on concepts and sources).² Net lending/borrowing excluding interest expenditure.
TABLE 40 : Cyclically adjusted net lending (+) or net borrowing (-), general government (as a percentage of GDP, 1992-2008)5-year averages 2006 2007 2008
1992-96 1997-01 2002-06 2002 2003 2004 2005 X-2006 IV-2007 X-2006 IV-2007 X-2006 IV-2007 Belgium -4.8 -0.8 -0.2 -0.1 0.5 -0.1 -1.7 0.1 0.5 -0.1 0.1 -0.1 0.1 Germany -3.2 -1.6 -2.7 -3.6 -3.2 -2.9 -2.3 -2.2 -1.5 -1.4 -0.8 -1.2 -0.7 Ireland 0.1 1.2 0.7 -1.7 -0.2 1.3 1.1 1.7 3.0 1.6 1.8 1.5 1.6 Greece -10.1 -4.1 -5.9 -5.2 -6.4 -8.6 -6.1 -3.3 -3.3 -3.3 -3.1 -3.1 -3.4 Spain -4.4 -2.0 0.6 -0.7 -0.1 0.1 1.6 1.9 2.3 1.6 1.8 1.4 1.7 France -4.3 -2.4 -3.2 -3.6 -4.1 -3.7 -2.6 -2.3 -2.0 -2.3 -2.0 -1.8 -1.5 Italy -7.8 -2.5 -3.4 -3.3 -3.4 -3.2 -3.4 -4.1 -3.8 -2.4 -1.6 -2.5 -1.8 Luxembourg : 4.3 0.8 1.5 1.3 -0.1 1.0 -1.1 0.5 -0.2 0.6 0.1 0.8 Netherlands -2.6 -0.9 -0.6 -1.9 -2.2 -1.0 0.7 0.6 1.1 0.4 -0.4 0.3 0.1 Austria -3.9 -1.8 -0.8 -0.2 -0.9 -0.6 -1.1 -1.2 -1.0 -1.2 -1.1 -1.0 -1.2 Portugal -4.1 -3.9 -3.3 -3.4 -2.4 -2.7 -5.1 -3.7 -2.9 -3.2 -2.7 -3.2 -2.6 Slovenia : : -1.7 -2.3 -2.0 -1.8 -1.1 -1.5 -1.5 -1.6 -1.7 -1.7 -1.7 Finland -3.2 1.8 3.5 4.2 3.4 3.0 3.6 2.9 3.7 2.8 3.5 2.9 3.6 Euro area : : -2.2 -2.7 -2.7 -2.4 -1.8 -1.7 -1.2 -1.2 -0.8 -1.0 -0.7 Bulgaria : : 0.9 -0.2 -0.9 1.6 1.3 : 2.8 : 1.6 : 1.8 Czech Republic : -3.6 -3.9 -5.7 -5.5 -1.9 -3.1 -3.8 -3.1 -4.1 -4.1 -3.8 -3.8 Denmark -1.5 0.0 2.6 0.4 1.0 2.9 5.0 4.1 4.0 4.5 3.6 4.6 3.8 Estonia : -0.2 2.3 0.5 2.4 2.8 2.4 2.2 3.3 1.4 3.5 1.5 3.8 Cyprus : : -3.6 -5.0 -6.1 -3.8 -1.9 -1.4 -1.2 -1.2 -1.1 -1.2 -1.1 Latvia : -1.8 -0.9 -2.1 -1.3 -0.7 -0.2 -1.3 0.0 -1.3 0.0 -0.9 0.4 Lithuania : -4.2 -1.4 -1.6 -1.8 -2.0 -0.9 -1.4 -0.6 -1.4 -0.6 -1.2 -1.0 Hungary : -5.0 -7.9 -8.6 -6.9 -6.5 -8.0 -10.5 -9.6 -7.4 -6.9 -5.4 -4.7 Malta : : -4.7 -6.2 -9.2 -3.6 -2.2 -2.3 -2.0 -2.3 -1.9 -2.7 -1.6 Poland : -3.8 -4.8 -4.2 -5.7 -5.8 -4.2 -2.3 -4.0 -2.1 -3.6 -1.8 -3.3 Romania : : -1.3 -0.7 -0.6 -1.7 -1.2 : -2.2 : -3.5 : -3.3 Slovakia : -7.1 -3.2 -6.9 -1.9 -1.7 -2.1 -3.2 -3.3 -3.3 -3.4 -3.3 -3.3 Sweden -5.9 1.3 1.0 -0.8 0.2 1.2 2.5 2.7 2.1 2.1 1.9 2.1 1.9 United Kingdom -5.5 0.6 -2.8 -1.7 -3.2 -3.4 -2.9 -2.7 -2.6 -2.6 -2.5 -2.2 -2.1 EU27 : : -2.2 -2.5 -2.7 -2.5 -1.8 : -1.4 : -1.1 : -0.9

- 147 -
TABLE 41 : Cyclically adjusted primary balance, general government (as a percentage of GDP, 1992-2008) 23.04.2007
5-year averages 2006 2007 20081992-96 1997-01 2002-06 2002 2003 2004 2005 X-2006 IV-2007 X-2006 IV-2007 X-2006 IV-2007
Belgium 4.7 6.2 4.6 5.7 5.8 4.6 2.5 4.2 4.6 3.8 4.1 3.6 3.9 Germany 0.1 1.6 0.2 -0.6 -0.2 -0.1 0.4 0.5 1.3 1.3 2.0 1.5 2.0 Ireland 5.7 3.8 1.9 -0.4 1.0 2.5 2.2 2.8 4.0 2.7 2.9 2.5 2.6 Greece 2.5 4.6 -0.6 0.9 -1.0 -3.1 -1.2 1.3 1.3 1.1 1.3 0.9 0.8 Spain 0.4 1.8 2.7 2.0 2.3 2.1 3.4 3.5 3.9 3.1 3.4 2.9 3.2 France -0.9 0.7 -0.5 -0.7 -1.3 -0.9 0.1 0.3 0.5 0.4 0.5 0.9 1.0 Italy 3.5 4.8 1.5 2.2 1.8 1.5 1.2 0.5 0.8 2.4 3.2 2.2 3.0 Luxembourg : 4.6 1.0 1.7 1.5 0.0 1.2 -0.9 0.6 0.0 0.8 0.3 1.0 Netherlands 3.1 3.2 1.9 0.9 0.4 1.5 3.1 2.9 3.4 2.6 1.7 2.3 2.1 Austria 0.0 1.6 2.1 2.9 2.0 2.2 1.8 1.5 1.7 1.4 1.5 1.5 1.4 Portugal 1.7 -0.7 -0.6 -0.6 0.3 -0.1 -2.4 -0.8 -0.1 -0.2 0.2 0.0 0.3 Slovenia : : 0.2 0.0 0.1 0.1 0.6 0.1 0.0 -0.2 -0.3 -0.4 -0.3 Finland 0.9 5.0 5.2 6.2 5.1 4.5 5.1 4.2 5.1 4.2 4.9 4.2 5.0 Euro area : : 1.0 0.7 0.6 0.7 1.1 1.2 1.7 1.7 2.1 1.8 2.2 Bulgaria : : 2.7 1.9 1.3 3.5 2.9 : 4.1 : 2.8 : 2.9 Czech Republic : -2.6 -2.7 -4.5 -4.4 -0.7 -2.0 -2.7 -2.0 -3.0 -3.0 -2.6 -2.8 Denmark 4.8 4.1 4.9 3.4 3.6 5.2 6.8 5.8 5.6 5.9 5.0 5.7 5.0 Estonia : 0.1 2.4 0.7 2.6 3.0 2.6 2.3 3.4 1.5 3.6 1.6 3.9 Cyprus : : -0.3 -1.8 -2.7 -0.5 1.6 1.8 2.1 1.9 2.1 1.9 2.0 Latvia : -0.9 -0.2 -1.4 -0.7 0.0 0.4 -0.7 0.5 -0.8 0.4 -0.4 0.8 Lithuania : -2.9 -0.4 -0.3 -0.6 -1.1 -0.1 -0.6 -0.2 -0.6 0.1 -0.4 -0.2 Hungary : 1.9 -3.8 -4.6 -2.8 -2.1 -3.9 -6.5 -5.7 -2.9 -2.8 -1.2 -0.8 Malta : : -1.0 -2.6 -5.8 0.1 1.7 1.5 1.7 1.1 1.4 0.7 1.7 Poland : -0.3 -2.0 -1.3 -2.8 -3.1 -1.4 0.1 -1.5 0.3 -1.0 0.6 -0.7 Romania : : 0.2 1.7 1.0 -0.3 -0.1 : -1.4 : -2.8 : -2.5 Slovakia : -3.8 -0.9 -3.4 0.6 0.5 -0.6 -1.5 -1.9 -1.4 -2.0 -1.3 -2.0 Sweden 0.1 6.1 3.0 2.1 2.2 2.8 4.2 4.4 3.8 3.8 3.7 3.9 3.6 United Kingdom -2.3 3.6 -0.7 0.3 -1.2 -1.4 -0.8 -0.8 -0.6 -0.5 -0.4 -0.1 0.0 EU27 : : 0.7 0.6 0.3 0.4 0.9 : 1.3 : 1.6 : 1.7
TABLE 42 : Gross debt, general government (as a percentage of GDP, 1999-2008)2006 2007 2008
1999 2000 2001 2002 2003 2004 2005 X-2006 IV-2007 X-2006 IV-2007 X-2006 IV-2007 Belgium 113.6 107.7 106.3 103.3 98.6 94.3 93.2 89.4 89.1 86.3 85.6 83.2 82.6 Germany 60.9 59.7 58.8 60.3 63.9 65.7 67.9 67.8 67.9 67.7 65.4 67.3 63.6 Ireland 48.4 37.8 35.5 32.2 31.2 29.7 27.4 25.8 24.9 24.4 23.0 23.6 21.7 Greece 112.3 111.6 113.2 110.7 107.8 108.5 107.5 104.8 104.6 101.0 100.9 96.4 97.6 Spain 61.5 59.2 55.5 52.5 48.8 46.2 43.2 39.7 39.9 37.0 37.0 34.7 34.6 France 58.3 56.7 56.2 58.2 62.4 64.3 66.2 64.7 63.9 63.9 62.9 63.3 61.9 Italy 113.7 109.1 108.7 105.6 104.3 103.8 106.2 107.2 106.8 105.9 105.0 105.7 103.1 Luxembourg 6.7 6.4 6.5 6.5 6.3 6.6 6.1 7.4 6.8 7.3 6.7 7.1 6.0 Netherlands 61.1 53.8 50.7 50.5 52.0 52.6 52.7 50.5 48.7 47.8 47.7 45.4 45.9 Austria 66.5 65.5 66.0 65.8 64.6 63.9 63.5 62.1 62.2 60.9 60.6 59.8 59.2 Portugal 51.4 50.4 52.9 55.5 56.8 58.2 63.6 67.4 64.7 69.4 65.4 70.7 65.8 Slovenia 24.6 27.6 28.3 29.1 28.6 28.9 28.4 28.4 27.8 28.0 27.5 27.6 27.2 Finland 45.5 43.8 42.3 41.3 44.3 44.1 41.4 38.8 39.1 37.3 37.0 35.8 35.2 Euro area 71.8 69.2 68.2 68.0 69.2 69.7 70.5 69.4 69.0 68.0 66.9 66.9 65.0 Bulgaria : : : 53.6 45.9 37.9 29.2 25.8 22.8 21.8 20.9 17.9 19.0 Czech Republic 16.4 18.5 25.1 28.5 30.1 30.7 30.4 30.9 30.4 30.8 30.6 31.0 30.9 Denmark 57.4 51.7 47.4 46.8 45.8 44.0 36.3 28.5 30.2 24.5 25.0 22.0 20.0 Estonia 6.0 5.2 4.8 5.6 5.7 5.2 4.4 4.0 4.1 2.7 2.7 2.1 2.3 Cyprus 58.7 58.8 60.7 64.7 69.1 70.3 69.2 64.8 65.3 62.2 61.5 59.6 54.8 Latvia 12.5 12.3 14.0 13.5 14.4 14.5 12.0 11.1 10.0 10.6 8.0 10.3 6.7 Lithuania 22.8 23.7 22.8 22.2 21.2 19.4 18.6 18.9 18.2 19.6 18.6 19.8 19.9 Hungary 59.5 54.2 52.1 55.6 58.0 59.4 61.7 67.6 66.0 70.9 67.1 72.7 68.1 Malta 56.4 56.0 62.1 60.8 70.4 73.9 72.4 69.6 66.5 69.0 65.9 68.6 64.3 Poland 39.3 35.9 35.9 39.8 47.1 45.7 47.1 42.4 47.8 43.1 48.4 42.7 49.1 Romania 24.0 23.9 23.2 25.0 21.5 18.8 15.8 13.7 12.4 13.9 12.8 14.4 13.1 Slovakia 47.5 50.2 48.9 43.3 42.4 41.5 34.5 33.0 30.7 31.6 29.7 31.0 29.4 Sweden 62.2 52.3 53.8 52.0 53.5 52.4 52.2 46.7 46.9 42.6 42.1 38.7 37.7 United Kingdom 44.0 41.2 38.0 37.4 38.8 40.3 42.2 43.2 43.5 44.1 44.0 44.7 44.5 EU27 : : : 60.2 61.8 62.2 62.9 62.1 61.7 60.9 59.9 59.9 58.3Note that the new forecasts for DK, PL and SE are not comparable with those of autumn 2006, since the transitory period granted by Eurostat has ended.Government debt now includes government liabilities held by mandatory defined-benefit pension schemes.

- 148 -
TABLE 43 : Gross national saving (as a percentage of GDP, 1992-2008) 23.04.2007
5-year averages 2006 2007 20081992-96 1997-01 2002-06 2002 2003 2004 2005 X-2006 IV-2007 X-2006 IV-2007 X-2006 IV-2007
Belgium 24.8 25.7 23.8 24.2 23.6 23.9 23.4 23.5 23.8 23.6 24.2 24.0 24.5 Germany 21.2 20.3 20.7 19.4 19.5 21.0 21.4 22.1 22.4 22.8 23.9 22.9 24.0 Ireland 17.7 22.6 23.6 21.3 23.5 23.4 23.9 24.3 25.7 23.7 24.3 23.4 23.8 Greece 19.3 16.3 14.9 13.9 15.2 15.7 14.6 16.3 15.0 17.0 15.6 17.7 16.2 Spain 20.6 22.3 22.6 22.9 23.4 22.4 22.1 22.0 22.0 21.8 22.1 21.9 22.1 France 19.0 21.1 19.0 19.8 19.1 18.8 18.1 18.7 19.1 19.1 19.8 19.3 20.2 Italy 20.6 21.3 19.9 20.8 19.8 20.3 19.4 19.8 19.2 20.4 19.7 20.7 19.7 Luxembourg 35.0 33.4 31.0 33.5 29.9 32.9 32.5 30.7 26.4 31.5 28.4 32.0 29.8 Netherlands 25.8 27.1 27.0 25.7 25.4 27.8 26.4 27.0 29.8 27.8 29.5 28.0 29.4 Austria 21.3 22.1 23.7 23.3 23.2 23.3 23.9 24.4 24.7 24.4 24.9 24.4 25.0 Portugal 20.3 18.3 14.6 16.7 16.4 15.0 12.8 12.6 12.1 12.8 12.2 13.4 12.8 Slovenia 23.3 24.2 24.3 24.4 23.9 24.2 24.1 24.2 24.8 25.2 25.3 25.7 25.8 Finland 17.9 26.8 26.4 28.3 24.4 26.5 25.5 26.1 27.3 26.2 27.8 26.0 27.8 Euro area 20.9 21.6 21.0 20.9 20.6 21.2 20.8 21.3 21.5 21.7 22.2 21.9 22.3 Bulgaria : : 16.4 16.7 15.8 17.2 16.2 16.2 16.2 17.2 16.0 19.0 15.6 Czech Republic 28.1 24.9 22.2 22.4 20.7 21.2 23.4 23.4 23.1 24.5 23.4 25.1 23.8 Denmark 19.9 22.0 23.8 22.9 23.1 23.0 24.4 24.5 25.4 25.1 25.6 25.5 26.1 Estonia : 21.1 23.6 22.0 21.8 22.3 25.8 27.2 26.4 29.9 26.0 32.2 25.5 Cyprus : 15.7 14.6 15.1 15.2 15.2 13.8 14.8 13.7 14.9 14.5 15.1 14.9 Latvia 30.9 16.1 19.9 20.0 20.6 20.3 21.8 21.9 17.0 22.6 17.0 24.0 18.6 Lithuania : 14.2 16.8 16.9 16.5 16.4 18.1 17.2 16.2 17.1 14.2 18.0 13.1 Hungary : 20.4 17.2 18.9 17.0 17.2 16.5 15.7 16.2 17.5 18.5 19.4 20.5 Malta : 15.1 13.8 17.0 14.7 10.6 13.3 11.6 13.5 12.0 14.8 11.8 15.5 Poland 17.2 19.7 16.9 16.1 16.6 15.7 17.5 17.8 18.2 18.6 19.8 20.0 20.5 Romania 22.9 14.3 16.9 20.6 17.1 18.8 14.0 14.1 14.0 14.0 13.8 13.3 14.6 Slovakia : 23.8 22.0 21.7 22.5 23.5 21.3 21.3 21.2 23.6 23.9 24.6 24.4 Sweden 17.5 21.5 23.1 21.9 23.0 22.8 23.0 23.9 24.9 24.2 26.1 24.4 26.3 United Kingdom 15.1 16.0 15.0 15.3 15.1 15.3 14.7 15.1 14.5 15.4 14.4 15.5 14.4 EU27 : : 19.9 19.9 19.7 20.1 19.7 20.2 20.3 20.6 20.9 20.9 21.0 USA 16.4 16.9 13.4 13.6 13.3 13.2 13.0 13.8 13.8 13.8 13.3 13.9 13.3 Japan 31.6 28.5 26.7 25.9 26.1 26.8 27.0 27.3 27.8 27.4 28.7 27.4 29.1
TABLE 44 : Gross saving, private sector (as a percentage of GDP, 1992-2008) ¹5-year averages 2006 2007 2008
1992-96 1997-01 2002-06 2002 2003 2004 2005 X-2006 IV-2007 X-2006 IV-2007 X-2006 IV-2007 Belgium 28.0 23.8 22.2 22.3 22.8 22.6 21.6 22.1 21.9 22.2 22.6 22.6 22.9 Germany 20.8 19.6 21.5 20.3 20.8 22.3 22.2 22.2 21.9 22.3 22.3 22.0 22.1 Ireland 17.6 17.2 18.9 17.7 19.6 18.7 19.3 19.5 19.0 18.8 18.6 18.8 18.4 Greece 26.1 16.8 16.6 14.6 17.0 18.5 17.0 15.6 16.1 16.3 16.0 16.6 16.9 Spain 21.8 20.2 18.0 19.0 19.5 18.4 16.9 16.4 16.2 16.4 16.4 16.7 16.6 France 20.1 19.6 18.8 19.5 19.8 19.0 17.8 17.7 17.9 17.9 18.3 17.6 18.1 Italy 25.6 20.6 20.0 20.6 20.7 20.8 20.1 19.5 18.0 19.3 17.9 19.8 18.0 Luxembourg : 24.4 25.0 25.4 23.8 28.3 26.7 25.7 20.7 26.0 22.6 26.4 23.9 Netherlands 26.2 24.1 25.0 23.9 24.7 26.6 23.6 23.4 26.1 23.5 26.3 23.5 25.7 Austria 20.7 20.0 21.6 20.6 21.6 21.1 22.2 22.6 22.7 22.5 22.8 22.4 22.9 Portugal 21.6 17.8 16.4 17.0 17.8 17.5 16.0 14.8 13.6 14.5 13.1 14.9 13.4 Slovenia : : 22.1 22.9 22.0 22.0 21.4 20.9 22.0 21.7 22.9 22.1 23.8 Finland 19.9 21.1 20.8 21.5 19.4 21.6 20.5 20.9 21.1 21.0 21.8 20.9 21.9 Euro area : : 20.3 20.2 20.6 20.9 20.1 19.8 19.6 19.9 19.9 19.8 19.8 Bulgaria : : 11.6 14.1 12.7 11.5 10.3 8.9 9.4 10.9 10.7 12.2 10.2 Czech Republic : 21.5 19.4 20.5 19.2 17.1 19.9 20.0 20.3 21.2 20.9 21.6 20.9 Denmark 20.4 19.4 20.2 21.1 21.7 19.6 18.3 19.0 20.0 19.5 20.7 19.9 21.3 Estonia : 16.3 18.2 16.3 15.6 17.5 21.3 21.5 20.5 25.1 19.8 27.7 19.5 Cyprus : : 14.9 15.9 17.6 15.9 13.6 13.2 11.5 13.2 12.2 13.3 12.6 Latvia : 15.2 17.2 19.0 19.5 17.6 18.0 17.4 12.1 18.2 12.3 19.4 13.6 Lithuania : 12.8 14.6 15.3 14.7 14.5 15.7 14.8 13.0 14.8 10.2 15.6 8.9 Hungary : 19.9 19.5 19.4 19.1 19.3 19.6 20.2 19.9 20.0 20.4 20.6 21.1 Malta : : 15.3 18.1 16.9 12.5 14.9 13.3 14.2 12.4 14.3 12.2 14.7 Poland : 19.4 17.6 16.9 18.3 17.4 17.9 15.8 17.8 16.2 18.5 17.3 19.2 Romania : : 13.7 17.4 13.4 15.5 10.7 10.9 11.6 11.7 11.7 11.1 12.2 Slovakia : 22.0 22.0 22.4 22.2 23.3 20.3 21.2 21.6 23.2 23.9 24.1 24.1 Sweden 21.4 17.3 19.7 20.2 21.1 19.2 18.0 18.2 19.9 19.0 20.5 19.0 20.5 United Kingdom 18.5 14.0 15.6 15.2 16.1 16.3 15.7 15.5 14.8 15.2 14.3 15.1 14.1 EU27 : : 19.3 19.2 19.8 19.9 19.1 18.8 18.7 18.9 18.8 18.9 18.8 USA 18.4 14.3 14.5 14.8 15.4 15.2 14.1 12.7 13.0 12.9 12.5 13.4 12.8 Japan 26.6 27.7 28.4 28.1 28.5 29.4 28.3 30.2 27.8 30.2 28.3 30.0 28.6
¹ ESA 79 up to 1994, ESA 95 from 1995 onwards.

- 149 -
TABLE 45 : Gross saving, general government (as a percentage of GDP, 1992-2008) ¹ 23.04.2007
5-year averages 2006 2007 20081992-96 1997-01 2002-06 2002 2003 2004 2005 X-2006 IV-2007 X-2006 IV-2007 X-2006 IV-2007
Belgium -3.2 1.8 1.6 2.0 0.8 1.4 1.9 1.4 2.0 1.5 1.6 1.5 1.6 Germany 0.4 0.7 -0.7 -0.8 -1.3 -1.3 -0.9 -0.1 0.6 0.5 1.6 0.9 2.0 Ireland 0.1 5.5 4.7 3.5 3.9 4.7 4.7 4.8 6.6 4.8 5.7 4.6 5.4 Greece -6.8 -0.5 -1.7 -0.7 -1.7 -2.9 -2.2 0.6 -0.8 0.6 -0.3 0.9 -0.6 Spain -1.1 2.1 4.7 3.9 3.9 4.1 5.2 5.6 6.4 5.4 5.7 5.2 5.5 France -1.1 1.5 0.2 0.3 -0.7 -0.1 0.3 1.0 1.2 1.2 1.6 1.8 2.0 Italy -5.0 0.7 0.0 0.3 -0.8 -0.4 -0.5 0.4 1.3 1.0 1.8 0.9 1.6 Luxembourg : 9.0 6.1 8.1 6.2 4.5 5.7 4.5 5.7 5.4 5.8 5.5 5.9 Netherlands -0.4 3.0 2.1 1.8 0.7 1.3 2.9 3.7 3.7 4.3 3.3 4.6 3.7 Austria 0.6 2.1 2.2 2.9 1.8 2.3 1.8 1.9 2.1 2.0 2.2 2.0 2.2 Portugal -1.3 0.6 -1.8 -0.3 -1.4 -2.4 -3.2 -2.2 -1.5 -1.7 -1.0 -1.5 -0.7 Slovenia : : 2.2 1.5 1.8 2.2 2.6 3.3 2.7 3.5 2.4 3.5 2.0 Finland -2.0 5.6 5.7 6.8 5.2 5.1 5.2 5.4 6.3 5.4 6.1 5.3 6.1 Euro area : : 0.7 0.7 0.0 0.2 0.7 1.4 1.9 1.8 2.3 2.0 2.5 Bulgaria : 6.5 4.8 2.6 3.1 5.7 5.9 7.3 6.8 6.3 5.3 6.8 5.4 Czech Republic : 3.3 2.8 2.0 1.4 4.1 3.5 3.4 3.2 3.3 2.4 3.4 2.6 Denmark -0.6 2.7 3.7 1.8 1.4 3.4 6.1 5.7 5.8 5.8 5.0 5.7 4.9 Estonia : 4.8 5.6 5.7 6.2 4.8 4.5 5.7 6.9 4.8 6.2 4.4 6.0 Cyprus : : -0.3 -0.9 -2.3 -0.6 0.3 1.5 2.3 1.7 2.3 1.7 2.3 Latvia : 0.9 2.7 1.0 1.1 2.7 3.9 4.5 4.9 4.4 4.7 4.6 5.0 Lithuania : 1.4 2.2 1.6 1.8 2.0 2.5 2.3 3.2 2.2 4.0 2.3 4.2 Hungary : 0.5 -2.3 -0.5 -2.1 -2.1 -3.2 -4.5 -3.6 -2.5 -2.0 -1.2 -0.7 Malta : : -1.5 -1.2 -2.1 -1.8 -1.6 -1.8 -0.8 -0.4 0.5 -0.4 0.8 Poland : 0.3 -0.8 -0.8 -1.7 -1.7 -0.4 2.0 0.5 2.4 1.3 2.7 1.3 Romania : : 3.2 3.2 3.7 3.3 3.3 3.3 2.4 2.3 2.1 2.3 2.4 Slovakia : 1.8 0.1 -0.7 0.3 0.3 1.0 0.2 -0.4 0.4 0.1 0.5 0.3 Sweden -3.8 4.2 3.7 2.0 2.2 3.7 5.2 5.8 5.5 5.4 5.6 5.5 5.8 United Kingdom -3.4 2.0 -0.6 0.1 -1.0 -0.9 -1.0 -0.3 -0.3 0.2 0.1 0.4 0.4 EU27 : : 0.6 0.6 -0.1 0.2 0.6 1.4 1.6 1.7 2.0 2.0 2.2 USA -1.9 2.6 -1.1 -1.2 -2.2 -2.0 -1.1 1.1 0.9 0.9 0.7 0.5 0.5 Japan 5.0 0.8 -1.7 -2.1 -2.4 -2.6 -1.3 -2.9 0.0 -2.7 0.4 -2.5 0.5
¹ ESA 79 up to 1994, ESA 95 from 1995 onwards.
TABLE 46 : Exports of goods and services, volume (percentage change on preceding year, 1992-2008)5-year averages 2006 2007 2008
1992-96 1997-01 2002-06 2002 2003 2004 2005 X-2006 IV-2007 X-2006 IV-2007 X-2006 IV-2007 Belgium 3.9 5.2 3.2 1.2 2.9 5.9 2.8 5.3 3.5 4.9 5.6 4.6 5.1 Germany 2.8 9.1 7.1 4.3 2.4 9.6 6.9 10.1 12.5 6.7 8.7 6.6 7.1 Ireland 14.2 16.9 4.2 4.3 0.5 7.3 3.9 4.7 4.9 5.2 5.3 5.0 4.9 Greece 4.2 11.0 2.6 -7.7 1.0 11.7 2.9 6.6 6.2 5.9 6.1 5.6 5.9 Spain 10.3 8.9 3.5 2.0 3.7 4.1 1.5 6.9 6.2 4.9 5.8 5.4 5.4 France 5.2 8.1 2.6 1.5 -1.2 3.9 3.1 8.0 6.0 6.0 5.5 5.7 5.6 Italy 7.4 2.4 0.3 -4.0 -2.4 3.3 -0.5 5.9 5.3 4.1 4.9 4.0 4.5 Luxembourg 4.4 10.7 7.6 2.1 3.5 10.1 8.0 14.4 14.9 9.7 9.0 8.9 8.4 Netherlands 5.9 8.3 4.7 0.9 1.5 8.0 5.5 8.2 7.5 6.8 6.0 6.5 5.5 Austria 3.1 8.7 6.1 4.0 2.0 10.0 6.4 3.9 8.5 6.1 7.4 5.8 6.9 Portugal 4.5 5.5 3.9 1.5 3.9 4.4 1.1 7.9 8.8 5.4 6.8 5.5 5.9 Slovenia -2.1 7.9 8.5 6.7 3.1 12.5 10.5 10.3 10.0 8.4 9.0 8.0 8.1 Finland 10.7 10.6 5.4 2.8 -1.7 8.6 7.1 11.2 10.7 6.9 6.6 6.1 6.2 Euro area 5.2 7.8 4.4 1.7 1.1 6.9 4.2 7.9 8.2 6.0 6.7 5.8 6.0 Bulgaria : 5.5 9.2 5.2 10.7 12.7 8.5 12.6 9.0 11.2 10.0 11.0 9.6 Czech Republic 9.7 10.3 10.9 2.1 7.2 21.1 10.4 14.0 14.6 10.6 12.1 10.1 10.4 Denmark 3.4 7.2 4.4 4.1 -0.9 2.2 7.2 10.6 9.6 6.9 5.7 6.4 5.2 Estonia : 13.8 11.3 1.7 7.6 17.1 21.5 16.6 10.0 13.6 8.7 12.7 7.8 Cyprus : 6.0 1.2 -4.8 -0.7 5.1 4.7 5.7 2.1 6.2 4.0 6.2 4.0 Latvia : 5.7 9.0 5.4 5.2 9.4 20.3 14.2 5.3 15.0 8.7 12.8 9.0 Lithuania : 6.7 12.0 19.4 6.9 4.4 14.5 14.2 15.4 12.5 10.2 10.6 11.1 Hungary 11.7 16.3 10.9 3.9 6.2 15.7 11.6 13.1 18.0 10.3 13.5 9.3 10.5 Malta : 4.5 1.4 6.1 -2.3 4.9 -2.6 0.6 1.4 2.1 2.7 2.4 2.9 Poland 12.2 9.7 11.1 4.8 14.2 14.0 8.0 16.7 15.1 11.1 10.1 9.5 9.0 Romania 10.4 10.8 11.6 17.5 8.4 13.9 8.1 14.6 10.6 10.7 9.4 12.2 8.1 Slovakia : 10.8 12.4 4.7 15.9 7.9 13.8 13.8 20.7 14.6 19.0 10.3 11.9 Sweden 7.9 8.2 6.5 1.2 4.5 11.1 6.6 8.2 9.1 6.6 7.0 6.0 6.2 United Kingdom 7.2 5.4 5.4 1.0 1.7 4.9 7.9 17.8 11.6 6.7 5.8 6.0 5.4 EU27 : 7.6 5.0 1.9 1.8 7.2 5.3 9.7 9.2 6.5 7.0 6.2 6.2 USA 7.4 4.2 4.7 -2.3 1.3 9.2 6.8 8.5 9.0 7.2 7.0 6.8 7.2 Japan 3.5 2.9 9.4 7.5 9.2 13.9 7.0 9.6 9.5 6.9 7.3 6.3 6.6

- 150 -
TABLE 47 : Imports of goods and services, volume (percentage change on preceding year, 1992-2008) 23.04.2007
5-year averages 2006 2007 20081992-96 1997-01 2002-06 2002 2003 2004 2005 X-2006 IV-2007 X-2006 IV-2007 X-2006 IV-2007
Belgium 3.7 5.1 3.3 0.2 3.0 6.3 3.5 5.0 3.8 4.9 5.4 4.4 4.9 Germany 3.2 7.5 5.6 -1.4 5.4 6.9 6.5 9.8 11.1 5.5 8.5 6.7 7.6 Ireland 12.0 16.9 4.2 2.1 -1.2 8.7 6.5 5.8 5.3 6.0 5.8 4.7 5.1 Greece 3.8 9.4 4.1 -1.4 4.5 9.3 -1.2 6.3 9.8 5.1 6.5 4.9 5.4 Spain 6.4 11.4 7.0 3.7 6.2 9.6 7.0 8.9 8.4 6.9 7.6 6.2 7.0 France 3.2 8.6 4.4 1.7 1.1 6.6 6.1 8.0 6.7 6.3 6.0 6.1 5.6 Italy 1.9 5.2 1.5 -0.5 0.8 2.7 0.5 4.6 4.3 3.9 4.6 3.9 4.5 Luxembourg 3.6 11.1 7.7 1.0 5.5 10.3 9.3 13.8 12.7 10.2 9.5 9.3 8.6 Netherlands 5.3 8.9 4.3 0.3 1.8 6.4 5.1 8.1 8.1 6.9 6.3 6.3 6.2 Austria 3.5 6.7 5.1 0.1 5.1 8.7 5.2 2.9 6.8 5.5 7.3 5.5 6.7 Portugal 5.6 7.7 2.2 -0.7 -0.8 6.6 1.9 2.9 4.3 3.0 3.6 3.6 4.2 Slovenia 3.1 7.7 8.4 4.8 6.7 13.4 7.0 8.7 10.4 7.5 8.7 7.1 7.9 Finland 5.7 8.0 6.2 2.5 3.3 7.8 12.2 7.7 5.4 6.5 6.2 6.0 6.4 Euro area 3.8 7.9 4.6 0.3 3.1 6.7 5.2 7.5 7.7 5.7 6.7 5.8 6.2 Bulgaria : 13.1 12.9 5.7 16.4 14.5 13.1 13.5 15.1 11.6 12.1 11.8 11.6 Czech Republic 20.1 9.8 9.9 5.0 8.0 18.2 4.8 11.3 14.2 9.4 11.0 9.2 10.0 Denmark 4.4 7.2 7.4 7.5 -1.6 6.9 10.7 14.2 14.0 7.6 6.4 6.4 5.3 Estonia : 12.8 12.4 6.0 10.6 15.2 15.9 17.7 14.8 15.4 13.3 13.9 10.8 Cyprus : 4.8 2.5 -0.9 -1.0 9.6 3.1 5.5 2.2 5.5 3.6 5.6 3.9 Latvia : 7.2 13.2 4.7 13.1 16.6 14.8 17.7 17.5 16.3 12.6 11.8 8.4 Lithuania : 7.5 14.8 17.7 10.4 14.9 16.0 17.2 15.4 14.9 14.9 13.0 12.9 Hungary 12.0 16.9 9.9 6.8 9.3 14.1 6.8 9.6 12.6 7.0 10.1 7.2 8.6 Malta : 2.2 2.3 -1.6 7.0 5.4 1.3 2.7 -0.5 2.6 2.7 2.5 1.8 Poland 15.3 9.7 9.3 2.7 9.3 15.2 4.7 16.6 15.4 12.0 13.4 10.5 12.4 Romania 8.1 12.1 17.9 12.0 16.0 22.1 16.6 20.7 23.0 16.0 21.6 14.3 17.1 Slovakia : 9.6 11.0 4.6 7.6 8.8 16.6 12.3 17.8 11.3 15.8 8.2 10.5 Sweden 4.4 7.3 4.9 -1.9 5.0 7.0 6.9 7.8 7.8 7.0 8.2 5.9 6.4 United Kingdom 6.2 8.1 6.4 4.8 2.0 6.6 7.0 16.5 11.8 6.2 5.7 5.5 5.1 EU27 : 8.1 5.4 1.4 3.4 7.4 5.8 9.5 9.1 6.4 7.2 6.2 6.6 USA 8.9 9.2 6.0 3.4 4.1 10.8 6.1 6.6 5.8 4.7 3.2 5.1 5.1 Japan 6.3 1.3 4.6 0.9 3.9 8.1 5.8 7.7 4.5 9.5 7.3 7.5 7.4
TABLE 48 : Merchandise trade balance (fob-fob, as a percentage of GDP, 1992-2008)5-year averages 2006 2007 2008
1992-96 1997-01 2002-06 2002 2003 2004 2005 X-2006 IV-2007 X-2006 IV-2007 X-2006 IV-2007 Belgium 3.3 3.2 2.6 3.8 3.5 2.7 1.6 1.5 1.4 1.5 1.7 1.7 1.9 Germany 2.2 3.6 6.7 6.4 6.1 7.0 7.0 6.9 7.1 7.4 7.8 7.2 7.6 Ireland 16.6 22.3 19.8 25.2 21.8 19.6 16.7 14.7 15.5 13.2 13.7 12.4 12.4 Greece -12.5 -15.6 -16.8 -16.3 -16.7 -17.7 -16.2 -16.9 -17.3 -16.6 -17.2 -16.3 -16.9 Spain -3.3 -4.6 -6.4 -5.0 -5.1 -6.3 -7.5 -8.1 -8.1 -8.7 -8.5 -9.0 -8.7 France 0.6 1.0 -0.7 0.5 0.1 -0.4 -1.4 -2.1 -2.2 -2.1 -2.3 -2.2 -2.3 Italy 2.7 2.1 0.4 1.1 0.7 0.6 0.0 -0.4 -0.7 -0.2 -0.3 0.0 -0.3 Luxembourg -10.2 -12.7 -10.2 -10.6 -11.2 -10.2 -11.1 -9.9 -8.0 -10.2 -7.7 -10.2 -7.5 Netherlands 5.3 5.3 7.1 6.7 6.5 7.1 7.6 8.3 7.7 8.6 7.8 8.9 7.7 Austria -3.3 -1.4 1.3 1.7 0.5 1.2 1.0 1.6 2.0 2.0 2.2 2.3 2.2 Portugal -8.9 -10.6 -9.4 -9.7 -8.1 -9.4 -10.1 -10.0 -9.8 -9.5 -8.7 -9.1 -8.4 Slovenia -1.1 -4.5 -2.9 -1.1 -2.2 -3.8 -3.7 -3.2 -3.7 -2.7 -3.3 -2.1 -3.0 Finland 7.5 10.0 6.9 9.4 7.8 6.7 4.9 5.7 5.7 5.3 5.7 4.8 5.1 Euro area 1.3 1.7 1.6 2.4 2.0 1.8 1.2 0.9 0.8 0.9 1.0 0.8 0.8 Euro area, adjusted ¹ 1.8 1.4 1.3 0.6 0.5 0.3 0.5 0.5 0.5 0.4 Bulgaria -2.6 -5.6 -16.3 -11.3 -13.7 -14.9 -20.2 -20.9 -21.5 -21.3 -22.1 -21.5 -22.7 Czech Republic -5.2 -5.3 -0.8 -2.9 -2.7 -1.0 1.3 1.8 1.1 2.4 2.3 3.2 3.1 Denmark 4.1 3.6 3.3 4.6 4.6 3.7 3.1 1.4 0.4 1.3 0.2 1.6 0.3 Estonia : -16.9 -15.7 -15.2 -16.3 -17.4 -13.5 -15.5 -16.3 -17.5 -17.2 -19.2 -17.3 Cyprus : -24.6 -25.8 -27.3 -23.9 -25.6 -25.0 -27.7 -27.0 -28.6 -26.8 -29.6 -26.6 Latvia -7.1 -14.9 -19.4 -15.8 -17.8 -20.2 -18.9 -22.6 -24.4 -23.8 -24.7 -23.2 -22.6 Lithuania : -11.3 -10.8 -9.4 -9.0 -10.6 -11.1 -12.8 -13.9 -13.0 -15.8 -12.9 -16.7 Hungary -5.6 -4.4 -2.5 -3.2 -3.9 -3.0 -1.7 -1.1 -0.5 0.6 1.6 1.9 2.8 Malta -22.3 -17.6 -15.7 -8.5 -14.0 -16.5 -19.6 -22.4 -19.8 -22.6 -19.0 -22.8 -18.3 Poland -0.1 -6.4 -2.2 -3.7 -2.6 -2.3 -0.9 -1.3 -1.4 -2.0 -2.6 -2.6 -3.9 Romania -7.3 -6.6 -8.8 -5.7 -7.6 -8.7 -9.8 -11.2 -12.1 -12.6 -13.9 -13.9 -14.8 Slovakia : -8.5 -5.5 -9.3 -2.5 -3.8 -5.9 -5.1 -5.9 -2.6 -3.0 -1.5 -2.6 Sweden 4.8 6.9 6.1 6.6 6.1 6.7 5.5 5.4 5.5 5.2 5.6 5.2 5.4 United Kingdom -4.5 -4.4 -5.2 -5.6 -6.0 -6.5 -6.3 -6.9 -6.5 -6.9 EU27 : 0.7 0.3 1.0 0.8 0.5 -0.1 -0.5 -0.6 -0.5 -0.6 -0.7 -0.8 EU27, adjusted ¹ : : : : : : -1.0 : -1.4 : -1.3 : -1.5 USA -2.1 -3.6 -5.7 -4.7 -5.1 -5.8 -6.4 -6.5 -6.4 -6.3 -5.9 -6.3 -6.0 Japan 2.8 2.5 2.5 2.4 2.5 2.9 2.1 1.9 2.5 1.6 2.7 1.5 2.7
¹ See note 8 on concepts and sources.

- 151 -
TABLE 49 : Current account balance (as a percentage of GDP, 1992-2008) 23.04.2007
5-year averages 2006 2007 20081992-96 1997-01 2002-06 2002 2003 2004 2005 X-2006 IV-2007 X-2006 IV-2007 X-2006 IV-2007
Belgium 4.6 4.8 3.6 5.0 4.5 3.6 2.5 2.4 2.3 2.5 2.7 2.9 2.9 Germany -1.1 -0.8 3.4 2.2 2.0 3.9 4.2 4.5 4.7 5.3 5.6 5.4 5.7 Ireland 1.8 -0.7 -1.8 -1.4 0.0 -1.0 -3.1 -3.2 -3.3 -4.1 -3.9 -4.2 -4.4 Greece -0.6 -5.9 -10.0 -9.7 -10.0 -9.5 -9.2 -8.5 -11.4 -8.0 -11.0 -7.5 -10.5 Spain -1.4 -2.4 -5.9 -3.8 -4.0 -5.9 -7.5 -8.6 -8.5 -9.6 -9.1 -10.0 -9.7 France 0.5 1.9 -0.7 0.8 0.2 -0.6 -2.1 -2.1 -2.0 -2.0 -1.9 -2.1 -1.8 Italy 1.0 1.2 -1.0 -0.3 -0.9 -0.5 -1.2 -1.4 -2.0 -1.1 -1.7 -0.8 -1.7 Luxembourg 12.8 10.0 10.2 11.6 8.0 11.8 11.1 11.4 8.6 12.2 10.5 12.8 11.9 Netherlands 4.8 4.8 7.5 6.0 6.1 8.6 7.1 7.6 9.9 8.1 9.2 8.5 9.0 Austria -1.6 -1.0 2.6 2.5 1.7 2.1 2.9 3.0 3.7 2.8 3.2 2.7 3.1 Portugal -3.2 -8.8 -8.5 -8.6 -6.5 -8.0 -9.6 -9.0 -9.8 -8.7 -9.5 -8.3 -9.0 Slovenia 2.6 -1.2 -1.4 1.1 -0.8 -2.6 -2.0 -1.9 -2.7 -1.8 -2.4 -1.4 -2.3 Finland 0.6 7.3 6.9 10.0 5.9 7.7 4.9 5.5 5.9 5.2 6.1 4.7 5.8 Euro area 0.2 0.5 0.4 0.9 0.5 0.8 0.0 -0.1 0.0 0.1 0.2 0.1 0.1 Euro area, adjusted ¹ 0.8 0.4 0.7 -0.1 -0.1 -0.1 0.1 0.1 0.1 0.0 Bulgaria -4.3 -2.7 -8.5 -2.4 -5.5 -6.6 -12.0 -13.9 -15.8 -13.5 -16.6 -12.4 -17.2 Czech Republic -2.1 -4.1 -5.2 -6.1 -6.5 -6.3 -2.7 -3.1 -4.1 -2.3 -3.0 -1.7 -2.7 Denmark 1.8 1.2 3.0 2.5 3.4 3.1 3.6 1.9 2.5 2.1 1.9 2.3 2.3 Estonia : -7.0 -11.9 -10.4 -11.5 -12.5 -11.1 -11.5 -14.2 -10.5 -15.1 -9.6 -14.7 Cyprus : -2.4 -4.5 -3.7 -2.2 -5.0 -5.6 -6.0 -5.9 -5.9 -5.6 -5.9 -5.4 Latvia 6.0 -7.3 -12.3 -6.6 -8.2 -12.9 -12.6 -16.1 -21.1 -17.4 -22.4 -16.6 -21.0 Lithuania : -8.6 -7.4 -5.1 -6.8 -7.5 -6.9 -8.9 -10.7 -9.4 -12.4 -9.1 -13.4 Hungary : -8.0 -7.2 -6.9 -7.9 -8.4 -6.8 -7.3 -5.9 -5.1 -3.5 -3.5 -2.2 Malta : -6.4 -4.2 2.7 -2.8 -6.4 -8.3 -10.9 -6.3 -10.9 -5.6 -11.2 -4.4 Poland 0.6 -4.2 -2.6 -2.5 -2.1 -4.4 -1.7 -2.3 -2.3 -2.7 -3.1 -2.8 -4.3 Romania : -5.0 -6.0 -1.1 -4.8 -5.0 -8.7 -10.3 -10.3 -11.8 -12.1 -13.3 -12.3 Slovakia : -6.3 -5.5 -7.3 -2.1 -2.5 -7.9 -7.8 -7.7 -4.8 -4.2 -3.4 -3.7 Sweden 0.9 4.2 6.3 5.3 6.6 6.5 5.8 6.3 7.0 6.4 7.5 6.5 7.5 United Kingdom -1.6 -1.3 -1.6 -2.4 -2.5 -3.4 -2.6 -3.9 -2.8 -4.1 EU27 : 0.0 -0.1 0.4 0.1 0.2 -0.5 -0.6 -0.7 -0.5 -0.7 -0.5 -0.8 EU27, adjusted ¹ : : : : : : -0.7 : -0.9 : -0.9 : -1.0 USA -1.1 -2.8 -5.4 -4.4 -4.7 -5.6 -6.2 -6.4 -6.1 -6.4 -5.8 -6.5 -6.0 Japan 2.5 2.5 3.5 2.9 3.2 3.7 3.6 3.5 3.9 3.0 4.2 2.7 4.1
¹ See note 8 on concepts and sources.
TABLE 50 : Net lending (+) or net borrowing (-) of the nation (as a percentage of GDP, 1992-2008)5-year averages 2006 2007 2008
1992-96 1997-01 2002-06 2002 2003 2004 2005 X-2006 IV-2007 X-2006 IV-2007 X-2006 IV-2007 Belgium 4.4 4.8 3.5 4.8 4.4 3.6 2.5 2.8 2.4 2.9 2.7 3.3 3.1 Germany -1.1 -0.7 3.4 2.1 2.0 3.9 4.2 4.5 4.7 5.3 5.6 5.4 5.7 Ireland 2.9 0.2 -1.6 -1.0 0.0 -0.8 -3.0 -3.1 -3.2 -4.0 -3.8 -4.1 -4.3 Greece : -4.0 -8.5 -8.6 -8.6 -7.7 -7.7 -7.2 -9.7 -6.7 -9.4 -6.2 -9.0 Spain -0.7 -1.4 -4.9 -2.7 -2.9 -4.8 -6.5 -7.8 -7.7 -9.0 -8.5 -9.5 -9.1 France 0.5 2.0 -0.8 0.8 -0.2 -0.6 -2.1 -2.1 -2.0 -1.9 -1.9 -2.1 -1.8 Italy 1.1 1.4 -0.9 -0.3 -0.7 -0.4 -1.1 -1.3 -1.8 -0.9 -1.5 -0.6 -1.5 Luxembourg : : : : : : : 11.4 8.6 12.2 10.5 12.8 11.9 Netherlands 4.4 4.6 7.3 5.9 5.9 8.4 6.8 7.3 9.5 7.8 8.8 8.2 8.6 Austria -1.7 -1.1 2.5 2.3 1.7 1.9 2.8 2.9 3.5 2.7 3.2 2.6 3.0 Portugal -0.7 -6.5 -6.8 -6.7 -4.1 -6.1 -8.1 -7.4 -8.7 -7.3 -8.4 -7.0 -8.0 Slovenia 2.6 -1.2 -1.3 1.1 -0.8 -2.5 -1.9 -2.1 -2.5 -2.0 -2.2 -1.6 -2.1 Finland 0.7 7.4 7.1 10.1 6.0 7.8 5.1 5.5 6.6 5.3 6.8 4.8 6.5 Euro area 0.3 0.7 0.5 0.9 0.5 0.9 0.1 0.1 0.2 0.2 0.3 0.2 0.2 Euro area, adjusted ¹ 0.8 0.5 0.8 0.0 0.1 0.1 0.2 0.3 0.2 0.2 Bulgaria -4.6 -2.5 -8.0 -3.1 -5.9 -5.1 -10.8 -13.9 -15.1 -13.5 -15.6 -12.4 -15.8 Czech Republic -3.0 -4.0 -5.0 -4.7 -6.3 -6.2 -3.2 -3.6 -4.7 -2.8 -3.5 -2.2 -3.3 Denmark 1.8 1.4 3.1 2.6 3.4 3.1 3.7 2.0 2.5 2.2 1.9 2.3 2.3 Estonia : -7.1 -10.7 -9.9 -10.5 -13.0 -8.4 -10.3 -11.7 -9.2 -12.9 -8.3 -11.9 Cyprus : : : : : : : -5.7 -5.6 -5.7 -5.4 -5.7 -5.2 Latvia 11.9 -7.0 -11.4 -6.4 -7.5 -11.9 -11.2 -14.4 -20.0 -15.4 -20.3 -14.3 -18.7 Lithuania : -8.6 -6.7 -4.7 -6.4 -6.8 -5.9 -7.7 -9.5 -8.1 -11.1 -8.0 -12.1 Hungary : -7.6 : -6.6 -8.0 -8.1 : -6.6 -5.9 -3.6 -3.5 -1.6 -2.2 Malta : -5.9 -2.5 2.8 -2.4 -4.9 -4.9 -7.9 -3.3 -8.0 -2.5 -8.3 -1.5 Poland 2.4 -4.1 -2.4 -2.5 -2.1 -4.2 -1.4 -1.8 -1.7 -1.4 -2.1 -1.2 -3.3 Romania -3.8 -4.8 : -1.0 -4.3 -4.1 : -10.3 -10.3 -11.8 -11.2 -13.3 -11.4 Slovakia : -6.4 -6.0 -9.3 -2.5 -2.3 -8.1 -7.5 -7.8 -4.5 -4.0 -3.1 -3.5 Sweden 0.5 3.9 6.1 5.3 6.6 6.5 5.9 5.6 6.3 6.3 7.4 6.4 7.3 United Kingdom -1.5 -1.2 -1.5 -2.3 -2.6 -3.3 -2.5 -3.8 -2.7 -4.0 EU27 : : : : : : : -0.5 -0.6 -0.3 -0.5 -0.3 -0.6 EU27, adjusted ¹ : : : : : : : : -0.8 : -0.7 : -0.8 USA -1.2 -2.9 -5.4 -4.4 -4.7 -5.6 -6.3 -6.4 -6.2 -6.4 -5.9 -6.5 -6.0 Japan 2.4 2.3 3.4 2.8 3.1 3.6 3.5 3.4 3.8 2.9 4.1 2.6 4.0
¹ See note 8 on concepts and sources.

- 152 -
TABLE 51 : Merchandise trade balance (fob-fob, in billions of Ecu/euro, 2000-2008) 23.04.2007
2006 2007 20082000 2001 2002 2003 2004 2005 X-2006 IV-2007 X-2006 IV-2007 X-2006 IV-2007
Belgium 5.3 7.1 10.2 9.7 7.8 4.7 4.7 4.2 4.9 5.5 5.7 6.4 Germany 62.6 100.7 136.6 131.9 155.2 156.3 159.4 163.4 174.0 186.6 174.3 188.2 Ireland 24.9 28.1 32.7 30.3 28.9 29.6 25.6 27.2 25.0 26.0 24.9 25.3 Greece -23.0 -21.3 -23.4 -26.0 -29.9 -29.3 -32.9 -33.7 -34.6 -35.8 -36.4 -37.9 Spain -39.9 -38.4 -36.6 -40.2 -53.2 -67.5 -79.2 -79.4 -90.3 -88.5 -99.8 -96.8 France -2.5 2.4 8.4 2.4 -6.1 -33.9 -36.8 -39.3 -38.8 -42.2 -43.0 -44.4 Italy 10.5 16.7 14.3 9.5 8.8 0.4 -6.2 -9.7 -3.5 -5.0 0.4 -5.0 Luxembourg -2.8 -3.0 -2.6 -2.9 -2.8 -3.3 -3.2 -2.7 -3.5 -2.8 -3.8 -3.0 Netherlands 23.8 27.0 31.2 31.0 34.5 38.6 43.8 40.4 47.6 43.1 52.0 44.3 Austria -3.1 -1.2 3.8 1.2 2.8 2.6 4.2 5.2 5.3 5.8 6.3 6.2 Portugal -14.7 -14.5 -13.1 -11.2 -13.5 -15.0 -15.3 -15.2 -15.1 -14.1 -14.9 -14.2 Slovenia -1.2 -0.7 -0.3 -0.5 -1.0 -1.0 -1.0 -1.1 -0.9 -1.1 -0.7 -1.0 Finland 14.9 14.1 13.5 11.4 10.2 7.7 9.5 9.5 9.3 10.0 8.7 9.4 Euro area 54.7 117.0 174.7 146.6 141.9 89.8 72.8 68.9 79.3 87.6 73.8 77.5 Euro area, adjusted ¹ 31.6 73.2 127.8 105.0 103.5 48.2 40.3 27.4 46.9 46.0 41.3 36.0 Bulgaria -1.3 -1.8 -1.9 -2.4 -3.0 -4.4 -5.1 -5.4 -5.7 -6.1 -6.3 -6.9 Czech Republic -3.4 -3.4 -2.3 -2.2 -0.8 1.3 2.0 1.2 3.0 2.9 4.2 4.0 Denmark 7.2 8.3 8.5 8.7 7.3 5.2 3.2 1.0 2.9 0.5 3.8 0.8 Estonia -0.9 -0.9 -1.2 -1.4 -1.6 -1.5 -2.0 -2.1 -2.6 -2.7 -3.2 -3.1 Cyprus -2.7 -2.9 -3.0 -2.8 -3.3 -3.4 -3.9 -3.9 -4.2 -4.1 -4.7 -4.3 Latvia -1.1 -1.5 -1.6 -1.8 -2.3 -2.5 -3.5 -4.0 -4.3 -4.8 -4.9 -5.1 Lithuania -1.2 -1.2 -1.4 -1.5 -1.9 -2.3 -3.0 -3.3 -3.5 -4.2 -3.9 -5.0 Hungary -3.3 -2.6 -2.3 -2.9 -2.5 -1.5 -1.0 -0.4 0.6 1.6 1.8 3.0 Malta -0.8 -0.6 -0.4 -0.6 -0.7 -0.9 -1.1 -1.0 -1.1 -1.0 -1.2 -1.0 Poland -13.3 -8.5 -7.7 -5.1 -4.6 -2.2 -3.4 -3.9 -5.8 -7.9 -8.0 -12.5 Romania -1.9 -3.4 -2.8 -4.0 -5.3 -7.8 -10.8 -11.7 -13.4 -16.7 -15.8 -20.5 Slovakia -1.1 -2.5 -2.4 -0.7 -1.3 -2.2 -2.2 -2.6 -1.2 -1.6 -0.8 -1.6 Sweden 16.9 16.8 17.2 16.5 18.7 15.7 16.4 16.9 16.8 18.1 17.7 18.6 United Kingdom -54.1 -66.3 -75.9 -70.3 -89.8 -100.6 -114.2 -122.8 -125.9 -138.4 -136.8 -145.7 EU27 -6.4 46.5 97.6 76.1 50.9 -17.4 -54.3 -73.1 -64.1 -76.8 -83.6 -101.7 EU27, adjusted ¹ : : : : : -104.7 : -160.4 : -164.1 : -189.1 USA -497.7 -487.8 -521.2 -495.3 -544.4 -636.3 -691.4 -672.5 -695.9 -618.9 -725.7 -649.8 Japan 126.4 78.4 99.4 93.7 106.4 101.6 66.6 87.7 55.6 89.7 55.1 91.3
¹ See note 8 on concepts and sources.
TABLE 52 : Current account balance (in billions of Ecu/euro, 2000-2008) 2006 2007 2008 2000 2001 2002 2003 2004 2005 X-2006 IV-2007 X-2006 IV-2007 X-2006 IV-2007
Belgium 10.5 10.6 13.3 12.2 10.5 7.5 7.7 7.2 8.3 8.7 9.9 10.0 Germany -33.6 -0.6 46.1 43.6 85.1 94.7 103.0 108.4 124.4 135.7 130.3 140.6 Ireland -1.7 -2.0 -1.8 -0.1 -1.5 -4.2 -5.6 -5.8 -7.8 -7.4 -8.5 -9.0 Greece -11.1 -12.3 -13.9 -15.6 -16.0 -16.6 -16.6 -22.3 -16.7 -23.0 -16.8 -23.4 Spain -25.3 -29.5 -27.4 -31.5 -49.4 -67.4 -84.5 -83.2 -99.7 -94.8 -111.1 -107.4 France 15.9 17.6 12.2 3.9 -10.7 -35.1 -37.1 -35.6 -36.2 -35.2 -39.6 -34.3 Italy -1.7 3.6 -4.3 -12.0 -7.0 -17.1 -20.6 -29.3 -16.3 -25.9 -11.9 -27.5 Luxembourg 2.9 2.0 2.8 2.0 3.2 0.5 3.7 2.8 4.3 3.8 4.8 4.7 Netherlands 26.4 23.1 28.0 28.9 42.1 35.9 40.3 52.2 44.9 50.6 49.3 52.2 Austria -2.2 -0.7 5.6 3.9 4.9 7.1 7.8 9.4 7.4 8.7 7.4 8.5 Portugal -13.1 -13.6 -11.6 -9.0 -11.5 -14.4 -13.7 -15.3 -13.8 -15.4 -13.6 -15.4 Slovenia -0.6 0.0 0.3 -0.2 -0.7 -0.5 -0.6 -0.8 -0.6 -0.8 -0.5 -0.8 Finland 11.0 13.1 14.4 8.7 11.7 7.8 9.1 10.0 9.1 10.8 8.6 10.7 Euro area -22.5 11.5 63.6 34.8 60.7 -1.9 -7.2 -2.4 7.3 15.9 8.2 9.0 Euro area, adjusted ¹ -88.8 -22.1 57.0 32.4 55.6 -8.2 -32.6 -8.8 -18.1 9.6 -17.2 2.7 Bulgaria -0.8 -0.9 -0.4 -1.0 -1.3 -2.6 -3.4 -4.0 -3.6 -4.6 -3.7 -5.3 Czech Republic -2.9 -3.6 -4.9 -5.3 -5.5 -2.7 -3.4 -4.7 -2.8 -3.7 -2.2 -3.6 Denmark 2.4 5.6 4.6 6.5 6.0 7.5 4.2 5.5 4.8 4.4 5.5 5.5 Estonia -0.3 -0.3 -0.8 -1.0 -1.2 -1.2 -1.5 -1.9 -1.5 -2.3 -1.6 -2.6 Cyprus -0.5 -0.4 -0.4 -0.3 -0.6 -0.8 -0.9 -0.9 -0.9 -0.9 -0.9 -0.9 Latvia -0.4 -0.7 -0.7 -0.8 -1.4 -1.6 -2.5 -3.4 -3.2 -4.3 -3.5 -4.8 Lithuania -0.7 -0.6 -0.8 -1.1 -1.4 -1.4 -2.1 -2.6 -2.5 -3.3 -2.7 -4.0 Hungary -4.4 -3.6 -4.9 -5.9 -6.9 -6.2 -6.5 -5.2 -4.7 -3.6 -3.4 -2.4 Malta -0.5 -0.2 0.1 -0.1 -0.3 -0.4 -0.5 -0.3 -0.5 -0.3 -0.6 -0.2 Poland -10.8 -6.0 -5.3 -4.1 -8.9 -4.2 -6.0 -6.2 -7.8 -9.1 -8.5 -14.0 Romania -1.6 -2.5 -0.5 -2.5 -3.0 -6.9 -10.0 -10.0 -12.7 -14.5 -15.2 -16.9 Slovakia -0.5 -1.7 -1.9 -0.6 -0.8 -3.0 -3.4 -3.4 -2.3 -2.3 -1.7 -2.2 Sweden 10.8 11.3 13.8 17.9 18.2 16.8 19.3 21.5 20.5 24.5 22.1 25.6 United Kingdom -40.8 -35.2 -26.3 -21.6 -28.5 -42.6 -47.7 -63.6 -52.1 -78.2 -58.0 -86.2 EU27 -73.5 -27.4 35.3 15.0 25.0 -51.3 -70.0 -81.6 -60.6 -82.4 -65.6 -103.1 EU27, adjusted ¹ : : : : : -73.0 : -103.3 : -104.1 : -124.8 USA -429.9 -413.8 -485.8 -453.5 -522.4 -620.2 -680.9 -647.1 -703.5 -607.0 -741.9 -648.8 Japan 129.5 98.0 119.8 120.5 138.6 152.9 123.8 136.7 105.6 136.2 99.8 136.1
¹ See note 8 on concepts and sources.

- 153 -
TABLE 53 : Export markets (a) (percentage change on preceding year, 2000-2008) 23.04.2007
2006 2007 2008 2000 2001 2002 2003 2004 2005 X-2006 IV-2007 X-2006 IV-2007 X-2006 IV-2007
Belgium 11.9 1.1 2.4 4.0 8.5 6.4 9.8 9.5 6.9 7.5 6.7 6.9 Germany 12.3 0.6 3.8 4.0 9.7 6.4 9.7 9.2 7.6 7.7 7.0 7.2 Ireland 11.5 0.1 3.2 3.6 8.5 6.0 9.9 8.6 6.4 6.3 6.1 6.2 Greece 9.7 1.6 3.2 4.5 9.5 7.5 10.2 9.8 7.7 8.3 7.3 7.7 Spain 10.8 0.6 1.9 3.1 8.5 5.9 9.0 8.7 6.5 6.9 6.3 6.5 France 10.7 0.6 2.9 4.6 8.7 6.1 9.6 9.2 6.9 7.5 6.6 7.0 Italy 12.3 0.5 3.6 5.1 9.9 7.1 10.1 9.9 7.5 8.1 7.1 7.5 Luxembourg (b) : : : : 8.1 5.9 9.5 9.2 6.5 7.4 6.4 6.7 Netherlands 9.6 0.3 2.3 4.2 8.3 6.1 9.9 9.6 6.7 7.8 6.6 7.0 Austria 12.5 1.2 2.0 4.6 9.3 6.3 10.0 10.9 7.3 8.8 7.2 8.0 Portugal 12.5 0.7 1.4 3.9 8.5 6.5 9.7 9.1 6.8 7.2 6.5 6.7 Slovenia : : : : 8.4 5.8 9.5 10.2 7.6 8.9 7.1 7.8 Finland 11.6 0.6 4.0 5.3 9.8 8.8 11.8 11.5 9.8 10.2 8.4 8.5 Euro area (c) 11.5 0.6 3.1 4.3 9.1 6.4 9.8 9.4 7.2 7.7 6.8 7.1 Bulgaria : : : : 10.5 6.4 8.8 9.2 7.1 8.0 6.7 7.3 Czech Republic : : : : 9.2 6.6 10.7 11.6 7.5 9.5 7.2 8.3 Denmark 9.5 0.1 2.6 4.5 8.7 7.3 9.9 9.8 7.1 7.9 6.7 7.0 Estonia : : : : 9.7 9.7 11.4 11.2 9.5 9.6 8.0 8.0 Cyprus : : : : 7.6 6.7 11.4 10.2 7.3 7.6 6.7 6.8 Latvia : : : : 9.2 9.1 13.9 13.0 10.6 10.9 9.2 9.1 Lithuania : : : : 10.6 9.2 13.1 12.8 10.8 10.7 8.9 8.7 Hungary : : : : 8.9 6.6 10.5 11.3 7.6 9.3 7.3 8.2 Malta : : : : 11.0 7.2 9.9 9.0 7.0 7.0 6.7 6.9 Poland : : : : 9.6 7.5 10.8 11.4 7.9 9.3 7.4 8.0 Romania : : : : 8.7 5.5 8.7 8.8 6.6 7.3 6.4 6.8 Slovakia : : : : 10.3 5.8 10.4 11.4 7.6 9.3 7.5 8.5 Sweden 11.3 -0.4 3.5 3.9 9.3 7.6 10.2 9.8 7.2 7.4 6.8 6.8 United Kingdom 11.4 0.0 3.0 4.1 9.0 7.0 8.4 8.1 6.9 7.1 6.6 6.8 EU27 (c) : : : : 8.7 5.5 : 9.5 : 7.8 : 7.2 USA 10.8 -2.2 6.5 5.2 10.8 7.3 8.8 8.7 7.6 7.4 7.2 7.4 Japan 12.5 -2.3 7.9 6.6 12.8 7.6 9.7 9.4 8.5 8.2 8.4 8.6
(a) Imports of goods to the various markets (incl. EU-markets) weighted according to their share in country's exports of goods.(b) Included in the figures for Belgium up to 2003.(c) Intra- and extra-EU trade.
TABLE 54 : Export performance (a) (percentage change on preceding year, 2000-2008) 2006 2007 2008 2000 2001 2002 2003 2004 2005 X-2006 IV-2007 X-2006 IV-2007 X-2006 IV-2007
Belgium -4.0 -0.9 -1.1 0.2 -1.7 -3.9 -3.5 -5.2 -1.5 -1.3 -1.7 -1.4 Germany 1.1 5.6 -0.3 -0.9 0.5 0.6 0.6 3.5 -0.7 1.3 -0.3 0.0 Ireland 6.2 4.5 1.0 -7.3 -2.8 -3.2 -6.1 -7.5 -2.0 -3.6 -2.0 -2.6 Greece -0.9 -3.1 -10.0 -0.3 -10.9 0.6 -2.0 2.0 -0.6 0.0 -0.9 -0.7 Spain -0.7 3.3 1.7 2.0 -3.1 -5.5 -1.2 -2.9 -1.3 -0.9 -0.8 -0.5 France 1.4 2.3 -0.9 -4.4 -3.7 -2.8 0.7 -0.9 -0.4 -1.3 -0.5 -1.1 Italy -2.6 -0.6 -7.3 -7.1 -6.4 -7.7 -4.8 -5.0 -3.3 -3.5 -3.0 -3.3 Luxembourg (b) : : : : 1.0 -2.0 2.7 2.0 -0.5 -1.3 -0.8 -1.1 Netherlands 2.1 1.0 -1.0 -2.0 1.0 0.2 -1.1 -1.3 0.5 -1.4 0.2 -1.1 Austria 0.5 5.5 3.0 -2.3 3.2 -0.5 -0.5 -0.6 -0.2 -0.6 -0.7 -0.5 Portugal : 0.8 0.1 1.8 -3.7 -5.1 -2.0 -0.7 -1.3 -0.3 -0.9 -0.7 Slovenia : : : : 4.1 4.2 1.6 0.5 1.3 0.6 1.3 0.6 Finland 9.9 -0.8 -1.6 -4.9 -3.4 -2.6 0.4 1.3 -2.6 -3.4 -2.1 -2.2 Euro area (c) 0.7 2.8 -1.3 -2.5 -1.6 -2.1 -1.1 -0.6 -1.0 -0.7 -0.8 -0.9 Bulgaria : : : : 1.7 3.6 4.8 1.6 4.6 3.2 5.0 3.4 Czech Republic : : : : 12.7 4.7 3.7 3.5 3.3 3.5 3.3 2.7 Denmark 0.4 2.4 1.7 -6.2 -4.5 -2.0 0.5 -3.7 0.1 -3.2 0.1 -2.1 Estonia : : : : 9.6 16.8 8.3 0.4 6.1 -0.2 6.3 0.2 Cyprus : : : : 4.2 19.9 -7.1 -23.5 -1.3 -3.4 -0.7 -2.7 Latvia : : : : 1.5 10.7 1.0 -9.9 4.7 -2.6 2.6 -0.1 Lithuania : : : : -7.3 2.9 0.9 2.6 1.0 -0.9 0.8 2.2 Hungary : : : : 9.2 4.5 2.8 4.9 2.6 4.6 1.8 2.7 Malta : : : : -4.3 -12.0 -8.1 -5.5 -4.2 -3.6 -3.5 -3.4 Poland : : : : 4.7 0.2 4.7 2.2 1.9 0.4 1.5 0.9 Romania : : : : 6.5 2.3 4.0 -0.7 3.2 0.3 5.3 -0.5 Slovakia : : : : -0.4 7.2 3.9 8.3 7.1 9.5 3.0 3.4 Sweden 0.7 -1.7 -1.5 0.9 0.8 -2.3 -3.0 -1.6 -0.7 -0.6 -0.7 -0.8 United Kingdom 0.7 2.7 -4.1 -4.2 -6.9 2.1 15.1 6.7 -0.4 -1.1 -0.6 -0.9 EU27 (c) : : : : -1.2 -0.3 : 0.3 : -0.6 : -0.7 USA 0.4 -4.0 -9.8 -3.2 -1.6 0.2 1.1 1.7 0.3 -0.4 0.1 0.2 Japan -0.1 -4.0 -0.3 2.2 0.9 -1.5 -0.2 1.3 -1.8 -0.2 -2.0 -1.5
(a) Index for exports of goods divided by an index for growth of markets.(b) Included in the figures for Belgium up to 2003.(c) Intra- and extra-EU trade.

- 154 -
TABLE 55 : World GDP, volume (percentage change on preceding year, 2001-2008) 23.04.2007
2006 2007 2008 ( a ) 2001 2002 2003 2004 2005 X-2006 IV-2007 X-2006 IV-2007 X-2006 IV-2007
EU27 21.0 2.0 1.2 1.3 2.5 1.7 2.8 3.0 2.4 2.9 2.4 2.7 Euro area 15.0 1.9 0.9 0.8 2.0 1.4 2.6 2.7 2.1 2.6 2.2 2.5 Belgium 0.6 0.8 1.5 1.0 3.0 1.1 2.7 3.1 2.3 2.3 2.2 2.2 Bulgaria 0.0 4.1 5.6 5.0 6.6 6.2 6.0 6.1 6.0 6.1 6.2 6.2 Czech Republic 0.2 2.5 1.9 3.6 4.2 6.1 6.0 6.1 5.1 4.9 4.7 4.9 Denmark 0.4 0.7 0.5 0.4 2.1 3.1 3.0 3.1 2.3 2.3 2.2 2.0 Germany 4.3 1.2 0.0 -0.2 1.2 0.9 2.4 2.7 1.2 2.5 2.0 2.4 Estonia 0.0 7.7 8.0 7.1 8.1 10.5 10.9 11.4 9.5 8.7 8.4 8.2 Ireland 0.3 5.8 6.0 4.3 4.3 5.5 5.3 6.0 5.3 5.0 4.3 4.0 Greece 0.3 5.1 3.8 4.8 4.7 3.7 3.8 4.3 3.7 3.7 3.7 3.7 Spain 1.7 3.6 2.7 3.0 3.2 3.5 3.8 3.9 3.4 3.7 3.3 3.4 France 3.3 1.9 1.0 1.1 2.3 1.2 2.2 2.0 2.3 2.4 2.1 2.3 Italy 2.7 1.8 0.3 0.0 1.2 0.1 1.7 1.9 1.4 1.9 1.4 1.7 Cyprus 0.0 4.0 2.0 1.8 4.2 3.9 3.8 3.8 3.8 3.8 3.9 3.9 Latvia 0.0 8.0 6.5 7.2 8.7 10.6 11.0 11.9 8.9 9.6 8.0 7.9 Lithuania 0.0 6.6 6.9 10.3 7.3 7.6 7.8 7.5 7.0 7.3 6.5 6.3 Luxembourg 0.1 2.5 3.8 1.3 3.6 4.0 5.5 6.2 4.5 5.0 4.2 4.7 Hungary 0.2 4.1 4.3 4.1 4.9 4.2 4.0 3.9 2.4 2.4 2.7 2.6 Malta 0.0 -1.1 1.9 -2.3 0.4 3.0 2.3 2.9 2.1 3.0 2.2 2.8 Netherlands 1.0 1.9 0.1 0.3 2.0 1.5 3.0 2.9 2.9 2.8 2.6 2.6 Austria 0.5 0.8 0.9 1.1 2.4 2.0 3.1 3.1 2.6 2.9 2.1 2.5 Poland 0.5 1.1 1.4 3.8 5.3 3.5 5.2 6.1 4.7 6.1 4.8 5.5 Portugal 0.3 2.0 0.8 -0.7 1.3 0.5 1.2 1.3 1.5 1.8 1.7 2.0 Romania 0.2 5.7 5.1 5.2 8.5 4.1 7.2 7.7 5.8 6.7 5.6 6.3 Slovenia 0.1 2.7 3.5 2.7 4.4 4.0 4.8 5.2 4.2 4.3 4.5 4.0 Slovakia 0.1 3.2 4.1 4.2 5.4 6.0 6.7 8.3 7.2 8.5 5.7 6.5 Finland 0.3 2.6 1.6 1.8 3.7 2.9 4.9 5.5 3.0 3.1 2.6 2.7 Sweden 0.6 1.1 2.0 1.7 4.1 2.9 4.0 4.4 3.3 3.8 3.1 3.3 United Kingdom 3.4 2.4 2.1 2.7 3.3 1.9 2.7 2.8 2.6 2.8 2.4 2.5 Candidate Countries 1.1 -6.5 7.5 5.7 8.3 7.0 5.9 5.9 6.2 4.9 6.2 5.8 - Croatia 0.1 4.4 5.6 5.3 4.3 4.3 4.5 4.8 4.6 4.8 4.5 4.5 - Turkey 1.0 -7.5 7.9 5.8 8.9 7.4 6.0 6.1 6.4 4.9 6.3 5.9 - Former Yugoslav Republic of Macedonia 0.0 -4.5 0.9 2.8 4.1 3.8 3.8 3.1 4.5 4.3 5.5 5.3USA 20.3 0.8 1.6 2.5 3.9 3.2 3.4 3.3 2.3 2.2 2.8 2.7Japan 6.5 0.2 0.3 1.4 2.7 1.9 2.7 2.2 2.3 2.3 2.1 2.1Canada 1.8 1.8 2.9 1.8 3.3 2.9 2.8 2.8 2.6 2.4 3.0 2.9Norway 0.3 2.0 1.5 1.0 3.9 2.7 3.0 2.9 2.4 3.2 2.2 2.7Switzerland 0.4 1.0 0.3 -0.2 2.3 1.9 2.7 2.9 1.9 2.1 1.7 1.9Iceland 0.0 3.8 -1.0 3.0 8.2 5.5 4.1 4.1 1.2 1.2 2.5 2.5Australia 1.0 3.8 3.2 4.0 2.3 2.6 2.9 2.6 3.2 2.9 2.8 3.1New Zealand 0.2 3.9 4.7 3.6 3.7 1.9 1.6 1.6 2.1 2.1 2.4 2.2Industrialised countries 52.6 1.1 1.5 1.9 3.2 2.5 3.1 3.1 2.5 2.6 2.6 2.7Others 47.4 4.5 5.0 6.5 7.6 7.4 7.3 7.7 6.9 7.3 6.9 7.2CIS 3.6 6.3 5.3 7.9 8.4 6.4 7.1 7.7 6.7 6.9 6.7 6.9 - Russia 2.4 5.1 4.7 7.3 7.2 6.4 6.7 6.7 6.4 6.8 6.4 6.5 - Other 1.2 9.0 6.5 9.1 11.1 6.5 8.1 9.6 7.2 7.2 7.4 7.6MENA 3.8 0.9 1.9 3.4 5.8 6.9 5.5 5.4 5.4 5.4 5.2 5.2Other emerging markets 39.9 4.7 5.2 6.7 7.7 7.5 7.5 7.9 7.1 7.5 7.1 7.5 Asia 30.0 5.8 6.7 8.0 8.3 8.4 8.4 8.7 8.0 8.3 8.0 8.4 - China 15.6 8.3 9.1 10.0 10.1 10.2 10.4 10.7 9.8 10.5 9.7 10.4 - India 6.0 5.8 3.8 8.5 7.5 8.4 8.1 8.7 7.4 7.6 7.3 7.4 - Hong Kong 0.4 0.6 1.8 3.2 8.6 7.3 5.9 6.8 5.1 6.1 4.7 6.1 - Korea 1.6 3.8 7.0 3.1 4.7 4.0 4.9 5.1 4.0 4.3 4.0 4.7 - Indonesia 1.6 3.8 4.4 4.7 5.1 5.6 5.3 5.3 5.8 5.8 5.9 6.0 Latin America 7.4 0.5 0.1 2.3 5.9 4.5 4.7 5.4 4.0 4.5 3.7 4.1 - Brazil 2.6 1.3 2.7 1.1 5.7 2.9 3.3 3.7 3.5 4.2 3.5 3.9 - Mexico 1.8 0.0 0.8 1.4 4.2 2.8 4.2 4.8 3.7 3.3 3.5 3.7 Sub-Saharan Africa 2.5 3.9 3.5 3.4 4.9 5.7 4.6 5.5 6.1 6.5 5.5 6.0World 100.0 2.7 3.1 4.1 5.3 4.8 5.1 5.2 4.6 4.8 4.7 4.8World excluding EU27 79.0 2.9 3.6 4.8 6.0 5.6 5.7 5.8 5.2 5.3 5.2 5.4World excluding euro area 85.0 2.9 3.5 4.7 5.9 5.4 5.6 5.7 5.0 5.2 5.1 5.3(a) Relative weights, based on GDP (at constant prices and pps) in 2005.

- 155 -
TABLE 56 : World exports of goods and services, volume (percentage change on preceding year, 2001-2008) 23.04.2007
2006 2007 2008 ( a ) 2001 2002 2003 2004 2005 X-2006 IV-2007 X-2006 IV-2007 X-2006 IV-2007
EU27 (b) 40.8 3.7 1.9 1.8 7.2 5.3 9.7 9.2 6.5 7.0 6.2 6.2 Euro area (b) 30.4 3.7 1.7 1.1 6.9 4.2 7.9 8.2 6.0 6.7 5.8 6.0 Candidate Countries 0.8 7.5 9.4 15.2 11.3 7.8 5.5 8.2 6.1 6.8 6.4 6.5 - Croatia 0.1 8.1 1.3 11.4 5.7 4.6 6.8 6.9 7.1 7.2 7.2 7.3 - Turkey 0.7 7.4 11.1 16.0 12.5 8.5 5.2 8.5 5.9 6.7 6.2 6.4 - Former Yugoslav Republic of Macedonia 0.0 : : : : : 18.0 15.2 14.0 14.5 16.0 15.9USA 10.5 -5.4 -2.3 1.3 9.2 6.8 8.5 9.0 7.2 7.0 6.8 7.2Japan 4.8 -6.9 7.5 9.2 13.9 7.0 9.6 9.5 6.9 7.3 6.3 6.6Canada 3.4 -3.0 1.2 -2.4 5.2 2.1 1.7 1.3 3.9 2.8 4.2 3.4Norway 1.1 4.3 -0.3 -0.2 1.1 0.7 3.2 1.2 3.4 3.6 4.2 3.4Switzerland 1.4 0.2 -0.7 -0.4 8.4 6.4 7.4 10.0 5.3 5.9 5.0 6.0Iceland 0.0 1.0 -1.5 -2.1 9.4 -1.0 5.3 5.4 8.4 8.5 9.5 9.5Australia 1.1 0.8 0.4 -0.7 2.6 3.4 7.1 6.0 6.6 6.6 6.7 7.2New Zealand 0.2 3.5 6.0 1.8 5.3 -2.6 5.6 5.6 5.6 7.0 6.4 6.8Industrialised countries 64.2 1.0 1.6 2.1 7.8 5.4 8.8 8.6 6.4 6.7 6.2 6.2Others 35.8 -2.1 9.0 10.7 16.9 13.1 9.6 9.5 9.3 9.3 8.7 9.3CIS 3.1 -14.3 -5.2 7.6 17.7 12.0 7.5 4.4 6.7 4.9 6.1 4.9 - Russia 2.2 -17.2 -7.3 5.9 13.3 12.7 6.7 2.4 5.9 3.2 5.1 3.3 - Other 0.9 -4.2 1.0 12.4 29.5 10.5 9.2 9.2 8.7 8.7 8.4 8.4MENA 4.6 -5.1 7.0 5.0 3.6 8.8 6.2 5.3 6.1 5.0 5.5 4.7Other emerging markets 28.1 -0.3 10.8 12.0 18.9 14.0 10.5 10.8 10.1 10.5 9.5 10.5 Asia 21.2 -0.4 13.9 14.5 20.5 15.3 11.7 11.9 10.8 11.7 10.4 11.7 - China 6.7 14.3 24.1 29.4 27.3 21.5 18.5 18.3 16.1 19.2 15.1 17.9 - India 1.1 7.4 17.5 5.8 15.0 24.7 13.0 14.7 12.0 12.7 10.3 10.3 - Hong Kong 2.8 -2.5 8.7 12.8 16.1 10.7 9.6 7.5 8.6 7.6 8.0 8.3 - Korea 2.7 -9.7 21.6 14.7 21.3 8.2 9.2 10.3 8.4 9.1 8.3 9.9 - Indonesia 0.8 -1.9 -2.8 -6.1 12.6 61.0 8.0 9.7 8.2 8.2 8.8 8.6 Latin America 5.2 -0.6 1.0 5.6 16.0 8.9 7.2 7.4 6.1 6.1 6.4 6.4 - Brazil 1.1 10.9 9.4 13.6 16.4 8.1 5.9 4.4 5.9 4.9 5.9 5.4 - Mexico 1.8 -4.6 0.8 3.6 12.1 6.0 7.3 7.9 5.5 5.0 5.9 5.9 Sub-Saharan Africa 1.7 2.2 2.4 0.2 8.3 12.1 4.7 6.9 13.8 9.6 7.8 7.9World 100.0 -0.1 4.2 5.2 11.1 8.2 9.1 8.9 7.4 7.7 7.1 7.3World excluding EU27 59.2 -2.8 5.8 7.5 13.7 10.1 8.7 8.7 8.1 8.1 7.6 8.1World excluding euro area 69.6 -1.7 5.4 7.0 12.9 9.9 9.6 9.2 8.1 8.1 7.6 7.9(a) Relative weights, based on exports of goods and services (at current prices and current exchange rates) in 2005.(b) Intra- and extra-EU trade.
TABLE 57 : Export shares in EU trade (goods only - 2005)Other Sub
Candidate Industr. Rest Latin SaharanEU27 Countries USA Japan Canada Countries CIS MENA Asia America Africa World
EU27 68.2 1.8 7.9 1.4 0.7 4.5 2.5 4.1 5.6 1.9 1.4 100 Belgium 77.3 1.1 6.4 1.0 0.7 2.1 1.0 3.1 5.1 1.1 1.1 100 Bulgaria 66.8 15.3 3.3 0.2 0.5 1.0 3.5 3.8 3.6 1.1 0.8 100 Czech Republic 86.1 1.2 2.6 0.4 0.2 1.8 3.1 1.8 1.7 0.6 0.4 100 Denmark 71.5 0.6 6.5 2.3 0.9 7.6 1.8 2.0 4.9 1.2 0.6 100 Germany 64.6 2.0 8.8 1.7 0.7 5.4 3.1 3.2 7.1 2.2 1.2 100 Estonia 79.3 0.9 3.2 0.3 0.7 3.7 8.8 0.4 1.8 0.5 0.4 100 Ireland 63.8 0.4 18.7 2.7 0.4 5.4 0.3 1.3 5.2 1.1 0.6 100 Greece 65.5 8.2 5.6 0.3 0.7 1.8 3.0 8.4 3.3 1.0 2.1 100 Spain 74.2 1.9 4.3 0.8 0.5 3.1 0.9 4.9 3.1 5.1 1.3 100 France 65.0 1.5 7.3 1.5 0.7 4.3 1.5 7.4 6.4 2.0 2.4 100 Italy 61.5 3.0 8.2 1.6 0.8 5.4 2.9 6.5 5.9 2.8 1.4 100 Cyprus 75.0 0.2 1.9 1.9 0.2 0.8 2.2 11.7 3.9 0.2 1.9 100 Latvia 76.9 0.1 2.7 0.9 0.4 4.3 12.3 0.7 0.7 0.7 0.3 100 Lithuania 65.9 1.3 4.7 0.1 2.8 2.9 17.7 0.3 3.7 0.4 0.2 100 Luxembourg 89.3 1.1 2.2 0.3 0.4 1.6 0.7 1.1 2.1 1.0 0.4 100 Hungary 82.1 3.1 3.1 0.6 0.1 1.7 3.7 2.6 2.0 0.5 0.7 100 Malta 51.1 0.3 14.5 2.1 0.8 0.9 0.6 7.7 18.7 1.3 2.0 100 Netherlands 80.5 1.1 4.3 0.7 0.3 2.7 1.9 2.4 3.7 1.1 1.2 100 Austria 72.6 2.1 5.9 1.2 0.9 6.2 3.0 2.0 4.4 1.0 0.8 100 Poland 79.2 1.8 2.1 0.2 0.6 3.2 8.7 1.2 1.7 0.9 0.4 100 Portugal 80.3 0.8 5.6 0.3 0.5 1.5 0.4 2.0 3.0 1.4 4.3 100 Romania 71.7 9.1 4.1 0.3 0.4 1.4 3.5 5.1 3.0 0.6 0.8 100 Slovenia 74.0 11.9 2.1 0.1 0.2 1.8 5.7 2.2 1.1 0.4 0.4 100 Slovakia 87.9 1.4 3.1 0.3 0.2 1.1 3.2 0.9 1.2 0.4 0.3 100 Finland 56.2 1.2 6.2 1.7 1.0 4.6 12.4 5.8 7.3 2.2 1.4 100 Sweden 58.2 1.1 10.8 1.6 1.1 11.5 2.4 3.6 6.2 2.1 1.4 100 United Kingdom 55.3 1.2 15.4 1.9 1.6 5.2 1.3 5.9 8.3 1.5 2.2 100
- 156 -
TABLE 58 : World imports of goods and services, volume (percentage change on preceding year, 2001-2008) 23.04.2007
2006 2007 2008 ( a ) 2001 2002 2003 2004 2005 X-2006 IV-2007 X-2006 IV-2007 X-2006 IV-2007
EU27 (b) 40.4 2.4 1.4 3.4 7.4 5.8 9.5 9.1 6.4 7.2 6.2 6.6 Euro area (b) 29.4 1.8 0.3 3.1 6.7 5.2 7.5 7.7 5.7 6.7 5.8 6.2 Candidate Countries 1.1 -19.4 15.5 24.7 21.6 10.3 6.4 7.2 6.1 6.1 5.5 5.6 - Croatia 0.2 9.8 13.4 12.1 4.6 3.5 6.0 7.3 6.8 6.8 5.8 5.8 - Turkey 0.9 -24.8 15.8 27.1 24.7 11.5 6.4 7.1 6.0 6.0 5.5 5.5 - Former Yugoslav Republic of Macedonia 0.0 : : : : : 12.0 14.5 11.0 13.5 14.0 14.3USA 16.3 -2.7 3.4 4.1 10.8 6.1 6.6 5.8 4.7 3.2 5.1 5.1Japan 4.2 0.6 0.9 3.9 8.1 5.8 7.7 4.5 9.5 7.3 7.5 7.4Canada 3.1 -5.1 1.7 4.5 8.2 7.1 5.8 5.2 5.7 3.8 5.6 5.8Norway 0.7 1.7 1.0 1.4 8.8 8.6 7.9 9.2 5.0 4.3 5.4 4.1Switzerland 1.2 3.2 -2.6 1.0 7.4 5.3 6.8 10.0 5.8 6.1 5.5 6.1Iceland 0.1 -15.4 -6.5 7.6 12.4 17.3 15.8 15.8 2.7 2.7 -0.3 -0.3Australia 1.2 -3.9 9.4 8.0 13.2 8.1 8.1 7.5 7.4 7.4 8.4 6.8New Zealand 0.3 -2.1 10.1 6.3 13.0 4.2 6.8 6.8 7.1 6.9 7.5 7.3Industrialised countries 68.6 0.2 2.2 4.0 8.6 6.1 8.4 7.8 6.1 6.1 6.0 6.2Others 31.4 -1.2 8.2 10.0 15.9 9.8 10.5 10.6 10.2 10.3 9.4 9.8CIS 2.2 2.5 -1.1 7.0 19.4 16.5 16.3 17.2 18.6 19.1 12.5 12.8 - Russia 1.3 2.9 -1.2 2.6 16.5 18.0 20.7 20.7 24.2 24.6 14.4 14.5 - Other 0.9 1.9 -0.8 15.1 24.3 14.3 9.5 11.8 8.8 9.7 8.8 9.7MENA 3.0 6.5 4.8 1.3 3.9 7.2 8.9 6.3 7.0 6.2 6.0 5.9Other emerging markets 26.2 -2.4 9.3 11.2 16.9 9.5 10.1 10.5 9.9 10.1 9.5 10.0 Asia 19.9 -4.1 12.8 14.0 18.7 9.4 10.5 10.5 10.5 10.6 10.1 10.6 - China 5.8 11.9 23.0 32.0 24.7 10.0 15.1 14.4 14.7 15.7 14.2 15.6 - India 1.4 2.5 4.5 20.9 8.7 32.0 14.1 17.6 11.8 15.1 8.5 9.7 - Hong Kong 2.7 -1.9 7.4 11.4 14.6 7.2 9.0 8.3 8.8 7.9 8.4 8.7 - Korea 2.5 -17.4 31.8 6.3 12.5 5.8 7.5 8.1 7.4 7.1 8.3 7.8 - Indonesia 0.7 -14.2 -2.5 -3.7 27.2 30.8 7.5 8.7 8.6 9.3 6.0 9.2 Latin America 4.7 -0.2 -2.5 2.0 12.9 9.1 8.5 10.5 7.1 8.1 7.0 7.3 - Brazil 0.8 7.6 -10.8 -2.5 11.4 6.3 6.6 11.5 7.2 9.8 7.6 8.3 - Mexico 2.0 -2.6 1.0 1.2 11.9 8.7 8.2 10.1 6.4 6.9 6.4 6.4 Sub-Saharan Africa 1.6 12.3 0.7 3.9 7.2 11.8 11.1 12.0 10.5 9.5 9.5 9.5World 100.0 -0.2 4.1 5.9 10.9 7.3 9.0 8.7 7.4 7.4 7.0 7.3World excluding EU27 59.6 -2.0 5.9 7.6 13.3 8.2 8.7 8.4 8.1 7.5 7.6 7.8World excluding euro area 70.6 -1.0 5.7 7.1 12.7 8.1 9.6 9.1 8.1 7.6 7.5 7.7(a) Relative weights, based on imports of goods and services (at current prices and current exchange rates) in 2005.(b) Intra- and extra-EU trade.
TABLE 59 : Import shares in EU trade (goods only - 2005)Other Sub
Candidate Industr. Rest Latin SaharanEU27 Countries USA Japan Canada Countries CIS MENA Asia America Africa World
EU27 67.2 1.2 4.6 2.1 0.5 4.5 4.3 3.5 9.1 1.7 1.2 100 Belgium 74.6 0.5 6.5 2.5 0.6 2.1 1.0 3.1 7.1 0.7 1.3 100 Bulgaria 60.5 8.1 1.7 0.2 0.2 1.6 17.6 0.8 5.4 3.7 0.2 100 Czech Republic 81.5 0.5 1.5 2.0 0.2 2.4 6.3 0.5 4.7 0.2 0.2 100 Denmark 74.4 1.1 2.7 1.2 0.3 6.8 1.3 1.2 9.3 1.2 0.3 100 Germany 68.6 1.4 4.5 2.4 0.3 5.3 3.3 1.7 10.2 1.6 0.7 100 Estonia 66.9 0.5 1.3 2.2 0.2 1.3 21.1 0.1 5.6 0.6 0.1 100 Ireland 67.8 0.6 12.4 2.6 0.5 3.7 1.0 0.3 9.9 0.8 0.5 100 Greece 64.8 2.8 2.2 1.6 0.2 2.4 4.8 9.5 10.3 1.0 0.4 100 Spain 69.7 1.1 2.4 1.8 0.3 3.1 1.4 6.5 7.1 3.8 2.8 100 France 72.5 0.8 4.5 1.6 0.4 4.4 1.8 4.9 6.3 1.3 1.6 100 Italy 62.0 2.1 3.1 1.5 0.4 4.4 6.6 9.1 7.7 2.1 1.0 100 Cyprus 38.2 0.8 0.6 2.3 0.1 0.7 39.5 5.9 10.9 1.0 0.1 100 Latvia 67.6 0.9 1.9 0.6 0.3 2.5 20.0 0.3 5.3 0.6 0.0 100 Lithuania 55.8 1.1 2.7 0.4 0.2 1.7 32.2 0.4 4.8 0.7 0.0 100 Luxembourg 78.9 0.1 3.5 1.0 0.4 2.2 0.5 1.6 11.7 0.0 0.1 100 Hungary 72.2 0.8 1.6 2.9 0.1 1.3 9.9 0.2 10.5 0.3 0.1 100 Malta 54.8 7.6 3.7 1.6 0.1 2.5 3.5 1.2 24.0 0.6 0.2 100 Netherlands 49.9 0.7 7.1 3.2 0.5 4.5 7.6 4.6 16.6 3.6 1.9 100 Austria 83.6 1.1 2.2 0.9 0.3 3.8 2.9 0.9 3.2 0.2 0.6 100 Poland 75.4 0.9 1.3 1.0 0.2 2.2 11.6 0.3 5.7 1.0 0.3 100 Portugal 76.8 0.6 1.7 1.1 0.2 2.2 3.5 4.3 3.9 2.7 3.0 100 Romania 70.2 4.8 1.6 0.5 0.3 1.5 13.1 1.1 5.5 1.3 0.2 100 Slovenia 83.2 6.1 1.3 0.7 0.3 1.6 1.1 1.0 3.5 1.0 0.1 100 Slovakia 80.2 0.5 0.5 0.7 0.1 1.0 12.4 0.1 4.3 0.1 0.0 100 Finland 60.5 0.5 3.4 2.9 0.5 3.8 12.1 0.2 14.6 1.4 0.3 100 Sweden 75.4 0.7 3.4 1.8 0.3 7.7 2.5 0.7 5.8 1.3 0.3 100 United Kingdom 59.1 1.3 7.9 3.1 1.3 7.9 2.0 2.3 12.0 1.5 1.6 100

- 157 -
TABLE 60 : World merchandise trade balances (fob-fob, bn. US dollars, 2000-2008) 23.04.2007
2006 2007 2008 2000 2001 2002 2003 2004 2005 X-2006 IV-2007 X-2006 IV-2007 X-2006 IV-2007
EU27 -5.9 41.6 92.0 85.9 63.2 -21.6 -67.9 -91.7 -81.2 -102.1 -106.2 -136.3 EU27, adjusted ¹ : : : : : -130.2 : -201.3 : -218.3 : -253.4 Euro area 50.5 104.7 164.8 165.6 176.3 111.6 91.0 86.5 100.7 116.5 93.7 103.9 Euro area, adjusted ¹ 29.2 65.5 120.6 118.6 128.6 59.9 50.4 34.3 59.5 61.2 52.5 48.2 Candidate Countries -27.0 -8.6 -14.4 -19.4 -31.1 -49.6 -58.6 -57.2 -66.9 -62.1 -73.2 -64.5USA -459.2 -436.7 -491.7 -559.5 -676.4 -791.3 -864.3 -844.0 -883.8 -823.1 -921.6 -870.7Japan 116.6 70.2 93.8 105.8 132.2 126.3 83.2 110.1 70.6 119.4 69.9 122.4Canada 45.1 45.6 36.5 40.2 50.3 53.5 47.0 47.9 40.7 44.0 37.2 41.1Norway 26.0 25.8 23.4 27.0 32.4 46.9 57.2 55.9 58.9 69.4 51.7 81.9Switzerland -2.5 -2.8 3.3 3.2 5.4 2.5 2.8 2.0 1.2 0.7 0.3 0.1Iceland -0.5 -0.1 0.2 -0.2 -0.5 -1.5 -2.3 -2.3 -2.2 -2.3 -1.9 -2.0Australia -4.8 1.7 -5.5 -15.3 -18.0 -13.4 -9.2 -8.2 -9.1 -1.9 -12.6 0.3New Zealand 0.6 1.4 0.1 -0.5 -1.4 -2.7 -2.3 -1.9 -2.4 -0.2 -3.1 -0.2Industrialised countries -311.6 -261.7 -262.4 -332.8 -443.9 -650.8 -814.3 -789.3 -874.3 -758.2 -959.5 -827.8Others 252.7 188.3 211.0 281.3 357.4 490.6 578.5 613.1 595.6 613.9 589.7 630.6CIS 63.4 49.9 49.2 62.3 92.3 124.2 144.0 152.0 127.5 125.6 106.4 96.9MENA 105.3 69.4 68.2 91.4 115.3 186.7 265.5 258.7 274.8 253.6 296.5 284.8Other emerging markets 84.0 69.1 93.5 127.6 149.8 179.7 169.0 202.5 193.3 234.6 186.8 248.9 Asia 53.1 54.6 64.5 90.2 91.3 96.3 81.4 94.2 82.0 102.8 73.2 105.5 Latin America 10.2 1.1 15.8 24.0 31.5 42.6 53.4 53.2 63.8 64.2 65.3 68.7 Sub-Saharan Africa 20.6 13.4 13.3 13.5 27.0 40.8 34.1 55.0 47.5 67.6 48.3 74.8World -59.0 -73.3 -51.4 -51.5 -86.5 -160.3 -235.8 -176.2 -278.7 -144.3 -369.8 -197.1¹ See note 8 on concepts and sources.
TABLE 61 : World current account balances (bn. US dollars, 2000-2008) 2006 2007 2008 2000 2001 2002 2003 2004 2005 X-2006 IV-2007 X-2006 IV-2007 X-2006 IV-2007
EU27 -67.8 -24.5 33.3 16.9 31.1 -63.8 -87.4 -102.4 -76.8 -109.6 -83.4 -138.1 EU27, adjusted ¹ : : : : : -90.8 : -129.6 : -138.5 : -167.2 Euro area -20.7 10.3 60.0 39.3 75.4 -2.3 -9.0 -3.1 9.3 21.2 10.4 12.1 Euro area, adjusted ¹ -81.9 -19.8 53.8 36.6 69.1 -10.2 -40.7 -11.0 -23.0 12.8 -21.8 3.7 Candidate Countries -9.8 3.4 -1.5 -8.0 -15.6 -29.4 -32.9 -39.1 -42.5 -43.1 -47.2 -44.9USA -396.6 -370.4 -458.3 -512.3 -649.1 -771.3 -851.1 -812.1 -893.5 -807.2 -942.2 -869.4Japan 119.5 87.7 113.0 136.1 172.2 190.2 154.8 171.6 134.1 181.1 126.7 182.4Canada 23.6 21.9 14.0 11.6 20.7 27.0 17.0 22.4 8.7 17.9 4.5 12.8Norway 25.3 27.5 24.2 27.7 32.9 46.7 56.6 57.0 54.7 72.6 40.5 85.2Switzerland 29.6 21.0 20.9 40.1 46.9 54.1 51.2 57.9 53.8 64.6 53.0 71.2Iceland -0.8 -0.3 -0.1 0.9 1.9 2.9 -3.0 -2.9 -2.5 -2.4 -1.8 -1.8Australia -15.3 -7.9 -16.5 -29.7 -40.1 -42.1 -42.8 -41.6 -41.4 -36.7 -45.5 -34.7New Zealand -2.7 -1.4 -2.5 -3.5 -6.5 -9.6 -7.4 -7.5 -6.7 -5.9 -7.2 -6.0Industrialised countries -295.0 -243.0 -273.5 -320.2 -405.6 -595.4 -744.9 -696.7 -812.1 -668.9 -902.4 -743.5Others 167.1 110.8 137.1 207.1 275.4 381.1 494.6 518.9 482.5 509.9 471.3 528.0CIS 48.1 33.1 30.1 36.1 62.6 87.4 115.1 100.7 87.1 94.2 59.0 60.0MENA 68.0 34.5 31.3 57.4 86.1 158.0 281.1 271.5 292.1 267.7 315.7 300.6Other emerging markets 51.0 43.2 75.6 113.6 126.7 135.7 98.4 146.7 103.4 148.0 96.6 167.4 Asia 52.7 60.2 73.6 105.3 109.4 100.5 60.2 86.3 49.2 72.5 46.9 87.0 Latin America -4.6 -12.0 6.2 12.8 14.4 27.1 23.5 26.2 30.4 34.0 29.6 36.3 Sub-Saharan Africa 2.9 -4.9 -4.1 -4.5 2.9 8.1 14.7 34.3 23.8 41.5 20.1 44.1World -127.9 -132.2 -136.5 -113.1 -130.2 -214.3 -250.3 -177.8 -329.6 -159.0 -431.1 -215.5¹ See note 8 on concepts and sources.
TABLE 62 : Primary commodity prices (in US dollars, percentage change on preceding year, 2000-2008)SITC 2006 2007 2008Classification 2000 2001 2002 2003 2004 2005 X-2006 IV-2007 X-2006 IV-2007 X-2006 IV-2007Food (0 + 1) 0.4 0.3 0.6 1.3 7.2 3.9 14.0 15.3 5.3 13.0 1.5 4.2Basic materials (2 + 4) 5.4 -7.0 1.0 8.7 17.8 9.4 27.0 33.9 -0.3 14.0 -5.7 -2.3- of which : Agricultures non-food 1.5 -5.2 4.6 7.3 6.7 -2.6 5.0 12.1 1.3 13.9 0.1 1.5 - of which : Wood and pulp 3.4 -10.7 -3.3 6.8 13.3 3.2 -0.8 9.3 -5.2 3.5 -4.1 -4.2 Minerals and metals 11.4 -9.6 -4.3 10.9 35.2 24.0 49.3 54.7 -1.3 14.0 -10.0 -4.9Fuel products (3) 47.9 -9.1 -0.3 11.8 31.8 45.0 19.7 18.3 1.0 -0.1 2.4 5.8- of which : Crude petroleum 59.6 -12.7 0.1 13.9 33.4 44.7 21.3 20.2 1.1 0.0 2.6 6.2Primary commodities- Total excluding fuels 3.7 -4.6 0.9 6.1 14.3 7.7 23.2 28.4 1.2 13.7 -3.7 -0.6- Total including fuels 23.8 -7.7 0.7 9.0 23.5 28.6 21.0 22.0 1.1 5.2 0.1 3.1
Crude petroleum - price per barrel (us dollar)Brent 28.6 25.0 25.0 28.5 38.0 55.1 65.6 66.2 66.3 66.2 68.0 70.3

- 158 -
Note on concepts and sources
1. The directorate general for economic and financial affairs (DG ECFIN) produces, under its own responsibility, short-term fully-fledged economic forecasts twice a year: in the spring and in the autumn. These forecasts cover the principal macroeconomic aggregates for the Member States, the Candidate Countries, the European Union as a whole, the euro area and the international environment. Interim forecasts, updating the outlook for the seven largest Member States, EU27 and the euro area, are presented in between the fully-fledged forecasts.
2. Data for 2006 are estimates, while those for 2007 and 2008 are forecasts, except in the case of Greece where also the data for 2006 are forecasts since Eurostat is currently verifying the revised GDP data provided by the national authorities. The sources for all tables are the Commission services, except where it is otherwise stated. Historical data for the Member States are based on the European System of Accounting (ESA 1995). Most Member States have now introduced chain-linking in their national accounts to measures the development of economic aggregates in volume terms. For the USA and Japan, the definitions are as in the SNA.
3. Tables 5 and 6 on domestic demand and final demand respectively, present data including inventories.
4. In Table 16, the data are based on the national index for USA and Japan, and for EU Member States and aggregates prior to 1996.
5. The potential output gap is calculated with reference to potential output as estimated via a production function, where the increase in the capital stock and the difference between actual unemployment and the NAWRU play a key role.
6. Employment data are based on numbers of persons employed in tables 21-27 and 31-32. For Germany, Estonia, Spain, France, Italy, Hungary, the Netherlands and Austria full-time equivalents are available and used, while data for the remaining Member States as well as for the EU- and euro area aggregates refer to the total numbers of persons employed.
7. The nominal short term interest rates are defined as the 3-month inter-bank rates. The nominal long term interest rates are defined as the yield on the central government benchmark 10-year bond.
8. EU27 and euro-area data are aggregated using exchange rates. World GDP is aggregated using Purchasing Power Standards (PPS). In the tables on world trade and international payments, the aggregation is carried out on the basis of current exchange rates. Tables 48-52, 60 and 61 show also EU27 and euro-area "adjusted" balances. Theoretically, balances of EU27 and euro area vis-à-vis third countries should be identical to the sum of the balances of the individual countries in the EU27 or the euro area. However, intra-EU27 or intra-euro-area balances are non-zero because of reporting errors.
The creation of the internal market in 1993 reduced border controls and formalities, and accordingly the scope and precision of intra-EU trade coverage. Typically, intra-EU imports are underestimated compared to intra-EU exports, leading to an overestimation of the surplus. For the past the "adjusted" balances are Eurostat estimates for EU27 and ECB estimates for the euro area. For the future, they are ECFIN's forecasts based on the extrapolation of the discrepancies observed in 2005.
9. The allocation of mobile phone licences (UMTS) impacts strongly on the general government accounts for some countries in 2000-2007. Tables 35, 37 and 39 include the amounts from the sale of the licences, while the cyclically adjusted balances in tables 40 and 41 exclude these amounts. The amounts in bn of national currency are for BE 0.5, for CZ 7.4, for DK 3.2, for DE 50.8, for EE 0.2, for IE 0.2, for EL 0.7, for ES 0.5, for FR 1.8, for IT 13.8, for HU 52.0, for NL 2.7, for AT 0.8, for PL 8.2, for PT 0.4, for SI 0.1, for SK 3.0, for UK 22.5, for EU27 110.5, and for the euro area 72.3.
10. With respect to the 12 RAMS (recently-acceded Member States), which are currently in a transition phase, the quality of statistical data may not always be directly comparable to most EU15 Member States.
11. Geographical zones are defined as follows: Euro area : EUR13 (BE, DE, IE, EL, ES, FR, IT, LU, NL, AT, PT, SI, FI) Candidate countries : Croatia, Turkey and Former Yugoslav Republic of Macedonia.
Industrialised Countries : EU27, Candidate Countries, USA, Japan, Canada, Norway, Switzerland, Iceland, Australia and New Zealand.
MENA (Middle East and Northern Africa) : Algeria, Bahrain, Egypt, Iran, Iraq, Israel, Jordan, Kuwait, Lebanon, Libya, Morocco, Oman, Qatar, Saudi Arabia, Syria, Tunisia, United Arab Emirates and Yemen.
Asia : All countries except Japan and the Asian MENA countries.
Latin America : All countries.
Sub-Saharan Africa : All countries except the African MENA countries.