estcp cost and performance report - frtr · ri remedial investigation ... voc volatile organic...
TRANSCRIPT
ESTCPCost and Performance Report
ENVIRONMENTAL SECURITYTECHNOLOGY CERTIFICATION PROGRAM
U.S. Department of Defense
(ER-0219)
Comparative Demonstration of Active and Semi- Passive In Situ Bioremediation Approaches for Perchlorate-Impacted Groundwater at LonghornArmy Ammunitions Plant
i
COST & PERFORMANCE REPORT ESTCP Project: ER-0219
TABLE OF CONTENTS
Page
1.0 EXECUTIVE SUMMARY ....................................................................... 1 1.1 BACKGROUND........................................................................... 1 1.2 OBJECTIVES OF THE DEMONSTRATION ....................................... 1 1.3 IMPLEMENTATION ISSUES.......................................................... 2
2.0 INTRODUCTION.................................................................................. 3 2.1 BACKGROUND........................................................................... 3 2.2 OBJECTIVES OF THE DEMONSTRATION ....................................... 4 2.3 REGULATORY DRIVERS.............................................................. 5
3.0 TECHNOLOGY.................................................................................... 7 3.1 TECHNOLOGY DESCRIPTION ...................................................... 7 3.2 ADVANTAGES AND LIMITATIONS OF THE TECHNOLOGY .............. 8
4.0 PERFORMANCE OBJECTIVES...............................................................11 4.1 EASE OF INSTALLATION ...........................................................11 4.2 EASE OF ELECTRON DONOR DELIVERY EVENTS .........................11 4.3 ENHANCEMENT OF MICROBIOLOGICAL ACTIVITY ......................12 4.4 EASE OF PERFORMANCE MONITORING AND VALIDATION............12 4.5 REDUCTION IN PERCHLORATE CONCENTRATION........................12 4.6 RADIUS OF INFLUENCE AND DISTANCE FOR DEGRADATION........13
5.0 SITE DESCRIPTION.............................................................................15 5.1 SITE LOCATION AND HISTORY...................................................15 5.2 SITE GEOLOGY AND HYDROGEOLOGY .......................................16 5.3 CONTAMINANT DISTRIBUTION ..................................................16
6.0 DESIGN.............................................................................................19 6.1 CONCEPTUAL EXPERIMENTAL DESIGN ......................................19 6.2 BASELINE CHARACTERIZATION.................................................19 6.3 LABORATORY TREATABILITY STUDY RESULTS...........................19 6.4 DESIGN AND LAYOUT OF TECHNOLOGY COMPONENTS ...............19
6.4.1 Groundwater Modeling .........................................................21 6.5 FIELD TESTING ........................................................................25
6.5.1 Tracer Testing....................................................................25 6.5.2 Electron Donor Amendment and System Monitoring......................25
6.6 SAMPLING METHODS................................................................27 6.7 SAMPLING RESULTS .................................................................27
TABLE OF CONTENTS (continued)
Page
ii
6.7.1 Baseline Conditions..............................................................27 6.7.1.1 Groundwater Elevation Monitoring .............................27 6.7.1.2 Groundwater Chemistry...........................................27
6.7.2 Results of Tracer Testing.......................................................34 6.7.2.1 Results of First Tracer Testing...................................34 6.7.2.2 Results of Second Tracer Test....................................35
6.7.3 Results of Perchlorate Analysis................................................35 6.7.4 Results of Oxidation Reduction Potential (ORP) Monitoring.............39 6.7.5 Results of Volatile Fatty Acids (VFA) Analysis............................39 6.7.6 Results of Sulfate Analysis .....................................................39 6.7.7 Results of Iron, Manganese, and Arsenic Analysis ........................39 6.7.8 Groundwater Elevations ........................................................42
7.0 PERFORMANCE ASSESSMENT .............................................................43 7.1 EASE OF INSTALLATION ...........................................................43 7.2 EASE OF ELECTRON DONOR DELIVERY EVENTS .........................44 7.3 ENHANCEMENT OF MICROBIOLOGICAL ACTIVITY ......................44 7.4 EASE OF PERFORMANCE MONITORING AND VALIDATION............45 7.5 REDUCTION IN PERCHLORATE CONCENTRATION........................46 7.6 RADIUS OF INFLUENCE AND DISTANCE FOR DEGRADATION........47
8.0 COST ASSESSMENT ............................................................................49 8.1 COST MODEL ...........................................................................49 8.2 COST DRIVERS .........................................................................55 8.3 COST ANALYSIS .......................................................................57
9.0 IMPLEMENTATION ISSUES..................................................................63 9.1 ADDITIONAL SOURCES OF INFORMATION...................................63 9.2 POTENTIAL ENVIRONMENTAL ISSUES ........................................63
9.2.1 Regulatory Issues ................................................................63 9.2.2 Air Discharge ....................................................................63 9.2.3 Wastewater Discharge ..........................................................63 9.2.4 Waste Storage, Treatment, and Disposal ....................................63
9.3 END-USER ISSUES .....................................................................64 9.4 PROCUREMENT ISSUES .............................................................64 9.5 DESIGN ISSUES.........................................................................64
10.0 REFERENCES.....................................................................................65 APPENDIX A POINTS OF CONTACT......................................................................... A-1

iii
LIST OF FIGURES
Page Figure 1. Summary of site geology and hydrogeology. ....................................................... 17 Figure 2. Plan view of test area wells................................................................................... 20 Figure 3. Cross section A-A'. ............................................................................................... 22 Figure 4. Numerical model simulation (March 2004 conditions). ....................................... 23 Figure 5. Numerical model simulation (November 2005 conditions).................................. 24 Figure 6. Comparison of perchlorate concentrations in groundwater. ................................. 32 Figure 7. Pre- and post-treatment perchlorate concentrations.............................................. 36 Figure 8. Perchlorate concentrations with time in Transect 1. ............................................. 37 Figure 9. Perchlorate concentrations with time in 16EW09. ............................................... 40 Figure 10. Post treatment iron concentrations in groundwater. ............................................. 41 Figure 11. Base case plume and biobarrier configuration...................................................... 51 Figure 12. Cumulative costs for perchlorate treatment. ......................................................... 60

iv
LIST OF TABLES
Page Table 1. Performance objectives......................................................................................... 11 Table 2. Summary of system operation and monitoring..................................................... 26 Table 3. Summary of groundwater monitoring results. ...................................................... 28 Table 4. Summary of tracer test results............................................................................... 34 Table 5. Performance objectives and results....................................................................... 43 Table 6. Site characteristics and design parameters for EISB of perchlorate-impacted
groundwater. ......................................................................................................... 50 Table 7. Summary of costs for treatment of perchlorate-impacted groundwater. .............. 58 Table 8. Impact of site characteristics and design parameters on costs for semi-
passive EISB. ........................................................................................................ 61

v
ACRONYMS AND ABBREVIATIONS μg/L micrograms per Liter μmol/L micromoles per Liter AFCEE Air Force Center for Engineering and the Environment bgs below ground surface CES Complete Environmental Service cis-1,2-DCE cis-1,2-Dichloroethene cm/sec centimeters per second Dem/Val demonstrate/validate DO dissolved oxygen DoD Department of Defense EISB enhanced in situ bioremediation ESTCP Environmental Security Technology Certification Program EVO emulsified vegetable oil FFA Federal Facility Agreement ft feet Geosyntec Geosyntec Consultants gpm gallons per minute GW groundwater ITRC Interstate Technology & Regulatory Council K hydraulic conductivity LHAAP Longhorn Army Ammunition Plant NASA National Aeronautics and Space Administration NAVFACESC Naval Facilities Engineering Command/Engineering Service Center NPV net present value O&M operation and maintenance OM&M operation, maintenance, and monitoring ORP oxidation reduction potential PQL practical quantitation limit P&T pump-and-treat
ACRONYMS AND ABBREVIATIONS (continued)
vi
RI remedial investigation SERDP Strategic Environmental Research and Development Program STL Severn Trent Laboratories TCE trichloroethene TNRCC Texas Natural Resource Conservation Commission TNT 2,4,6-trinitrotoluene USEPA U.S. Environmental Protection Agency VC vinyl chloride VFA volatile fatty acid VOC volatile organic compounds
Technical material contained in this report has been approved for public release.
vii
ACKNOWLEDGEMENTS Funding of this work was provided by the Department of Defense (DoD), Environmental Security Technology Certification Program (ESTCP). The authors wish to thank Dr. Andrea Leeson and Dr. Jeffery Marqusee of ESTCP and Bryan Harre of the Naval Facilities Engineering Command/Engineering Service Center (NAVFACESC) for their support during the demonstration and for comments provided on the work and on the report. Field work was organized and conducted by David Bertrand, Grant Scholes, and Natasha Barros of Geosyntec and by Bill Corrigan of Complete Environmental Service (CES). Microbial characterization and chemical analysis were conducted by Dr. John Coates of BioInsite, LLC. The work would not have been possible without the cooperation and support from many individuals at the U.S. Army and the U.S. Army Corps of Engineers, including Andy Abrochta, Cliff Murray, and Rose Zeiler.

This page left blank intentionally.
1
1.0 EXECUTIVE SUMMARY
1.1 BACKGROUND
Perchlorate is an inorganic anion and a primary ingredient in solid rocket propellant. It exhibits high solubility and mobility in water and has been identified in groundwater at numerous sites across the United States. Enhanced in situ bioremediation (EISB) of perchlorate-impacted groundwater offers a simple approach to treat and destroy perchlorate in the subsurface. This report describes work conducted to demonstrate/validate the use of a semi-passive EISB approach at the Longhorn Army Ammunition Plant (LHAAP) in Texas. The semi-passive EISB approach involves periodic (e.g., two or three times per year) delivery of electron donor to create a biologically active zone for the purposes of promoting perchlorate biodegradation either as a biobarrier across a plume or for treatment of other target treatment zones. The semi-passive biobarrier approach involves the use of extraction and injection wells to add and mix the electron donors in the subsurface. Once electron donor is delivered, recirculation is shut off, and the electron donor promotes in situ biological treatment of the perchlorate.
1.2 OBJECTIVES OF THE DEMONSTRATION
The overall objective of this work was to demonstrate the efficacy of the semi-passive approach to EISB to generate accurate full-scale design and cost information for widespread technology consideration and application. The demonstration was designed to evaluate performance objectives, including 1) the ease of installation of system components, 2) the ease of electron donor delivery events, 3) the enhancement of microbiological activity and the reduction in perchlorate concentrations, 4) the ease of performance monitoring and validation, and 5) the radius of influence and distance for degradation. Demonstration Results Based on the experience and observations made during the demonstration, the performance objectives for the demonstration were achieved. The results of the field demonstration phase of the work showed the following:
1. The data demonstrate that significant reductions in perchlorate concentrations can be achieved using EISB for perchlorate. At the end of the demonstration, perchlorate concentrations were reduced from levels over 800 micrograms per liter (μg/L) to less than 4 μg/L in 10 of 13 shallow wells within and downgradient of the biobarrier, and the concentrations in the other wells ranged from 7 to 10 μg/L. The average concentration of perchlorate in shallow wells within and downgradient of the biobarrier following the final addition of electron donor was 3.4 μg/L.
2. Following the final injection of electron donor, the concentrations of iron,
manganese, and arsenic in groundwater samples increased within the area of the biobarrier relative to the upgradient concentrations, but the concentrations in wells downgradient of the biobarrier declined significantly.

2
An assessment of the costs to implement EISB for perchlorate-impacted groundwater using the semi-passive approach was also conducted. A cost model was developed for a template site based on a typical site with perchlorate impacts in shallow groundwater. Cost estimates were prepared for four different approaches to EISB and a conventional pump-and-treat (P&T) system to provide points of comparison with the EISB approaches. The cost model focused on treatment of a contaminated plume of groundwater and did not include costs for possible source zone treatment. The cost assessment includes estimates of the net present value (NPV) of 30 years of future costs to help assess the life-cycle costs. NPV and total costs are presented below.
Semi-Passive
Biobarrier Passive
Biobarrier Active
Biobarrier Trench Biowall
P&T
NPV of 30 years of total remedy costs
$1,560,000 $1,620,000 $1,980,000 $1,450,000 $2,310,000
Total 30-year remedy costs
$2,060,000 $2,250,000 $2,700,000 $2,040,000 $3,160,000
1.3 IMPLEMENTATION ISSUES
Many guidance documents are available from organizations such as U.S. Environmental Protection Agency (USEPA), Interstate Technology & Regulatory Council (ITRC), and Air Force Center for Engineering and the Environment (AFCEE) dealing with EISB for perchlorate and chlorinated solvents. Many design issues with EISB for chlorinated solvents are also common to perchlorate. The Strategic Environmental Research and Development Program (SERDP) and Environmental Security Technology Certification Program (ESTCP) recently published a monograph, “In Situ Bioremediation of Perchlorate in Groundwater,” based in part on the work described in this Cost and Performance Report. This monograph contains information on the various options for treatment of perchlorate-impacted groundwater and on the design for these options, including the semi-passive approach to EISB. Key implementation issues that need to be considered with this technology are regulatory issues, end-user issues, and design issues. The implementation of EISB in most jurisdictions requires a groundwater reinjection permit. End users will have an interest in the technology because of its ability to treat groundwater in situ at an overall cost much less than for conventional P&T remediation approaches. End users and other stakeholders may have concerns regarding 1) the effectiveness of the technology in reducing concentrations of target compounds below appropriate criteria and 2) potential negative impacts of excess electron donor on water quality downgradient of the treatment zone. Design issues to be considered include treatment of sites with 1) low hydraulic conductivity, 2) significant variations in hydraulic conductivity, 3) high concentrations of competing electron acceptors, and 4) high concentrations of naturally occurring metals in the subsurface soil.
3
2.0 INTRODUCTION
This Cost and Performance Report has been prepared by Geosyntec Consultants (Geosyntec) for ESTCP to present a summary of the results of the semi-passive EISB demonstration that was conducted at the LHAAP in northeast Texas. This work was conducted as part of ESTCP Project ER-0219, “Comparative Demonstration of Active and Semi-Passive In Situ Bioremediation Approaches for Perchlorate Impacted Groundwater.” Additional details of the demonstration test are presented in the “Final Report, Comparative Demonstration of Active and Semi-Passive In Situ Bioremediation Approaches for Perchlorate Impacted Groundwater: Semi-Passive Bioremediation Demonstration” (Geosyntec, 2008). Section 1 of this report presents background information and summarizes the objectives of the demonstration. Section 3 describes the semi-passive bioremediation technology demonstrated in this work. Section 4 presents the performance objectives for the demonstration. Section 5 presents information on the LHAAP site where the demonstration was conducted. Section 6 presents the test design and results of the demonstration. Section 7 presents the results of the performance assessment. Section 8 presents a cost assessment of the technology, and Section 9 discusses potential implementation issues with technology.
2.1 BACKGROUND
Perchlorate (ClO4-) is an inorganic anion that consists of chlorine bonded to four oxygen atoms.
It is a primary ingredient in solid rocket propellant and has been used for decades in the manufacturing, testing, and firing of rockets and missiles. Much of the several million pounds of perchlorate produced in the United States each year is used by the military and National Aeronautics and Space Administration (NASA), but private industry has used perchlorate to manufacture products such as fireworks, safety flares, automobile airbags, and commercial explosives. Perchlorate exhibits high solubility and mobility in water and is very stable, being degraded only under anaerobic conditions. When perchlorate is released into a typical groundwater or surface water environment, it tends to persist and can migrate to great distances (many miles) in groundwater, as has been observed at many sites. Perchlorate released to the subsurface many decades ago can also be retained in the pore spaces of low permeability materials such as silts and clays, representing a long-term threat to groundwater and surface water. Conventional technologies for the treatment of perchlorate-impacted groundwater are expensive. In California alone, the costs for remediation of perchlorate-impacted groundwater are expected to be in the billions of dollars. Of the technologies being developed, bioremediation, is among the most promising, because it has the potential to destroy perchlorate rather than transferring it to another waste stream (e.g., impacted resin or brine) requiring costly treatment or disposal. Recent bench- and small-scale field demonstrations are providing strong evidence that in situ bioremediation can provide a less costly and less operation and maintenance (O&M)-intensive approach to remediating perchlorate-impacted groundwater. Specifically, EISB has potential to both destroy perchlorate source areas and control the migration of the perchlorate plumes that are threatening drinking water supplies.

4
One of the main factors that affects the success and cost of in situ bioremediation systems is the effectiveness of nutrient (electron donor) delivery and mixing in the subsurface. A variety of active, semi-passive and fully passive electron donor delivery systems have been employed to promote contaminant biodegradation. As further discussed in Section 4, each of these delivery configurations has associated benefits and limitations with respect to ease of implementation and cost. This report describes work conducted to demonstrate/validate (Dem/Val) a semi-passive EISB approach at a relatively shallow site at LHAAP in Texas.
2.2 OBJECTIVES OF THE DEMONSTRATION
The specific overall objectives of this technology demonstration were to:
Demonstrate that perchlorate can be biodegraded in situ to acceptable levels (i.e., the practical quantitation limit [PQL]) using in situ bioremediation with a semi-passive electron donor delivery methodology
Evaluate the effectiveness of the electron donor delivery approach under in situ
conditions, and generate design and performance data for full-scale application using this approach (e.g., cost per unit area or unit volume groundwater treated)
Evaluate the effects of the electron donor delivery approach on the acclimation,
development, and stability of the in situ microbial communities Evaluate the effects of the electron donor delivery approach on groundwater
quality (e.g., production of sulfides or methane, or mobilization of dissolved metals), and assess its suitability for use in drinking water aquifers (to address direct regulatory concerns)
Identify design and operational factors that influence successful implementation
and continued operation of the in situ bioremediation approach. The specific performance objectives for the demonstration were achieved as discussed below.
The ease of installation of electron donor delivery components. This objective was achieved based on experience with the actual installation of the electron donor delivery system at the LHAAP Site. The equipment for the injection of electron donor and short-term circulation of groundwater was readily available through local drillers and plumbing suppliers. The procedures used to install the wells, pumps, and piping were standard for local licensed drillers and the procedures were simple enough to be conducted by field technicians with minimal special training.
The ease of electron donor delivery events. This objective was achieved based on
experience of field staff with the actual electron donor delivery events who reported that the procedures were simple and completed with minimal training and effort.
5
The enhancement of microbiological activity. This objective was achieved based
on the results of chemical and geochemical characterization. Groundwater monitoring data for chemical and geochemical parameters demonstrated that electron donor addition enhanced microbiological activity in the treatment zone. The significant and sustained reductions in perchlorate concentrations in groundwater observed following addition of electron donor provide additional indication that biological activity was enhanced by the addition of electron donor and that this biological activity included microorganisms capable of degradation of perchlorate.
The ease of performance monitoring and validation. This objective was achieved
based on the data obtained during the demonstration. The quality of the data obtained and the ability to interpret this data and quantify biodegradation with confidence demonstrates that the performance monitoring network allowed for straightforward data collection, interpretation, and validation.
The reduction in perchlorate concentrations. This objective was achieved based
on groundwater sampling of performance monitoring wells, which demonstrated that the average perchlorate concentrations were reduced to below the PQL of 4 µg/L.
The radius of influence and distance for degradation. This objective was
achieved based on groundwater sampling results from performance monitoring wells during the tracer tests and following electron donor delivery cycles, which demonstrated that the radius of influence for electron donor extends between all recirculation wells and that perchlorate was degraded before groundwater reached downgradient performance monitoring wells.
2.3 REGULATORY DRIVERS
The USEPA and various states are currently evaluating perchlorate in drinking water, but Interim guidelines have been published and range between 4 and 18 μg/L. While ex situ treatment alternatives exist for perchlorate-impacted groundwater, they are often cost-intensive, and therefore, this demonstration seeks to validate a more cost-effective technology that can meet the pending remediation goals. For this demonstration, the remediation target was reduction of perchlorate concentrations to the current common PQL, which is 4 μg/L in most jurisdictions.

This page left blank intentionally.
7
3.0 TECHNOLOGY
This section describes the semi-passive EISB technology that is the subject of the demonstration described in this report. Section 3.1 provides a description of the technology, and Section 3.2 discusses the advantages and limitations of the technology.
3.1 TECHNOLOGY DESCRIPTION
Enhanced in situ bioremediation has proven to be a cost-effective approach for the treatment of perchlorate-impacted groundwater under many different site conditions. One of the main factors that affects the success and cost of EISB systems is the effectiveness of nutrient (electron donor) delivery. A variety of active, semi-passive, and fully passive electron donor delivery systems has been employed to promote in situ biodegradation. Each of these delivery configurations has associated benefits and limitations with respect to ease of implementation and cost. Active EISB systems have been shown to be effective (Geosyntec, 2002) in providing migration control over reasonably wide (and deep) perchlorate plumes with only a few extraction and injection wells. However, due to the continuous operation of active systems, permanent ex situ infrastructure is required, and O&M costs are high. By comparison, passive systems employing slow-release electron donors do not require permanent ex situ infrastructure and minimize short term O&M costs, but the tight spacing of the injection points or wells makes the capital costs of the installations prohibitive for large and/or deep plumes. Longer term O&M costs for reinjection of additional electron donor required every 2 to 4 years can also be high. Passive systems also involve injecting large quantities of electron donor at one time and can have significant negative impacts on secondary water quality characteristics. The goal of the semi-passive bioremediation approach is to integrate the best aspects of both the active approach (wider well spacing and less impact on secondary water quality characteristics) and the passive approach (minimal permanent ex situ infrastructure, lower O&M), in order to optimize the balance of capital and O&M costs for bioremediation deployment. Semi-passive EISB of perchlorate involves the addition of electron donor on a periodic basis to stimulate natural microorganisms. Semi-passive EISB approaches are similar to active approaches in that groundwater is recirculated between injection and extraction wells; however, with the semi-passive approach, groundwater is recirculated for an “active phase” of a limited duration (e.g., several days to several weeks) to distribute the electron donor, and then the recirculation system is shut off for a “passive phase” of longer duration (e.g., several months). Injection and extraction wells can be configured to create a biobarrier perpendicular to groundwater flow or can be used to distribute electron donor in source areas, or throughout other target treatment zones. The semi-passive approach differs from the passive approach in that it relies on some recirculation of groundwater to distribute electron donor and it differs from the active approach in that the recirculation of groundwater is conducted on a periodic and not a continuous basis. The equipment used to implement the semi-passive approach may be mobile and moved from one area to another as required or may be a permanent installation operated on an intermittent basis.
8
As with the active remediation approaches, the electron donor used for the semi-passive approach must be sufficiently mobile to travel some distance between the injection and extraction wells in order to achieve the desired electron donor coverage. Soluble electron donors such as sodium lactate, citric acid, or ethanol have been used in field applications. Biomass grows rapidly during the active phase when high concentrations of electron donor are present. During the passive phase, biomass dies over time, providing a source of electron donor to promote additional microbial degradative activity until the next electron donor addition cycle. The high level of microbial activity also reduces natural minerals in the subsurface, leaving behind reduced minerals, which help to maintain reducing conditions after electron donor and biomass has been consumed. Semi-passive approaches are similar to passive bioremediation approaches in that electron donor is added to the subsurface, and the system is allowed to operate predominantly under natural groundwater flow conditions. The active phase of the semi-passive approach can allow for a better distribution of electron donor than is possible with the passive approach because electron donor is pushed from the injection wells and pulled towards the extraction wells of the groundwater recirculation system. In addition, because the amount of electron donor injected at any one time using the semi-passive approach is typically less than is used in passive systems, there are generally fewer impacts to secondary water quality and hydraulic conductivity. As with any bioremediation approach, groundwater quality may be adversely impacted by trace constituents present in the electron donors injected. Care must be taken in the selection of electron donors to avoid those that could cause increases in concentrations of dissolved metals or other undesirable constituents. The semi-passive approach, with periodic operation of a groundwater recirculation system, is less expensive to operate than the active approach because the recirculation system is not operated on a continuous basis. Periodic operation of the recirculation system will also result in less biofouling of the injection wells than with continuous recirculation. The semi-passive approach also allows for the use of simple equipment such as a trailer-mounted recirculation system that can be moved from one area to another in sequence.
3.2 ADVANTAGES AND LIMITATIONS OF THE TECHNOLOGY
The semi-passive EISB approach that is the subject of this demonstration can be used as an alternative to groundwater extraction and above ground treatment (P&T) or as an alternative to other EISB approaches (i.e., fully active or passive). Advantages and limitations of the semi-passive EISB approach relative to each of these alternatives are discussed below. The semi-passive EISB approach has the following advantages over P&T technologies: 1) lower capital and O&M costs; 2) will destroy perchlorate rather than simply transferring it to another medium; 3) can directly treat perchlorate in situ in source areas, or in groundwater as it pass through a linear biobarrier system; and 4) has the ability to treat co-contaminants such as trichloroethene (TCE). The semi-passive EISB approach has the following limitations over P&T technologies: 1) potential difficulties distributing electron donor in sufficient amounts to all areas of the aquifer containing perchlorate; 2) effectiveness possibly limited by the occurrence of specific

9
geochemical conditions; and 3) potential to adversely impact secondary groundwater quality if excess amounts of electron donor are added. The semi-passive EISB approach, with periodic operation of a groundwater recirculation system, has the following advantages over passive EISB approaches: 1) requires fewer wells or injection points; 2) does not inject high concentrations of electron donor at one time and therefore reduces the impacts to secondary water quality characteristics; 3) does not inject large volumes of oil emulsion that can reduce the hydraulic conductivity of the treatment zone and cause diversion of groundwater around the treatment zone. The semi-passive approach has the following limitations relative to passive approaches: 1) normally requires the installation of permanent injection wells and 2) requires periodic re-amendment of the subsurface with electron donor on a more frequent basis than most passive approaches. The semi-passive approach, with periodic operation of a groundwater recirculation system rather that continuous operation, has the following advantages over active approaches: 1) groundwater recirculation equipment of a semi-passive system does not need to be dedicated to a specific set of injection and extraction wells; 2) operating costs are significantly less than for an active system; and 3) equipment required for semi-passive operation can be less complex and is less likely to require complex controls and permitting. Relative to active approaches, the semi-passive approach results in greater variations in the concentration of electron donor than active systems but not as great as with the passive approach. The semi-passive EISB approach incorporates some of the best aspects of both the active approach (wider well spacing and less impact on secondary water quality characteristics) and the passive approach (minimal permanent ex situ infrastructure, lower O&M) in order to optimize the balance of capital and O&M costs.

This page left blank intentionally.
11
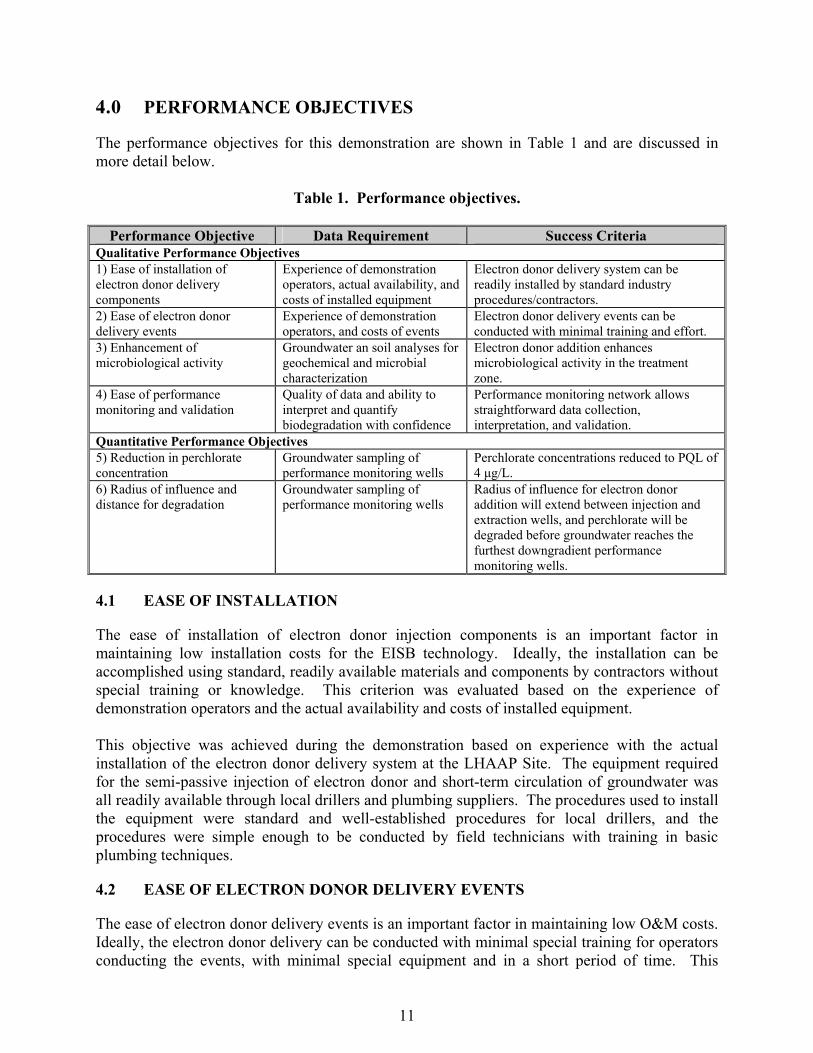
4.0 PERFORMANCE OBJECTIVES
The performance objectives for this demonstration are shown in Table 1 and are discussed in more detail below.
Table 1. Performance objectives.
Performance Objective Data Requirement Success Criteria Qualitative Performance Objectives 1) Ease of installation of electron donor delivery components
Experience of demonstration operators, actual availability, and costs of installed equipment
Electron donor delivery system can be readily installed by standard industry procedures/contractors.
2) Ease of electron donor delivery events
Experience of demonstration operators, and costs of events
Electron donor delivery events can be conducted with minimal training and effort.
3) Enhancement of microbiological activity
Groundwater an soil analyses for geochemical and microbial characterization
Electron donor addition enhances microbiological activity in the treatment zone.
4) Ease of performance monitoring and validation
Quality of data and ability to interpret and quantify biodegradation with confidence
Performance monitoring network allows straightforward data collection, interpretation, and validation.
Quantitative Performance Objectives 5) Reduction in perchlorate concentration
Groundwater sampling of performance monitoring wells
Perchlorate concentrations reduced to PQL of 4 μg/L.
6) Radius of influence and distance for degradation
Groundwater sampling of performance monitoring wells
Radius of influence for electron donor addition will extend between injection and extraction wells, and perchlorate will be degraded before groundwater reaches the furthest downgradient performance monitoring wells.
4.1 EASE OF INSTALLATION
The ease of installation of electron donor injection components is an important factor in maintaining low installation costs for the EISB technology. Ideally, the installation can be accomplished using standard, readily available materials and components by contractors without special training or knowledge. This criterion was evaluated based on the experience of demonstration operators and the actual availability and costs of installed equipment. This objective was achieved during the demonstration based on experience with the actual installation of the electron donor delivery system at the LHAAP Site. The equipment required for the semi-passive injection of electron donor and short-term circulation of groundwater was all readily available through local drillers and plumbing suppliers. The procedures used to install the equipment were standard and well-established procedures for local drillers, and the procedures were simple enough to be conducted by field technicians with training in basic plumbing techniques.
4.2 EASE OF ELECTRON DONOR DELIVERY EVENTS
The ease of electron donor delivery events is an important factor in maintaining low O&M costs. Ideally, the electron donor delivery can be conducted with minimal special training for operators conducting the events, with minimal special equipment and in a short period of time. This
12
criterion was evaluated based on the experience of operators and the costs of conducting the electron donor injection events. This objective was achieved during the demonstration based on experience of field staff with the actual electron donor delivery events. The activities and procedures required for the electron donor delivery events were simple enough to be conducted by field staff with minimal specialized training and effort.
4.3 ENHANCEMENT OF MICROBIOLOGICAL ACTIVITY
The enhancement of microbiological activity is a critical factor to the success of the EISB technology because it is this activity that degrades the perchlorate in the subsurface. This criterion was evaluated based on the results of groundwater and soil analyses for geochemical and microbial characterization. This objective was achieved during the demonstration based on the results of chemical and geochemical characterization. Groundwater monitoring data for chemical and geochemical parameters demonstrated that electron donor addition enhanced microbiological activity in the treatment zone. Significant and sustained reductions in oxidation reduction potential (ORP) were observed following addition of electron donor and provide the first indication that biological activity was enhanced by the addition of electron donor. Reduction in sulfate in wells in the immediate vicinity of the electron donor injection points also indicates enhancement of biological activity. The significant and sustained reductions in perchlorate concentrations in groundwater observed following addition of electron donor provide additional indication that biological activity was enhanced by the addition of electron donor and that this biological activity included microorganisms capable of degradation of perchlorate.
4.4 EASE OF PERFORMANCE MONITORING AND VALIDATION
The ease of performance monitoring and validation is an important factor to demonstrate that the objective of perchlorate reduction has been accomplished. This criterion was evaluated by assessing the quality of data and ability to interpret and quantify biodegradation with confidence. This objective was achieved during the demonstration based on the data obtained during the demonstration. The quality of the data obtained and the ability to interpret this data and quantify biodegradation with confidence demonstrated that the performance monitoring network allowed for straightforward data collection, interpretation, and validation.
4.5 REDUCTION IN PERCHLORATE CONCENTRATION
The reduction of perchlorate concentrations in groundwater is the most critical objective of demonstration. This is a quantitative objective of achieving an average concentration of perchlorate to the PQL of 4 μg/L. This criterion was assessed based on the results of chemical analysis of groundwater samples collected from performance monitoring wells. This objective was achieved based on groundwater sampling of performance monitoring wells that demonstrated that the average perchlorate concentrations were reduced to below the PQL of 4 μg/L in the final sampling event.
13
4.6 RADIUS OF INFLUENCE AND DISTANCE FOR DEGRADATION
The radius of influence and distance for degradation of perchlorate is an important factor in determining the effectiveness of the electron donor distribution system. This criterion was assessed based on groundwater sampling of performance monitoring wells during the tracer test and following electron donor addition to demonstrate that the radius of influence for electron donor addition extends between injection and extraction wells and that perchlorate is degraded before groundwater reaches downgradient performance monitoring wells. This objective was achieved during the demonstration based on groundwater sample results from performance monitoring wells during the tracer tests and following electron donor delivery cycles, which demonstrated that the radius of influence for electron donor extends between all recirculation wells and that perchlorate was degraded before groundwater reached downgradient performance monitoring wells.

This page left blank intentionally.

15
5.0 SITE DESCRIPTION
This section presents information on the LHAAP Site where the demonstration was conducted. Section 5.1 describes the site location and history; Section 5.2 describes the site geology and hydrogeology; and Section 5.3 describes the contaminant distribution.
5.1 SITE LOCATION AND HISTORY
LHAAP is located in central east Texas in the northeastern corner of Harrison County. LHAAP occupies nearly 8500 acres between State Highway 43 at Karnack, Texas, and the western shore of Caddo Lake. Additional maps showing the location of LHAAP and the Site 16 landfill at LHAAP are presented in the Final Report. Information on the test site history and characteristics is presented in the Final Feasibility Study for Site 16, LHAAP, Karnack, Texas (Jacobs Engineering Group, 2002). Additional information on the geology and hydrogeology is presented in the Final Remedial Investigation (RI) Report for Site 16 Landfill (Jacobs Engineering Group, 2000). A summary of the Site history and conditions is presented below. LHAAP was established in October 1942 with the primary mission to produce 2,4,6-trinitrotoluene (TNT) flake. TNT flake production continued through World War II until August 1945. From 1952 until 1956, pyrotechnic ammunition such as photoflash bombs, simulators, hand signals, and 40-millimeter (mm) tracers were produced at Plant 2. Plant 3 was the site of the rocket motor facility that operated from 1955 to 1965. Pyrotechnic and illuminating ammunition was produced at the facility until 1997. Various production activities at LHAAP could have contributed to the material disposed of in Site 16. During the 1950s, a large bermed depression in the central section of the currently capped area was reportedly used for disposal of a variety of materials such as substandard TNT, barrels of chemicals, oil, paint, scrap iron, and wood. This area was reportedly backfilled and covered, and operations continued moving eastward, raising the ground surface (before cap) to 15 ft above the original grade. Burn pits and waste storage were common at the site, but there is little documentation of these activities. It is thought that two rocket motor casings were burned and buried on the eastern side of the landfill. Site 16 was used for disposal of all types of solid and industrial waste until the 1980s when disposal activities were moved to Site 12, Landfill 12. The Site 16 landfill is no longer in use. In August 1990, the installation was placed on the National Priorities List. A Federal Facility Agreement (FFA) among the USEPA, the Army, and the Texas Natural Resource Conservation Commission (TNRCC) became effective December 30, 1991. Remedial actions conducted at Site 16 have included the installation of a groundwater extraction system and a multilayer cover. The groundwater extraction system was installed in 1996 and 1997 as a treatability study. The groundwater extracted from eight wells is piped to the Burning Ground 3 Groundwater Treatment Plant. The multilayer cap was installed at the landfill in 1998, completed as a result of an Interim Remedial Action Record of Decision signed in 1995.
16
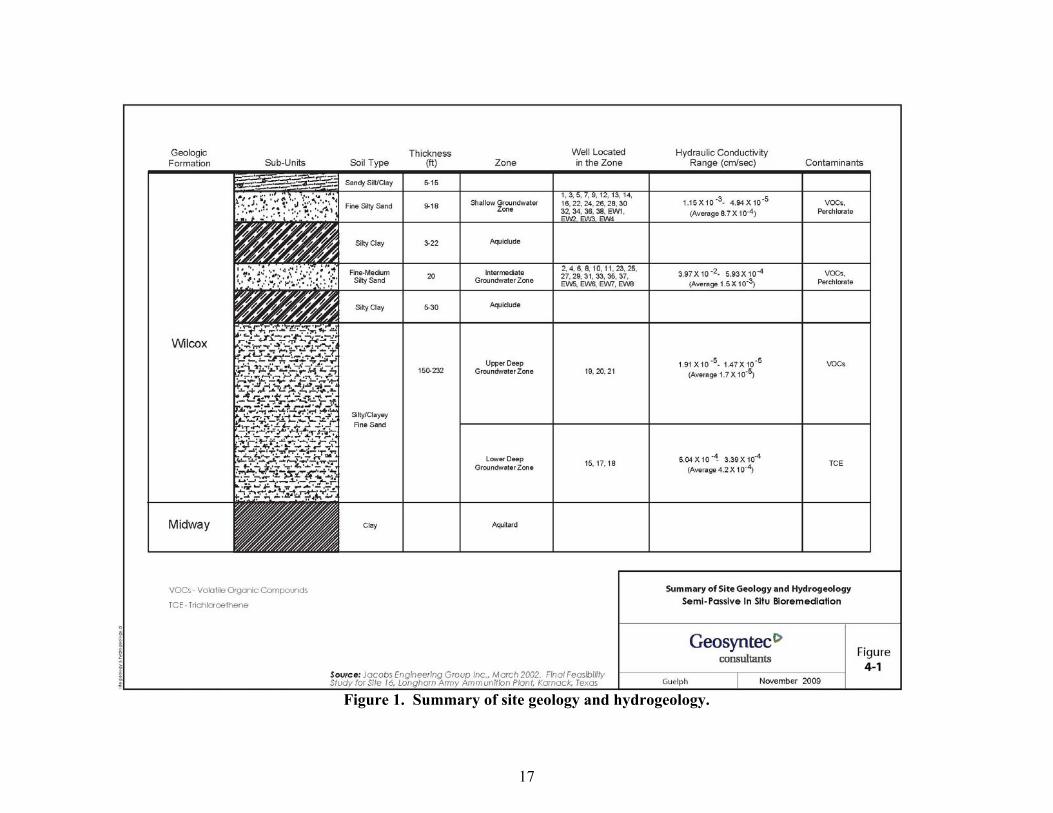
5.2 SITE GEOLOGY AND HYDROGEOLOGY
The surface soil at Site 16 is a very fine sandy loam. A silty clay loam is also found in the floodplain of Harrison Bayou where flooding occurs frequently. The subsurface geology at Site 16 consists primarily of a thin veneer of Quaternary alluvium mantling Tertiary age formations of the Wilcox and Midway Groups. Underlying these are Cretaceous age formations of the Navarro and Taylor Groups. The Wilcox Group, which constitutes a majority of the unconsolidated sediments underlying Site 16, consists of interbedded sands, silts, and clays. Figure 1 summarizes the geology of the site. Based on nearly 100 borings, monitoring wells, and geoprobe points, the subsurface hydrogeology at Site 16 can generally be characterized as consisting of three water-bearing sandy zones that are separated by semi-confining clay layers. However, there is considerable heterogeneity across the site as the sand layers vary in depth. The geologic logs from the eight groundwater extraction wells installed to the northeast of the landfill illustrate the degree of heterogeneity as the wells have diverse yields with variable transmissivity and storativity. Rising head slug tests were conducted and water level measurements were obtained for all Site 16 monitoring wells. The mean hydraulic conductivity for each zone is presented on Figure 1. The groundwater velocity is estimated to vary from 0.31 ft/year in the deep zone to 37 ft/year in the shallow and intermediate zones.
5.3 CONTAMINANT DISTRIBUTION
Groundwater in the vicinity of the Site 16 landfill is impacted by perchlorate and several chlorinated volatile organic compounds (VOC), most notably TCE, cis-1,2-Dichloroethene (cis-1,2-DCE) and vinyl chloride (VC). Perchlorate analyses were conducted on groundwater samples collected in May 2000, September 2000, and January 2001. Data from these sampling events are summarized for the shallow aquifer in the study area in the Final Report. The aerial extent of perchlorate and chlorinated solvents is similar in the shallow and intermediate aquifers; however, perchlorate is not present in the deeper water bearing zone beneath and downgradient of the landfill. Figure 1 also illustrates the vertical extent of perchlorate and VOC impacts in the shallow zone of the groundwater. Results of additional groundwater sampling conducted as part of the demonstration are presented in Section 6.
17
Figure 1. Summary of site geology and hydrogeology.

This page left blank intentionally.
19
6.0 DESIGN
This section describes the design and the results of the demonstration test. Section 6.1 presents a conceptual experimental design; Section 6.2 describes the baseline characterization that was conducted; Section 6.3 describes the results of a laboratory treatability study; Section 6.4 describes the design and layout of the technology components for the demonstration; Section 6.5 describes the field testing that was conducted; Section 6.6 describes the sampling methods; and Section 6.7 presents the results of the sampling conducted to monitor the field demonstration.
6.1 CONCEPTUAL EXPERIMENTAL DESIGN
In concept, the semi-passive biobarrier approach involved the use of alternating extraction and injection (recirculation) wells installed across a perchlorate plume. To add and mix the electron donor across the plume, groundwater was periodically extracted, amended with electron donor, and recharged to the aquifer to promote in situ biodegradation of perchlorate and prevent migration of perchlorate beyond the biobarrier. The distance between the recirculation wells was 35 ft. The time required to circulate the electron donor across the plume with the alternating extraction and injection wells was small (on the order of 2 to 3 weeks), whereas the time interval between injections was fairly large (i.e., 6 to 8 months). Once electron donor was delivered, recirculation was stopped, and the electron donor remained in the groundwater to promote biodegradation of perchlorate.
6.2 BASELINE CHARACTERIZATION
Groundwater samples were collected and analyzed to determine baseline conditions and the electron donor requirements to degrade perchlorate. One set of baseline samples was collected in June 2003. A second set of baseline samples was collected in March 2004 with the groundwater recirculation system operating, but prior to addition of electron donor. Samples were collected following sampling protocols established for the site in the Demonstration Plan.
6.3 LABORATORY TREATABILITY STUDY RESULTS
A laboratory treatability study was conducted to evaluate the potential to degrade perchlorate and chlorinated solvents, primarily TCE and cis-1,2-DCE, present in the groundwater. The results of the study are presented in Appendix B of the Final Report.
6.4 DESIGN AND LAYOUT OF TECHNOLOGY COMPONENTS
The semi-passive electron donor system included a series of five recirculation wells installed in a line perpendicular to the direction of groundwater flow. The wells were designed to be used as extraction or injection wells, as required. The target depth interval for treatment was the Shallow Groundwater Zone, as shown in Figure 1. Figure 2 shows the location of the recirculation wells, intermediate injection wells, performance monitoring wells, and soil borings in the vicinity of the demonstration area.

20
Figure 2. Plan view of test area wells.
21
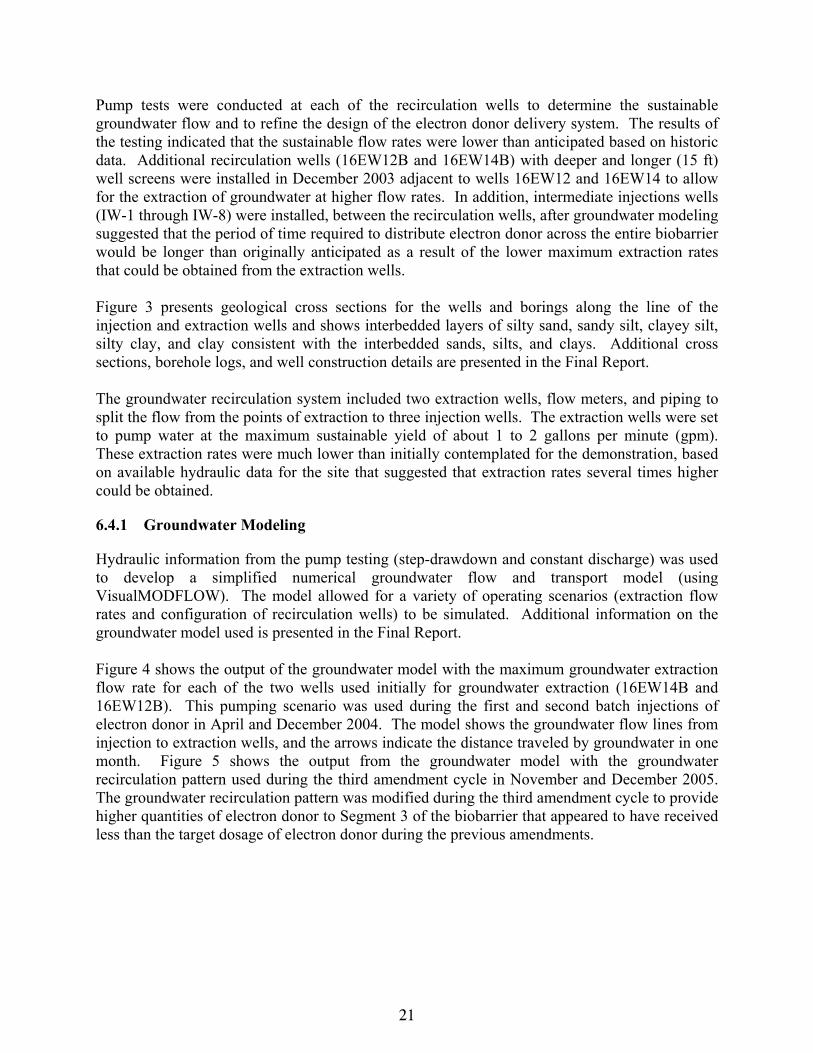
Pump tests were conducted at each of the recirculation wells to determine the sustainable groundwater flow and to refine the design of the electron donor delivery system. The results of the testing indicated that the sustainable flow rates were lower than anticipated based on historic data. Additional recirculation wells (16EW12B and 16EW14B) with deeper and longer (15 ft) well screens were installed in December 2003 adjacent to wells 16EW12 and 16EW14 to allow for the extraction of groundwater at higher flow rates. In addition, intermediate injections wells (IW-1 through IW-8) were installed, between the recirculation wells, after groundwater modeling suggested that the period of time required to distribute electron donor across the entire biobarrier would be longer than originally anticipated as a result of the lower maximum extraction rates that could be obtained from the extraction wells. Figure 3 presents geological cross sections for the wells and borings along the line of the injection and extraction wells and shows interbedded layers of silty sand, sandy silt, clayey silt, silty clay, and clay consistent with the interbedded sands, silts, and clays. Additional cross sections, borehole logs, and well construction details are presented in the Final Report. The groundwater recirculation system included two extraction wells, flow meters, and piping to split the flow from the points of extraction to three injection wells. The extraction wells were set to pump water at the maximum sustainable yield of about 1 to 2 gallons per minute (gpm). These extraction rates were much lower than initially contemplated for the demonstration, based on available hydraulic data for the site that suggested that extraction rates several times higher could be obtained.
6.4.1 Groundwater Modeling
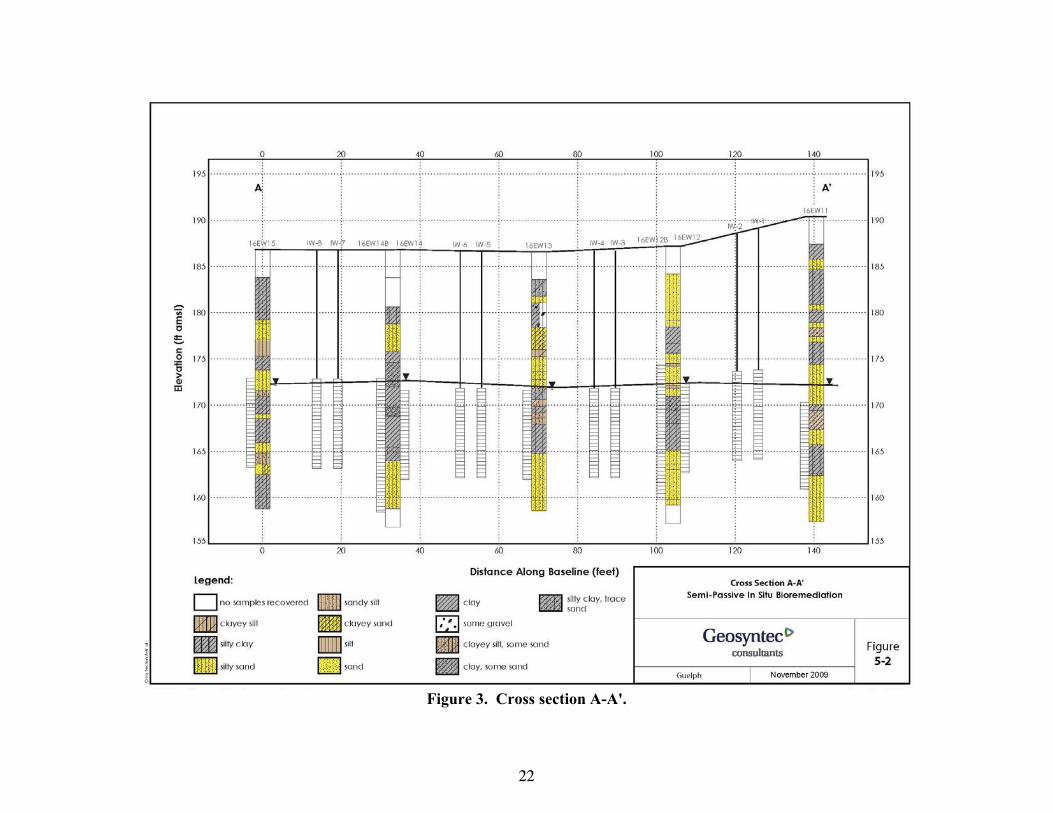
Hydraulic information from the pump testing (step-drawdown and constant discharge) was used to develop a simplified numerical groundwater flow and transport model (using VisualMODFLOW). The model allowed for a variety of operating scenarios (extraction flow rates and configuration of recirculation wells) to be simulated. Additional information on the groundwater model used is presented in the Final Report. Figure 4 shows the output of the groundwater model with the maximum groundwater extraction flow rate for each of the two wells used initially for groundwater extraction (16EW14B and 16EW12B). This pumping scenario was used during the first and second batch injections of electron donor in April and December 2004. The model shows the groundwater flow lines from injection to extraction wells, and the arrows indicate the distance traveled by groundwater in one month. Figure 5 shows the output from the groundwater model with the groundwater recirculation pattern used during the third amendment cycle in November and December 2005. The groundwater recirculation pattern was modified during the third amendment cycle to provide higher quantities of electron donor to Segment 3 of the biobarrier that appeared to have received less than the target dosage of electron donor during the previous amendments.
22
Figure 3. Cross section A-A'.

23
Figure 4. Numerical model simulation (March 2004 conditions).
24
Figure 5. Numerical model simulation (November 2005 conditions).
25
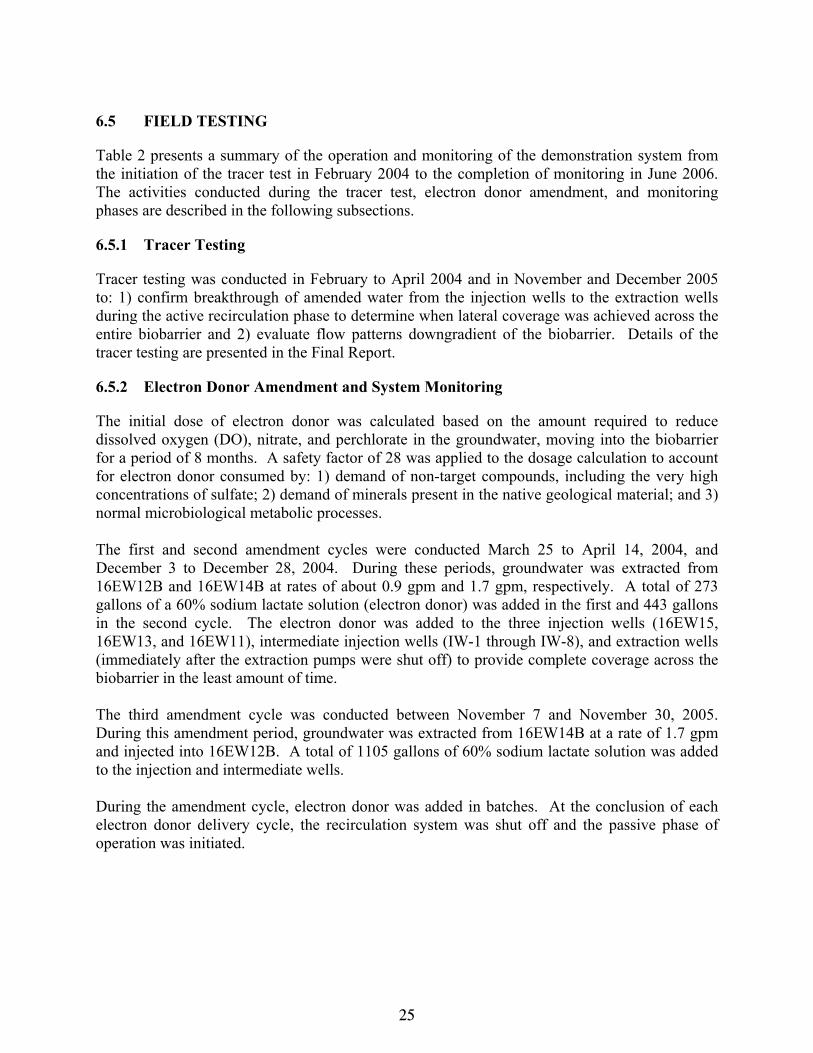
6.5 FIELD TESTING
Table 2 presents a summary of the operation and monitoring of the demonstration system from the initiation of the tracer test in February 2004 to the completion of monitoring in June 2006. The activities conducted during the tracer test, electron donor amendment, and monitoring phases are described in the following subsections.
6.5.1 Tracer Testing
Tracer testing was conducted in February to April 2004 and in November and December 2005 to: 1) confirm breakthrough of amended water from the injection wells to the extraction wells during the active recirculation phase to determine when lateral coverage was achieved across the entire biobarrier and 2) evaluate flow patterns downgradient of the biobarrier. Details of the tracer testing are presented in the Final Report.
6.5.2 Electron Donor Amendment and System Monitoring
The initial dose of electron donor was calculated based on the amount required to reduce dissolved oxygen (DO), nitrate, and perchlorate in the groundwater, moving into the biobarrier for a period of 8 months. A safety factor of 28 was applied to the dosage calculation to account for electron donor consumed by: 1) demand of non-target compounds, including the very high concentrations of sulfate; 2) demand of minerals present in the native geological material; and 3) normal microbiological metabolic processes. The first and second amendment cycles were conducted March 25 to April 14, 2004, and December 3 to December 28, 2004. During these periods, groundwater was extracted from 16EW12B and 16EW14B at rates of about 0.9 gpm and 1.7 gpm, respectively. A total of 273 gallons of a 60% sodium lactate solution (electron donor) was added in the first and 443 gallons in the second cycle. The electron donor was added to the three injection wells (16EW15, 16EW13, and 16EW11), intermediate injection wells (IW-1 through IW-8), and extraction wells (immediately after the extraction pumps were shut off) to provide complete coverage across the biobarrier in the least amount of time. The third amendment cycle was conducted between November 7 and November 30, 2005. During this amendment period, groundwater was extracted from 16EW14B at a rate of 1.7 gpm and injected into 16EW12B. A total of 1105 gallons of 60% sodium lactate solution was added to the injection and intermediate wells. During the amendment cycle, electron donor was added in batches. At the conclusion of each electron donor delivery cycle, the recirculation system was shut off and the passive phase of operation was initiated.
26
Table 2. Summary of system operation and monitoring.
Activity or Event Date Groundwater Recirculation Tracer Test Electron Donor Addition Groundwater Monitoring
2/11/04 Groundwater recirculation initiated Tracer addition initiated 2/11/04 Tracer monitoring initiated 2/17/04 Tracer addition ended 3/23/04 Groundwater monitoring 3/25/04 Electron donor addition initiated 4/6/04 Groundwater monitoring 4/7/04 Tracer monitoring ended 4/14/04 Groundwater recirculation ended Electron donor addition ended 4/20/04 Groundwater monitoring 5/4/04 Groundwater monitoring 5/18/04 Groundwater monitoring 6/2/04 Groundwater monitoring 6/16/04 Groundwater monitoring 7/7/04 Groundwater monitoring 8/4/04 Groundwater monitoring 9/28/04 Groundwater monitoring 12/1/04 Groundwater monitoring 12/3/04 Groundwater recirculation initiated Electron donor addition initiated 12/28/04 Groundwater recirculation ended Electron donor addition ended 1/26/05 Groundwater monitoring 3/9/05 Groundwater monitoring 5/23/05 Groundwater monitoring 10/18/05 Groundwater monitoring 10/21/05 Groundwater recirculation initiated 11/2/05 Groundwater monitoring 11/7/05 Tracer addition initiated Electron donor addition initiated 11/7/05 Tracer monitoring initiated 11/10/05 Tracer addition ended 11/30/05 Electron donor addition ended 12/19/05 Tracer monitoring ended Groundwater monitoring 12/20/05 Groundwater recirculation ended 1/30/06 Groundwater monitoring 3/16/06 Groundwater monitoring 5/8/06 Groundwater monitoring (ORP Only) 6/20/06 Groundwater monitoring (ORP Only) Notes: Date listed for groundwater monitoring is the date the event was started. Monitoring was typically done over 2-3 days. ORP – oxidation reduction potential
27
6.6 SAMPLING METHODS
Samples were collected by Complete Environmental Service (CES), the local on-site environmental contractor (under subcontract to Geosyntec), following protocols established in the Demonstration Plan (Geosyntec, 2003). Analyses were conducted by BioInsite, LLC (BioInsite) or by Severn Trent Laboratories (STL) located in Houston, Texas. Details of analytical methods, container size and type, preservation method, and sample holding times are presented in the Demonstration Plan.
6.7 SAMPLING RESULTS
This section presents the results obtained during the demonstration. Section 6.7.1 presents data collected during baseline monitoring; Section 6.7.2 presents the results of the tracer testing; Section 6.7.3 presents the results of perchlorate analysis; Sections 6.7.4, 6.7.5, 6.7.6 and 6.7.7 presents the results of analysis of other groundwater parameters; and Section 6.7.8 presents the results of groundwater level monitoring.
6.7.1 Baseline Conditions
This section presents the results of baseline monitoring conducted prior to the injection of electron donor at the site.
6.7.1.1 Groundwater Elevation Monitoring
Historic groundwater data obtained from LHAAP was reviewed to evaluate groundwater flow directions over time in the vicinity of the demonstration area. Appendix E of the Final Report contains an assessment of this data and measurements collected during the demonstration. Groundwater elevation measurements from the baseline sampling event in December 2003 are consistent with an eastward groundwater flow direction and a gradient with a magnitude in the range of 0.006 and 0.007 feet per feet (ft/ft).
6.7.1.2 Groundwater Chemistry
Table 3 includes baseline chemistry data collected after groundwater recirculation was initiated but before the addition of electron donor. A complete set of baseline groundwater chemistry data is presented in Appendix F of the Final Report along with other chemistry data collected during the demonstration. Figure 6a shows perchlorate concentrations in samples collected from wells in March 2004 prior to initiation of electron donor addition. Baseline perchlorate concentrations in groundwater samples collected in March 2004 ranged from nondetect up to 1700 μg/L in the upgradient monitoring well 16PM03. The ORP values were generally high (greater than positive 150 millivolts [mV]).

28
Table 3. Summary of groundwater monitoring results.
Well ID Date
Dissolved Oxygen (mg/L)
Oxidation Reduction Potential
(mV) pH
(std. units) Perchlorate
(μg/L) Sulfate (mg/L)
Acetate (μmol/L
Iron (mg/L)
Manganese (mg/L)
Arsenic (mg/L)
16EW09 3/24/04 1.43 108 5.9 749 4790 13 23 9.4 -- 16EW09 5/20/04 0.63 68 5.9 373 3320 22 5 6.8 -- 16EW09 12/2/04 0.82 137 6.0 66 -- -- -- -- 0.0100 U 16EW09 3/9/05 -- 104 6.2 128 -- -- -- -- -- 16EW09 3/14/06 -- -- -- 4.00U -- -- -- -- -- 16EW10 3/23/04 1.42 -- 6.1 111 2190 111 18 3.1 -- 16EW10 5/20/04 0.56 44 6.1 187 1700 75 5.9 2.1 -- 16EW10 12/2/04 0.44 62 6.1 31 -- -- -- -- 0.0100 U 16EW10 3/9/05 -- 61 7.1 55 -- -- -- -- -- 16EW10 3/14/06 -- -- -- 4.00U -- -- -- -- --
16EW12B 3/24/04 1.68 223 6.4 1040 2730 12.5 U 0.400 U 1.3 -- 16EW12B 5/20/04 0.15 -32 6.2 63 1360 1,890 6.0 0.98 -- 16EW12B 12/2/04 0.98 12 6.5 18 -- -- -- -- 0.0100 U 16EW12B 3/9/05 -- -199 6.9 22 -- -- -- -- -- 16EW12B 3/14/06 -- -- -- 4.00U -- -- -- -- -- 16EW14B 3/24/04 1.8 206 6.2 1000 3800 12.5 U 0.73 6.1 -- 16EW14B 5/20/04 <0.0 -99 6.2 142 1680 12,100 62 5.4 -- 16EW14B 12/2/04 1.88 35 6.1 38 -- -- -- -- 0.0100 U 16EW14B 3/9/05 -- -178 7.0 4.00U -- -- -- -- -- 16PM01 3/23/04 0.62 8 6.1 4.00U 206 12.5 U 16 1.4 -- 16PM01 5/18/04 1.32 21 6.3 5 190 12.5 U 10 1.4 -- 16PM01 12/1/04 3.28 59 6.2 4.00U -- -- -- -- 0.0100 U 16PM01 3/10/05 -- 11 6.2 4.00U -- -- -- -- -- 16PM01 3/14/06 -- -- -- 4.00U -- -- -- -- -- 16PM02 3/23/04 2.78 84 5.6 4.00U 316 12.5 U 4.5 1.6 -- 16PM02 5/18/04 0.67 147 5.6 9 260 12.5 U 8.4 1.8 -- 16PM02 12/1/04 3.06 170 5.5 11 -- -- -- -- 0.0100 U 16PM02 3/10/05 -- 121 5.6 153 -- -- -- -- -- 16PM02 3/14/06 -- -- -- 19.0 -- -- -- -- --
29
Table 3. Summary of groundwater monitoring results (continued).
Well ID Date
Dissolved Oxygen (mg/L)
Oxidation Reduction Potential
(mV) pH
(std. units) Perchlorate
(μg/L) Sulfate (mg/L)
Acetate (μmol/L
Iron (mg/L)
Manganese (mg/L)
Arsenic (mg/L)
16PM03 3/23/04 1.86 643 6.3 1690 470 12.5 U 4.7 0.27 -- 16PM03 5/18/04 0.63 127 6.3 1600 414 12.5 U 0.89 0.19 -- 16PM03 12/1/04 2.91 117 6.3 1620 -- -- -- -- 0.0100 U 16PM03 3/10/05 -- 66 6.4 1180 -- -- -- -- -- 16PM03 3/14/06 -- -- -- 4551 -- -- -- -- -- 16PM04 3/23/04 1.54 417 6.1 286 1430 13.1 1.1 1.4 -- 16PM04 5/18/04 0.28 73 6.2 190 975 76 4.2 1.1 -- 16PM04 12/1/04 3.15 70 6.2 29.9 -- -- -- -- 0.0100 U 16PM04 3/10/05 -- 31 6.2 14 -- -- -- -- -- 16PM04 3/14/06 -- -- -- 4.00U -- -- -- -- -- 16PM05 3/24/04 2.56 216 6.0 883 3540 12.5 U 5.3 2.2 -- 16PM05 5/18/04 1.04 33 5.9 134 3010 36 19 5.4 -- 16PM05 12/1/04 3.55 122 5.9 12 -- -- -- -- 0.0100 U 16PM05 3/9/05 -- -22 6.9 14 -- -- -- -- -- 16PM05 3/14/06 -- -- -- 4.00 U -- -- -- -- -- 16PM06 3/23/04 2.15 -- 6.2 968 3730 12.5 U 30 8.3 -- 16PM06 5/19/04 3.25 -62 6.5 374 3250 643 126 7.7 -- 16PM06 12/1/04 5 55 6.1 6.8 -- -- -- -- 0.0100 U 16PM06 3/9/05 -- -6 6.9 4.00 U -- -- -- -- -- 16PM06 3/14/06 -- -- -- 7.0 -- -- -- -- --
16PM07-D 3/23/04 1.26 -- 6.1 4.00 U 837 62.3 1.9 1.3 -- 16PM07-D 5/19/04 0.74 70 6.2 63 693 43 3.4 1.1 -- 16PM07-D 12/1/04 1.86 71 6.0 8.2 -- -- -- -- 0.0100 U 16PM07-D 3/9/05 -- 65 6.9 4.00 U -- -- -- -- -- 16PM07-D 3/14/06 26.5 16PM07-S 3/23/04 1.5 -- 6.1 39 810 45.9 3.7 0.83 -- 16PM07-S 5/19/04 0.96 121 6.1 177 975 40 2.1 0.84 -- 16PM07-S 12/1/04 3.33 249 6.1 5.5 -- -- -- -- 0.0100 U 16PM07-S 3/9/05 -- 96 6.8 4.00 U -- -- -- -- -- 16PM07-S 3/14/06 -- -- -- 10.0 -- -- -- -- --

30
Table 3. Summary of groundwater monitoring results (continued).
Well ID Date
Dissolved Oxygen (mg/L)
Oxidation Reduction Potential
(mV) pH
(std. units) Perchlorate
(μg/L) Sulfate (mg/L)
Acetate (μmol/L
Iron (mg/L)
Manganese (mg/L)
Arsenic (mg/L)
16PM08 3/23/04 1.25 132 6.3 129 1040 13.1 0.44 0.98 -- 16PM08 5/19/04 1.08 181 6.3 126 975 33 0.48 0.85 -- 16PM08 12/1/04 3.06 96 6.3 30 -- -- -- -- 0.0100 U 16PM08 3/10/05 -- 136 6.3 34 -- -- -- -- -- 16PM08 3/14/06 -- -- -- 4.00 U -- -- -- -- -- 16PM09 3/24/04 1.16 206 5.8 918 2070 144 1.2 4.4 -- 16PM09 5/18/04 1.14 63 6.1 146 1590 12.5 U 3.3 11 -- 16PM09 12/1/04 2.52 137 5.9 22 -- -- -- -- 0.0100 U 16PM09 3/9/05 -- 20 6.8 6 -- -- -- -- -- 16PM09 3/14/06 -- -- -- 4.00 U -- -- -- -- --
16PM10-D 3/24/04 0.71 212 5.0 69 965 45.9 7.4 3.7 -- 16PM10-D 5/19/04 1.15 164 5.2 156 885 25 6.8 3.8 -- 16PM10-D 12/1/04 2.17 108 5.4 37 -- -- -- -- 0.0100 U 16PM10-D 3/9/05 -- 113 6.9 4.00 U -- -- -- -- -- 16PM10-D 3/14/06 -- -- -- 4.00 U -- -- -- -- -- 16PM10-S 3/24/04 1.02 227 5.8 669 3410 12.5 U 4.0 9.0 -- 16PM10-S 5/19/04 0.96 -54 6.4 340 2600 67 59 38 -- 16PM10-S 12/1/04 2.69 40 6.2 8.7 -- -- -- -- 0.036 16PM10-S 3/9/05 -- -55 6.9 4.00 U -- -- -- -- -- 16PM10-S 3/14/06 -- -- -- 7.5 -- -- -- -- -- 16PM11 3/23/04 1.49 216 6.2 161 1100 12.5 U 1.1 1.6 -- 16PM11 5/20/04 2.19 221 6.3 258 1460 33 0.57 1.2 -- 16PM11 12/1/04 3.85 112 6.2 41 -- -- -- -- 0.0100 U 16PM11 3/10/05 -- 62 6.2 22 -- -- -- -- -- 16PM11 3/14/06 -- -- -- 4.00 U -- -- -- -- -- 16PM12 3/24/04 1.51 208 5.7 132 4090 12.5 U 1.5 3.5 -- 16PM12 5/18/04 -- -- -- -- -- -- 2.5 3.3 -- 16PM12 5/19/04 0.78 107 5.8 72 3200 19 -- -- -- 16PM12 12/1/04 2.57 141 5.8 96 -- -- -- -- 0.0100 U 16PM12 3/9/05 -- 31 6.8 373 -- -- -- -- -- 16PM12 3/14/06 -- -- -- 7684 -- -- -- -- --
31
Table 3. Summary of groundwater monitoring results (continued).
Well ID Date
Dissolved Oxygen (mg/L)
Oxidation Reduction Potential
(mV) pH
(std. units) Perchlorate
(μg/L) Sulfate (mg/L)
Acetate (μmol/L
Iron (mg/L)
Manganese (mg/L)
Arsenic (mg/L)
16PM13-D 3/23/04 1.27 -- 5.6 220 2460 95.1 2.5 4.0 -- 16PM13-D 5/19/04 0.77 180 5.8 279 1910 89 1.2 3.5 -- 16PM13-D 12/1/04 2.2 206 5.7 395 -- -- -- -- 0.0100 U 16PM13-D 3/9/05 -- 167 6.9 71 -- -- -- -- -- 16PM13-D 3/14/06 -- -- -- 4.00 U -- -- -- -- -- 16PM13-S 3/23/04 1.19 -- 6.1 4.00 U 610 21.3 2.7 0.95 -- 16PM13-S 5/19/04 0.99 177 6.0 165 1200 25 1.3 2.1 -- 16PM13-S 12/1/04 2.31 239 6.0 18 -- -- -- -- 0.0100 U 16PM13-S 3/9/05 -- 130 6.9 5.6 -- -- -- -- -- 16PM13-S 3/14/06 -- -- -- 4.00 U -- -- -- -- -- 16PM14 3/23/04 1.6 250 6.2 428 3000 21.3 1.3 2.9 -- 16PM14 5/19/04 -- -- -- 488 2620 31 -- -- -- 16PM14 5/20/04 1.71 176 6.3 -- -- -- 2.1 3.2 -- 16PM14 12/1/04 2.79 149 6.3 389 -- -- -- -- 0.0100 U 16PM14 3/10/05 -- 129 6.3 179 -- -- -- -- 16PM14 3/14/06 -- -- -- 4.0 -- -- -- -- --
Notes: Data listed for 3/9/05 includes samples collected on 3/9/05 and 3/10/05. = baseline sample prior to electron donor addition mg/L = milligrams per liter μg/L = micrograms per liter -- = not analyzed mV = millivolt μmol/L = micromoles per liter

32
Figure 6. Comparison of perchlorate concentrations in groundwater.

33
Figure 6. Comparison of perchlorate concentrations in groundwater (continued).

34
6.7.2 Results of Tracer Testing
Tracer testing was conducted February to April 2004 and again in November and December 2005. The results of the two tracer tests are discussed in the Final Report and summarized below.
6.7.2.1 Results of First Tracer Testing
Table 4 presents a summary of the tracer recoveries, travel times, and results of the mass balance for each segment for the tracer tests. Mass balance calculations were performed to evaluate the transport of tracer between the recirculation wells for each of the four segments in the biobarrier. Additional data from the tracer testing is presented in the Final Report.
Table 4. Summary of tracer test results.
Mass Balance Data Peak Concentrations
Well ID
Mass Injected
(kg)
Mass Observed
(kg)
Percent Observed/ Recovered
Observation Period (days) C/Co
Time (days)
Segment 1: EW15 to EW14B – Bromide EW15 15.4 IW8 14.7 95.5 26 0.40 8 IW7 10.5 68.3 42 0.14 22
EW14B 1.7 11.1 39 0.11 50 Segment 2: EW13 to EW14B – Iodide
EW13 15.9 IW5 16.2 101.4 42 0.32 12 IW6 3.3 20.9 42 0.09 37
EW14B 0.3 2.2 55 - - Segment 3: EW13 to EW12B – Iodide
EW13 15.9 IW4 6.0 37.4 42 0.09 - PM4 9.3 58.3 55 - - IW3 5.1 32.3 36 0.14 -
EW12B 0 0 42 - - Segment 4: EW11 to EW12B – Bromide
EW11 16.2 IW1 9.2 56.7 26 0.34 12 IW2 2.5 15.2 42 0.08 25
EW12B 0.4 2.5 42 - - Transect 1: 16PM05 – 16PM09 – Bromide
PM05 0.47 15 PM09 0.10 29
Transect 2: 16PM06 – 16PM10-S – 16PM10-D – Iodide PM06 0.51 3.5
PM10-S 0.21 10 Notes: Hyphen means data insufficient to estimate values kg – kilogram

35
The tracer concentrations and mass balance for intermediate wells in Segments 1, 2, and 4 show consistent movement of the tracer within each segment. The travel time between the injection wells and first intermediate injection well (located 15 ft from the injection well) was typically one to two weeks. The mass balance estimates between the injection wells and the first intermediate wells in Segments 1, 2, and 4 ranged between 57% and 100%. The tracer concentrations and mass balance in intermediate wells in Segment 3 indicate significantly slower movement of the tracer. The slower movement of tracer is consistent with the groundwater flow model that showed some of the water injected into EW-13 being pulled back towards the south into the higher pumping 16EW14B because 16EW12B could not sustain as high a yield.
6.7.2.2 Results of Second Tracer Test
The results of the tracer test conducted between well 16EW12B (injection point) and well 16EW12B (extraction point) during the third cycle of electron donor amendment indicate travel times consistent with the results of the groundwater modeling of this recirculation scenario suggesting a travel time between recirculation wells (a distance of 35 ft) to be approximately 1 to 2 months. The travel time for the peak concentration (10% to 20% of the injected concentration) of tracer to wells IW-2 and IW-3, located 14 ft to the north and 14 ft to the south of 16EW12B, was about 9 to 10 days. The travel time for the peak concentration of tracer to well 16PM04 located 17.5 ft to the south of 16EW12B was approximately 15 days. The travel time for the peak concentration of tracer to well IW-4, located 21 feet to the south of 16EW12B, was approximately 28 days. The results of the second tracer test confirm the results of the groundwater modeling and suggest that electron donor can be distributed across the biobarrier using the recirculation wells and intermediate injection points.
6.7.3 Results of Perchlorate Analysis
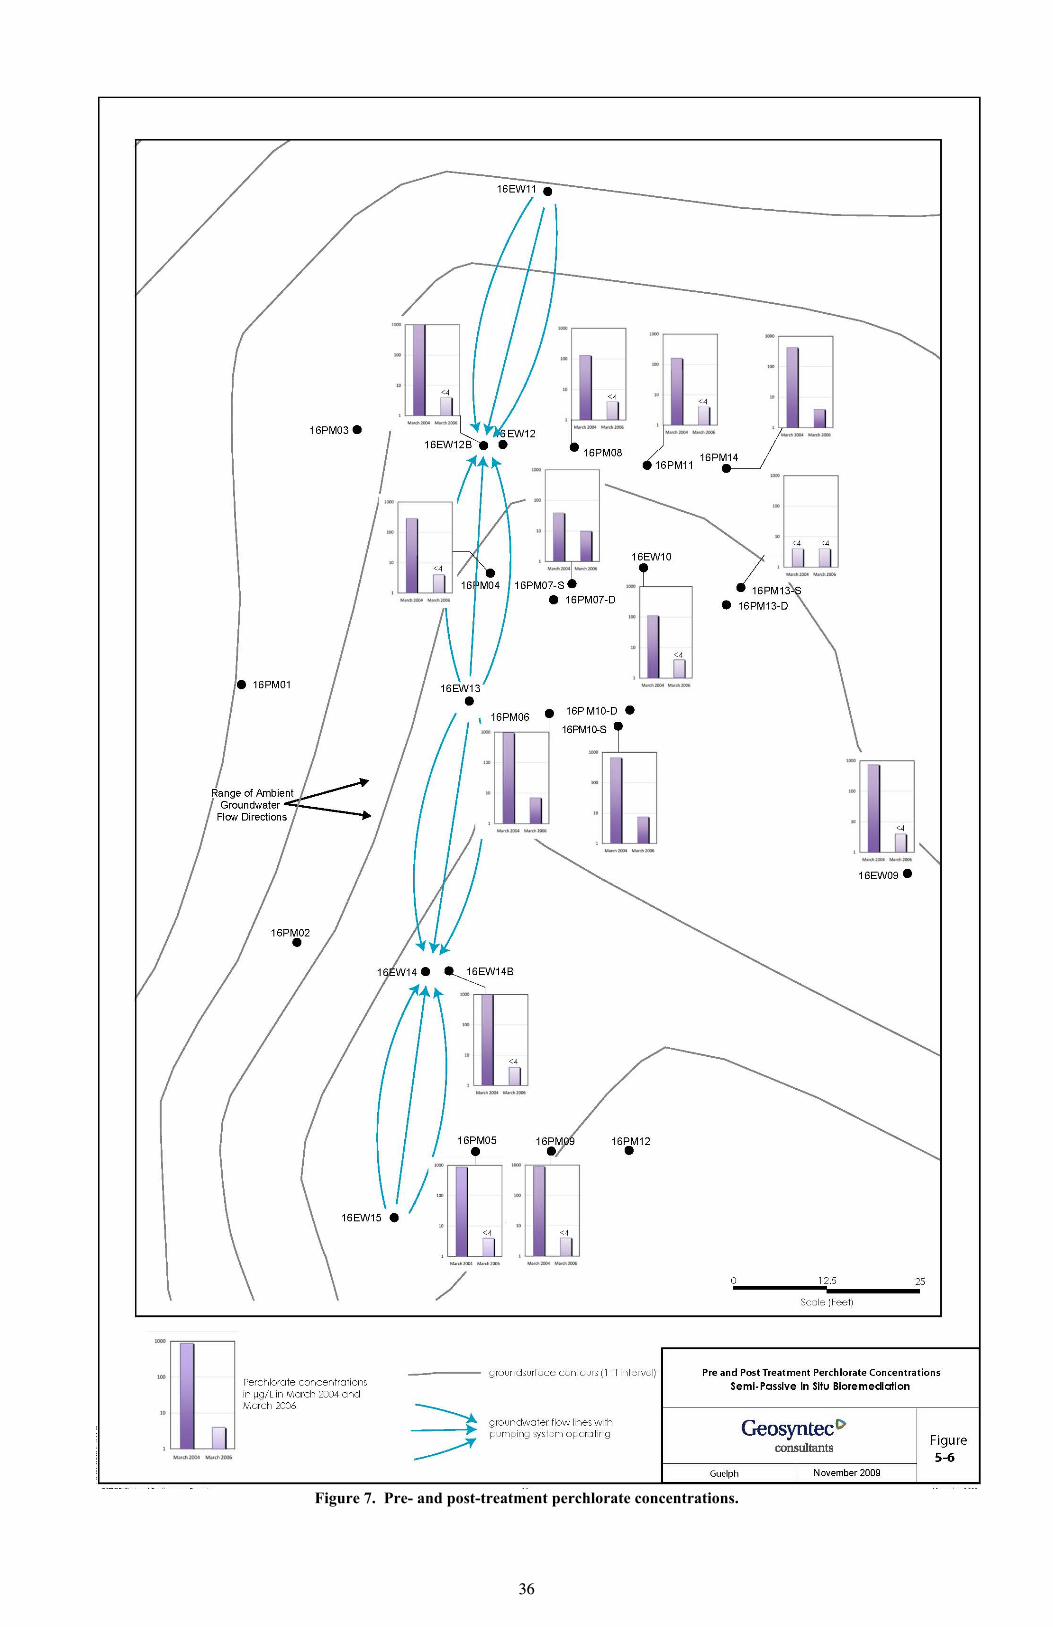
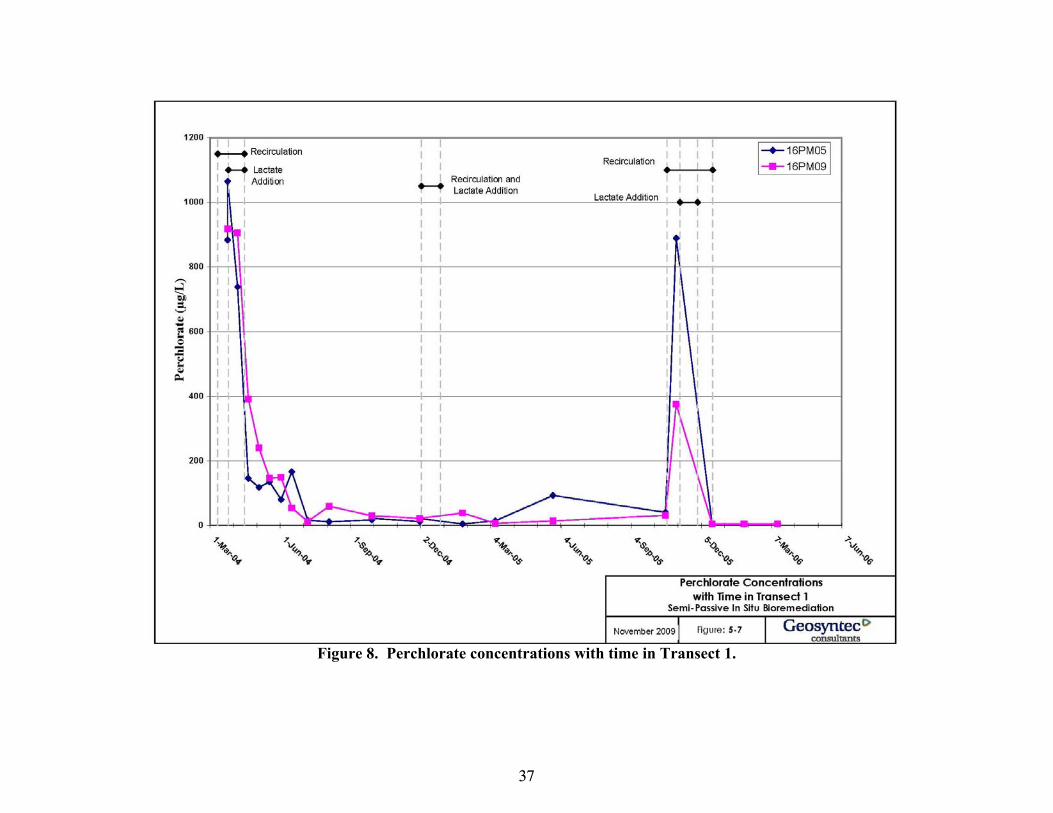
Figure 6 shows the perchlorate concentrations in groundwater samples collected during the baseline monitoring (Figure 6a), mid-demonstration monitoring (Figure 6b) and post-demonstration monitoring (Figure 6c). Figure 7 shows the relative concentration of perchlorate in monitoring wells downgradient of the biobarrier before addition of electron donor (March 2004) and post-demonstration (March 2006). Figure 8 shows the perchlorate concentrations over time in Transect 1. Table 3 presents a summary of perchlorate and other key groundwater parameters collected during the main groundwater sampling events. The results of all perchlorate analyses conducted during the demonstration and the results of a statistical analysis of the perchlorate data are presented in the Final Report. The groundwater monitoring data demonstrate that significant reductions in perchlorate concentrations were achieved across the line of recirculation wells in the semi-passive biobarrier (Figure 7). Following the third and final injection of electron donor, perchlorate concentrations were reduced to less than 4 μg/L in 10 of 13 shallow wells within and downgradient of the biobarrier, and the concentrations in the other three wells ranged from 7 to 10 μg/L. Using half of the laboratory detection limit for groundwater samples where perchlorate was not detected, the average concentration of perchlorate in shallow wells within and downgradient of the biobarrier following the third addition of electron donor was 3.4 μg/L.
36
Figure 7. Pre- and post-treatment perchlorate concentrations.
37
Figure 8. Perchlorate concentrations with time in Transect 1.
38
The concentrations of perchlorate were reduced substantially following the first and second injection of electron donor (Figure 6b) in Transects 1, 2 and 3. The concentrations of perchlorate in Transect 4 were reduced from baseline concentrations, but less than optimal distribution of electron donor in this transect during the first and second addition of electron donor resulted in a lower reduction in perchlorate than was observed in the other transects. As discussed above, following the third electron donor delivery cycle, the concentrations of perchlorate were further reduced in all monitoring well transects, including Transect 4. The improved level of treatment of perchlorate is likely due to a combination of factors, including 1) the improved distribution of electron donor provided by the recirculation pattern used; 2) the residual beneficial impacts of the first and second electron donor delivery cycles, including reducing minerals in the geological media and growing biomass, which can act as a long-term residual source of electron donor; and 3) the larger quantity of electron donor used during the third amendment cycle. Concentrations of perchlorate in Transect 1 monitoring wells 16PM05 and 16PM09 (Figure 8) were in the range of 900 μg/L to 1100 μg/L before the first electron donor delivery cycle. Following the third amendment, the elevated concentrations of perchlorate were reduced and the concentrations in the 16PM05 and 16PM09 were less than 4 μg/L during the final three monitoring events. Concentrations of perchlorate in Transect 2 monitoring wells 16PM06 and 16PM10-S were in the range of 700 μg/L to 900 μg/L before the first electron donor delivery cycle. The concentration of perchlorate in wells in this transect increased during recirculation of groundwater during the third amendment cycle and then decreased to less that 4 μg/L for two of the three final monitoring events. Concentrations of perchlorate in Transect 3 monitoring wells 16PM04, 16PM07-S, 16PM07-D, 16EW10, 16PM13-S, and 16PM13-D were in the range of 100 μg/L to 600 μg/L during the first electron donor delivery cycle. The concentration of perchlorate in wells in this transect increased during recirculation of groundwater for the third addition of electron donor, then decreased significantly for two of the three final monitoring events. Transect 4 monitoring wells included 16EW12B, 16PM08, and 16PM11. The perchlorate concentration in the extraction well (16EW12B) was in the range of 1000 μg/L to 1100 μg/L before and during the initial electron donor delivery cycle. The concentrations in monitoring wells 16PM08 and 16PM11 were in the range of 100 μg/L to 200 μg/L before and during the initial amendment. Following the initial amendment, the concentration in 16EW12B decreased to less than 100 μg/L within a month. During the third amendment cycle, the recirculation pattern was modified to provide additional electron donor to this transect. The concentration of perchlorate in this transect increased during recirculation of groundwater during the third amendment; then the concentrations of perchlorate in 16EW12B, 16PM08, and 16PM11 all dropped significantly following the third amendment cycle. The concentrations of perchlorate in all the monitoring wells in this transect were below 4 μg/L during the post-demonstration monitoring event (March 2006).
39
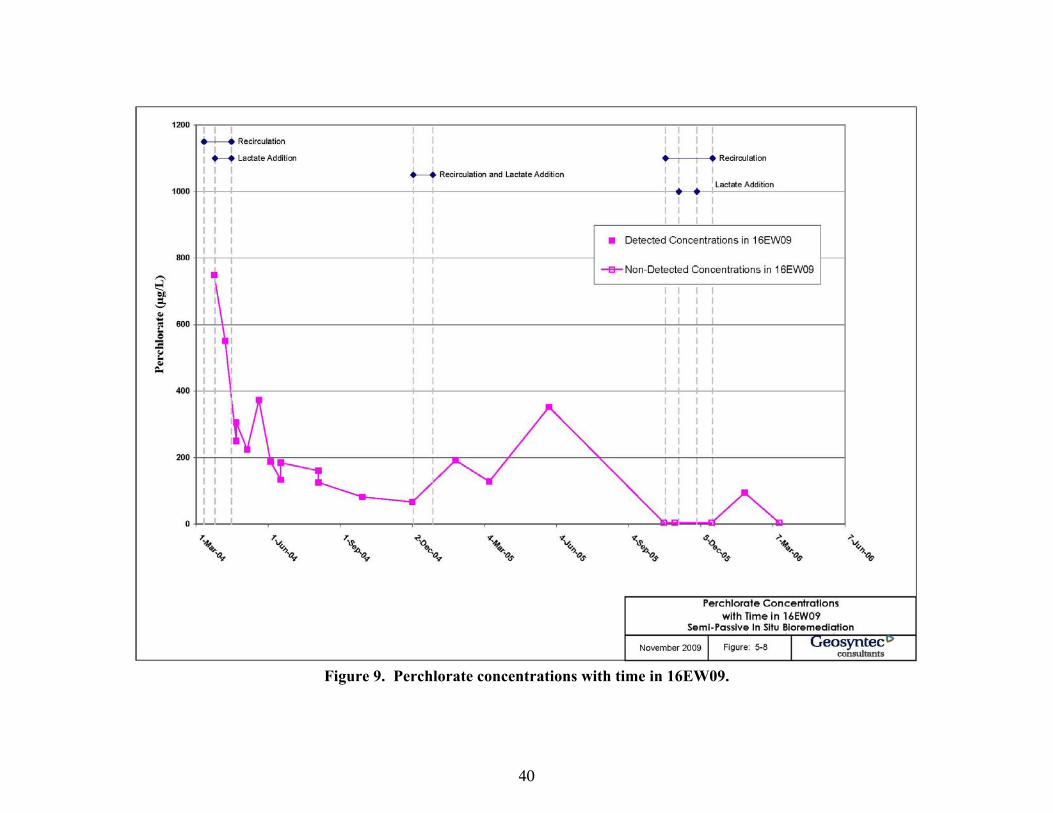
Concentrations of perchlorate over time in monitoring well 16EW09, located approximately 60 ft downgradient of the centerline of the recirculation wells, are shown in Figure 9. This well is located significantly downgradient of the biobarrier and monitors the downgradient impact of the biobarrier on groundwater. The baseline perchlorate concentration in this monitoring well was over 600 μg/L but declined significantly over the 6 months following the first electron donor delivery cycle. There was some increase in concentration of perchlorate during the first half of 2005 but declined at the end of 2005 and early 2006, such that four of the last five samples collected from this well were not detected.
6.7.4 Results of Oxidation Reduction Potential (ORP) Monitoring
Table 3 shows the ORP and concentrations of key groundwater parameters collected during the main groundwater sampling events. The results of all laboratory and field measurements conducted during the demonstration test are presented in the Final Report.
6.7.5 Results of Volatile Fatty Acids (VFA) Analysis
The concentrations of acetate in groundwater samples collected during the main groundwater sampling events are shown in Table 3. The results of all VFA (acetate, formic acid, lactic acid, and propionate) analysis are presented in the Final Report. During the baseline sampling event, the concentrations of acetate in all wells were generally below the laboratory detection limit. As expected, following each amendment cycle, acetate concentrations increased and correlated with a reduction in ORP and perchlorate concentrations. Elevated concentrations of acetate (greater than 200 μmol/L) were also observed in monitoring wells closest to the biobarrier that included 16PM04, 16PM05, and 16PM10-S. As expected, lower concentrations of acetate were measured in samples further downgradient of the biobarrier.
6.7.6 Results of Sulfate Analysis
The results of sulfate analysis indicated little change in concentrations at most monitoring wells (with the exception of 16EW12B, 16EW14B, and 16PM06) following the first and second electron donor delivery cycles, suggesting that the semi-passive approach may be able to avoid significant undesirable groundwater impacts.
6.7.7 Results of Iron, Manganese, and Arsenic Analysis
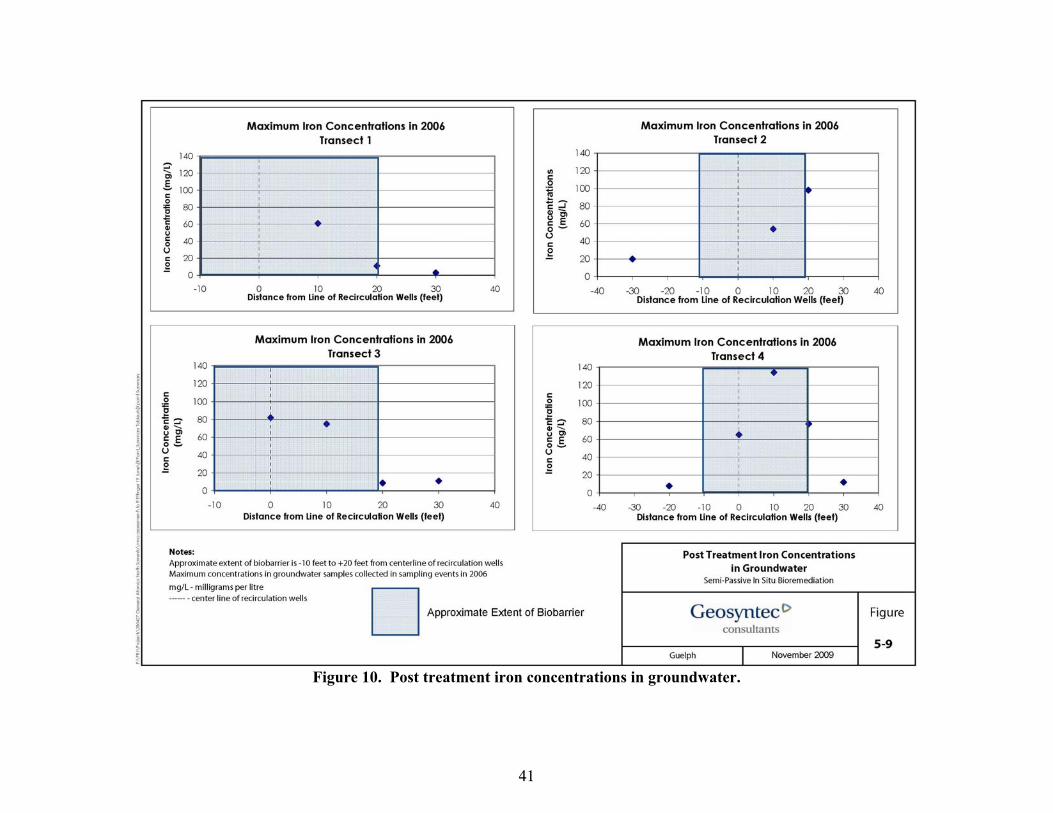
Figure 10 shows the iron concentrations in monitoring wells along each transect, relative to the biobarrier. The approximate extent of the biobarrier is shown extending 10 ft upgradient and 20 ft downgradient of the centerline of the recirculation wells. Transects 2 and 4 have monitoring wells that are 30 ft and 20 ft, respectively, upgradient of the biobarrier (16PM01 and 16PM03), and the concentrations of iron in these wells remained low during the demonstration, which indicates they were outside the influence of the biobarrier.
40
Figure 9. Perchlorate concentrations with time in 16EW09.
41
Figure 10. Post treatment iron concentrations in groundwater.

42
As shown in Figure 10, the concentrations of iron increased within the biobarrier relative to the upgradient well, but declined significantly downgradient of the biobarrier (i.e., 10 ft downgradient of biobarrier). Similar results were observed for manganese, which increased in concentrations within the biobarrier relative to upgradient concentrations and declined in concentrations downgradient of Transects 1 and 4. The concentration of manganese in groundwater from the well 10 ft downgradient of the biobarrier in Transect 3, however, remained elevated. Arsenic concentrations also increased within the biobarrier, but as with the iron, the concentrations declined significantly 10 ft downgradient of the biobarrier.
6.7.8 Groundwater Elevations
Post-demonstration groundwater elevations show some regional change (i.e., lower overall levels in June 2006 relative to December 2003) but no significant change in elevation in wells in the vicinity of the biobarrier relative to one another that would indicate a significant impact on the hydraulics at the site resulting from the addition of electron donor.
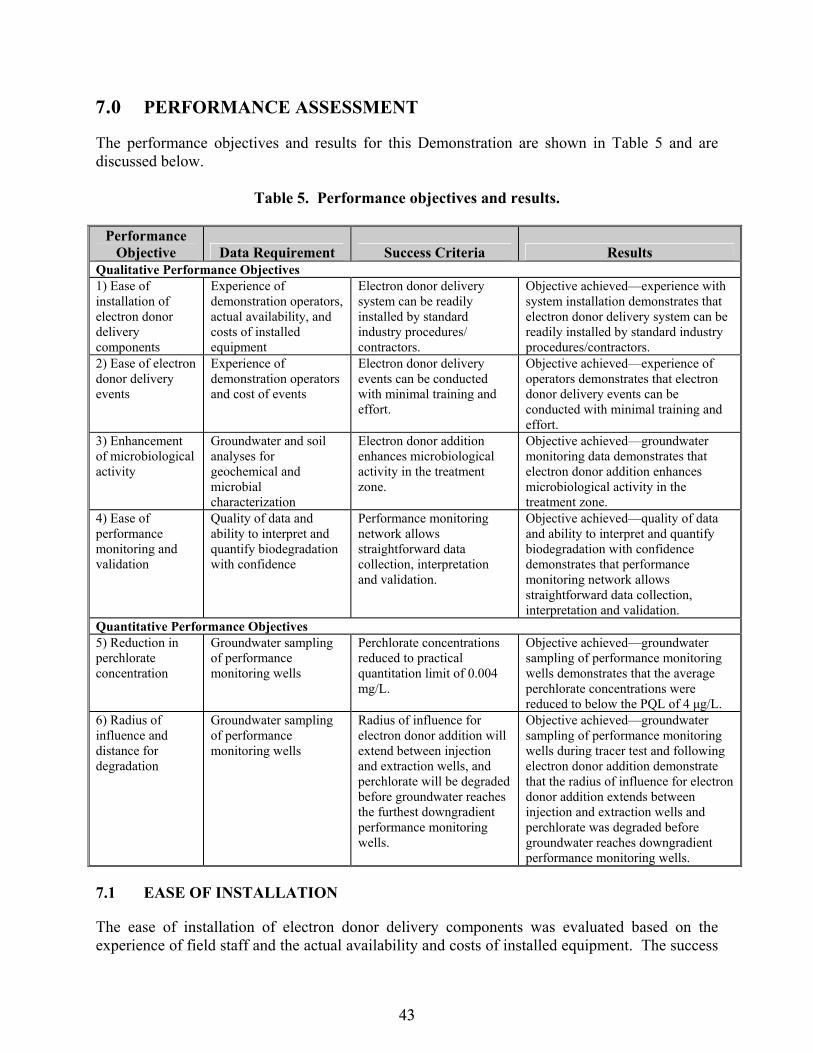
43
7.0 PERFORMANCE ASSESSMENT
The performance objectives and results for this Demonstration are shown in Table 5 and are discussed below.
Table 5. Performance objectives and results.
Performance Objective Data Requirement Success Criteria Results
Qualitative Performance Objectives 1) Ease of installation of electron donor delivery components
Experience of demonstration operators, actual availability, and costs of installed equipment
Electron donor delivery system can be readily installed by standard industry procedures/ contractors.
Objective achieved—experience with system installation demonstrates that electron donor delivery system can be readily installed by standard industry procedures/contractors.
2) Ease of electron donor delivery events
Experience of demonstration operators and cost of events
Electron donor delivery events can be conducted with minimal training and effort.
Objective achieved—experience of operators demonstrates that electron donor delivery events can be conducted with minimal training and effort.
3) Enhancement of microbiological activity
Groundwater and soil analyses for geochemical and microbial characterization
Electron donor addition enhances microbiological activity in the treatment zone.
Objective achieved—groundwater monitoring data demonstrates that electron donor addition enhances microbiological activity in the treatment zone.
4) Ease of performance monitoring and validation
Quality of data and ability to interpret and quantify biodegradation with confidence
Performance monitoring network allows straightforward data collection, interpretation and validation.
Objective achieved—quality of data and ability to interpret and quantify biodegradation with confidence demonstrates that performance monitoring network allows straightforward data collection, interpretation and validation.
Quantitative Performance Objectives 5) Reduction in perchlorate concentration
Groundwater sampling of performance monitoring wells
Perchlorate concentrations reduced to practical quantitation limit of 0.004 mg/L.
Objective achieved—groundwater sampling of performance monitoring wells demonstrates that the average perchlorate concentrations were reduced to below the PQL of 4 μg/L.
6) Radius of influence and distance for degradation
Groundwater sampling of performance monitoring wells
Radius of influence for electron donor addition will extend between injection and extraction wells, and perchlorate will be degraded before groundwater reaches the furthest downgradient performance monitoring wells.
Objective achieved—groundwater sampling of performance monitoring wells during tracer test and following electron donor addition demonstrate that the radius of influence for electron donor addition extends between injection and extraction wells and perchlorate was degraded before groundwater reaches downgradient performance monitoring wells.
7.1 EASE OF INSTALLATION
The ease of installation of electron donor delivery components was evaluated based on the experience of field staff and the actual availability and costs of installed equipment. The success
44
criterion for this objective is that the electron donor delivery system can be readily installed using standard industry procedures and contractors. This objective was achieved based on experience with the actual installation of the electron donor delivery system at the LHAAP site. The equipment required for the semi-passive injection of electron donor and short-term circulation of groundwater was all readily available through local drillers and plumbing suppliers. The procedures used to install the equipment were standard and well-established procedures for local drillers, and the procedures were simple enough to be conducted by field technicians with training in basic plumbing techniques.
7.2 EASE OF ELECTRON DONOR DELIVERY EVENTS
The ease of electron donor delivery events was evaluated based on the experience of field staff who conducted the actual electron donor events. The success criterion for this objective is that electron donor delivery events can be conducted by field staff with minimal training and effort. This objective was achieved based on the experience of field staff with the actual electron donor delivery events. The activities and procedures required for the electron donor delivery events were simple enough to be conducted by field staff with minimal specialized training and effort. Electron donor was added to the groundwater recirculation injection wells and the intermediate injection points three times per week for a period of three weeks. Commercially available sodium lactate was used as the electron donor, and this liquid was easy and safe to work. The procedure of transferring the electron donor from the drums to each of the injection locations took one person about one hour to complete three times per week. The groundwater recirculation system was operated on a continuous basis over the three-week period of time when the electron donor was being added to the subsurface and there were no indications that significant fouling was occurring in the groundwater injection wells. The injection wells were equipped with a high level shutoff switch to shut off the recirculation of groundwater if the water level in the injection wells rose indicating that the well was becoming fouled. The high level switch was not activated during any of the three electron donor injection events. It is believed that at least three factors contributed to the lack of significant fouling in the injection wells: 1) the use of soluble electron donor that could move quickly from the injection well without being held up on the soil particles; 2) the injection schedule (three times per week rather than on a continuous basis) during the active injection phase, which meant that microorganisms were not receiving a continuous supply of food even during the active phase of groundwater recirculation and injection; and 3) the fact that groundwater was not recirculated and electron donor was not added to the wells for a passive phase of at least eight months during which time biological material that may have accumulated in the well screen during the active phase would degrade significantly before the subsequent active phase.
7.3 ENHANCEMENT OF MICROBIOLOGICAL ACTIVITY
The enhancement of microbiological activity was evaluated using groundwater and soil analysis for geochemical parameters and microbial characterization. The success criterion for this objective is that electron donor addition enhances microbiological activity in the treatment zone.
45
This objective was achieved based on the results of chemical and geochemical characterization. Groundwater monitoring data for chemical and geochemical parameters demonstrated that electron donor addition enhanced microbiological activity in the treatment zone. Significant and sustained reductions in ORP were observed following addition of electron donor and provide the first indication that biological activity was enhanced by the addition of electron donor. A statistical analysis of ORP data was conducted and is presented in the Final Report. This analysis shows a high level of confidence that the injection of electron donor in the biobarrier resulted in significant reductions in ORP that are indicative of enhanced biological activity. Reduction in sulfate in wells in the immediate vicinity of the electron donor injection points also indicates enhancement of biological activity. The reductions in perchlorate concentrations in groundwater observed following addition of electron donor provide additional indications that biological activity was enhanced by the addition of electron donor and that this biological activity included microorganisms capable of degradation of perchlorate.
7.4 EASE OF PERFORMANCE MONITORING AND VALIDATION
The ease of performance monitoring and validation was evaluated based on the quality of the data obtained and the ability to interpret and quantify biodegradation with confidence. The success criterion for this objective is that the performance monitoring network and sampling conducted allows for straightforward data collection, interpretation, and validation. This objective was achieved based on the data obtained during the demonstration. The quality of the data obtained and the ability to interpret this data and quantify biological activity (by the reduction in ORP) with confidence and reduction in perchlorate demonstrated that the performance monitoring network allowed for straightforward data collection, interpretation, and validation. The monitoring well network installed for the demonstration was extensive and allowed the collection of groundwater samples for measurement of field parameters and for chemical analysis from key locations in the demonstration test area. Monitoring points along four distinct transects parallel to the ambient direction of groundwater flow allowed for an assessment of groundwater quality within and downgradient of the biobarrier. The monitoring well network also included multiple sampling locations along the alignment of the recirculation wells used to create the biobarrier that were used to characterize the groundwater quality along the biobarrier and to monitor the distribution of tracer during the tracer testing conducted at the time of the first and third electron donor amendment phase. Measurement of field parameters and analysis of samples collected from monitoring wells allowed for data to be collected that demonstrated significant reductions in ORP associated with the enhancement of biological activity resulting from the addition of electron donor. The reduction in ORP in samples from monitoring wells in the demonstration area provided a quantitative measure of the biological activity in the subsurface. The monitoring well network allowed for the collection of data that showed the reduction in perchlorate concentrations to validate the performance of the technology.

46
7.5 REDUCTION IN PERCHLORATE CONCENTRATION
The reduction in perchlorate concentrations was evaluated based on groundwater sampling of performance monitoring wells. The success criterion for this objective is that perchlorate concentrations are reduced to the PQL of 4 μg/L. This objective was achieved based on groundwater sampling of performance monitoring wells that demonstrated that the average perchlorate concentrations were reduced to below the PQL of 4 μg/L during the final sampling event. The objective of 4 μg/L was not achieved in all samples at all time periods, as discussed below. Figure 6 shows the perchlorate concentrations in groundwater samples collected during the baseline monitoring (Figure 6a), mid-demonstration monitoring (Figure 6b) and post-demonstration monitoring (Figure 6c). Figure 7 shows the relative concentration of perchlorate in monitoring wells downgradient of the biobarrier before addition of electron donor (March 2004) and post-demonstration (March 2006). Table 3 presents a summary of perchlorate and other key groundwater parameters collected during the main groundwater sampling events. The Final Report contains the results of all perchlorate analyses conducted during the demonstration and the results of a statistical analysis of the perchlorate data. The groundwater monitoring data demonstrate that significant reductions in perchlorate concentrations were achieved across the line of recirculation wells in the semi-passive biobarrier (Figure 7). Following the third and final injection of electron donor, perchlorate concentrations were reduced to less that 4 μg/L in 10 of 13 shallow wells within and downgradient of the biobarrier, and the concentrations in the other three wells ranged from 7 to 10 μg/L. Using half the laboratory detection limit for groundwater samples where perchlorate was not detected, the average concentration of perchlorate in shallow wells within and downgradient of the biobarrier following the third addition of electron donor was 3.4 μg/L. The concentrations of perchlorate were reduced substantially following the first and second injection of electron donor (Figure 6b) in Transects 1, 2, and 3. The concentrations of perchlorate in Transect 4 were reduced from baseline concentrations, but less than optimal distribution of electron donor in this transect during the first and second addition of electron donor resulted in a lower reduction in perchlorate than was observed in the other transects. As discussed above, following the third electron donor delivery cycle, the concentrations of perchlorate were further reduced in all monitoring well transects, including Transect 4. The improved level of treatment of perchlorate is likely due to a combination of factors, including 1) the improved distribution of electron donor provided by the recirculation pattern used; 2) the residual beneficial impacts of the first and second electron donor delivery cycles, including reducing minerals in the geological media and growing biomass which can act as a long-term residual source of electron donor; and 3) the larger quantity of electron donor used during the third amendment cycle.
47
7.6 RADIUS OF INFLUENCE AND DISTANCE FOR DEGRADATION
The radius of influence and distance for degradation was evaluated based on the results of groundwater sample collected from the performance monitoring wells. The success criterion for this objective is that the radius of influence for electron donor addition will extend between recirculation wells and that perchlorate will be degraded before groundwater reaches the furthest downgradient performance monitoring well. This objective was achieved based on groundwater sample results from performance monitoring wells during the tracer tests and following electron donor delivery cycles, which demonstrated that the radius of influence for electron donor extends between all recirculation wells and that perchlorate was degraded before groundwater reached downgradient performance monitoring wells. Table 4 presents a summary of the tracer recoveries, travel times, and results of the mass balance for each segment during the first tracer test. During this tracer test, groundwater was extracted from 16EW12B and 16EW14B at rates of 1.0 gpm and 1.7 gpm, respectively, and groundwater was injected into 16EW11, 16EW13, and 16EW15 at rates of 1.0 gpm, 0.85 gpm, and 0.85 gpm, respectively. The tracer concentrations and mass balance for intermediate wells in Segments 1, 2, and 4 show consistent movement of the tracer within each segment. The travel time between the injection wells and first intermediate injection well (located 15 ft from the injection well) was typically one to two weeks. The mass balance estimates between the injection wells and the first intermediate wells in Segments 1, 2, and 4 ranged between 57% and 100%. The tracer concentrations and mass balance in intermediate wells in Segment 3 indicate significantly slower movement of the tracer. The slower movement of tracer is consistent with the groundwater flow model that showed some of the water injected into EW-13 being pulled back towards the south into the higher pumping 16EW14B because 16EW12B could not sustain as high a yield. The second tracer test was conducted during the third injection of electron donor between well 16EW12B (injection point) and well 16EW12B (extraction point), during which groundwater was extracted from 16EW14B at a rate of 1.7 gpm and injected into 16EW12B at rate of 1.7 gpm. The monitoring results indicate travel times consistent with the results of the groundwater modeling of this recirculation scenario suggesting a travel time between recirculation wells (a distance of 35 ft) to be approximately one to two months. The travel time for the peak concentration (10% to 20% of the injected concentration) of tracer to wells IW-2 and IW-3, located 14 ft to the north and 14 ft to the south of 16EW12B, was about 9 to 10 days. The travel time for the peak concentration of tracer to well 16PM04 located 17.5 ft to the south of 16EW12B was approximately 15 days. The travel time for the peak concentration of tracer to well IW-4, located 21 ft to the south of 16EW12B, was approximately 28 days. The results of the second tracer test confirm the results of the groundwater modeling and suggest that electron donor can be distributed across the biobarrier. The distance for degradation was demonstrated by the reductions in perchlorate in monitoring wells in the immediate vicinity of the biobarrier alignment. Degradation of perchlorate occurred in wells very close to the alignment of the biobarrier, indicating that the degradation of perchlorate can occur within the distance that electron donor is distributed upgradient of the center of the alignment of the biobarrier.

This page intentionally left blank

49
8.0 COST ASSESSMENT
This section presents the results of a cost assessment to implement EISB for perchlorate-impacted groundwater using the semi-passive approach for the addition of electron donor. Section 8.1 describes a costing model that was developed for the application of EISB with a comparison to other approaches to implementing EISB and to a P&T system; Section 8.2 presents an assessment of the cost drivers for the application of the technology; and Section 8.3 presents the results of an analysis of the costing model.
8.1 COST MODEL
A cost model was developed for EISB for this report and for the recently released SERDP/ESTCP monograph on In Situ Bioremediation of Perchlorate in Groundwater (Stroo and Ward, 2009). The cost model was developed for a template site based on a hypothetical site with perchlorate-impacted shallow groundwater. The specific site characteristics used are presented in Table 6, and an illustration of the plume and biobarrier are provided in Figure 11. Cost estimates were prepared for a semi-passive EISB remedy along with three other approaches to implementing EISB and for a conventional P&T system. Using the template site conditions, estimates of costs for the capital, O&M, and long-term monitoring were developed. Capital costs included design and permitting activities, mobilization, site preparation, well installation, chemical reagents, management, and derived waste disposal. O&M costs included mobilization, equipment replacement, and supplies (e.g., electron donor). Long-term monitoring costs included field supplies, sampling equipment, laboratory analysis, and regulatory reporting. Labor associated with the planning, procurement, and implementation of all aspects of the remedies is also included. Excluded from consideration are the costs of pre-remediation investigations (e.g., plume delineation, risk determination, and related needs), treatability studies, source zone treatment, and post remediation and decommissioning. The cost estimates focused on treatment of a contaminated plume of groundwater, and costs for possible source zone treatment are not included. In reality, it may be appropriate to treat source areas that may contain a significant mass of perchlorate and contribute slowly to elevated concentrations in groundwater. A perchlorate “source” may take a variety of forms, including:
Perchlorate in the geological media above the water table (the “vadose zone”), which is carried into the groundwater by water infiltrating from the surface and flushing the perchlorate into the groundwater
Perchlorate in the vadose zone, which dissolves into the groundwater as groundwater elevations increase (possibly on an intermittent basis) and saturate the vadose zone containing the perchlorate
Perchlorate disposed of below the water table in a manner that allows the perchlorate to be released into the groundwater over an extended period of time
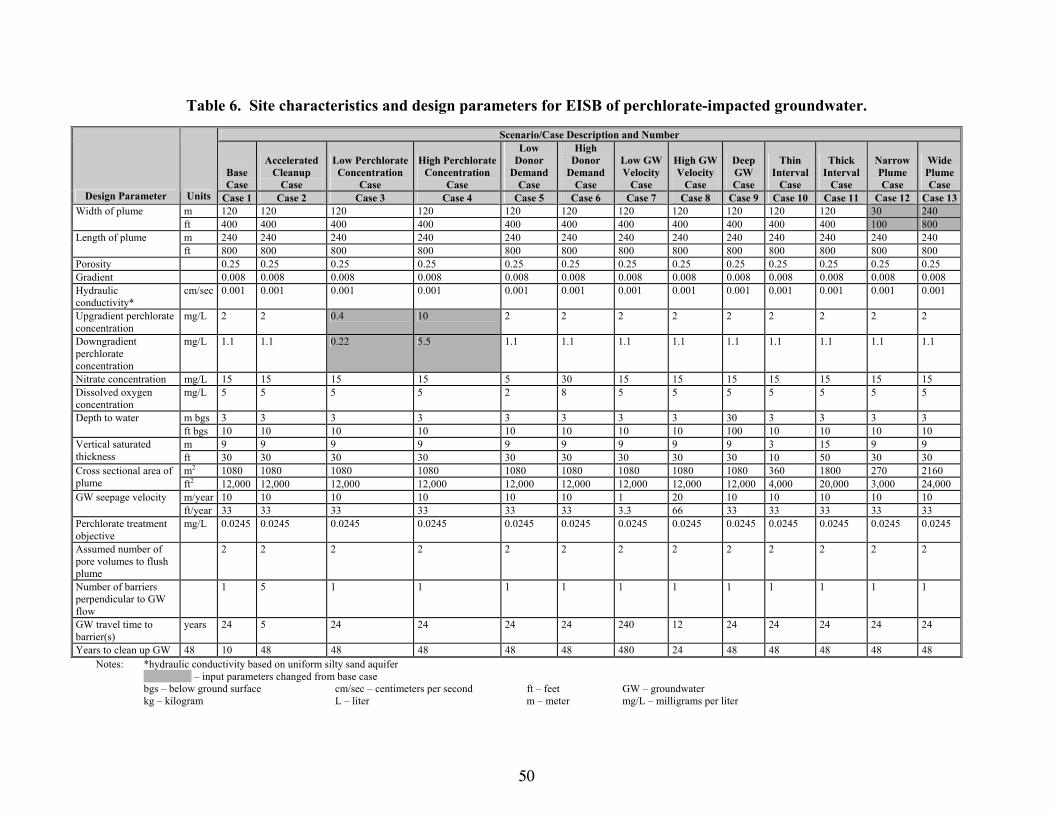
50
Table 6. Site characteristics and design parameters for EISB of perchlorate-impacted groundwater.
Scenario/Case Description and Number
Base Case
Accelerated Cleanup
Case
Low Perchlorate Concentration
Case
High Perchlorate Concentration
Case
Low Donor
Demand Case
High Donor
Demand Case
Low GW Velocity
Case
High GW Velocity
Case
Deep GW Case
Thin Interval
Case
Thick Interval
Case
Narrow Plume Case
Wide Plume Case
Design Parameter Units Case 1 Case 2 Case 3 Case 4 Case 5 Case 6 Case 7 Case 8 Case 9 Case 10 Case 11 Case 12 Case 13m 120 120 120 120 120 120 120 120 120 120 120 30 240 Width of plume ft 400 400 400 400 400 400 400 400 400 400 400 100 800 m 240 240 240 240 240 240 240 240 240 240 240 240 240 Length of plume ft 800 800 800 800 800 800 800 800 800 800 800 800 800
Porosity 0.25 0.25 0.25 0.25 0.25 0.25 0.25 0.25 0.25 0.25 0.25 0.25 0.25 Gradient 0.008 0.008 0.008 0.008 0.008 0.008 0.008 0.008 0.008 0.008 0.008 0.008 0.008 Hydraulic conductivity*
cm/sec 0.001 0.001 0.001 0.001 0.001 0.001 0.001 0.001 0.001 0.001 0.001 0.001 0.001
Upgradient perchlorate concentration
mg/L 2 2 0.4 10 2 2 2 2 2 2 2 2 2
Downgradient perchlorate concentration
mg/L 1.1 1.1 0.22 5.5 1.1 1.1 1.1 1.1 1.1 1.1 1.1 1.1 1.1
Nitrate concentration mg/L 15 15 15 15 5 30 15 15 15 15 15 15 15 Dissolved oxygen concentration
mg/L 5 5 5 5 2 8 5 5 5 5 5 5 5
m bgs 3 3 3 3 3 3 3 3 30 3 3 3 3 Depth to water ft bgs 10 10 10 10 10 10 10 10 100 10 10 10 10 m 9 9 9 9 9 9 9 9 9 3 15 9 9 Vertical saturated
thickness ft 30 30 30 30 30 30 30 30 30 10 50 30 30 m2 1080 1080 1080 1080 1080 1080 1080 1080 1080 360 1800 270 2160 Cross sectional area of
plume ft2 12,000 12,000 12,000 12,000 12,000 12,000 12,000 12,000 12,000 4,000 20,000 3,000 24,000 m/year 10 10 10 10 10 10 1 20 10 10 10 10 10 GW seepage velocity ft/year 33 33 33 33 33 33 3.3 66 33 33 33 33 33
Perchlorate treatment objective
mg/L 0.0245 0.0245 0.0245 0.0245 0.0245 0.0245 0.0245 0.0245 0.0245 0.0245 0.0245 0.0245 0.0245
Assumed number of pore volumes to flush plume
2 2 2 2 2 2 2 2 2 2 2 2 2
Number of barriers perpendicular to GW flow
1 5 1 1 1 1 1 1 1 1 1 1 1
GW travel time to barrier(s)
years 24 5 24 24 24 24 240 12 24 24 24 24 24
Years to clean up GW 48 10 48 48 48 48 48 480 24 48 48 48 48 48 Notes: *hydraulic conductivity based on uniform silty sand aquifer – input parameters changed from base case bgs – below ground surface cm/sec – centimeters per second ft – feet GW – groundwater kg – kilogram L – liter m – meter mg/L – milligrams per liter

51
Figure 11. Base case plume and biobarrier configuration.
52
Perchlorate, which was released into the groundwater at high concentrations and diffused into low hydraulic conductivity (K) units in the geological media and which continue to diffuse out of the low K units as the upgradient source of perchlorate is depleted.
If the “source” material is not treated, it may continue to feed the plume for an extended period of time and it may be necessary to treat the plume for a longer period of time until the source zone is sufficiently depleted. The semi-passive remedial approach could be used in a modified configuration to treat source areas below the water table, but estimating the costs for this application is beyond the scope of this document. Sources of perchlorate above the water table may be treated using other approaches such as enhanced flushing of the vadose zone. To obtain a clearer picture of life-cycle costs for the various options, estimates include the NPV of future costs. The NPV calculations provide cash flow analysis for 30 years, showing the costs by category for each year. The future costs are only carried forward for 30 years on the basis that the NPV of future costs beyond the 30-year time frame are small and the future costs beyond the 30-year period of time are difficult to predict. O&M and long-term monitoring costs are discounted at a rate of 3% to develop the NPV estimates of future costs (Department of Defense [DoD], 1995). The rate of 3% is based on the U.S. Federal Government Office of Management and Budget “Real Interest Rates on Treasury Notes and Bonds” for 20-year and 30-year notes and bonds of 2.8% (Office of Management and Budget, 2008). The cost model also estimates the impact of changes in site characteristics and design parameters. Using the template site as a baseline condition, site characteristics and design parameters (e.g., depth to groundwater, contaminant plume width, and groundwater velocity) were varied individually, and the twelve iterations are shown in Table 6. This specific analysis provides some insight into how capital, O&M, and long-term monitoring costs are affected by changing specific variables. The base case assumes a homogeneous silty sand aquifer from a depth of 3 m (approximately 10 ft) bgs to 12 m (40 ft) bgs with a K of 0.001 cm/sec, a horizontal gradient of 0.008 m/m, and a porosity of 0.25. These aquifer characteristics result in a groundwater seepage velocity of approximately 10 m/year (33 ft/year). The plume of perchlorate-impacted groundwater extends along the direction of groundwater flow for 240 m (800 ft) and is 120 m (400 ft) in width. The concentration of perchlorate at the upgradient side of the plume is 2 mg/L, and the concentration on the downgradient side is 1.1 mg/L. Oxygen and nitrate will contribute demand for electron donor, and the assumed concentrations of dissolved oxygen and nitrate are 5 mg/L and 15 mg/L, respectively. The base case also assumes that two pore volumes of clean water will need to flush through the impacted areas to achieve the clean-up objectives. In reality, the number of pore volumes of clean water required to flush through the subsurface to achieve target treatment objectives will be determined by a number of factors, such the degree of heterogeneity of the geological media. Variations in the K of the aquifer material can allow significant mass of perchlorate to diffuse into low K layers and then act as an ongoing source of perchlorate to the higher K zone as the

53
perchlorate is flushed from the higher K zones. In most geological settings, more than two pore volumes will be required to achieve treatment objectives, and longer term operation of the remedial measures will be required. The assumption that two pore volumes of flushing are required to achieve treatment objectives could only be valid for situations where there is very uniform K of the geological media and is likely an optimistic assumption for most real-world situations. The base case design incorporates one biobarrier on the downgradient edge of the plume to treat water as it flows across the line of the biobarrier. Based on the groundwater seepage velocity of 10 m/yr (33 ft/year), a plume that extends for 240 m (800 ft) along the direction of groundwater flow and the assumed need to flush two pore volumes of clean water through the impacted aquifer to achieve cleanup standards, it would be expected to take approximately 48 years for the plume to be treated in the base case. If more than two pore volumes of flushing are actually required to achieve treatment objectives, the biobarrier would need to be operated beyond the 30-year time frame considered in this costing exercise, but the concentrations to be treated would likely be reduced significantly and operating requirements reduced. The costs of this potential future operation would be incurred more than 30 years into the future and the NPV of these costs would not be as significant as the costs incurred for operation in the near and medium term (i.e., less than 30 years). The perchlorate treatment objective that was used for the template site was based on the chronic exposure reference dose (and the resulting drinking water equivalent concentration) selected by USEPA in 2005 (http://www.epa.gov/iris/subst/1007.htm) of 24.5 μg/L (0.0245 mg/L). A lower treatment objective would increase the costs associated with the implementation of the approaches presented here. The semi-passive bioremediation approach considered can achieve low treatment criteria (i.e., below 0.004 mg/L), but to achieve lower target treatment criteria, a higher safety factor will be required in the design and operation of each of the remedies such that pockets or layers of low K geological material containing untreated groundwater with some perchlorate do not remain or transmit perchlorate in groundwater following treatment, and the system may need to be operated for a longer period of time. If a very low target treatment objective is required, even small pockets or layers of untreated groundwater could result in groundwater samples exceeding the target criteria. Layers of low K geological material exist at many sites where interbedded clay, silts, and sands are present and can serve as longer term repositories for perchlorate from which diffusion is the dominant transport mechanism. These pockets or layers may release perchlorate to flowing groundwater after treatment of perchlorate in the higher K units has been completed. As discussed above, the presence of significant low K repositories of perchlorate and low target treatment concentrations would affect the assumption used in the base case that two pore volumes of groundwater need to be flushed through the plume to achieve the target treatment objectives. If additional clean groundwater needs to be flushed through the plume area to achieve remedial action objectives, then the treatment system will need to be operated for a longer period of time and incur additional long-term O&M and monitoring costs. The additional safety factor in design and possibly longerterm operation will increase costs to achieve lower target treatment objectives, but the impact of a specific change in the target treatment
54
concentration is difficult to predict without extensive and very detailed site characterization and contaminant transport modeling. The semi-passive biobarrier alternative assumes that a series of injection and extraction wells will be installed along the alignment of the biobarrier and a groundwater recirculation system will be constructed to recirculate groundwater and distribute electron donor across the biobarrier. Groundwater will be recirculated between injection and extraction wells and a soluble electron donor will be added to the water being recirculated to distribute the electron donor across the plume of perchlorate impacted groundwater. For the purpose of this cost model, it is assumed that this initial system installation is the same as would be used for an active approach to the addition of electron donor. The costing has been developed based on circulating groundwater and adding electron over a period of 3 weeks, after which the recirculation system will be shut down for a period of 9 months. Operation will continue on a cycle of 3 weeks of groundwater recirculation and addition of electron donor every 9 months. The operating costs would be lower than for an active system as a result of the reduced operating requirements and reduced potential for biofouling of injection wells. In some situations, it may be possible to reduce the capital expenditure for the semi-passive systems by using simple controls and more manual operations than would be possible with active recirculation systems. In some situations, the capital costs can be further reduced by constructing small mobile units that can be used to recirculate groundwater and add electron donor at one set of wells and then moved to wells at another location to recirculate groundwater and add electron donor. The other EISB approaches considered here include passive electron donor injection, active electron donor injection, and a trench biowall. The passive EISB system assumes that a series of injection wells is installed across the plume and that emulsified vegetable oil (EVO) is injected into these wells every 3 years. The active system would be set up in a manner almost identical to the semi-passive system but would be operated on a continuous rather than an intermittent basis. The trench biowall EISB system assumes that a trench is excavated to intercept the plume of perchlorate-impacted groundwater and is backfilled with mulch and EVO. It is assumed that the biowall is rejuvenated by injecting additional EVO after 4 and 8 years and every 3 years thereafter. The groundwater extraction and treatment or P&T system included for comparison would be similar to the biobarrier system in that a row of extraction and injection wells would be used to bring groundwater to the surface and to reinject the groundwater, but rather than amending the groundwater with electron donor, the groundwater would be treated to remove perchlorate prior to reinjection on a continuous basis. The groundwater treatment component of this system would be a small-scale bioreactor to degrade perchlorate. A series of 12 variations in site conditions and/or design parameters was developed, and the cost implications of these variations on the semi-passive EISB system were estimated. The first variation of the base case, Case 2: Accelerated Cleanup Case, utilizes five biobarriers aligned perpendicular to the direction of groundwater flow distributed every 48 m (160 ft) within the 240 m (800 ft) long plume. This will provide treatment of the plume at one downgradient and four intermediate locations rather than just at the downgradient edge of the plume. Based on the seepage velocity of 10 m/yr (33 ft/year) and the assumption that two pore volumes of clean water
55
need to flow through the plume area to achieve cleanup, this case will require approximately 10 years to treat the groundwater rather than the 48 years of the base case. The third and fourth cases incorporate reduced and elevated concentrations of perchlorate in groundwater as shown in Table 6. The fifth and sixth cases assume lower and higher concentrations of nitrate and dissolved oxygen that will result in a higher and lower demand for electron donor. The seventh and eighth cases incorporate lower and higher groundwater seepage velocities resulting from changes in the hydraulic gradient from the base case. The ninth case assumes that the depth to groundwater is 30 m (100 ft) rather than the 3 m (10 ft) in the base case. The tenth and eleventh cases assume thin and thick vertical interval of 3 m (10 ft) and 15 m (50 ft) rather than the 9 m (30 ft) of the base case. The twelfth and thirteenth cases assume a narrow plume (30 m [100 ft] in width) and a wide plume (240 m [800 ft] in width) rather than the 120 m (400 ft) width of the base case. The costs of the base case and the variations are discussed in Section 8.3.
8.2 COST DRIVERS
The costs to implement EISB for perchlorate-impacted groundwater using the semi-passive approach for the addition of electron donor will vary significantly from site to site. The key costs drivers are listed below, followed by a brief discussion of the impact on cost.
Width of plume (perpendicular to the direction of groundwater flow). Treatment systems for wider plumes require more recirculation wells, equipment, electron donor, and labor to operate. Some system costs, such as design and mobilization, will be relatively insensitive to the size of a system but many costs will increase in direct proportion with an increase in the width of the area to be treated.
Length of plume to be treated. Treatment systems may be designed to treat the entire length of a plume in a shorter time period by installing recirculation wells at many locations along the length of the plume, or they may be designed to treat a plume over a longer period of time as the groundwater flows through a few biobarriers aligned perpendicular to the direction of groundwater flow. In either case, the costs will be higher for plumes of greater length. Systems designed to treat plumes quickly will require more recirculation wells, more equipment, more electron donor, and more labor to operate than systems designed to treat perchlorate over a longer period of time. Systems designed to treat plumes as they flow through a small number of biobarriers will need to operate for longer periods of time if the plume to be treated has a greater length.
Vertical thickness of the area of impacted groundwater. Systems designed to treat plumes with a greater vertical thickness will be more expensive as they will require longer screen in the recirculation wells, higher capacity pumps, piping and other equipment, more electron donor, and some additional labor to operate. As with the length of the plume, some system costs, such as design and mobilization costs, will be relatively insensitive to the size of a system, but many costs will increase in direct proportion with an increase in the vertical thickness of the area to be treated.

56
Depth of the interval to be treated. System designed to treat perchlorate at greater depths will be somewhat more expensive than shallow plumes as a result of the higher costs of installing recirculation wells. Most other capital and operating costs will not be impacted greatly by the need to treat deeper plumes of perchlorate-impacted groundwater.
The area of the plume of impacted groundwater to be treated. As discussed above, systems may be designed to treat the entire length of a plume on a short time frame by installing recirculation wells at many locations along the length of the plume, or they may be designed to treat a plume over a longer period of time as the groundwater flows through a few biobarriers aligned perpendicular to the direction of groundwater flow. Treating the entire plume will increase the initial capital costs relative to treating the plume as water flows through a small number of biobarriers, but the long-term costs will be less because treatment will be completed over a shorter period of time.
Ambient groundwater velocity. Systems designed to treat higher ambient groundwater velocities will be more expensive because higher groundwater recirculation rates or additional recirculation wells will likely be required to distribute electron donor across the width of the plume and the higher groundwater velocities will result in greater demand for electron donor as higher quantities of perchlorate and other electron acceptors will be flowing through the target treatment zone. A higher groundwater velocity will, however, usually allow for cleanup criteria to be achieved in a shorter period of time, as water flows faster through the impacted geological media.
K of the geological media containing the impacted groundwater. Sites with a high K will generally have high groundwater velocities and associated higher costs as discussed above. Systems at low K sites will generally be less expensive because of the lower groundwater velocity, but the amount of the costs savings may be reduced somewhat by the need for a greater number of recirculation wells that may be required to recirculate a sufficient amount of groundwater to maintain hydraulic control.
The variation in the K of different layers in the geological media. Sites with a high degree of variation in the K of different layers in the geological media will have increased costs as a result of the greater number of pore volumes of clean water required to flush through the subsurface to achieve target treatment objectives. Variations in the K of the aquifer material can allow significant mass of perchlorate to diffuse into low K layers and then act as an ongoing source of perchlorate to the higher K zone as the perchlorate is flushed from the lower K zones. The need for more pore volumes of water to flush the subsurface will result in the need to operate the system for a longer period of time with an associated increase in operation, maintenance, and monitoring (OM&M) costs.
Concentration of perchlorate in impacted groundwater. Higher concentrations of perchlorate may not impact the initial capital costs to a large extent but will increase OM&M costs for systems in two ways. First, higher concentrations of perchlorate will require more clean water to flush the perchlorate from the
57
geological media and therefore a longer period of operation. Second, the higher concentrations will require more electron donor to degrade the perchlorate present, although the impact of this factor may be small at most sites where the total demand for electron donor is dominated by parameters such as DO, nitrate, and sulfate rather than by the perchlorate concentration.
Target treatment concentration. EISB can achieve low treatment criteria (i.e., below 4 μg/L) but the lower the target treatment criteria, the higher the safety factor required in the design and operation of the system so that pockets or layers of low K geological material containing untreated groundwater with some perchlorate do not remain or transmit perchlorate in groundwater following treatment. If a very low target treatment objective is required, even small pockets or layers of untreated groundwater could result in groundwater samples exceeding the target criteria and operation of the system for a long period of time may be required. Layers of low K geological material exist at many sites where inter-bedded clay, silts, and sands are present and can serve as longer term repositories for perchlorate from which diffusion is the dominant transport mechanism. These pockets or layers may release perchlorate to flowing groundwater after substantial treatment of perchlorate in the higher K units has been completed.
Concentration of other electron acceptors. High concentration of other electron acceptors such as DO, nitrate, and sulfate will increase the amount of electron donor required to degrade perchlorate. The increased electron donor demand will increase the operating costs somewhat for the system.
8.3 COST ANALYSIS
The detailed breakdown of the estimated capital costs, annual O&M costs, long-term monitoring costs and the NPV of these costs for 1) the semi-passive EISB, 2) the passive EISB, 3) the active EISB, 4) the trench biowall EISB, and 5) the equivalent P&T system are presented in the Final Report. A summary of these costs is presented in Table 7. The capital cost, including design, installation of wells, installation of the groundwater recirculation and amendment system, and system start-up and testing for the semi-passive EISB system is approximately $430,000, and the annual O&M cost is estimated to be $39,000 per year. The NPV of the O&M represents an additional $780,000 of costs over a 30-year life. The NPV of the long-term monitoring costs is estimated to be $350,000 to give a total current value cost for the alternative of $1,560,000. The total cost of the remedy over 30 years is estimated to be $2,060,000. The cross sectional area of the plume for this scenario is 1080 m2 or 12,000 ft2. The unit costs for capital and annual O&M are therefore $398/m2 ($36/ft2) and $36/m2 ($3/ft2), respectively.

58
Table 7. Summary of costs for treatment of perchlorate-impacted groundwater.
Alternative Capital Costs
Total O&M Costs (year 1 to 30)
Average Annual
O&M costs (year 1 to 30)
NPV of 30 Years of O&M
Costs
NPV of 30 Years of Monitoring
Costs
NPV of 30 Years of
Total Remedy
Costs
Total 30-Year Remedy
Costs Semi-passive biobarrier $430,000 $1,160,000 $38,700 $780,000 $350,000 $1,560,000 $2,060,000 Passive biobarrier $280,000 $1,500,000 $50,000 $990,000 $350,000 $1,620,000 $2,250,000 Active biobarrier $430,000 $1,800,000 $60,000 $1,200,000 $350,000 $1,980,000 $2,700,000 Trench biowall $320,000 $1,250,000 $41,700 $780,000 $350,000 $1,450,000 $2,040,000 P&T $490,000 $2,200,000 $73,300 $1,470,000 $350,000 $2,310,000 $3,160,000 Cross sectional area of biobarrier (m2) 1080 1080 1080 1080 1080 1080 1080 Cross sectional area of biobarrier (m2) 12,000 12,000 12,000 12,000 12,000 12,000 12,000
Unit Cost Basis ($ per m2 of biobarrier) Semi-passive biobarrier $398 $1100 $36 $720 $324 $1400 $1900 Passive biobarrier $259 $1400 $46 $920 $324 $1500 $2100 Active biobarrier $398 $1700 $56 $1110 $324 $1800 $2500 Trench biowall $296 $1200 $39 $720 $324 $1300 $1900 P&T $454 $2000 $68 $1360 $324 $2100 $2900
Unit Cost Basis ($ per ft2 of biobarrier) Semi-passive biobarrier $36 $97 $3.20 $65 $29 $130 $170 Passive biobarrier $23 $125 $4.20 $83 $29 $140 $190 Active biobarrier $36 $150 $5.00 $100 $29 $170 $230 Trench biowall $27 $104 $3.50 $65 $29 $120 $170 P&T $41 $183 $6.10 $123 $29 $190 $260 Notes: NPV – net present value; current value of future costs based on a 3% annual discount rate O&M – operation and maintenance ft2 – square feet m2 – square meters
59
Costs for all of the alternatives considered in this evaluation are presented in Table 7. Figure 12 shows the cumulative costs by year for each of the alternatives evaluated above. The total 30-year costs for the semi-passive EISB and the trench biowall options are virtually the same at about $2,000,000. The costs for the passive EISB are slightly more at about $2,250,000, and the costs for the active EISB are the highest of the EISB alternatives at $2,700,000. The costs for the P&T option are over $3,000,000. Table 8 shows the estimates of the impact of variations in the site characteristics and design parameters on the costs for the semi-passive EISB approach. Of the changes in site characteristics and design parameters considered in this evaluation, the most significant cost driver is the decision to accelerate the cleanup of the entire zone of perchlorate-impacted groundwater rather than treating groundwater at the downgradient limit and allowing the impacted groundwater to flow through this location over time. As a result of the size of the plume, a significant number of separate biobarrier systems would be required to provide sufficient coverage of the impacted groundwater to accelerate cleanup.
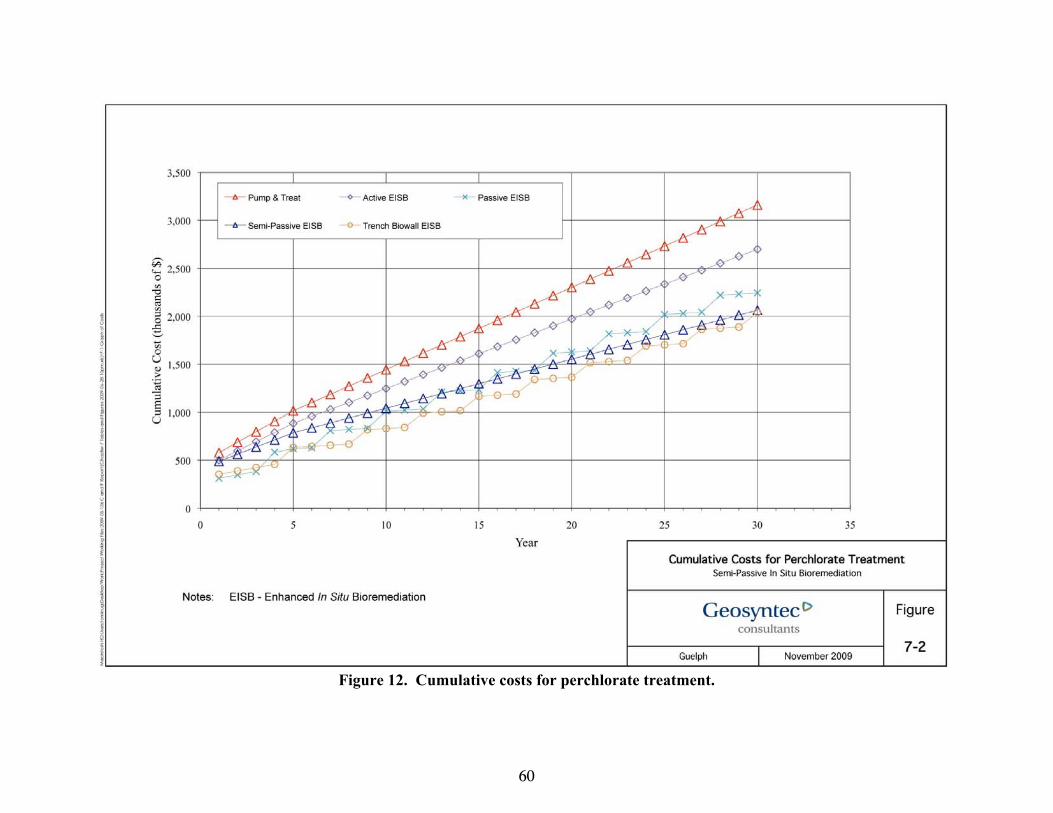
60
Figure 12. Cumulative costs for perchlorate treatment.

61
Table 8. Impact of site characteristics and design parameters on costs for semi-passive EISB.
Base Case
Accelerated Cleanup Case
Low Perchlorate Concentration
Case
High Perchlorate Concentration
Case Low Donor
Demand Case High Donor
Demand Case Low GW
Velocity Case Case 1 Case 2 Case 3 Case 4 Case 5 Case 6 Case 7 Cost
Component Cost Factor Cost Factor Cost Factor Cost Factor Cost Factor Cost Factor Cost Capital cost $430,000 4.50 $1,935,000 0.98 $421,400 1.05 $451,500 0.95 $408,500 1.15 $494,500 0.90 $387,000 NPV of O&M costs
$780,000 1.75 $1,365,000 0.95 $741,000 1.05 $819,000 0.90 $702,000 1.20 $936,000 0.90 $702,000
NPV of monitoring costs
$350,000 1.25 $437,500 1.00 $350,000 1.00 $350,000 1.00 $350,000 1.00 $350,000 1.00 $350,000
NPV of total costs
$1,560,000 2.40 $3,737,500 0.97 $1,512,400 1.04 $1,620,500 0.94 $1,460,500 1.14 $1,780,500 0.92 $1,439,000
High GW
Velocity Case Deep GW Case Thin Interval
Case Thick Interval
Case Narrow Plume
Case Wide Plume Case Case 8 Case 9 Case 10 Case 11 Case 12 Case 13 Cost
Component Factor Cost Factor Cost Factor Cost Factor Cost Factor Cost Factor Cost Capital cost 1.15 $494,500 1.25 $537,500 0.90 $387,000 1.15 $494,500 0.35 $150,500 1.85 $795,500 NPV of O&M costs
1.10 $858,000 1.00 $780,000 0.90 $702,000 1.15 $897,000 0.45 $351,000 1.75 $1,365,000
NPV of monitoring costs
0.90 $315,000 1.00 $350,000 1.00 $350,000 1.00 $350,000 0.50 $175,000 1.50 $525,000
NPV of total costs
1.07 $1,667,500 1.07 $1,667,500 0.92 $1,439,000 1.12 $1,741,500 0.43 $676,500 1.72 $2,685,500
Notes: All costs are in thousands of dollars NPV – net present value Factor – factor increase or decrease in costs relative to the Base Case O&M – operation and maintenance

This page left blank intentionally.
63
9.0 IMPLEMENTATION ISSUES
This section describes implementation issues with EISB using semi-passive addition of electron donor to treat perchlorate-impacted groundwater.
9.1 ADDITIONAL SOURCES OF INFORMATION
Many guidance documents are available from organizations such as USEPA, ITRC, and AFCEE dealing with EISB for perchlorate and chlorinated solvents. Many design issues with EISB for chlorinated solvents are also common to perchlorate. SERDP/ESTCP recently published a monograph titled “In Situ Bioremediation of Perchlorate in Groundwater” (Stroo and Ward, 2009) based in part on the work described in this Cost and Performance Report. This monograph contains information on the various options for treatment of perchlorate-impacted groundwater and on the design for these options, including the semi-passive approach to EISB. A list of recent relevant guidance documents is presented in the Final Report.
9.2 POTENTIAL ENVIRONMENTAL ISSUES
9.2.1 Regulatory Issues
The implementation of EISB in most jurisdictions requires a groundwater reinjection permit. This permit must allow for extraction of groundwater, amendment with electron donor, and reinjection of the mixture. It is not normally difficult to obtain permits to implement such a program because 1) the groundwater that will be extracted will be reinjected close to where it was extracted; 2) electron donors normally consist of innocuous organic compounds; and 3) bioaugmentation (addition of a microbiological culture) is seldom required for EISB for treatment of perchlorate.
9.2.2 Air Discharge
The EISB process described will not normally result in discharge of chemicals to the atmosphere.
9.2.3 Wastewater Discharge
The EISB process described will not normally result in the generation of wastewater streams. Extracted groundwater is normally reinjected into the injection wells. Some small quantities of wastewater may be generated during well installation, and groundwater sampling events and must be managed as they would be for other investigation-derived waste.
9.2.4 Waste Storage, Treatment, and Disposal
The EISB process described will not normally result in the generation of significant waste streams. Some waste may be generated during well installation and must be managed as they would be for other investigation-derived waste.

64
9.3 END-USER ISSUES
Potential end users of this technology include responsible parties for contaminated sites where perchlorate is present in groundwater. End users will have an interest in the technology because it can potentially treat groundwater in situ at an overall cost much less than for conventional P&T remediation approaches. End users and other stakeholders may have concerns regarding 1) the effectiveness of the technology in reducing concentrations of target compounds below appropriate criteria; 2) potential negative impacts of excess electron donor on water quality downgradient of the treatment zone; and 3) potential negative impacts of the electron donor addition on secondary water characteristics.
9.4 PROCUREMENT ISSUES
There are no specialized equipment components required to implement EISB using the semi-passive approach and no specialized services required. There are no significant procurement issues with the application of this technology.
9.5 DESIGN ISSUES
Based on the results of the demonstration conducted at the LHAAP Site and a review of other applications of the technology, potential design issues to be considered in the development of the design of semi-passive EISB systems were identified. These design issues are discussed in the Final Report and include how to design systems for sites with:
Low hydraulic conductivity Significant variations in hydraulic conductivity High concentrations of competing electron acceptors High concentrations of naturally occurring metals in the soil.
65
10.0 REFERENCES
DoD. 1995. U.S. Department of Defense (DoD) Instruction 7041.3: Economic Analysis for Decision-Making. November 17, 1995. http://www.dtic.mil/whs/directives/corres/pdf/704103p. pdf
Geosyntec Consultants. 2002. In Situ Bioremediation of Perchlorate-Impacted Groundwater
Final Technical Report. Strategic Environmental Research and Development Program (SERDP). June 2002.
Geosyntec Consultants. 2003. Technology Demonstration Plan for: Remediation of Perchlorate
Through Semi-Passive Bioremediation. Prepared for the Environmental Security Technology Certification Program (ESTCP). May 2003.
Geosyntec Consultants. 2008. Final Report, Comparative Demonstration of Active and Semi-
Passive In Situ Bioremediation Approaches for Perchlorate Impacted Groundwater: Semi-Passive Bioremediation Demonstration. Prepared for the Environmental Security Technology Certification Program (ESTCP). December 2008.
Jacobs Engineering Group Inc. 2000. Final Remedial Investigation Report for the Site 16
Landfill at the Longhorn Army Ammunition Plant (LHAAP), Karnack, Texas, Jacobs Engineering Group Inc., Maryland Heights, MO. October 2000.
Jacobs Engineering Group Inc. March 2002. Final Feasibility Study for Site 16, Longhorn Army
Ammunition Plant (LHAAP), Karnack, Texas, Jacobs Engineering Group Inc., Oak Ridge, Tennessee, MO.
Office of Management and Budget. 2008. Discount Rates for Cost-Effectiveness, Lease,
Purchase and Related Analysis http://www.whitehouse.gov/omb/circulars/a094/a94_appx-c.html
Stroo, H. F. and C. H. Ward (Editors). 2009. In Situ Bioremediation of Perchlorate in
Groundwater. SERDP and ESTCP Remediation Technology Monograph Series. Published by Springer Science and Business Media, LLC. 2009.

This page left blank intentionally.
A-1
APPENDIX A
POINTS OF CONTACT
Point of Contact Name Organization
Phone Fax
E-Mail Role Andy Obrochta U.S. Army Corps of Engineers
CESWT-EC-ER 1645 South 101 East Avenue Tulsa, OK 74128
Phone: 918-669-7155 Fax: 918-669-7532 E-Mail: [email protected]
USACE Project Manager
Cliff Murray U.S. Army Corps of Engineers CESWT-EC-DD 1645 South 101 East Avenue Tulsa, OK 74128
Phone: 918-669-7573 Fax: 918-669-7532 E-Mail: [email protected]
USACE Technical Advisor
Rose Zeiler U.S. Army P.O. Box 23610 Barling, Arkansas 72923
Phone: 479-484-2516 Fax: 479-484-2055 E-Mail: [email protected]
LHAPP Representative
Evan Cox Geosyntec Consultants 130 Research Lane Suite 2 Guelph, ON NIG 5G3 Canada
Phone: 519-822-2230 Ext. 237 Fax: 519-822-3151 E-Mail: [email protected]
Principal Investigator
Tom Krug Geosyntec Consultants 130 Research Lane Suite 2 Guelph, ON NIG 5G3 Canada
Phone: 519-822-2230 Ext. 242 Fax: 519-822-3151 E-Mail: [email protected]
Co-Principle Investigator
David Bertrand Geosyntec Consultants 130 Research Lane Suite 2 Guelph, ON NIG 5G3 Canada
Phone: 519-822-2230 Ext. 245 Fax: 519-822-3151 E-Mail: [email protected]
Field Study Leader
Bill Corrigan Complete Environmental Service (CES) P.O. Box 170 Karnack, TX 75661
Phone: 903-679-3448 Fax: 903-679-3448 E-Mail: [email protected]
Site Contractor
Andrea Leeson ESTCP Office 901 N. Stuart Street Suite 303 Arlington, VA 22203
Phone: 703-696-2118 Fax: 703-696-2114 E-Mail: [email protected]
Environmental Restoration Program Manager
ESTCP Program Office
901 North Stuart StreetSuite 303Arlington, Virginia 22203
(703) 696-2117 (Phone)(703) 696-2114 (Fax)
E-mail: [email protected]