estcp cost and performance report
TRANSCRIPT
ESTCPCost and Performance Report
EnvironmEntal SEcuritytEchnology cErtification Program
u.S. Department of Defense
(ER-0511)
In Situ Bioremediation of Perchlorate and Nitrate in Vadose Zone Soil using Gaseous Electron Donor Injection Technology (GEDIT)
August 2010
i
COST & PERFORMANCE REPORT Project: ER-0511
TABLE OF CONTENTS
Page
1.0 EXECUTIVE SUMMARY ................................................................................................ 1 1.1 BACKGROUND .................................................................................................... 1 1.2 OBJECTIVES OF THE DEMONSTRATION ....................................................... 1 1.3 DEMONSTRATION RESULTS ............................................................................ 1
1.3.1 Perchlorate ......................................................................... 1 1.3.2 Nitrate ..........................................................................................................2
1.4 IMPLEMENTATION ISSUES .............................................................................. 2
2.0 INTRODUCTION .............................................................................................................. 3 2.1 BACKGROUND .................................................................................................... 3 2.2 OBJECTIVES OF THE DEMONSTRATION ....................................................... 3 2.3 REGULATORY DRIVERS ................................................................................... 3
3.0 TECHNOLOGY ................................................................................................................. 5 3.1 TECHNOLOGY DESCRIPTION .......................................................................... 5 3.2 ADVANTAGES AND LIMITATIONS OF THE TECHNOLOGY ...................... 7
4.0 PERFORMANCE OBJECTIVES ...................................................................................... 9
5.0 SITE DESCRIPTION ....................................................................................................... 11 5.1 SITE LOCATION ................................................................................................. 11 5.2 SITE GEOLOGY/HYDROGEOLOGY ............................................................... 11 5.3 CONTAMINANT DISTRIBUTION .................................................................... 12
6.0 TEST DESIGN ................................................................................................................. 13 6.1 CONCEPTUAL EXPERIMENTAL DESIGN ..................................................... 13 6.2 BASELINE CHARACTERIZATION .................................................................. 13 6.3 PHASE ICTREATABILITY STUDY .................................................................. 14 6.4 FIELD TESTING.................................................................................................. 15
6.4.1 Phase IICTracer Tests and Optimization ...................................... 16 6.4.2 Phase IIICGas Mixture Injection ............................................... 16 6.4.3 Phase IVCLPG Injection ........................................................ 17 6.4.4 Schedule ........................................................................... 17
6.5 SAMPLING METHODS ...................................................................................... 17 6.6 SAMPLING RESULTS ........................................................................................ 18
6.6.1 Steady State Gas Concentrations ............................................... 18 6.6.2 Perchlorate and Nitrate Concentrations in Soil ............................... 23 6.6.3 Relationship between Contaminant Destruction and Gas
Composition ...................................................................... 26
TABLE OF CONTENTS (continued)
Page
ii
6.6.4 Soil Moisture and Lithology Effects ........................................... 27
7.0 PERFORMANCE ASSESSMENT .................................................................................. 31 7.1 PERCHLORATE DESTRUCTION ..................................................................... 31 7.2 NITRATE DESTRUCTION ................................................................................. 31 7.3 PERCHLORATE DESTRUCTION RATE .......................................................... 31 7.4 NITRATE DESTRUCTION RATE ..................................................................... 31 7.5 IMPLEMENTABILITY ....................................................................................... 31
8.0 COST ASSESSMENT ...................................................................................................... 33 8.1 COST MODEL ..................................................................................................... 33 8.2 COST ANALYSIS................................................................................................ 33 8.3 COST DRIVERS .................................................................................................. 34
9.0 IMPLEMENTATION ISSUES ........................................................................................ 41 9.1 REGULATIONS AND PERMITS ....................................................................... 41 9.2 END-USER CONCERNS .................................................................................... 41
10.0 REFERENCES ................................................................................................................. 43 APPENDIX A POINTS OF CONTACT......................................................................... A-1
iii
LIST OF FIGURES
Page Figure 1. Comparison of bioventing and GEDIT. .................................................................. 5 Figure 2. Example gas injection GEDIT process and instrumentation diagram. ................... 6 Figure 3. Example soil vapor extraction SVE GEDIT process and instrumentation
diagram. .................................................................................................................. 6 Figure 4. Vicinity map, IRCTS. ........................................................................................... 11 Figure 5. Demonstration phases. .......................................................................................... 13 Figure 6. Piezometer and well locations. ............................................................................. 15 Figure 7. Gas supply for the demonstration. ........................................................................ 16 Figure 8. Gas supply control panel. ...................................................................................... 16 Figure 9. Demonstration schedule. ....................................................................................... 17 Figure 10. Gas sampling and analysis train. ........................................................................... 18 Figure 11. Average oxygen concentrations during N2/H2/LPG/CO2 injection. ..................... 19 Figure 12. Average H2 concentrations during N2/H2/LPG/CO2 injection. ............................. 20 Figure 13. Average H2 concentrations (log scale) during N2/H2/LPG/CO2 injection. ........... 20 Figure 14. Average propane concentrations during N2/H2/LPG/CO2 injection. .................... 21 Figure 15. Average oxygen concentrations during LPG injection. ........................................ 22 Figure 16. Average propane concentrations during LPG injection. ....................................... 22 Figure 17. Perchlorate concentrations within the 10-ft target ROI. ....................................... 23 Figure 18. Nitrate/nitrite concentrations within the 10-ft target ROI. .................................... 23 Figure 19. Perchlorate removal based on all data. ................................................................. 24 Figure 20. Average perchlorate removal within the 10-ft ROI target. ................................... 25 Figure 21. Nitrate/nitrite removal based on all data. .............................................................. 25 Figure 22. Average nitrate/nitrite removal within 10-ft ROI target. ...................................... 26 Figure 23. Relationship between contaminant removal and gas composition within the
10-ft target ROI during Phase III mixed N2/H2/LPG/CO2 gas injection. ............. 27 Figure 24. Perchlorate removal within the 10-ft target ROI at different final moisture
contents. ................................................................................................................ 28 Figure 25. Relationship between perchlorate destruction and final soil moisture and
USCS soil type. ..................................................................................................... 29 Figure 26. Sensitivity analyses for drilling-related costs. ...................................................... 34 Figure 27. Sensitivity analyses for gas-related costs. ............................................................. 39
iv
LIST OF TABLES
Page Table 1. Technical limitations and risks. .............................................................................. 8 Table 2. Performance objectives. .......................................................................................... 9 Table 3. Analytical methods for sample analysis. .............................................................. 18 Table 4. Design basis for each scenario. ............................................................................. 33 Table 5. Project implementation costs for GEDIT at IRCTS site under different
scenarios. ............................................................................................................... 35
v
ACRONYMS AND ABBREVIATIONS AGC Aerojet General Corporation amsl above mean sea level ASTM American Society for Testing and Materials bgs below ground surface BNA basic, neutral, and acidic semi-volatiles CDM Camp Dresser & McKee, Inc. cfh cubic feet per hour cfm cubic feet per minute CO2 carbon dioxide cy cubic yard DDT dichlorodiphenyltrichloroethane DoD Department of Defense DWEL drinking water equivalent level ESTCP Environmental Security Technology Certification Program GED gaseous electron donor GEDIT gaseous electron donor injection technology H2 hydrogen HMX high melting explosive or octahydro-1,3,5,7-tetranitro-1,3,5,7-tetrazocine IRCTS Inactive Rancho Cordova Test Site ITRC Interstate Technology Regulatory Council LEL lower explosive limit LPG liquefied petroleum gas MCL maximum contaminant level mg-N/kg milligrams of nitrogen per kilogram N2 nitrogen NA not applicable ND non-detect NDMA n-nitrosodimethylamine O&M operations and maintenance OSHA Occupational Safety and Health Administration
ACRONYMS AND ABBREVIATIONS (continued)
vi
PBA propellant burn area PCB polychlorinated biphenyls RDX royal demolition explosive or hexahydro-1,3,5-trinitro-1,3,5-triazine RfD reference dose ROI radius of influence Simon HSI Simon Hydro-Search, Inc. TCE trichloroethene TNT trinitrotoluene TOC total organic carbon USEPA U.S. Environmental Protection Agency USCS Unified Soil Classification System VOC volatile organic compound
Technical material contained in this report has been approved for public release.
vii
ACKNOWLEDGEMENTS This project was funded by the Environmental Security Technology Certification Program (ESTCP). Patrick Evans, Ph.D. (Camp Dresser & McKee, Inc. [CDM]) was the principal investigator and Rachel Brennan, Ph.D. (Pennsylvania State University) was the co-principal investigator. We are very appreciative of the support and encouragement from Dr. Andrea Leeson and Dr. Jeff Marqusee. Supplemental funding was provided by the Aerojet General Corporation (AGC), which also granted access to the demonstration site. The project team wishes to thank Mr. Rodney Fricke of AGC for his ongoing support and dedication throughout the project. Mr. Bryan Harre was the contracting officer’s representative and provided very helpful comments during project execution. Contact information for individuals involved in this project is provided in Appendix A.

This page left blank intentionally.
1
1.0 EXECUTIVE SUMMARY
1.1 BACKGROUND
Perchlorate is a human health concern because of its ability to inhibit iodide uptake by the thyroid. While extensive research and technology development on the treatment of perchlorate in water has been conducted, limited research and technology development has been focused on perchlorate in soil. Perchlorate contamination in soil is important because it can be a source of groundwater contamination. Currently, available technologies for the treatment of perchlorate in soil require excavation and are not always cost-effective or practical, particularly as the depth of contamination increases. In situ remediation of perchlorate in soil is an alternative, potentially more cost-effective solution. Gaseous electron donor injection technology (GEDIT) (U.S. Patent No. 7,282,149 and patent pending) involves injection of gaseous electron donors (GED) into the soil with the purpose of promoting anaerobic biodegradation of perchlorate to water and chloride ion. This technology can be viewed as bioventing in reverse. Bioventing, a proven bioremediation technology for petroleum hydrocarbons, involves the injection of a gaseous electron acceptor (e.g., oxygen) into the vadose zone resulting in the biodegradation of an electron donor (e.g., hydrocarbons). In the present application, the electron acceptor and donor are reversed with the GED being injected in order to biodegrade the electron acceptor (i.e., perchlorate or nitrate). GEDIT is also applicable to treatment of other Department of Defense (DoD) and Department of Energy related contaminants such as hexavalent chromium, uranium, technetium, chlorinated volatile organic compounds (VOC), and highly energetic compounds including trinitrotoluene (TNT), royal demolition explosive (RDX), and high melting explosive (HMX).
1.2 OBJECTIVES OF THE DEMONSTRATION
The overarching objective of this project was to demonstrate and validate GEDIT for treatment of perchlorate and nitrate in vadose zone soil. This project represents the first field demonstration of the technology. The demonstration yielded valuable engineering design information on GEDIT implementation. Development of an engineering guidance document was another objective of the project. Quantitative performance objectives for the project included greater than 90% perchlorate and nitrate destruction within 12 months of operation and a radius of influence (ROI) of 10 ft or greater. Qualitative performance objectives regarding safety, regulatory acceptance, and ease of use were also included. All performance objectives were met or exceeded.
1.3 DEMONSTRATION RESULTS
1.3.1 Perchlorate
The demonstration was conducted at the Boeing Inactive Rancho Cordova Test Site (IRCTS) Propellant Burn Area (PBA) in Rancho Cordova, CA. The average percent perchlorate destruction was 93±9% within the targeted 10-ft ROI and the 10-to-40-ft below ground surface (bgs) depth interval and within 5 months of operation. The performance objective of 90% for perchlorate destruction was exceeded. Initial perchlorate concentrations within this ROI and
2
depth ranged from 2600 to 75,000 micrograms per kilogram (µg/kg). Final perchlorate concentrations ranged from <13 to 8800 µg/kg. Seven final soil samples (i.e., six sample locations plus one duplicate) were non-detect (ND) for perchlorate (<13 to <15 µg/kg).
1.3.2 Nitrate
The average percent nitrate destruction was 94±9% within the targeted 10-ft ROI and the 10-to-50-ft bgs depth interval and within 5 months of operation. The performance objective of 90% for nitrate destruction was exceeded. When all data that comprised an ROI of 55 ft were considered, the average nitrate destruction was 90±14%. Initial concentrations of nitrate plus nitrite within the 10-ft target ROI ranged from 2.0 to 8.6 milligrams of nitrogen per kilogram (mg-N/kg). Final nitrate plus nitrite concentrations ranged from <0.054 to 2.9 mg-N/kg. Six final soil samples (i.e., five sample locations plus one duplicate) were ND for nitrate (<0.054 to <0.057 mg-N/kg). ROI was used as a primary metric for implementability because it will determine the number of wells required to treat a given area. The ROI for perchlorate degradation was conservatively estimated to be 10 ft and likely to be 15 ft during the demonstration. The ROI for nitrate degradation was estimated to be at least 55 ft. The performance objective for implementability was an ROI of 10 ft. Therefore the performance objective was met. Unit costs for various scenarios ranged from $21 to $87 per cubic yard (cy). These costs are considered to be conservative, and further optimization of the process is anticipated to further decrease unit costs. An alternative approach to in situ treatment is excavation of vadose zone soil and ex situ bioremediation. This process includes soil excavation; rock screening and crushing; soil mixing with water, electron donor, and nutrients; storage in treatment cells during biodegradation; soil drying; and backfilling. Full-scale costs for this process were estimated to be about $35/ton or $45/cy.
1.4 IMPLEMENTATION ISSUES
In addition to well spacing, regulatory acceptance, permitting, and safety are important implementation issues. Federal or state regulations driving site cleanup will drive the need for GEDIT. The primary application for GEDIT is anticipated to be treatment of contaminants such as perchlorate in soil for the purpose of groundwater protection. The feasibility study process will include evaluation of GEDIT compared to other alternatives such as pump-and-treat, liquid flushing, and excavation. Specific permits for GEDIT will be driven by local codes and will include drilling and well installation permits and hazardous materials storage permits. Other permits may be necessary and will be dependent on local codes. Flammability is the primary end-user concern associated with GEDIT. As shown in this demonstration, this issue was easily managed and did not necessitate unusual efforts. The level of effort was similar to that for a construction site or remediation of a gasoline station site. Engineering guidance for implementation of this technology is included in the Environmental Security Technology Certification Program (ESTCP) Final Report.
3
2.0 INTRODUCTION
2.1 BACKGROUND
Currently, available technologies for the treatment of perchlorate in soil require excavation and are not always cost-effective or practical, particularly as the depth of contamination increases. When applicable, excavation followed by anaerobic composting has proven to be effective. In situ remediation of perchlorate in soil is an alternative, potentially more cost-effective solution. Currently, emerging in situ technologies for treating perchlorate in soil involve soil flushing with water or liquid electron donors. Flushing the soil with water or liquid electron donors transfers the contaminant to the aqueous phase, which must then be extracted and treated. Soil flushing technologies are limited by the ability to adequately distribute these liquids throughout the vadose zone, as a result of the tendency for fluids to flow along preferential pathways, and potential difficulty in capturing infiltrated water at certain sites. Additionally, technologies based on infiltration of liquid electron donors become even more difficult to apply as vadose zone contamination extends deeper. Therefore, there is a need for more effective in situ perchlorate treatment technologies applicable to vadose zone soil at any depth. GEDIT (U.S. Patent No. 7,282,149 and patent pending) involves injection of gases such as hydrogen (H2) and propane into the vadose zone to stimulate anaerobic biological reduction of perchlorate to water and chloride. GEDIT is also applicable to treatment of other DoD and Department of Energy related contaminants such as hexavalent chromium, uranium, technetium, chlorinated VOCs, and highly energetic compounds, including TNT, RDX, and HMX.
2.2 OBJECTIVES OF THE DEMONSTRATION
The overarching objective of this project was to demonstrate and validate GEDIT for treatment of perchlorate and nitrate in vadose zone soil. This project represents the first field demonstration of the technology. Quantitative performance objectives for the project included greater than 90% perchlorate and nitrate destruction within 12 months of operation and a ROI of 10 ft or greater. Qualitative performance objectives regarding safety, regulatory acceptance, and ease of use were also included. All performance objectives were met or exceeded.
2.3 REGULATORY DRIVERS
The primary driver for cleanup of perchlorate in soil is protection of groundwater. The current drinking water equivalent level (DWEL) is 24.5 micrograms per liter (µg/L) which is based on a reference dose (RfD) of 0.0007 milligrams per kilogram per day (mg/kg/day) (U.S. Environmental Protection Agency [USEPA], 2006a). Currently, USEPA has established an interim drinking water health advisory level of 15 µg/L for perchlorate (USEPA, 2008). Individual states vary in their regulation of perchlorate in drinking water. California has established an maximum contaminant level (MCL) of 6 µg/L, and Massachusetts has established an MCL of 2 µg/L. Other states vary with respect to how they regulate perchlorate, and very few states have specific regulatory limits for perchlorate in soil (Interstate Technology Regulatory Council [ITRC], 2005). Most commonly, cleanup limits for perchlorate in soil are established on a site-by-site basis and can be as stringent as ND in order to protect groundwater.

This page left blank intentionally.
5
3.0 TECHNOLOGY
3.1 TECHNOLOGY DESCRIPTION
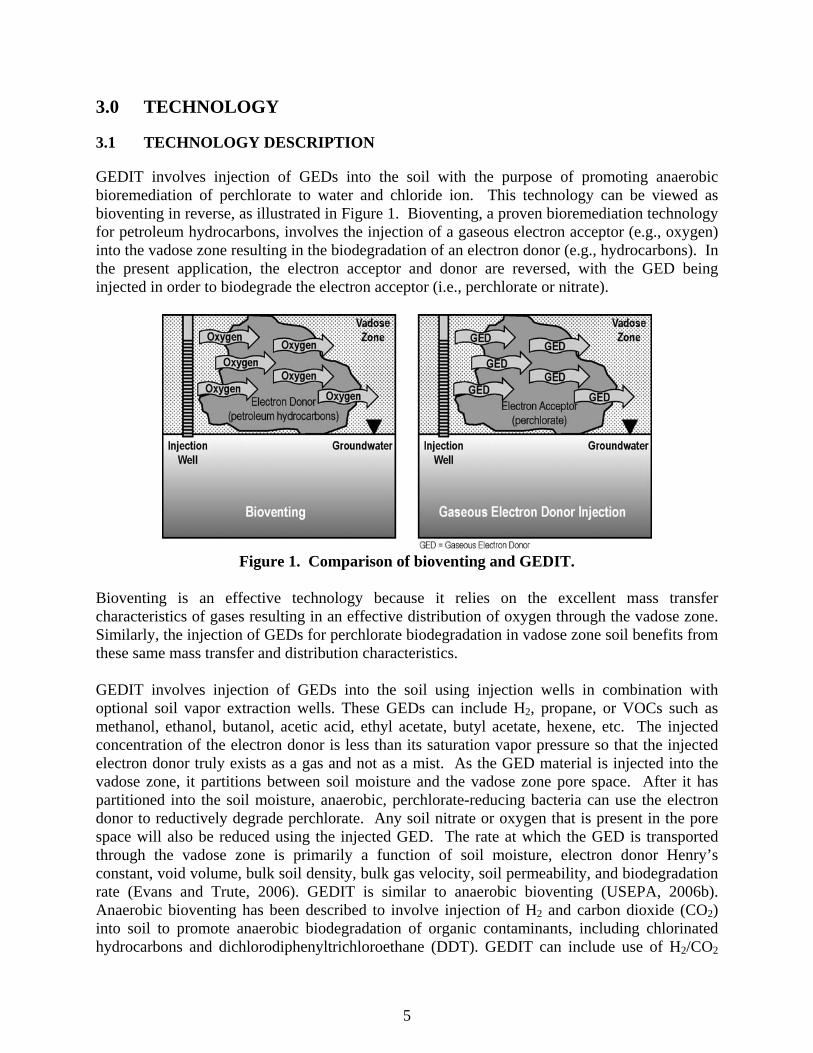
GEDIT involves injection of GEDs into the soil with the purpose of promoting anaerobic bioremediation of perchlorate to water and chloride ion. This technology can be viewed as bioventing in reverse, as illustrated in Figure 1. Bioventing, a proven bioremediation technology for petroleum hydrocarbons, involves the injection of a gaseous electron acceptor (e.g., oxygen) into the vadose zone resulting in the biodegradation of an electron donor (e.g., hydrocarbons). In the present application, the electron acceptor and donor are reversed, with the GED being injected in order to biodegrade the electron acceptor (i.e., perchlorate or nitrate).
Figure 1. Comparison of bioventing and GEDIT.
Bioventing is an effective technology because it relies on the excellent mass transfer characteristics of gases resulting in an effective distribution of oxygen through the vadose zone. Similarly, the injection of GEDs for perchlorate biodegradation in vadose zone soil benefits from these same mass transfer and distribution characteristics. GEDIT involves injection of GEDs into the soil using injection wells in combination with optional soil vapor extraction wells. These GEDs can include H2, propane, or VOCs such as methanol, ethanol, butanol, acetic acid, ethyl acetate, butyl acetate, hexene, etc. The injected concentration of the electron donor is less than its saturation vapor pressure so that the injected electron donor truly exists as a gas and not as a mist. As the GED material is injected into the vadose zone, it partitions between soil moisture and the vadose zone pore space. After it has partitioned into the soil moisture, anaerobic, perchlorate-reducing bacteria can use the electron donor to reductively degrade perchlorate. Any soil nitrate or oxygen that is present in the pore space will also be reduced using the injected GED. The rate at which the GED is transported through the vadose zone is primarily a function of soil moisture, electron donor Henry’s constant, void volume, bulk soil density, bulk gas velocity, soil permeability, and biodegradation rate (Evans and Trute, 2006). GEDIT is similar to anaerobic bioventing (USEPA, 2006b). Anaerobic bioventing has been described to involve injection of H2 and carbon dioxide (CO2) into soil to promote anaerobic biodegradation of organic contaminants, including chlorinated hydrocarbons and dichlorodiphenyltrichloroethane (DDT). GEDIT can include use of H2/CO2
6
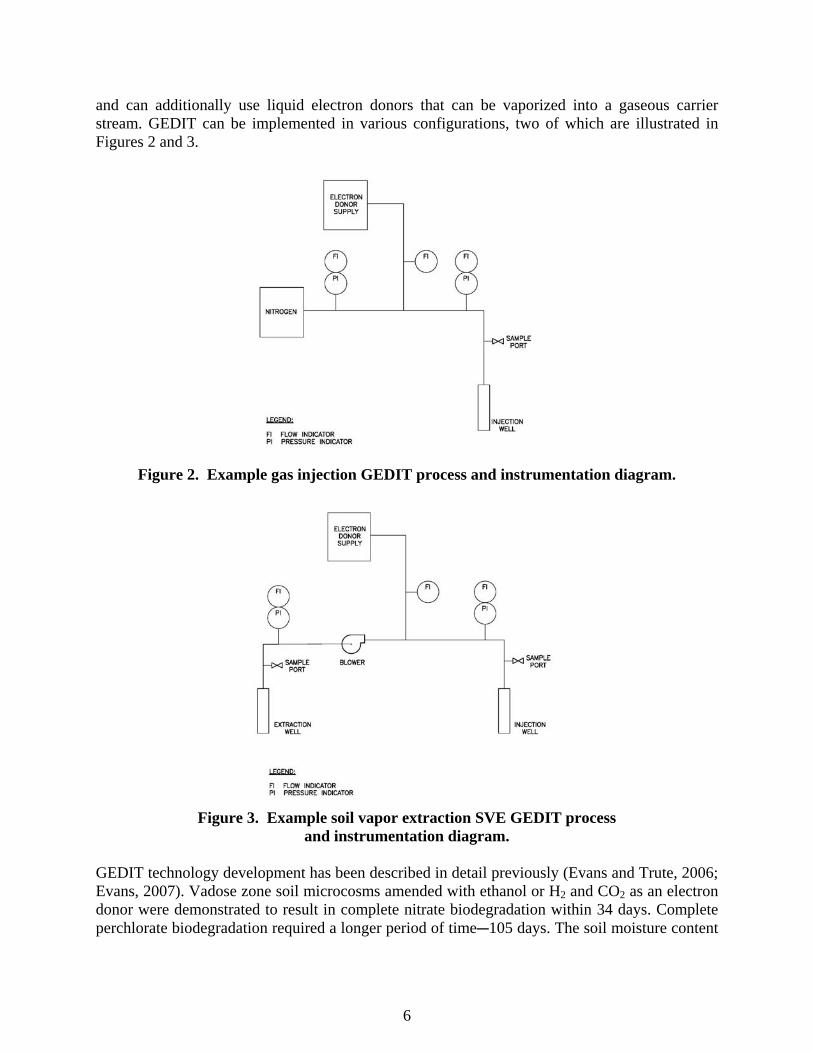
and can additionally use liquid electron donors that can be vaporized into a gaseous carrier stream. GEDIT can be implemented in various configurations, two of which are illustrated in Figures 2 and 3.
Figure 2. Example gas injection GEDIT process and instrumentation diagram.
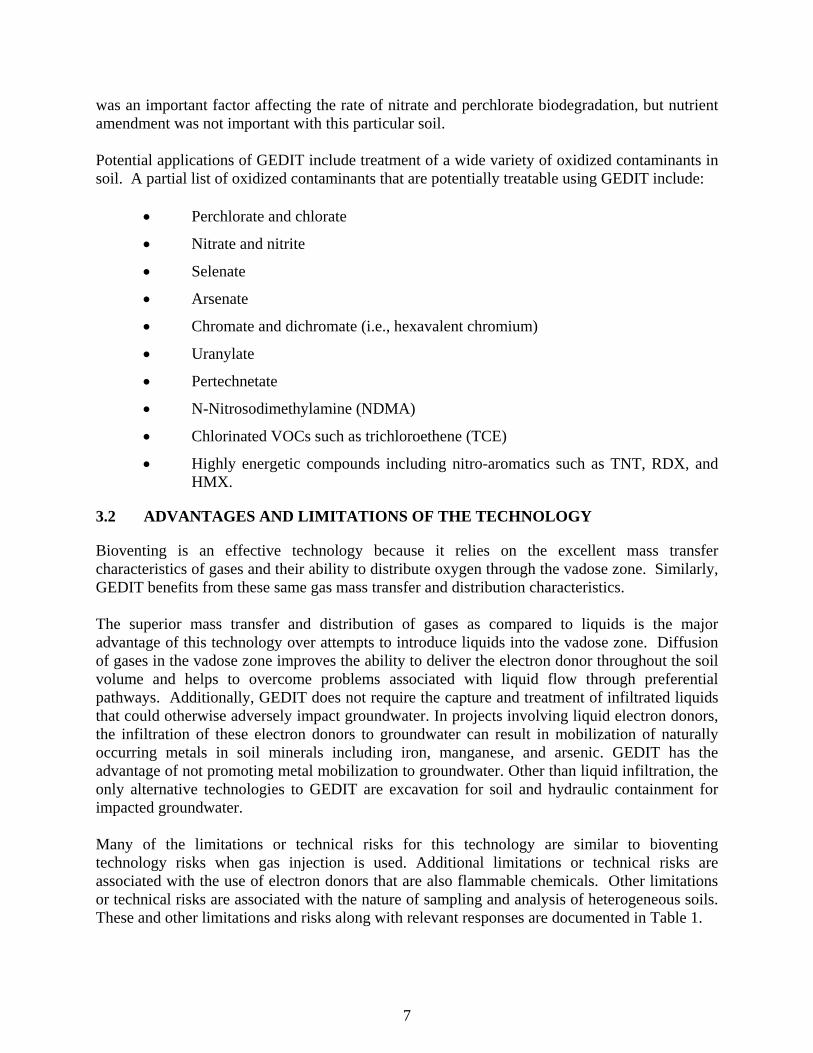
Figure 3. Example soil vapor extraction SVE GEDIT process
and instrumentation diagram. GEDIT technology development has been described in detail previously (Evans and Trute, 2006; Evans, 2007). Vadose zone soil microcosms amended with ethanol or H2 and CO2 as an electron donor were demonstrated to result in complete nitrate biodegradation within 34 days. Complete perchlorate biodegradation required a longer period of timeC105 days. The soil moisture content
7
was an important factor affecting the rate of nitrate and perchlorate biodegradation, but nutrient amendment was not important with this particular soil. Potential applications of GEDIT include treatment of a wide variety of oxidized contaminants in soil. A partial list of oxidized contaminants that are potentially treatable using GEDIT include:
Perchlorate and chlorate
Nitrate and nitrite
Selenate
Arsenate
Chromate and dichromate (i.e., hexavalent chromium)
Uranylate
Pertechnetate
N-Nitrosodimethylamine (NDMA)
Chlorinated VOCs such as trichloroethene (TCE)
Highly energetic compounds including nitro-aromatics such as TNT, RDX, and HMX.
3.2 ADVANTAGES AND LIMITATIONS OF THE TECHNOLOGY
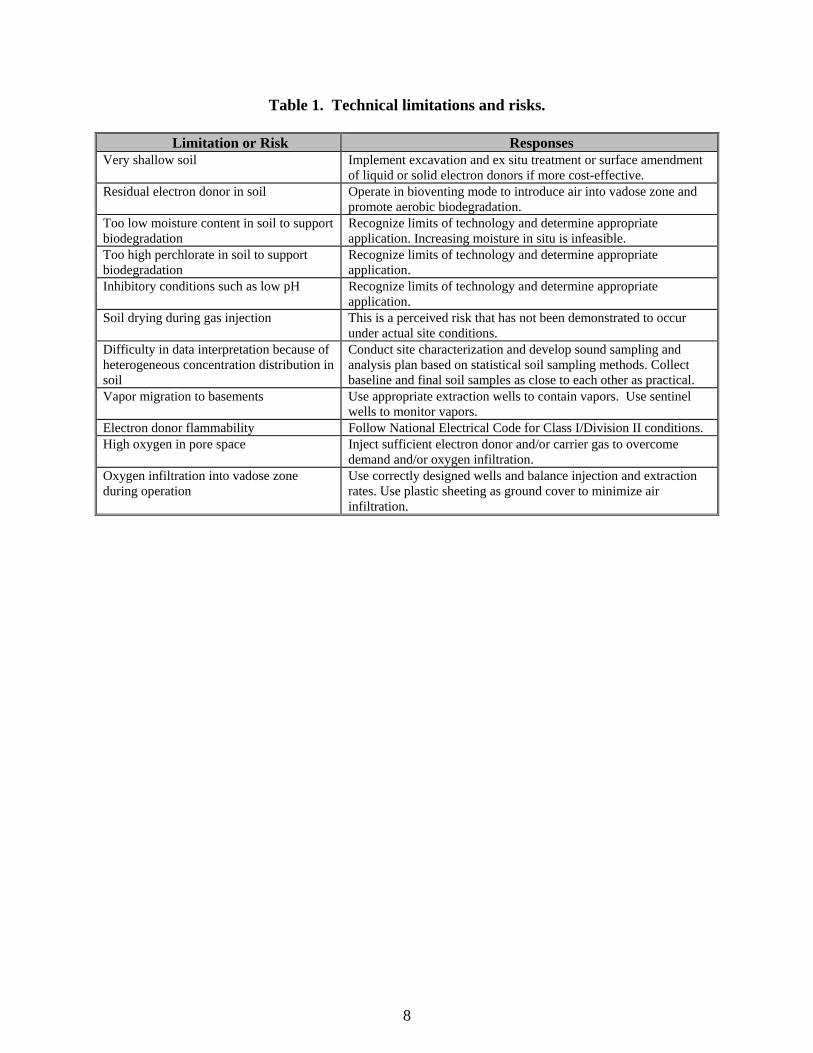
Bioventing is an effective technology because it relies on the excellent mass transfer characteristics of gases and their ability to distribute oxygen through the vadose zone. Similarly, GEDIT benefits from these same gas mass transfer and distribution characteristics. The superior mass transfer and distribution of gases as compared to liquids is the major advantage of this technology over attempts to introduce liquids into the vadose zone. Diffusion of gases in the vadose zone improves the ability to deliver the electron donor throughout the soil volume and helps to overcome problems associated with liquid flow through preferential pathways. Additionally, GEDIT does not require the capture and treatment of infiltrated liquids that could otherwise adversely impact groundwater. In projects involving liquid electron donors, the infiltration of these electron donors to groundwater can result in mobilization of naturally occurring metals in soil minerals including iron, manganese, and arsenic. GEDIT has the advantage of not promoting metal mobilization to groundwater. Other than liquid infiltration, the only alternative technologies to GEDIT are excavation for soil and hydraulic containment for impacted groundwater. Many of the limitations or technical risks for this technology are similar to bioventing technology risks when gas injection is used. Additional limitations or technical risks are associated with the use of electron donors that are also flammable chemicals. Other limitations or technical risks are associated with the nature of sampling and analysis of heterogeneous soils. These and other limitations and risks along with relevant responses are documented in Table 1.
8
Table 1. Technical limitations and risks.
Limitation or Risk Responses Very shallow soil Implement excavation and ex situ treatment or surface amendment
of liquid or solid electron donors if more cost-effective. Residual electron donor in soil Operate in bioventing mode to introduce air into vadose zone and
promote aerobic biodegradation. Too low moisture content in soil to support biodegradation
Recognize limits of technology and determine appropriate application. Increasing moisture in situ is infeasible.
Too high perchlorate in soil to support biodegradation
Recognize limits of technology and determine appropriate application.
Inhibitory conditions such as low pH Recognize limits of technology and determine appropriate application.
Soil drying during gas injection This is a perceived risk that has not been demonstrated to occur under actual site conditions.
Difficulty in data interpretation because of heterogeneous concentration distribution in soil
Conduct site characterization and develop sound sampling and analysis plan based on statistical soil sampling methods. Collect baseline and final soil samples as close to each other as practical.
Vapor migration to basements Use appropriate extraction wells to contain vapors. Use sentinel wells to monitor vapors.
Electron donor flammability Follow National Electrical Code for Class I/Division II conditions. High oxygen in pore space Inject sufficient electron donor and/or carrier gas to overcome
demand and/or oxygen infiltration. Oxygen infiltration into vadose zone during operation
Use correctly designed wells and balance injection and extraction rates. Use plastic sheeting as ground cover to minimize air infiltration.
9
4.0 PERFORMANCE OBJECTIVES
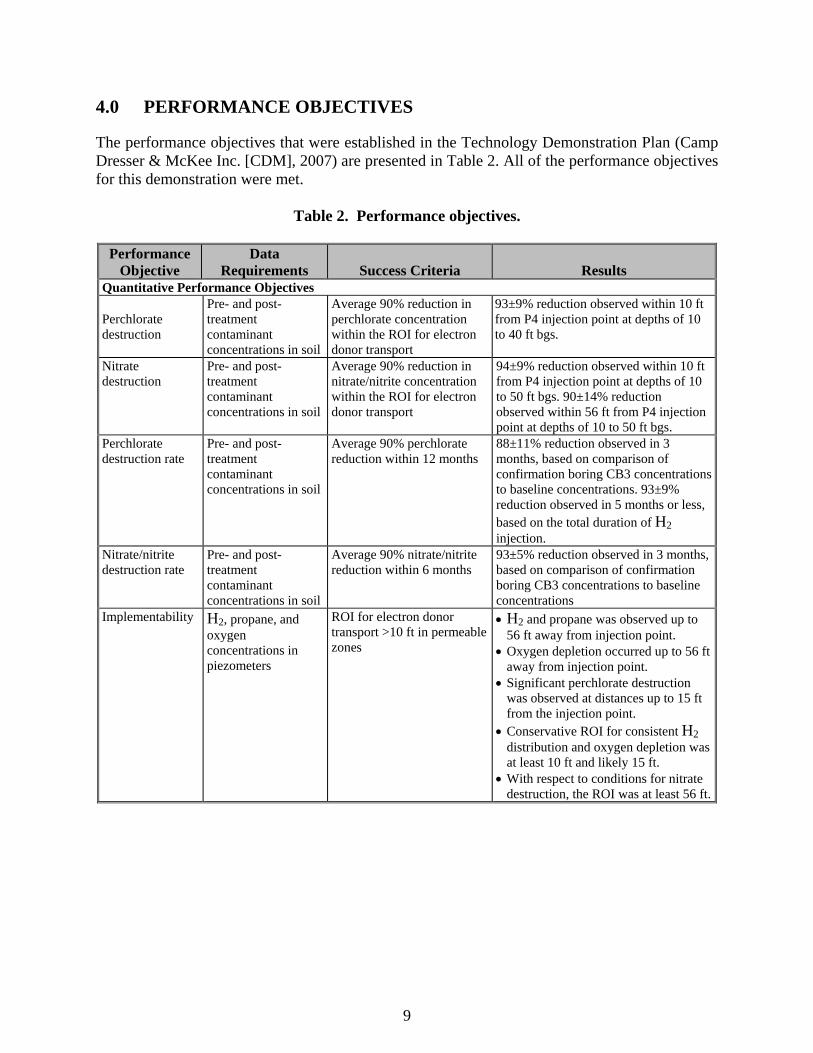
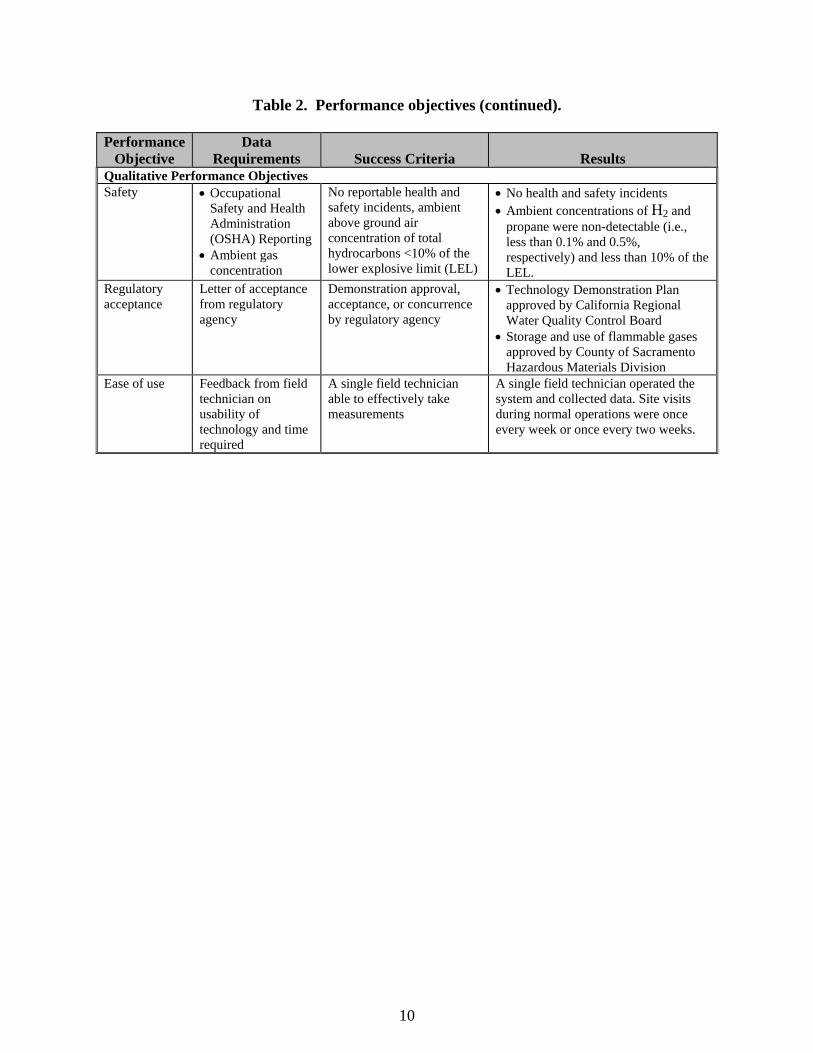
The performance objectives that were established in the Technology Demonstration Plan (Camp Dresser & McKee Inc. [CDM], 2007) are presented in Table 2. All of the performance objectives for this demonstration were met.
Table 2. Performance objectives.
Performance Objective
Data Requirements Success Criteria Results
Quantitative Performance Objectives
Perchlorate destruction
Pre- and post-treatment contaminant concentrations in soil
Average 90% reduction in perchlorate concentration within the ROI for electron donor transport
93±9% reduction observed within 10 ft from P4 injection point at depths of 10 to 40 ft bgs.
Nitrate destruction
Pre- and post-treatment contaminant concentrations in soil
Average 90% reduction in nitrate/nitrite concentration within the ROI for electron donor transport
94±9% reduction observed within 10 ft from P4 injection point at depths of 10 to 50 ft bgs. 90±14% reduction observed within 56 ft from P4 injection point at depths of 10 to 50 ft bgs.
Perchlorate destruction rate
Pre- and post-treatment contaminant concentrations in soil
Average 90% perchlorate reduction within 12 months
88±11% reduction observed in 3 months, based on comparison of confirmation boring CB3 concentrations to baseline concentrations. 93±9% reduction observed in 5 months or less, based on the total duration of H2 injection.
Nitrate/nitrite destruction rate
Pre- and post-treatment contaminant concentrations in soil
Average 90% nitrate/nitrite reduction within 6 months
93±5% reduction observed in 3 months, based on comparison of confirmation boring CB3 concentrations to baseline concentrations
Implementability H2, propane, and oxygen concentrations in piezometers
ROI for electron donor transport >10 ft in permeable zones
H2 and propane was observed up to 56 ft away from injection point.
Oxygen depletion occurred up to 56 ft away from injection point.
Significant perchlorate destruction was observed at distances up to 15 ft from the injection point.
Conservative ROI for consistent H2 distribution and oxygen depletion was at least 10 ft and likely 15 ft.
With respect to conditions for nitrate destruction, the ROI was at least 56 ft.
10
Table 2. Performance objectives (continued).
Performance Objective
Data Requirements Success Criteria Results
Qualitative Performance Objectives Safety Occupational
Safety and Health Administration (OSHA) Reporting
Ambient gas concentration
No reportable health and safety incidents, ambient above ground air concentration of total hydrocarbons <10% of the lower explosive limit (LEL)
No health and safety incidents Ambient concentrations of H2 and
propane were non-detectable (i.e., less than 0.1% and 0.5%, respectively) and less than 10% of the LEL.
Regulatory acceptance
Letter of acceptance from regulatory agency
Demonstration approval, acceptance, or concurrence by regulatory agency
Technology Demonstration Plan approved by California Regional Water Quality Control Board
Storage and use of flammable gases approved by County of Sacramento Hazardous Materials Division
Ease of use Feedback from field technician on usability of technology and time required
A single field technician able to effectively take measurements
A single field technician operated the system and collected data. Site visits during normal operations were once every week or once every two weeks.
11
5.0 SITE DESCRIPTION
The information presented in this section is based on previously published reports (Aerojet General Corporation [AGC] and Simon Hydro-Search, Inc. (Simon HSI), 1993; Aerojet & HSI GeoTrans, 2000). The Demonstration Plan (CDM, 2007) was based on data provided in these reports. Additional information and data have since been collected for the site. Therefore, the historical data should not be considered to be completely representative of current site conditions. Nevertheless, the data presented in the historical reports are considered adequate for planning and execution of this technology demonstration.
5.1 SITE LOCATION
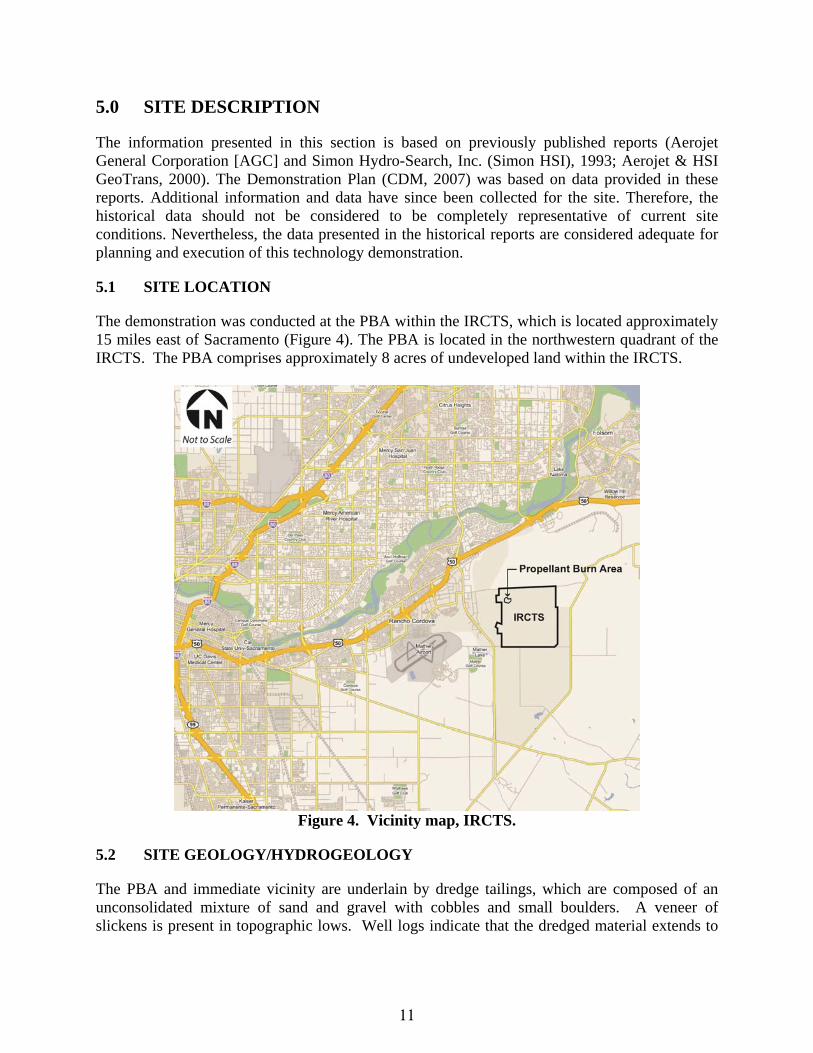
The demonstration was conducted at the PBA within the IRCTS, which is located approximately 15 miles east of Sacramento (Figure 4). The PBA is located in the northwestern quadrant of the IRCTS. The PBA comprises approximately 8 acres of undeveloped land within the IRCTS.
Figure 4. Vicinity map, IRCTS.
5.2 SITE GEOLOGY/HYDROGEOLOGY
The PBA and immediate vicinity are underlain by dredge tailings, which are composed of an unconsolidated mixture of sand and gravel with cobbles and small boulders. A veneer of slickens is present in topographic lows. Well logs indicate that the dredged material extends to
12
depths of at least 70 ft and overlies a layer of silt and clay. This layer overlies more sands and gravels. Groundwater levels fluctuate seasonally, and since 1992, have typically varied between 3 and 4 ft over a total range of approximately 8 ft. Water level elevations have decreased 25 to 35 ft since the early 1960s. This decline is probably due to several factors, including reduced recharge after the termination of dredging operations in 1962 and increased groundwater pumping for municipal use. Depth to groundwater in the PBA was about 120 to 130 ft bgs in 1998. This depth is 50 ft or more below the GEDIT injection zone for this demonstration.
5.3 CONTAMINANT DISTRIBUTION
Based on soil and groundwater investigations, the following chemicals have been detected at the PBA: perchlorate, polychlorinated dibenzodioxins/dibenzofurans (dioxins/furans), VOCs, specifically TCE, metals, basic, neutral, and acidic semi-volatiles (BNA) and polychlorinated biphenyls (PCB) (Aerojet & HSI GeoTrans, 2000). Site characterization and the baseline health and ecological risk assessment have established that only perchlorate, dioxins/furans, and TCE are chemicals of concern at the PBA. Pre-existing investigation data (Aerojet & HSI GeoTrans, 2000; Fricke and Carlton, 2005) are extensive and demonstrate that perchlorate contamination in soil is widespread within the PBA. The demonstration was conducted in the vicinity of SS-2 (later converted to well SVS-2). Perchlorate concentrations in excess of 100 mg/kg were observed near the surface and decreased with depth. The demonstration was conducted to a depth of 50 ft bgs, and perchlorate concentrations were generally in the single or double digit mg/kg in the vicinity of SS-2.
13
6.0 TEST DESIGN
6.1 CONCEPTUAL EXPERIMENTAL DESIGN
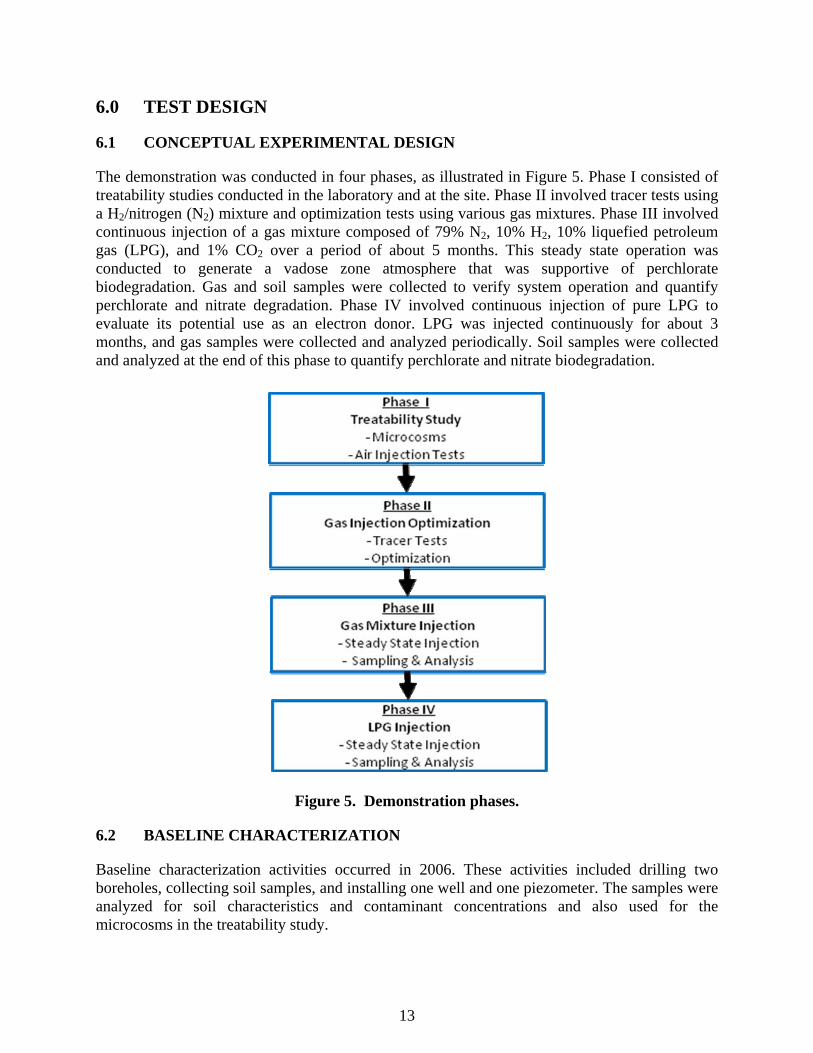
The demonstration was conducted in four phases, as illustrated in Figure 5. Phase I consisted of treatability studies conducted in the laboratory and at the site. Phase II involved tracer tests using a H2/nitrogen (N2) mixture and optimization tests using various gas mixtures. Phase III involved continuous injection of a gas mixture composed of 79% N2, 10% H2, 10% liquefied petroleum gas (LPG), and 1% CO2 over a period of about 5 months. This steady state operation was conducted to generate a vadose zone atmosphere that was supportive of perchlorate biodegradation. Gas and soil samples were collected to verify system operation and quantify perchlorate and nitrate degradation. Phase IV involved continuous injection of pure LPG to evaluate its potential use as an electron donor. LPG was injected continuously for about 3 months, and gas samples were collected and analyzed periodically. Soil samples were collected and analyzed at the end of this phase to quantify perchlorate and nitrate biodegradation.
Figure 5. Demonstration phases.
6.2 BASELINE CHARACTERIZATION
Baseline characterization activities occurred in 2006. These activities included drilling two boreholes, collecting soil samples, and installing one well and one piezometer. The samples were analyzed for soil characteristics and contaminant concentrations and also used for the microcosms in the treatability study.
14
The lithologic conditions encountered during drilling ranged from silt and clay to silty sand and clayey gravel to cobbles. These data indicate that soil is generally coarse-grained and supportive of gas injection with the exception of shallow soil (i.e., 15 ft bgs). Nitrate/nitrite concentrations were less than 5 mg-N/kg, and perchlorate ranged from non-detectable to 59 mg/kg. Perchlorate was present in greater concentrations at shallower depths and was associated with the finer grained soils. Greater concentrations of perchlorate were also associated with greater moisture contents. Moisture contents ranged from 6.5 to 34% and greater moisture contents were associated with silt and clay. Total organic carbon (TOC) concentrations were generally ND or near the limit of detection (0.2 to 0.3 mg/kg), and pH ranged from 6.9 to 8.1.
6.3 PHASE ICTREATABILITY STUDY
Sacrificial batch microcosm tests were used to rapidly assess the ability of GEDs and various moisture contents to achieve optimal perchlorate remediation in vadose zone soil taken from the site (Cai et al., 2010). The electron donor candidates tested were H2, 1-hexene, ethyl acetate, and LPG. Each electron donor was tested at two different concentrations under two different soil moisture contents that were representative of minimum and maximum site moisture contents at the site. Perchlorate reduction did not occur in low moisture (7%) microcosms after an incubation time of 125 to 187 days. Results from the high moisture content microcosm (16%) indicated that H2 was an effective electron donor for perchlorate biodegradation in site vadose zone soil, achieving complete perchlorate degradation within 35 to 42 days. LPG may have promoted complete perchlorate reduction at the high LPG dose and 1-hexene may have promoted partial perchlorate reduction at both doses; however, when compared to H2, these donors had more significant lag periods of 21 to 49 days, respectively. Additionally, the observation of perchlorate reduction in the negative control does not allow definitive conclusions regarding the effects of these electron donors on perchlorate reduction. An air injection test was conducted at the PBA site using the injection well CDM-INJ1 and piezometer CDM-P1 in combination with the two existing wells at the site (SVS1A and SVS2), as shown in Figure 6. Minimal pressure was observed at the injection well (5 inches water column or less) and a positive effect was observed from air injection on the piezometers located up to 84 ft from the injection well. The average pneumatic permeability (k) based on these data was calculated to be 5.6×10⁻⁴±0.9×10⁻⁴ cm2 at 120 ft above mean sea level (amsl). This permeability is high and typically associated with unconsolidated gravels. Because of this high permeability, the radius of pneumatic influence at the maximum flow rate of 420 cubic feet per minute (cfm) was determined to be at least 84 ft. Pneumatic effects were observed at a distance of 34 ft at the lowest flow rate testedC21 cfm. Pneumatic effects were observed at elevations down to about 50 ft bgs (i.e., 120 ft amsl).
15
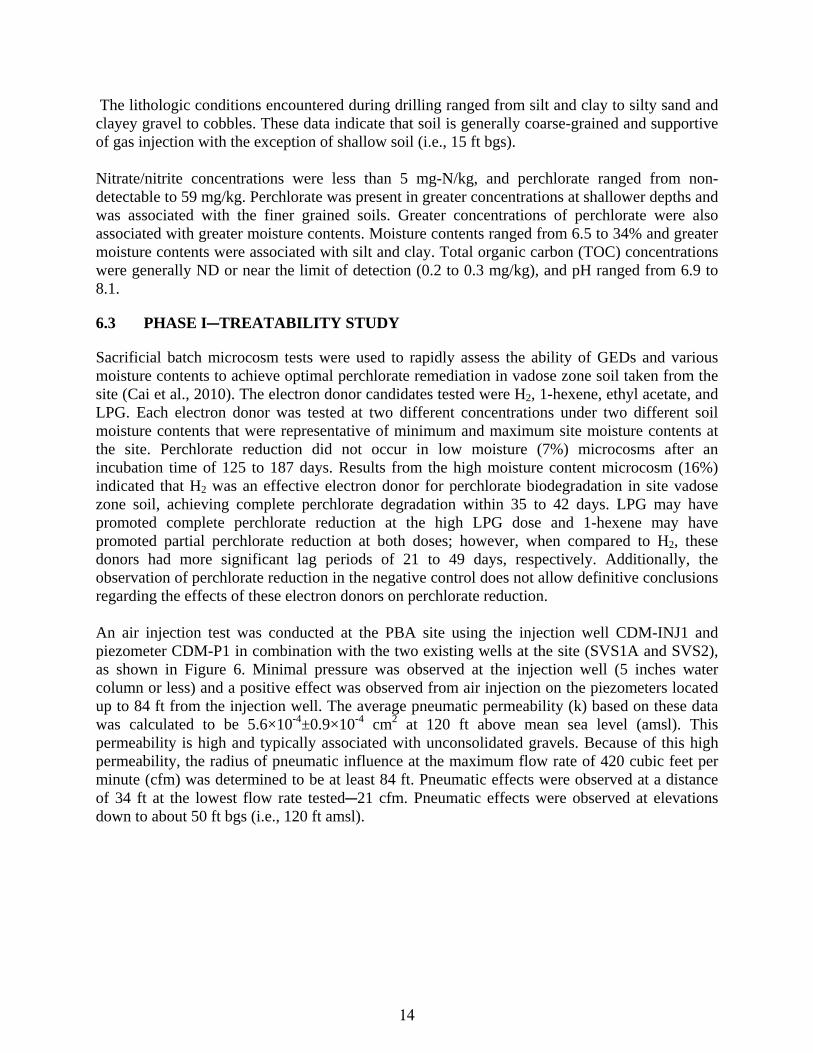
Figure 6. Piezometer and well locations.
6.4 FIELD TESTING
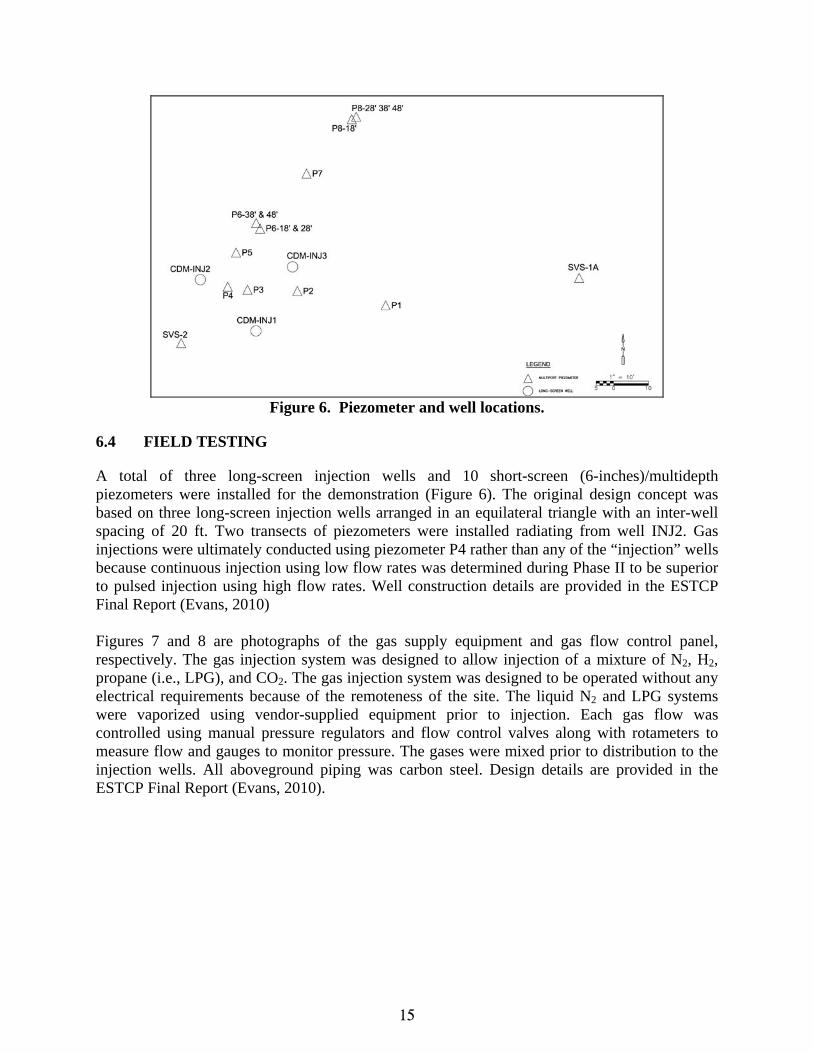
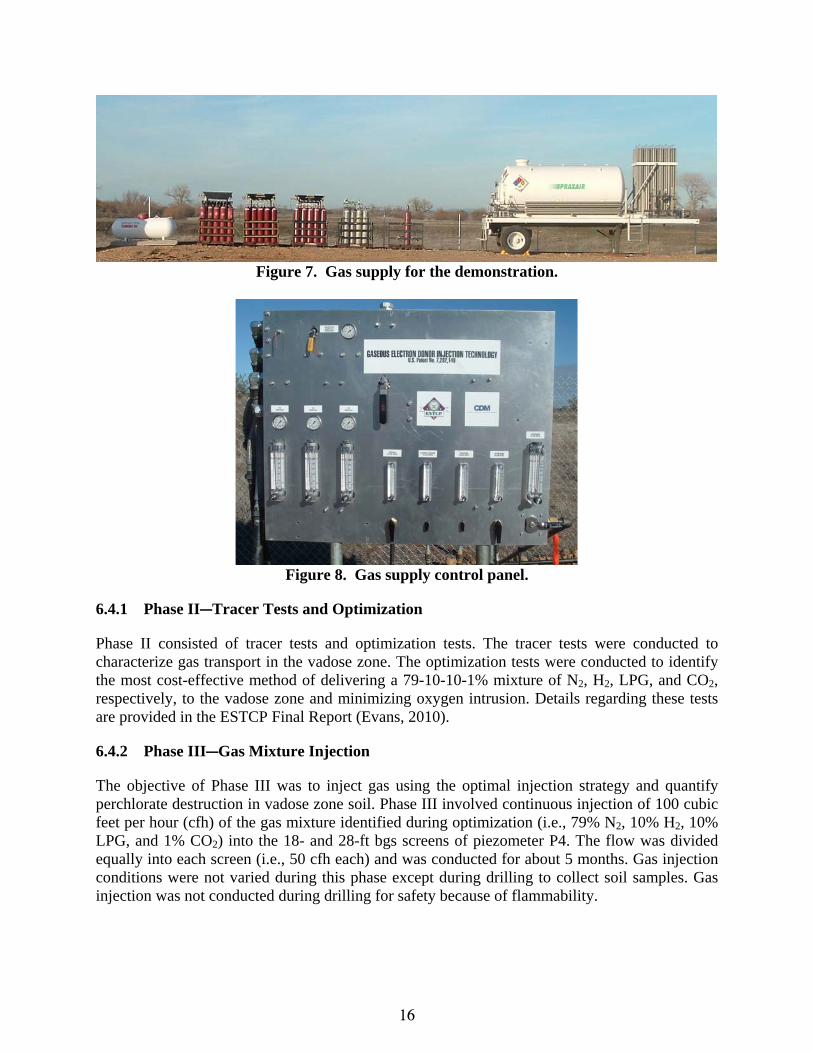
A total of three long-screen injection wells and 10 short-screen (6-inches)/multidepth piezometers were installed for the demonstration (Figure 6). The original design concept was based on three long-screen injection wells arranged in an equilateral triangle with an inter-well spacing of 20 ft. Two transects of piezometers were installed radiating from well INJ2. Gas injections were ultimately conducted using piezometer P4 rather than any of the “injection” wells because continuous injection using low flow rates was determined during Phase II to be superior to pulsed injection using high flow rates. Well construction details are provided in the ESTCP Final Report (Evans, 2010) Figures 7 and 8 are photographs of the gas supply equipment and gas flow control panel, respectively. The gas injection system was designed to allow injection of a mixture of N2, H2, propane (i.e., LPG), and CO2. The gas injection system was designed to be operated without any electrical requirements because of the remoteness of the site. The liquid N2 and LPG systems were vaporized using vendor-supplied equipment prior to injection. Each gas flow was controlled using manual pressure regulators and flow control valves along with rotameters to measure flow and gauges to monitor pressure. The gases were mixed prior to distribution to the injection wells. All aboveground piping was carbon steel. Design details are provided in the ESTCP Final Report (Evans, 2010).
16
Figure 7. Gas supply for the demonstration.
Figure 8. Gas supply control panel.
6.4.1 Phase IICTracer Tests and Optimization
Phase II consisted of tracer tests and optimization tests. The tracer tests were conducted to characterize gas transport in the vadose zone. The optimization tests were conducted to identify the most cost-effective method of delivering a 79-10-10-1% mixture of N2, H2, LPG, and CO2, respectively, to the vadose zone and minimizing oxygen intrusion. Details regarding these tests are provided in the ESTCP Final Report (Evans, 2010).
6.4.2 Phase IIICGas Mixture Injection
The objective of Phase III was to inject gas using the optimal injection strategy and quantify perchlorate destruction in vadose zone soil. Phase III involved continuous injection of 100 cubic feet per hour (cfh) of the gas mixture identified during optimization (i.e., 79% N2, 10% H2, 10% LPG, and 1% CO2) into the 18- and 28-ft bgs screens of piezometer P4. The flow was divided equally into each screen (i.e., 50 cfh each) and was conducted for about 5 months. Gas injection conditions were not varied during this phase except during drilling to collect soil samples. Gas injection was not conducted during drilling for safety because of flammability.
17
6.4.3 Phase IVCLPG Injection
Phase IV involved injection of pure LPG instead of the gas mixture. Use of pure LPG had the potential to be more cost effective than the gas mixture if it was actually capable of promoting perchlorate biodegradation.1 Injection of LPG was conducted at a flow rate of 100 cfh divided evenly across the 18- and 28-ft bgs screens of piezometer P4 for about 3 months.
6.4.4 Schedule
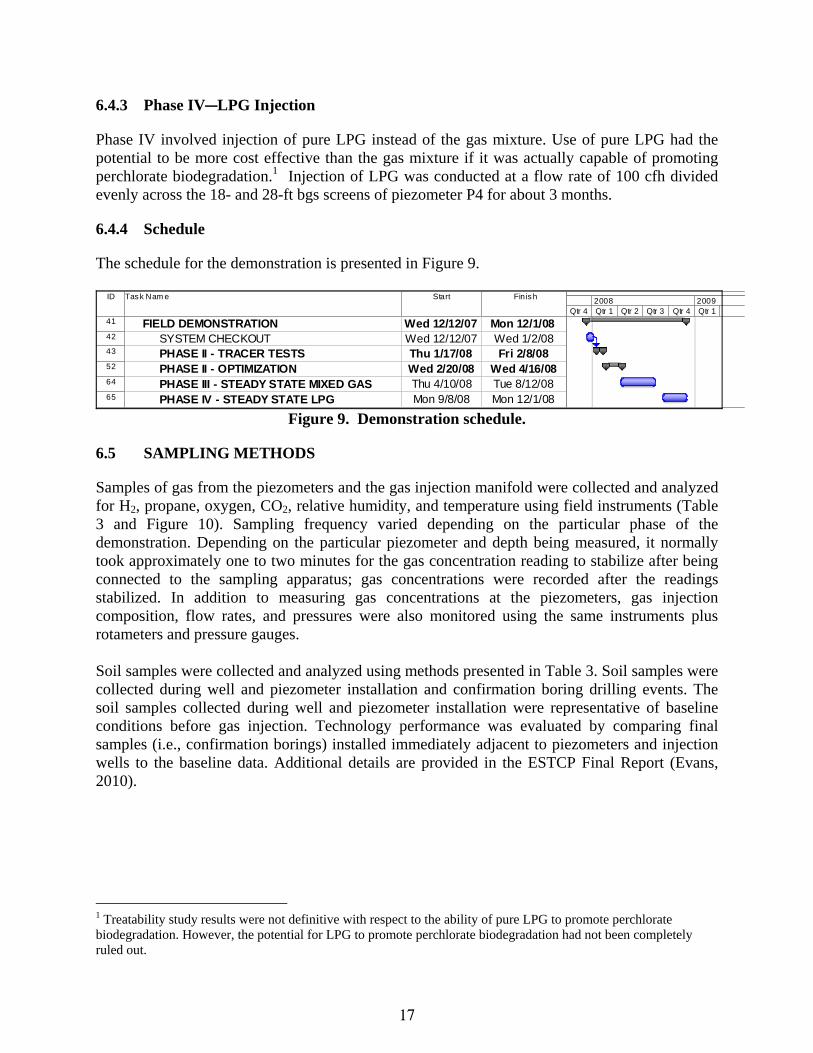
The schedule for the demonstration is presented in Figure 9.
ID Task Nam e Start Finish
41 FIELD DEMONSTRATION Wed 12/12/07 Mon 12/1/0842 SYSTEM CHECKOUT Wed 12/12/07 Wed 1/2/0843 PHASE II - TRACER TESTS Thu 1/17/08 Fri 2/8/0852 PHASE II - OPTIMIZATION Wed 2/20/08 Wed 4/16/0864 PHASE III - STEADY STATE MIXED GAS Thu 4/10/08 Tue 8/12/0865 PHASE IV - STEADY STATE LPG Mon 9/8/08 Mon 12/1/08
Qtr 4 Qtr 1 Qtr 2 Qtr 3 Qtr 4 Qtr 12008 2009
Figure 9. Demonstration schedule.
6.5 SAMPLING METHODS
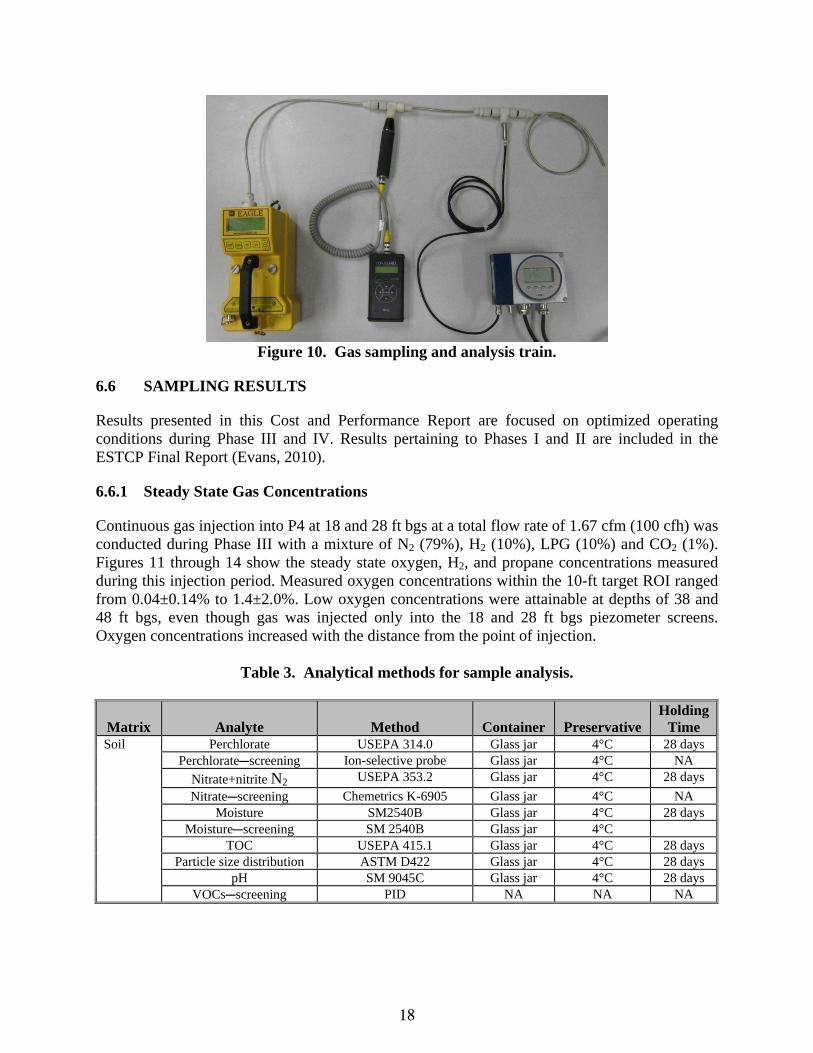
Samples of gas from the piezometers and the gas injection manifold were collected and analyzed for H2, propane, oxygen, CO2, relative humidity, and temperature using field instruments (Table 3 and Figure 10). Sampling frequency varied depending on the particular phase of the demonstration. Depending on the particular piezometer and depth being measured, it normally took approximately one to two minutes for the gas concentration reading to stabilize after being connected to the sampling apparatus; gas concentrations were recorded after the readings stabilized. In addition to measuring gas concentrations at the piezometers, gas injection composition, flow rates, and pressures were also monitored using the same instruments plus rotameters and pressure gauges. Soil samples were collected and analyzed using methods presented in Table 3. Soil samples were collected during well and piezometer installation and confirmation boring drilling events. The soil samples collected during well and piezometer installation were representative of baseline conditions before gas injection. Technology performance was evaluated by comparing final samples (i.e., confirmation borings) installed immediately adjacent to piezometers and injection wells to the baseline data. Additional details are provided in the ESTCP Final Report (Evans, 2010).
1 Treatability study results were not definitive with respect to the ability of pure LPG to promote perchlorate biodegradation. However, the potential for LPG to promote perchlorate biodegradation had not been completely ruled out.
18
Figure 10. Gas sampling and analysis train.
6.6 SAMPLING RESULTS
Results presented in this Cost and Performance Report are focused on optimized operating conditions during Phase III and IV. Results pertaining to Phases I and II are included in the ESTCP Final Report (Evans, 2010).
6.6.1 Steady State Gas Concentrations
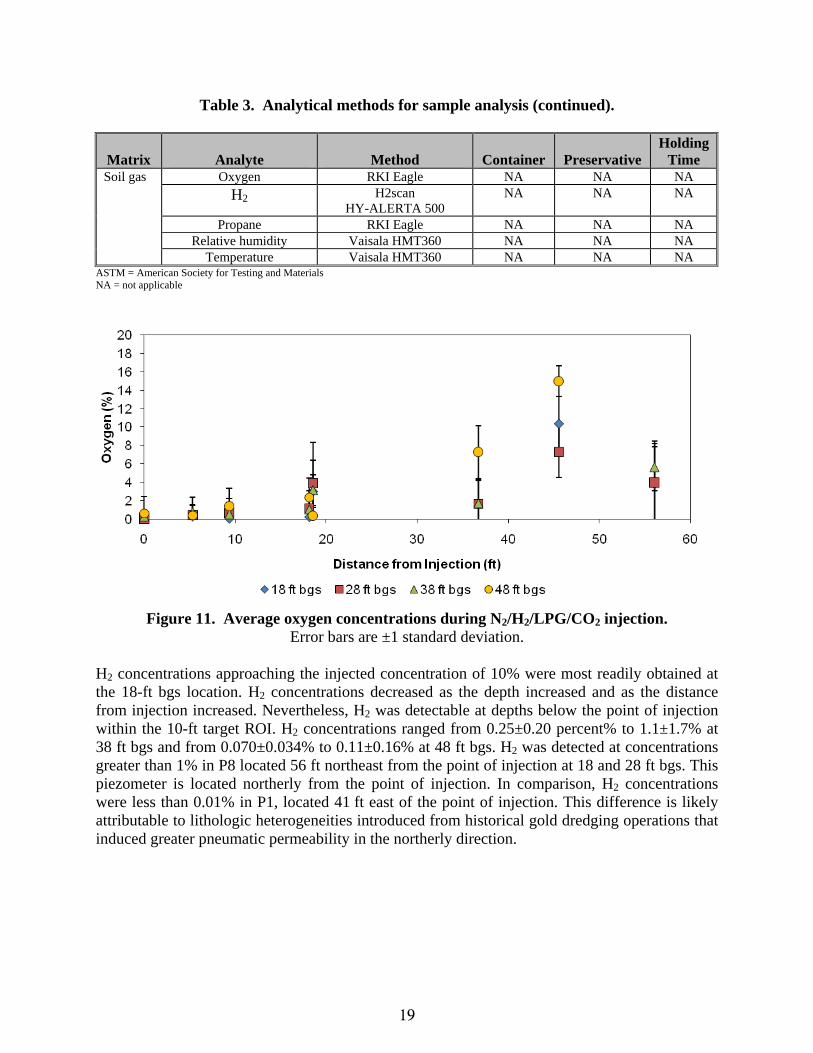
Continuous gas injection into P4 at 18 and 28 ft bgs at a total flow rate of 1.67 cfm (100 cfh) was conducted during Phase III with a mixture of N2 (79%), H2 (10%), LPG (10%) and CO2 (1%). Figures 11 through 14 show the steady state oxygen, H2, and propane concentrations measured during this injection period. Measured oxygen concentrations within the 10-ft target ROI ranged from 0.04±0.14% to 1.4±2.0%. Low oxygen concentrations were attainable at depths of 38 and 48 ft bgs, even though gas was injected only into the 18 and 28 ft bgs piezometer screens. Oxygen concentrations increased with the distance from the point of injection.
Table 3. Analytical methods for sample analysis.
Matrix Analyte Method Container Preservative Holding
Time Soil Perchlorate USEPA 314.0 Glass jar 4°C 28 days
PerchlorateCscreening Ion-selective probe Glass jar 4°C NA
Nitrate+nitrite N2 USEPA 353.2 Glass jar 4°C 28 days
NitrateCscreening Chemetrics K-6905 Glass jar 4°C NA Moisture SM2540B Glass jar 4°C 28 days
MoistureCscreening SM 2540B Glass jar 4°C TOC USEPA 415.1 Glass jar 4°C 28 days
Particle size distribution ASTM D422 Glass jar 4°C 28 days pH SM 9045C Glass jar 4°C 28 days
VOCsCscreening PID NA NA NA
19
Table 3. Analytical methods for sample analysis (continued).
Matrix Analyte Method Container Preservative Holding
Time Soil gas Oxygen RKI Eagle NA NA NA
H2 H2scan HY-ALERTA 500
NA NA NA
Propane RKI Eagle NA NA NA Relative humidity Vaisala HMT360 NA NA NA
Temperature Vaisala HMT360 NA NA NA ASTM = American Society for Testing and Materials NA = not applicable
Figure 11. Average oxygen concentrations during N2/H2/LPG/CO2 injection.
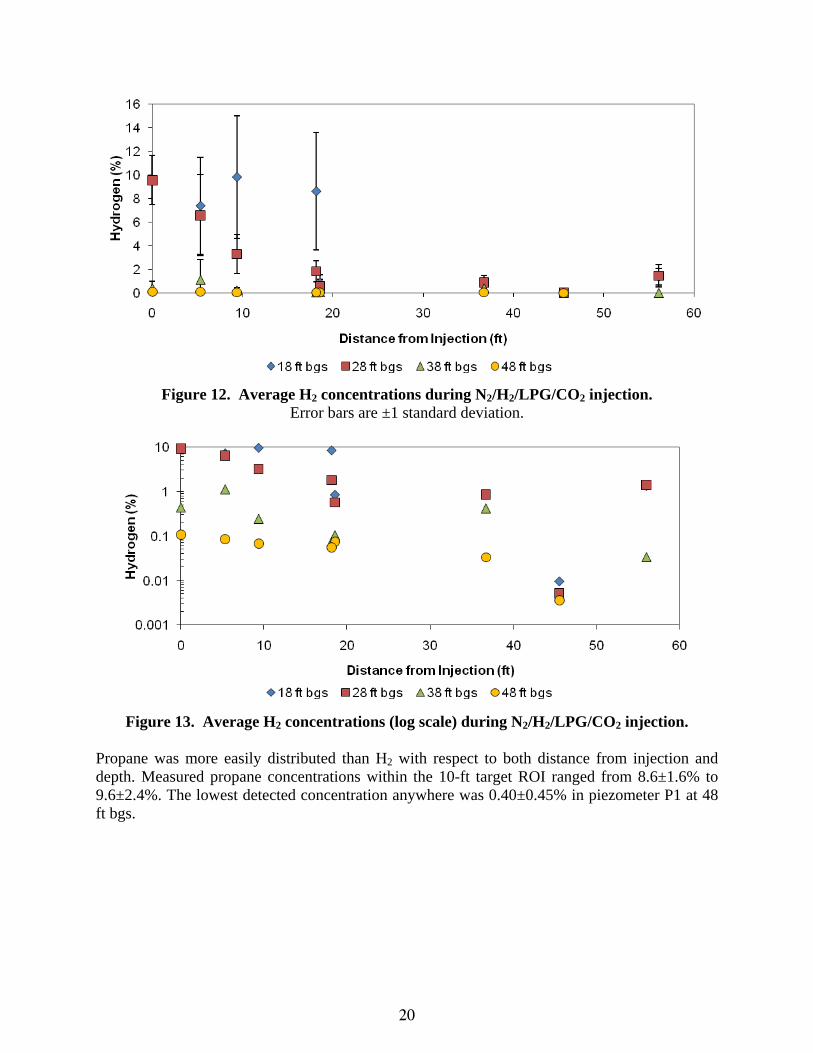
Error bars are ±1 standard deviation. H2 concentrations approaching the injected concentration of 10% were most readily obtained at the 18-ft bgs location. H2 concentrations decreased as the depth increased and as the distance from injection increased. Nevertheless, H2 was detectable at depths below the point of injection within the 10-ft target ROI. H2 concentrations ranged from 0.25±0.20 percent% to 1.1±1.7% at 38 ft bgs and from 0.070±0.034% to 0.11±0.16% at 48 ft bgs. H2 was detected at concentrations greater than 1% in P8 located 56 ft northeast from the point of injection at 18 and 28 ft bgs. This piezometer is located northerly from the point of injection. In comparison, H2 concentrations were less than 0.01% in P1, located 41 ft east of the point of injection. This difference is likely attributable to lithologic heterogeneities introduced from historical gold dredging operations that induced greater pneumatic permeability in the northerly direction.
20
Figure 12. Average H2 concentrations during N2/H2/LPG/CO2 injection.
Error bars are ±1 standard deviation.
Figure 13. Average H2 concentrations (log scale) during N2/H2/LPG/CO2 injection.
Propane was more easily distributed than H2 with respect to both distance from injection and depth. Measured propane concentrations within the 10-ft target ROI ranged from 8.6±1.6% to 9.6±2.4%. The lowest detected concentration anywhere was 0.40±0.45% in piezometer P1 at 48 ft bgs.
21
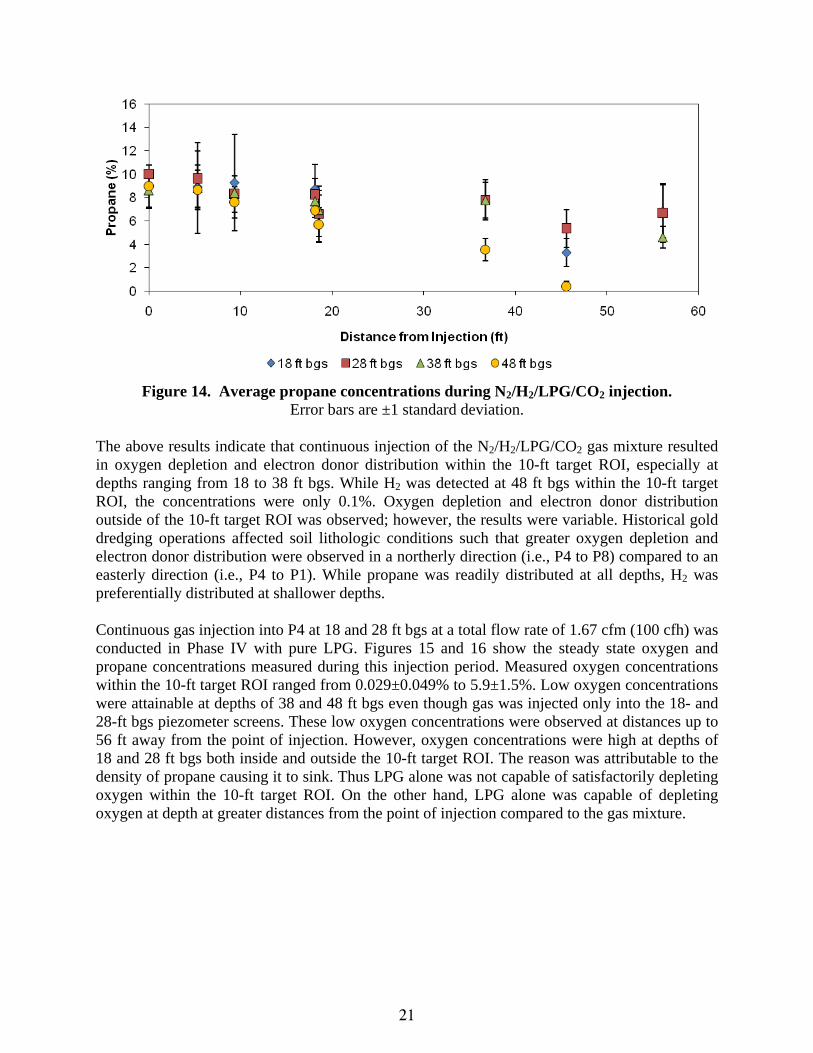
Figure 14. Average propane concentrations during N2/H2/LPG/CO2 injection.
Error bars are ±1 standard deviation. The above results indicate that continuous injection of the N2/H2/LPG/CO2 gas mixture resulted in oxygen depletion and electron donor distribution within the 10-ft target ROI, especially at depths ranging from 18 to 38 ft bgs. While H2 was detected at 48 ft bgs within the 10-ft target ROI, the concentrations were only 0.1%. Oxygen depletion and electron donor distribution outside of the 10-ft target ROI was observed; however, the results were variable. Historical gold dredging operations affected soil lithologic conditions such that greater oxygen depletion and electron donor distribution were observed in a northerly direction (i.e., P4 to P8) compared to an easterly direction (i.e., P4 to P1). While propane was readily distributed at all depths, H2 was preferentially distributed at shallower depths. Continuous gas injection into P4 at 18 and 28 ft bgs at a total flow rate of 1.67 cfm (100 cfh) was conducted in Phase IV with pure LPG. Figures 15 and 16 show the steady state oxygen and propane concentrations measured during this injection period. Measured oxygen concentrations within the 10-ft target ROI ranged from 0.029±0.049% to 5.9±1.5%. Low oxygen concentrations were attainable at depths of 38 and 48 ft bgs even though gas was injected only into the 18- and 28-ft bgs piezometer screens. These low oxygen concentrations were observed at distances up to 56 ft away from the point of injection. However, oxygen concentrations were high at depths of 18 and 28 ft bgs both inside and outside the 10-ft target ROI. The reason was attributable to the density of propane causing it to sink. Thus LPG alone was not capable of satisfactorily depleting oxygen within the 10-ft target ROI. On the other hand, LPG alone was capable of depleting oxygen at depth at greater distances from the point of injection compared to the gas mixture.

22
Figure 15. Average oxygen concentrations during LPG injection.
Error bars are ±1 standard deviation.
Figure 16. Average propane concentrations during LPG injection. Maximum Propane Concentration Measurable by Instrument was 30%.
Error bars are ±1 standard deviation. Propane was easily distributed at significant distances from the point of injection at the 28-, 38-, and 48-ft bgs depths. The gas analyzer was not capable of reporting propane concentrations greater than 30%; thus concentrations reported with values of 30% were likely greater than 30%. Distribution of propane at 18 ft bgs was relatively poor; this result is consistent with the observed oxygen concentration profiles. However, propane distribution at 28 ft bgs was relatively good, which makes the elevated oxygen concentrations surprising. The above results indicate that continuous injection of pure LPG was less effective than the gas mixture with respect to oxygen depletion and electron donor distribution. However, injection of
23
pure LPG did have a distinct advantage with respect to oxygen depletion and electron donor distribution at depths greater than the point of injection.
6.6.2 Perchlorate and Nitrate Concentrations in Soil
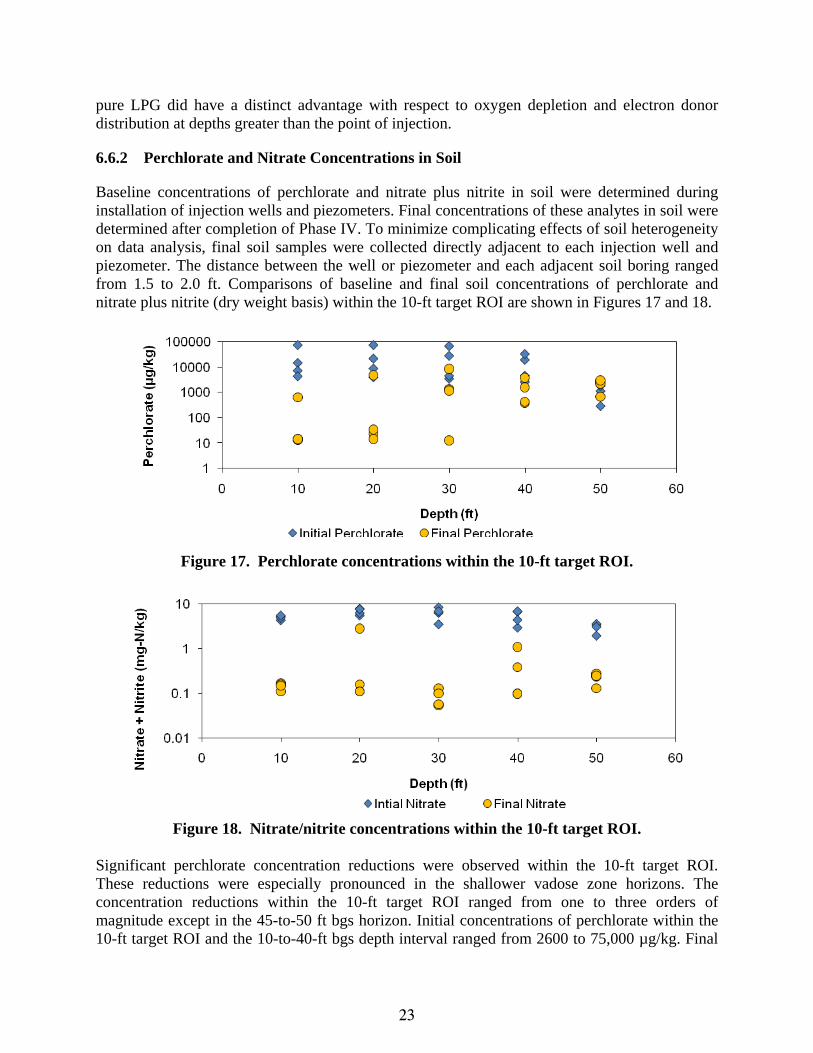
Baseline concentrations of perchlorate and nitrate plus nitrite in soil were determined during installation of injection wells and piezometers. Final concentrations of these analytes in soil were determined after completion of Phase IV. To minimize complicating effects of soil heterogeneity on data analysis, final soil samples were collected directly adjacent to each injection well and piezometer. The distance between the well or piezometer and each adjacent soil boring ranged from 1.5 to 2.0 ft. Comparisons of baseline and final soil concentrations of perchlorate and nitrate plus nitrite (dry weight basis) within the 10-ft target ROI are shown in Figures 17 and 18.
Figure 17. Perchlorate concentrations within the 10-ft target ROI.
Figure 18. Nitrate/nitrite concentrations within the 10-ft target ROI.
Significant perchlorate concentration reductions were observed within the 10-ft target ROI. These reductions were especially pronounced in the shallower vadose zone horizons. The concentration reductions within the 10-ft target ROI ranged from one to three orders of magnitude except in the 45-to-50 ft bgs horizon. Initial concentrations of perchlorate within the 10-ft target ROI and the 10-to-40-ft bgs depth interval ranged from 2600 to 75,000 µg/kg. Final
24
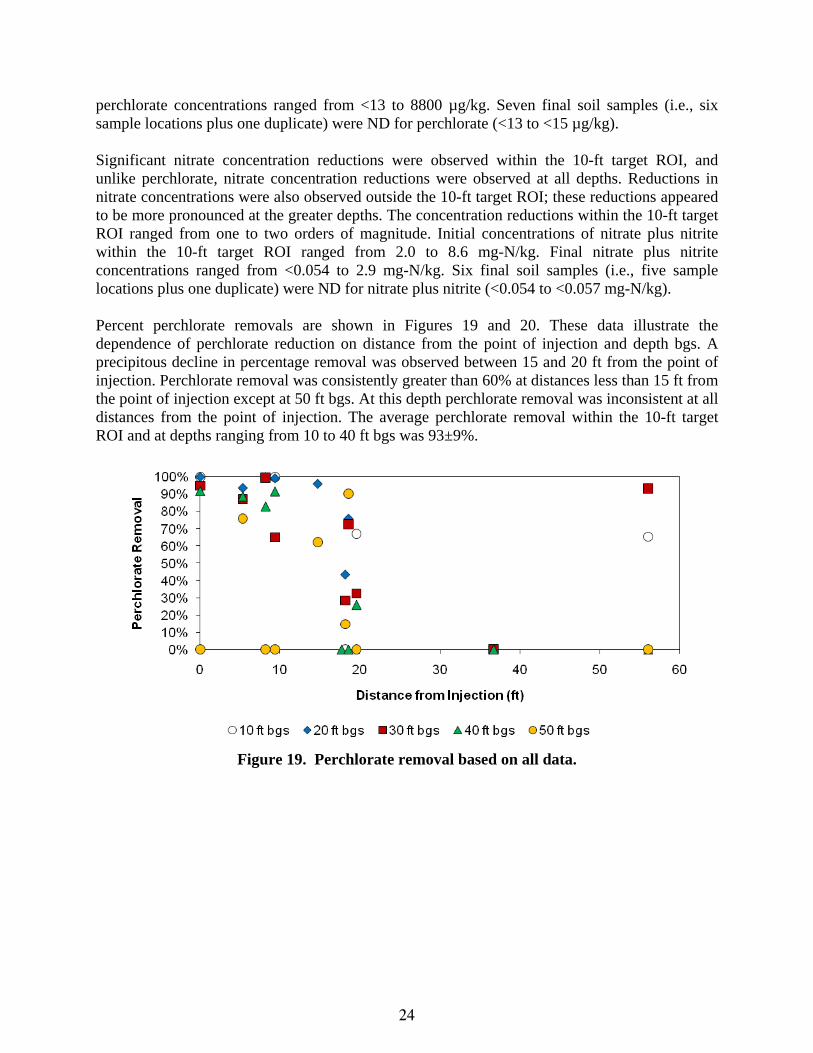
perchlorate concentrations ranged from <13 to 8800 µg/kg. Seven final soil samples (i.e., six sample locations plus one duplicate) were ND for perchlorate (<13 to <15 µg/kg). Significant nitrate concentration reductions were observed within the 10-ft target ROI, and unlike perchlorate, nitrate concentration reductions were observed at all depths. Reductions in nitrate concentrations were also observed outside the 10-ft target ROI; these reductions appeared to be more pronounced at the greater depths. The concentration reductions within the 10-ft target ROI ranged from one to two orders of magnitude. Initial concentrations of nitrate plus nitrite within the 10-ft target ROI ranged from 2.0 to 8.6 mg-N/kg. Final nitrate plus nitrite concentrations ranged from <0.054 to 2.9 mg-N/kg. Six final soil samples (i.e., five sample locations plus one duplicate) were ND for nitrate plus nitrite (<0.054 to <0.057 mg-N/kg). Percent perchlorate removals are shown in Figures 19 and 20. These data illustrate the dependence of perchlorate reduction on distance from the point of injection and depth bgs. A precipitous decline in percentage removal was observed between 15 and 20 ft from the point of injection. Perchlorate removal was consistently greater than 60% at distances less than 15 ft from the point of injection except at 50 ft bgs. At this depth perchlorate removal was inconsistent at all distances from the point of injection. The average perchlorate removal within the 10-ft target ROI and at depths ranging from 10 to 40 ft bgs was 93±9%.
Figure 19. Perchlorate removal based on all data.
25
Figure 20. Average perchlorate removal within the 10-ft ROI target.
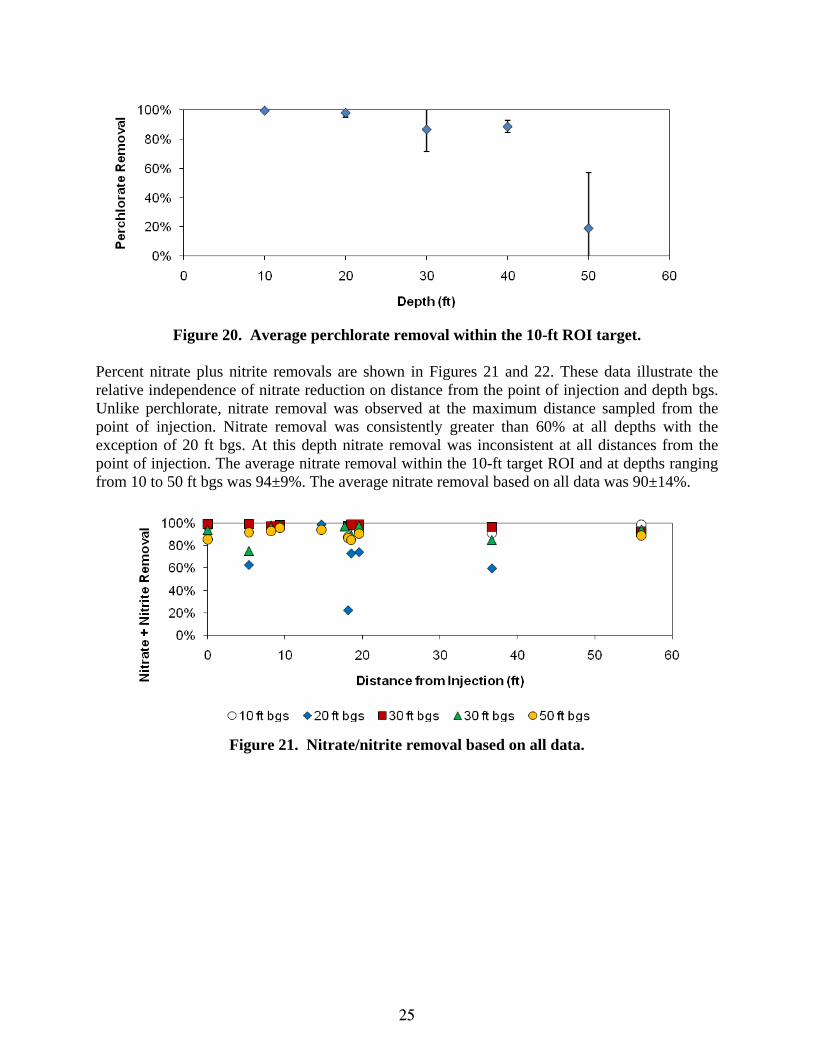
Percent nitrate plus nitrite removals are shown in Figures 21 and 22. These data illustrate the relative independence of nitrate reduction on distance from the point of injection and depth bgs. Unlike perchlorate, nitrate removal was observed at the maximum distance sampled from the point of injection. Nitrate removal was consistently greater than 60% at all depths with the exception of 20 ft bgs. At this depth nitrate removal was inconsistent at all distances from the point of injection. The average nitrate removal within the 10-ft target ROI and at depths ranging from 10 to 50 ft bgs was 94±9%. The average nitrate removal based on all data was 90±14%.
Figure 21. Nitrate/nitrite removal based on all data.
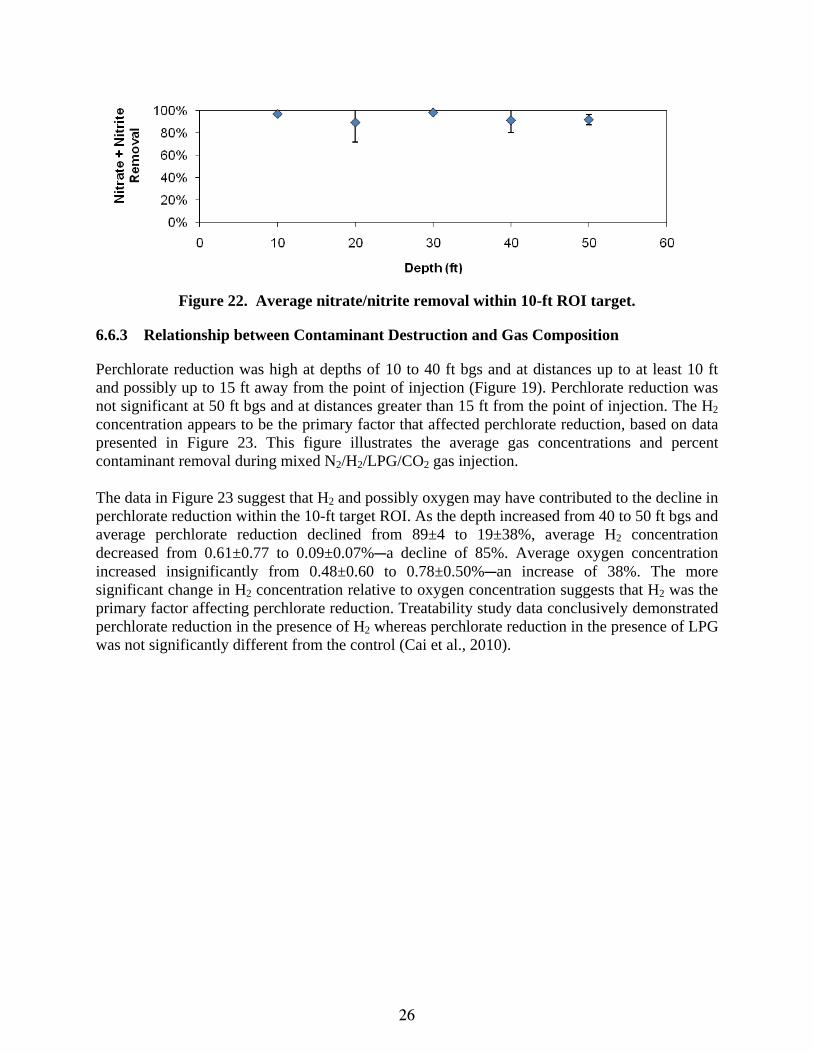
26
Figure 22. Average nitrate/nitrite removal within 10-ft ROI target.
6.6.3 Relationship between Contaminant Destruction and Gas Composition
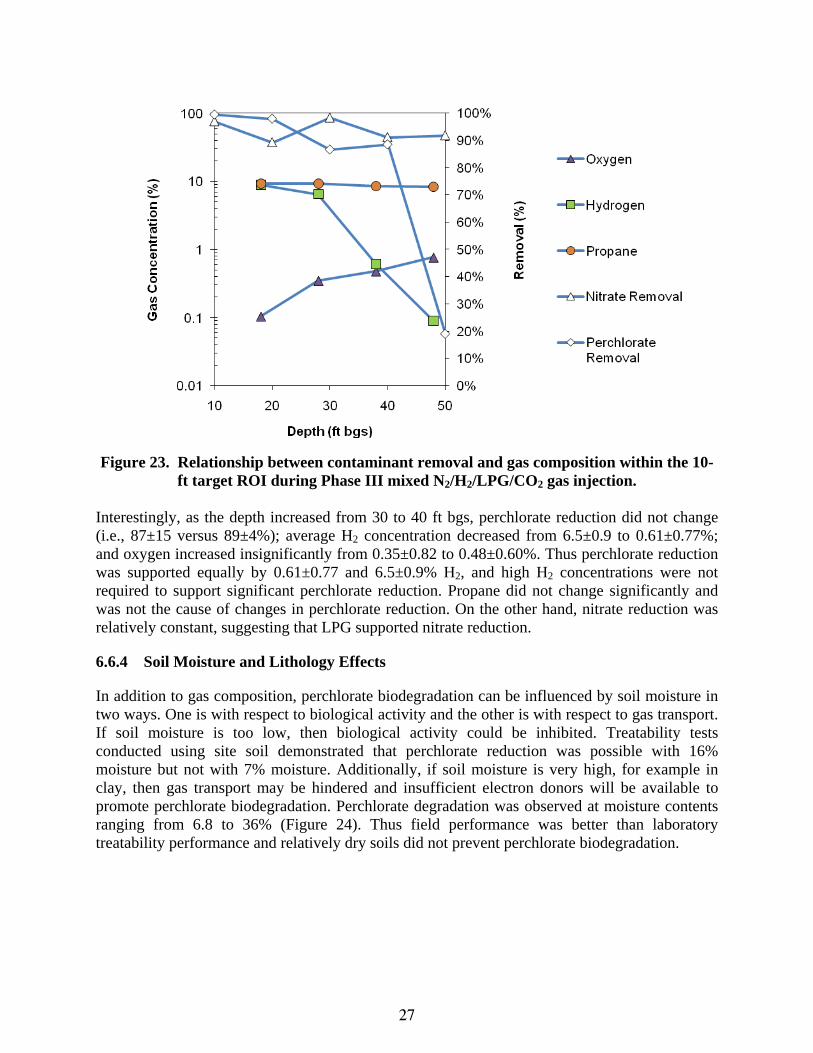
Perchlorate reduction was high at depths of 10 to 40 ft bgs and at distances up to at least 10 ft and possibly up to 15 ft away from the point of injection (Figure 19). Perchlorate reduction was not significant at 50 ft bgs and at distances greater than 15 ft from the point of injection. The H2 concentration appears to be the primary factor that affected perchlorate reduction, based on data presented in Figure 23. This figure illustrates the average gas concentrations and percent contaminant removal during mixed N2/H2/LPG/CO2 gas injection. The data in Figure 23 suggest that H2 and possibly oxygen may have contributed to the decline in perchlorate reduction within the 10-ft target ROI. As the depth increased from 40 to 50 ft bgs and average perchlorate reduction declined from 89±4 to 19±38%, average H2 concentration decreased from 0.61±0.77 to 0.09±0.07%Ca decline of 85%. Average oxygen concentration increased insignificantly from 0.48±0.60 to 0.78±0.50%Can increase of 38%. The more significant change in H2 concentration relative to oxygen concentration suggests that H2 was the primary factor affecting perchlorate reduction. Treatability study data conclusively demonstrated perchlorate reduction in the presence of H2 whereas perchlorate reduction in the presence of LPG was not significantly different from the control (Cai et al., 2010).
27
Figure 23. Relationship between contaminant removal and gas composition within the 10-
ft target ROI during Phase III mixed N2/H2/LPG/CO2 gas injection. Interestingly, as the depth increased from 30 to 40 ft bgs, perchlorate reduction did not change (i.e., 87±15 versus 89±4%); average H2 concentration decreased from 6.5±0.9 to 0.61±0.77%; and oxygen increased insignificantly from 0.35±0.82 to 0.48±0.60%. Thus perchlorate reduction was supported equally by 0.61±0.77 and 6.5±0.9% H2, and high H2 concentrations were not required to support significant perchlorate reduction. Propane did not change significantly and was not the cause of changes in perchlorate reduction. On the other hand, nitrate reduction was relatively constant, suggesting that LPG supported nitrate reduction.
6.6.4 Soil Moisture and Lithology Effects
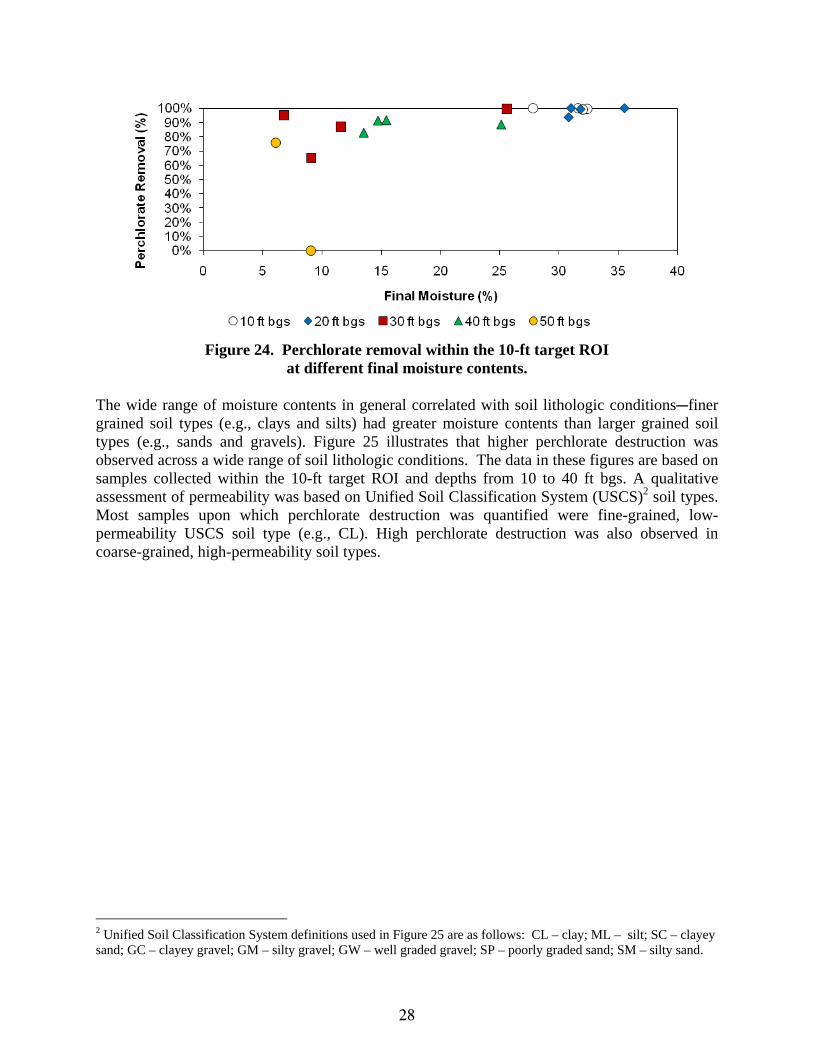
In addition to gas composition, perchlorate biodegradation can be influenced by soil moisture in two ways. One is with respect to biological activity and the other is with respect to gas transport. If soil moisture is too low, then biological activity could be inhibited. Treatability tests conducted using site soil demonstrated that perchlorate reduction was possible with 16% moisture but not with 7% moisture. Additionally, if soil moisture is very high, for example in clay, then gas transport may be hindered and insufficient electron donors will be available to promote perchlorate biodegradation. Perchlorate degradation was observed at moisture contents ranging from 6.8 to 36% (Figure 24). Thus field performance was better than laboratory treatability performance and relatively dry soils did not prevent perchlorate biodegradation.
28
Figure 24. Perchlorate removal within the 10-ft target ROI
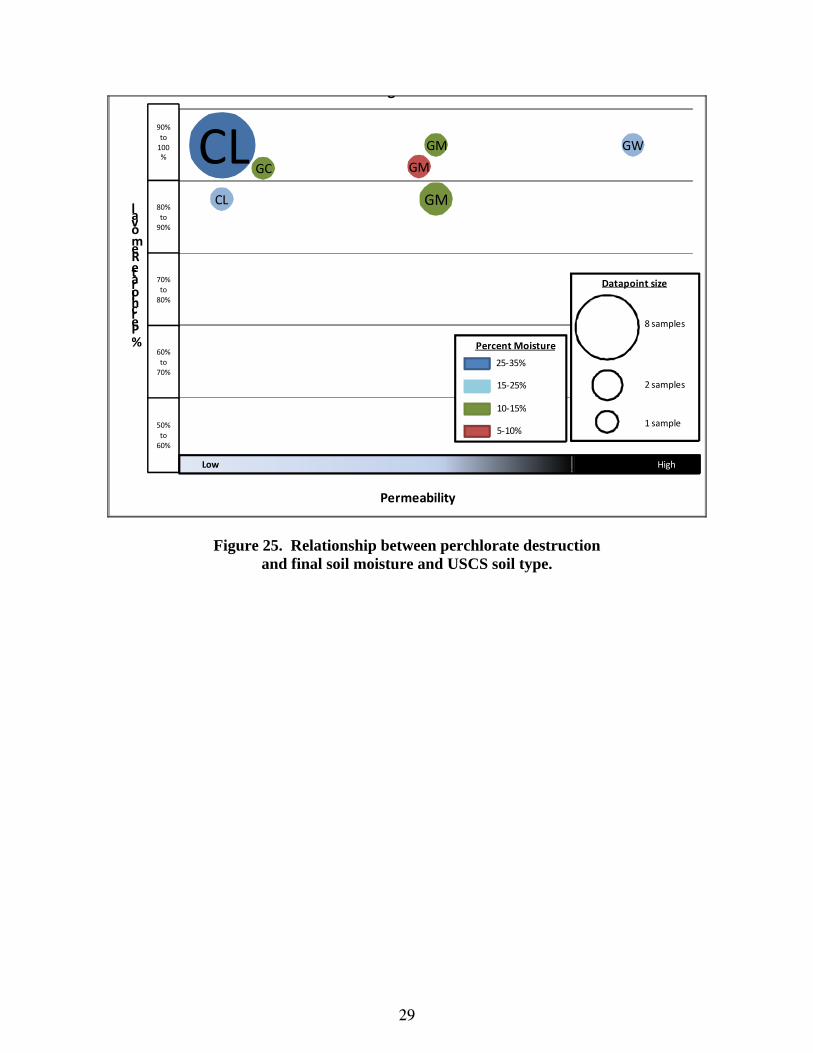
at different final moisture contents. The wide range of moisture contents in general correlated with soil lithologic conditionsCfiner grained soil types (e.g., clays and silts) had greater moisture contents than larger grained soil types (e.g., sands and gravels). Figure 25 illustrates that higher perchlorate destruction was observed across a wide range of soil lithologic conditions. The data in these figures are based on samples collected within the 10-ft target ROI and depths from 10 to 40 ft bgs. A qualitative assessment of permeability was based on Unified Soil Classification System (USCS)2 soil types. Most samples upon which perchlorate destruction was quantified were fine-grained, low-permeability USCS soil type (e.g., CL). High perchlorate destruction was also observed in coarse-grained, high-permeability soil types.
2 Unified Soil Classification System definitions used in Figure 25 are as follows: CL – clay; ML – silt; SC – clayey sand; GC – clayey gravel; GM – silty gravel; GW – well graded gravel; SP – poorly graded sand; SM – silty sand.
29
CLGC
GM
GM GW
CL
GM
0.5
0.6
0.7
0.8
0.9
1
% Perchlorate Removal
Permeability
g
90%
to 100%
80% to 90%
70% to 80%
60% to 70%
50%
to 60%
Low High
25‐35%
15‐25%
10‐15%
5‐10%
Percent Moisture
8 samples
2 samples
1 sample
Datapoint size
Figure 25. Relationship between perchlorate destruction and final soil moisture and USCS soil type.

This page left blank intentionally.
31
7.0 PERFORMANCE ASSESSMENT
7.1 PERCHLORATE DESTRUCTION
The average percent perchlorate destruction was 93±9% within the 10-ft ROI and the 10-to-40-ft bgs depth interval. The performance objective of 90% for perchlorate destruction was exceeded. Initial perchlorate concentrations within this ROI and depth ranged from 2600 to 75,000 µg/kg. Final perchlorate concentrations ranged from <13 to 8800 µg/kg. Seven final soil samples (i.e., six sample locations plus one duplicate) were ND for perchlorate (<13 to <15 µg/kg).
7.2 NITRATE DESTRUCTION
The average percent nitrate destruction was 94±9% within the 10-ft ROI and the 10-to-50-ft bgs depth interval. The performance objective of 90% for perchlorate destruction was exceeded. When all data were considered which consisted of an ROI of 56 ft, the average nitrate destruction was 90±14%. Nitrate was analytically quantified as the sum of nitrate and nitrite. Therefore, accumulation of the denitrification intermediate nitrite did not occur. Initial concentrations of nitrate plus nitrite within the 10-ft target ROI ranged from 2.0 to 8.6 mg-N/kg. Final nitrate plus nitrite concentrations ranged from <0.054 to 2.9 mg-N/kg. Six final soil samples (i.e., five sample locations plus one duplicate) were ND for nitrate plus nitrite (<0.054 to <0.057 mg-N/kg).
7.3 PERCHLORATE DESTRUCTION RATE
A maximum of 5 months was required to achieve 93±9% perchlorate destruction during the demonstration, and 3 months or less was required in certain locations (Evans, 2010). The performance objective was 90% destruction within 12 months. Thus, the performance objective was met. Heterogeneity greatly complicated assessment of actual perchlorate destruction rates. Nevertheless, 88±11% perchlorate destruction at a rate of 380±110 µg kg-1 d-1 was estimated in the vicinity of P3. This rate compares favorably to biodegradation rates measured during optimized full-scale ex situ bioremediation of perchlorate in soil (Evans et al., 2008). There, the median rate was about 200 µg kg-1 d-1, and the 90th percentile rate was about 500 µg kg-1 d-1.
7.4 NITRATE DESTRUCTION RATE
A maximum of 5 months was required to achieve 94±9% nitrate destruction during the demonstration and three months or less in certain locations. The performance objective was 90% destruction within 6 months. Thus, the performance objective was met. Nitrate plus nitrite was quantified to account for the potential of nitrite accumulation during denitrification. Therefore the destruction rate is representative of nitrate and nitrite destruction rather than partial nitrate transformation to nitrite. Heterogeneity greatly complicated assessment of actual nitrate destruction rates. Nevertheless, a nitrate destruction rate of 40±11 µg kg-1 d-1 was estimated in the vicinity of P3.
7.5 IMPLEMENTABILITY
ROI was used as a primary metric for implementability because it will determine the number of wells required to treat a given area. The ROI for perchlorate degradation was conservatively
32
estimated to be 10 ft and likely to be 15 ft during the demonstration. This ROI for nitrate degradation was estimated to be at least 56 ft. The performance objective for implementability was an ROI of 10 ft. Therefore, the performance objective was met. These ROIs were based on injection of a total of 100 standard cfh of gas into P4 at 18 and 28 ft bgs. The ROI for oxygen depletion and electron donor transport was strongly affected by injection well design, gas flow rate, injection strategy. Use of 6-inch long soil vapor probes as injection points and continuous injection of gas at relatively low flow rates was preferable to use of long well screens and pulsing of gas at relatively high flow rates. Gas composition also affected the ROI and the ROI varied with respect to depth. For example, LPG was transported a greater distance than H2 during Phase III injection of the H2/CO2/LPG/N2 gas mixture. H2, because of its buoyancy, was limited in how deep it could be transported compared to LPG. The injection of this mixture was effective in reducing oxygen concentrations not only at the injection depths (i.e., 18 and 28 ft bgs), but also above and below these depths, based on measured oxygen concentrations and observed perchlorate removals. Injection of pure LPG during Phase IV demonstrated that this gas could be transported significant distances but tended to sink, resulting in elevated oxygen concentrations in shallow soil horizons. Thus, the ROI measured for this demonstration was operationally defined and should not be directly applied to other sites. Greater ROIs are possible, and the most cost-effective and implementable approach will be determined by optimizing gas injection and well spacing.
33
8.0 COST ASSESSMENT
This section provides an assessment of full-scale GEDIT costs and drivers. The IRCTS-PBA site was used as a basis for developing the cost estimates. Four different scenarios were developed for in situ treatment of perchlorate in soil at this site. These scenarios were developed to compare actual demonstration design and operating conditions to likely full-scale design and operating conditions.
8.1 COST MODEL
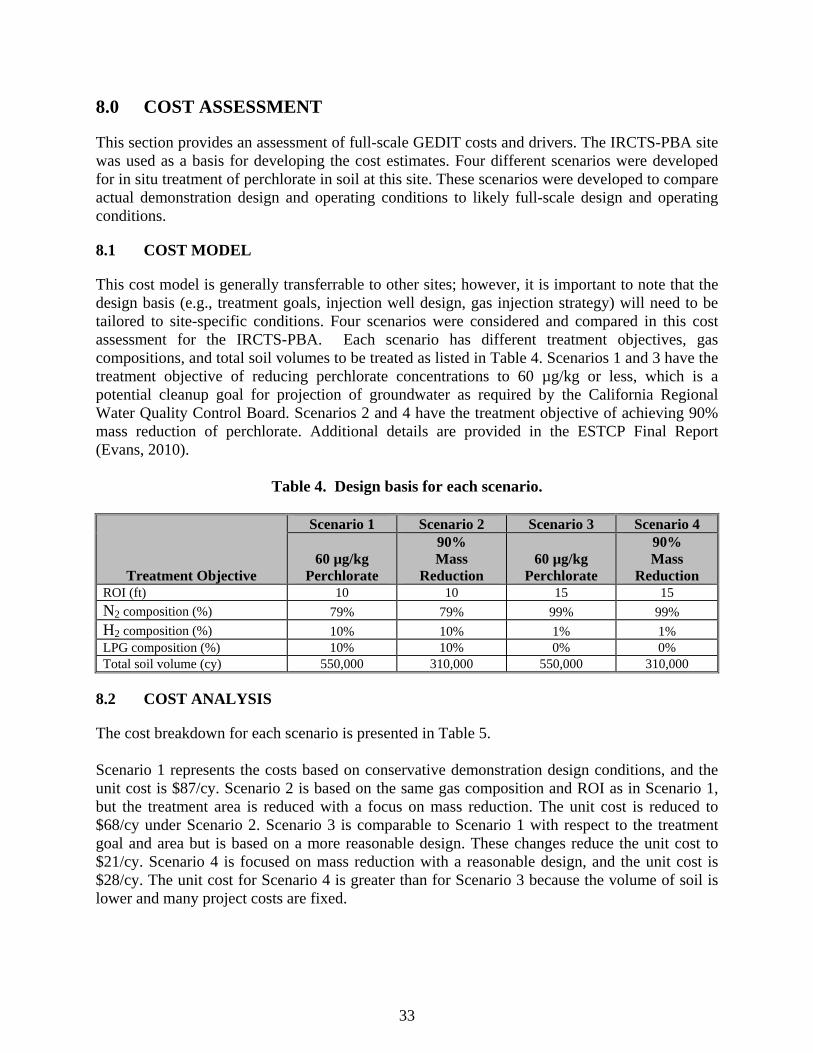
This cost model is generally transferrable to other sites; however, it is important to note that the design basis (e.g., treatment goals, injection well design, gas injection strategy) will need to be tailored to site-specific conditions. Four scenarios were considered and compared in this cost assessment for the IRCTS-PBA. Each scenario has different treatment objectives, gas compositions, and total soil volumes to be treated as listed in Table 4. Scenarios 1 and 3 have the treatment objective of reducing perchlorate concentrations to 60 µg/kg or less, which is a potential cleanup goal for projection of groundwater as required by the California Regional Water Quality Control Board. Scenarios 2 and 4 have the treatment objective of achieving 90% mass reduction of perchlorate. Additional details are provided in the ESTCP Final Report (Evans, 2010).
Table 4. Design basis for each scenario.
Treatment Objective
Scenario 1 Scenario 2 Scenario 3 Scenario 4
60 µg/kg Perchlorate
90% Mass
Reduction 60 µg/kg
Perchlorate
90% Mass
Reduction ROI (ft) 10 10 15 15
N2 composition (%) 79% 79% 99% 99%
H2 composition (%) 10% 10% 1% 1% LPG composition (%) 10% 10% 0% 0% Total soil volume (cy) 550,000 310,000 550,000 310,000
8.2 COST ANALYSIS
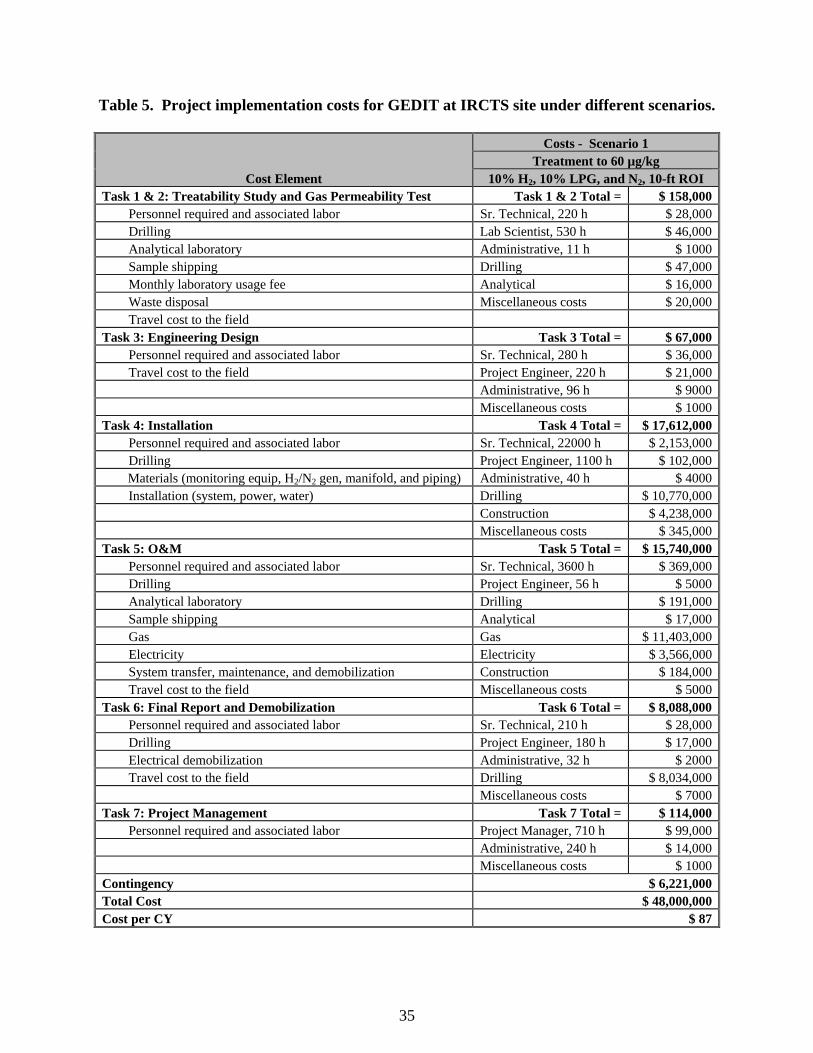
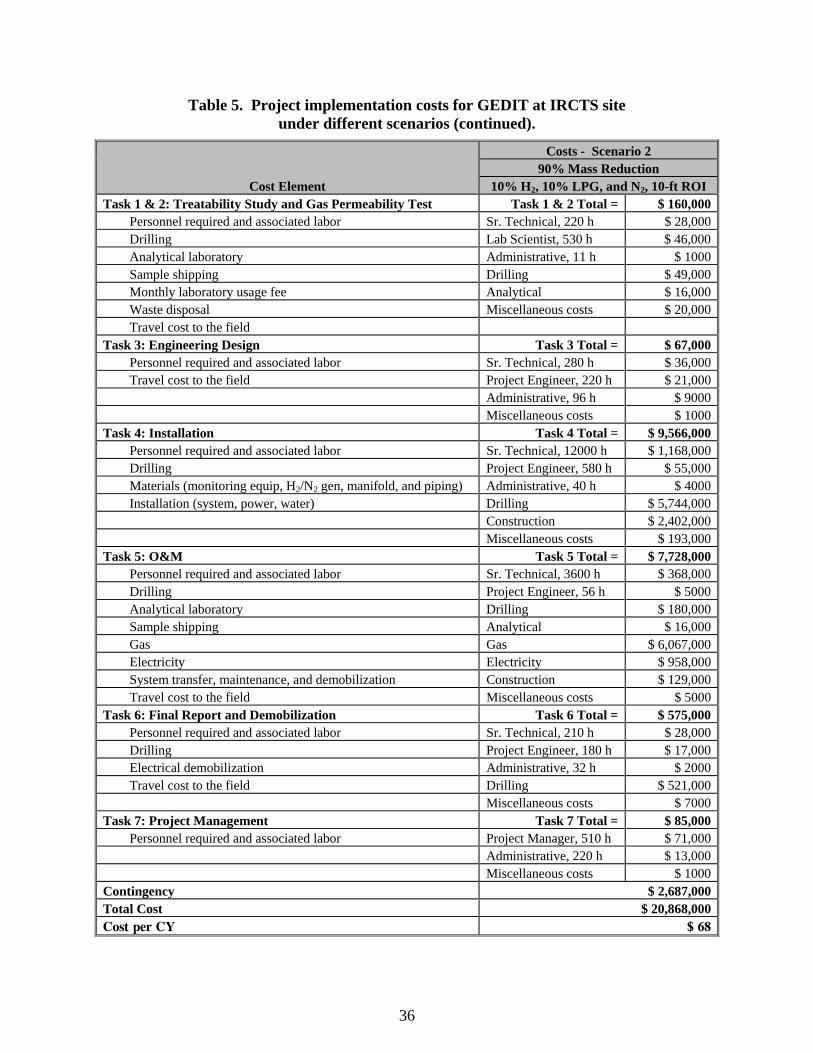
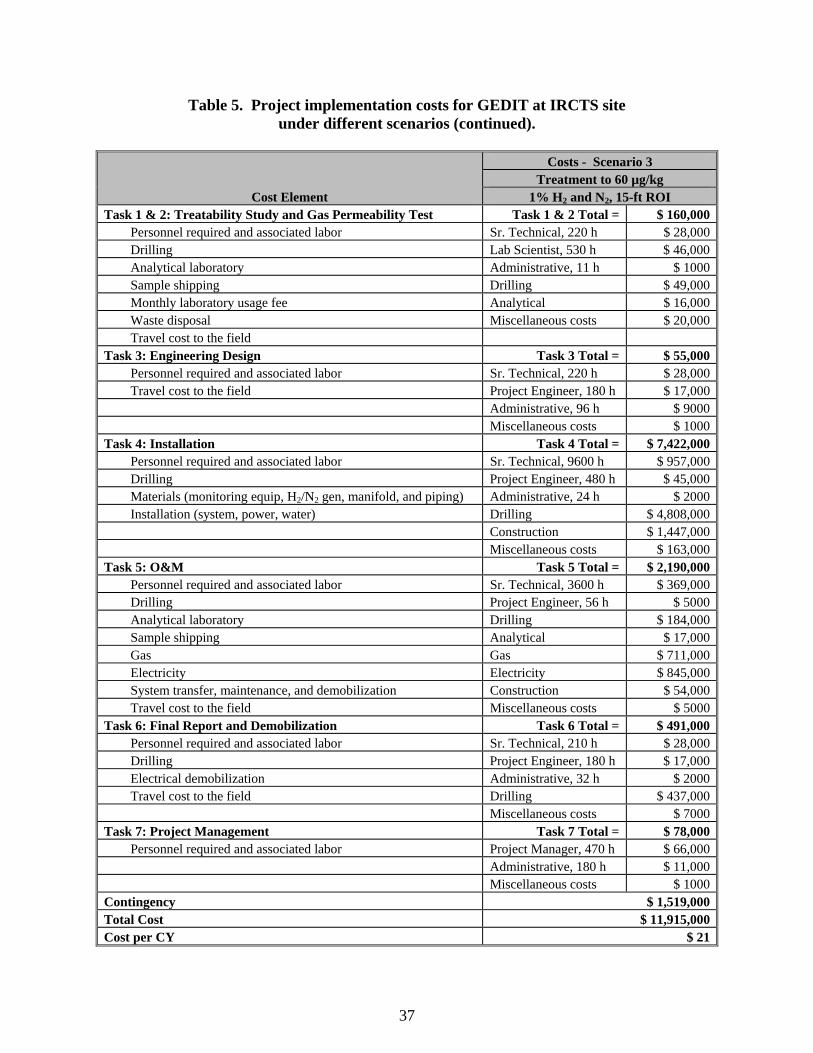
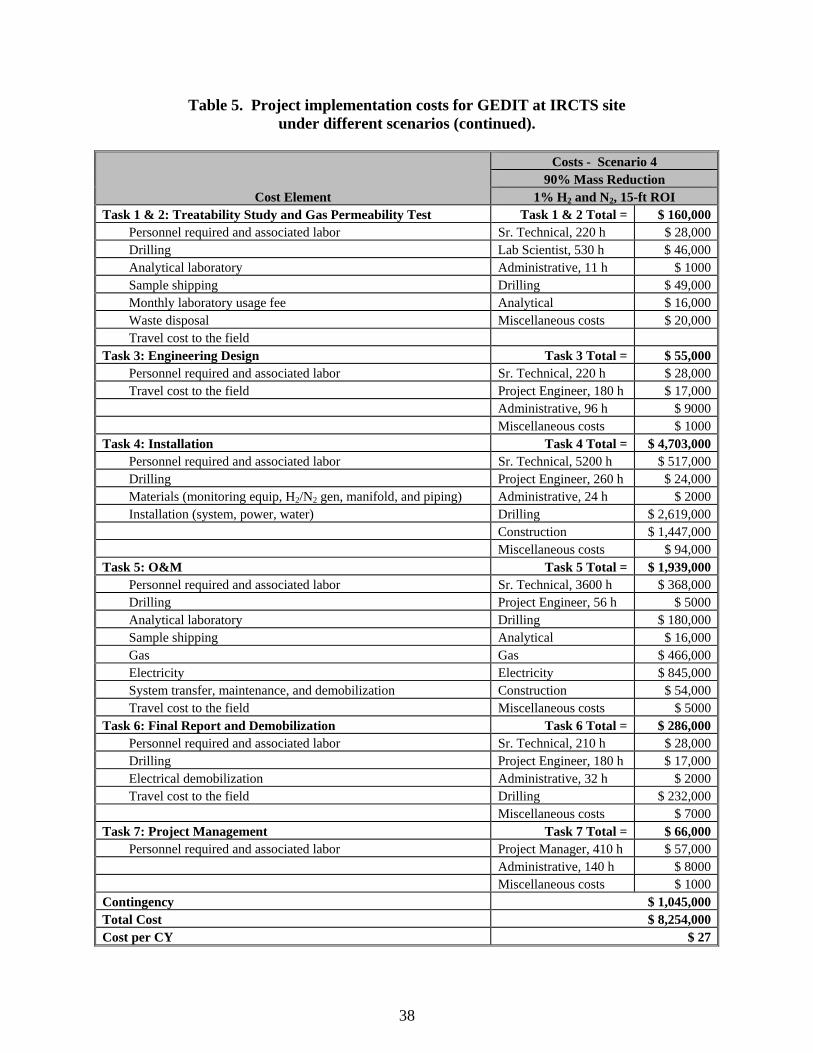
The cost breakdown for each scenario is presented in Table 5. Scenario 1 represents the costs based on conservative demonstration design conditions, and the unit cost is $87/cy. Scenario 2 is based on the same gas composition and ROI as in Scenario 1, but the treatment area is reduced with a focus on mass reduction. The unit cost is reduced to $68/cy under Scenario 2. Scenario 3 is comparable to Scenario 1 with respect to the treatment goal and area but is based on a more reasonable design. These changes reduce the unit cost to $21/cy. Scenario 4 is focused on mass reduction with a reasonable design, and the unit cost is $28/cy. The unit cost for Scenario 4 is greater than for Scenario 3 because the volume of soil is lower and many project costs are fixed.
34
When comparing each task across the different scenarios, the costs of the treatability study, gas permeability test, engineering design, and project management are similar under different scenarios. The cost of installation and demobilization under Scenario 1 is much greater than that under other scenarios because of higher labor cost for geologist labor, higher drilling cost, and higher construction cost. The gas cost under operations and maintenance (O&M) in Scenarios 1 and 2 is much greater than that of Scenarios 3 and 4 because of the high cost of LPG. The cost drivers are analyzed in more detail below.
8.3 COST DRIVERS
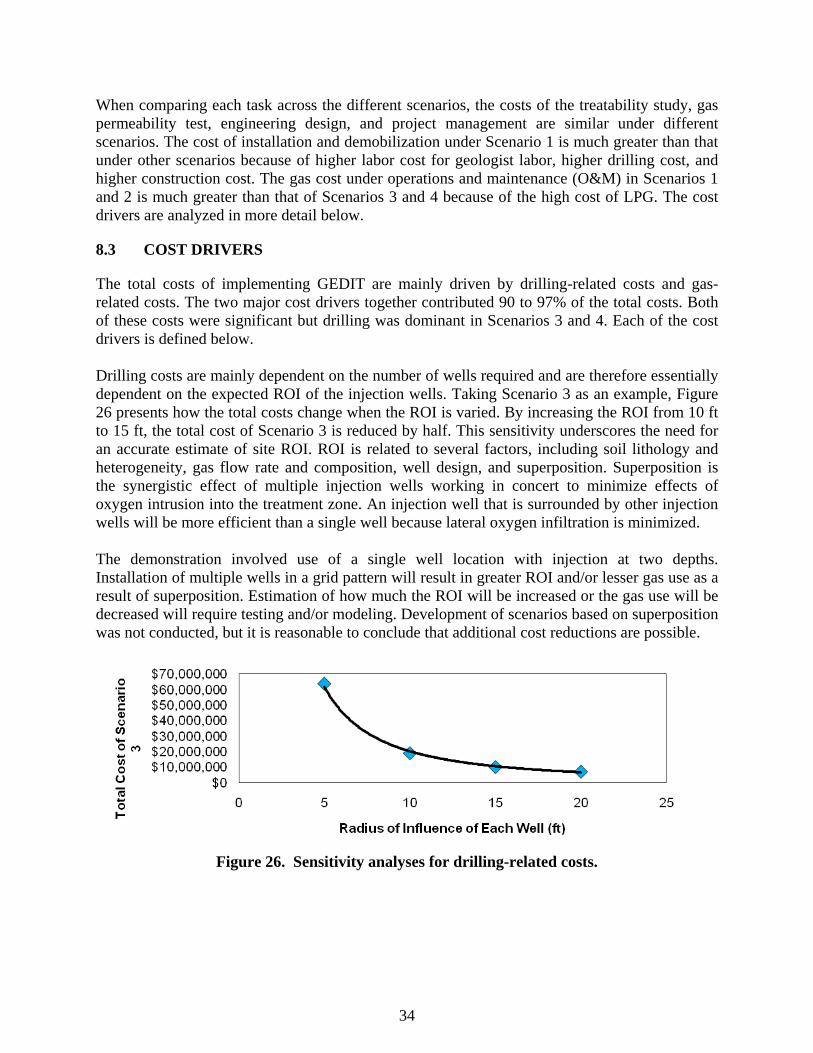
The total costs of implementing GEDIT are mainly driven by drilling-related costs and gas-related costs. The two major cost drivers together contributed 90 to 97% of the total costs. Both of these costs were significant but drilling was dominant in Scenarios 3 and 4. Each of the cost drivers is defined below. Drilling costs are mainly dependent on the number of wells required and are therefore essentially dependent on the expected ROI of the injection wells. Taking Scenario 3 as an example, Figure 26 presents how the total costs change when the ROI is varied. By increasing the ROI from 10 ft to 15 ft, the total cost of Scenario 3 is reduced by half. This sensitivity underscores the need for an accurate estimate of site ROI. ROI is related to several factors, including soil lithology and heterogeneity, gas flow rate and composition, well design, and superposition. Superposition is the synergistic effect of multiple injection wells working in concert to minimize effects of oxygen intrusion into the treatment zone. An injection well that is surrounded by other injection wells will be more efficient than a single well because lateral oxygen infiltration is minimized. The demonstration involved use of a single well location with injection at two depths. Installation of multiple wells in a grid pattern will result in greater ROI and/or lesser gas use as a result of superposition. Estimation of how much the ROI will be increased or the gas use will be decreased will require testing and/or modeling. Development of scenarios based on superposition was not conducted, but it is reasonable to conclude that additional cost reductions are possible.
Figure 26. Sensitivity analyses for drilling-related costs.
35
Table 5. Project implementation costs for GEDIT at IRCTS site under different scenarios.
Cost Element
Costs - Scenario 1 Treatment to 60 µg/kg
10% H2, 10% LPG, and N2, 10-ft ROI Task 1 & 2: Treatability Study and Gas Permeability Test Task 1 & 2 Total = $ 158,000
Personnel required and associated labor Sr. Technical, 220 h $ 28,000 Drilling Lab Scientist, 530 h $ 46,000 Analytical laboratory Administrative, 11 h $ 1000 Sample shipping Drilling $ 47,000 Monthly laboratory usage fee Analytical $ 16,000 Waste disposal Miscellaneous costs $ 20,000 Travel cost to the field
Task 3: Engineering Design Task 3 Total = $ 67,000 Personnel required and associated labor Sr. Technical, 280 h $ 36,000 Travel cost to the field Project Engineer, 220 h $ 21,000
Administrative, 96 h $ 9000 Miscellaneous costs $ 1000
Task 4: Installation Task 4 Total = $ 17,612,000 Personnel required and associated labor Sr. Technical, 22000 h $ 2,153,000 Drilling Project Engineer, 1100 h $ 102,000 Materials (monitoring equip, H2/N2 gen, manifold, and piping) Administrative, 40 h $ 4000 Installation (system, power, water) Drilling $ 10,770,000
Construction $ 4,238,000 Miscellaneous costs $ 345,000
Task 5: O&M Task 5 Total = $ 15,740,000 Personnel required and associated labor Sr. Technical, 3600 h $ 369,000 Drilling Project Engineer, 56 h $ 5000 Analytical laboratory Drilling $ 191,000 Sample shipping Analytical $ 17,000 Gas Gas $ 11,403,000 Electricity Electricity $ 3,566,000 System transfer, maintenance, and demobilization Construction $ 184,000 Travel cost to the field Miscellaneous costs $ 5000
Task 6: Final Report and Demobilization Task 6 Total = $ 8,088,000 Personnel required and associated labor Sr. Technical, 210 h $ 28,000 Drilling Project Engineer, 180 h $ 17,000 Electrical demobilization Administrative, 32 h $ 2000 Travel cost to the field Drilling $ 8,034,000
Miscellaneous costs $ 7000 Task 7: Project Management Task 7 Total = $ 114,000
Personnel required and associated labor Project Manager, 710 h $ 99,000 Administrative, 240 h $ 14,000 Miscellaneous costs $ 1000
Contingency $ 6,221,000 Total Cost $ 48,000,000 Cost per CY $ 87
36
Table 5. Project implementation costs for GEDIT at IRCTS site under different scenarios (continued).
Cost Element
Costs - Scenario 2 90% Mass Reduction
10% H2, 10% LPG, and N2, 10-ft ROI Task 1 & 2: Treatability Study and Gas Permeability Test Task 1 & 2 Total = $ 160,000
Personnel required and associated labor Sr. Technical, 220 h $ 28,000 Drilling Lab Scientist, 530 h $ 46,000 Analytical laboratory Administrative, 11 h $ 1000 Sample shipping Drilling $ 49,000 Monthly laboratory usage fee Analytical $ 16,000 Waste disposal Miscellaneous costs $ 20,000 Travel cost to the field
Task 3: Engineering Design Task 3 Total = $ 67,000 Personnel required and associated labor Sr. Technical, 280 h $ 36,000 Travel cost to the field Project Engineer, 220 h $ 21,000 Administrative, 96 h $ 9000 Miscellaneous costs $ 1000
Task 4: Installation Task 4 Total = $ 9,566,000 Personnel required and associated labor Sr. Technical, 12000 h $ 1,168,000 Drilling Project Engineer, 580 h $ 55,000 Materials (monitoring equip, H2/N2 gen, manifold, and piping) Administrative, 40 h $ 4000 Installation (system, power, water) Drilling $ 5,744,000 Construction $ 2,402,000 Miscellaneous costs $ 193,000
Task 5: O&M Task 5 Total = $ 7,728,000 Personnel required and associated labor Sr. Technical, 3600 h $ 368,000 Drilling Project Engineer, 56 h $ 5000 Analytical laboratory Drilling $ 180,000 Sample shipping Analytical $ 16,000 Gas Gas $ 6,067,000 Electricity Electricity $ 958,000 System transfer, maintenance, and demobilization Construction $ 129,000 Travel cost to the field Miscellaneous costs $ 5000
Task 6: Final Report and Demobilization Task 6 Total = $ 575,000 Personnel required and associated labor Sr. Technical, 210 h $ 28,000 Drilling Project Engineer, 180 h $ 17,000 Electrical demobilization Administrative, 32 h $ 2000 Travel cost to the field Drilling $ 521,000 Miscellaneous costs $ 7000
Task 7: Project Management Task 7 Total = $ 85,000 Personnel required and associated labor Project Manager, 510 h $ 71,000 Administrative, 220 h $ 13,000
Miscellaneous costs $ 1000 Contingency $ 2,687,000Total Cost $ 20,868,000 Cost per CY $ 68
37
Table 5. Project implementation costs for GEDIT at IRCTS site under different scenarios (continued).
Cost Element
Costs - Scenario 3 Treatment to 60 µg/kg
1% H2 and N2, 15-ft ROI Task 1 & 2: Treatability Study and Gas Permeability Test Task 1 & 2 Total = $ 160,000
Personnel required and associated labor Sr. Technical, 220 h $ 28,000 Drilling Lab Scientist, 530 h $ 46,000 Analytical laboratory Administrative, 11 h $ 1000 Sample shipping Drilling $ 49,000 Monthly laboratory usage fee Analytical $ 16,000 Waste disposal Miscellaneous costs $ 20,000 Travel cost to the field
Task 3: Engineering Design Task 3 Total = $ 55,000 Personnel required and associated labor Sr. Technical, 220 h $ 28,000 Travel cost to the field Project Engineer, 180 h $ 17,000
Administrative, 96 h $ 9000 Miscellaneous costs $ 1000
Task 4: Installation Task 4 Total = $ 7,422,000 Personnel required and associated labor Sr. Technical, 9600 h $ 957,000 Drilling Project Engineer, 480 h $ 45,000 Materials (monitoring equip, H2/N2 gen, manifold, and piping) Administrative, 24 h $ 2000 Installation (system, power, water) Drilling $ 4,808,000
Construction $ 1,447,000 Miscellaneous costs $ 163,000
Task 5: O&M Task 5 Total = $ 2,190,000 Personnel required and associated labor Sr. Technical, 3600 h $ 369,000 Drilling Project Engineer, 56 h $ 5000 Analytical laboratory Drilling $ 184,000 Sample shipping Analytical $ 17,000 Gas Gas $ 711,000 Electricity Electricity $ 845,000 System transfer, maintenance, and demobilization Construction $ 54,000 Travel cost to the field Miscellaneous costs $ 5000
Task 6: Final Report and Demobilization Task 6 Total = $ 491,000 Personnel required and associated labor Sr. Technical, 210 h $ 28,000 Drilling Project Engineer, 180 h $ 17,000 Electrical demobilization Administrative, 32 h $ 2000 Travel cost to the field Drilling $ 437,000
Miscellaneous costs $ 7000 Task 7: Project Management Task 7 Total = $ 78,000
Personnel required and associated labor Project Manager, 470 h $ 66,000 Administrative, 180 h $ 11,000 Miscellaneous costs $ 1000
Contingency $ 1,519,000 Total Cost $ 11,915,000 Cost per CY $ 21
38
Table 5. Project implementation costs for GEDIT at IRCTS site under different scenarios (continued).
Cost Element
Costs - Scenario 4 90% Mass Reduction
1% H2 and N2, 15-ft ROI Task 1 & 2: Treatability Study and Gas Permeability Test Task 1 & 2 Total = $ 160,000
Personnel required and associated labor Sr. Technical, 220 h $ 28,000 Drilling Lab Scientist, 530 h $ 46,000 Analytical laboratory Administrative, 11 h $ 1000 Sample shipping Drilling $ 49,000 Monthly laboratory usage fee Analytical $ 16,000 Waste disposal Miscellaneous costs $ 20,000 Travel cost to the field
Task 3: Engineering Design Task 3 Total = $ 55,000 Personnel required and associated labor Sr. Technical, 220 h $ 28,000 Travel cost to the field Project Engineer, 180 h $ 17,000 Administrative, 96 h $ 9000 Miscellaneous costs $ 1000
Task 4: Installation Task 4 Total = $ 4,703,000 Personnel required and associated labor Sr. Technical, 5200 h $ 517,000 Drilling Project Engineer, 260 h $ 24,000 Materials (monitoring equip, H2/N2 gen, manifold, and piping) Administrative, 24 h $ 2000 Installation (system, power, water) Drilling $ 2,619,000 Construction $ 1,447,000 Miscellaneous costs $ 94,000
Task 5: O&M Task 5 Total = $ 1,939,000 Personnel required and associated labor Sr. Technical, 3600 h $ 368,000 Drilling Project Engineer, 56 h $ 5000 Analytical laboratory Drilling $ 180,000 Sample shipping Analytical $ 16,000 Gas Gas $ 466,000 Electricity Electricity $ 845,000 System transfer, maintenance, and demobilization Construction $ 54,000 Travel cost to the field Miscellaneous costs $ 5000
Task 6: Final Report and Demobilization Task 6 Total = $ 286,000 Personnel required and associated labor Sr. Technical, 210 h $ 28,000 Drilling Project Engineer, 180 h $ 17,000 Electrical demobilization Administrative, 32 h $ 2000 Travel cost to the field Drilling $ 232,000 Miscellaneous costs $ 7000
Task 7: Project Management Task 7 Total = $ 66,000 Personnel required and associated labor Project Manager, 410 h $ 57,000 Administrative, 140 h $ 8000
Miscellaneous costs $ 1000 Contingency $ 1,045,000 Total Cost $ 8,254,000 Cost per CY $ 27
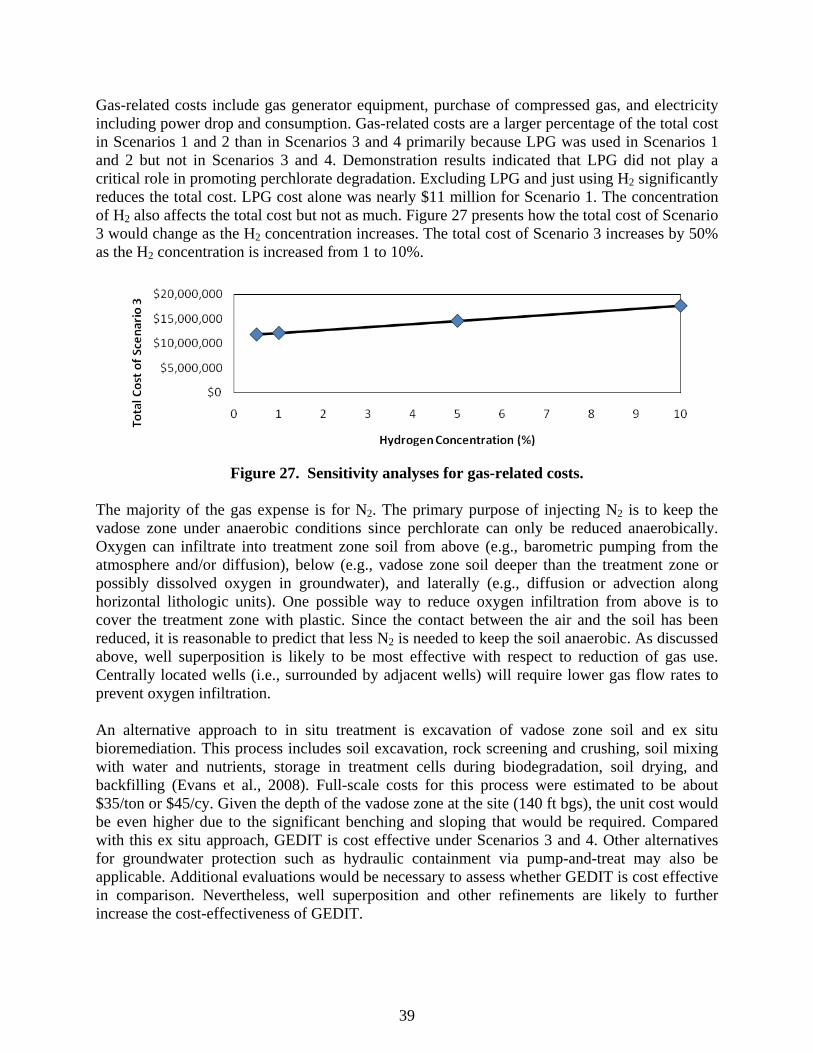
39
Gas-related costs include gas generator equipment, purchase of compressed gas, and electricity including power drop and consumption. Gas-related costs are a larger percentage of the total cost in Scenarios 1 and 2 than in Scenarios 3 and 4 primarily because LPG was used in Scenarios 1 and 2 but not in Scenarios 3 and 4. Demonstration results indicated that LPG did not play a critical role in promoting perchlorate degradation. Excluding LPG and just using H2 significantly reduces the total cost. LPG cost alone was nearly $11 million for Scenario 1. The concentration of H2 also affects the total cost but not as much. Figure 27 presents how the total cost of Scenario 3 would change as the H2 concentration increases. The total cost of Scenario 3 increases by 50% as the H2 concentration is increased from 1 to 10%.
Figure 27. Sensitivity analyses for gas-related costs.
The majority of the gas expense is for N2. The primary purpose of injecting N2 is to keep the vadose zone under anaerobic conditions since perchlorate can only be reduced anaerobically. Oxygen can infiltrate into treatment zone soil from above (e.g., barometric pumping from the atmosphere and/or diffusion), below (e.g., vadose zone soil deeper than the treatment zone or possibly dissolved oxygen in groundwater), and laterally (e.g., diffusion or advection along horizontal lithologic units). One possible way to reduce oxygen infiltration from above is to cover the treatment zone with plastic. Since the contact between the air and the soil has been reduced, it is reasonable to predict that less N2 is needed to keep the soil anaerobic. As discussed above, well superposition is likely to be most effective with respect to reduction of gas use. Centrally located wells (i.e., surrounded by adjacent wells) will require lower gas flow rates to prevent oxygen infiltration. An alternative approach to in situ treatment is excavation of vadose zone soil and ex situ bioremediation. This process includes soil excavation, rock screening and crushing, soil mixing with water and nutrients, storage in treatment cells during biodegradation, soil drying, and backfilling (Evans et al., 2008). Full-scale costs for this process were estimated to be about $35/ton or $45/cy. Given the depth of the vadose zone at the site (140 ft bgs), the unit cost would be even higher due to the significant benching and sloping that would be required. Compared with this ex situ approach, GEDIT is cost effective under Scenarios 3 and 4. Other alternatives for groundwater protection such as hydraulic containment via pump-and-treat may also be applicable. Additional evaluations would be necessary to assess whether GEDIT is cost effective in comparison. Nevertheless, well superposition and other refinements are likely to further increase the cost-effectiveness of GEDIT.

This page left blank intentionally.
41
9.0 IMPLEMENTATION ISSUES
9.1 REGULATIONS AND PERMITS
Federal or state regulations driving site cleanup will drive the need for GEDIT. The primary application for GEDIT is anticipated to be treatment of contaminants such as perchlorate in deep soil for the purpose of groundwater protection. The feasibility study process will include evaluation of GEDIT compared to other alternatives such as pump-and-treat, liquid flushing, and excavation. Specific permits for GEDIT will be driven by local codes and will include drilling and well installation permits and hazardous materials storage permits. Other permits may be necessary and will be dependent on local codes.
9.2 END-USER CONCERNS
Flammability is the primary end-user concern associated with GEDIT. As shown in this demonstration, this issue was easily managed and did not necessitate extraordinary efforts. The level of effort was similar to that for a construction site or remediation of a gasoline station site. Specifically, the following observations and actions were part of this demonstration:
H2 was supplied in cylinders much in the same way that acetylene is supplied for welding at construction sites. The number of cylinders was greater than typically used at a construction site but these cylinders are contained in a commercially available rig that stabilizes and manifolds the cylinders.
LPG was placed in a standard commercially available tank on a portable concrete pad. This effort is no different from a remediation site that uses a propane-fired thermal oxidizer or a construction site that uses LPG.
Flammable gas and no smoking placards were used at the site. Such placards would be present at any gasoline station remediation site.
Liquid N2 was supplied in a commercially available trailer. From a cold surface hazard perspective, liquid N2 is handled the same as liquid oxygen at hospitals and other commercial facilities.
The Sacramento County Hazardous Materials Department and Aerojet-General Corporation were satisfied with the arrangements for the storage and use of flammable materials on the site. A standard hazardous materials permit was required by the County. Aerojet-General Corporation conducted a New Process Evaluation, which is a standard requirement.
Flammable gases were not detected above the ground surface. Thus, release of flammable gas to the atmosphere was not a safety issue. Nevertheless, monitoring of flammable gases should be conducted just as they would be during a gasoline station remediation project.

This page left blank intentionally.
43
10.0 REFERENCES
Aerojet Environmental Operations and HSI GeoTrans, Inc. (Aerojet & HSI GeoTrans) 2000. Remedial Investigation Report for the Vadose Zone at the Propellant Burn Area. Inactive Rancho Cordova Test site. Rancho Cordova, California. May.
Aerojet General Corporation and Simon Hydro-Search, Inc. (AGC & Simon HSI), 1993. Revised Workplan for the Additional Characterization of the Propellant Burn Area, Circular Feature, and Municipal Landfill at the Inactive Rancho Cordova Test Site (IRCTS), October.
Cai, H., A. G. Eramo, P. J. Evans, R. Fricke, and R. A. Brennan. 2010. In Situ Bioremediation of Perchlorate in Vadose Zone Soil Using Gaseous Electron Donors: Microcosm Treatability Study. Water Environment Research 82(5):409-417.
Camp Dresser & McKee, Inc. (CDM). 2007. Technology Demonstration Plan. In Situ Bioremediation of Perchlorate in Vadose Zone Soil Using Gaseous Electron Donors. ESTCP Project Number ER-0511.
Evans, P. J., and M. M. Trute. 2006. In Situ Bioremediation of Nitrate and Perchlorate in Vadose Zone Soil for Groundwater Protection Using Gaseous Electron Donor Injection Technology. Water Environment Research 78(13):2436-2446.
Evans, P. J. 2007. Process for In Situ Bioremediation of Subsurface Contaminants. U. S. Patent No. 7,282,149. October 16.
Evans, P. J., I. Lo, A. E. Moore, W. J. Weaver, W. F. Grove, and H. Amini. 2008. Rapid Full-Scale Bioremediation of Perchlorate in Soil at a Large Brownfields Site. Remediation. Spring:9-25.
Evans, P. J. 2010. In Situ Bioremediation of Perchlorate and Nitrate in Vadose Zone Soil Using Gaseous Electron Donor Injection Technology (GEDIT). ESTCP Project ER-0511 Final Report.
Fricke, R A. and S. M. Carlton. 2005. Treatability Study of In-Situ Biodegradation of Perchlorate in the Unsaturated Zone. Presentation at NGWA Conference on MTBE and Perchlorate.
Interstate Technology Regulatory Council (ITRC). 2005. Technology Overview. Perchlorate: Overview of Issues, Status, and Remedial Options. Washington, D.C. September.
USEPA. 2006a. Assessment Guidance for Perchlorate, memorandum from Susan Parker Bodine to Regional Administrators, U.S. Environmental Protection Agency, Office of Solid Waste and Emergency Response, Washington, D.C.
USEPA. 2006b. In Situ Treatment Technologies for Contaminated Soil. Engineering Forum Issue Paper. EPA 542/F-06/013. Office of Solid Waste and Emergency Response. Washington, D.C.

44
USEPA. 2008. Interim Drinking Water Health Advisory for Perchlorate. EPA 822-R-08-225. December.
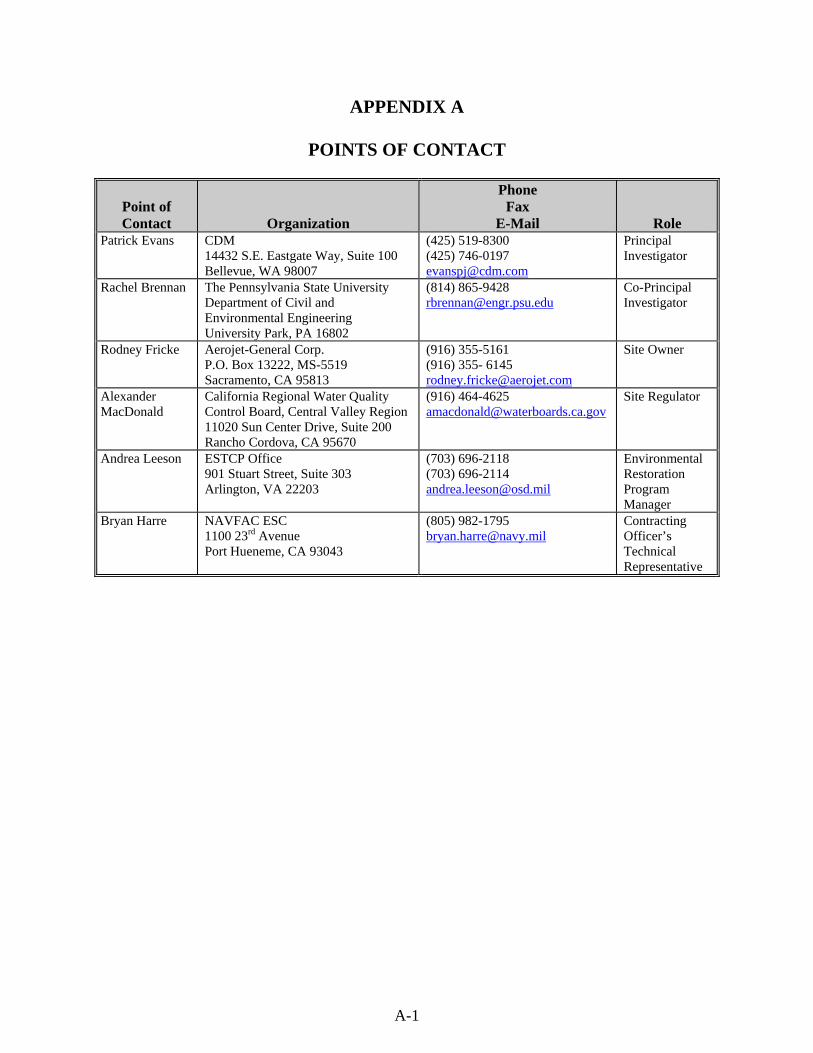
A-1
APPENDIX A
POINTS OF CONTACT
Point of Contact Organization
Phone Fax
E-Mail RolePatrick Evans CDM
14432 S.E. Eastgate Way, Suite 100 Bellevue, WA 98007
(425) 519-8300 (425) 746-0197 [email protected]
Principal Investigator
Rachel Brennan The Pennsylvania State University Department of Civil and Environmental Engineering University Park, PA 16802
(814) 865-9428 [email protected]
Co-Principal Investigator
Rodney Fricke Aerojet-General Corp. P.O. Box 13222, MS-5519 Sacramento, CA 95813
(916) 355-5161 (916) 355- 6145 [email protected]
Site Owner
Alexander MacDonald
California Regional Water Quality Control Board, Central Valley Region 11020 Sun Center Drive, Suite 200 Rancho Cordova, CA 95670
(916) 464-4625 [email protected]
Site Regulator
Andrea Leeson ESTCP Office 901 Stuart Street, Suite 303 Arlington, VA 22203
(703) 696-2118 (703) 696-2114 [email protected]
Environmental Restoration Program Manager
Bryan Harre NAVFAC ESC 1100 23rd Avenue Port Hueneme, CA 93043
(805) 982-1795 [email protected]
Contracting Officer’s Technical Representative
EStcP office901 north Stuart StreetSuite 303arlington, virginia 22203
(703) 696-2117 (Phone)(703) 696-2114 (fax)
E-mail: [email protected]