estcp cost and performance report - frtr cost and performance report ... flute™ flexible liner...
TRANSCRIPT
ESTCP Cost and Performance Report
(ER-9916)
Radon-222 as Natural Tracer for Monitoringthe Remediation of NAPL Contamination in the Subsurface
March 2008
EnvironmEntal SEcuritytEchnology cErtification Program
u.S. Department of Defense

COST & PERFORMANCE REPORT ESTCP Project: ER-9916
TABLE OF CONTENTS
Page
1.0 EXECUTIVE SUMMARY ................................................................................................ 1
2.0 BACKGROUND ................................................................................................................ 3 2.1 PARTITIONING TRACER TESTS FOR NAPL CHARACTERIZATION ..........3 2.2 OBJECTIVES OF THE DEMONSTRATION........................................................4 2.3 REGULATORY DRIVERS ....................................................................................4 2.4 STAKEHOLDER/END-USER ISSUES .................................................................4
3.0 TECHNOLOGY DESCRIPTION ...................................................................................... 7 3.1 TECHNOLOGY BACKGROUND, DEVELOPMENT, FUNCTION, AND
INTENDED USE.....................................................................................................7 3.1.1 Theory of Operation.................................................................................... 7
3.2 PROCESS DESCRIPTION .....................................................................................8 3.2.1 The Static Test Method............................................................................... 8 3.2.2 Dynamic Test Method................................................................................. 9
3.3 PREVIOUS TESTING OF THE TECHNOLOGY ...............................................11 3.4 STRENGTHS, ADVANTAGES, AND WEAKNESSES OF THE
TECHNOLOGY ....................................................................................................11 3.4.1 Factors Affecting Cost and Performance.................................................. 12
4.0 DEMONSTRATION DESIGN ........................................................................................ 15 4.1 PERFORMANCE OBJECTIVES .........................................................................15 4.2 SELECTING THE TEST SITE.............................................................................15 4.3 PREDEMONSTRATION TESTING AND ANALYSIS......................................17 4.4 TESTING AND EVALUATION PLAN...............................................................18
4.4.1 Testing in the Laboratory Physical Aquifer Model .................................. 18 4.4.2 Dover Site Series of Tests......................................................................... 18
4.4.2.1 Push-Pull Tests........................................................................ 18 4.4.2.2 Static Tests .............................................................................. 19
4.5 SAMPLING, MONITORING, AND ANALYTICAL PROCEDURES...............19 4.5.1 Determination of Bromide (Br) by Ion Chromatography......................... 19
4.5.1.1 Radon Analysis ....................................................................... 20 4.5.2 Determination of PCE Concentrations by Gas Chromatography ............. 20
4.5.2.1 Data Analysis .......................................................................... 20 4.5.2.1.1 Push-Pull Tests...................................................... 20 4.5.2.1.2 Numerical Simulations of Laboratory Tests
Results ................................................................... 21
i

TABLE OF CONTENTS (continued)
Page
5.0 PERFORMANCE ASSESSMENT .................................................................................. 23 5.1 RESULTS OF PAM TESTS AND MODEL SIMULATIONS USING
STOMP ..................................................................................................................23 5.2 PUSH-PULL TEST RESULTS FOR THE DOVER TEST CELL .......................27 5.3 SUMMARY OF RESULTS FOR THE DNTS STUDY .......................................36 5.4 DATA ASSESSMENT..........................................................................................37 5.5 TECHNOLOGY COMPARISON.........................................................................38
6.0 COST ASSESSMENT...................................................................................................... 41 6.1 COMPARISON OF COSTS WITH THE PITT METHOD..................................47 6.2 LIFE-CYCLE ANALYSIS....................................................................................49
7.0 IMPLEMENTATION ISSUES ........................................................................................ 51 7.1 COST OBSERVATIONS......................................................................................51 7.2 PERFORMANCE OBSERVATIONS...................................................................52 7.3 SCALE-UP ............................................................................................................53 7.4 LESSONS LEARNED...........................................................................................53 7.5 END-USER ISSUES .............................................................................................54 7.6 APPROACH AND REGULATORY COMPLIANCE AND ACCEPTANCE.....55
8.0 REFERENCES ................................................................................................................. 57
APPENDIX A POINTS OF CONTACT......................................................................... A-1
ii
LIST OF FIGURES
Page
Figure 1. Effect of NAPL Saturation on Rn Concentration in Presence of NAPL Relative to Background Rn Concentration. ............................................................ 8
Figure 10. Simulated Radon Breakthrough Curves During the Extraction Phases of Six
Figure 11. Comparison of Push-Pull Tests Conducted in April 2002 and September
Figure 12. Comparison of Push-Pull Tests Conducted in Well OSU-3 in April 2002 and
Figure 13. Groundwater Radon Concentrations in OSU-2 at Three Depth Intervals
Figure 14. Groundwater Radon Concentrations in OSU-3 at Three Depth Intervals
Figure 2. Single-Well, Push-Pull Partitioning Tracer Test. ................................................... 9 Figure 3. Retardation is Indicated by Increased Dispersion in a Push-Pull Test. ................ 10 Figure 4. Test Cell Used at DNTS for the Static and Dynamic Tests. ................................. 16 Figure 5. Test Cell Used in the Demonstration and Well Used for Long-Term
Monitoring. ........................................................................................................... 17 Figure 6. Test 1. Radon and Bromide Experimental and Simulated. Breakthrough
Curves During the Extraction Phase of a Push Pull Test Performed in a Noncontaminated Physical Aquifer Model........................................................... 26
Figure 7. Test 2. Radon and Bromide Experimental and Simulated Breakthrough curves During the Extraction Phase of a Push-Pull Test Performed in a TCE-Contaminated Physical Aquifer Model................................................................. 27
Figure 8. Results of Push-Pull Tests Conducted in April and May 2002 in OSU-2 and OSU-3. ........................................................................................................... 29
Figure 9. Results of Push-Pull Tests Conducted in September 2002 in OSU-2 and OSU-3. .................................................................................................................. 30
Push-Pull Tests with Homogeneous NAPL Saturations....................................... 31
2002 in Well OSU-2. ............................................................................................ 32
September 2002. ................................................................................................... 33
from Weekly Monitoring Events. ......................................................................... 34
from Weekly Monitoring Events. ......................................................................... 35
iii

LIST OF TABLES
Page
Table 1. Performance Objectives. ....................................................................................... 15 Table 2. Performance Criteria............................................................................................. 24 Table 3. Expected Performance and Performance Confirmation Methods. ....................... 25 Table 4. Radon Retardation Factors, Adjusted Retardation Factors for the Effect of
Trapped Gas (in italics), Best-Fit Dispersivities, and Calculated TCE Saturations from Push-Pull Tests.......................................................................... 26
Table 5. Depth-Averaged Groundwater Radon Concentrations. ........................................ 28 Table 6. Estimated Changes in Saturations Based on Radon Test Results......................... 33 Table 7. Summary of Radon Survey in Well OSU-2 and Estimated Changes in
Saturation Based on Equation 13.......................................................................... 36 Table 8. Summary of Radon Survey in Well OSU-3 and Estimated Changes in
Saturation Based on Equation 13.......................................................................... 36 Table 9. Comparison of PITT Tests to Radon Method Test............................................... 39 Table 10. Implementation Costs for the Test at DNTS......................................................... 42 Table 11. Estimated Demonstration Costs by Commercial Vendor. .................................... 43 Table 12. Estimated Demonstration Costs by Commercial Vendor. .................................... 44 Table 13. Estimated Demonstration Costs by Commercial Vendor. .................................... 46 Table 14. Estimated Demonstration Costs by Commercial Vendor for PITT Tests............. 48
iv

ACRONYMS AND ABBREVIATIONS
Br bromide BTC breakthrough curve
CAH chlorinated aliphatic hydrocarbons
DNTS Dover National Test Site DoD Department of Defense DNAPL dense non-aqueous phase liquid
EPA Environmental Protection Agency ESTCP Environmental Security Technology Certification Program
FID flame ionization detector FLUTe™ Flexible Liner Underground Technologies, LLC
GC gas chromatograph
IC ion chromatography
LSC Liquid Scintillation Counter
MCL maximum contaminant level MNA monitored natural attenuation
NAPL nonaqueous phase liquids NRC National Research Council
O&M operations and maintenance OSU Oregon State University
PAM physical aquifer model PCE perchloroethene PCi/L picocuries per liter PID photo ionization detector PITT partitioning interwell tracer test PV present value
Ra radium-226 Rn radon-222
STOMP subsurface transport over multiple phases
v

ACRONYMS AND ABBREVIATIONS (continued)
TCE trichloroethene
UGF Ultima-Gold F
VOA volatile organic analyte VOC volatile organic compound
vi

ACKNOWLEDGEMENTS
We would like to acknowledge the personnel at Dover National Test Site (DNTS), especially Tim McHale, for the logistical support for our work at the site. We would like also to thank our project officers—Marcia Kankelfrit, Erica Becvar, and Fricklen Holmes—at the Air Force Center for Environmental Excellence (ACFEE) for their help throughout the project. We would like to acknowledge the help of Jesse Jones, Robert Laughman, and Mohammad Azizian from Oregon State University (OSU) for preparing field tests, sampling, and analysis of radon.
Technical material contained in this report has been approved for public release.
vii

This page left blank intentionally.

1.0 EXECUTIVE SUMMARY
Nonaqueous phase liquids (NAPL), including chlorinated solvents, aromatic hydrocarbons, and other volatile organic compounds (VOC), are common contaminants at Department of Defense (DoD) and other federal and non-federal sites. Residual or pooled NAPL contamination provides a long-term source of contamination as it slowly dissolves into groundwater. A major obstacle preventing cost-effective soil and groundwater cleanup at many DoD sites is the current inability to accurately and inexpensively locate and quantify NAPL contamination. This Cost and Performance Report describes the use of naturally occurring radon-222 (Rn) as a partitioning tracer for locating and quantifying NAPL contamination in the subsurface and for monitoring changes in NAPL quantities resulting from remediation activities.
Radon-222 has unique physical properties that make it a useful “natural” partitioning tracer for detecting and quantifying NAPL. Rn is produced in the subsurface by the continuous decay of naturally occurring radium-226 (Ra). In the absence of NAPL contamination, the aqueous Rn concentration quickly reaches a site-specific equilibrium value determined by the mineralogy and porosity of the geologic formation. In the presence of NAPL, however, the Rn concentration is substantially reduced due to partitioning of Rn into the organic NAPL phase. Moreover, the reduction in Rn concentration of groundwater in contact with a NAPL phase is quantitatively correlated with the quantity of NAPL present, as described by simple equilibrium models. Thus, the method is based on measuring Rn in groundwater samples from existing monitoring wells.
Two methods of using radon were evaluated in the study: 1) a “static” method that involves the monitoring of NAPL concentrations in groundwater samples collected spatially and temporally at a site and 2) a “dynamic” method using single well push-pull tests, which is based on the retardation in radon transport that results from the partitioning process. The static method provides an end user with a means to easily survey NAPL contamination under subsurface conditions that are not heterogeneous with respect to parameters that dictate radon concentrations under background conditions (no NAPL present) at the site. More importantly, the static method can provide a method for monitoring the progress of remediation at a specific location. In this application, the method is less sensitive to local variations in geology that affect the background Rn concentration. The “dynamic” push-pull-test method, although a more complicated test to perform, potentially eliminates the complexities that result from nonhomogenous subsurface conditions. In push-pull tests, radon-free groundwater is injected along with a conservative tracer, such as bromide, into a standard monitoring well, using the entire well screen or a packed section to probe a specific depth interval. Upon extraction at the same location, the breakthrough of bromide and the radon is monitored and then analyzed to estimate radon retardation factors, which provide estimates of NAPL saturation in the vicinity of the test well.
Both static and dynamic methods were used to detect changing NAPL saturations in a test cell at the Dover National Test Site (DNTS). Tests were conducted in a test cell where 100 L of perchloroethene (PCE) was added to create NAPL contamination in the saturated zone. The test cell consists of fine- to medium-grade sand. Radon surveys and push-pull tests were performed in four wells that were installed near the PCE spill. Surveys performed prior to the release of PCE quantified the spatial variations in radon that resulted from geologic factors (primarily porosity and mineralogy). Upon releasing PCE, radon concentration decreased in some locations,
1

but increased in others. Long-term monitoring of radon concentrations during NAPL remediation showed increases in radon concentration that were consistent with NAPL removal. The increases occurred over a short period of time reflecting NAPL movement in the test cell in response to induced groundwater flow. Push-pull tests were performed in four of the monitoring wells at different times and at different depth intervals. For many of the tests, it was difficult to detect radon responses that would indicate retarded radon transport due to the presence of NAPL. In tests conducted during the remediation of the PCE, comparison of push-pull tests conducted over the period of 8 months showed decreased radon retardation and increased radon concentration, which both indicated remediation of NAPL contamination. The results agreed with the static radon test results and indicated that decreases in NAPL residual saturation of about 1% likely occurred in response to inducing groundwater flow in the test cell. The results indicate that a combination of static and dynamic push-pull tests might be used to monitor the progress of NAPL remediation. Static tests, however, are much easier and less costly to employ than push-pull tests. The results indicate that the radon method is best employed when a NAPL residual saturation greater than 1% exists, and wells for sampling exist within a NAPL source zone. The method would be best combined with other methods, such as Flexible Liner Underground Technologies, LLC (FLUTe™) ribbon samplers, that can identify the depth intervals where NAPL exists. Long-term monitoring using the static radon method, and possibly combined with dynamic push-pull tests, can be used to estimate NAPL saturation and monitor the progress of remediation. The end user is provided with data sets and methods for potentially adopting the radon method, which might be used along with other methods for characterizing NAPL contamination and the progress of remediation efforts.
Cost estimates indicate that the radon method would be less costly to perform than partitioning tracer tests, where tracers must be added. However, the radon method is useful only if samples can be obtained within the NAPL zone, so well installation and use of other methods are needed to confirm the presence of NAPL. The most cost-effective use of the method is for monitoring the progress of NAPL contamination using the static method were groundwater samples are periodically collected and changes in radon concentration are monitored at a specific location over time.
2

2.0 BACKGROUND
Nonaqueous phase liquids (NAPL), including chlorinated solvents, aromatic hydrocarbons, and other VOCs, are common contaminants at DoD and other federal and non-federal sites. Residual or pooled NAPL contamination provides a long-term source of contamination as it slowly dissolves into groundwater (Mercer and Cohen, 1990; Cohen and Mercer, 1993). Effective site remediation and monitoring programs require accurate information on the locations and volumes of NAPL contamination in the subsurface. In addition, monitoring NAPL quantities during and after remediation activities is highly desirable to quantify the extent of cleanup achieved and to verify the cost-effectiveness of the remediation method. A major obstacle preventing cost-effective soil and groundwater cleanup at many DoD sites is the current inability to accurately and inexpensively locate and quantify NAPL contamination.
This Cost and Performance Report describes the use of naturally occurring Rn as a partitioning tracer for locating and quantifying NAPL contamination in the subsurface and for monitoring changes in NAPL quantities resulting from remediation activities.
Section 2.0, Background, provides an introduction to the technology, including background information on the use of partitioning tracer tests for NAPL characterization, objectives, regulatory drivers, and previous testing of the technology. Section 3.0, Technology Description, describes the use of static and dynamic Rn sampling for detecting and quantifying NAPL contamination in the subsurface and reviews the advantages and limitations of the technology. Section 4.0, Demonstration Design, describes the performance objectives, test site, and facilities. The performance assessment is provided in Section 5.0, which includes an interpretation of the results of the demonstration. The cost assessment is included Section 6.0, and implementation issues, such as cost and performance observations, lesson learned, and approaches to regulatory compliance and acceptance in Section 7.0. References are included in Section 8.0.
2.1 PARTITIONING TRACER TESTS FOR NAPL CHARACTERIZATION
Traditional methods for locating and quantifying NAPL contamination consist of analyzing sediment or groundwater samples (Cohen and Mercer, 1993). However, sediment core collection is expensive and sample volumes are often small, preventing efficient site-scale NAPL characterization by sediment sampling. Although high contaminant concentrations in groundwater samples can provide indirect evidence of the presence of NAPL, groundwater data alone cannot provide quantitative information on the quantity of NAPL that may be present.
Partitioning tracer tests provide an alternative method for quantifying NAPL contamination in the subsurface. In this type of test, a suite of tracers, including both water- and NAPL-soluble compounds, is injected into the subsurface to probe for the presence of NAPL. The presence of NAPL is inferred from the difference in mobility between the injected NAPL-soluble tracers, which partition into the NAPL, and the injected water-soluble tracers, which remain in the aqueous phase. The relative mobility of the two types of tracers can be used to calculate retardation factors, from which the average NAPL saturation in the interrogated portion of the aquifer may be computed. A variety of alcohols and other organic compounds have been used as partitioning tracers, while anions have been used as water-soluble tracers (Jin et al., 1995; Nelson and Brusseau, 1996; Annable et al., 1998; Nelson et al., 1999; Young et al., 1999). In
3

addition to site characterization, partitioning tracer tests can be used to monitor the progress of NAPL remediation efforts. By performing partitioning tracer tests before and after remedial action, the reduction in NAPL saturation achieved by remedial action may be determined. Partitioning tracers have been shown to reliably detect the presence of NAPL contamination even in trace amounts (e.g., Jin et al., 1995). Conventional partitioning tracers, however, can be expensive, difficult to analyze for, and often require regulatory approval before they can be injected into the subsurface.
2.2 OBJECTIVES OF THE DEMONSTRATION
The purpose of this demonstration was to evaluate the potential of using naturally occurring Rn to quantify NAPL contamination in the subsurface and to monitor the progress of NAPL remediation. The specific objectives were:
• To evaluate a “static method” using Rn concentration measurements to quantify NAPL contamination and monitor the progress of NAPL remediation
• To evaluate a “dynamic” push-pull, single-well test to quantify NAPL contamination and to monitor the progress of remediation
• To conduct tests in a physical aquifer model (PAM) and at a field site to both quantify NAPL contamination and monitor the progress of remediation.
2.3 REGULATORY DRIVERS
The target compounds for these tests were PCE and trichloroethylene (TCE), which are both frequently observed subsurface contaminants existing as NAPL phases. The regulatory drivers for these environmental contaminants are maximum contaminant levels (MCL) governed under the Safe Drinking Water Act (42 U.S.C s/s 300f et seq. 1994). The Environmental Protection Agency (EPA) has set an MCL of 0.005 mg/L for both PCE and TCE and (Source: http://www.epa.gov/safewater/mcl.html#3).
2.4 STAKEHOLDER/END-USER ISSUES
The demonstration provides information on how to conduct and perform tests using the Rn method of NAPL detection and quantification. Two methods are evaluated: 1) a “static” method that involves the monitoring of NAPL concentrations in groundwater samples collected spatially and temporally at a site and 2) a dynamic method using single well push-pull tests. The static test can potentially provide an end user with a means to easily survey NAPL contamination under subsurface conditions that are not very heterogeneous with respect to parameters that dictate radon concentrations under ambient (no NAPL) present at the site. The static test method, more importantly, can provide a method for monitoring the progress of remediation at specific locations, even when heterogeneities are present.
The “dynamic” push-pull-test method is a more complicated test to perform, but potentially eliminates the complexities that result from non-homogeneous subsurface conditions and can interrogate a larger volume of the subsurface. The application of both methods would help confirm observations at a site. The end user is provided with data sets and methods for
4

potentially adopting the Rn method for characterizing NAPL contamination and the progress of remediation efforts.
5

This page left blank intentionally.

3.0 TECHNOLOGY DESCRIPTION
3.1 TECHNOLOGY BACKGROUND, DEVELOPMENT, FUNCTION, AND INTENDED USE
Rn possesses unique physical properties that make it useful as a partitioning tracer for detecting and quantifying NAPL, including its presence in detectable concentrations in nearly all subsurface environments and its affinity for organic liquids. Rn is produced in the subsurface by the continuous decay of naturally occurring Ra. In the absence of NAPL contamination, the aqueous Rn concentration quickly reaches a site-specific equilibrium value determined by the mineralogy and porosity of the geologic formation. In the presence of NAPL, however, the Rn concentration is substantially reduced due to partitioning of Rn into the organic NAPL phase (Semprini et al., 2000). Moreover, the reduction in Rn concentration in the presence of NAPL is quantitatively correlated with the quantity of NAPL present. Thus, by measuring Rn concentration in groundwater samples from existing monitoring wells, it may be possible to identify those locations where NAPL is likely present and to obtain preliminary estimates for NAPL saturation.
3.1.1 Theory of Operation
The theory and capabilities of the natural radon tracer method have been previously tested in laboratory and field experiments. A simple equilibrium-partitioning model has been found to accurately describe the Rn partitioning process Semprini et al., 1993; Hopkins, 1995; Semprini et al., 2000; Davis et al., 2002):
RnNAPL 1 = (1)
RnBackground 1+SNAPL(K−1)
where RnNAPL is the Rn concentration picouries per liter ([(pCi/L)]) in a groundwater sample from a NAPL contaminated zone, RnBackground is the Rn concentration (pCi/L) in a “background” groundwater sample from outside the contaminated zone, SNAPL is the residual NAPL saturation (NAPL volume/pore volume), and K is the Rn NAPL:water partition coefficient (dimensionless). The model predicts that as the residual NAPL saturation increases, Rn concentration in groundwater within the NAPL zone will decrease relative to Rn concentrations in adjacent uncontaminated regions (Figure 1). Assuming a K of 50 (typical for chlorinated solvents) (Cantaloub, 2001) and a SNAPL of 0.01, the equilibrium model indicates that Rn concentrations in the NAPL contaminated zones will be only 0.67 (67%) of the Rn concentration in a background monitoring well, which is easily detectable. Thus, the Rn method is sensitive to the presence to NAPL saturations of approximately 1% or greater.
7

0.0
0.2
0.4
0.6
0.8
1.0
Rn N
APL
/Rn b
ackg
roun
d
K = 30 K = 50 K = 80
0.00 0.01 0.02 0.03 0.04 0.05 0.06
NAPL Saturation
Figure 1. Effect of NAPL Saturation on Rn Concentration in Presence of NAPL Relative to Background Rn Concentration.
3.2 PROCESS DESCRIPTION
The radon method can be applied using two methods: 1) the static method, which involves measuring radon concentrations both spatially and temporally and evaluating changes in concentration that occur and 2) the dynamic method, where radon is used as partitioning tracer, but instead of adding the tracer, radon free water is injected along with a conservative tracer, such as bromide.
3.2.1 The Static Test Method
The static method refers to measuring the radon concentration in the groundwater temporally and spatially in the test cell to evaluate spatial changes that occur due the presence of NAPL, or temporal changes at a given sampling location to monitor the progress of remediation. The method requires that the groundwater samples be collected to ensure that minimal loss occurs due to volatilization of the Rn from the sample. Thus, methods for sampling volatile organic analytes (VOAs) in groundwater were employed.
Two different static methods were employed in the demonstration. One method employed sampling many depth intervals monitoring wells that surrounded the NAPL source zone. These surveys were conducted several times during the course of the study. Discrete depth intervals were sampled using inflatable packers to seal the desired depth interval of the well.
Long-term temporal monitoring can also be performed with groundwater samples obtained from selected monitoring wells. In the demonstration, samples were collected on a weekly basis.
8

The major limitation of the static Rn sampling approach is the inherent variability in background Rn concentrations. Background Rn concentrations are determined by the mineralogy and porosity of aquifer sediments through Equation 2:
C EρCRn = Ra b (2)background n
where CRnBackground is the radon concentration in the groundwater (pCi/L), CRa is the radium concentration of the aquifer solids (pCi/kg), E is radon emanation power (fraction of radon produced in the solids that reaches the pore fluid) of aquifers solids (-/-), ρb is the bulk density of the formation (kg/L), n is the porosity. Thus, natural variability in any of these factors will be reflected in variability in background Rn concentrations, which may make delineating NAPL contamination difficult using only static groundwater surveys. It should be noted that this limitation will likely not be important when the Rn method is used to monitor the progress of remediation activities at a specific location, unless these result in changes in aquifer mineralogy from the remediation process.
3.2.2 Dynamic Test Method
To overcome the limitation of geologic variations, a dynamic radon method can be employed by performing a partitioning tracer test, wherein Rn-free water containing a non-NAPL-partitioning (conservative) tracer is injected into the subsurface while monitoring Rn and conservative tracer concentrations at one or more points. From these data a retardation factor for Rn, can be used to compute the average NAPL saturation in the portion of the aquifer interrogated during the test using:
V Stracer NAPLR = = 1+ K (3)V Sradon w
where R is the retardation factor (dimensionless), Vtracer is the velocity of the nonpartitioning tracer, Vradon is the Rn velocity, Sw is the water saturation (volume of water/volume of aquifer) and SNAPL + Sw = 1. These tests must be of short duration compared to the half-life of Rn (3.83 days) so that radon emanation from the aquifer solids does not affect the results. One potential means of determining retardation factors is the use of single-well tracer tests called push-pull tests (Figure 2), which can be accomplished over short time periods.
Figure 2. Single-Well, Push-Pull Partitioning Tracer Test. (inject phase [left], extraction phase [right])
9

In this push-pull partitioning tracer test, Rn-free water containing a nonpartitioning tracer is injected into the saturated zone using an existing monitoring well; the injected test solution is then extracted from the same location. During the extraction phase, water samples are collected and analyzed for Rn and nonpartitioning tracer, and used to prepare breakthrough curves for both solutes. Test breakthrough curves are analyzed using type-curves prepared by numerical modeling (Figure 3) (Davis et al., 2002; 2005). In Figure 3, C/Cb is the ratio of a measured Rn concentration in a sample (C) to the local background concentration Cb and Ve/Vi is the ratio of the cumulative volume of water extracted at the time the sample was collected (Vext) to the volume of water injected (Vinj). One of the assumptions of the analysis shown in Figure 3 is that the NAPL is uniformly distributed throughout the aquifer.
The injected test solution volume and the aquifer porosity determine the volume of aquifer interrogated during a push-pull test. The injected test solution volume is known precisely, and the accuracy of this calculation depends largely on the accuracy of the porosity value. However, the shape of the interrogated zone is likely unknown because of the inevitable presence of aquifer heterogeneities that cause the injected test solution to flow further from the well along high conductivity flow paths.
1.0
0.8
0.6
0.4
0.2
0.0 0.0 0.5 1.0 1.5 2.0
R = 1 R = 2 R = 5 R = 10 R = 20 R = 50 R = 100
Vext/Vinj
Figure 3. Retardation is Indicated by Increased Dispersion in a Push-Pull Test.
Figure 3 shows the effect of varying retardation factors on numerically simulated extraction phase radon breakthrough curves for push-pull tests conducted by injecting Rn-free water. In this figure, Vext/Vinj corresponds to the cumulative volume of extracted solution at a given time divided by the total volume of injected solution (i.e., dimensionless time). These simulations were performed by Schroth et al., 2000, using the subsurface transport over multiple phases (STOMP) code (White and Oostrom, 2000). Note that normalized Rn concentrations increase during the extraction phase since an Rn-free test solution is injected. In the absence of NAPL, Rn behaves like a conservative tracer (R = 1); in the presence of NAPL, Rn transport is retarded (R > 1), resulting in an increased apparent dispersion during the extraction phase.
Nor
mal
ized
Con
cent
ratio
n
10

The demonstration involved injecting a known volume of radon-free test solution containing a conservative tracer into a single well, followed by the extraction of the test solution/groundwater mixture from the same well. NAPL saturations were determined by estimating the Rn retardation factor from measured conservative tracer and radon concentrations obtained during the injection and extraction phases of the test. The retardation factor (R) for radon in a NAPL-contaminated aquifer is defined as
vwR = (4)vRn
where vw is the groundwater velocity and vRn is the velocity of radon in groundwater. Assuming linear equilibrium partitioning, the retardation factor for radon may be written as (Dwarakanath et al., 1999)
KSR = 1+ n (5)
Sw
where Sn and Sw are the NAPL and water saturations in the pore space (Sn + Sw = 1). Once the retardation factor is known, the NAPL saturation could then be calculated via (Dwarakanath et al., 1999)
R −1S = (6)n R + K −1
3.3 PREVIOUS TESTING OF THE TECHNOLOGY
The technology has been tested under laboratory conditions, in column studies with different degrees of NAPL saturation (Semprini et al., 2000). The results of these were modeled and showed the decrease in Rn concentration in the pore fluid resulted from an increase in NAPL saturation, consistent with the results shown in Figure 1. In addition, the modeling of the column studies showed the expected retardation in Rn transport due to the presence of NAPL. Limited field tests of the technology have been performed. Semprini et al., (2000), presented results from the emplace NAPL source experiments conducted at the Borden Field site in Canada. Rn concentration decreases were observed that resulted from the emplaced sources, and an Rn transport model was used to simulate the responses observed in the field. Semprini et al., (1998) reported radon groundwater surveys at the Building 834 operable unit of Site 300 Lawrence Livermore National Laboratories site. At this site, heavily contaminated with TCE NAPL, deficits in Rn concentration were observed that coincided with the zone of NAPL contamination.
3.4 STRENGTHS, ADVANTAGES, AND WEAKNESSES OF THE TECHNOLOGY
The natural Rn tracer method has some unique properties for detecting and quantifying NAPL contamination in the subsurface. For static Rn sampling, this includes the ability to rapidly screen a field site for the presence of NAPL using only groundwater samples collected from existing monitoring wells. Sample collection protocols for radon analysis are identical to those
11

used to collect samples for conventional VOC analyses, except that sample hold times are reduced because of Rn’s short half-life. Application of the natural Rn method requires the presence of monitoring wells or other methods for injecting and/or extracting groundwater samples from the subsurface (e.g., multilevel samplers, and drive-points) and detectable radon concentrations. The effectiveness of static radon sampling in detecting NAPL is in part controlled by the heterogeneity of radium content, radon emanation power, and porosity of aquifer sediments (Equation 2). Static radon sampling may be less useful at sites that display heterogeneity in these properties. This limitation may not be of concern when monitoring radon concentration responses as remediation proceeds because local geologic conditions are likely not to change. For site conditions where remediation is not being implemented or where stronger confirmation is required, this limitation might be overcome with dynamic radon sampling using either the single-well, push-pull test or the well-to-well test methodology. The push-pull test method has several advantages over well-to-well tracer tests including the need for only a single well, and the ability to perform tests, relatively quickly using minimum volumes of injected and extracted water. A limitation of the push-pull method is that it interrogates only a small volume of the aquifer and would be more sensitive to spatial heterogeneities in NAPL saturation.
As the retardation response is reflected mainly by increased dispersion (Figure 3), the retardation by advection observed in well-to-well tests is lost. Another limitation of the radon method is that dilution by native groundwater with high radon concentrations can interfere with the decreases in radon that result from the partitioning into the NAPL. Thus when NAPL contamination occurs over small spatial scales, the radon sampling must also occur over similar scales. As with a half-life of 3.83 days, the radon rapidly equilibrates to background levels away from the NAPL source zone. Thus the method applies to samples obtained mainly from direct contact with the NAPL zone. The partitioning to the NAPL limits the detection with radon to NAPL saturations of approximately 1% or greater. Thus the method would be of use in cases of high NAPL saturation.
3.4.1 Factors Affecting Cost and Performance
The Rn method has the advantage over other partitioning tracers in that it is naturally produced, thus it does not need to be added to the subsurface. In the simplest form of the application, Rn concentration in groundwater samples needs to be determined spatially or temporally. Samples are obtained using standard methods of sampling for Volatile Organic Analysis using VOA bottles. Rn has a half-life of 3.83 days, thus Rn samples must be processed within a few days to obtain accurate measurements. As previously discussed, spatial sampling for radon to identify NAPL contamination can be problematic due to spatial variability in subsurface geology that dictates the background radon concentration in subsurface fluids. The likely best use of the method is temporal sampling at a specific location to monitor the progress of NAPL remediation. This would be a fairly inexpensive means of monitoring remediation, since it only requires the monitoring of radon concentrations in fluids produced from areas containing NAPL. The method is best applied when the NAPL is immobile, and fluids produced are in direct contact with the NAPL phase.
12

Dynamic push-pull tests, where water lacking radon is injected along with a conservative tracer, are designed so that the concentration response upon extraction can be monitored. These tests would be more costly to perform. These tests might be performed in conjunction with other partitioning tests, where the partitioning tracer is added. The cost associated with adding radon analysis to these tests would be minimal and would provide confirming data. Based on the results of our technology demonstration, the Rn method does not appear to be a standalone tool but is best used in conjunction with other methods.
13

This page left blank intentionally.

4.0 DEMONSTRATION DESIGN
4.1 PERFORMANCE OBJECTIVES
The primary performance objective of this study was to demonstrate Rn as a natural partitioning tracer for locating and quantifying NAPL contamination in the saturated zone. A combination of field tests was performed, including spatial and temporal surveys called static tests, and dynamic push-pull-tests. In addition, push-pull tests were performed in a laboratory PAM to evaluate the radon push-pull test method under controlled conditions. Performance objectives, performance criteria, expected performance, and actual performance are presented in Table 1.
Table 1. Performance Objectives.
Type of Performance
Objective Primary Performance
Criteria Expected Performance Actual Performance Quantitative Estimation of NAPL
saturation with push-pull tests performed in laboratory PAM.
Observed retardation can be used to estimate NAPL saturation.
Numerical model was used to simulate observations. Reasonable measurements of NAPL saturation were achieved.
Quantitative Spatial surveys of radon concentration in the Dover tests cell to quantify NAPL saturation
Decreases in radon concentration spatially could be use to locate and quantify NAPL saturation.
Radon concentrations were variable and appeared to result from geologic variability. Geophysical methods tested by others were unable to locate or quantify the NAPL contamination.
Quantitative Temporal survey of radon concentration at select locations in the Dover test cell
Increases in radon concentration at specific locations could be used to monitor the progress of remediation.
Concentration increases appeared to be linked with NAPL transport as a result of flow of groundwater.
Quantitative Push-pull tests conducted to estimate NAPL saturation
Retarded response in radon transport could be use to estimate NAPL saturation.
Retarded response observed in push-pull tests was used to estimate NAPL saturation.
4.2 SELECTING THE TEST SITE
Field tests were conducted in a test cell at DNTS at Dover Air Force Base, Dover, Delaware. At the DTNS site, NAPL contamination resulted from a controlled release of PCE into the test cell. The test cell at the site also underwent active remediation using enhanced in situ bioremediation. The PCE released into the test cell was also to be investigated by others using geophysical methods. This test cell consists of native sandy aquifer material surrounded by double-walled sheet piling. The test cell is 27 ft long, 18 ft wide, and is underlain by a clay aquitard approximately 40 ft below grade. Figure 4 is a schematic of a test cell used in the demonstration. At each end of the test cell, a gallery of wells permits groundwater to be injected at one end and extracted at another to create induced gradient conditions. Monitoring wells are located in the interior of the test cell.
15

(Figure is provided courtesy of GeoSyntec Consultants)
Figure 4. Test Cell Used at DNTS for the Static and Dynamic Tests. (Tests were performed in Oregon State University [OSU] Wells 1-4)
Figure 5 shows a photo of the test cell used in the demonstration and the long-term monitoring locations during the bioremediation study. Injection wells pumped radon-free water into the test cell; extraction wells removed the water from the opposite end. Two monitoring wells aligned with the flow gradient are used to obtain radon samples. The test cell is equipped with four monitoring wells arranged in an 8 ft by 8 ft square pattern surrounding the location of the NAPL release. The monitoring wells were slotted in the saturated zone over an interval of 10 to 40 ft below ground surface. In July 2001, approximately 100 L of perchloroethene DNAPL (PCE) was released into the test cell.
16

Injection wells Monitoring well 2
PCE injection point
Monitoring well 3
Figure 5. Test Cell Used in the Demonstration and Well Used for Long-Term Monitoring.
GeoSyntec Consultants began an interwell tracer test in the test cell on March 22, 2002, using a conservative chloride tracer. The tracer test solution consisted of test cell groundwater that is treated for aqueous phase organics using a carbon adsorption system. Chloride was added before injection of the solution into the south end of the test cell through three injection wells. Three extraction wells were located at the north end of the test cell. The wells were pumped at a constant rate, thus creating a uniform flow field within the test cell.
Two multilevel samplers for collecting groundwater samples for radon analysis were installed prior to the tracer test. These samplers were capable of sampling three depth intervals: 17-20, 23-26, and 29-32 ft below grade. Each depth interval was bounded by noninflatable packers in order to create a barrier to flow contribution from other depth intervals. One multilevel sampler was located in well OSU-2, while the other was in well OSU-3. These two wells were parallel with the flow direction in the test cell, with well OSU-2 located upgradient from well OSU-3. For push-pull tests, an inflatable packer system was used that permitted tests to be performed over 2-ft slotted intervals of the well screens. The inflatable packer system was also used to obtain samples from different depth intervals prior to the push-pull test.
4.3 PREDEMONSTRATION TESTING AND ANALYSIS
Predemonstration testing at the Dover field test site involved a survey of wells to determine the background Rn concentrations. The survey helped determine whether the Rn concentrations were high enough to be measured by the liquid scintillation counting methods that were to be used in the demonstration. The results determined the spatial variability in the Rn concentration as a result of geologic variability in the test cell. The concentrations ranged from 55 to 302 pCi/L (see
17

Table 3.2 of the Final Report). The results show that there is a fair amount of variability in background radon concentrations at the site. Concentrations vary by more than a factor of five within the test cell. Thus radon surveys to detect NAPL would be problematic at this site based on spatial measurements alone.
In addition, batch radon emanation experiments were performed from a core sample from the test cell to estimate variability in the radon source term. A 30-day incubation period was used to allow Rn concentrations in the sample to reach secular equilibrium with emanation from the sediment. The results from the emanation study are presented in Table 3.3 of the Final Report and show variability in radon emanation from the aquifer solids. Emanation from the aquifer solids varied by about a factor of 2.5, from 22 to 55 pCi/kg of solids, which was consistent with the variations in radon groundwater concentrations that were observed.
4.4 TESTING AND EVALUATION PLAN
The demonstration activities consisted of a combination of laboratory and field studies. Laboratory studies involved using laboratory PAMs. The studies used existing facilities and equipment available at OSU. Field studies used facilities and services used in routine groundwater sample collection at the DNTS. We will first describe the test plan used in the PAM study, then the plan for the DNTS demonstration studies.
4.4.1 Testing in the Laboratory Physical Aquifer Model
Laboratory studies were conducted to evaluate push-pull tests in a controlled laboratory setting. Laboratory push-pull tests were performed in PAMs constructed in a wedge shape to simulate the radial flow field near an injection/extraction well during a push-pull test (Figure 3.3, Final Report). The sediment pack contained a known initial quantity of liquid (nonaqueous phase) TCE, equivalent to ~2% of the total pore volume within the contaminated zone. Push-pull tests were performed under confined conditions after a 3-week equilibrium period during which radon concentrations reached >95% of their secular equilibrium value as a result of concurrent radon emanation from sediment and decay. During the injection phase, flow was directed from the injection/extraction ports at the narrow end of the PAM toward the constant head reservoir at the PAM’s wide end. During the extraction phase, flow was reversed.
The test solution consisted of tap water containing ~100 mg/L bromide that was sparged to be radon-free. Radon concentrations were measured in extracted water using the scintillation method that will be described.
4.4.2 Dover Site Series of Tests
4.4.2.1 Push-Pull Tests
Push-pull tests were performed in wells surrounding the NAPL spill zone in the DNTS test cell. For each test, 30 to 80 L of test solution was injected. The test solution consisted of site groundwater containing ~100 mg/L bromide as a conservative tracer. The solution was prepared in a large plastic carboy (500 L). Dissolved radon was removed by bubbling compressed nitrogen through the test solution prior to injection. Several tests were performed by injecting
18

groundwater over the complete slotted interval of the well. In other tests, inflatable straddle packers were used to isolate 3-ft-depth intervals of the well screen for testing. Test solutions were injected using a peristaltic pump, and the test solution/groundwater mixture was extracted using the same peristaltic pump. For each test, approximately double the amount of solution that was injected was extracted (50 to 500 L of injected solution and groundwater was removed from the well). The injected groundwater was allowed to reside in the aquifer for several hours prior to extracting the groundwater.
Push-pull tests at the DNTS field site were performed with typical equipment used in groundwater monitoring. These included a peristaltic pump, a container to collect well purge water prior to sample collection, suitable purge water disposal system, VOA bottles for sample collection, coolers and ice packs for shipping samples to the analytical laboratory, and site-appropriate personal protection equipment. Push-pull tests also required a large tank for test solution preparation. The tests were performed by a single field technician. Monitoring consisted of collecting samples of test solution during the injection phase of push-pull tests and collecting groundwater samples during the extraction phase using standard sampling protocols established for VOC sample collection.
Figure 4 shows a schematic of the DNTS test cell used for the demonstration test. Push-pull tests were conducted in four wells surrounding the PCE NAPL spill (OSU-1, OSU-2, OSU-3, and OSU-4). Push-pull tests were performed before and after the addition of PCE to the test cell. Tests were also performed with and without groundwater flow being induced. The induced flow experiment included tests as NAPL remediation proceeded via enhanced reductive dehalogenation, which was initiated in the spring of 2002.
4.4.2.2 Static Tests
Static tests at the DNTS involved two types: 1) depth surveys in the four monitoring wells where groundwater samples for radon analysis were obtained prior to conducting push-pull tests and 2) long-term monitoring of three depth intervals at two monitoring well locations. For the depth surveys, samples at 3-ft-depth intervals over the complete well-slotted interval were obtained using an inflatable packer. Standard sampling methods were used for VOA analysis, where 3-well volumes were purged prior to obtaining a sample, a method to ensure no loss of volatile radon upon sampling. The long-term monitoring involved weekly sampling at three specific depth intervals. Permanent packers were placed in the wells to permit the sampling of the discreet intervals. Due to the shallow groundwater table, the DNTS peristaltic pumps were used to collect the groundwater samples. Groundwater samples were collected in standard 40-ml VOA bottles and shipped overnight to OSU for the radon analysis.
4.5 SAMPLING, MONITORING, AND ANALYTICAL PROCEDURES
4.5.1 Determination of Bromide (Br) by Ion Chromatography
Concentrations of Br- were determined with a Dionex DX-500 (Sunnyvale, California) ion chromatograph (ic) equipped with an electrical conductivity detector and a Dionex AS14 column. The eluent consisted of 3.5 mM Na2CO3 and 1.0 mM NaHCO3, and the eluent flow rate was 1.5 mL/min. The approximate quantitation limit was 0.5 mg/L.
19

4.5.1.1 Radon Analysis
The measurement of radon in groundwater is based on a standard method for radon in water using liquid scintillation counting (see Method 7500-Rn in Standard Methods for the Analysis of Water and Wastewater, 19th edition supplement). The same method was used in both the laboratory PAM tests, the field push-pull tests, and the static monitoring tests. The cocktail was manufactured by Packard Instruments and carries the brand name Ultima-Gold F (UGF). UGF contains both an “extractant” (99%) and a “detector” (1%). Due to Rn’s short half-life, sample analysis had to be completed within approximately 5 days after sample collection. A groundwater sample (10 to 15 ml) was added to scintillation cocktail (5 to 10 ml) and allowed to equilibrate for a least 3 hours to permit daughter product growth. Counting was performed with a Packard 2500 TR/AB Liquid Scintillation Counter (LSC) (see Final Report for details).
4.5.2 Determination of PCE Concentrations by Gas Chromatography
Test samples were collected in 40-mL VOA vials with a Teflon/neoprene septum and a polypropylene-hole cap (Supelco, Bellefonte, Pennsylvania). PCE was determined by a modified EPA 8000 purge and trap GC analysis. Chromatographic separation was achieved with a 30-m megabore GSQ-PLOT column from J&W Scientific (Folsom, California) installed on an HP6890 series GC connected to a photo ionization detector (PID) followed by a flame ionization detector (FID) operated at 250°C.
4.5.2.1 Data Analysis
4.5.2.1.1 Push-Pull Tests
Data analysis for push-pull tests was performed using normalized concentrations. The normalized concentration for bromide is defined as C* = 1 - C/Co where C is the measured bromide concentration in a sample and Co is the bromide concentration in the injected test solution (~100 mg/L). This calculation is performed to facilitate the comparison of bromide and radon breakthrough curves. Bromide is an injected tracer, and thus its concentrations increase with time during the injection phase and decrease with time during the extraction phase. Radon, in contrast, is an in situ tracer and thus its concentrations decrease with time during the injection phase (of radon-free water) and increase with time during the extraction phase. The normalized concentration for radon is defined as C* = C/Cb, where C is the measured radon concentration and Cb is the background (equilibrium) radon concentration in the sediment pack or aquifer. Push-pull tests were performed over a time period of <8 hours so that radon emanation from aquifer sediments during the test was negligible.
Both static and push-pull methods using radon as a partitioning tracer can be used to quantify NAPL contamination. The static method involves calculating NAPL saturations from a comparison of radon concentrations in groundwater samples obtained from NAPL-contaminated and noncontaminated portions of the same aquifer, or by changes that occur over time. This method assumes secular equilibrium between radon emanation and decay, equilibrium radon partitioning between the water and NAPL phases, and a constant background radon concentration (Semprini et al., 2000). In the presence of NAPL, radon will be distributed between the water and NAPL phases as described by:
20

C E ρRa p bC S + C S = (7)n n w,n w n where Sn and Sw are the NAPL and water saturations in the pore space (Sn + Sw = 1). Assuming linear equilibrium radon partitioning of radon between NAPL and water, Equation 7 can be rearranged as
n =
CRa E p ρb (8)Cw,n 1+ Sn (K −1) which can be further rearranged to solve for the NAPL saturation
⎛ Cw,bkg ⎞⎛ 1 ⎞Sn = ⎜ −1⎟⎜⎜ (9)⎜ C ⎟ (K −1)⎟⎟ ⎝ w,n ⎠⎝ ⎠
where Cw,n is the radon concentration in groundwater in the NAPL contaminated zone and Cw,bkg is the radon concentration in groundwater in a ‘background’ zone outside of the NAPL contaminated zone or in the aquifer before NAPL contamination has occurred and K is the solvent/water partition coefficient.
NAPL saturations are determined by estimating the radon retardation factor (R) during the pull phase of the test, where R > 1 in the presence of NAPL. Assuming linear equilibrium partitioning, the retardation factor for radon is (Dwarakanath et al., 1999)
KSR = 1+ n (10)
Sw
Once the retardation factor is known, the NAPL saturation can then be calculated via (Dwarakanath et al., 1999)
R −1Sn = (11)R + K −1
Temporal changes in static radon concentrations are used to estimate changes in PCE saturations in the test cell at DNTS. Radon retardation factors obtained from push-pull tests are used to estimate PCE saturations to estimate the efficacy of remediation.
4.5.2.1.2 Numerical Simulations of Laboratory Tests Results
Simulations were also performed with the STOMP code (White and Oostrom, 2000), a fully implicit volume-integrated finite difference simulator for modeling one-, two- and three-dimensional groundwater flow and transport. STOMP has been extensively tested and validated against analytical solutions and other numerical codes (Nichols et al., 1997). Simulations incorporated injection and extraction volumes used in the PAM tests. The computational domain consisted of a line of 500 nodes with a uniform radial node spacing of Δr = 1.0 cm. The model geometry and injection volumes resulted in the injection solution traveling 48 cm from the well, as measured by the travel distance to half the solution injection concentration of the conservative tracer (C/Co = 0.5) assuming plug flow of a conservative tracer.
21

Specified NAPL saturations were modeled using TCE with a value of K = 50 for radon (Davis et al., 2003). To simplify the modeling procedure, NAPL saturations (Sn) were incorporated into the model using solid: aqueous phase partition coefficients. Equation 11 was used to determine a retardation factor (R) for a given ratio of Sn to water saturation (Sw). Second, this calculated R value, the sediment porosity, and bulk density were used to determine a solid: aqueous phase partition coefficient (Kd),
⎛ n ⎞K d = (R −1)⎜⎜ ⎟⎟ (12)ρ⎝ b ⎠
Simulations were performed with specified Sn values from 0 to 15.25%, which corresponds to retardation factors (R) ranging from 1 to 10, respectively. All simulations and PAM push-pull tests were performed over time periods such that the effects of radon emanation and decay on radon concentrations could be neglected (i.e., Ve/Vi = 2 was obtained in ≤12.5 hours).
22

5.0 PERFORMANCE ASSESSMENT
The performance assessment provides an evaluation of the demonstration of the radon method for quantifying NAPL contamination in the subsurface. Both the demonstration in the laboratory PAM and at DNTS are included. The demonstration consisted of both static testing, which represented the monitoring of radon concentrations, and dynamic testing using single-well, push-pull tests. Presented in Tables 2 and 3 are performance criteria, expected performance, and performance confirmation methods for the demonstration. A summary of the study results from the PAM test and DNTS are presented in Section 5.1 through 5.3, followed by a data assessment presented in Section 5.4, and a technology comparison in Section 5.5.
5.1 RESULTS OF PAM TESTS AND MODEL SIMULATIONS USING STOMP
Push-pull tests were conducted in laboratory PAMs using the methods described in Section 4.4.1. Test 1 was conducted in the absence of TCE NAPL contamination, while Test 2 was conducted with 2% residual TCE emplace.
Figure 6 shows the results of the PAM test with no NAPL present. STOMP simulations were applied to the results of the extraction phase radon breakthrough curves shown in Figures 6 and 7. These push-pull tests were performed in clean sediment (Test 1, Figure 6) and TCE-contaminated sediment (Test 2, Figure 7), with the contaminated zone (Sn ~2%) of Test 2 extending 74 cm from the narrow end of the PAM, beyond which Sn = 0%.
Test 1 was modeled with an average initial radon concentration = 197.6 pCi/L (measured in 4 sampling ports in this PAM before the test). The bromide data are well fit by a simulated R = 1 breakthrough curve (BTC), with a best-fit αL = 1.9 cm, and the radon data are best-fit by a simulated R = 1.3. The retardation in this case results from radon partitioning into some residual gas pockets in the PAM with an estimated gas saturation (Sg) of 7.4% (see Final Report).
Test 2 was also modeled using STOMP, with an average initial radon concentration of 262.1 pCi/L (measured in four sampling ports in this PAM prior to TCE contamination). Simulations were performed in which TCE contamination extended to 74 cm, with uncontaminated sediment at >74 cm. The br data are well-fit by a simulated R = 1 BTC, with a best-fit αL = 3.7 cm, and the radon data are best-fit by a simulated R = 2.2 (Figure 7). The radon retardation in Test 2 is attributed to partitioning of radon between 1) the trapped gas and aqueous phase and 2) the TCE and aqueous phase. An adjusted R value of 1.9 that accounts for the presence of trapped gas results in an estimated Sn = 1.8% (Table 4). The best-fit αL = 3.7 cm compares favorably with the best-fit αL = 4.0 obtained using analytical solutions, while the estimated Sn = 1.8% is a more reasonable estimate of the TCE saturation in the sediment pack (~2%) is the estimated Sn = 7.4% determined using analytical solutions. The analytical solution analysis is provided in the Final Report. The results of the modeling analysis show the importance of including the true initial conditions as well as the actual NAPL distribution, which could be represented in the STOMP simulations but not the analytical solutions. Thus the revised method results in better agreement of extraction and injection phase estimated R values and subsequent estimations of Sn. The new estimate of Sn = 1.8% is also in agreement with Sn values ranging from 0.7 to 1.6% from partitioning alcohol push-pull tests performed in this PAM (Istok et al., 2002).
23

The STOMP simulations provided estimates for Sn in the PAM test closer to the emplaced saturation of 2%. The simulations more accurately represented the true condition of in situ radon partitioning prior to and during the push-pull test. The method shows promise in providing estimates for Sn and showing changes in Sn over time as, for example, source zone remediation is affected.
Table 2. Performance Criteria.
Performance Criteria Description Primary or Secondary
Spatial variations in radon concentration can result from geologic variability prior to NAPL addition.
Groundwater radon concentrations were determined at eight different depths in four monitoring wells at DNTS cell.
Primary
DNTS Spatial changes in radon concentration can result from the NAPL addition to the test cell.
Groundwater radon concentrations were determined at eight different depths in four monitoring wells at DNTS cell.
Primary
Spatial variability in radon emanation for aquifer core samples show geologic variability in Rn source term.
Radon emanation from aquifer core samples was measured at eight different depths with cores from four monitoring wells at DNTS.
Secondary
Radon concentration in GW can be predicted from radon emanation values from core materials.
Compare groundwater concentration to estimates from core samples for DNTS cell.
Secondary
Temporal changes in radon concentration result from NAPL remediation.
Monitor groundwater radon concentrations at three different depths in monitoring wells at DNTS cell.
Primary
Retardation in radon transport can be used to estimate NAPL saturation.
Compare Rn concentration breakthroughs to that of br as a conservative tracer in PAM during the injection phase of push-pull tests.
Primary
Response in single well push-pull tests can be used to estimate NAPL saturation in PAM tests.
Compare radon concentration breakthroughs to the extraction phase of the PAM push-pull tests.
Primary
Response in single well push-pull tests can be used to estimate NAPL saturation at the DNTS.
Compare radon concentration breakthroughs to the extraction phase in single-well push-pull tests conducted at DNTS.
Primary
Factors affecting the technology performance.
• Geologic variability in radon concentrations • NAPL saturation and distribution • Spatial resolution in GW sampling • Packer performance • Ability to estimate background radon concentrations
Primary
Reliability • Reproducibility of push-pull tests • Ability to perform at different sites
Secondary
Ease of use Number and skills of people required to perform tests Primary Versatility • Use at several location
• Use with different types of geology • Use with different types of NAPL contamination
Primary
Scale-up constraints Spatial resolution in sampling Secondary
24

Table 3. Expected Performance and Performance Confirmation Methods.
Performance Criteria Expected Performance
Metric Performance
Confirmation Method Actual Spatial variations in radon concentration can result from geologic variability prior to NAPL addition.
Measured Rn concentrations will vary significantly spatially.
Repeated measurements show similar results.
Significant differences in radon concentration were observed as a function of depth prior to the NAPL releases.
DNTS spatial changes in radon concentration can results from the NAPL addition to the test cell.
Radon concentrations would decrease as a result of NAPL being present.
Measurement of Rn concentration in groundwater before and after NAPL is released at different depths in monitoring wells.
Concentrations decreased in some locations and decreased in others.
Spatial variability in radon emanation for aquifer core samples shows variations in radon source term.
Spatial variations in radon source term are observed.
Emanation measurements are reproducible.
Emanation of radon from core material was found to vary spatially.
Radon concentration in groundwater can be predicted from radon emanation values from core materials.
Correlation between estimated and predicted values.
Correlation analysis A strong correlation did not exist between estimated and measured values.
Temporal changes in radon concentration result from NAPL remediation.
Radon concentration increases as NAPL remediation proceeds.
PCE concentration in groundwater decrease.
Radon concentrations increased with time.
Retardation in radon transport can be used to estimate NAPL saturation.
Retardation in radon transport is expected compared to bromide as a conservative tracer.
Compare saturation estimates based on retardation with actual saturation.
Saturations estimated from radon retardation agreed reasonably well with emplaced NAPL saturations.
Response in single well push-pull tests can be used to estimate NAPL in PAM tests.
Extraction phase radon concentrations can be modeled to estimate NAPL saturation in PAMs.
Compare estimated saturation with actual saturations in PAMs.
Estimated saturations compared well with actual saturations in PAMs.
Response in single well push-pull tests can be used to estimate NAPL saturation at DNTS.
Extraction phase radon concentrations can be modeled to estimate NAPL.
Compare the mass of PCE added to test cell with estimated saturation.
Estimated saturations were difficult to compare with saturation emplace since emplaced distribution was not known.
Factors affecting the technology performance.
Similar metrics as above Similar metrics as above Important factors: • The amount and spatial
distribution of NAPL • Spatial resolution of GW
sampling • Geological variability in radon
concentrations Closeness of monitoring locations to the NAPL
Ease of use • Personnel required; tests conducted per day
• Reproducibility of the tests
• High spatial resolution needed
Number and training of personnel.
Required at least one highly trained technician with field expertise and analytical skills. Tests were often difficult to reproduce; high spatial resolution is needed when limited NAPL is present.
Versatility Similar metrics as above Similar metrics as above Work was performed only at one site—similar issues with use at other sites.
Scale-up Constraints Conducted at full scale Conducted at intermediate scale
Spatial resolution at full scale
25

Table 4. Radon Retardation Factors, Adjusted Retardation Factors for the Effect of Trapped Gas (in italics), Best-Fit Dispersivities, and
Calculated TCE Saturations from Push-Pull Tests. (Results from analytical are shown on the left [Davis et al., 2002], results of Numerical STOMP simulations are shown on the right. A value of K = 50 was used to calculate Sn in the presence of
TCE)
Simulations using analytical solutions
(αL best-fit using approximate solution)
Numerical Simulations using Stomp
(αL best-fit using STOMP) R αL (cm) Sn (%) R αL (cm) Sn (%)
Test 1, no TCE 1.1 3.2 - 1.3 1.9 -Test 2, with TCE 5.1/5.0 4.0 7.4 2.2/1.9 3.7 1.8
R = radon retardation factors αL (cm) = best-fit dispersivities
0
20 Br-
R = 1 Rn R = 1.3
0.0 0.5 1.0 1.5 2.0
150
40
Br- (m
g/L
)
Rn
(pC
i/L)
100 60
80 50
100
0
Ve/Vi
Figure 6. Test 1. Radon and Bromide Experimental and Simulated. Breakthrough Curves During the Extraction Phase of a Push Pull Test Performed in a Noncontaminated Physical
Aquifer Model.
26

0 250
Br-
R = 1 Rn R = 2.2
0.0 0.5 1.0 1.5 2.0
20 200
Br- (m
g/L
) 40 150
60 100
80 50
100 0
V /Vie
Rn
(pC
i/L)
Figure 7. Test 2. Radon and Bromide Experimental and Simulated Breakthrough curves During the Extraction Phase of a Push-Pull Test Performed in a TCE-Contaminated
Physical Aquifer Model.
5.2 PUSH-PULL TEST RESULTS FOR THE DOVER TEST CELL
Over the course of a 2-year period, sixteen push-pull tests were completed in the test cell at DNTS in four wells and one drive point well that surrounded the location where NAPL was injected (see Figure 5). The tests were conducted either over the complete screened section of the well or over a specific depth interval. Results of all the tests are provided in the final report.
Results of Radon Concentration Surveys: May, August, and November 2001 Surveys of the background radon concentration in groundwater samples from different depth intervals in OSU-1, OSU-2, OSU-3, and OSU-4 were obtained prior to conducting the push-pull tests. The samples were obtained by packing a 3-ft section of well screen at a specific depth and pumping three well volumes prior to collecting a sample. Attempts were made to sample 10 depth intervals from 12-15 ft to 39-42 ft.
The results of three surveys conducted in May, August, and November 2001 are provided in Table 4.7 of the final report. The May survey was performed prior to the addition of 100 L of PCE to the test cell, while the August and November surveys were conducted after PCE addition.
The May survey confirmed earlier observations that a broad range of radon concentrations exist in the test cell as a result of geologic factors. Radon concentrations ranged from 31 to 303 pCi/L in groundwater. Depth average concentrations were made for intervals where samples were obtained over all three sampling events, providing 6 to 8 depth levels to be averaged for each well. In the May survey depth well, depth-averaged values ranged from 127 to 195 pCi/L (Table 5).
27

Table 5. Depth-Averaged Groundwater Radon Concentrations.
Well
May 01 August 01 November 01 Depth Average Rn
(pCi/L) Depth Average Rn
(pCi/L) Depth Average Rn
(pCi/L) OSU-1 151 104 105 OSU-2 127 108 135 OSU-3 195 111 104 OSU-4 176 210 189
Depth Intervals Averaged OSU-1 and OSU-2; 15-18 ft; 21-24 ft; 24-27 ft; 27-30 ft; 30-33 ft; 33-36 ft; 36-39 ft OSU-3: 15-18ft;18-21 ft; 21-24 ft; 24-27 ft; 27-30 ft; 30-33 ft; 33-36 ft OSU-4: 21-24 ft; 24-27 ft; 27-30 ft; 30-33 ft; 33-36 ft; 36-39 ft
The results from the surveys show definite variations in radon concentration from May to November. At OSU-1 and OSU-3, depth-averaged radon concentrations decreased after NAPL was added (Table 5). The most dramatic decrease was observed in OSU-3, where the depth-averaged concentrations decreased from 195 pCi/L in the May survey to 104 pCi/L in the August survey. This rapid response is consistent with what we would expect if the NAPL upon release was rapidly transported to regions near this well.
April/May 2002 GeoSyntec consultants began an interwell tracer test in the test cell in March 2002 using a conservative chloride tracer. The tracer test solution consisted of test cell groundwater that was treated for aqueous phase organics using a carbon adsorption system. Samples showed radon was effectively removed by the activated carbon system; thus groundwater that lacked radon was injected to the test cell. Radon then accumulated in the groundwater as a result of emanation from the aquifer solids during transport through the test cell. The residence time of groundwater in the test cell was greater than 20 days, permitting secular equilibrium of radon to be achieved. Chloride was added before injection of the solution into the south end of the test cell through three injection wells. Three extraction wells were located at the north end of the test cell. The wells pumped at a constant rate, thus creating a uniform flow field within the test cell.
A series of push-pull tests were conducted with flow occurring. Results from the push-pull tests are provided in Figure 8 for the OSU 2 and OSU 3 wells. The results show no direct evidence of retardation in radon transport in any of the wells. The results were similar to those obtained under no-flow conditions, except there appears to be less retardation observed in well OSU-3 in April with flow occurring than in the November 2001 test without flow. The results potentially indicate a change in NAPL saturation around the 18-to 21-ft interval of OSU-3 as a result of induced groundwater flow. One of the problems encountered in the analysis of the results is determining what background radon concentration should be used to create the normalized concentration curves.
28

Well OSU 2 Rn and 1-Br-Push-Pull Test Breakthrough Curves
Under Flow Conditions
0.00
0.20
0.40
0.60
0.80
1.00
0.00 0.50 1.00 1.50 2.00 V o lume Ext ract ed / V o lume Inject ed
Rn
Br
Well OSU 3 Rn and 1-Br-Push-Pull Test Breakthrough Curves
Under Flow Conditions
0.00
0.20
0.40
0.60
0.80
1.00
0.00 0.50 1.00 1.50 2.00 V o lume Ext ract ed / V o lume Inject ed
Rn
1-Br
Figure 8. Results of Push-Pull Tests Conducted in April and May 2002 in OSU-2 and OSU-3.
Push-Pull Tests, September 2002 The final series of push-pull tests was conducted in wells OSU-2 and OSU-3 in September 2002, 7 months after flow was induced in the test cell. The tests were conducted over similar depth intervals as the April tests. Results from the normalized plots are shown in Figure 9. Little evidence for retardation is shown for well OSU-2, while some evidence for retardation is shown in well OSU-3.
29

Well 2 Radon and Bromide Push-Pull Test Breakthrough Curves
Under Flow Conditions – September 2002
0 0.1 0.2 0.3 0.4 0.5 0.6 0.7 0.8 0.9
1
0.0 0.5 1.0 1.5 2.0
Volume extractedVolume injected
Rn
0.0 0.1 0.2 0.3 0.4 0.5 0.6 0.7 0.8 0.9 1.0
Br- Rn
Br-
C/C
b an
d C
/Co
1.20
1.00
0.80
0.60
0.40
0.20
0.00
Push-Pull at Well OSW3 Packed at the 21-24 ft Interval
Br- C/Co
Rn -C/Co
0.00 0.50 1.00 1.50 2.00
Volume Injected/Volume Extracted
Figure 9. Results of Push-Pull Tests Conducted in September 2002 in OSU-2 and OSU-3.
Analysis of the push-pull tests using actual measured concentrations The analysis of the laboratory PAM push-pull tests indicated that analyzing the push-pull test results using actual measured radon concentration instead of normalized concentrations provides
30

a more sensitive means of evaluating responses. For conditions of generalized push-pull tests, model simulations were performed over a range of saturations using the STOMP numerical code. A complete description of these simulations is provided by Davis et al., (2005). Figure 10 shows results of simulations where PCE or TCE NAPL is uniformly distributed in an aquifer with different degrees of saturation. The simulations were performed to illustrate expected behavior and representative breakthrough curves of radon concentration response when it is not normalized. These general responses might be used in analyzing the results form the Dover tests.
For the simulation where Sn = 0%, radon concentrations reach 92.1% of their initial value at the well. In contrast, for the simulation where Sn = 15.25%, radon concentrations reach 86.3% of their initial value at the well, and concentrations are greatly reduced as a results of NAPL partitioning. This percentage decrease is due to retardation of the radon BTC as Sn increases (Schroth et al., 2000). Radon BTCs show the greatest sensitivity at small values of Sn, which is due to the non-linear relationship between Sn and the initial radon concentration (Figure 10).
200
150
100
50
0 0.0 0.5 1.0 1.5 2.0
Sn= 0 %, R = 1 Sn= 1.96 %. R = 2 Sn= 5.66 %, R = 4 Sn= 9.09 %. R = 6 Sn= 12.28 %, R = 8 Sn= 15.25 %, R = 10
Cw
,n (p
Ci/L
)
Ve/Vi
Figure 10. Simulated Radon Breakthrough Curves During the Extraction Phases of Six Push-Pull Tests with Homogeneous NAPL Saturations.
(Sn = 0 to 15.25% for r ≤500 cm)
Figure 11 shows the combined results of the April and September 2002 tests for well OSU-2 plotted in a form similar to the modeling analysis shown in Figure 10. The bromide results indicate fairly reproducible transport conditions in the two tests. Radon was more retarded and the maximum concentrations are lower in the April tests. Radon transport in the September tests is behaving more like bromide, although there still may be some retardation. The response of radon indicates that NAPL saturation decreased from April to September as a result of the initiation of flow conditions. The shape of the response curves are similar to those of the numerical simulations shown in Figure 10. The results would indicate that the NAPL saturation in April was in the range of 2%, if homogeneous NAPL saturations existed.
31

The push-pull test results for OSU-3, shown in Figure 12, are similar to those observed in the OSU-2 well. Br concentration breakthrough curves are very reproducible between the tests and show similar transport conditions during the tests. The radon response is shown to be more retarded in the April test, and the maximum concentration achieved was also lower. Radon concentration increases are less retarded in the September test. Like the OSU-2 well tests, the tests in OSU-3 are similar in shape to the simulated responses shown in Figure 4.13 (Final Report). The result indicates a NAPL saturation of around 2%, if a uniform distribution of NAPL existed, as was used in the simulations shown in Figure 10.
Push-Pull Tests in Well OSU 2 Under Flow Conditions 18.5 – 21.5 ft April 2002 and 19.5 – 22.5 ft September 2002
0
50
100
150
200
250
300
350
0.0 0.2 0.4 0.6 0.8 1.0 1.2 1.4 1.6 1.8 2.0
Volume Extracted/Volume Injected
R a d
o n (p
C i/L
)
0.0 0.1 0.2 0.3 0.4 0.5 0.6 0.7 0.8 0.9 1.0
B ro
m id
e N
o rm
a liz
ed
Radon April 2002 Radon Sep 2002 Bromide April 2002 Bromide Sep 2002
Figure 11. Comparison of Push-Pull Tests Conducted in April 2002 and September 2002 in Well OSU-2.
The results from the April and September tests appear to provide stronger evidence that NAPL presence decreased with continuous groundwater flow through the test cell over a 6-month period. The method of plotting actual radon concentrations, presented in Figure 11 and 12, compared to normalized concentrations, appears to be a more sensitive means of analyzing the results. The results also do not require determining the correct background concentration to normalize the measured Rn concentrations.
The amount of groundwater that was flushed through the test cell was likely not enough to dissolve the emplaced NAPL. A more likely scenario is that the NAPL became mobilized with the initiation of flow in the test cell.
32
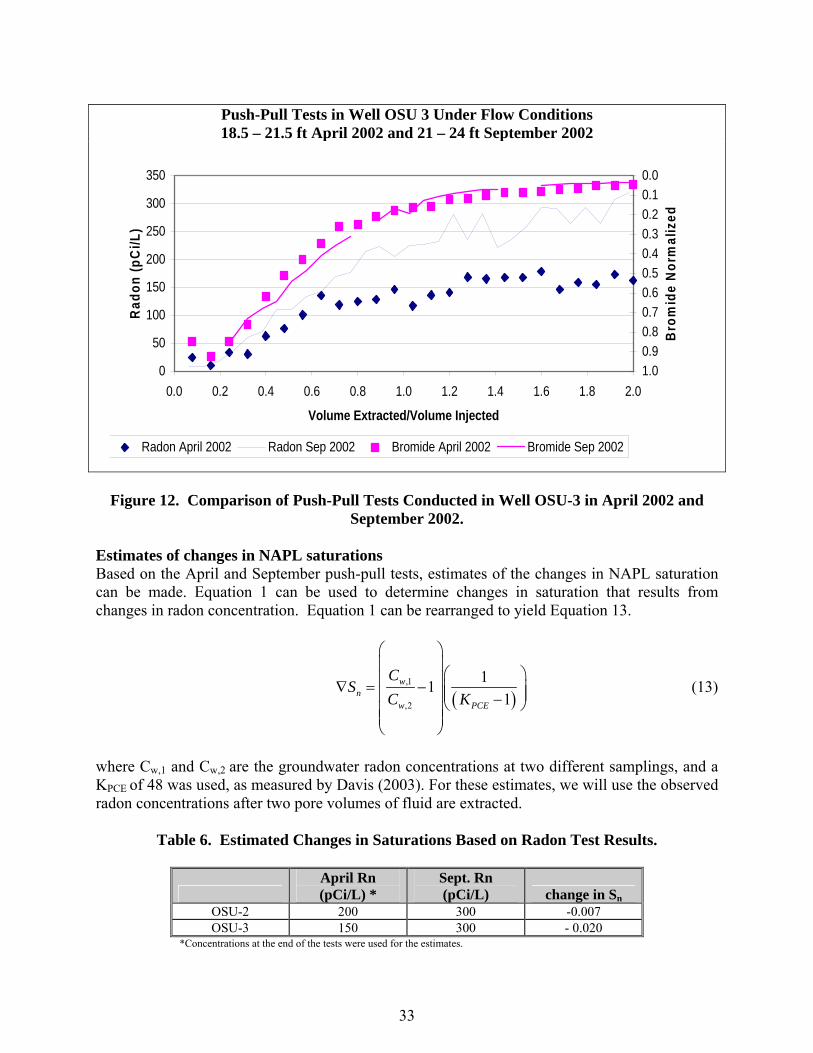
Push-Pull Tests in Well OSU 3 Under Flow Conditions 18.5 – 21.5 ft April 2002 and 21 – 24 ft September 2002
0
50
100
150
200
250
300
350
0.0 0.2 0.4 0.6 0.8 1.0 1.2 1.4 1.6 1.8 2.0
Volume Extracted/Volume Injected
Rad
on (p
Ci/L
)
0.0 0.1 0.2 0.3 0.4 0.5 0.6 0.7 0.8 0.9 1.0
B ro
m id
e N
orm
aliz
ed
Radon April 2002 Radon Sep 2002 Bromide April 2002 Bromide Sep 2002
Figure 12. Comparison of Push-Pull Tests Conducted in Well OSU-3 in April 2002 and September 2002.
Estimates of changes in NAPL saturations Based on the April and September push-pull tests, estimates of the changes in NAPL saturation can be made. Equation 1 can be used to determine changes in saturation that results from changes in radon concentration. Equation 1 can be rearranged to yield Equation 13.
⎛ ⎞ ⎜ ⎟C ⎛ 1 ⎞⎜ w,1 ⎟S 1 (13)∇ =n ⎜ − ⎟⎜⎜ ⎟⎟C K −1⎜ w,2 ⎟⎝
( PCE ) ⎠ ⎜ ⎟⎝ ⎠
where Cw,1 and Cw,2 are the groundwater radon concentrations at two different samplings, and a KPCE of 48 was used, as measured by Davis (2003). For these estimates, we will use the observed radon concentrations after two pore volumes of fluid are extracted.
Table 6. Estimated Changes in Saturations Based on Radon Test Results.
April Rn (pCi/L) *
Sept. Rn (pCi/L) change in Sn
OSU-2 200 300 -0.007 OSU-3 150 300 - 0.020
*Concentrations at the end of the tests were used for the estimates.
33

22-M
ar-02
05-A
pr-02
19-A
pr-02
03-M
ay-02
17-M
ay-02
31-M
ay-02
14-Ju
n-02
28-Ju
n-02
12-Ju
l-02
26-Ju
l-02
09-A
ug-02
23-A
ug-02
06-S
ep-02
20-S
ep-02
The results of the analysis are provided in Table 6. Based on the increases in radon concentration, a decrease in saturation of about 0.007 (0.7%) and 0.02 (2%) was predicted. The results are consistent with decreases in retardation, shown in Figures 11 and 12, and the results of model simulations shown in Figure 10.
Static Tests Results Long-term monitoring of radon concentrations in groundwater samples from OSU-2 and OSU-3 were performed using two multilevel samplers. These multilevel samplers were capable of sampling three different depth intervals: 17-20, 23-26, and 29-32 ft below grade. These two wells are parallel with the flow direction in the test cell, with well OSU-2 located upgradient from well OSU-3.
Results from the surveys at OSU-2 from March 2002 through September 2002 are shown in Figure 13 after flow was initiated in the test cell. Increases in radon concentration were observed at all locations, with most of the increases occurring from July to September. No data were collected May through June since the packer system failed as a result of PCE dissolving some of the packer's plastic fittings. A new packer system was installed at the same depth intervals for the later monitoring. The greatest increases were observed at the 24.5-ft and the 30.5-ft depth intervals.
Well OSU 2 Radon Concentration versus Time at Midpoint of 3-ft Sampling Intervals
Under Flow Conditions
0
50
100
150
200
250
300
350
Rn
(pC
i/L) 18.5'
24.5'
30.5'
Time (d)
Figure 13. Groundwater Radon Concentrations in OSU-2 at Three Depth Intervals from Weekly Monitoring Events.
Similar increases in radon concentrations were observed at all three depth intervals in OSU-3 between July and September (Figure 14). The greatest increases again occurred at the 24.5-ft and the 30.5-ft depth intervals.
34
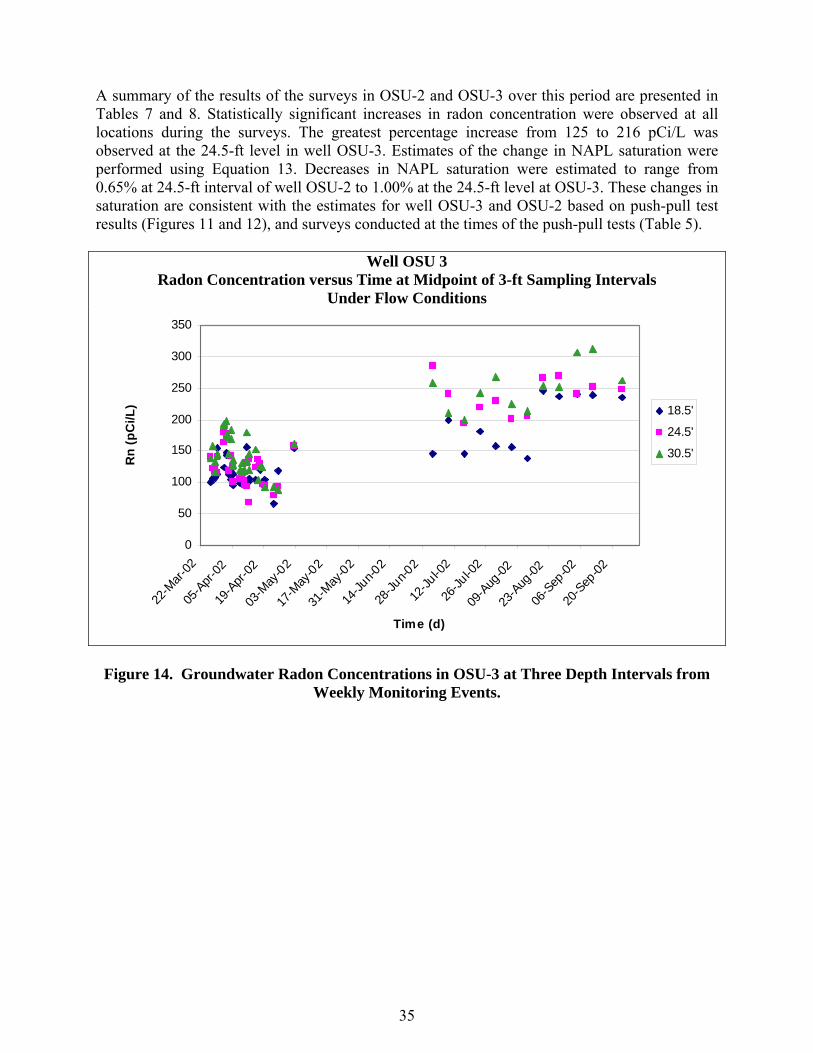
22-M
ar-02
05-A
pr-02
19-A
pr-02
03-M
ay-02
17-M
ay-02
31-M
ay-02
14-Ju
n-02
28-Ju
n-02
12-Ju
l-02
26-Ju
l-02
09-A
ug-02
23-A
ug-02
06-S
ep-02
20-S
ep-02
A summary of the results of the surveys in OSU-2 and OSU-3 over this period are presented in Tables 7 and 8. Statistically significant increases in radon concentration were observed at all locations during the surveys. The greatest percentage increase from 125 to 216 pCi/L was observed at the 24.5-ft level in well OSU-3. Estimates of the change in NAPL saturation were performed using Equation 13. Decreases in NAPL saturation were estimated to range from 0.65% at 24.5-ft interval of well OSU-2 to 1.00% at the 24.5-ft level at OSU-3. These changes in saturation are consistent with the estimates for well OSU-3 and OSU-2 based on push-pull test results (Figures 11 and 12), and surveys conducted at the times of the push-pull tests (Table 5).
Well OSU 3 Radon Concentration versus Time at Midpoint of 3-ft Sampling Intervals
Under Flow Conditions
0
50
100
150
200
250
300
350
Time (d)
Rn
(pC
i/L) 18.5'
24.5'
30.5'
Figure 14. Groundwater Radon Concentrations in OSU-3 at Three Depth Intervals from Weekly Monitoring Events.
35

Table 7. Summary of Radon Survey in Well OSU-2 and Estimated Changes in Saturation Based on Equation 13.
Well OSU 2 18.5 ft 24.5 ft 30.5 ft Spring 2002 Mean 142.8 170.2 164.5 Standard Deviation 26.0 27.5 38 Summer/Fall 2002 Mean 215.5 245.6 254 Standard Deviation 38.9 36.7 38.6 Calculated Student's t Value 7.12 7.34 6.91 99% t Value 2.7 2.7 2.7 Change in PCE Saturation -0.71% -0.65% -0.74%
Table 8. Summary of Radon Survey in Well OSU-3 and Estimated Changes in Saturation Based on Equation 13.
Well OSU 3 18.5 ft 24.5 ft 30.5 ft Spring 2002 Mean 115.9 124.7 142.8 Standard Deviation 21.0 27.8 29.6 Summer/Fall 2002 Mean 193.4 237.4 249.9 Standard Deviation 44.0 29.1 35.6 Calculated Student's t Value 8.16 12.04 10.33 99% t Value 2.69 2.69 2.69 Change in PCE Saturation -0.85% -1.00% -0.90%
The results indicate that the rapid increase in radon concentration observed around August 2002 may have been associated with the movement of NAPL in the test cell in response to the initiation of groundwater flow through the test cell. The radon results indicate that low residual saturations of PCE were likely present. This result is consistent with PCE monitoring results, which show PCE concentrations below the solubility limit that existed in the test cell.
5.3 SUMMARY OF RESULTS FOR THE DNTS STUDY
The results from the Dover test cell illustrate some of the complications of using the radon method at the field scale for detecting and monitoring NAPL remediation. Variations in background radon concentrations were observed that must be considered in evaluating radon concentration distribution. These spatial variations in radon concentration could potentially mask the decreases in radon concentration that can result from the presence of NAPL.
Temporal changes in radon concentration at specific locations are a more effective means of using radon as a natural tracer and might be used as one measure of how NAPL remediation is progressing. In the Dover test cell, radon concentrations were measured before and after PCE was added as a dense nonaqueous phase liquid (DNAPL). In general Rn concentration decreased after PCE was added, but at several locations Rn concentration increased, which cannot be easily explained.
Push-pull tests proved difficult to interpret, and convincing evidence for retarded transport was obtained only in a few tests. Graphing the measured radon concentration instead of normalized
36

concentrations provided for better means of interpreting test results. A series of push-pull tests, conducted after groundwater flow was initiated, showed an increase in background radon concentration and a decrease in retardation consistent with the response that is expected when NAPL saturations are decreasing.
The long-term monitoring indicated that radon concentration increased at three different depth intervals in two wells that surrounded the area were NAPL was released. The increases occurred abruptly over a period of about of about 2 months after groundwater flow was initiated in the test cell. The results indicate the NAPL PCE may have moved during this time period.
The results from spatial radon monitoring and push-pull tests indicate the NAPL saturation was low in the test cell, in the range of 2% or less. This low amount of saturation appears to be near the detection limit of the radon method. Thus it is difficult to draw strong conclusions from the different radon tests that were performed. Studies should be repeated in a field setting were higher NAPL saturations are present.
The sensitivity of the radon method strongly depends on the partition coefficient for partitioning of radon into the NAPL phase. As shown in Figure 1, for a partition coefficient for TCE and PCE in the range of 50, a 1% NAPL saturation would decrease radon concentrations by about 30% from background levels. To increase the sensitivity, we need to verify that such changes on radon concentration have occurred. This might be accomplished by processing larger size groundwater to establish higher counting rates and to make measurements in triplicate, and use mean values of triplicate measurements. However, obtaining a larger sample may be a drawback because at many locations acquiring large volumes of groundwater may be difficult. Also the processing of the larger sample volumes would require a nonstandard analytical method for radon analysis.
Obtaining groundwater samples over more discrete depth intervals would help prevent mixing groundwater for zones with no NAPL that can have high radon concentration with those from NAPL zones that are depleted in radon concentrations.
5.4 DATA ASSESSMENT
The data collected under controlled laboratory conditions in the PAMs showed increased retardation of radon in push-pull tests conducted with TCE NAPL of around 2%. Numerical model simulations were in agreement with results from the PAM tests (Figure 7).
Results from the DNTS test cell were much more difficult to interpret. Spatial variations in radon concentration were observed in the absence of the NAPL release as a result of geologic variations. The results for the spatial survey are consistent with measured variations for radon emanation of core materials obtained from the test cell.
Temporal changes in radon concentration at specific depth interval after PCE was added to the test cell were observed, as well as both increases and decreases in radon concentration (Table 5). While decreases in radon concentration are expected due to partitioning into the NAPL, increases are more difficult to explain. Radon is volatile and can be lost during sampling. It is possible that in early tests low radon concentrations were measured due to losses during sampling. Concentration then increased in later tests. It is also possible that the packer isolating the depth
37
interval was not working correctly and the groundwater that was sampled came from different depths. The results demonstrate the care that must be taken when sampling for radon.
The temporal monitoring at specific locations was the simplest method to apply and gave as much information as the more complicated push-pull tests. Radon concentration increased as remediation proceeded, which was consistent with the expected response. The changes in radon concentration indicated that NAPL saturations were low in the test cell in the range of 2% or less. This level of saturation appears to be in the range of the detection limit of the method.
5.5 TECHNOLOGY COMPARISON
There are numerous approaches to use for NAPL source zone assessments, and comparisons to the different technologies are beyond the scope of this work. The National Research Council (NRC) study of “Contaminants in the Subsurface: Source Zone Assessment and Remediation” (2004) provides a review of different technologies that are employed for source zone assessment. More than 16 assessment methods are listed and discussed. Kram et al., (2001; 2002) compare about 18 different technologies, with the radon method being one of the technologies evaluated. The radon method differs significantly from all the methods discussed since it is a natural tracer method. The most closely related test was a partitioning tracer test, where a tracer or suit of tracers is added to the subsurface and their transport breakthrough is monitored in monitoring wells. The most common form of the test is the partitioning interwell tracer test (PITT) for estimating the mass and distribution of DNAPL over volumes larger than those achieved by soil sampling. The NCR reports that this method has been applied successfully to more than 50 sites.
The PITT method involves the use of, for example, hydrophobic chemicals, such as higher-weight alcohols as partitioning tracers, which are injected through the contaminated zone along with a conservative tracer. Partitioning tracer transport is retarded compared to the conservative tracer, and the degree of retardation can be used to determine NAPL saturation. Kram et al., (2002) rated the PITT test as the most expensive test to perform, followed by the radon test method. Part of the higher costs for these tests was associated with the installation of wells needed to conduct the tests. The cost estimates also included using other screening methods for NAPL contamination prior to conducting the radon tests.
The radon method, being a natural tracer, is shown to have some advantages over the PITT method, and thus addition is not required. This results in a lower cost, especially when the static monitoring method is being applied. The radon method, however, is limited to a single partition coefficient, and is more subject to dilution effects. Due to radon’s half-life of 3.83 days, sampling wells must be very close to the area of NAPL contamination. Table 9 is a comparison of the PITT tests and the radon test method.
38

Table 9. Comparison of PITT Tests to Radon Method Test. (+=less of an advantage; +++= more of an advantage)
PITT Rank Radon Method Rank Injection of a partitioning tracer required + Injection of partitioning tracer not required +++ Interwell tests can be performed +++ Interwell test can be performed but residence
time of < 2 days +
Push-pull tests can be performed +++ Push-pull tests can be performed +++ Several tracers can be added with different partition coefficients
+++ Radon has a fixed partition coefficient +
Mass transfer issues must be resolved + Mass transfer less of an issue with radon partitioned into the NAPL
+++
Dilution effects less of a problem +++ Dilution effects more of a problem + Aquifer heterogeneities less of an issue +++ Aquifer heterogeneities more of an issue + Samples a larger volume of aquifer +++ Samples a smaller volume of aquifer + Temporal monitoring of the tracer required + Continuous monitoring of radon not required +++ Higher cost + Lower cost ++ Usually conducted at a single location + Can be conducted at multiple locations ++ More amendable to modeling ++ Less amenable to modeling +
39

This page left blank intentionally.
40

6.0 COST ASSESSMENT
Implementation costs for the test at DNTS are shown in Table 10. The total cost was $237,300, with the fixed cost ($50,000) representing 21% of the total cost, while the variable costs were $187,300 representing 79%. Forty percent of the fixed costs were associated with mobilization and demobilization, 24% for planning and preparation, and 36% for start-up and equipment costs. For the variable costs, the labor for conducting the field tests represented 11%, travel 6%, rentals and consumables 3%, analytical 66%, and data analysis and report writing 14%. A major cost was the analytical costs, which represented about 52% of the total cost. The analytical costs and the number of samples are provided in the footnote. Groundwater radon analysis costs were based on several vendor price quotes found in a Web search. Costs for PCE and bromide analysis were based on a price quote from a local analytical laboratory for single compound analysis for these compounds. The costs are based on the long-term monitoring that included the push-pull test analysis.
Several scenarios have been determined for using commercial vendor cost analysis. These are presented in Tables 11, 12, and 13. The cost analysis presented in Table 11 is based on a site where quarterly monitoring analysis is performed over a 3-year period where 12 locations are selected for long-term radon monitoring. The case represents the monitoring of a NAPL remediation project. Triplicate samples are analyzed for radon analysis and singlet samples for Chlorinated Aliphatic Hydrocarbons (CAH) analysis. For these long-term monitoring tests, the estimated total cost is $113,800, or 100% lower than OSU costs. The fixed cost ($41,500) represents 37% of the total cost, while the variable costs ($71,780) represent 63%. A significant reduction in cost was achieved by eliminating the push-pull tests and monitoring on a quarterly basis. The fixed costs are reduced from $50,000 (OSU) to $41,500 (vendor). In addition, equipment costs such as peristaltic pumps, packers, and carboys are approximately $10,000. The fixed costs of mobilization and demobilization as well as planning and preparation result in the only 20% reduction in capital costs of the vendor estimates compared to the OSU study. A large difference in the costs between the OSU and the vendor is a reduction in analytical costs with the elimination of the push-pull tests, as well as performing quarterly monitoring, which was much less frequent than the OSU sampling, which was performed weekly. Triplicate quarterly radon samples were replaced by singlet weekly samples in the OSU study. The analytical costs in Table 11 represent 30% of the variable costs compared to 66% for the case presented in Table 10.
Table 12 presents an analysis for a smaller site than that given in Table 11 but having the same quarterly monitoring program. For this site, the sampling locations have been reduced to six, compared to 12 locations presented in Table 11. The total cost was reduced to $80,610 compared to $113,280, or about a 30% reduction. Thus a 50% reduction in the sample locations results in only a 30% reduction in costs because there is only a 15% reduction in the capital costs. The main saving of about 37% results from lower testing and analytical costs. The fixed cost ($35,750) represents 44% of the total cost, while the variable costs ($44,860) represent 54%. The analysis indicates that as the number of monitoring locations is reduced the fixed cost percent of the total cost increases.
41

Table 10. Implementation Costs for the Test at DNTS.
Cost Category Subcategory Costs Fixed Costs Capital costs Mobilization/demobilization $10,000
Planning/preparationa $10,000 Site investigation and testingb
- Field work preparation - Other
$5,000 $2,000
Equipment cost - Peristaltic pumps - Packer systems
$2,500 $3,000
Start-up and Testing $5,000 Other - Carboys, tubing - Chemicals, gas supplies - Sampling vials, labels
$4,500 $5,000 $3,000
Subtotal $50,000 Variable Costs Testing, analytical, and reporting costs
Labor - Field personnelc
- Traveld
- Lodginge
$ 20,000 $6,000 $5,000
Materials and consumables $2,000 Utilities and fuel $1,000 Equipment rentals
- Trailer - Analytical tank rentals - Other rentals
$1,500 $1,000
$500 Performance testing/analysis
- Radon analysis (IC)f
- CAHs analyses (GC)g
- Bromideh
- Data analysisi
- Report preparationj
- Other
$66,000 $37,500 $35,000 $15,500 $10,500
Other direct costs $800 Subtotal: $202,300
TOTAL COSTS: $252,300 Unit cost: $252,300
a Planning/preparation: 118 hr @ $85/hr for environmental engineer b Field work preparation and other: 156 hr @ $45/hr for technician c Field personnel: 444 hr @ $45/hr for technician d Travel: 10 trips @ 600/trip e Lodging: 10 trips @ 500/trip f Cost of radon analysis: $22/sample (3,000 samples analyzed in the study) gCost of CAH analysis: $75/sample (500 samples analyzed during the study)hCost of Br analysis: $35/sample (1,000 samples analyzed in the study) iData analysis 176 hr @ $85/hr for environmental engineer jReport preparation: 124 hr @ $85/hr for environmental engineer
42

Table 11. Estimated Demonstration Costs by Commercial Vendor. (Long-Term Quarterly Monitoring for 3 Years at 12 Sample Locations at the Site).
Cost Category Subcategory DNTS Costs
Capital costs Mobilization/demobilization $10,000 Planning/preparationa $10,000 Site investigation and testingb
- Field work preparation - Other
$5,000 $2,000
Equipment cost Peristaltic pumps Packer systems
$2,500 $3,000
Start-up and testing $5,000 Other - Carboys, tubing - Chemicals, gas supplies - Sampling vials, labels
$2,500 $0,000 $1,500
Subtotal $41,500 Testing, analytical, and reporting costs
Labor - Field personnelc
- Traveld
- Lodginge
$17,280 $7,200 $6,000
Materials and consumables $2,000 Utilities and fuel $1,000 Equipment rentals
- Trailer - Analytical tank rentals - Other rentals
$ 0,00 $1,000
$500 Performance testing/analysis
- Radon analysisf
- CAHs analysesg
- Data analysesh
- Report preparationi
- Other
$10,000 $11,400
$5,000 $ 7,500 $2,500
Other direct costs $400 Subtotal: $71,780
TOTAL COSTS: $113,280 Unit cost: $113,280
a Planning/preparation: 118 hr @ $85/hr for environmental engineer b Field work preparation and other: 156 hr @ $45/hr for technician c Field personnel: 444 hr @ $45/hr for technician d Travel: 10 trips @ 600/trip e Lodging: 10 trips @ 500/trip f Cost of radon analysis: $22/sample (3,000 samples analyzed in the study) gCost of CAH analysis: $75/sample (500 samples analyzed during the study)hCost of Br analysis: $35/sample (1,000 samples analyzed in the study) iData analysis 176 hr @ $85/hr for environmental engineer jReport preparation: 124 hr @ $85/hr for environmental engineer
43
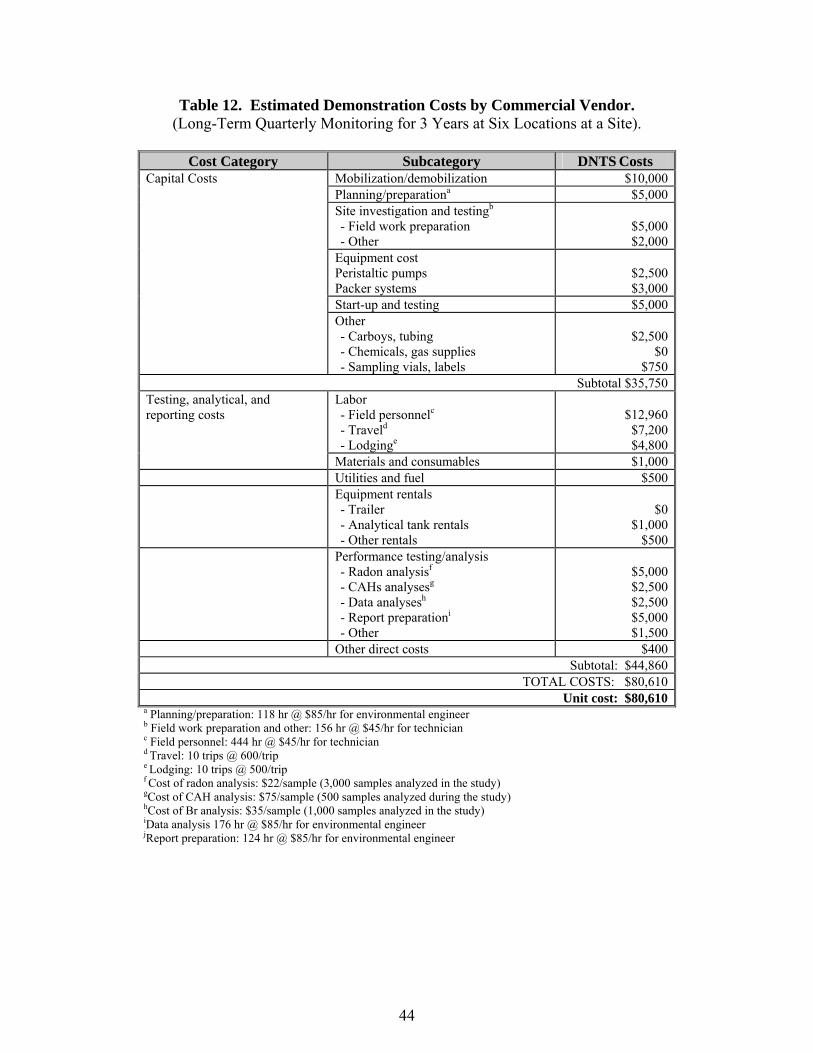
Table 12. Estimated Demonstration Costs by Commercial Vendor. (Long-Term Quarterly Monitoring for 3 Years at Six Locations at a Site).
Cost Category Subcategory DNTS Costs Capital Costs Mobilization/demobilization $10,000
Planning/preparationa $5,000 Site investigation and testingb
- Field work preparation - Other
$5,000 $2,000
Equipment cost Peristaltic pumps Packer systems
$2,500 $3,000
Start-up and testing $5,000 Other - Carboys, tubing - Chemicals, gas supplies - Sampling vials, labels
$2,500 $0
$750 Subtotal $35,750
Testing, analytical, and reporting costs
Labor - Field personnelc
- Traveld
- Lodginge
$12,960 $7,200 $4,800
Materials and consumables $1,000 Utilities and fuel $500 Equipment rentals
- Trailer - Analytical tank rentals - Other rentals
$0 $1,000
$500 Performance testing/analysis
- Radon analysisf
- CAHs analysesg
- Data analysesh
- Report preparationi
- Other
$5,000 $2,500 $2,500 $5,000 $1,500
Other direct costs $400 Subtotal: $44,860
TOTAL COSTS: $80,610 Unit cost: $80,610
a Planning/preparation: 118 hr @ $85/hr for environmental engineer b Field work preparation and other: 156 hr @ $45/hr for technician c Field personnel: 444 hr @ $45/hr for technician d Travel: 10 trips @ 600/trip e Lodging: 10 trips @ 500/trip f Cost of radon analysis: $22/sample (3,000 samples analyzed in the study) gCost of CAH analysis: $75/sample (500 samples analyzed during the study)hCost of Br analysis: $35/sample (1,000 samples analyzed in the study) iData analysis 176 hr @ $85/hr for environmental engineer jReport preparation: 124 hr @ $85/hr for environmental engineer
44

Table 13 presents the same quarterly scenario as presented in Table 11, but included now are yearly push-pull tests at each of the 12 test locations, so the cost of conducting 36 push-pull tests is now included. The approach here would be to perform push-pull tests at the beginning, during, and at the end of a NAPL remediation project. This scenario would provide the additional information for estimating the change in saturation using the change in retardation factors as remediation proceeds. The addition of the push-pull tests added about 600 radon and 600 bromide samples to be analyzed, including some duplicates and background samples. There were about 12 samples per test. In order to include the push-pull tests along with the quarterly monitoring, the total cost would increase from $113,280 (Table 11) to 171,210 (Table 13) per site. The main increase would occur in the testing and analytical, from $71,780 to $128,208. The cost analysis is based on reducing the number of samples taken during a push-pull test from 25 used on the OSU tests to 12 in the vendor tests. We believed that precise breakthrough curves can be obtained with 12 samples. The cost analysis also assumed that the push-pull tests would be conducted during site trips for quarterly monitoring. The duration of the trips would be extended to permit the push-pull tests to be performed. For this case, the direct costs were 25% of the total cost, again showing the trend that as the total cost increases, the variable costs become a great percentage of the total costs.
In all the cases, mobilization and demobilization, and site planning and preparation are fixed costs that do not change much from case to case. These costs may be reduced once a vendor has experience using the radon method at a number of different sites. Other fixed costs include equipment costs. Savings could be realized in equipment costs by using the same equipment at several sites with only the cost for maintenance. Purchase of equipment requires a large initial investment, but long-term savings are realized over time as the equipment is used at all the sites. The major variable costs include labor of the technician doing the sampling, travel cost, the analytical costs for radon, CAH, and br analysis, and for data analysis and reporting. Analytical costs tend to increase directly with the number of samples analyzed. Travel costs, especially for the distance sites, were significant (about 10% of the variable costs), assuming the technician needs to travel out of state, e.g., to the DNTS site, or if equipment has to be hauled back and forth if no storage is established at the site, e.g., at the Fort Lewis site, which is closer to OSU and where we have done field work for much lower cost. Costs could also reduced in practice if local on-site personnel are used and if travel and shipping costs can be reduced. The labor costs and analytical costs will scale with the number of observation locations for the monitoring approach and the number of push-pull tests performed. Data analysis costs and report preparation costs may be reduced once a vendor has experience analyzing the data and developing reports on the findings.
Estimation of cost saving to DoD using the radon method of DNAPL detection is difficult to determine based on the many different potential characterization methods available, the type of applications it is used for, and specifics of the individual sites. Kram et al., (2002) did an independent cost evaluation of nine different methods used to detect and delineate DNAPL, including the radon method. Their estimates for using the radon method, although based on different assumptions than ours, were similar to ours and ranged from $70,870 to $104,425 per site. Their baseline approach, which required collecting core samples through drilling and chemical analysis, ranged from $46,160 to $59,440 per site. In order for fair
45

Table 13. Estimated Demonstration Costs by Commercial Vendor. (Long-Term Quarterly Monitoring for 3 Years at 12 Sample Locations at a Site, Plus Yearly
Push-Pull Tests at Each Location).
Cost Category Subcategory DNTS Costs Capital costs Mobilization/demobilization $10,000
Planning/preparationa $10,000 Site investigation and testingb
- Field work preparation - Other
$5,000 $2,000
Equipment cost - Peristaltic pumps - Packer systems
$2,500 $3,000
Start-up and testing $5,000 Other - Carboys, tubing - Chemicals, gas supplies - Sampling vials, labels
$2,500 $1,500 $1,500
Subtotal $43,000 Testing, analytical, and reporting costs
Labor - Field personnelc
- Traveld
- Lodginge
$25,920 $7,200 $9,600
Materials and consumables $4,000 Utilities and fuel $2,000 Equipment rentals
- Trailer - Analytical tank rentals - Other rentals
$1,500 $1,000
$500 Performance testing/analysis
- Radon analysisf
- CAHs analysesg
- Br analysish
Data analysesi
- Report preparationj
- Other
$23,188 $11,400 $21,000 $ 9,000 $ 9,000 $2,500
Other direct costs $400 Subtotal: $128,208
TOTAL COSTS: $171,208 Unit cost: $171,208
a Planning/preparation: 118 hr @ $85/hr for environmental engineer b Field work preparation and other: 156 hr @ $45/hr for technician c Field personnel: 444 hr @ $45/hr for technician d Travel: 10 trips @ 600/trip e Lodging: 10 trips @ 500/trip f Cost of radon analysis: $22/sample (3,000 samples analyzed in the study) gCost of CAH analysis: $75/sample (500 samples analyzed during the study)hCost of Br analysis: $35/sample (1,000 samples analyzed in the study) iData analysis 176 hr @ $85/hr for environmental engineer jReport preparation: 124 hr @ $85/hr for environmental engineer
46

comparisons for the different methods, they assumed that the sites being investigated had no wells for sampling, and thus if a characterization method needed wells, as the radon method does, the cost of well installation was included in the estimates. Thus, if appropriate wells for sampling already existed at a site the radon method costs would be lower.
6.1 COMPARISON OF COSTS WITH THE PITT METHOD
A cost comparison was made of Kram et al., (2001; 2002) of 18 different technologies for detecting and quantifying NAPL contamination, including a comparison of the radon method and PITT. The radon method was based on radon surveys, while the PITTs analysis involved the injection of tracers in an interwell tracer test. For their analysis the cost of the PITT tests for three different scenarios ranges from 38% to 60% higher.
Based on the analysis of Kram et al., (2001; 2002), an evaluation was made of the cost for the radon survey method and the PITT method. Kram et al. indicated that both the radon method and the PITT method require higher pretest costs. The PITT method costs are higher than the radon costs since analysis must be performed to determine which partitioning tracers to use. The PITT method also requires conducting well-to-well tracer tests, thus additional wells will likely be required for these tests. There will also be additional costs associated with pumps and packers and on-site materials to conduct these tests. Table 14 provides some estimates of the cost of PITT for a site, that is the same as the conditions given in Table 12 using the radon survey method. In comparing Table 14 to 12, the capital costs were found to be higher for the PITTs— $53,759 compared $35,750 for the radon surveys. This results from the more detailed pretesting required in the PITTs, and the increased costs associated with equipment to conduct well-to-well tracer tests. The testing of analytical and reporting costs were also higher for the PITTs— $68,200 compared to $44,860 for the radon surveys. The higher costs result because more time is required to complete well-to-well tracer tests (compared to surveys), and there are higher analytical, data analysis, and reporting costs for the PITTs compared to the radon surveys. The total costs were about 50% higher for the PITTs ($121,950) compared to the radon surveys ($80,610).
The radon method would become more expensive than the PITT method if push-pull-tests were also included, along with the radon surveys. The comparison here would be costs given in Tables 13 and 14. The total costs for the radon surveys along with push-pull-tests would be $171,820 compared to $121,950 for the PITTs, or about 40% higher. Thus the radon method would not likely be a good choice if push-pull-tests were being considered as well. The advantages of the PITTs, as presented in Table 9, would also need to be considered, along with the potentially higher costs of performing push-pull radon tests. The radon survey approach, (Table 12) would have a cost advantage over the PITT method and may be appropriate for some site-specific cases. When more information is available on NAPL saturation and changes in saturation occurring with remediation—which will justify the greater cost investment—the PITT method would likely be a better technology choice.
47

Table 14. Estimated Demonstration Costs by Commercial Vendor for PITT Tests.
Cost Category Subcategory DNTS Costs Capital costs Mobilization/demobilization $15,000
Planning/Preparationa $7,500 Site investigation and testingb
- Field work preparation - Other
$10,000 $2,000
Equipment cost Peristaltic pumps Packer systems
$3,500 $6,000
Start-up and testing $5,000 Other - Carboys, tubing - Chemicals, gas supplies - Sampling vials, labels
$3,500 $0
$1, 250 Subtotal $53,750
2. Testing, analytical, and reporting costs
Labor - Field personnelc
- Traveld
- Lodginge
$18,900 $7,200 $9,600
Materials and consumables $3,000 Utilities and fuel $1,000 Equipment rentals
- Trailer - Analytical tank rentals - Other rentals
$0 $2,000 $1,000
Performance testing/analysis - PartitioningTracer analysisf
- ConsevativeTracer analysesg
- Data analysesh
- Report preparationi
- Other
$12,000 $2,500
$5,000 $5,000
Other direct costs $1,000 Subtotal: $68,200
TOTAL COSTS: $121,950 Unit cost: $121,950
a Planning/preparation: 118 hr @ $85/hr for environmental engineer b Field work preparation and other: 156 hr @ $45/hr for technician c Field personnel: 444 hr @ $45/hr for technician d Travel: 10 trips @ 600/trip e Lodging: 10 trips @ 500/trip f Cost of radon analysis: $22/sample (3,000 samples analyzed in the study) gCost of CAH analysis: $75/sample (500 samples analyzed during the study)hCost of Br analysis: $35/sample (1,000 samples analyzed in the study) iData analysis 176 hr @ $85/hr for environmental engineer jReport preparation: 124 hr @ $85/hr for environmental engineer
48

6.2 LIFE-CYCLE ANALYSIS
A life-cycle analysis was performed for the cost presented in Tables 11, 12, and 13. The cost of the 3 years of monitoring was discounted using present value (PV) of discounted cash flow analysis. For these estimates it was assumed that the capital costs all occurred during the first year of operation, and that the operation and maintenance (O&M) costs (testing, analytical, and report costs) were divided equally over the three years of monitoring. PV cost represents the amount of money that would have to be set aside today to cover the capital investment and the O&M costs occurring in the present and the future.
PVtechnology = Capital Costs + PVannual O&M costs over the life of the technology (14)
We assumed that the capital investment does not have to be discounted back to the present since this investment occurred immediately. The term PVannual O&M costs over the life of the technology, represents the annual O&M costs (saving realized) over several years of operation, adjusted for the time value of money. This calculation is done by dividing each year’s O&M costs by a factor that incorporates a discount rate (r) as shown in Equation 15. The discount rate incorporates the combined effects of inflation, risk, and productivity. The analysis accounts for any cost that is postponed into future years, frees up money for productive use and provides a return equation to the discount rate. The PVannual O&M costs can be determined using the following equation:
& cos t in Y ar tPVannual O&M costs = ∑O M e (15)(1+ r)t
Two discount rates were evaluated in the present value analysis: a discount rate of 4% to represent that for the federal government and a rate of 8% for private industry.
Table 14 represents the results of the PV analysis.
Unit Cost/Site PV Cost/Site (r = 0.04) PV Cost/Site (r = 0.08) Table 11 $ 113,280 $ 107,900 $ 103,160 Table 12 $ 80,610 $ 77,246 $ 74,285 Table 13 $171,208 $ 161,600 $ 153,130
Due to the short period of 3 years used in the analysis and the significant fraction of the costs that are capital in nature, the PV costs are reduced to about 96% to 89% of the costs provided in Tables 11 to 13.
49

This page left blank intentionally.

7.0 IMPLEMENTATION ISSUES
7.1 COST OBSERVATIONS
Certain factors that affected project costs were related to performing the study at DNTS sites. At DNTS, the depth of groundwater in sampling wells was about 40 ft, which did not require special pumps; only peristaltic pumps were required to conduct the temporal sampling and the push-pull tests. Monitoring wells at DNTS were provided, as well as logistical support, including personnel of the sampling for the long-term monitoring.
A big factor driving costs was conducting the push-pull tests at the site. These tests drive personnel cost as well as analytical costs, and it is not clear whether the information they provide justifies the additional cost. Much lower costs would be achieved by applying the static radon method to monitor the progress of site remediation of NAPL contamination. Temporal monitoring on a monthly basis would also result in a significant reduction in the cost of applying the method. For example the cost analysis provided in Table 11, where push-pull tests were eliminated, show about a 60% reduction compared to the OSU study that included push-pull tests. Not conducting the push-pull tests, however, would eliminate the information obtained on retardation. Thus an independent means of estimating saturation would be lost. Changes in radon concentration with time would be the only means of estimating changes in NAPL saturation. Temporal changes in radon concentration would be as sensitive as changes in retardation factors in estimating saturations. However, users would need to determine the benefits versus costs of conducting push-pull tests to provide an additional means for estimating saturation. Having two different radon methods to determine changes in NAPL saturation may in some cases be worth the additional costs.
Kram et al., (2002) estimated the cost of using the radon flux survey for a site using the radon method, as described by Semprini et al., (1998). The survey involved methods such as the static radon sampling described here and not push-pull tests. The screening approach includes collecting multidepth samples from 65- to 100 ft depth at five locations. Prior to radon sampling, a survey using the ribbon NAPL sampler FLUTe™ method was implemented during conventional drilling to help identify zones of NAPL contamination and to direct the radon survey. Confirmation included collection of analysis of six samples from two locations to a total depth of 75 ft. Five wells needed to be installed for the analysis. The cost per site including reporting was $80,000 to $110,000 using commercial vendors. This is in a similar range as the estimates for our study provided in Table 11.
The Kram et al., (2002) study also made estimates for the PITTs, and the cost ranged from $113,580 to $144,740, about 60% higher than the radon method. Tables 12 and 14 provide a comparison of the radon survey method, which is equivalent to the radon flux survey of Kram et al., (2002), and the PITT method, respectively. The radon survey method provides 50% lower costs. This, as discussed in Section 6.1, results from the higher capital costs associated with pretesting and the greater capital costs associated with performing well-to-well partitioning tracer tests. The higher cost of testing and reporting for the PITT method results from greater labor costs to conduct well-to-well tests, higher analytical costs, and higher data interpretation is reporting costs. However, if push-pull testing along with surveys are included with the radon method (Table 13), then the radon would become more expensive than the PITT method.
51

However, as indicated in Table 9, there are some advantages to the PITT method over the radon method, and thus the cost alone can not be the criteria for selecting one method over another. If the long-term monitoring approach using the radon method fits the needs for monitoring, then significant saving might be achieved compared to the PITT method. When more information is available on NAPL saturation and changes in saturation occurring with remediation—which will justify the greater cost investment—the PITT method would likely be a better choice of a technology.
7.2 PERFORMANCE OBSERVATIONS
This study evaluated using radon to try to locate NAPL saturation, quantify the amount of NAPL saturation emplaced, and monitor the progress of NAPL remediation. The types of approaches evaluated included monitoring spatial and temporal radon concentrations in groundwater, as well as more dynamic single-well push-pull tests. The method requires only simple components for groundwater sampling, such as pumps, to extract groundwater from the test wells, plastic tanks and carboys to hold prepared test solutions and standard groundwater sampling equipment. Temporal monitoring at selected special locations was fairly straightforward to employ, while push-pull tests required more expertise and are more complicated to interpret.
In the laboratory PAM, push-pull tests demonstrated that retardation in radon was observed as a result of NAPL being present. Results of numerical simulations showed the response observed could be well simulated with a NAPL saturation of about 1.8%, which was in reasonable agreement with 2%, the amount emplaced in the PAM.
The tests conducted in the DNTS site were less conclusive. Natural spatial variations in radon concentrations in groundwater from the test cell were observed, with concentration ranging by about an order of magnitude. Thus using spatial concentration of radon alone to local NAPL contamination would prove to be problematic. Observing temporal changes in concentrations at specific sampling locations normalizes for spatial variations in radon concentration, as long as the radon source term in the aquifer material does not change over time. The temporal sampling indicates radon concentration increased at some locations and decreased at others after NAPL PCE was added to the test cell. Concentrations were expected to decrease or remain constant as a result of NAPL addition. More important are the observations of changes in radon concentration as a result of remediation activities. Radon concentrations increased after groundwater flow was initiated in the test cell. The monitoring of radon groundwater concentrations at three depth intervals in two wells indicated that abrupt increases in radon concentration were observed, which is more consistent with NAPL movement than slow dissolution as a result of the remediation process that was being applied.
Push-pull tests permitted investigation of the presence of NAPL at specific depth intervals of wells. The tests proved difficult to perform and interpret. When normalizing concentrations to background concentrations, it was difficult to determine what represented a true background level. Radon concentrations at the end of the test were available for use for normalization procedures. Unfortunately, radon concentrations were usually not obtained at the depth level of the push-pull test prior to conducting the test. For push-pull tests conducted in April 2002 and September 2002, conditions of the tests were consistent enough for comparisons to be made among the tests. Groundwater flow was occurring in both tests, similar amounts of fluid were
52

injected and extracted, and the tests were performed at similar depth intervals. The analysis of the results from these tests, especially when the actual radon concentrations are compared, support decreased PCE NAPL saturations as remediation proceeded (Figures 11 and 12).
Unfortunately, the remediation study was still ongoing when the radon project ended. Independent measurements of core samples could not be obtained, as it would have disrupted the remediation study. Thus mapping of the NAPL presence using an independent method was not possible.
7.3 SCALE-UP
The field tests were performed at the scale at which they would be implemented in practice. Depth interval surveys over 3-ft depth intervals seem reasonable for field scale tests. Push-pull tests could be easily modified to inject more groundwater if probing larger radial distances were of interest. A limitation, however, is that the volume required increases with r2, thus probing greater radial distances required large volumes of water to be injected. Costs might be reduced by making radon survey part of a standard monitoring program since sampling by standard methods for volatile organics is required. Kram et al. (2002) provide costs and sampling for Rn-flux estimates for applying the method at the field scale.
7.4 LESSONS LEARNED
The long term monitoring approach and the depth interval surveys seem to provide as much, if not more, information than the push-pull tests. Obtaining more replicate samples throughout the course of the study would have been helpful as well as obtaining a complete history of PCE aqueous concentrations.
Methods to better determine if a packer was not working properly would have been useful. Several push-pull tests had low bromide recovery. Since, in the absence of NAPL, radon concentrations would be higher in the background groundwater, sampling of higher radon concentration water would dilute the signal of the reduced radon concentration as a result of NAPL being present. Thus a leaky packer would be problematic.
More efforts should have been put into determining background radon samples prior to conducting the push-pull tests. After the packer was set at the desired test interval a series of groundwater samples should have been collected for determining background radon concentrations. Basing background concentrations on the final samples collected in a push-pull tests assumed that background levels had been reached, which may not have been the case. Normalizing concentrations based on these samples affects the normalized breakthrough curves.
Push-pull tests should be conducted at specific depth intervals and not over the complete screened intervals of the wells. The potential of dilution of the tests by groundwater of higher radon concentration is more likely when tests are conducted over complete intervals. Once a depth likely containing NAPL has been identified, tests should also be repeated over the same depth intervals throughout the course of the study. This would permit comparisons in changes over time at specific locations.
53

The aqueous phase concentrations of PCE or TCE or other NAPLs of interest should have been monitored at the depth interval for the complete temporal history of the test. This would have permitted comparisons between changes in radon concentration with changes in PCE concentration.
The test cell at Dover had a limited amount of PCE added, about 100 liters. Calculation estimates indicate that this amount of PCE would contaminate a radial volume of about 0.8 m over the 10-m saturated thickness of the aquifer if a uniform NAPL saturation of 2% was achieved. The spacing between the OSU observation wells was 2 m. These calculations indicate that the amount of PCE released was fairly limited, and the amounts of NAPL estimated from the radon method were in the range of those expected from this very simple calculation. However, we had no control over the amount of PCE to be added to the test cell. The saturation of PCE that resulted was near the detection limit of the radon method.
Care must be taken when using the radon scintillation method if samples are colored or other interferences are present. We found that the scintillation method gave too low of values when iron was present. Iron had to be removed from the sample for accurate radon concentration to be achieved.
The radon test method appears to be most appropriately used to monitor the remediation of NAPL contamination. It would likely be more successfully applied where gross NAPL contamination is present and where a remediation method, such as six-phase heating, is being employed that removed large amounts of the NAPL phase. It was our objective to perform such a study in subsequent tests of this technology; however, funds to the project were terminated prior to those tests.
7.5 END-USER ISSUES
The method of measuring temporal changes in radon concentration over time appears to be the most straightforward application of this technology. Standard methods for groundwater sampling can be applied for sampling VOAs in groundwater. Commercial laboratories for radon analysis actually use standard VOA bottles for customers to collect groundwater samples for analysis. Radon concentrations measurements can therefore be performed by standard commercial laboratories. As discussed above, care must be taken to ensure the interfering compounds, such as iron, are not present in the sample.
A standard approach would be to determine radon and dissolved phase of the chlorinated solvent concentrations over specific depth intervals in monitoring wells. A 3-ft packed interval, as was used in this study, might be appropriate. Both sampling for radon and the dissolved phase of the chlorinated solvent would employ the same sampling methods. Decreases in the concentration of the chlorinated solvent and increases in radon would be expected if NAPL saturations were decreasing. The radon method is meant for use where gross contamination with chlorinated solvents is present. Concentration of the chlorinated solvent, for example, should be in the range of its solubility limit in water. If concentration of the chlorinated solvent is much lower than the solubility limit, then too much dilution of background groundwater is likely occurring to see a detectable reduction in radon concentration.
54

The method also works best if the NAPL is immobile and is not present in groundwater samples. The presence of a NAPL phase would complicate the analysis since radon that partitions into the NAPL would be in the sample. Users may consider using passive samplers that would result in sampling of only the dissolved phase.
Spatial measurements of radon concentrations alone is not a good approach for using this method because of likely heterogeneities in geology conditions that would cause radon concentration to vary. Monitoring temporal changes in concentration as remediation proceeds is a better use of the technology, since heterogeneities in geology would be less important.
Push-pull tests provide more detailed information than can be obtained from temporal sampling alone. If push-pull tests are employed, they should be performed over specific depth intervals and repeated at these depth intervals. Care must be taken in injecting radon free groundwater, and tests must be conducted over short time intervals so radon does not build-up in the injected groundwater. Bromide was an effective nonpartitioning tracer and should be applied in the tests. The radon method would be best employed while using other methods. For example, in the cost estimation calculations of Kram et al., (2002), they used the radon flux method in combination with the FLUTe™ ribbon sampling methods.
Based on the observations of our demonstration, estimation of changes in NAPL saturation of less that 1% would prove to be difficult using the radon method. Since the response is non- linear (see Figure 1) the method is more sensitive to changes in saturation a low levels of saturation (0 to 1%) than high levels (5% to 6%), for example. However, at very low levels of NAPL saturation (less than 0.5%), reliable detection of NAPL saturation and changes in NAPL saturation would not be achieved.
7.6 APPROACH AND REGULATORY COMPLIANCE AND ACCEPTANCE
The demonstration, although showing some promise for using the radon method, was not conclusive enough for an end user to seek regulatory compliance for it as a method to locate and quantify NAPL contamination. However, it is an easy method to implement and apply with other methods, such as monitoring the chlorinated solvents concentration in groundwater samples. The best use of the method would be as a monitoring method where changes in radon concentration in groundwater samples could be tracked over time as a means of monitoring the progress of remediation.
Future demonstrations should be directed to sites where gross NAPL contamination is present and concentrations of the solvents at specific locations are near the solubility limit in water. The most appropriate application of the technology would be for sites where large amounts of NAPL are being removed.
The radon method is a potentially useful tool to be employed for assessing the monitored natural attenuation (MNA) of chlorinated solvent DNAPL contamination. The monitoring- based radon method would only require obtaining temporal samples at specific locations, which fits well with protocols for MNA. Unlike partitioning tracers need not be added; thus disturbances to the MNA processes that might result from the injection of tracers would not occur using the radon method.
55

This page left blank intentionally.
56

8.0 REFERENCES
1. Annable, M.D., P.S.C. Rao, K. Hatfield, W.D. Graham, A.L. Wood, and C.G. Enfield, 1998. Partitioning tracers for measuring residual NAPL: field-scale test results. Journal of Environmental Engineering, 124:498-503.
2. Cantaloub, M., 2001. Aqueous-organic partition coefficients for radon-222 and their application to radon analysis by liquid scintillation methods. Master’s Thesis, Oregon State University.
3. Cohen, R.M. and J.W. Mercer, 1993. DNAPL Site Evaluation. CRC Press, Boca Raton, Florida.
4. Davis, .M., J.D. Istok, and L. Semprini, 2003. Push-pull partitioning tracer tests using radon-222 to quantify nonaqueous phase liquid contamination. J. of Contaminant Hydrology, Vol. 58, 129-146.
5. Davis, B.M, J.D. Istok, and L. Semprini, 2003. Static and push-pull methods using radon-222 to characterize dense nonaqueous phase liquid saturations. Ground Water Vol. 41, 470-481.
6. Davis, B.M., 2003. Radon-222 as an In Situ Partitioning Tracer for Quantifying Nonaqueous Phase Liquid (NAPL) Saturations in the Subsurface. Ph.D. Thesis, Oregon State University.
7. Davis, B.M. J.D. Istok and L. Semprini, 2005. Numerical simulations of radon as an in situ partitioning tracer for quantifying napl contamination using push-pull tests. Journal of Contaminant Hydrology, Vol. 78:87-103.
8. Dwarakanath, V., N. Deeds, and G.A. Pope, 1999. Analysis of partitioning interwell tracer tests. Environmental Science and Technology, 33:3829-3836.
9. Hopkins, O.S., 1995. Radon-222 as an indicator for nonaqueous phase liquids in the saturated zone: developing a detection technology. Master’s Thesis, Oregon State University.
10. Istok, J.D., J.A. Field, M.H. Schroth, B.M. Davis, and V. Dwarakanath, 2002. Single-well “push-pull” tracer test for NAPL detection in the subsurface. Environmental Science & Technology 36, 2708-2716.
11. Jin, M., M. Delshad, V. Dwarakanath, D.C. McKinney, G.A. Pope, K. Sepehrnoori, and C.E. Tilburg. 1995. Partitioning tracer test for detection, estimation, and remediation performance assessment of subsurface nonaqueous phase liquids. Water Resources Research. 31(4):1201-1211.
12. Kram, M.L, A.A. Keller, J. Rossabi, and L.G. Evertt. 2001. DNAPL characterization methods and approaches, Part 1: Performance comparisons. Ground Water Monitoring & Remediation, 21:109-123.
57

13. Kram, M.L., A.A. Keller, J. Rossabi, and L.E. Evertt. 2002. DNAPL characterization methods and approaches, Part 2: Cost comparisons. Ground Water Monitoring & Remediation 22:46-61.
14. Mercer, J.W. and R.M. Cohen, 1990. A review of immiscible fluids in the subsurface: properties, models, characterization and remediation. Journal of Contaminant Hydrology, 6:107-163.
15. National Research Council, 2004. Contaminants in the subsurface: Source zone assessment and remediation. National Academy of Sciences, 370.
16. Nelson, N.T., and M.L. Brusseau, 1996. Field study of the partitioning tracer method for detection of dense nonaqueous phase liquid in a trichloroethene-contaminated aquifer. Environmental Science & Technology, 30:2859-2863.
17. Nelson, N.T., M. Oostrom, T.W. Wietsma, and M.L. Brusseau, 1999. Partitioning tracer method for the in situ measurement of DNAPL saturation: influence of heterogeneity and sampling method. Environmental Science & Technology, 33:4046-4053.
18. Nichols, W.E., N.J. Aimo, M. Oostrom, and M.D. White, 1997. STOMP: Subsurface Transport Over Multiple Phases, Application Guide. PNNL-11216, Richland, Washington.
19. Schroth, M.H., J.D. Istok, and R. Haggerty, 2000. In situ evaluation of solute retardation using single-well push-pull tests. Advances in Water Resources, 24:105-117.
20. Semprini, L., K. Broholm, and M. McDonald, 1993. Radon-222 deficit for locating and quantifying NAPL contamination in the subsurface. EOS Transactions, American Geophysical Union, 76:F276.
21. Semprini, L., M. Cantaloub, S. Gottipati, O. Hopkins, and J. Istok, 1998. Radon-222 as a tracer for quantifying and monitoring NAPL remediation. In: G.B. Wickramanayake and R.E. Hinchee (Editors), Nonaqueous-Phase Liquids. Battelle Press, Columbus, Ohio, 137-142.
22. Semprini, L., O.S. Hopkins, and B.R. Tasker, 2000. Laboratory, field and modeling studies of radon-222 as a natural tracer for monitoring NAPL contamination. Transport in Porous Media, 38:223-240.
23. American Public Health Association and the American Waterworks Association, 1996. Standard methods for the examination of water and wastewater, 19th edition supplement. Washington D.C.
24. White, M.D., and M. Oostrom, 2000. STOMP: Subsurface Transport Over Multiple Phases, Version 2.0, User’s Guide. PNNL-12034, Richland, Washington.
58

25. Young, C.M., R.E. Jackson, M. Jin, J.T. Londergan, P.E. Mariner, G.A. Pope, F.J. Anderson, and T. Houk, 1999. Characterization of a TCE NAPL zone in alluvium by partitioning tracers. Ground Water Monitoring and Remediation, 19:84-94.
59

This page left blank intentionally.

APPENDIX A
POINTS OF CONTACT
Point of Contact Organization
(Name & Address) Phone/Fax/Email Role In Project Dr. Lewis Semprini Oregon State University
Department of Civil, Construction, and Environmental Engineer, Owen Hall 220 Corvallis, OR 97331
(541) 737-6895 (541) 737-3099 [email protected]
Principal Investigator
Dr. Jack Istok Oregon State University Department of Civil, Construction, and Environmental Engineer, Owen Hall 220 Corvallis, OR 97331
(541) 737-8547 (541) 737-3099 [email protected]
Co-Principal Investigator
Mr. Ficklen Holmes AFCEE/ERT 3207 North Road Brooks Air Force Base, TX 78235-5363
(210) 536-4366 (210) 536-4330 [email protected]
Project Manager
A-1

ESTCP Program Office 901 north Stuart Street Suite 303 arlington, virginia 22203 (703) 696-2117 (Phone)(703) 696-2114 (fax) e-mail: [email protected] www.estcp.org