estcp cost and performance · pdf fileestcp cost and performance report environmental...
TRANSCRIPT
ESTCPCost and Performance Report
ENVIRONMENTAL SECURITYTECHNOLOGY CERTIFICATION PROGRAM
U.S. Department of Defense
(CP-9503)
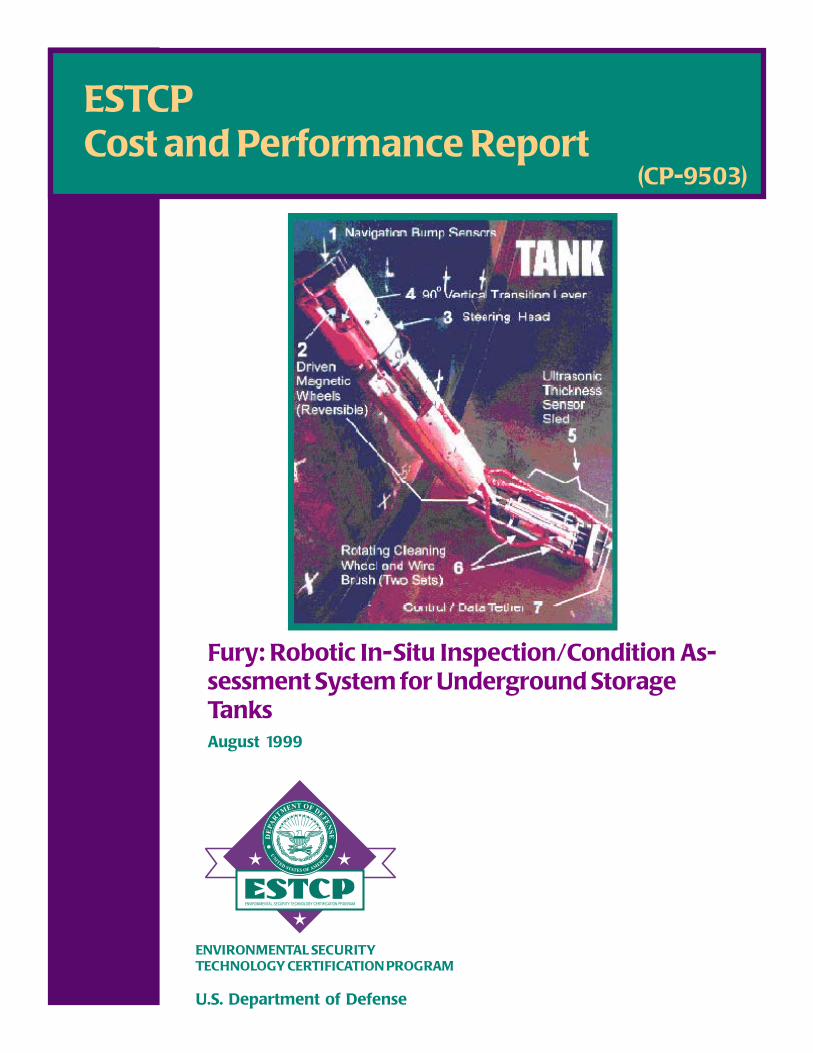
Fury: Robotic In-Situ Inspection/Condition As-sessment System for Underground StorageTanksAugust 1999

Report Documentation Page Form ApprovedOMB No. 0704-0188
Public reporting burden for the collection of information is estimated to average 1 hour per response, including the time for reviewing instructions, searching existing data sources, gathering andmaintaining the data needed, and completing and reviewing the collection of information. Send comments regarding this burden estimate or any other aspect of this collection of information,including suggestions for reducing this burden, to Washington Headquarters Services, Directorate for Information Operations and Reports, 1215 Jefferson Davis Highway, Suite 1204, ArlingtonVA 22202-4302. Respondents should be aware that notwithstanding any other provision of law, no person shall be subject to a penalty for failing to comply with a collection of information if itdoes not display a currently valid OMB control number.
1. REPORT DATE AUG 1999 2. REPORT TYPE
3. DATES COVERED 00-00-1999 to 00-00-1999
4. TITLE AND SUBTITLE Fury: Robotic In-Situ Inspection/Condition Assessment System forUnderground Storage Tanks
5a. CONTRACT NUMBER
5b. GRANT NUMBER
5c. PROGRAM ELEMENT NUMBER
6. AUTHOR(S) 5d. PROJECT NUMBER
5e. TASK NUMBER
5f. WORK UNIT NUMBER
7. PERFORMING ORGANIZATION NAME(S) AND ADDRESS(ES) Environmental Security Technology Certification Program(ESTCP),4800 Mark Center Drive, Suite 17D08,Alexandria,VA,22350-3605
8. PERFORMING ORGANIZATIONREPORT NUMBER
9. SPONSORING/MONITORING AGENCY NAME(S) AND ADDRESS(ES) 10. SPONSOR/MONITOR’S ACRONYM(S)
11. SPONSOR/MONITOR’S REPORT NUMBER(S)
12. DISTRIBUTION/AVAILABILITY STATEMENT Approved for public release; distribution unlimited
13. SUPPLEMENTARY NOTES
14. ABSTRACT
15. SUBJECT TERMS
16. SECURITY CLASSIFICATION OF: 17. LIMITATION OF ABSTRACT Same as
Report (SAR)
18. NUMBEROF PAGES
43
19a. NAME OFRESPONSIBLE PERSON
a. REPORT unclassified
b. ABSTRACT unclassified
c. THIS PAGE unclassified
Standard Form 298 (Rev. 8-98) Prescribed by ANSI Std Z39-18


TABLE OF CONTENTS
Page
1.0 EXECUTIVE SUMMARY . . . . . . . . . . . . . . . . . . . . . . . . . . . . . . . . . . . . . . . . . . . . . . . . 1
2.0 TECHNOLOGY DESCRIPTION . . . . . . . . . . . . . . . . . . . . . . . . . . . . . . . . . . . . . . . . . . . 32.1 BACKGROUND TECHNOLOGY DEVELOPMENT . . . . . . . . . . . . . . . . . . . . . 32.2 TECHNOLOGY DESCRIPTION . . . . . . . . . . . . . . . . . . . . . . . . . . . . . . . . . . . . . 42.3 FACTORS AFFECTING TECHNOLOGY PERFORMANCE . . . . . . . . . . . . . . 62.4 ADVANTAGES COMPARED TO CONVENTIONAL TECHNOLOGIES . . . . 6
3.0 DEMONSTRATION DESIGN . . . . . . . . . . . . . . . . . . . . . . . . . . . . . . . . . . . . . . . . . . . . . 93.1 PERFORMANCE OBJECTIVES . . . . . . . . . . . . . . . . . . . . . . . . . . . . . . . . . . . . . 93.2 PHYSICAL SETUP AND OPERATION . . . . . . . . . . . . . . . . . . . . . . . . . . . . . . . 93.3 MONITORING PROCEDURES . . . . . . . . . . . . . . . . . . . . . . . . . . . . . . . . . . . . . 113.4 DEMONSTRATION SITE/FACILITY BACKGROUND AND
CHARACTERISTICS . . . . . . . . . . . . . . . . . . . . . . . . . . . . . . . . . . . . . . . . . . . . . 11
4.0 PERFORMANCE ASSESSMENT . . . . . . . . . . . . . . . . . . . . . . . . . . . . . . . . . . . . . . . . 134.1 GENERAL OBSERVATIONS . . . . . . . . . . . . . . . . . . . . . . . . . . . . . . . . . . . . . . 134.2 SELECTED VALIDATION RESULTS FROM FORT LEE . . . . . . . . . . . . . . . 134.3 VALIDATION AND RESULTS AT HUNTER ARMY AIRFIELD . . . . . . . . . 164.4 STATISTICAL INTERPRETATION OF RESULTS . . . . . . . . . . . . . . . . . . . . . 204.5 SUITABILITY FOR CATHODIC PROTECTION UPGRADE . . . . . . . . . . . . . 20
5.0 COST ASSESSMENT . . . . . . . . . . . . . . . . . . . . . . . . . . . . . . . . . . . . . . . . . . . . . . . . . . . 21
6.0 IMPLEMENTATION ISSUES . . . . . . . . . . . . . . . . . . . . . . . . . . . . . . . . . . . . . . . . . . . . 236.1 COST OBSERVATIONS . . . . . . . . . . . . . . . . . . . . . . . . . . . . . . . . . . . . . . . . . . 236.2 PERFORMANCE OBSERVATIONS . . . . . . . . . . . . . . . . . . . . . . . . . . . . . . . . . 236.3 REGULATORY AND OTHER ISSUES . . . . . . . . . . . . . . . . . . . . . . . . . . . . . . 236.4 OTHER SIGNIFICANT OBSERVATIONS . . . . . . . . . . . . . . . . . . . . . . . . . . . . 236.5 LESSONS LEARNED . . . . . . . . . . . . . . . . . . . . . . . . . . . . . . . . . . . . . . . . . . . . . 246.6 SCALE-UP . . . . . . . . . . . . . . . . . . . . . . . . . . . . . . . . . . . . . . . . . . . . . . . . . . . . . 25
7.0 REFERENCES . . . . . . . . . . . . . . . . . . . . . . . . . . . . . . . . . . . . . . . . . . . . . . . . . . . . . . . . 27
APPENDIX A:Points of Contact

This page was intentionally left blank.

LIST OF FIGURES
Page
Figure 1. Photograph of Fury Robotic System . . . . . . . . . . . . . . . . . . . . . . . . . . . . . . . . . . . 5
Figure 2. Photograph of Hunter Army Airfield Underground Storage Tanks . . . . . . . . . . . 12
Figure 3. Mechanical vs. Fury Thickness Measurement (Bottom, Middle) . . . . . . . . . . . . 14(Fort Lee)
Figure 4. Mechanical vs. Fury Thickness Measurement (Bottom, Quarter) . . . . . . . . . . . . 14(Fort Lee)
Figure 5 . Mechanical vs. Fury Thickness Measurement (End Cap) . . . . . . . . . . . . . . . . . . 14(Fort Lee)
Figure 6. Location Distribution of 1,000 Thinnest Wall Thickness Measurements . . . . . . 16(Fort Lee)
Figure 7. Tank 3 Thickness Distribution . . . . . . . . . . . . . . . . . . . . . . . . . . . . . . . . . . . . . . . 18(Hunter Army Airfield)
Figure 8. Thickness Distribution of Region C in Tank 3 . . . . . . . . . . . . . . . . . . . . . . . . . . 18(Hunter Army Airfield)
Figure 9. Tank 4 Thickness Distribution . . . . . . . . . . . . . . . . . . . . . . . . . . . . . . . . . . . . . . . 18(Hunter Army Airfield)
Figure 10. Thickness Distribution of Region C in Tank 4 . . . . . . . . . . . . . . . . . . . . . . . . . . 19(Hunter Army Airfield)
Figure 11. Tank 5 Thickness Distribution . . . . . . . . . . . . . . . . . . . . . . . . . . . . . . . . . . . . . . . 19(Hunter Army Airfield)
Figure 12. Thickness Distribution of Region C in Tank 5 . . . . . . . . . . . . . . . . . . . . . . . . . . 19(Hunter Army Airfield)

LIST OF TABLES
Page
Table 1. Statistical Comparison of Fort Lee Thickness Data Sets . . . . . . . . . . . . . . . . . . . 15
Table 2. Statistical Analysis of Complete Fort Lee Data Set . . . . . . . . . . . . . . . . . . . . . . . 15
Table 3. Descriptive Analysis of Hunter Army Airfield Data Set . . . . . . . . . . . . . . . . . . . 17
Table 4. 500 Thinnest Data Points at Hunter Army Airfield . . . . . . . . . . . . . . . . . . . . . . . 17
Table 5. Cost Comparison of Fury vs. Manual Inspection . . . . . . . . . . . . . . . . . . . . . . . . 22
LIST OF ACRONYMS
AAF Army AirfieldAPI American Petroleum InstituteASTM American Society for Testing and Materials
CERL Construction Engineering Research LaboratoriesCRADA Cooperative Research and Development Agreement
EMAT Electromagnetic Acoustic TransducerESTCPEnvironmental Security Technology Certification Program
MLE Maximum Likelihood Estimate
NDT Non-Destructive TestingNLPA National Leak Prevention Association
O&M Operating and Maintenance
PPE Personal Protective Equipment
SBIR Small Business Innovative Research
TRADOC United States Army Training and Indoctrination Command
USACERL United States Army Construction Engineering Research LaboratoriesUST Underground Storage Tank

This page was intentionally left blank.

ACKNOWLEDGMENTS
Fury was developed by the U.S. Army Construction Engineering Research Laboratory (USACERL) inconjunction with RedZone Robotics, Inc., Pittsburgh, PA. Funding for the effort by the Small BusinessInnovative Research Program (SBIR) and the Army Petroleum Center, in addition to the EnvironmentalSecurity Technology Certification Program (ESTCP) is gratefully acknowledged. Outstanding personalefforts by Mr. Jeff Timmins, Mr. Robert Weber (USACERL), Mr. Troy Lehman (RedZone) and especiallyMr. Tim Richardson (Fort Lee, VA) are also acknowledged.
Points of contact can be found in Appendix A.
Technical material contained in this report has been approved for public release.


This page was intentionally left blank.

1.0 EXECUTIVE SUMMARY
The Code of Federal Regulations (40 CFR 280-281) required all underground storage tanks (USTs)containing petroleum products to be brought into compliance to prevent environmental contaminationthrough leakage. Replacing all older USTs can, in some cases, be prohibitively expensive. One alternativeto requiring that tanks pass a precision tightness test is to retrofit USTs with cathodic protection forcontinued use. To pursue this alternative, there is a need for more cost-effective and reliable tank conditionassessment methods.
The U.S. Army Construction Engineering Research Laboratories (USACERL) in conjunction withRedZone Robotics, Inc. of Pittsburgh, PA developed a remote, robotic UST conditioninspection/assessment system named Fury to meet this need. Fury is a robotic crawler, which movesinside a UST by means of magnetic wheels. It includes 90-degree transition arms for robot positioning ontank end-caps and has a central pivot to allow for full motion of the steering head. The robot is designedto fit through an existing small diameter pipe, which mitigates invasive tank entry during assessment andallows for non-destructive evaluation. Control of the Fury is accomplished through a tether attached tothe rear of the robot. Fury utilizes ultrasonic transducers on a sensor sled to obtain approximately 90,000wall thickness measurements per hour at over 95% of cylindrical-wall or end-cap locations.
Under this Environmental Security Technology Certification Program (ESTCP) project, Fury was (1)successfully validated on a subsequently excavated UST at Fort Lee, VA from 18-26 August, 1996, and(2) successfully demonstrated in three USTs at Hunter Army Air Field (a sub-unit of Fort Stewart, GA)from 18 February to 7 March, 1997. Fury provided faster inspections and more reliable data, identifiedthe most severely pitted wall regions, and avoided the expense and safety issues associated with confinedspace entry, which is required for conventional manual inspection methods. Fury inspection of a typical30-50,000 gallon UST took less than one day. Fury is ultimately intended for deployment in tankscontaining fuel while the headspace is filled with a protective blanket of inert gas, which avoids interruptionof normal operations. Safety certification for this duty is presently being sought. Cost estimates for a Furyinspection system showed a payback of less than 2.5 years, and a per-tank assessment cost between$600-$1,200, which was $2,000-$4,000 per tank less than the estimate for conventional manual invasivemethods.
The results of Fury condition assessments can be used to make better informed management decisionsconcerning upgrade versus replacement. A significant cost could be avoided for each tank found suitablefor upgrade. Potential cost savings from avoiding the replacement of only 10% of the nationwide USTinventory are as high as $10 billion. Fury can also be used for ongoing UST condition assessment,assessment of aboveground tanks, and underwater applications such as inspection of submerged sheet-piling.

This page was intentionally left blank.

2.0 TECHNOLOGY DESCRIPTION
2.1 BACKGROUND TECHNOLOGY DEVELOPMENT
The Environmental Protection Agency (EPA) regulates underground storage tanks (USTs) containingpetroleum products, which are a potential source of soil and ground water pollution, in the Code of FederalRegulations (CFR). All existing UST systems were required to be, or upgraded to be in compliance withone of the alternatives allowed in 40 CFR 280-281 by no later than December 22, 1998 [1]. Thesealternatives include upgrading with cathodic protection, total UST replacement, internal lining (which isbanned by Army Regulation 200-1, however) or closure. The integrity of USTs that were 10 or moreyears old needs to be ensured prior to upgrade.
The U.S. Army owns and operates some 20,000 USTs that must meet the compliance requirements of 40CFR 280-281. One cost-effective, compliance option for USTs over 10 years old was conditionassessment followed by upgrading with cathodic protection. In support of this option Army-wide, animproved robotic inspection and assessment technology was developed. The U.S. Army ConstructionEngineering Research Laboratories (USACERL) in conjunction with RedZone Robotics developed anautomatic, ultrasonic in-situ tank assessment system, named Fury, which eliminates the problems of safetyand expense often associated with tank inspection. The robot was developed through a Small BusinessInnovative Research (SBIR) Phase II contract, and was designed for implementation by DoD users, as wellas by the commercial sector, in USTs containing hazardous petroleum products. The ultrasonic transducerwas independently validated for use in the Fury system by the Naval Facilities Engineering Service Center.
The Fury robotic tank inspection system combines and extends two existing technologies to produce acost-effective tool for UST inspection. Mobile robots have been used to move inspection devices overstructures, and ultrasonic transducers have been extensively used to inspect metallic structures. Fury entersthe tank through an existing fill pipe and moves over the interior surfaces of the tank to make ultrasonictime-of-flight measurements of wall thickness. When safety certified, Fury will be able to operate in tankscontaining combustible liquids or vapors.
Ultrasonic thickness inspection methods are widely used in a number of industries. The American SocietyFor Testing and Materials (ASTM) developed standards for measurement procedures [2, 3] as well asexisting certification programs for technicians. Currently approved in National Leak Prevention Association(NLPA) 631, "Entry, Cleaning, Interior Inspection, Repair and Lining of Underground Storage Tanks" [4],are hand-held ultrasonic thickness measurement techniques for the assessment of UST condition. It isexpected that a Fury tank inspection covering 15% of the internal surface area of a tank as required byASTM ES 40-94 [5] can be completed in less than eight hours from arrival to departure.
The predominant mode of UST failure is a result of external pitting, which is a localized form of corrosionthat can lead to perforations. Seam or weld leaks are rarely the cause of failure. Pitting depends on severalsoil factors (e.g., soil resistivity, moisture, pH, temperature, chloride/sulfide levels), and subsequentperforation of the tank wall is directly correlated to pit depth. A typical UST will in time exhibit adistribution of pitting areas over the external surface that is exposed to soil, as well as a distribution ofgrowing pit depths. With the addition of cathodic protection and the required follow-up systemmaintenance, all external UST corrosion can be stopped.

This ESTCP project served to: (1) validate the capabilities of Fury on a UST at Fort Lee, VA, in partthrough comparison with results from a third party inspection made after its subsequent excavation, and (2)demonstrate Fury on USTs at Hunter Army Air Field, located at Fort Stewart, GA.
2.2 TECHNOLOGY DESCRIPTION
The Fury robotic tank inspection system (shown in Figure 1) consists of four assemblies: the robotassembly, the inspection assembly, the tether management assembly and the operator console. The robotis designed to fit through an existing riser (4-inch diameter minimum), which mitigates invasive tank entryduring assessment and allows for non-destructive evaluation.
The robot assembly supports and moves the inspection assembly over the tank interior surfaces.Permanent magnet wheels are used to attach the system to the tank walls allowing the system to move overthe tank end-caps and overhead portions of the tank wall. Electric motors that power the robotcomponents, are contained in the purged and pressurized lightweight aluminum robot housing. Steering andtransition mechanisms provide robot mobility. The weight of the robot is approximately 5 lbs.
The inspection assembly contains the ultrasonic transducer used to measure wall thickness as well as thetank wall cleaning components. Tank wall cleaning is needed to assure ultrasonic wall thicknessmeasurement performance at all locations. Powered cleaning wheels and brushes are used. The drive forthe cleaning system is supplied by the robot assembly. The ultrasonic transducer is mounted in a guide shoethat protects the transducer and holds it perpendicular to and against the tank wall. The guide shoe directscouplant flow to the transducer/wall interface. Liquids contained in the tank are used for couplant to avoidcontamination. All parts are grounded to the tank through the tether.
The tether management assembly drives the tether into or out of the tank and stores unused tether. A guideis provided to minimize tether damage. The tether management assembly is controlled from the operatorconsole allowing one person operation. A couplant supply and a purge gas supply are contained in thetether management assembly. The operator console consists of an intelligent controller, an ultrasonic dataacquisition system and power distribution unit. The operator console displays numeric and graphicalinformation showing the position of the robot in the tank and robot status. It also controls the ultrasonicdata acquisition system. The power distribution unit supplies electrical power to the intelligent controller,ultrasonic data acquisition system, robot assembly and the tether management assembly.
The robotic inspection system can be operated by a single trained technician. In addition to specific trainingto operate the robotic system, certification as a level IIR Non-Destructive Testing (NDT) technician isrequired to operate the ultrasonic system. The robotic inspection system equipment can be positioned atthe tank site by the same operator assuming the tank site is vehicle-accessible. Any necessary removal offill connectors and drop tubes can also be accomplished by the operator.
The robotic inspection system is assembled from a combination of off-the-shelf and custom components,and uses no proprietary technologies. Those custom components, such as robot housings, magnetic wheelsand ultrasonic transducers, can be produced by a variety of sources. No exotic materials or manufacturingprocesses are used.

Figure 1. Photograph of Fury Robotic System
FURY

Internal inspection system components are designed to last the life of the product. Non-movingcomponents are projected to last a minimum of 10 years while moving parts will likely require yearlyinspection and possible replacement. Periodic replacement of the tether will be required as a result ofabrasion and wear of the tether jacket. The tether is expected to last six months to one year dependingon usage and test conditions. The high-pressure purge gas supply cylinder will require more frequentreplacement. Generally, as the system is fielded, incremental improvements in durability will be made. Thetether can be easily disconnected from the operator console so that inspection operations can continue byswapping assemblies. Normal vehicular maintenance will be required for the tow vehicle and trailer usedto transport the robotic inspection system. No reliability problems are expected.
Safety approval or certification for submersed operation in fuel is being sought for the robotic system. Forthese ESTCP demonstrations in de-fueled tanks, safety certification was not needed. The lessons learnedfrom the demonstration field experience will be incorporated into a redesigned system, which can obtainsafety approval. The considerable advantage of certification would be to allow Fury’s use in tankscontaining fuel. Tanks would not have to be emptied, cleaned, purged, or made inert prior to inspection.This eliminates the risk of spillage during emptying and cleaning, and the disposal of tank residuals andcleaning materials. Disruption of tank operation is also eliminated and the tank can remain in service duringthe inspection. Future systems will include a tether handling system to prevent any loss of tank contents.
2.3 FACTORS AFFECTING TECHNOLOGY PERFORMANCE
Robot mobility may be reduced by the presence of obstacles in the tank such as tank reinforcements,particularly reinforcements of tank end-caps, and loose objects in the tank. Robot mobility and ultrasonicperformance may be affected by very firm sludge that cannot be displaced by the robotic system. Internalcorrosion is not expected to affect performance. The amount of oxygen necessary for corrosion in contactwith the internal tank walls is limited by the presence of fuel during regular fuel-storage duty. Correctionfor any existing internal coating that could affect the thickness measurement, is required during data analysis.The various media in contact with the outside of an UST should have no effect on ultrasonic thicknessmeasurements.
2.4 ADVANTAGES COMPARED TO CONVENTIONAL TECHNOLOGIES
The robot assembly, inspection assembly and tether are small enough to enter the underground storage tankthrough the 4-inch diameter pipe used to fill the tank. This eliminates the need to dig through pavement andearth to reach the tank and cut an access opening in the tank. The compact size of the unit avoids damageto the tank or piping that would be caused by digging and reduces disruption at the tank site. Since therobotic inspection system is operated remotely and does not require workers to enter the tank, confinedspace exposure is eliminated and chemical exposure is reduced. The robot assembly can also move theinspection assembly over 95% of the accessible interior of the tank.
Human invasive inspection is the conventional technology that has been used for many years to determinetank condition. Personnel enter the tank to prepare it for inspection and to perform the inspection. Theprocedure consists of emptying, purging/inerting, unearthing, cutting, entering, desludging, grit blasting,vacuuming, visual and manual inspection (including ultrasonics, probing, hammer testing, etc.), and restoringthe site after inspection. Internal manual inspection is required before tank lining, but is not necessarybefore installing cathodic protection. This inspection method is described in API 1631 and included in 40

CFR '280.21 (b)(2)(I) [1].
More recently, video inspection and mean-time-to-corrosion-failure methods have been developed.Invasive video inspection methods insert specialized cameras and lighting into the fill tube of a UST. Thecamera, on the end of a long stick, is rotated, raised, and lowered to provide a full view of the tank interior.High-magnification lenses and explosion-proof lights are used. The tank must be emptied prior toinspection. Sludge removal and cleaning may be required to expose the tank wall for inspection.
The advantages of video inspection include creation of a visual record of the tank interior. Disadvantagesinclude separate sludge removal costs, no surface cleaning, and surface-only characterization. Videoinspection is somewhat disruptive in that the equipment, truck, and personnel are stationed over the tankpad. Another disadvantage is that it is a proprietary service.
Mean-time-to-corrosion-failure is a predictive method, based upon soil characteristics and tank age, thathas been approved by many states for testing prior to cathodic upgrade. Tank site soil samples arelaboratory tested for parameters known to promote tank corrosion including soil pH, resistivity, sulfides,moisture, and tank size. Parameter values are input into a mathematical model, which calculates likelihoodof corrosion failure for tanks of a given age at the site. The advantages of mean-time-to-corrosion-failure inspection include no disruption of tank operations.However, to date, the accuracy and value of the method to owner/operators remains unclear. Mean-time-to-corrosion-failure inspection is described in ASTM ES 40-94 [5].

This page was intentionally left blank.

3.0 DEMONSTRATION DESIGN
3.1 PERFORMANCE OBJECTIVES
The major objective of this effort was to validate and demonstrate that the Fury system could maneuverthroughout a UST and perform ultrasonic thickness measurements at a high sampling rate and providereliable data that could be used to determine the condition of the tank. The following parameters were tobe quantified and documented:
1. Main system components and associated equipment lists.
2. Set up time, procedures, and any unexpected impediments to inspection/assessment.
3. Actual inspection rate, which was required to be faster than conventional methods, and allprocedures associated with UST integrity assessment including duration of each procedure.
4. Exit procedures (including data storage) and site clean up.
5. The data collected by this technology were to be used to help determine the suitability of tanks forupgrading with cathodic protection, thus avoiding the significant expense of replacement.
In accordance with both ASTM ES 40-94 [5] and NLPA 631 [24], a tank is acceptable for upgrade withcathodic protection when 98% of the surface area has no pitting greater than 50% of the original wallthickness, and, for every m of surface, the average wall thickness remaining is greater than 85% of the2
original wall thickness.
3.2 PHYSICAL SETUP AND OPERATION
The USTs tested during the demonstrations had been used for storage of fuel hydrocarbons, and had beenemptied prior to the demonstrations. Thus, no process wastes were produced. The drop tube (if installed)had to be removed from the tank filler pipe. Drop tubes are thought to be present on about 15% of allUSTs presently installed. During the demonstrations, personnel used level C personal protective equipment(PPE).
The first demonstration was conducted from 18-26 August, 1996 at Fort Lee, VA, where a tank that wasscheduled for removal was used mainly for validation purposes prior to its excavation. In addition to aFury inspection in accordance with ASTM ES40-94 [5], a number of performance capabilities weredocumented on videotape using a real-time video feed from inside the tank to an outside monitor. Thecapabilities documented included: entry/exit through a riser pipe, adherence to the inner tank wall in allorientations, movement in the forward and reverse directions, obstacle sensing and avoidance, traversalof lap joints, transitions to and from end-cap walls, navigational accuracy, surface cleaning and ultrasonicthickness measurements. After the tank was removed, a third party inspection was performed by MidwestResearch Institute (MRI), Inc. in accordance with procedures developed by the EPA during a study ofavailable UST assessment methods [6].
One of the most critical comparisons was that of the Fury in-situ ultrasonic thickness measurements to

other reference methods. Three 5x5 square grids with 10 cm. spacing were utilized; one was located nearthe center bottom, one was approximately one half the distance to the end cap near the bottom, and onewas on one end cap. These test grids were marked out with wax pencil and stamp markers. Eachmeasurement location was circled using a vibrating engraver and a robot template positioner. The templatewas used to assure that in-situ comparison measurements with a hand-held ultrasonic thickness gauge weretaken from exactly the same position. Both the robot sensor and the hand held thickness gauge werecalibrated on the same step block before and after each group of measurements. After the tank was pulled,the grids were cut out of the tank, sectioned, and the same measurements were performed using a standardmechanical micrometer capable of an accuracy of 1/1000 of an inch.
The second demonstration was conducted at the Hunter Army Air Field (a sub-installation of Ft. Stewart,GA) from February 18 to March 7, 1997. Fury performed the remote, in-situ assessment of the conditionof three 50,000 gallon USTs (from a total of thirty-one 50,000 gal. USTs at the site) according to ASTMES40-94 [5]. These tanks were thought to be in good condition based on the condition of some previouslyremoved tanks. Each of the tanks was selected from three separate pump stations, each consisting of abank of 10 tanks. Emphasis was on measurements on the bottom one-third of the tank (the mostsusceptible to pitting) in order to provide a conservative assessment.
A checklist was completed prior to robot insertion into the tank. In the event of robot assembly failure, therobot could be retrieved by pulling on the tether. The geometry of standard cylindrical USTs is such thatno tether binding or 90-degree bends were expected. Ultrasonic performance was controlled bycalibrating the ultrasonic system on a calibration plate of known thickness before the robot was insertedinto the tank, and by repeating the ultrasonic calibration after the robot was removed from the tank.Ultrasonic signals were displayed during inspection for review by the operator. Good practice also calledfor a check of calibration at the completion of the daily measurement activities or when the operatorchanged.
The nature of UST failure, predominantly manifested by exterior pitting corrosion, allows for accuratemeasurement using ultrasonic techniques. The ultrasonic system directly measures the remaining wallthickness of the tank. As specified in ASTM ES 40-94 [5], wall thickness was measured to an accuracyof +/- 0.010 in. over the tank wall surface and in 0.125 in. diameter flat-bottom pits. The nature of pitting corrosion is such that 100% inspection is not required to assess a buried structure'scondition. The empirical relationship between the average pit depth (P) to the maximum pit depth has beenfound to be:
P(max) = 1.41 P(avg.)
The sample size that was required for ultrasonic wall thickness measurements has been estimated (usingextreme-value statistics) as 7% of the total wall area, according to an EPA report on inspection proceduresand equipment [7]. In ASTM ES 40-94 [5], this sample size was essentially doubled to 15% for increasedenvironmental safety. Currently, a random sampling of the tank walls with no overlap is required, althoughsome areas have been suggested where corrosion might occur more frequently (such as the bottom externalthird of the UST, the internal "water" line, and at the internal top subject to moisture condensation).
3.3 MONITORING PROCEDURES

RCC and Bushman’s study reverified the high soil resistivity at Hunter Army Airfield which was documented in a 19781
Corrosion Survey Report by the U.S. Army Facilities Engineering Support Agency.
For the Fort Lee tank, two hand-held reference methods were used by MRI for comparison with Fury:hand-held manual ultrasonic measurement (ASTM E114 [2] and E797 [3]) and micrometer basedthickness measurement (ASTM G46-94) of UST sections cut after excavation. Two on-site audits wereconducted at Fort Lee to verify that calibration and operating procedures were being followed, and thatinspection data was being properly stored. One audit was conducted during Fury inspection, a secondaudit was performed while the manual tank-wall-thickness measurements were being made.
At Hunter AAF, the sampling plan for the three 50,000 gallon USTs required collection of ultrasonicthickness measurements on a minimum of 15% of the internal area from each tank. The sampling locationswere distributed randomly over the tank walls and end caps.
Measurements were distributed as bands of thickness measurements over the tank surfaces. A band ofcontinuous ultrasonic thickness data was taken during each traverse of the tank wall from end-cap to end-cap. To avoid overlap, each traverse was separated by a minimum of one band width. On the end-capsthe traverses were from outer edge to outer edge, which necessarily resulted in some overlap near thecenter of the end-caps. Typically 20% over sampling was employed, depending on tank size. In total, aminimum of 15% of the inner tank surface was inspected with no overlap. A quantitative sense of positionsensing/representation capabilities was also obtained.
Post inspection data analysis included the determination of an overall mean value (with end-caps and tankwall treated separately) as well as the distribution of the thinnest measurements. In addition, two lifeprediction algorithms were applied using soil data collected in accordance with ASTM ES40-94 [5] (seesection 4.4 for statistical interpretation of results).
Several soil parameter measurements were taken by Russell Corrosion Consultants, Inc. (RCC) inassociation with Bushman & Associates, Inc. to assess external corrosion and determine the suitability ofthe USTs for upgrade by the addition of cathodic protection. These included: (a) soil resistivitymeasurements ; (b) soil type analysis; (c) moisture content; (d) presence of sulfides and chlorides; (e) soil1
pH; and (f) tank to electrolyte potentials. The external corrosion field testing at Hunter AAF wasperformed during the week of March 3, 1997.
3.4 DEMONSTRATION SITE/FACILITY BACKGROUND AND CHARACTERISTICS
The selection of demonstration sites for condition assessment of USTs was based on the following factors:
1. The USTs to be inspected needed to be empty, cleaned and to have been in service for at least 10years. This ensured that some corrosion had taken place so that the USTs were representative ofthe older population of USTs to which 40 CFR 280-281 specifically refers.
2. The USTs to be inspected were representative of typical DoD applications. This involved factorssuch as capacity, fuel content (both highly refined fuels such as gasoline and less refined productsuch as diesel fuel), use, and soil side environment.

Figure 2. Photograph of Hunter Army Airfield Underground Storage Tanks
3. The USTs to be inspected needed to have filler pipes that were accessible to a vehicle towing atrailer.
4. The USTs installations needed a source of 110 VAC 20 amp power available or, less preferably,a comparable portable generator present.
For validation purposes, a site with a number of USTs marked for removal was practical in the event thatan alternative UST might be needed. USTs with excessive structural degradation or those that hadpreviously been exposed internally to rain or ground water were excluded as not being representative ofthe intended use of the robotic system. Also, in the absence of safety certification, a clean, de-fueled, non-explosive environment was required for these demonstrations.
4.0 PERFORMANCE ASSESSMENT
4.1 GENERAL OBSERVATIONS
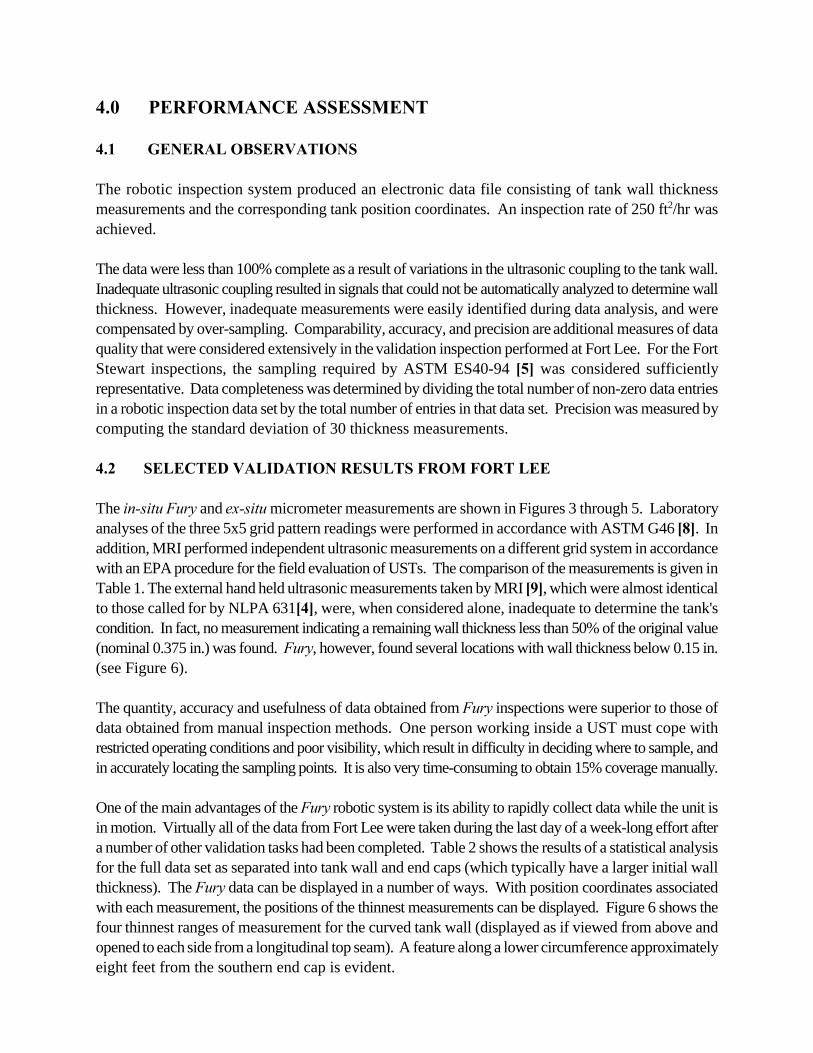
The robotic inspection system produced an electronic data file consisting of tank wall thicknessmeasurements and the corresponding tank position coordinates. An inspection rate of 250 ft /hr was2
achieved.
The data were less than 100% complete as a result of variations in the ultrasonic coupling to the tank wall.Inadequate ultrasonic coupling resulted in signals that could not be automatically analyzed to determine wallthickness. However, inadequate measurements were easily identified during data analysis, and werecompensated by over-sampling. Comparability, accuracy, and precision are additional measures of dataquality that were considered extensively in the validation inspection performed at Fort Lee. For the FortStewart inspections, the sampling required by ASTM ES40-94 [5] was considered sufficientlyrepresentative. Data completeness was determined by dividing the total number of non-zero data entriesin a robotic inspection data set by the total number of entries in that data set. Precision was measured bycomputing the standard deviation of 30 thickness measurements.
4.2 SELECTED VALIDATION RESULTS FROM FORT LEE
The in-situ Fury and ex-situ micrometer measurements are shown in Figures 3 through 5. Laboratoryanalyses of the three 5x5 grid pattern readings were performed in accordance with ASTM G46 [8]. Inaddition, MRI performed independent ultrasonic measurements on a different grid system in accordancewith an EPA procedure for the field evaluation of USTs. The comparison of the measurements is given inTable 1. The external hand held ultrasonic measurements taken by MRI [9], which were almost identicalto those called for by NLPA 631[4], were, when considered alone, inadequate to determine the tank'scondition. In fact, no measurement indicating a remaining wall thickness less than 50% of the original value(nominal 0.375 in.) was found. Fury, however, found several locations with wall thickness below 0.15 in.(see Figure 6).
The quantity, accuracy and usefulness of data obtained from Fury inspections were superior to those ofdata obtained from manual inspection methods. One person working inside a UST must cope withrestricted operating conditions and poor visibility, which result in difficulty in deciding where to sample, andin accurately locating the sampling points. It is also very time-consuming to obtain 15% coverage manually.
One of the main advantages of the Fury robotic system is its ability to rapidly collect data while the unit isin motion. Virtually all of the data from Fort Lee were taken during the last day of a week-long effort aftera number of other validation tasks had been completed. Table 2 shows the results of a statistical analysisfor the full data set as separated into tank wall and end caps (which typically have a larger initial wallthickness). The Fury data can be displayed in a number of ways. With position coordinates associatedwith each measurement, the positions of the thinnest measurements can be displayed. Figure 6 shows thefour thinnest ranges of measurement for the curved tank wall (displayed as if viewed from above andopened to each side from a longitudinal top seam). A feature along a lower circumference approximatelyeight feet from the southern end cap is evident.

MicrometerFURY
Thickness Measurement Comparison (Ft. Lee)
Th
ickn
ess
(in
ches
)
0.310
0.314
0.318
0.322
0.326
0.330
A1A2
A3A4
A5B1
B2B3
B4B5
C1C2
C3C4
C5D1
D2D3
D4D5
E1E2
E3E4
E5
Slope of Line:0.00020.0002
MicrometerFURY
Thickness Measurement Comparison (Ft. Lee)
Th
ickn
ess
(in
ches
)
0.252
0.256
0.260
0.264
K1K2
K3K4
K5L1
L2L3
L4L5
M1M2
M3M4
M5N1
N2N3
N4N5
O1O2
O3O4
O5
Slope of Line:1.769e-56.538e-5
Micrometer
FURY
Thickness Measurement Comparison (Ft. Lee)
Th
ickn
ess
(in
ches
)
0.226
0.232
0.238
0.244
F1F2
F3F4
F5G1
G2G3
G4G5
H1H2
H3H4
H5I1
I2I3
I4I5
J1J2
J3J4
J5
Slope of Line:0.00030.0002
Figure 5. Mechanical vs. Fury ThicknessMeasurement (End Cap)
Figure 4. Mechanical vs. Fury ThicknessMeasurement (Bottom, Quarter)
Figure 3. Mechanical vs. Fury ThicknessMeasurement (Bottom, Middle)

Table 1. Statistical Comparison of Fort Lee Thickness Data Sets
Method Position Valid n (in) (in) (in) (in)Mean Min Max S. D.
Fury Robot Wall 111952 0.255 0.071 0.543 0.033
Micrometer Wall 50 0.247 0.232 0.262 0.012
Hand-heldUltrasound* Wall 77 0.245 0.222 0.274 0.012
Fury Robot 3683 0.324 0.251 0.485 0.0100Farend cap
Fury Robot Near end cap 18 0.234 0.071 0.441 0.124
Micrometer End cap 20 0.322 0.316 0.327 0.003#
Hand-heldUltrasound* North end cap 9 0.325 0.318 0.331 .005
Hand-heldUltrasound* South end cap 9 0.322 0.312 0.328 0.006
*= MRI ultrasonic tank thickness measurements# = five samples were rendered unusable by the cutting torchn= number of data pointsmean = average thickness of sectionmin = minimum thickness measured in sectionmax = maximum thickness measured in sectionS.D. = standard deviation from the mean thickness
Table 2. Statistical Analysis of Complete Fort Lee Data Set
Position Valid n (in) (in) (in) (in)Mean Min Max S. D.
Wall 111952 0.2549 0.0707 0.5426 0.0333
Far end cap 3683 0.3244 0.2508 0.4845 0.0100
Near end cap 18 0.2336 0.0707 0.4412 0.1243
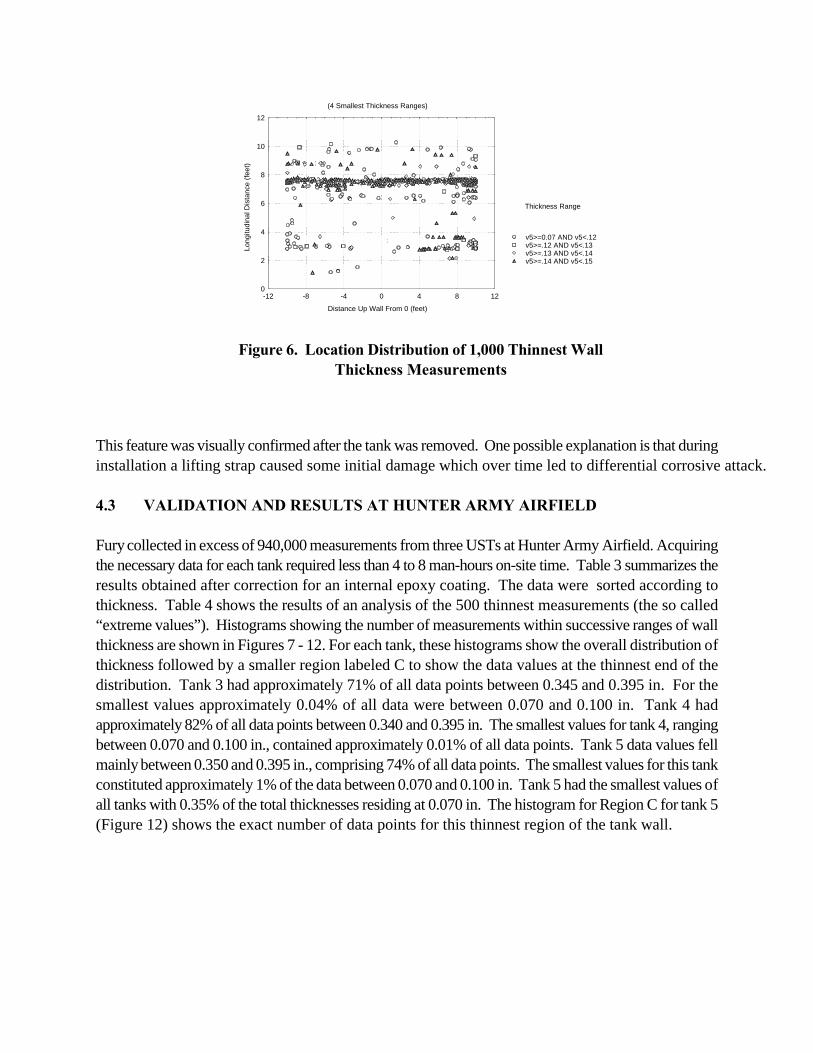
v5>=0.07 AND v5<.12v5>=.12 AND v5<.13v5>=.13 AND v5<.14v5>=.14 AND v5<.15
(4 Smallest Thickness Ranges)
Distance Up Wall From 0 (feet)
Long
itudi
nal D
ista
nce
(fee
t)
0
2
4
6
8
10
12
-12 -8 -4 0 4 8 12
Thickness Range
Figure 6. Location Distribution of 1,000 Thinnest WallThickness Measurements
This feature was visually confirmed after the tank was removed. One possible explanation is that duringinstallation a lifting strap caused some initial damage which over time led to differential corrosive attack.
4.3 VALIDATION AND RESULTS AT HUNTER ARMY AIRFIELD
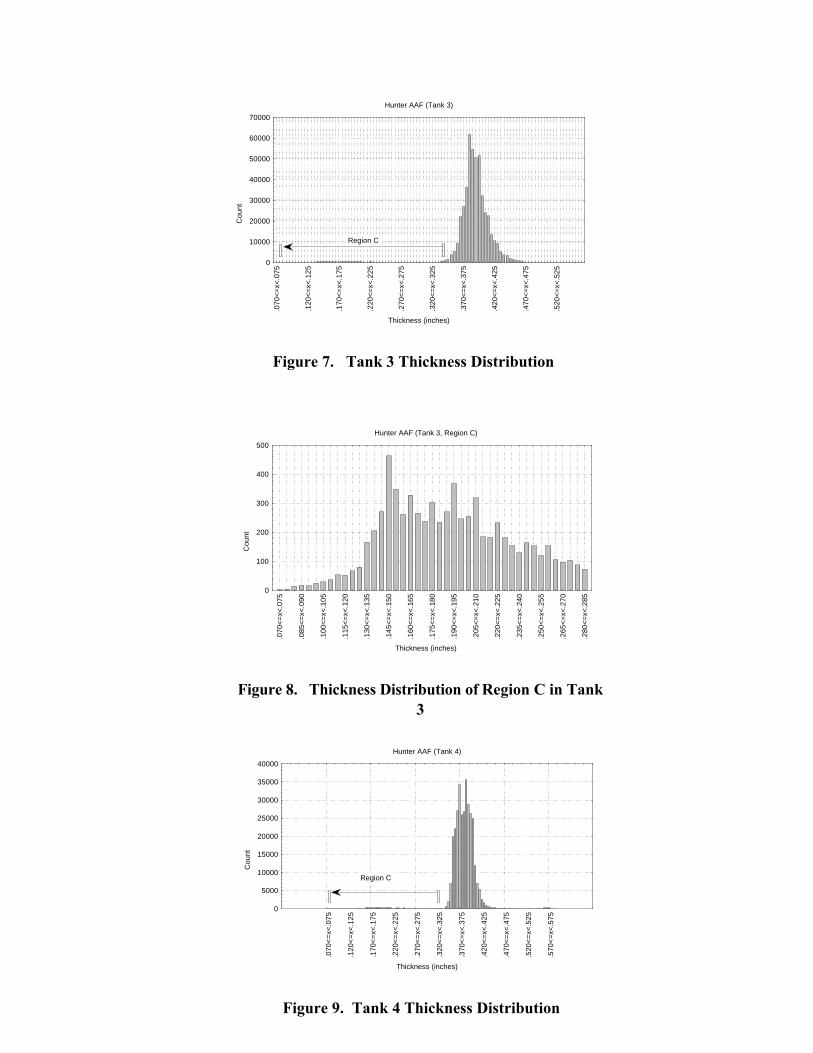
Fury collected in excess of 940,000 measurements from three USTs at Hunter Army Airfield. Acquiringthe necessary data for each tank required less than 4 to 8 man-hours on-site time. Table 3 summarizes theresults obtained after correction for an internal epoxy coating. The data were sorted according tothickness. Table 4 shows the results of an analysis of the 500 thinnest measurements (the so called“extreme values”). Histograms showing the number of measurements within successive ranges of wallthickness are shown in Figures 7 - 12. For each tank, these histograms show the overall distribution ofthickness followed by a smaller region labeled C to show the data values at the thinnest end of thedistribution. Tank 3 had approximately 71% of all data points between 0.345 and 0.395 in. For thesmallest values approximately 0.04% of all data were between 0.070 and 0.100 in. Tank 4 hadapproximately 82% of all data points between 0.340 and 0.395 in. The smallest values for tank 4, rangingbetween 0.070 and 0.100 in., contained approximately 0.01% of all data points. Tank 5 data values fellmainly between 0.350 and 0.395 in., comprising 74% of all data points. The smallest values for this tankconstituted approximately 1% of the data between 0.070 and 0.100 in. Tank 5 had the smallest values ofall tanks with 0.35% of the total thicknesses residing at 0.070 in. The histogram for Region C for tank 5(Figure 12) shows the exact number of data points for this thinnest region of the tank wall.

Table 3. Descriptive Analysis of Hunter Army Airfield Data Set
Tank Valid n (in) (in) (in) (in)mean min max std. dev.
3 463408 0.38945 0.07096 0.56196 0.03232
4 321919 0.37601 0.07563 0.58053 0.03305
5 157183 0.36974 0.07034 0.57284 0.06551
Table 4. 500 Thinnest Data Points at Hunter Army Airfield
Tank (in) (in) (in) (in)mean min max std. dev.
3 0.12664 0.07096 0.14700 0.02270
4 0.13498 0.07563 0.14973 0.01299
5 0.07252 0.07034 0.07614 0.00164
Hunter AAF (Tank 3)
Thickness (inches)
Cou
nt
0
10000
20000
30000
40000
50000
60000
70000
.070
<=
x<.0
75
.120
<=
x<.1
25
.170
<=
x<.1
75
.220
<=
x<.2
25
.270
<=
x<.2
75
.320
<=
x<.3
25
.370
<=
x<.3
75
.420
<=
x<.4
25
.470
<=
x<.4
75
.520
<=
x<.5
25
Region C
Hunter AAF (Tank 3, Region C)
Thickness (inches)
Cou
nt
0
100
200
300
400
500
.070
<=
x<.0
75
.085
<=
x<.0
90
.100
<=
x<.1
05
.115
<=
x<.1
20
.130
<=
x<.1
35
.145
<=
x<.1
50
.160
<=
x<.1
65
.175
<=
x<.1
80
.190
<=
x<.1
95
.205
<=
x<.2
10
.220
<=
x<.2
25
.235
<=
x<.2
40
.250
<=
x<.2
55
.265
<=
x<.2
70
.280
<=
x<.2
85
Hunter AAF (Tank 4)
Thickness (inches)
Cou
nt
0
5000
10000
15000
20000
25000
30000
35000
40000
.070
<=
x<.0
75
.120
<=
x<.1
25
.170
<=
x<.1
75
.220
<=
x<.2
25
.270
<=
x<.2
75
.320
<=
x<.3
25
.370
<=
x<.3
75
.420
<=
x<.4
25
.470
<=
x<.4
75
.520
<=
x<.5
25
.570
<=
x<.5
75
Region C
Figure 7. Tank 3 Thickness Distribution
Figure 8. Thickness Distribution of Region C in Tank3
Figure 9. Tank 4 Thickness Distribution

Hunter AAF (Tank 5, Region C)
Thickness (inches)
Cou
nt
0
100
200
300
400
500
600
700
.070
<=
x<.0
75
.085
<=
x<.0
90
.100
<=
x<.1
05
.115
<=
x<.1
20
.130
<=
x<.1
35
.145
<=
x<.1
50
.160
<=
x<.1
65
.175
<=
x<.1
80
.190
<=
x<.1
95
.205
<=
x<.2
10
.220
<=
x<.2
25
.235
<=
x<.2
40
.250
<=
x<.2
55
.265
<=
x<.2
70
.280
<=
x<.2
85
.295
<=
x<.3
00
.310
<=
x<.3
15
Hunter AAF (Tank 4, Region C)
Thickness (inches)
Cou
nt
0
50
100
150
200
250
300
350
.070
<=
x<.0
75
.085
<=
x<.0
90
.100
<=
x<.1
05
.115
<=
x<.1
20
.130
<=
x<.1
35
.145
<=
x<.1
50
.160
<=
x<.1
65
.175
<=
x<.1
80
.190
<=
x<.1
95
.205
<=
x<.2
10
.220
<=
x<.2
25
.235
<=
x<.2
40
.250
<=
x<.2
55
.265
<=
x<.2
70
.280
<=
x<.2
85
.295
<=
x<.3
00
.310
<=
x<.3
15
Hunter AAF (Tank 5)
Thickness (inches)
Cou
nt
0
4000
8000
12000
16000
20000
24000
.070
<=
x<.0
75
.120
<=
x<.1
25
.170
<=
x<.1
75
.220
<=
x<.2
25
.270
<=
x<.2
75
.320
<=
x<.3
25
.370
<=
x<.3
75
.420
<=
x<.4
25
.470
<=
x<.4
75
.520
<=
x<.5
25
.570
<=
x<.5
75
Region C
Figure 12. Thickness Distribution of Region C in Tank5
Figure 10. Thickness Distribution of Region C inTank 4
Figure 11. Tank 5 Thickness Distribution

4.4 STATISTICAL INTERPRETATION OF RESULTS
Descriptive and inferential statistics were considered for the large data sets obtained by Fury for each tankat Hunter AAF. Extreme value statistics were utilized on the maximum pit depths obtained from the datato determine probability of failure. Two approaches were employed assuming that maximum pit depthsfollowed a Gumbel Type I distribution. The probability of rejecting this null hypothesis was determined.The scale and shape parameters of the distribution were estimated in an iterative manner.
First, graphical estimates were made by plotting the maximum pit depths on probability paper andemploying least squares estimation. The resulting plots gave estimates for the slope and shape parameters,which were then used to calculate the probability of survival P of maximum pit depths. The graphicals
estimates were also used as initial estimates for Maximum Likelihood Estimates (MLE). Second,convergence based upon the Newton-Rhapson method for function minimization provided parameterestimates and confidence intervals for an MLE on the probabilities of occurrence of pit depths greater thanthe ones observed, which were compared with the graphical estimates for the probability of survival (aGumbel Type III distribution).
4.5 SUITABILITY FOR CATHODIC PROTECTION UPGRADE
The external corrosion evaluation performed by RCC and Bushman yielded acceptable predicted lifetimesfor all the USTs tested at Hunter AAF. Their report [10] concluded that the tanks were suitable forupgrading based on the external corrosion data gathered and the data evaluation equations (“MicroGPiper”Equation No. 6 and “Leakage Potential of USTs” Equation No. 6.) provided by CERL. While testing thesensitivity of the equations to deal with wide variations in soil characteristics, the second equation(“Leakage Potential of USTs”) was found to more realistically model the probability of corrosion pittingpenetration of USTs over the broadest potential range of variables.
The Fury inspection showed that Tanks 3 and 4 were in good shape while Tank 5 clearly showed a largenumber of observations at the lower thickness ranges. These observations combined with the findings fromthe external corrosion evaluation procedures, as required by ASTM ES40-94 [5], indicated that tanks 3and 4 were considered suitable for upgrade while tank 5 was not. From a corrosion engineering viewpoint,the character of the wall thickness histograms is intriguing. It may be that, as a tank undergoes theaccumulated damage of corrosive degradation, the condition represented by Figures 8 and 10 evolves moretoward a condition represented by Figure 12.
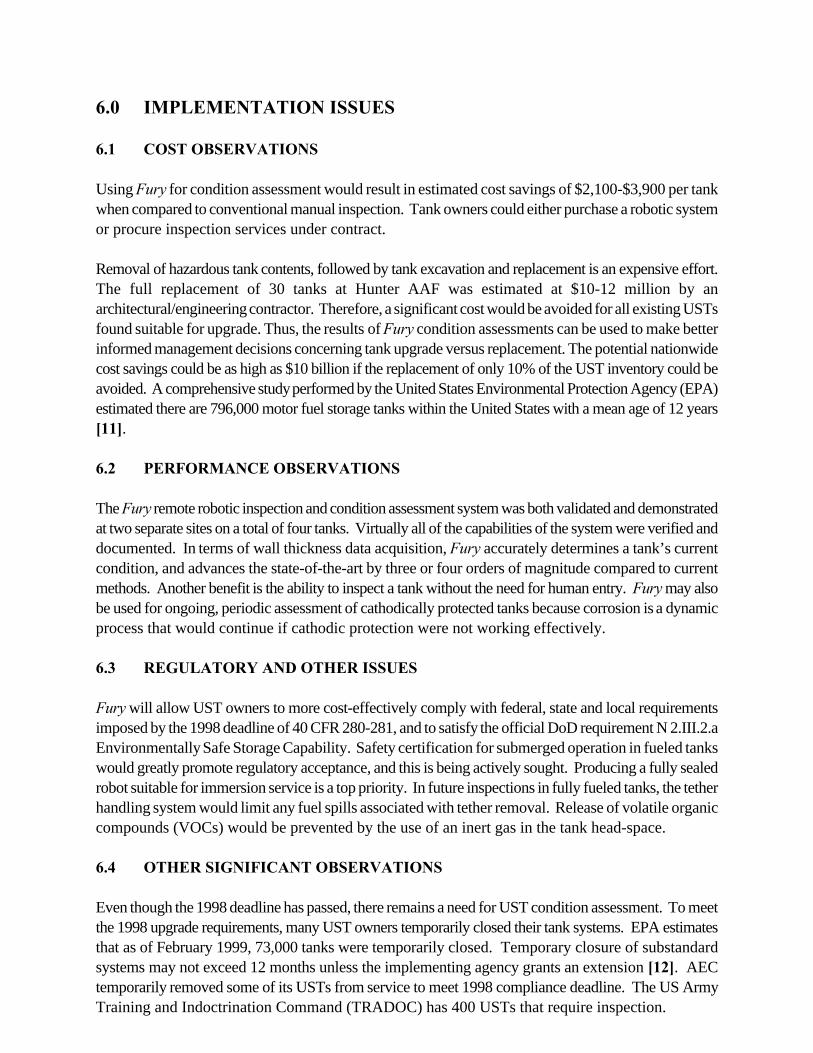
5.0 COST ASSESSMENT
An estimate of the potential life-cycle cost savings provided by a safety-certified Fury system is presentedin Table 5. Fury system costs are compared to the cost of a conventional, manual UST inspection process,which involves de-fueling and cleaning the tank, confined-space human entry, and hand-held acousticmeasurements. This cost assessment assumes purchase of a Fury unit by an Army installation.Alternatively, Fury inspection services could be purchased from a contractor on a per-tank basis.
At this stage of development, the accuracy of the cost estimate is +/- 30%, and a simple payback (with nodiscounting) is provided. A more accurate cost analysis could be made when Fury units are routinelymanufactured, and increased experience with equipment operation and data analysis has been obtained
Cost Basis:Fury System Manual Inspection150 tanks inspected per year (250d/yr)50 tanks inspected per year (250d/yr)6 sites per year, 25 tanks per site 2 sites per year, 25 tanks per site3 tanks inspected per week 1 tank inspected per weekNo de-fueling necessary De-fueling requiredSome tank access (purging, cutting) Tank access (purging, cutting, cleaning)(15% of tanks have drop tubes) (100% of tanks)1 technician (100% time) @ $320/d 2 technician (100% time) @ $320/d1 corrosion engineer (10% time) @$600/d (NIOSH requires 2 men for confined space)Site safety officer (2% time) @ $500/d1 corrosion engineer (5% time) @$600/dNo per diem (local labor) Site safety officer (2% time) @ $500/dElectricity 0.5 kW (robot) No per diem (local labor)Inert gas purge 10 cylinders @ $100 Electricity 2 kW (fuel/sludge removal)No hazwaste produced Inert gas purge 5 cylinders @ $100
Hazwaste disposal 5,000 gals @ $1/gal

Table 5. Cost Comparison of Fury vs. Manual Inspection
COST CATEGORY ($) ($) ($)
Fury Remote Conventional Tank ExcavationInspection System Manual Inspection and Replacement
Capital CostsEquipment Purchase $75,000 $5,000Vehicle & Trailer $25,000
Total $100,000 $5,000Annual O&M CostsAmortization (10-yr) $10,000 $500On-site mobilization $3,000 $1,000Maintenance $5,000 $500Parts replacement $10,000 $500Safety/equipment training $2,000 $2,000Tank access $2,500 $15,000Hazardous waste disposal $0 $5,000Technician labor $80,000 $160,000Corrosion engineer $15,000 $7,500Safety officer $2,500 $2,500Electricity $100 $300Inert gas $1,000 $500Demobilization (no hazwaste) $3,000 $1,000Total Annual O&M Costs $134,100 $196,300
Cost per tank $890 $3,930Cost per tank range $600 - $1,200 $2,750 - $5,100 $30,000 -
(+/- 30%) $300,000Annual O&M Costs $43,500 - $80,900
savings range (+ /-30%)Savings per tank $2,100 - $3,900
SIMPLE PAYBACK < 2.5 yearsPERIOD
6.0 IMPLEMENTATION ISSUES
6.1 COST OBSERVATIONS
Using Fury for condition assessment would result in estimated cost savings of $2,100-$3,900 per tankwhen compared to conventional manual inspection. Tank owners could either purchase a robotic systemor procure inspection services under contract.
Removal of hazardous tank contents, followed by tank excavation and replacement is an expensive effort.The full replacement of 30 tanks at Hunter AAF was estimated at $10-12 million by anarchitectural/engineering contractor. Therefore, a significant cost would be avoided for all existing USTsfound suitable for upgrade. Thus, the results of Fury condition assessments can be used to make betterinformed management decisions concerning tank upgrade versus replacement. The potential nationwidecost savings could be as high as $10 billion if the replacement of only 10% of the UST inventory could beavoided. A comprehensive study performed by the United States Environmental Protection Agency (EPA)estimated there are 796,000 motor fuel storage tanks within the United States with a mean age of 12 years[11].
6.2 PERFORMANCE OBSERVATIONS
The Fury remote robotic inspection and condition assessment system was both validated and demonstratedat two separate sites on a total of four tanks. Virtually all of the capabilities of the system were verified anddocumented. In terms of wall thickness data acquisition, Fury accurately determines a tank’s currentcondition, and advances the state-of-the-art by three or four orders of magnitude compared to currentmethods. Another benefit is the ability to inspect a tank without the need for human entry. Fury may alsobe used for ongoing, periodic assessment of cathodically protected tanks because corrosion is a dynamicprocess that would continue if cathodic protection were not working effectively.
6.3 REGULATORY AND OTHER ISSUES
Fury will allow UST owners to more cost-effectively comply with federal, state and local requirementsimposed by the 1998 deadline of 40 CFR 280-281, and to satisfy the official DoD requirement N 2.III.2.aEnvironmentally Safe Storage Capability. Safety certification for submerged operation in fueled tankswould greatly promote regulatory acceptance, and this is being actively sought. Producing a fully sealedrobot suitable for immersion service is a top priority. In future inspections in fully fueled tanks, the tetherhandling system would limit any fuel spills associated with tether removal. Release of volatile organiccompounds (VOCs) would be prevented by the use of an inert gas in the tank head-space.
6.4 OTHER SIGNIFICANT OBSERVATIONS
Even though the 1998 deadline has passed, there remains a need for UST condition assessment. To meetthe 1998 upgrade requirements, many UST owners temporarily closed their tank systems. EPA estimatesthat as of February 1999, 73,000 tanks were temporarily closed. Temporary closure of substandardsystems may not exceed 12 months unless the implementing agency grants an extension [12]. AECtemporarily removed some of its USTs from service to meet 1998 compliance deadline. The US ArmyTraining and Indoctrination Command (TRADOC) has 400 USTs that require inspection.

Although compliance with the 1998 deadline is thought to be approximately 80% and increasing, EPA stillneeds to ensure that all owners comply with the technical requirements and that UST systems are operatedand maintained properly. EPA will work to help states evaluate the effectiveness of UST systems especially with leak detection, cathodic protection and tank lining to ascertain that they operate properlyand to identify ways in which these systems can be improved [12]. Ongoing condition assessment is likelyto be an issue. Also, inspection of aboveground tanks every 5 years is mandated by American PetroleumInstitute Regulation API-653. Possible alternate uses of the robotic inspection system are to obtain wall thickness information on a varietyof steel structures including ship hulls, oil platforms, submersed sheet piling, locks and dams, and nuclearapplications. The ability of Fury to operate below liquid level would provide additional flexibility.Investigation of Fury inspection of submerged sheet piling already has been studied in the Cuyahoga Riverin Cleveland, OH [13].
Installation of other sensors in the inspection assembly in place of the ultrasonic transducer would allowother types of inspections to be performed. Possible sensors include magnetic flux, far field eddy current,electromagnetic acoustic transducer (EMAT) and corrosion rate measurement. Re-approval of theassembly would then be required to operate the robotic inspection system with a new sensor in classifiedareas.
The Fury project won a Department of the Army Research and Development Achievement Award for1998 and a detailed patent has been submitted to the Corps of Engineers Headquarters (case number 486).In addition, a Cooperative Research and Development Agreement (CRADA) is being sought with anindustry partner to investigate other applications.
6.5 LESSONS LEARNED
Some weaknesses in the functional reliability of Fury were apparent during the demonstrations. Aqueouscouplant managed to short out some of the on-board electronics on the second day of testing at Fort Lee,which necessitated a day of repairs. Mechanical weaknesses were also identified in rotator pins and auniversal joint used in the main drive. However, no problem identified was insurmountable and thus far allproblems were able to be addressed in the field.
The operator of the Fury system must be sure to turn on the data storage system and to maintain the datafiles at a reasonable size in order to aid later processing. Developing computer spreadsheets to facilitatethe data analysis required considerable time. RCC and Bushman recommended that CERL shouldconsider refining and protecting computer models to facilitate the data input while providing a uniform andrapid means of data assessment. This would not eliminate the need for a corrosion expert but would greatlyreduce the time required to reach a valid conclusion about the suitability of a UST system for upgrade.
6.6 SCALE-UP
There are no scale-up issues. The Fury prototype was tested in the configuration intended for future

production. It performed in-field UST condition assessment at an acceptably fast rate. Futuremanufactured units would be of identical design, with minor design improvements incorporated as part ofnormal system evolution and as operational experience increases.

This page was intentionally left blank.
7.0 REFERENCES
1. Code of Federal Regulations (CFR) 280-281: Technical Standards and Corrective ActionRequirements for Owners and Operators of Underground Storage Tanks.
2. ASTM E114 Practice for Ultrasonic Pulse-Echo Straight Beam Examination by the ContactMethod.
3. ASTM E797-94 Standard Practice for Measuring Thickness by Manual Pulse-Echo ContactMethod.
4. National Leak Prevention Association (NLPA) 631, Entry, Cleaning, Interior Inspection, Repairand Lining of Underground Storage Tanks.
5. ASTM Emergency Standard ES-40-94, "Emergency Standard Practice for Alternative Proceduresfor the Assessment of Buried Steel Tanks Prior to the Addition of Cathodic Protection", effectiveDec 1994 to Dec 1996. Replaced Sept 10, 1998 by ASTM G 158-98 Standard Guide for ThreeMethods of Assessing Buried Steel Tanks Prior to Upgrading with Cathodic Protection.
6. IT Corporation and Midwest Research Institute, “Quality Assurance Project Plan: Field Evaluationof UST Inspection Assessment Technologies,” October 1995.
7. "State-of-the-Art Procedures and Equipment for Internal Inspection of Underground StorageTanks", USEPA Office of Research and Development, EPA/600/2-90/061, January 1991.
8. ASTM G46-94 Standard Guide for Examination and Evaluation of Pitting Corrosion.
9. “Tank Inspection Results at Fort Lee, Virginia Final Report,” Midwest Research Institute, KansasCity, MO, March 7, 1997.
10. J. B. Bushman and M. J. Szeliga, “Expert Underground Storage Tank Inspection Report”, RussellCorrosion Consultants, Inc., Simpsonville, MD, April 20, 1997.
11. "Underground Motor Fuel Storage Tanks: A National Survey," Westat, Inc., Rockville, MD, May1986, No. PB86-216512.
12. Ng, Sammy. The View from U.S. EPA: Program Direction for 1999 and Beyond.Underground Tank Technology Update, Department of Professional Development, University ofWisconsin-Madison. Vol. 13, No. 5. September/October 1999.
13. Marsh C. P., R. Weber, J.B. Bushman, J. Klempir, and B.A. Temple. Robotic UnderwaterCorrosion Inspection/Assessment of Sheet Pile Along Two Rivers at Cleveland, Ohio.Cuyahoga River Bulkhead Study: Phase 2 Report. U.S. Army Construction EngineeringResearch Laboratory Technical Report 99/37. May 1999.

This page was intentionally left blank.
A-1
APPENDIX A
Points of Contact
Dr. Charles P. Marsh (principal investigator)ERDC-CERLUSACERLP.O. Box 90052902 Newmark DriveChampaign, IL 61826-9005Telephone: 217-373-6764Fax: 217-373-7227E-mail: [email protected]
Mr. Vince Hock (co-investigator)ERDC-CERLUSACERLP.O. Box 90052902 Newmark DriveChampaign, IL 61826-9005Telephone: 217-373-6753Fax: 217-373-7222E-mail: [email protected]
Mr. Robert Weber (ultrasonics)ERDC-CERLUSACERLP.O. Box 90052902 Newmark DriveChampaign, IL 61826-9005Telephone: 217-373-7239Fax: 217-373-7222E-mail: [email protected]
Mr. Jim HugarU.S. Army Petroleum CenterAMSTA-AF-PL54 M Avenue, Suite 9New Cumberland, PA 17070-5008Telephone: 717-770-5582Fax: 717-770-4230E-mail: [email protected]

A-2
Mr. Tim RichardsonDirectorate of Public Works1816 Shop RoadFort Lee, VA 23801-1604Telephone: 804-734-5070Fax: 804-734-3474E-mail: [email protected]
Mr. Vic MuldonChief Engineer, Plant and Services DivisionDirectorate of Public WorksHQ3DINDIV - Fort Stewart1117 Frank Cochran DriveFort Stewart, GA 31314-4938Telephone: 912-767-5220Fax: 912-767-5916
Mr. Bruce ThompsonRedZone Robotics2425 Liberty AvenuePittsburgh, PA 15222-4639Telephone: 412-765-3064/412-201-7234Fax: 412-765-3069E-mail: [email protected]
Mr. Jim Bushman (corrosion consultant)Bushman and Associates, IncorporatedTelephone: 330-769-3694
Mr. Dave WileyEPA Office of Underground Storage TanksTelephone: 703-603-7178


ESTCP Program Office
901 North Stuart StreetSuite 303Arlington, Virginia 22203
(703) 696-2117 (Phone)(703) 696-2114 (Fax)
e-mail: [email protected]