estcp cost and performance report - apps.dtic.mil · environmental security ... awareness since the...
TRANSCRIPT
ESTCPCost and Performance Report
ENVIRONMENTAL SECURITYTECHNOLOGY CERTIFICATION PROGRAM
U.S. Department of Defense
(RC-200723)
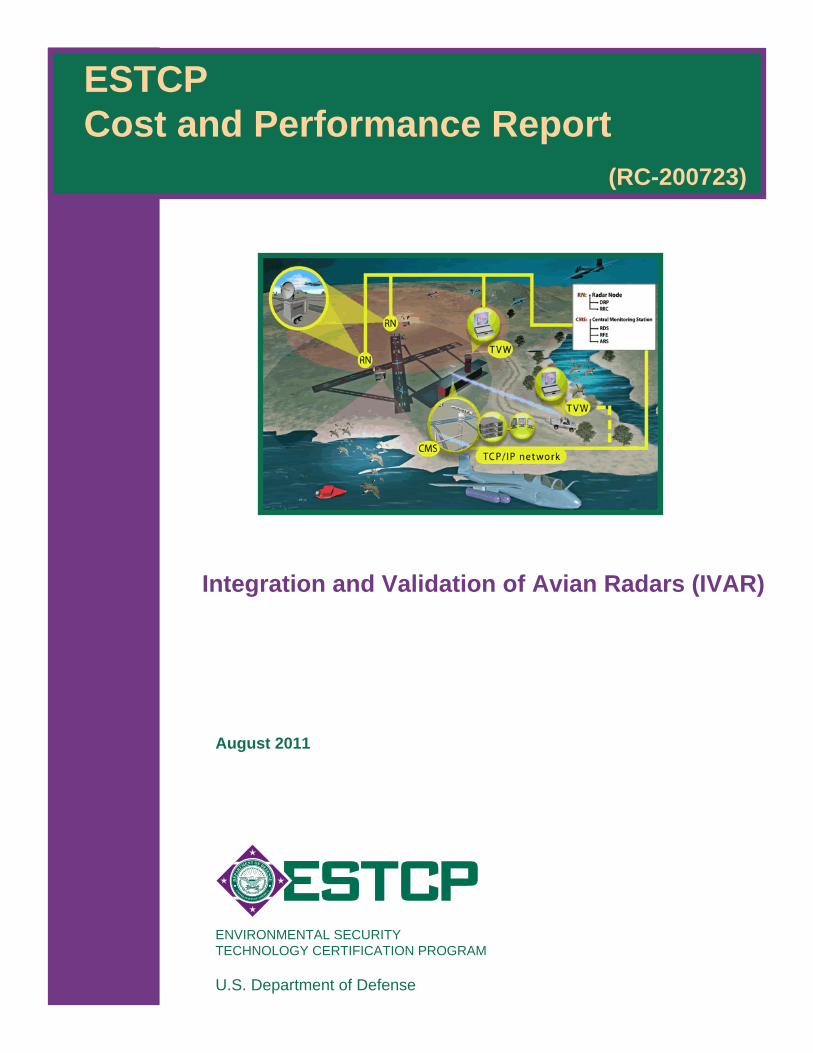
Integration and Validation of Avian Radars (IVAR)
August 2011

Report Documentation Page Form ApprovedOMB No. 0704-0188
Public reporting burden for the collection of information is estimated to average 1 hour per response, including the time for reviewing instructions, searching existing data sources, gathering andmaintaining the data needed, and completing and reviewing the collection of information. Send comments regarding this burden estimate or any other aspect of this collection of information,including suggestions for reducing this burden, to Washington Headquarters Services, Directorate for Information Operations and Reports, 1215 Jefferson Davis Highway, Suite 1204, ArlingtonVA 22202-4302. Respondents should be aware that notwithstanding any other provision of law, no person shall be subject to a penalty for failing to comply with a collection of information if itdoes not display a currently valid OMB control number.
1. REPORT DATE AUG 2011
2. REPORT TYPE N/A
3. DATES COVERED -
4. TITLE AND SUBTITLE Integration and Validation of Avian Radars (IVAR)
5a. CONTRACT NUMBER
5b. GRANT NUMBER
5c. PROGRAM ELEMENT NUMBER
6. AUTHOR(S) 5d. PROJECT NUMBER
5e. TASK NUMBER
5f. WORK UNIT NUMBER
7. PERFORMING ORGANIZATION NAME(S) AND ADDRESS(ES) Environmental Security Technology Certification Program U.S.Department of Defense
8. PERFORMING ORGANIZATIONREPORT NUMBER
9. SPONSORING/MONITORING AGENCY NAME(S) AND ADDRESS(ES) 10. SPONSOR/MONITOR’S ACRONYM(S)
11. SPONSOR/MONITOR’S REPORT NUMBER(S)
12. DISTRIBUTION/AVAILABILITY STATEMENT Approved for public release, distribution unlimited
13. SUPPLEMENTARY NOTES The original document contains color images.
14. ABSTRACT
15. SUBJECT TERMS
16. SECURITY CLASSIFICATION OF: 17. LIMITATION OF ABSTRACT
SAR
18. NUMBEROF PAGES
57
19a. NAME OFRESPONSIBLE PERSON
a. REPORT unclassified
b. ABSTRACT unclassified
c. THIS PAGE unclassified
Standard Form 298 (Rev. 8-98) Prescribed by ANSI Std Z39-18

i
COST & PERFORMANCE REPORT Project: RC-200723
TABLE OF CONTENTS
Page
1.0 EXECUTIVE SUMMARY ................................................................................................ 1 1.1 BACKGROUND .................................................................................................... 1 1.2 OBJECTIVES OF THE DEMONSTRATION ....................................................... 1 1.3 DEMONSTRATION RESULTS ............................................................................ 1 1.4 IMPLEMENTATION ISSUES .............................................................................. 2
2.0 INTRODUCTION .............................................................................................................. 3 2.1 BACKGROUND .................................................................................................... 3 2.2 OBJECTIVES OF THE DEMONSTRATION ....................................................... 4 2.3 REGULATORY DRIVERS ................................................................................... 5
3.0 TECHNOLOGY/METHODOLOGY DESCRIPTION ...................................................... 7 3.1 TECHNOLOGY/METHODOLOGY OVERVIEW ............................................... 7 3.2 ADVANTAGES AND LIMITATIONS OF THE TECHNOLOGY/
METHODOLOGY ............................................................................................... 10
4.0 PERFORMANCE OBJECTIVES .................................................................................... 13
5.0 SITE DESCRIPTION ....................................................................................................... 23 5.1 SITE LOCATION AND HISTORY ..................................................................... 23 5.2 SITE CHARACTERISTICS ................................................................................. 23
6.0 TEST DESIGN ................................................................................................................. 25 6.1 CONCEPTUAL TEST DESIGN .......................................................................... 25 6.2 BASELINE CHARACTERIZATION AND PREPARATION............................ 25 6.3 DESIGN AND LAYOUT OF TECHNOLOGY AND METHODOLOGY
COMPONENTS ................................................................................................... 25 6.4 FIELD TESTING.................................................................................................. 26
6.4.1 Automatic Tracking .................................................................................. 26 6.4.2 Sampling Protocols ................................................................................... 26 6.4.3 Data Streaming.......................................................................................... 27 6.4.4 Data Integration ........................................................................................ 27 6.4.5 Data Fusion ............................................................................................... 27
6.5 SAMPLING PROTOCOL .................................................................................... 27 6.6 SAMPLING RESULTS ........................................................................................ 28
7.0 PERFORMANCE ASSESSMENT .................................................................................. 29 7.1 AUTOMATIC TRACKING ................................................................................. 29 7.2 SAMPLING PROTOCOL .................................................................................... 30 7.3 DATA STREAMING ........................................................................................... 30 7.4 DATA INTEGRATION ....................................................................................... 31

TABLE OF CONTENTS (continued)
Page
ii
7.5 DATA FUSION .................................................................................................... 32 7.6 ADDITIONAL OBJECTIVES ............................................................................. 33
8.0 COST ASSESSMENT ...................................................................................................... 35 8.1 COST MODEL ..................................................................................................... 35 8.2 COST DRIVERS .................................................................................................. 37 8.3 COST ANALYSIS AND COMPARISON ........................................................... 37
9.0 IMPLEMENTATION ISSUES ........................................................................................ 39
10.0 REFERENCES ................................................................................................................. 43 APPENDIX A POINTS OF CONTACT......................................................................... A-1

iii
LIST OF FIGURES
Page Figure 1. Chronology of avian radar developments. .............................................................. 7Figure 2. eBirdRad trailer at MCASCP. ................................................................................. 8Figure 3. Components of a digital avian radar system. .......................................................... 8Figure 4. Conceptual diagram of an avian radar network. ..................................................... 9Figure 5. Typical display of eBirdRad avian radar system, NAS Patuxent River, April 17, 2007, 21:45 EDT. .................................................................................. 10 Figure 6. Map of IVAR study locations. “Sicom” = ARTI. ................................................ 23Figure 7. Comparison of 5-minute segments for all thermal imager (TI) counts of
birds versus radar counts of birds in the same sampling volume. ........................ 29Figure 8. Alarm triggered as a flock of Black-bellied Plovers (Pluvialis squatarola)
enters an alarm region set for NAS Whidbey Island on January 25, 2008. .......... 31Figure 9. Schematic diagram showing how track data from three radars can be displayed on separate monitors (upper) or integrated into a COP (lower). .......... 32Figure 10. COP display showing fused tracks from the WIAR1 and eBirdRad radars
for the two targets at NAS Whidbey Island on November 13, 2009. ................... 33

iv
LIST OF TABLES
Page Table 1. Capabilities of technologies for sampling bird populations. ................................ 11Table 2. Performance Objectives ........................................................................................ 14Table 3. Summary of the IVAR study locations. ................................................................ 24Table 4. Number of targets tracked during 15-minute intervals in four seasons in
four compass quadrants centered on the avian radar system at SEA-TAC International Airport, demonstrating seasonal differences in abundance but relatively uniform distributions of total tracks through 360° of azimuth. ............ 30
Table 5. Cost model for a stand-alone avian radar system. ................................................ 35Table 6. Cost Model for an integrated avian radar system. ................................................ 36Table 7. Cost model for an advanced avian radar system. .................................................. 36Table 8. Estimated cost of a typical avian radar system amortized over a 5-year
life span. ................................................................................................................ 38

v
ACRONYMS AND ABBREVIATIONS AGL above ground level ARS automated radar scheduler ARTI Accipiter Radar Technologies, Inc. BASH bird-aircraft strike hazard BirdRad bird radar CEAT Center of Excellence for Airport Technology CNIC Commander of Naval Installations Command CONOPS concept of operations COP common operational (or operating) picture COTS commercial off-the-shelf CSC Computer Sciences Corporation DIACAP DoD Information Assurance Certification and Accreditation Process DoD Department of Defense DRP digital radar processor EAFB Elmendorf Air Force Base eBirdRad Enhanced Bird Radar (system) ESA Endangered Species Act ESTCP Environmental Security Technology Certification Program FAA Federal Aviation Administration GIS geographic information system GPS Global Positioning System HERF hazards of electromagnetic radiation to fuel HERO hazards of electromagnetic radiation to ordnance HERP hazards of electromagnetic radiation to personnel IMM Interacting Multiple Model INRMP Integrated Natural Resources Management Plan IVAR Integration and Validation of Avian Radars LAN local area network MCASCP Marine Corps Air Station, Cherry Point, NC MHT Multiple Hypothesis Testing NASPR Naval Air Station, Patuxent River, MD NASWI Naval Air Station, Whidbey Island, WA NAVFAC Naval Facilities Engineering Command nmi nautical mile

ACRONYMS AND ABBREVIATIONS (continued)
vi
NRM natural resources management OPAREA operating areas POR program of record RCH remotely controlled helicopter RDM radar data manager RDS radar data server RF radio-frequency RFE radar fusion engine ROI return on investment RRC radar remote controller RST radar sensor transceiver SEA-TAC Seattle-Tacoma International Airport, WA SSC Pacific Space and Naval Warfare Systems Center Pacific SSC-SD Space and Naval Warfare Systems Center San Diego, CA TI thermal imager TVW TrackViewer Workstations UAV Unmanned Aerial Vehicle USDA United States Department of Agriculture WAN Wide Area Network WiFi Wireless Fidelity WS Wildlife Services

Technical material contained in this report has been approved for public release. Mention of trade names or commercial products in this report is for informational purposes only;
no endorsement or recommendation is implied.
vii
ACKNOWLEDGEMENTS Financial support for the Integration and Validation of Avian Radars (IVAR) project was provided by the Sustainable Infrastructure program area (now Resource Conservation and Climate Change) of the Department of Defense (DoD) Environmental Security Technology Certification Program (ESTCP). The IVAR project and the Center for Excellence for Airport Technology (CEAT) project (see Section 2.2) shared equipment and other resources at those locations where both projects conducted studies. Finally, the facilities that served as the IVAR study locations made in-kind contributions of staff, vehicles, communications equipment, and other resources in support of this project. The following people and organizations have contributed to the efforts of the IVAR project. Those noted with an asterisk (*) are points of contact for the IVAR project and are listed in Appendix A. Accipiter Radar Technologies, Inc. (ARTI)
Robert Beason* Carl Krasnor Al Premji Sean Clifford Julia Moule Andy Ukrainec Graeme Jones Tim Nohara* Peter Weber
University of Illinois/Center of Excellence for Airport Technology (CEAT)
Wendell Bunch Peter Lazar Dave Mayer Ed Herricks* Sid Majumdar Beth Woodworth
Chief of Naval Operations (N45)
Andy Del Collo* Clemson University/Edisto Island
Carroll Belser Sid Gauthreaux, Jr. * Computer Sciences Corporation (CSC)
Robert Clark* Sheila O’Brien Gerry Key* Rebecca Streib-Montee
DoD ESTCP
John Hall Jeffrey Marqusee John Thigpen DoD/Partners in Flight
Chris Eberly U.S. Federal Aviation Administration (FAA)
Ryan King*
viii
Elmendorf Air Force Base (EAFB) Chuck Benbow Herman Griese* Chris Dotur David Young
Marine Corps Air Station, Cherry Point, NC
Carmen Lombardo Bill Rogers Naval Air Station, Whidbey Island, WA
Bill Applegate Clarence Hein Matt Klope* Ann Casey Jill Hein Cody Mcloud Linda Dwight
Naval Air Station, Patuxent River, MD
Melanie Anderson Paul Parzynski Jim Swift* Bob Boxwell Hannah Perrin Beverly Walker Patty Craig Kyle Rambo Warren Walker Alexis Gray Jackie Smith Kevin Weinelt
Naval Facilities Engineering Command (NAVFAC) Headquarters
Joe Hautzenroder* Laura Muhs* Seattle-Tacoma International Airport
Steve Osmek* Space and Naval Warfare Systems Center Pacific (SSC Pacific)
Marissa Brand* United States Department of Agriculture (USDA)/Wildlife Services (WS)
Steve Ball Wayne Harris Mike Stevens Mike Begier* Dane Ledbetter Patrick Viehoever Chris Bowser* Dennis Lewis Bill Wilmoth Bob Brunke Jerry Morrill Keri Yankus Jason Gilsdorf Lawrence Shaffer

1
1.0 EXECUTIVE SUMMARY
1.1 BACKGROUND
Military bases and ranges have become refugia for birds and other wildlife as encroachment has turned once-rural military facilities into islands of habitat diversity surrounded by seas of urbanization. This trend has increased the military’s already significant role as stewards of its environment and is straining the ability of natural resource managers to protect the wildlife at these facilities while ensuring that the military can prepare and train for its primary missions. In parallel, the hazards and costs from bird strikes have increased markedly—as has public awareness since the crash of US Airways Flight #1549 into the Hudson River on January 15, 2009. Resource managers need better tools to aid them in their efforts: Digital avian radars appear to be such a tool.
1.2 OBJECTIVES OF THE DEMONSTRATION
The Integration and Validation of Avian Radars (IVAR) project was established to determine whether commercial off-the-shelf (COTS) digital avian radar technology can provide useful and accurate data on bird movements in real-world operational environments at military facilities. The IVAR team established six performance objectives with 38 metrics and criteria to test digital avian radar systems built by Accipiter Radar Technologies, Inc. (ARTI) and conducted demonstration and validation studies at seven locations: Marine Corps Air Station Cherry Point, NC (MCASCP); Naval Air Station Patuxent River, MD (NASPR); Naval Air Station Whidbey Island, WA (NASWI); Elmendorf Air Force Base (EAFB), AK; Seattle-Tacoma International Airport (SEA-TAC), WA; Edisto Island, SC; and ARTI, Ontario, Canada.
1.3 DEMONSTRATION RESULTS
More than 1500 targets being tracked automatically by the radars were confirmed by visual observers to be birds. We also used thermal imaging to confirm that targets tracked by the radar at night were birds. We demonstrated that these avian radars could operate unattended to track birds in 3-D in real time over a range of 0-11 km, up to altitudes of 1 km, through a complete 360° field-of-view, and could do so continuously 24/7 for a period of years. We further demonstrated that these systems can track more than 100 targets simultaneously, that they can detect 50 times more birds than human observers using conventional visual methods, and that they can record a host of parameters (e.g., time, location, speed, heading, etc.) for each tracked target and stream these target data in real time across both local- and wide-area networks with a high degree of reliability for storage and/or redistribution to other sites to display on maps, to generate graphs of bird activity patterns in both time and space, and to activate user-defined alerts to resource managers and air operations personnel when birds enter a critical airspace in specified densities, altitudes, directions of flight, etc. And finally we demonstrated that these avian radars can combine the tracks from two or more radars into an integrated display that increases situational awareness for the operators, and can fuse the tracks of targets in those areas where the radar beams overlap into common tracks that increase track continuity across the common operational picture (COP).

2
The IVAR project also demonstrated that the cost of operating an avian radar system is low compared to the cost of providing the same coverage, where it’s even possible, with human observers, while the reliability of the systems is high and most routine maintenance can be handled by local personnel or remotely by the vendor when network connectivity is available. Moreover, little training is required for local users to learn to operate these avian radar systems and utilize the data they generate.
1.4 IMPLEMENTATION ISSUES
The cost of acquiring, installing, and operating an avian radar system can vary greatly depending on the facility’s requirements. System costs ranged from $425,000 for a standalone system configuration that includes the radar system, installation, and operation and maintenance spread over a 5-year lifespan, to $1,850,000 for an advanced network-capable system with a data fusion capability and a statistical processor operated over a 7-year lifespan. As regards transferring this technology into operational use, the avian radar systems evaluated by the IVAR project, as well as systems by other vendors, are available today as COTS products. Based on the results of the IVAR project, the IVAR team has created a Functional Requirements and Performance Specifications for Avian Radar Systems document as a companion to the Final Report to assist users in determining what features to look for in an avian radar system based on their requirements, and at what level to expect these systems to perform the specified functions. The Federal Aviation Administration (FAA) has also released a draft Advisory Circular 150/5220-25 on avian radar systems that provides guidance and performance specifications for selecting, deploying, and operating avian radar systems at civil airports, much of which is equally applicable at military airfields. And finally, the U.S. Air Force has, and the U.S. Navy (including the Marine Corps) is in the process of implementing, bird-aircraft strike hazard (BASH) programs of record that (will) provide both policy and funding guidance to military facilities.

3
2.0 INTRODUCTION
2.1 BACKGROUND
Encroachment has made once rural military facilities refugia for birds and other wildlife. This has increased the military’s already significant role as stewards of their environment and home for many species with protected status. Now encroachment is increasing inside the fence line, as facilities take on more activities to remain mission-relevant. BASH managers at airfields and training ranges must know the behavior and ecology of resident and migratory birds in order to reduce bird-strikes that cause more than $600 million/yr in damage to U.S. military and civilian aircraft, plus the danger they pose to aircrews and passengers. These trends are straining the ability of natural resource and wildlife managers to protect the wildlife at these facilities while ensuring that the military can prepare and train for its primary missions, and are further compounded by the mandate for managers to “do more with less.” Military resource managers need tools that yield better situational awareness, provide a clearer understanding of where and when birds are present, insights into what attracts them to certain locations, and how changes in the natural or manmade environments affect their distribution. Current sampling methods (e.g., visual observations) are slow, costly, limited to daytime observations, and not well suited to real-time situational awareness. Although radar has been known to detect birds since the 1940s (Lack and Varley, 1945), it was only until recently that most avian radars were considered research tools. In 2000, under contract to the Department of Defense’s (DoD) Legacy Program Office, Clemson University developed six bird radars (BirdRad) that employed conventional X-band marine radars for used by military BASH and natural resource managers. The design requirements for these BirdRad systems were:
• Detect birds through an azimuth of 360 over a range of 0-11 km (0-6 nautical miles [nmi]).
• Make it possible to estimate the target’s height as well as range and azimuth
• Be mobile, i.e., so the unit could be moved within and between facilities
• Relatively low cost. Based on interviews with users of these BirdRad system, the Space and Naval Warfare Systems Center San Diego (SSC-SD) contracted with ARTI in 2003 to develop a prototype digital avian radar system combining ARTI’s digital radar processor (DRP) with the X-band marine radars used for BirdRad. The design objectives for this Enhanced Bird Radar (eBirdRad) system were:
• Remove ground clutter
• Automatically detect and track biological targets
• Automatically capture track data
• Automatic/remote operation of the radar

4
• Develop a sampling control software to control the collection of data
• Record bird observation data in a database
• Display tracks in a geographic information system (GIS) (i.e., overlay tracks on a map)
• Ruggedized for field operations. eBirdRad was field-tested in 2005. Based on the success of those trials, SSC-SD formed a team of scientists and engineers from governmental, industry, and academia and applied to DoD’s Environmental Security Technology Certification Program (ESTCP) for funds to demonstrate that digital avian radar technology could be scaled and integrated into operational military environments. This project was named Integration and Validation of Avian Radar (IVAR). The IVAR project joined in a collaborative effort at the Center for Excellence in Airport Technology (CEAT) at the University of Illinois that was funded by FAA to evaluate the maturity of avian radar technology for use at civil airports.
2.2 OBJECTIVES OF THE DEMONSTRATION
The objectives of the IVAR project were to demonstrate these capabilities of digital avian radar systems:
• Automatic Tracking. Automatically detect and track birds in real time at least as well as a human observer of the same scene on an analog radar display.
• Sampling Protocols. Operate automatically, remotely, or manually to measure daily and seasonal bird activity at different geographic locations.
• Data Streaming. Transmit the target track data these systems generate in real time across computer networks for storage, analysis, visualization, and redistribution.
• Data Integration. Increase situational awareness by combining track data from multiple radars into a common operational picture.
• Data Fusion. Increase track continuity by fusing tracks from multiple radars into common tracks.
• Additional. Can be operated easily and safely by personnel with no prior experience and minimal training, and are affordable to purchase and cost-effective to operate.
A total of 38 performance objectives were developed by the IVAR project to demonstrate these capabilities of digital avian radar systems: All 24 quantitative and 14 qualitative objectives were successfully demonstrated. A seventh objective, the Functional Requirements and Performance Specifications, is an additional program objective that is included as part of the discussion with respect to technology transfer to guide future potential users in the process of evaluating, acquiring and operating digital avian radar systems.
5
2.3 REGULATORY DRIVERS
While DoD ranks fifth among federal landholders in terms of the number acres it controls, it hosts three times the density of species listed as threatened or endangered under the Endangered Species Act (ESA) of any other federal landholder (Stein et al., 2008). The Navy alone has known or potential endangered species of birds on over 90% of it ranges, and 30% of the endangered bird species found on all DoD lands occur on Navy ranges. These statistics underscore the importance of sound stewardship of natural resources at DoD installations. Ecosystem management principles are employed in the planning, training, and operations at DoD installations through Integrated Natural Resources Management Plans (INRMPs) at each military facility with significant natural resources, as required by the Sikes Act Improvement Act of 1997 (16 U.S.C. 670a et seq.). These INRMPs also help DoD meet specific conservation requirements mandated by ESA, the Migratory Bird Treaty Act, Clean Water Act, National Environmental Policy Act, and a host of Executive Orders. The importance of these requirements is further amplified in a variety of DoD directives (e.g., DoD Directive 4715.3, Environmental Conservation Program and DoD Directive 3200.15, Sustainment of Ranges and Operating Areas [OPAREAs]) and programs (e.g., DoD Partners in Flight). Monitoring activities are also necessary to comply with the Migratory Bird Treaty Act (16 U.S.C. 703–712), the Memorandum of Understanding required by Executive Order 13186 (Responsibilities of Federal Agencies to Protect Migratory Birds), and the Migratory Bird Rule governing the incidental take of migratory birds as required by Section 315 of the FY 2003 Defense Authorization Act. More recent drivers for increased monitoring of bird populations at DoD facilities include:
• February 2007 report of the North American Bird Conservation Initiative titled “Opportunities for Improving Avian Monitoring”
• Efforts to prepare a DoD Coordinated Monitoring Plan, in which radar technologies are anticipated to figure prominently (Chris Eberly, personal communication)
• Guidelines that are being prepared for locating wind farm facilities on DoD lands. The following directives establish the policy and procedures for the military BASH programs: Navy/Marine Corps1
:
NAVFAC P-73 Manual, Real Estate Procedural Manual (Provides guidelines to create a BASH Plan)
1 The Navy has removed its BASH instructions from OPNAVINST 5090.1, and is instead preparing separate BASH instructions for the Commander of Naval Installations Command (CNIC) (M. Klope, personal communication, 2009).

6
OPNAVINST 3750, Naval Aviation Safety Program (Requires all aircraft/wildlife strike events to be reported to the Naval Safety Center)
Air Force:
Pamphlet 91-212—Bird/Wildlife Aircraft Strike Hazard Management Techniques.
7
3.0 TECHNOLOGY/METHODOLOGY DESCRIPTION
Section 3 provides a brief historical summary of avian radar systems development, together with some of the advantages and limitations of this technology.
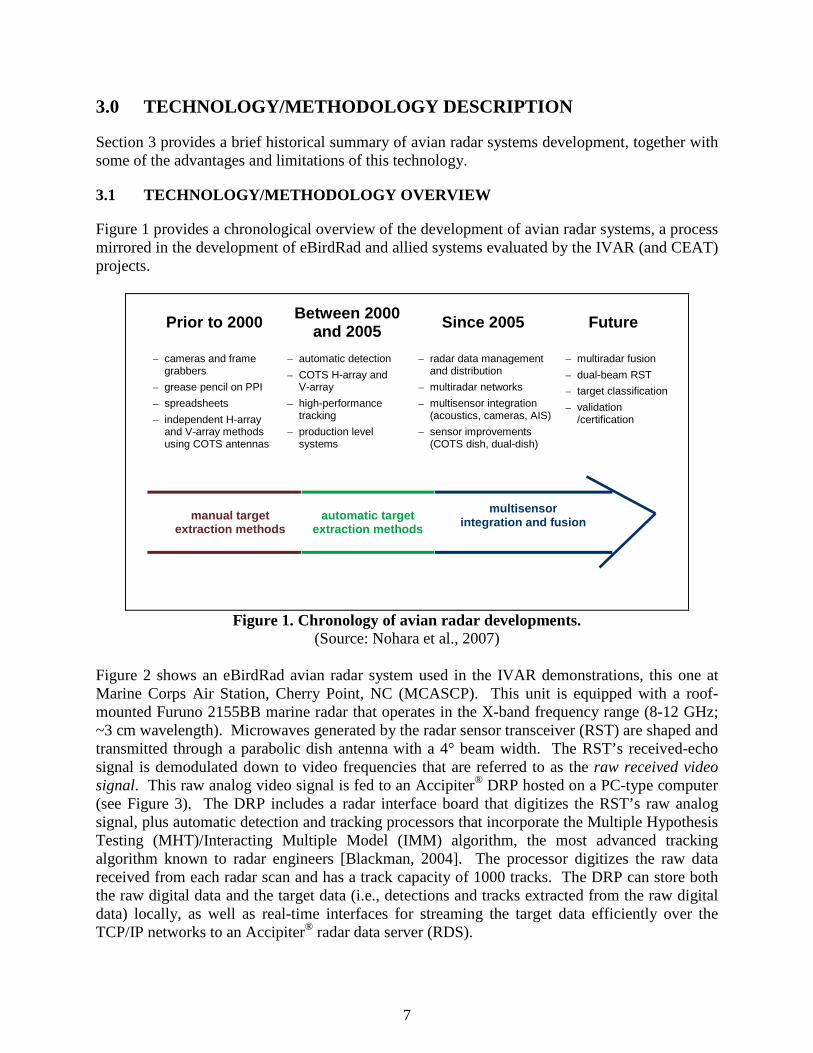
3.1 TECHNOLOGY/METHODOLOGY OVERVIEW
Figure 1 provides a chronological overview of the development of avian radar systems, a process mirrored in the development of eBirdRad and allied systems evaluated by the IVAR (and CEAT) projects.
Prior to 2000 Between 2000 and 2005 Since 2005 Future
– cameras and frame grabbers
– grease pencil on PPI – spreadsheets – independent H-array
and V-array methods using COTS antennas
– automatic detection – COTS H-array and
V-array – high-performance
tracking – production level
systems
– radar data management and distribution
– multiradar networks – multisensor integration
(acoustics, cameras, AIS) – sensor improvements
(COTS dish, dual-dish)
– multiradar fusion – dual-beam RST – target classification – validation
/certification
manual target extraction methods
automatic target extraction methods
multisensor integration and fusion
Figure 1. Chronology of avian radar developments.
(Source: Nohara et al., 2007) Figure 2 shows an eBirdRad avian radar system used in the IVAR demonstrations, this one at Marine Corps Air Station, Cherry Point, NC (MCASCP). This unit is equipped with a roof-mounted Furuno 2155BB marine radar that operates in the X-band frequency range (8-12 GHz; ~3 cm wavelength). Microwaves generated by the radar sensor transceiver (RST) are shaped and transmitted through a parabolic dish antenna with a 4° beam width. The RST’s received-echo signal is demodulated down to video frequencies that are referred to as the raw received video signal. This raw analog video signal is fed to an Accipiter® DRP hosted on a PC-type computer (see Figure 3). The DRP includes a radar interface board that digitizes the RST’s raw analog signal, plus automatic detection and tracking processors that incorporate the Multiple Hypothesis Testing (MHT)/Interacting Multiple Model (IMM) algorithm, the most advanced tracking algorithm known to radar engineers [Blackman, 2004]. The processor digitizes the raw data received from each radar scan and has a track capacity of 1000 tracks. The DRP can store both the raw digital data and the target data (i.e., detections and tracks extracted from the raw digital data) locally, as well as real-time interfaces for streaming the target data efficiently over the TCP/IP networks to an Accipiter® radar data server (RDS).
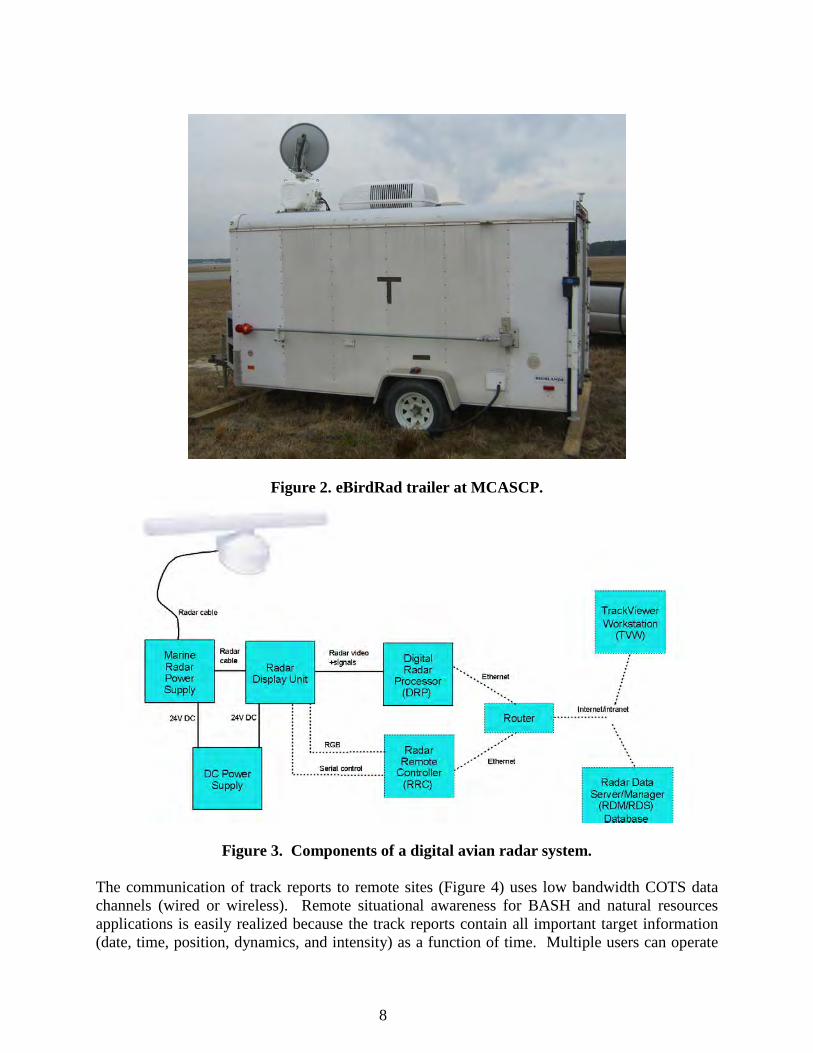
8
Figure 2. eBirdRad trailer at MCASCP.
Figure 3. Components of a digital avian radar system. The communication of track reports to remote sites (Figure 4) uses low bandwidth COTS data channels (wired or wireless). Remote situational awareness for BASH and natural resources applications is easily realized because the track reports contain all important target information (date, time, position, dynamics, and intensity) as a function of time. Multiple users can operate

9
remote TrackViewer Workstations (TVW) in different locations simultaneously, with each connected to the same RDS and tailored to process and display the data to his or her mission. The radar fusion engine (RFE) illustrated in Figure 4 is designed to combine track information recorded in the RDS from multiple radars so that remote applications have access to all track data, while the radar remote controller (RRC), combined with network interfaces to the DRP, supports complete remote control of the radars (including powering the radar on and off, switching from transmit to standby, and changing the transmitted waveform). The automated radar scheduler (ARS) can automatically schedule the operation of the radar and the DRP via the RRC. Figure 5 show a typical display from the DRP.
Figure 4. Conceptual diagram of an avian radar network.

10
Figure 5. Typical display of eBirdRad avian radar system, NAS Patuxent River, April 17, 2007, 21:45 EDT.
North is up; radar range setting is 3 nmi (5.5 km), range rings are 0.3 nmi (556 m) apart. Red trails are target tracks; white label at the head of a track is the target’s speed, in knots.
3.2 ADVANTAGES AND LIMITATIONS OF THE TECHNOLOGY/ METHODOLOGY
Table 1 summarizes the advantages and limitations of avian radar compared to other technologies.

11
Table 1. Capabilities of technologies for sampling bird populations.
Capability
Bird-Sampling Technology Radar
(Digital) Radar
(Analog) Thermal Auditory Visual Automated real-time tracking √ Range of detection ≥11 km
(6 nmi) ≥11 km (6 nmi)
~2.8 km (1.5 nmi)
<0.9 km (0.5 nmi)
~3.7 km (2 nmi)
Covers 360º of azimuth √ √ √ √ Computes 3-D spatial coordinates √(a) (b) 24/7 operations √ √ √ √ Automatic/remote control √ √ Detects targets day or night √ √ √ √ Real-time fusion of target tracks √ Real-time geospatial display √ Can detect all species √ √ √ √ Network-compatible √ √ Service-oriented architecture √ Automated data capture √ √ Can identify species √ √ Horizon-to-horizon coverage √ Passive detection √ √ √
(a) Not available with slotted-array antennas; see Technical Advances. (b) Only when multiple sensors are deployed and can triangulate on the target

This page left blank intentionally.

13
4.0 PERFORMANCE OBJECTIVES
Table 2 lists the performance objectives, including 24 quantitative plus 14 qualitative performance metrics and accompanying criteria. As noted in Table 2, all 24 quantitative performance metrics met or exceeded their specified success criteria (“Demonstrated”), as did all 14 qualitative performance objectives (“Achieved”).

14
Table 2. Performance Objectives Performance
Objective Metrics* Description Data Requirements Success Criteria Results Quantitative Performance Objectives
Automatic tracking
PA1.1 - Tracks single birds and flocks
Use visual and thermal confirmations to validate targets auto-tracked by radar are birds. Use unmanned aerial vehicle (UAV) to independently confirm target’s spatial coordinates.
Visual observers at different ranges and bearings will confirm as birds targets tracked by radar. A thermal imager will be used to identify biological targets passing through radar beam. Data from recording Global Positioning System (GPS) in a remotely controlled helicopter (RCH) will be compared with coordinate data from radar tracks of that target.
Evidence of 100+ ground-truthed tracks at each of 3 geographic locations.
Demonstrated: 100+ targets visually confirmed as birds at 3 locations; high correlation of radar & thermal tracks for 900+ targets; 60% of radar coordinates were within ±10 m of GPS-recorded coordinates from RCH.
PA2.1 - Provides location information versus time for each track
The track data recorded by the radar includes 3-D spatial coordinates of the targets.
Representative sample of track data from validation or other studies.
Latitude, longitude, height (and other parameters) recorded every ~2.5 seconds.
Demonstrated: 4-D coordinates + other parameters recorded for a target during each update scan of the radar.
PA3.1 - Track capacity Radar capable of simultaneously tracking at least 100 targets.
Image of radar display and track records during a period of intense bird activity.
>100 targets tracked simultaneously.
Demonstrated: Radar tracked 234 targets simultaneously.
PA4.1 - Tracks single large birds on airfield
Radar capable of tracking large birds within the perimeter of most airfields.
Identify visual confirmations of a large bird tracked within the perimeter of the largest study location.
Can track raptor-sized birds out to 2 km range with acceptable uncluttered display.
Demonstrated: Tracked 10 large birds ≥2.2 km from the radar.
PA5.1 - Tracks birds beyond airfield
Radar capable of tracking birds beyond the perimeter of most airfields.
Identify a large bird tracked outside the perimeter of the largest study location.
Can track birds out to 5 km range.
Demonstrated: Detected and tracked birds out to 5 km range, and up to 3 km beyond the airfield perimeter.

Table 2. Performance Objectives (continued)
15
Performance Objective Metrics* Description Data Requirements Success Criteria Results
Sampling protocols
PB1.1 - Monitors and records bird tracks 24/7
Radar capable of continuously monitoring bird activity for extended periods of time.
Evidence of continuous track records from a radar at a study location.
One week+ continuous data collection.
Demonstrated: 1-hour track histories demonstrate 1 week of 24/7 operation for two radars.
PB2.1 - Samples birds 360 deg in field of view
Radar capable of monitoring bird activity from any direction at a facility.
Plots and track data from a study location at which bird activity was widespread.
Evidence of bird tracks acquired over 360°.
Demonstrated: Track histories from 4 times in 1 year show tracks in all quadrants.
SB3.1 - Samples out to 11 km (6 nmi).
The instrumented range of the radar exceeds 11 km (6 nmi)
Plots & track data from study location with range set to include 11 km (6 nmi).
Evidence of one or more targets tracked at a range of ≥11 km (6 nmi).
Demonstrated: Multiple birds were tracked >11 km (6 nmi) from the EAFB radar.
PB4.1 - Efficiently stores bird track information
Plots & tracks data storage requirements; are low enough to permit accumulating enough data for multiyear comparisons.
Determine the mass storage requirements for one year’s worth of plots and tracks data files and for the equivalent database storage.
Local storage of one or more years’ worth of data is technically feasible and affordable enough to support year-to-year comparison.
Demonstrated: The plots and track data files from five radars ranged from 27-190 GB, and would fit on an inexpensive COTS mass storage device.
PB5.1 - Increase in number of birds sampled
Radar detects and tracks more birds than conventional visual sampling methods.
Routine visual census data from an area for which radar track data are available for the same times.
Evidence of 100%+ improvement over baseline visual sampling.
Demonstrated: Radar detects 4X birds as a visual observer for 5 min periods; 50X birds for 1-hour periods.
SB6.1 Samples up to 0.9 km.
Radar capable of detecting and tracking targets at higher elevations, as might be the case with migrating birds.
Plots and track data collected with a dish antenna angle set high enough so that targets 0.9 km above ground level (AGL) or higher are within range.
Evidence of target being tracked at an altitude of at least 0.9 km AGL.
Demonstrated: 17 birds were tracked above 0.9 km in a selected scan of the radar.
Data streaming
PC1.1 Target data streaming integrity assured
Target data sent over TCP/IP networks arrives at RDS intact.
Using a wired connection to the DRP, select 1-hour period and compare tracks recorded by DRP with those streamed to RDS to identify corrupted values and compute integrity.
Data errors <5% at a single site, SEA-TAC. The RDS will be at ARTI.
Demonstrated: 100% integrity maintained streaming data for 1 hour from SEA-TAC to ARTI.
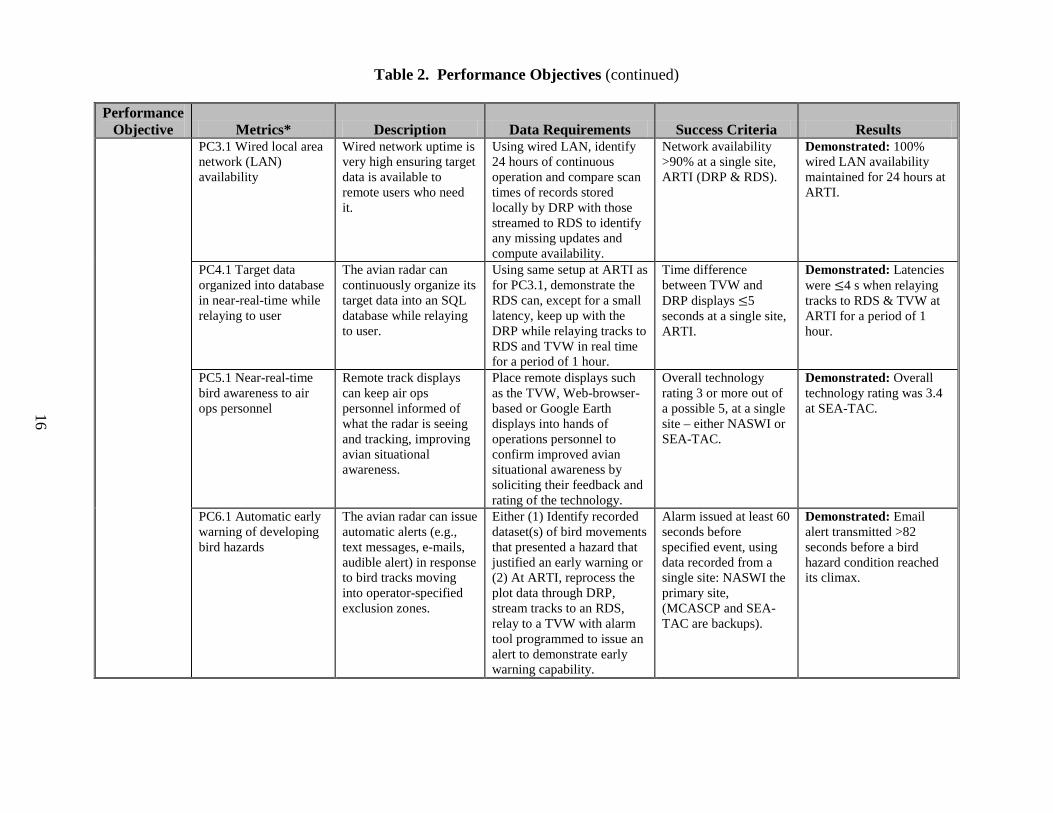
Table 2. Performance Objectives (continued)
16
Performance Objective Metrics* Description Data Requirements Success Criteria Results
PC3.1 Wired local area network (LAN) availability
Wired network uptime is very high ensuring target data is available to remote users who need it.
Using wired LAN, identify 24 hours of continuous operation and compare scan times of records stored locally by DRP with those streamed to RDS to identify any missing updates and compute availability.
Network availability >90% at a single site, ARTI (DRP & RDS).
Demonstrated: 100% wired LAN availability maintained for 24 hours at ARTI.
PC4.1 Target data organized into database in near-real-time while relaying to user
The avian radar can continuously organize its target data into an SQL database while relaying to user.
Using same setup at ARTI as for PC3.1, demonstrate the RDS can, except for a small latency, keep up with the DRP while relaying tracks to RDS and TVW in real time for a period of 1 hour.
Time difference between TVW and DRP displays ≤5 seconds at a single site, ARTI.
Demonstrated: Latencies were ≤4 s when relaying tracks to RDS & TVW at ARTI for a period of 1 hour.
PC5.1 Near-real-time bird awareness to air ops personnel
Remote track displays can keep air ops personnel informed of what the radar is seeing and tracking, improving avian situational awareness.
Place remote displays such as the TVW, Web-browser-based or Google Earth displays into hands of operations personnel to confirm improved avian situational awareness by soliciting their feedback and rating of the technology.
Overall technology rating 3 or more out of a possible 5, at a single site – either NASWI or SEA-TAC.
Demonstrated: Overall technology rating was 3.4 at SEA-TAC.
PC6.1 Automatic early warning of developing bird hazards
The avian radar can issue automatic alerts (e.g., text messages, e-mails, audible alert) in response to bird tracks moving into operator-specified exclusion zones.
Either (1) Identify recorded dataset(s) of bird movements that presented a hazard that justified an early warning or (2) At ARTI, reprocess the plot data through DRP, stream tracks to an RDS, relay to a TVW with alarm tool programmed to issue an alert to demonstrate early warning capability.
Alarm issued at least 60 seconds before specified event, using data recorded from a single site: NASWI the primary site, (MCASCP and SEA-TAC are backups).
Demonstrated: Email alert transmitted >82 seconds before a bird hazard condition reached its climax.
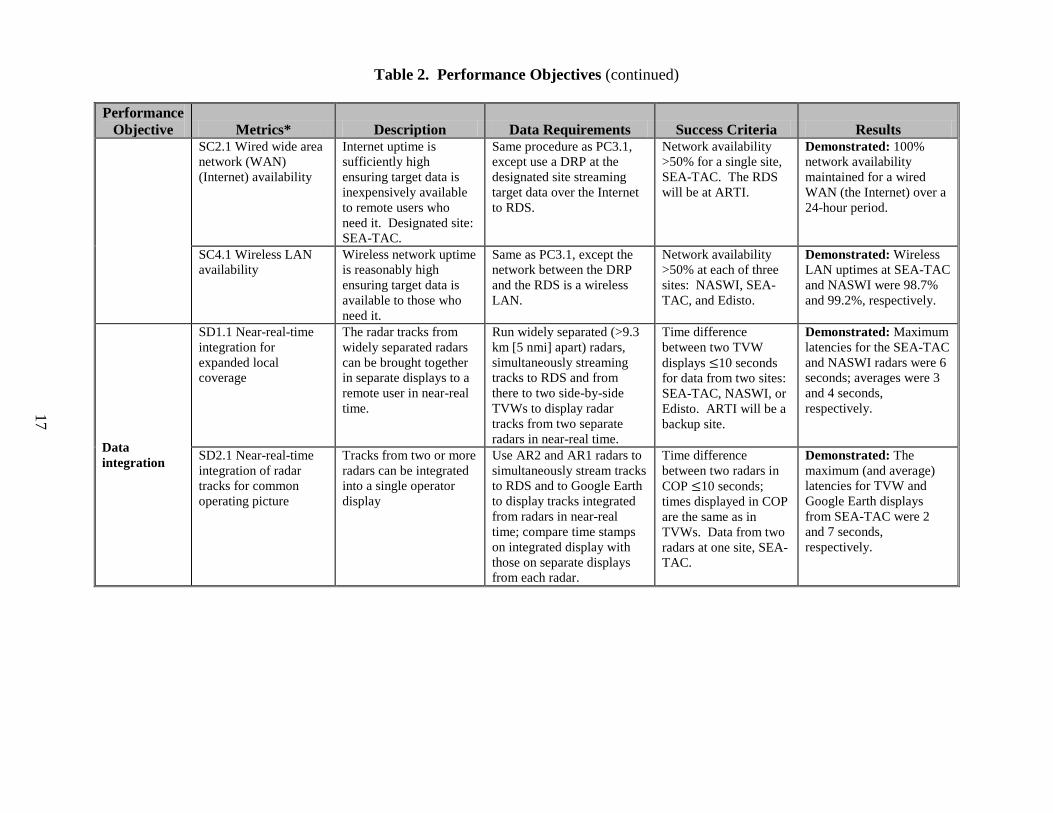
Table 2. Performance Objectives (continued)
17
Performance Objective Metrics* Description Data Requirements Success Criteria Results
SC2.1 Wired wide area network (WAN) (Internet) availability
Internet uptime is sufficiently high ensuring target data is inexpensively available to remote users who need it. Designated site: SEA-TAC.
Same procedure as PC3.1, except use a DRP at the designated site streaming target data over the Internet to RDS.
Network availability >50% for a single site, SEA-TAC. The RDS will be at ARTI.
Demonstrated: 100% network availability maintained for a wired WAN (the Internet) over a 24-hour period.
SC4.1 Wireless LAN availability
Wireless network uptime is reasonably high ensuring target data is available to those who need it.
Same as PC3.1, except the network between the DRP and the RDS is a wireless LAN.
Network availability >50% at each of three sites: NASWI, SEA-TAC, and Edisto.
Demonstrated: Wireless LAN uptimes at SEA-TAC and NASWI were 98.7% and 99.2%, respectively.
Data integration
SD1.1 Near-real-time integration for expanded local coverage
The radar tracks from widely separated radars can be brought together in separate displays to a remote user in near-real time.
Run widely separated (>9.3 km [5 nmi] apart) radars, simultaneously streaming tracks to RDS and from there to two side-by-side TVWs to display radar tracks from two separate radars in near-real time.
Time difference between two TVW displays ≤10 seconds for data from two sites: SEA-TAC, NASWI, or Edisto. ARTI will be a backup site.
Demonstrated: Maximum latencies for the SEA-TAC and NASWI radars were 6 seconds; averages were 3 and 4 seconds, respectively.
SD2.1 Near-real-time integration of radar tracks for common operating picture
Tracks from two or more radars can be integrated into a single operator display
Use AR2 and AR1 radars to simultaneously stream tracks to RDS and to Google Earth to display tracks integrated from radars in near-real time; compare time stamps on integrated display with those on separate displays from each radar.
Time difference between two radars in COP ≤10 seconds; times displayed in COP are the same as in TVWs. Data from two radars at one site, SEA-TAC.
Demonstrated: The maximum (and average) latencies for TVW and Google Earth displays from SEA-TAC were 2 and 7 seconds, respectively.
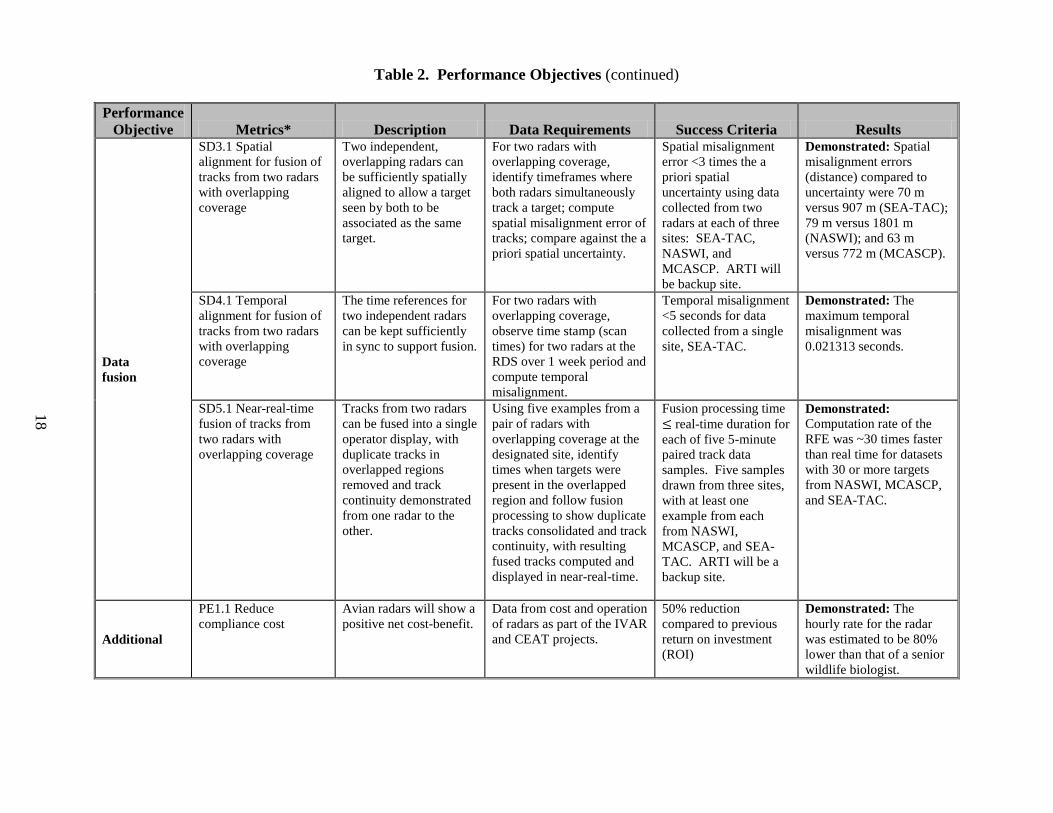
Table 2. Performance Objectives (continued)
18
Performance Objective Metrics* Description Data Requirements Success Criteria Results
Data fusion
SD3.1 Spatial alignment for fusion of tracks from two radars with overlapping coverage
Two independent, overlapping radars can be sufficiently spatially aligned to allow a target seen by both to be associated as the same target.
For two radars with overlapping coverage, identify timeframes where both radars simultaneously track a target; compute spatial misalignment error of tracks; compare against the a priori spatial uncertainty.
Spatial misalignment error <3 times the a priori spatial uncertainty using data collected from two radars at each of three sites: SEA-TAC, NASWI, and MCASCP. ARTI will be backup site.
Demonstrated: Spatial misalignment errors (distance) compared to uncertainty were 70 m versus 907 m (SEA-TAC); 79 m versus 1801 m (NASWI); and 63 m versus 772 m (MCASCP).
SD4.1 Temporal alignment for fusion of tracks from two radars with overlapping coverage
The time references for two independent radars can be kept sufficiently in sync to support fusion.
For two radars with overlapping coverage, observe time stamp (scan times) for two radars at the RDS over 1 week period and compute temporal misalignment.
Temporal misalignment <5 seconds for data collected from a single site, SEA-TAC.
Demonstrated: The maximum temporal misalignment was 0.021313 seconds.
SD5.1 Near-real-time fusion of tracks from two radars with overlapping coverage
Tracks from two radars can be fused into a single operator display, with duplicate tracks in overlapped regions removed and track continuity demonstrated from one radar to the other.
Using five examples from a pair of radars with overlapping coverage at the designated site, identify times when targets were present in the overlapped region and follow fusion processing to show duplicate tracks consolidated and track continuity, with resulting fused tracks computed and displayed in near-real-time.
Fusion processing time ≤ real-time duration for each of five 5-minute paired track data samples. Five samples drawn from three sites, with at least one example from each from NASWI, MCASCP, and SEA-TAC. ARTI will be a backup site.
Demonstrated: Computation rate of the RFE was ~30 times faster than real time for datasets with 30 or more targets from NASWI, MCASCP, and SEA-TAC.
Additional
PE1.1 Reduce compliance cost
Avian radars will show a positive net cost-benefit.
Data from cost and operation of radars as part of the IVAR and CEAT projects.
50% reduction compared to previous return on investment (ROI)
Demonstrated: The hourly rate for the radar was estimated to be 80% lower than that of a senior wildlife biologist.

Table 2. Performance Objectives (continued)
19
Performance Objective Metrics* Description Data Requirements Success Criteria Results
Qualitative Performance Objectives
Automatic tracking
PA1.2 - Automates real-time tracking of radar echoes
Automated tracking algorithms can detect and track targets in real time at least as well as a human operator.
Digital image that faithfully emulates analog radar display, including “true trails” mode. Digital image demonstrating automatic tracking of the same targets as in the analog scene.
Achievable Achieved: Both simulations and image comparisons demonstrated eBirdRad can automatically track targets in real time.
PA2.2 - Provides reduced clutter compared to analog radar
Remove “ground clutter” (returns from stationary objects) to reveal moving targets that were masked by the clutter.
Digital images of the same scene with and without clutter removal.
Achievable Achieved: Image comparisons demonstrated eBirdRad can reduce clutter & reveal additional targets.
Sampling protocols
PB1.2 - Sampling of diurnal and seasonal bird activity patterns
Capable of sampling bird activity night and day and at different times of the year.
Log of plots & track files generated during a 24-hour period every three months at the same location.
Achievable Achieved: Diurnal sampling demonstrated in 6 performance objectives, seasonal sampling in 4 objectives.
PB2.2 - Scheduled, unattended sampling events
Systems capable of being programmed in advance to power-on the radar, collect and record plots & track data, and power-down the radar at specified times, without human intervention.
Screen image from the radar scheduler for a specific event; log of the plots and tracks files generated during that event; Master and Detail records for selected tracks from that event.
Achievable Achieved: Successfully powered-on radar, captured plots and tracks data, and powered off radar according to pre-programmed schedule, with no human intervention.
PB3.2 Sampling controllable by remote operator
The ability to control the configuration and operation of the radar from a remote location.
Image of the remote operator’s console; log of the plots and tracks files generated during that event; Master and Detail records for selected tracks from that event.
Achievable Achieved: Commands were issued from ARTI to a radar at SEA-TAC and visually confirmation to have been executed.
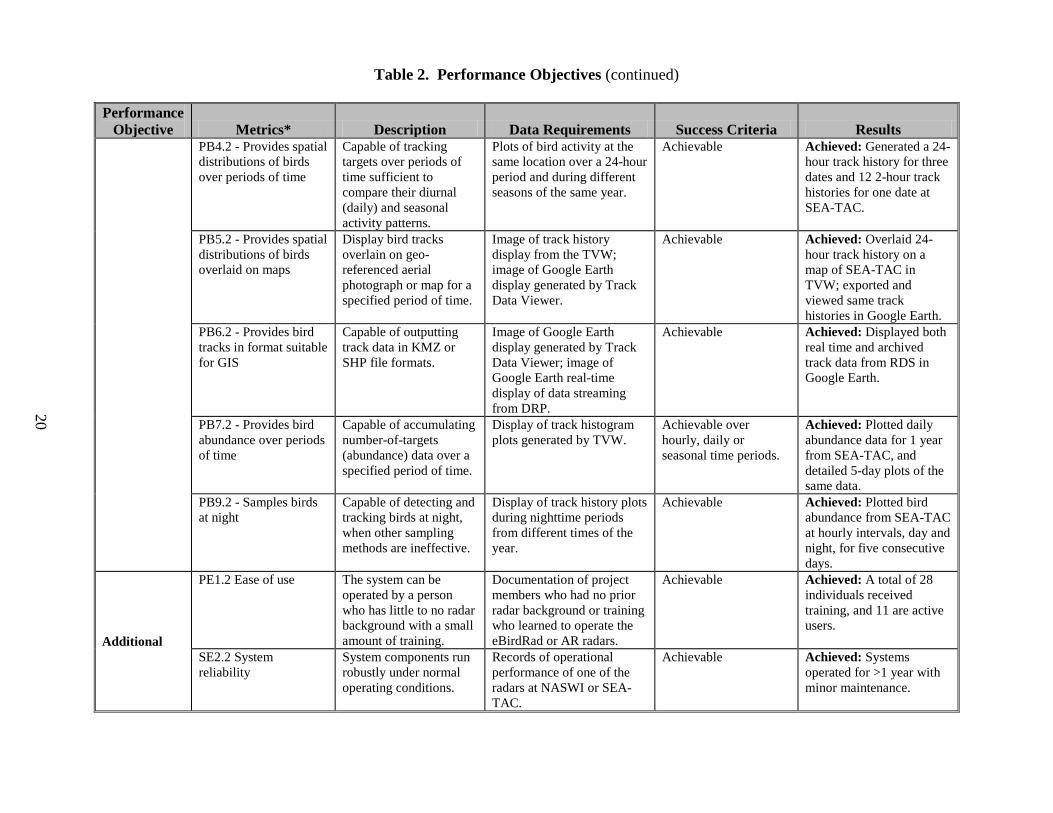
Table 2. Performance Objectives (continued)
20
Performance Objective Metrics* Description Data Requirements Success Criteria Results
PB4.2 - Provides spatial distributions of birds over periods of time
Capable of tracking targets over periods of time sufficient to compare their diurnal (daily) and seasonal activity patterns.
Plots of bird activity at the same location over a 24-hour period and during different seasons of the same year.
Achievable Achieved: Generated a 24-hour track history for three dates and 12 2-hour track histories for one date at SEA-TAC.
PB5.2 - Provides spatial distributions of birds overlaid on maps
Display bird tracks overlain on geo-referenced aerial photograph or map for a specified period of time.
Image of track history display from the TVW; image of Google Earth display generated by Track Data Viewer.
Achievable Achieved: Overlaid 24-hour track history on a map of SEA-TAC in TVW; exported and viewed same track histories in Google Earth.
PB6.2 - Provides bird tracks in format suitable for GIS
Capable of outputting track data in KMZ or SHP file formats.
Image of Google Earth display generated by Track Data Viewer; image of Google Earth real-time display of data streaming from DRP.
Achievable Achieved: Displayed both real time and archived track data from RDS in Google Earth.
PB7.2 - Provides bird abundance over periods of time
Capable of accumulating number-of-targets (abundance) data over a specified period of time.
Display of track histogram plots generated by TVW.
Achievable over hourly, daily or seasonal time periods.
Achieved: Plotted daily abundance data for 1 year from SEA-TAC, and detailed 5-day plots of the same data.
PB9.2 - Samples birds at night
Capable of detecting and tracking birds at night, when other sampling methods are ineffective.
Display of track history plots during nighttime periods from different times of the year.
Achievable Achieved: Plotted bird abundance from SEA-TAC at hourly intervals, day and night, for five consecutive days.
Additional
PE1.2 Ease of use The system can be operated by a person who has little to no radar background with a small amount of training.
Documentation of project members who had no prior radar background or training who learned to operate the eBirdRad or AR radars.
Achievable Achieved: A total of 28 individuals received training, and 11 are active users.
SE2.2 System reliability
System components run robustly under normal operating conditions.
Records of operational performance of one of the radars at NASWI or SEA-TAC.
Achievable Achieved: Systems operated for >1 year with minor maintenance.

Table 2. Performance Objectives (continued)
21
Performance Objective Metrics* Description Data Requirements Success Criteria Results
SE3.2 Safety radiation hazard
Radiation hazard to humans, fuels, and ordnance can be easily managed.
Demonstration of how operation of radars can meet hazards of electromagnetic radiation to personnel (HERP), hazards of electromagnetic radiation to fuel (HERF), and hazards of electromagnetic radiation to ordnance (HERO) conditions.
Achievable Achieved: Described process at NASPR for obtaining fuels, ordnance, and personnel safety hazard approvals.
SE4.2 Maintenance Life cycle support is available—maintenance can be managed by military maintenance personnel.
Maintenance information from IVAR and CEAT projects.
Achievable Achieved: Routine maintenance can be handled by local personnel.
* Performance Objective Numbering Convention: First character indicates: P=Primary or S=Secondary criterion Second character indicates: A=Automatic Tracking, B=Sampling Protocol, C=Data Streaming, D=Integration and Fusion, or E=Additional performance objective Third through fifth characters are the sequential numbers of the criterion: 1=Quantitative and 2 = Qualitative criteria

This page left blank intentionally.
23
5.0 SITE DESCRIPTION
Section 5 identifies the locations of the IVAR study sites and provides a brief summary of the characteristics of each location and the types of studies performed at each location.
5.1 SITE LOCATION AND HISTORY
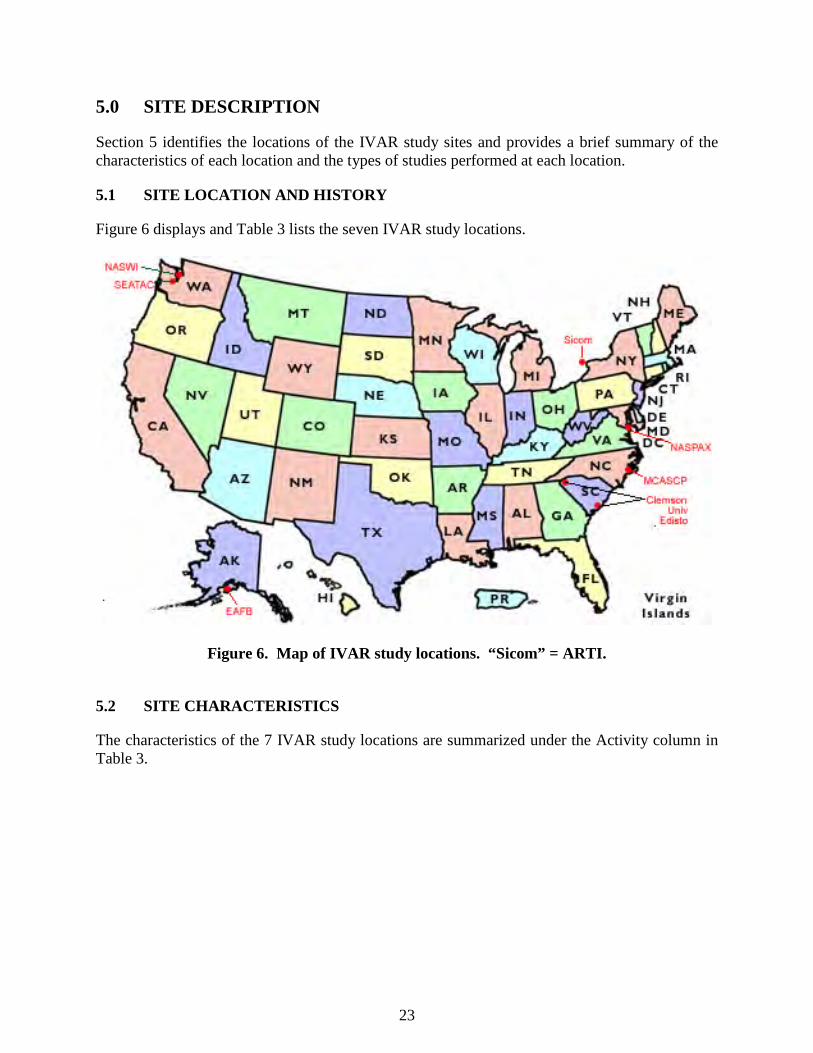
Figure 6 displays and Table 3 lists the seven IVAR study locations.
Figure 6. Map of IVAR study locations. “Sicom” = ARTI.
5.2 SITE CHARACTERISTICS
The characteristics of the 7 IVAR study locations are summarized under the Activity column in Table 3.

24
Table 3. Summary of the IVAR study locations. “X” indicates the specified type of demonstration was conducted at that location;
“B” indicates a potential back-up location for the specified demonstration.
Location
Demonstrations
Activity V
isua
l C
onfir
mat
ion
The
rmal
V
alid
atio
n
UA
V S
tudi
es
Sam
plin
g Pr
otoc
ols
Dat
a St
ream
ing
Dat
a In
tegr
atio
n
Dat
a Fu
sion
MCAS Cherry Point, NC X B B X B B
Very large air station; eastern seaboard; high seasonal and daily bird activity; periods of heavy air operations; 1-year visual census; multiple eBirdRad radars; fiber-optic wired LAN (planned)
NAS Patuxent River, MD X B X
Medium-sized air station; Northeastern seaboard; high seasonal and daily bird activity; eBirdRad acceptance testing site; single eBirdRad radar; no LAN/WAN capability
NAS Whidbey Island, WA X X X X X
Smaller air station; Western seaboard; high seasonal and daily bird activity; periods of heavy air operations; multiple radars (eBirdRad and AR1); wireless (Wireless Fidelity [WiFi] and EVDO) connectivity
Elmendorf AFB, AK X X
Large airbase; arctic seaboard; high seasonal bird activity; periods of heavy air operations; single eBirdRad radar; no LAN/WAN capability
SEATAC Int’l Airport, WA X X X X X
Moderate-size airport; bird activity; moderate-to-heavy air operations; Multiple radars; wired and wireless (WiFi) LAN and WAN
Edisto Island (Clemson), SC X X B B
High seasonal and daily bird activity; no air operations; single radar (eBirdRad); thermal imager; wired and wireless LAN (WiFi). WAN (DSL)
ARTI Ontario, Canada B X X X
Moderate bird activity; endpoint for streamed data, data management, and data fusion tools; main backup site; multiple radars (eBirdRad and AR1); wired and wireless (WiFi) LAN and WAN; RDS

25
6.0 TEST DESIGN
This section provides a summary of the conceptual test design employed by the IVAR project, how the “before” conditions at the study locations were characterized, and how the components of an avian radar system might be deployed at an operational site. It also lists the field tests that were performed in each of six major categories during the study, with a brief description of each test.
6.1 CONCEPTUAL TEST DESIGN
This section describes the tests we designed to demonstrate the five overarching objectives of the IVAR project, as described in Section 2.2 and Table 2. Figure 3 provides a diagrammatic representation of the major components of the avian radar systems the IVAR project used to demonstrate these stated objectives. For convenience, Figure 4 summarizes in a single diagram how all of these components might be deployed in an operational environment: In the actual tests, we deployed different combinations of components at a single location, while other situations required communications between components at several facilities.
At the highest level, our tests were designed to answer three fundamental questions about the avian radar systems that were evaluated by this project:
• Do they perform as advertised? • Can they perform under real-world conditions? • Can they deliver the data where, when, and in the form they are needed?
6.2 BASELINE CHARACTERIZATION AND PREPARATION
The demonstrations conducted at the principal IVAR study locations involved different aspects of validating digital avian radar systems that can automatically sample the bird populations at, or visiting, those locations. They were not designed to compare before-and-after conditions at those locations, and thus did not require characterizing the baseline conditions. The IVAR project did, however, rely heavily on expert knowledge of the avifauna at each of the study locations when designing the field studies, in particular the visual and thermal confirmation studies. This expertise was provided by the resident wildlife biologist at each of the six principal IVAR study locations who were also members of the IVAR project team.
6.3 DESIGN AND LAYOUT OF TECHNOLOGY AND METHODOLOGY COMPONENTS
Figure 3 provides a schematic representation of the major components of the avian radar systems evaluated by the IVAR project. Figure 4 is a notional representation of how these components might be deployed at an operational site; the actual deployment of these components varied from location to location.

26
6.4 FIELD TESTING
The avian radar systems evaluated by the IVAR project were operational when the field testing began. Thus, many of the demonstrations could be performed using data that were, or could be, collected during of the routine operation of these systems. Only the demonstrations of automatic tracking were time-sensitive and required advanced scheduling to coincide with spring and fall migrations at the facilities on the east and west coasts. These demonstrations deployed teams of observers to the study locations, without setup and shutdown of the radar systems per se.
6.4.1 Automatic Tracking
In tests to determine whether digital avian radars can automatically detect and track birds, we: Visual Confirmation – Positioned two-person teams of observers at various ranges and azimuths from the radar at four study locations for several 2-hour sessions each day during spring and fall campaigns to visually confirm whether targets tracked by the radar were birds. Thermal Confirmation – Used a thermal imager to confirm that targets tracked by the radar at night were birds. UAV – Tracked a remote-control helicopter with GPS to confirm the accuracy of the spatial coordinates of the targets tracked by the avian. Synthetic Targets – “Tracked” software-generated targets with known flight dynamics to confirm that the radar processor could track targets with complex movements similar to birds. Image Comparisons – Compared the digital radar’s rendering of a scene to the analog radar’s display of the same scene to evaluate radar ornithologists’ familiarity with the digital display. Parametric Data – Evaluated the types of parametric data generated for each tracked target. Number of Targets – Determined the maximum number of targets the radar can track simultaneously. Representative Ranges to Targets – Tracked targets at or beyond the perimeter of a large military base.
6.4.2 Sampling Protocols
In tests to confirm the sampling capabilities of digital avian radars to meet user requirements, we: Coverage – Used target track data gathered by the radar during typical operating conditions to demonstrate tracking birds night and day, through 360° of azimuth, up to altitudes at which birds are known to fly, and out to the distances not covered by airport surveillance or weather radars.

27
Storage – Determined whether a year’s worth of plots and tracks data from operating the radar under typical conditions could be stored on a conventional mass storage media device. Sample More Birds – Compared the number of birds tracked by the radar with those observed within the same volume at the same time using visual census methods.
6.4.3 Data Streaming
In tests to determine if target data can be reliably transmitted to remote locations, we: Network Availability – Measured the “up-time” of wireless and wired networks to determine if it is high enough to deliver plots and tracks data for local, remote, and historical applications. Network Reliability – Measured the error rate for delivering data to end-use applications. Storage & Redistribution – Measured the loss in data quality of data streamed to a database and redistributed in near-real-time to other users and applications. End-Use Applications – Demonstrated to natural resources management (NRM) and aircraft safety personnel the potential end-use applications of the data.
6.4.4 Data Integration
To test whether tracks from two or more radars can be integrated into a common display, we: Synchronized Coverage – Measured the lag times between two widely separated radars (100 km), and between those two radars and a display showing the tracks from both radars.
6.4.5 Data Fusion
To test whether common tracks from several radars with overlapping beams can be fused, we: Spatial Alignment – Measured the error in the spatial alignment of target tracks from two asynchronous radars. Temporal Alignment – Measured the error in temporal alignment of two asynchronous radars over the course of 1 week. Data Fusion – Determined if the time required to fuse duplicate tracks from two radars was less than real time.
6.5 SAMPLING PROTOCOL
No physical samples were collected during the IVAR field tests.

28
6.6 SAMPLING RESULTS
The sampling results from the IVAR validation studies are included in the Performance Assessment.

29
7.0 PERFORMANCE ASSESSMENT The following are brief summaries of results from the IVAR project’s demonstration of the performance objectives outlined in Section 4 of this report.
7.1 AUTOMATIC TRACKING
Observation teams visually confirmed that more than 1500 targets being tracked in real time by the radars were birds (success criterion = 100 birds/location), while the thermal imaging measurements (Figure 7) confirmed that more than 900 targets tracked at night were birds (success criterion = 100 birds). Tracking a remotely-controlled helicopter with an onboard recording GPS demonstrated that the accuracy of the horizontal spatial coordinates computed for a target by the radar was less than ±10 m. We demonstrated that in addition to the target’s unique Track ID, during each scan the radar generates and stores for each tracked target the date/time, horizontal coordinates (latitude and longitude), altitude, speed, heading, and a half dozen other parameters. We also demonstrated that the DRP was capable of simultaneously tracking more than twice as many targets as the success criterion of 100. Finally, we demonstrated that the radar can track targets within the perimeter of most military facilities (range of 2 km) and well beyond—up to 11 km.
Using track plots, we demonstrated that the DRP could readily track 20 software-generated synthetic targets that had complex but known flight dynamics similar to birds. Then by feeding the signal from an RST to both an analog BirdRad and a digital eBirdRad system, we confirmed that the digital rendering of scenes closely matched those of the analog displays with which most radar ornithologists would be familiar and the digital processor could significantly reduce ground clutter while tracking the same targets that were then apparent in the analog display—plus others that weren’t apparent until the clutter was removed.
Correlation of 5-min blocks
y = 1.4874x - 4.0244R2 = 0.6871
0
10
20
30
40
50
60
70
0 5 10 15 20 25 30 35 40 45
Radar Count
TI C
ount
Figure 7. Comparison of 5-minute segments for all thermal imager (TI) counts of birds
versus radar counts of birds in the same sampling volume. (y = 1.4874 x - 4.0244, Ra2 = 0.6838, df = 191; r = 0.829, v = 94, P < 0.001)
30
7.2 SAMPLING PROTOCOL
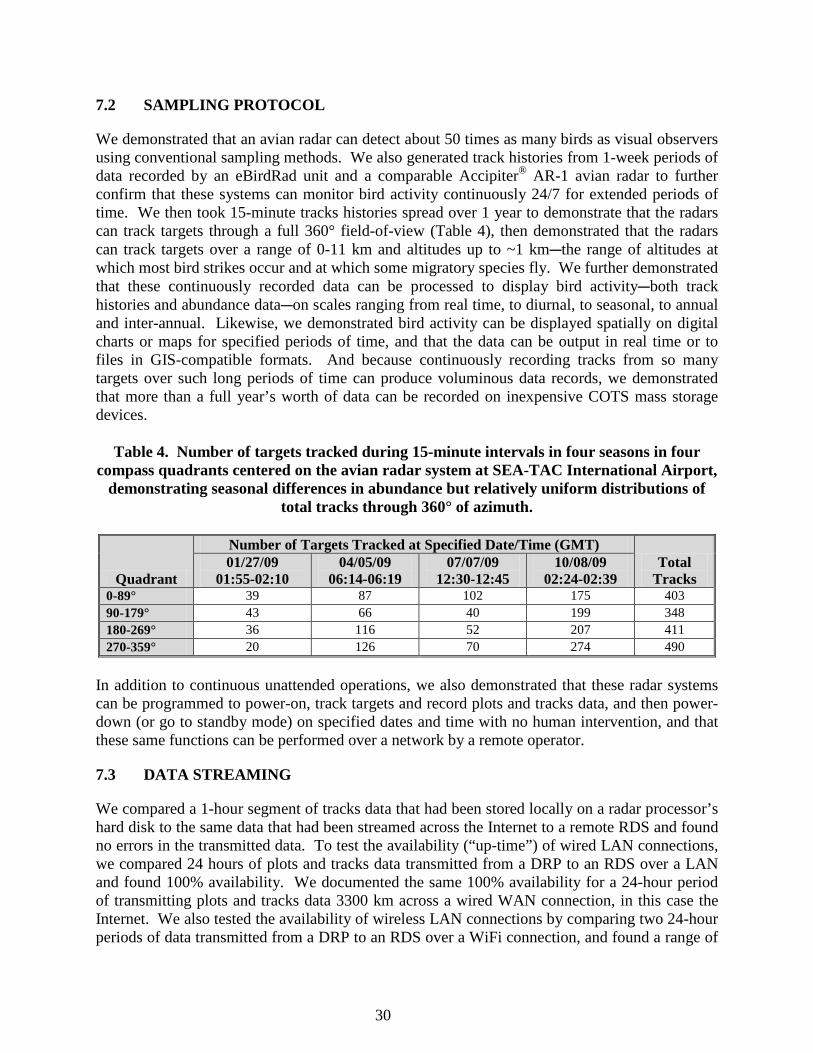
We demonstrated that an avian radar can detect about 50 times as many birds as visual observers using conventional sampling methods. We also generated track histories from 1-week periods of data recorded by an eBirdRad unit and a comparable Accipiter® AR-1 avian radar to further confirm that these systems can monitor bird activity continuously 24/7 for extended periods of time. We then took 15-minute tracks histories spread over 1 year to demonstrate that the radars can track targets through a full 360° field-of-view (Table 4), then demonstrated that the radars can track targets over a range of 0-11 km and altitudes up to ~1 kmCthe range of altitudes at which most bird strikes occur and at which some migratory species fly. We further demonstrated that these continuously recorded data can be processed to display bird activityCboth track histories and abundance dataCon scales ranging from real time, to diurnal, to seasonal, to annual and inter-annual. Likewise, we demonstrated bird activity can be displayed spatially on digital charts or maps for specified periods of time, and that the data can be output in real time or to files in GIS-compatible formats. And because continuously recording tracks from so many targets over such long periods of time can produce voluminous data records, we demonstrated that more than a full year’s worth of data can be recorded on inexpensive COTS mass storage devices.
Table 4. Number of targets tracked during 15-minute intervals in four seasons in four compass quadrants centered on the avian radar system at SEA-TAC International Airport,
demonstrating seasonal differences in abundance but relatively uniform distributions of total tracks through 360° of azimuth.
Quadrant
Number of Targets Tracked at Specified Date/Time (GMT) Total
Tracks 01/27/09
01:55-02:10 04/05/09
06:14-06:19 07/07/09
12:30-12:45 10/08/09
02:24-02:39 0-89° 39 87 102 175 403 90-179° 43 66 40 199 348 180-269° 36 116 52 207 411 270-359° 20 126 70 274 490
In addition to continuous unattended operations, we also demonstrated that these radar systems can be programmed to power-on, track targets and record plots and tracks data, and then power-down (or go to standby mode) on specified dates and time with no human intervention, and that these same functions can be performed over a network by a remote operator.
7.3 DATA STREAMING
We compared a 1-hour segment of tracks data that had been stored locally on a radar processor’s hard disk to the same data that had been streamed across the Internet to a remote RDS and found no errors in the transmitted data. To test the availability (“up-time”) of wired LAN connections, we compared 24 hours of plots and tracks data transmitted from a DRP to an RDS over a LAN and found 100% availability. We documented the same 100% availability for a 24-hour period of transmitting plots and tracks data 3300 km across a wired WAN connection, in this case the Internet. We also tested the availability of wireless LAN connections by comparing two 24-hour periods of data transmitted from a DRP to an RDS over a WiFi connection, and found a range of

31
98.7% to 99.2% network availability. Finally, our tests showed the latencies that the RDS introduces into the data streaming process as it receives, organizes, and redistributes data to users and applications are negligible. As an evaluation of end-use applications for live data streamed from the avian radars, we asked wildlife biologists at SEA-TAC to rate the improvement in real-time situational awareness provided by having live radar data available to them in the field: Their average rating was 3.4 on a scale of 1-to-5, with 5 being the maximum score in each category. We further demonstrated the radar could detect when more than a specified number of birds had entered a predefined volume of the airspace, and could alert selected personnel, in this case by e-mail, nearly 90 seconds before the birds passed over the end of the runway (Figure 8).
Figure 8. Alarm triggered as a flock of Black-bellied Plovers (Pluvialis squatarola) enters an alarm region set for NAS Whidbey Island on January 25, 2008.
The string of red dots to the right of the alarm region polygon is an aircraft approaching for a landing.
7.4 DATA INTEGRATION
We demonstrated that the latencies in data streamed from two radars more than 100 km apart were well less than our success criterion of 10 seconds. We also demonstrated that the latencies of streaming the track data from these two radars over 3300 km and combining them into a COP (Figure 9) were also <10 seconds.

32
Figure 9. Schematic diagram showing how track data from three radars can be displayed on separate monitors (upper) or integrated into a COP (lower).
The blue data feed was from a radar that was not used in the IVAR studies.
7.5 DATA FUSION
We demonstrated the precise spatial alignment of the radars required for data fusionCcombining tracks generated by independent radars with overlapping coverage into common tracksCusing data from three IVAR study locations that had two (or more) radars. We computed the spatial misalignment error between each pair of radars and found it to be less than 5% of our success criterion of three times the a priori spatial uncertainty at each location. Next, we used data from one of these locations which has two colocated radars to demonstrate a maximum misalignment of the two radars of 0.02 seconds over a period of one weekCwell within our success criterion of 5 seconds. Finally, we demonstrated the potential for data fusion from three widely spaced locations that had both similar and dissimilar radars separated by small, medium, and long distances (e.g., Figure 10 shows fused tracks from two such radars at NAS Whidbey Island): In each instance, the fusion processor was able to fuse the same tracks from different radars into common tracks in a fraction of the actual time interval represented by each dataset – in some cases, 30 times faster than real time. This demonstrated that the fusion processor can keep pace with the track data streamed from multiple radars in real time and can fuse those track data streams within the nominal 2-3 second scan period of the radars.

33
Figure 10. COP display showing fused tracks from the WIAR1 and eBirdRad radars for the two targets at NAS Whidbey Island on November 13, 2009.
The display is zoomed into the region of interest so that the fused track IDs are readable. Note that the fused track IDs maintained throughout the time interval in question are #358 and #185.
East-West and North-South units are shown in kilometers.
7.6 ADDITIONAL OBJECTIVES
To show that avian radar systems can reduce the cost of complying with some environmental regulations, we demonstrated that the hourly cost of operating the systems we evaluated was on the order of 20% of the cost of employing a senior wildlife biologist to gather the same amounts of data manually. More importantly, having the radar collecting the data 24/7 frees up the biologists to analyze, interpret, and incorporate the data into their management plans. We also demonstrated that individuals from a wide range of backgrounds but having no prior radar experience can become proficient enough to operate and access the data from the avian radar systems evaluated by the IVAR project. We further demonstrated that these systems are reliable under typical operating conditions, that routine maintenance can be accomplished by onsite personnel or vendors over remote network connections, and that radiation hazards from these systems are manageable using existing procedures at military facilities. We also compared the features and capabilities of the Accipiter® avian radar systems evaluated by the IVAR project with those known for other commercially available systems (i.e., MERLIN™ systems from DeTect, Inc.; MARS® system from GeoMarine, Inc.; and ROBIN Lite system from TNO). Finally, to bring all these demonstrations together, we prepared a companion document that

34
identifies the functions that modern avian radar systems should be capable of performing and the levels at which these functions can be performed with existing COTS technology.
35
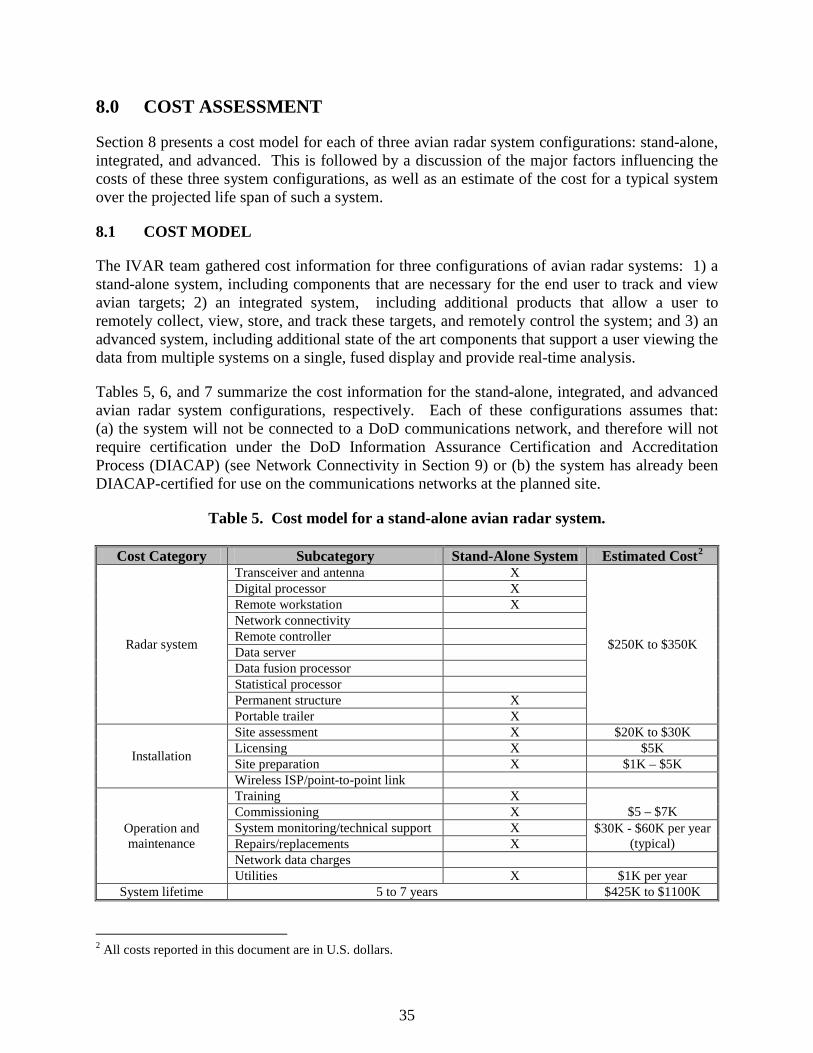
8.0 COST ASSESSMENT
Section 8 presents a cost model for each of three avian radar system configurations: stand-alone, integrated, and advanced. This is followed by a discussion of the major factors influencing the costs of these three system configurations, as well as an estimate of the cost for a typical system over the projected life span of such a system.
8.1 COST MODEL
The IVAR team gathered cost information for three configurations of avian radar systems: 1) a stand-alone system, including components that are necessary for the end user to track and view avian targets; 2) an integrated system, including additional products that allow a user to remotely collect, view, store, and track these targets, and remotely control the system; and 3) an advanced system, including additional state of the art components that support a user viewing the data from multiple systems on a single, fused display and provide real-time analysis.
Tables 5, 6, and 7 summarize the cost information for the stand-alone, integrated, and advanced avian radar system configurations, respectively. Each of these configurations assumes that: (a) the system will not be connected to a DoD communications network, and therefore will not require certification under the DoD Information Assurance Certification and Accreditation Process (DIACAP) (see Network Connectivity in Section 9) or (b) the system has already been DIACAP-certified for use on the communications networks at the planned site.
Table 5. Cost model for a stand-alone avian radar system.
Cost Category Subcategory Stand-Alone System Estimated Cost2
Radar system
Transceiver and antenna X
$250K to $350K
Digital processor X Remote workstation X Network connectivity Remote controller Data server Data fusion processor Statistical processor Permanent structure X Portable trailer X
Installation
Site assessment X $20K to $30K Licensing X $5K Site preparation X $1K – $5K Wireless ISP/point-to-point link
Operation and maintenance
Training X $5 – $7K Commissioning X
System monitoring/technical support X $30K - $60K per year (typical) Repairs/replacements X
Network data charges Utilities X $1K per year
System lifetime 5 to 7 years $425K to $1100K 2 All costs reported in this document are in U.S. dollars.

36
Table 6. Cost Model for an integrated avian radar system.
Cost Category Subcategory Integrated
System Estimated Cost2
Radar system
Transceiver and antenna X
$400K to $500K
Digital processor X Remote workstation X Network connectivity X Remote controller X Data server X Data fusion processor Statistical processor Permanent structure X Portable trailer X
Installation
Site assessment X $20K to $30K Licensing X $5K Site preparation X $1K – $5K Wireless ISP/point-to-point link X $ 0.5K - $10K
Operation and maintenance
Training X $2K – $5K Commissioning X System monitoring/technical support X $40K to $100K per year
(typical) Repairs/replacements X Network data charges X $0.2K - $1.5K Utilities X $1K per year
System lifetime 5 to 7 years $624K to $1200K
Table 7. Cost model for an advanced avian radar system.
Cost Category Subcategory Advanced
System Estimated Cost2
Radar system
Transceiver and antenna X
$500K to $750K
Digital processor X Remote workstation X Network connectivity X Remote controller X Data server X Data fusion processor X Statistical processor X Permanent structure X Portable trailer X
Installation
Site assessment X $20K to $30K Licensing X $5K Site preparation X $1 – $5K Wireless ISP/point-to-point link X $0.5K - $10K
Operation and maintenance
Training X $2 – $5K Commissioning X System monitoring/technical support X $50K to $150K per year
(typical) Repairs/replacements X Network data charges X $0.2K - $1.5K Utilities X $1K per year
System lifetime 5 to 7 years $775K to $1850
37
8.2 COST DRIVERS
The cost drivers are largely a function of the capital equipment costs, deployment costs (e.g., site preparation and connectivity), and operational costs. Capital costs for radar technology can vary depending on configuration for site specific needs, which includes both the number of sensor units and the associated basic integration and fusion capacity defined for multiple sensor deployment. Unit costs for radars can be expected to range from $250,000 to $500,000 depending on configuration. Purchase, lease, and service options may be available depending on vendor. For purchase of the equipment, it is expected that capital costs would be based on normal procurement processes that would provide least cost for advertised specifications. Most of the future engineering, modifications, and upgrades to the equipment are expected to be capitalized by the manufacturer and recouped in the purchase, lease, or service cost for the technology. Operation and maintenance costs for the technologies are largely controlled by the labor rates and the number of personnel required to field the equipment, analyze the data, and generate the documentation associated with the project.
8.3 COST ANALYSIS AND COMPARISON
As discussed in Section 8.1, the cost of acquiring, installing, and operating an avian radar system can vary greatly depending upon the facility’s requirements. In this section we chose a “middle-ground” configuration for what we believe would be a typical installation. Time Frame. We chose a five-year time frame as a trade-off between the probable system lifetime (5-7 years) and the cumulative technological advances during this period that would favor replacement rather than upgrades. Radar System. We chose a single, integrated, trailer-mounted system—a single radar because most facilities would probably start with just one radar and most military bases can be monitored by a single radar, an integrated system because it provides remote access for visualizing and analyzing the target track data and because it can reduce the need (and cost) for onsite training and maintenance, and a trailer-mounted system because it provides greater flexible in locating the radar. Installation. We assumed that a fairly substantial assessment would be required to locate a suitable site for the radar but that there would be no licensing fees because it is a military facility. We further assumed that a concrete pad would need to be built for parking the trailer at the selected site, but that shore power would be nearby and that network cabling would not be required because a wireless point-to-point link would be provided. Operation and Maintenance. We chose the low end of the range of estimated operations and maintenance charges because we paid the higher price for an integrated system with network access, which permits many of these procedures to be handled remotely by the vendor.

38
Table 8 summarizes the estimated cost of a system that would result from the specified configuration and assumptions. Table 8. Estimated cost of a typical avian radar system amortized over a 5-year life span.
Element Configuration Cost Comment
Time frame 5 years Tradeoff system lifetime versus technological advances
Radar system Integrated $400K Network-capable for remote access and support.
Installation
Site assessment $25K Licensing $0 N/A: Military facility Site preparation $5K Concrete pad only Communications link $3K Wireless, off-site ISP
Operation and maintenance
Training
$200K 20% per year for five years Commissioning Monitoring/support Repairs/replacement Network data charges $0 Assume wireless point-to-point link. Utilities $7.2K $100/mo for 5 years
TOTAL COST $640K As discussed in Section 3.2, none of the methods currently in use to sample bird activity are strictly comparable to avian radar systems. The most commonly used methods for both BASH and NRM applications involve visual sampling. However, these methods cannot be used at night, they are not well-suited to real-time monitoring, and using human observers to sample 24/7/365 would be both impractical and cost-prohibitive. In addition to sampling automatically and continuously in real time, avian radars and can detect and track many more birds at a lower hourly cost than visual observers. Thus, a more likely scenario will be to use both approaches: avian radars for routine surveillance sampling, and visual observers to fill in the gaps where the radars are not effective (e.g., in forested areas, or where species identifications are required). Using the radars for routine sampling would also free up the wildlife biologists and BASH managers to concentrate on interpreting the radar data and investigating the patterns of activity those data yield. We note that an avian radar system costs much less ($20/hour versus $100/hour) and can detect many more birds than a human observer expending the same level of effort. These arguments notwithstanding, the more likely scenario is to use the avian radar to augment rather than to replace field observations by the wildlife biologist. If we assume that the biologist would still spend the requisite 10 hours/week in the field observing birds, albeit differently because the radar is now performing continuous real-time surveillance of the bird populations, then the true cost of monitoring bird activity at a facility over a 5-year period would be the aggregate cost of the avian radar system ($640,000, Table 8) and the portion of the biologist’s time devoted to field observations ($260,000).

39
9.0 IMPLEMENTATION ISSUES
The following are issues that should be considered before acquiring and operating avian radar systems at a DoD facility.
Site Selection. Apart from cost (Section 8), the primary implementation issue at military airfields will be the site selection process. This process first requires the user to obtain approval to operate an radio-frequency (RF) device at that the facility, followed by a determination of where the radar can be operated so as not to present a hazard to personnel, fuels, and ordnance. In addition, all airfields restrict the height of structures as a function of their distance from a runway (known as the Runway Protection Zone).
Another issue related to site selection involves choosing a site for optimal performance of the radar. Chief among these considerations are coverage and clutter. The radar needs be located so the radar beam samples the areas of interest to the intended applications. Topography, vegetation, buildings, and other manmade structures may all prevent adequate coverage of some areas and may increase the amount of “ground clutter” that can limit detection and tracking of weak targets such as birds. Evaluating the clutter environment typically requires the expertise of radar professionals. The need, feasibility, and cost of constructing a site for the radar and providing utilities and network connectivity must also be considered. Site selection is usually based on an aggregate of factors rather than any single factor. Each step in the site selection process has built-in time delays and costs that need to be planned for in the overall procurement projects.
The FAA has prepared detailed guidelines for siting avian radars at civil airports (FAA, 2010). It can be anticipated that this guidance for civil airports will be adapted and adopted by military airfields as well.
Network Connectivity. DoD requires all automated information systems, including hardware, software, and communications equipment to pass a stringent certification before being connected to a DoD communications network. It is anticipated that most avian radar system vendors will seek a “type” DIACAP certification that would permit their equipment to be used at any DoD facility without specific “site” certification and that the vendors will absorb these certification costs as part of their product development. Potential purchasers should ask the vendors if their systems are DIACAP-certified, and if not, will the vendor pay for the cost of certification and how long the certification process will take.
Technical Advances. Slotted-array antennas provide very poor height resolution of targets, which can limit their utility for some applications. Dish antennas provide more accurate height information but the uncertainty in the computed height increases as a function of range. This in turn increases the error in computing the target’s “ground track” (the target’s position projected onto the ground). Recently, however, ARTI has introduced a multibeam avian radar antenna that purports to double the beam width (from 4° to 8°), while at the same time increasing the precision of the height computations.
Solid-state radars have recently come on the market that purport to reduce the mean time before maintenance is required. These radars are, however, about 10 times more expensive than

40
magnetron radars and have yet to be objectively evaluated for bird-tracking applications. One of the potential benefits of these solid-state radars is the use of coherent filtering within the radar sensor to reduce clutter. Similar technological advances can be anticipated in clutter removal algorithms, data analysis, visualization products, and a host of other components.
Using the Information from an Avian Radar System. In the near-term, the primary applications for avian radar systems will be for natural resources managers and BASH personnel who will use the information to better manage the bird populations at their installations. The mechanisms and format for conveying data from avian radar systems to control tower personnel or air crews will be the subject of many studies as these systems are brought online at military and civil airports.
Relationship between the IVAR and CEAT Projects. The CEAT at the University of Illinois and the IVAR project were collaborative efforts. CEAT was sponsored by the FAA to evaluate the deployment of avian radar technology at civil airports; IVAR was funded by DoD (ESTCP) to demonstrate the maturity of avian radar technology for potential NRM and BASH applications at military facilities, including airfields. Both projects shared data and resources and independently reached similar conclusions regarding the state of avian radar technology and where it can be most effective in its current stateCas a tool to support wildlife managers.
Technology Transfer. This report demonstrates that the avian radar systems evaluated by IVAR are mature technology that can operate under a wide range of realistic conditions at military facilities to generate useful data products for both real-time and historical applications. These products or their commercial equivalents are available for purchase as off-the-shelf products, as are avian radar products by other vendors. All of these vendors have system configurations for natural resources and BASH applications, experienced personnel who can assist with the deployment and operation of their products, and documentation and training for their products.
Avian radar technology is developing rapidly. Better height-finding antennas, solid-state transceivers, and advanced situational awareness displays are coming, and will continue to come into the market. However, as is often the case, the issues surrounding avian radar systems today are less about the technology and more about its implementation.
FAA Advisory Circular 150/5220-25 (FAA, 2010) provides a good roadmap and concept of operations (CONOPS) for selecting, deploying, and operating avian radar systems for BASH applications. It discusses the benefits and limitations of avian radar technology, and provides sound recommendations for developing a clear understanding of a facility’s needs and requirements before acquiring and deploying this technology. It also provides functional and performance specifications for avian radar systems and guidance on the deployment and operation and maintenance of avian radar systems at airports. Much of the information in the Advisory Circular is equally applicable to civil and military applications.
The IVAR project collaborated with a separate project at CEAT of the University of Illinois that was funded by the FAA to evaluate the application of avian radar technology at civil airports. The two projects shared resources, personnel, and data. While they reached similar conclusions regarding avian radar technology, the FAA Advisory Circular 150/5220-25 framed its functional requirements and performance specifications primarily in terms of the operational environment of civil airports.

41
The Air Force has a BASH program of record (POR) that is administered by the Air Force Safety Office and BASH program that is headquartered at Kirtland AFB. The Navy (including the Marine Corps) has recently elevated BASH to a POR that will, when fully implemented, be administered by the Commander of Naval Installations Command (CNIC). The Navy/Marine Corps Safety Center is located in Norfolk, VA, and the BASH program is located at NAS Whidbey Island.

This page left blank intentionally.

43
10.0 REFERENCES
Blackman, S.S. 2004. Multiple Hypothesis Tracking for Multiple Target Tracking. IEEE A&E Systems Magazine 19(1). January, 2004.
FAA. 2010. “Airport Avian Radar Systems”, Advisory Circular 150/5220-25, November 23, 2010. http://www.faa.gov/documentLibrary/media/Advisory_Circular/150_5220_25.pdf.
Lack, D., and G.C. Varley. 1945. Detection of birds by radar. Nature 156:446.
Nohara, T.J., P. Weber, A. Ukrainec, A. Premji, and G. Jones. 2007. An overview of avian radar developments: Past, present and future. Proceedings Bird Strike Committee USA/Canada, Kingston, Ontario, Canada.
Stein, B.A., C. Scott, and N. Benton. 2008. Federal lands and endangered species: The role of military and other federal lands in sustaining biodiversity. BioScience 58(4):339-347.

This page left blank intentionally.

A-1
APPENDIX A
POINTS OF CONTACT
Point of Contact Organization
Phone Fax
E-Mail Role In Project Marissa Brand
SPAWAR Systems Center – PACIFIC Postal Mail: 52570 Silvergate Avenue Bldg. 111, Floor 1, Room 214 San Diego, CA 92152
Phone: 619-553-5334 Fax: 619-553-6305 E-mail: [email protected]
Project Manager
Gerry Key ARTI Postal Mail/Shipping: 2806 NE 12th Avenue Portland, OR 97212
Phone: 503-922-2566 Fax: 503-922-2566 E-mail: [email protected]
Technical Lead
Robert Beason
Accipiter Radar Technologies, Inc. Postal Mail: P.O. Box 737 Sandusky, OH 44871 Shipping: 2912 Huron Avery Road Huron, OH 44839
Phone: 905-892-2249, Ext. 223 Fax: 419-433-2738 E-mail: [email protected]
Radar Ornithologist
Mike Begier U.S. Department of Agriculture APHIS Wildlife Services Postal Mail: 1400 Independence Avenue, SW South Agriculture Building, Room 1621 Washington, DC 20250 Shipping: [Same – preferred]
Phone: 202-720-4383 Fax: 202-690-0053 E-mail: [email protected]
Wildlife Biologist/BASH Manager
Chris Bowser U.S. Department of Agriculture/APHIS/Wildlife Services Postal Mail/Shipping: EAD (USDA WS) Attn: Chris Bowser Box 8006, Bldg. 4223 Access Road MCAS Cherry Point, NC 28533-0006
Phone: 252-466-9237 Fax: 252-466-9105 E-mail: [email protected]
Wildlife Biologist/BASH Manager
Robert Clark ARTI Postal Mail/Shipping: 4045 Hancock Street San Diego, CA 92110
Phone: 619-225-2633 Fax: 619-226-0462 E-mail: [email protected]
Prime Contract Manager

APPENDIX A (continued)
POINTS OF CONTACT
A-2
Point of Contact Organization
Phone Fax
E-Mail Role In Project Andy Del Collo
Chief of Naval Operations (N45) Postal Mail: 200 Navy Pentagon (NC-1 Suite 2000) Washington, DC 20350-2000 Shipping: 2511 Jefferson Davis Highway Suite 2000 Arlington, VA 22202
Phone: 703-602-2550 E-mail: [email protected]
Sponsor
Sid Gauthreaux, Jr.
Clemson University Postal Mail: P.O. Box 9 Edisto Island, SC 29438-0009 Shipping: 8360 Peters Point Road Edisto Island, SC 29438
Phone: 843-869-2383 Fax: 843-869-2383 E-mail: [email protected]
Radar Ornithologist
Herman Griese
United States Air Force Postal Mail/Shipping: 3 CES/CEANC 6326 Arctic Warrior Drive Elmendorf AFB Anchorage AK 99506-3240
Phone: 907-552-0200 Fax: 907-552-1533 E-mail: [email protected]
Wildlife Biologist/BASH Manager
Joe Hautzenroder
Naval Facilities Engineering Command Headquarters Postal Mail/Shipping: 1322 Patterson Avenue, SE Bldg. 33, Floor 2, Rm. 33-2014 Washington Navy Yard Washington, DC 20374
Phone: 202-685-9331 E-mail: [email protected]
Sponsor
Ed Herricks University of Illinois Postal Mail/Shipping: 3230B NCEL, MC-250 205 N. Mathews Urbana, IL 61801
Phone: 217-333-0997 Fax: 217-333-6968 E-mail: [email protected]
Collaborator
Ryan King Federal Aviation Administration Postal Mail/Shipping: AJP-6311 Airport Safety R&D Sub-Team Building 296 FAA Wm. J. Hughes Technical Center Atlantic City Int’l Airport, NJ 08405
Phone: 609-485-8816 Fax: 609-485-4845 E-mail: [email protected]
Collaborator
APPENDIX A (continued)
POINTS OF CONTACT
A-3
Point of Contact Organization
Phone Fax
E-Mail Role In Project Matt Klope Navy BASH Program
Postal Mail/Shipping: 1115 W. Lexington Street Building 103 Oak Harbor, WA 98278
Phone: 360-257-1468 E-mail: [email protected]
Wildlife Biologist/BASH Program Manager
Steve Osmek Seattle-Tacoma International Airport Postal Mail: Port of Seattle P.O. Box 68727 Seattle, WA 98168 Shipping: Main Terminal Building Center Service Tunnel 17801 Pacific Highway So. Seattle, WA 98158
Phone: 206-431-4453 Fax: 206-433-4645 E-mail: [email protected]
Senior Wildlife Biologist/Manager
Laura Muhs Naval Facilities Engineering Command Headquarters Postal Mail/Shipping: 1322 Patterson Avenue, SE Bldg. 33, Floor 2 Room 33-2021 Washington Navy Yard Washington, DC 20374
Phone: 202-685-9128 E-mail: [email protected]
Early Adopter
Tim Nohara Accipiter Radar Technologies, Inc. Postal Mail: P.O. Box 939 Fonthill, Ontario L0S 1E0 Canada Shipping: 576 Hwy 20 West Fenwick, Ontario L0S 1C0 Canada
Phone: 905-228-6888 Fax: 905-892-2249 E-mail: [email protected]
Radar Systems Design
James Swift Naval Facilities Engineering Command Washington, U.S. Navy Postal Mail/Shipping: 22541 Johnson Road Building 1410 Naval Air Station Patuxent River, MD 20670-1700
Phone: 301-757-0006 Fax: 301-757-1889 E-mail: [email protected]
Wildlife Biologist/BASH Manager

ESTCP Office901 North Stuart StreetSuite 303Arlington, Virginia 22203
(703) 696-2117 (Phone)(703) 696-2114 (Fax)
E-mail: [email protected]