esso (thailand) public company limited consolidated …
TRANSCRIPT

ESSO (THAILAND) PUBLIC COMPANY LIMITED CONSOLIDATED AND SEPARATE FINANCIAL STATEMENTS 31 DECEMBER 2020

Independent Auditor’s Report To the shareholders (and the Board of Directors) of Esso (Thailand) Public Company Limited
My opinion
In my opinion, the consolidated financial statements and the separate financial statements present fairly, in all material respects, the consolidated financial position of Esso (Thailand) Public Company Limited (the Company) and its subsidiaries (the Group) and the separate financial position of the Company as at 31 December 2020, and its consolidated and separate financial performance and its consolidated and separate cash flows for the year then ended in accordance with Thai Financial Reporting Standards (TFRS). What I have audited
The consolidated financial statements and the separate financial statements comprise:
• the consolidated and separate statements of financial position as at 31 December 2020;
• the consolidated and separate statements of comprehensive income for the year then ended;
• the consolidated and separate statements of changes in equity for the year then ended;
• the consolidated and separate statements of cash flows for the year then ended; and
• the notes to the consolidated and separate financial statements, which include significant accounting policies and other explanatory information.
Basis for opinion
I conducted my audit in accordance with Thai Standards on Auditing (TSAs). My responsibilities under those standards are further described in the Auditor’s responsibilities for the audit of the consolidated and separate financial statements section of my report. I am independent of the Group and the Company in accordance with the Code of Ethics for Professional Accountants issued by the Federation of Accounting Professions that are relevant to my audit of the consolidated and separate financial statements, and I have fulfilled my other ethical responsibilities in accordance with these requirements. I believe that the audit evidence I have obtained is sufficient and appropriate to provide a basis for my opinion. Key audit matters
Key audit matters are those matters that, in my professional judgement, were of most significance in my audit of the consolidated and separate financial statements of the current period. These matters were addressed in the context of my audit of the consolidated and separate financial statements as a whole, and in forming my opinion thereon, and I do not provide a separate opinion on these matters.

Key audit matter How my audit addressed the key audit matter
Revenue Recognition
In 2020, the Group recognised revenues of Baht 123,649 million which derived from two main business segments, Downstream and Petrochemical segments, as disclosed in the Notes 7 to the financial statements. The revenues are determined and recognised, based on the contractual price and volume of products delivered. The price is based on the market price and a number of other factors, depending on the distribution channels and contract terms with customers. The volumes sold are measured using applicable meters when the products are delivered to customers via pipeline, truck, or vessel. I focused on the revenue recognition of the petroleum products and petrochemical products because the revenue amounts and number of revenue transactions are material. In addition, selling prices are based on market prices and a number of other factors as stated in the contracts with customers.
My work performed over revenue recognition included:
• Obtaining an understanding and making inquiries to management about revenue recognition principle in accordance with TFRS15, accounting guidelines, disclosures and systems to support revenue recognition to assess correctness and appropriateness of the accounting standard and accounting policies the Group applied;
• Obtaining an understanding and testing the design and operating effectiveness of key controls in relation to the recognition of revenues, particularly focus on controls around the timely and accurate recording of sales transactions;
• Testing gross sales transactions and credit/debit notes on sampling basis by tracing to relevant supporting documents, including invoices to customers, delivery documents and subsequent cash receipts from those customers. Additionally, I inspected sales contracts and/or other related documents between the Group and customers to determine whether the revenue transactions were recognised correctly and appropriately;
• Selecting revenue samples prior to and after year end to test whether they are recorded in appropriate timing, based on terms and conditions set out in sales invoices and delivery documents or system generated reports; and
• Sending debtor confirmations for balances as at 31 October 2020, completing appropriate roll-forward procedures and performing subsequent receipt testing on customer balances for which confirmations were not received.
From the procedures performed, I found that the revenue recognition of the petroleum products and petrochemical products was appropriately applied in accordance with the Group’s accounting policies.
Cost of Inventory
As of 31 December 2020, the Group held inventories, mainly petroleum and petrochemical products, of Baht 5,077 million which represent 8 percent of the Group’s total assets. Cost of inventories primarily comprise purchase prices of crude oil and the manufacturing costs which are allocated to each type of products. Cost calculation requires the Group to perform the following procedures:
• Generating an automated report that computes the unit cost of each product. From this report, the production costs of inventories are pooled together and are allocated to each product using percentage of each product reference value to total production costs;
• Performing a comparison between product unit costs and market prices to ensure there is no significant unusual item; and
• Using final unit costs for calculation of inventory balance using FIFO application.
My work performed over cost of inventories included:
• Obtaining an understanding and testing the design and operating effectiveness of key controls in relation to over the inventory management and procurement cycle to the purchase requisitions, purchase orders, goods receiving, payments and recording to reflect the accuracy of the cost of inventory;
• Testing purchase transactions in relation to timing, amounts and volumes on sampling basis by tracing to relevant supporting documents, including invoices from suppliers and receiving documents;
• Selecting inventory purchase samples prior to and after year end to test whether they are recorded in appropriate timing, based on terms and conditions set out in delivery documents and recording to reflect the accuracy of the cost of inventory;
• Obtaining an understanding of basis of inventory cost to identify appropriateness of accounting policies the Group applied;
Key audit matter How my audit addressed the key audit matter
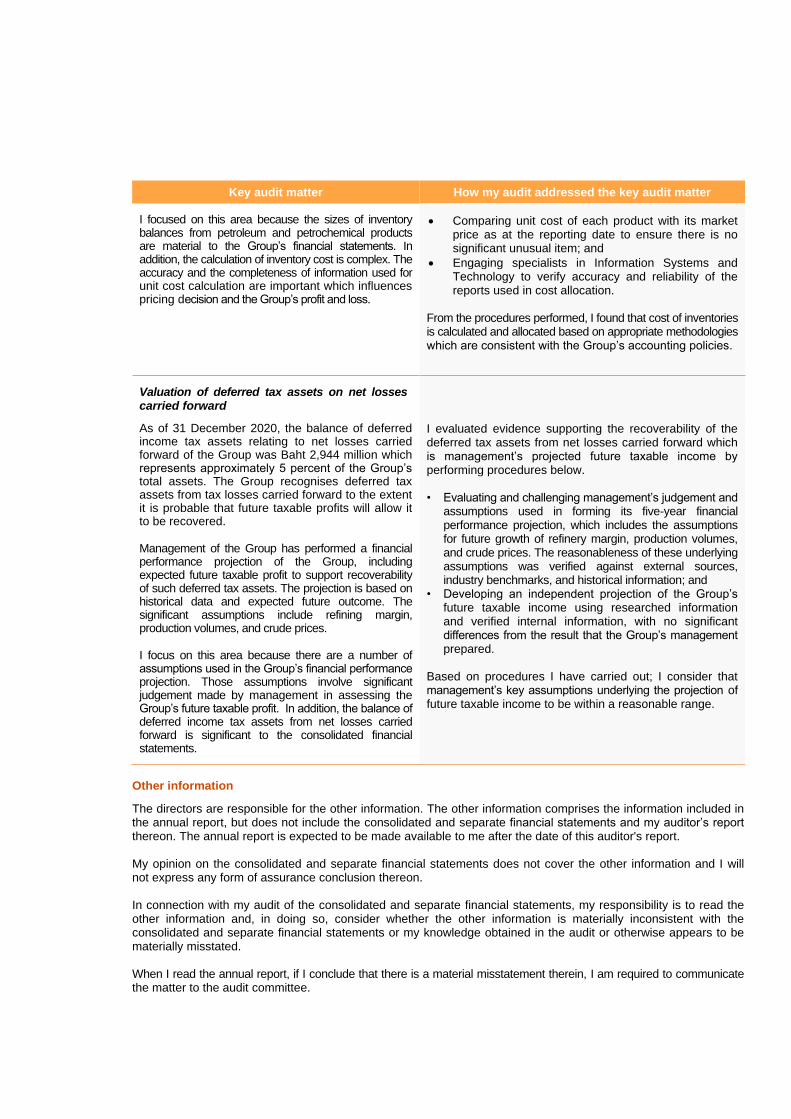
I focused on this area because the sizes of inventory balances from petroleum and petrochemical products are material to the Group’s financial statements. In addition, the calculation of inventory cost is complex. The accuracy and the completeness of information used for unit cost calculation are important which influences pricing decision and the Group’s profit and loss.
• Comparing unit cost of each product with its market price as at the reporting date to ensure there is no significant unusual item; and
• Engaging specialists in Information Systems and Technology to verify accuracy and reliability of the reports used in cost allocation.
From the procedures performed, I found that cost of inventories is calculated and allocated based on appropriate methodologies which are consistent with the Group’s accounting policies.
Valuation of deferred tax assets on net losses carried forward
As of 31 December 2020, the balance of deferred income tax assets relating to net losses carried forward of the Group was Baht 2,944 million which represents approximately 5 percent of the Group’s total assets. The Group recognises deferred tax assets from tax losses carried forward to the extent it is probable that future taxable profits will allow it to be recovered. Management of the Group has performed a financial performance projection of the Group, including expected future taxable profit to support recoverability of such deferred tax assets. The projection is based on historical data and expected future outcome. The significant assumptions include refining margin, production volumes, and crude prices. I focus on this area because there are a number of assumptions used in the Group’s financial performance projection. Those assumptions involve significant judgement made by management in assessing the Group’s future taxable profit. In addition, the balance of deferred income tax assets from net losses carried forward is significant to the consolidated financial statements.
I evaluated evidence supporting the recoverability of the deferred tax assets from net losses carried forward which is management’s projected future taxable income by performing procedures below. • Evaluating and challenging management’s judgement and
assumptions used in forming its five-year financial performance projection, which includes the assumptions for future growth of refinery margin, production volumes, and crude prices. The reasonableness of these underlying assumptions was verified against external sources, industry benchmarks, and historical information; and
• Developing an independent projection of the Group’s future taxable income using researched information and verified internal information, with no significant differences from the result that the Group’s management prepared.
Based on procedures I have carried out; I consider that management’s key assumptions underlying the projection of future taxable income to be within a reasonable range.
Other information
The directors are responsible for the other information. The other information comprises the information included in the annual report, but does not include the consolidated and separate financial statements and my auditor’s report thereon. The annual report is expected to be made available to me after the date of this auditor's report. My opinion on the consolidated and separate financial statements does not cover the other information and I will not express any form of assurance conclusion thereon. In connection with my audit of the consolidated and separate financial statements, my responsibility is to read the other information and, in doing so, consider whether the other information is materially inconsistent with the consolidated and separate financial statements or my knowledge obtained in the audit or otherwise appears to be materially misstated. When I read the annual report, if I conclude that there is a material misstatement therein, I am required to communicate the matter to the audit committee.
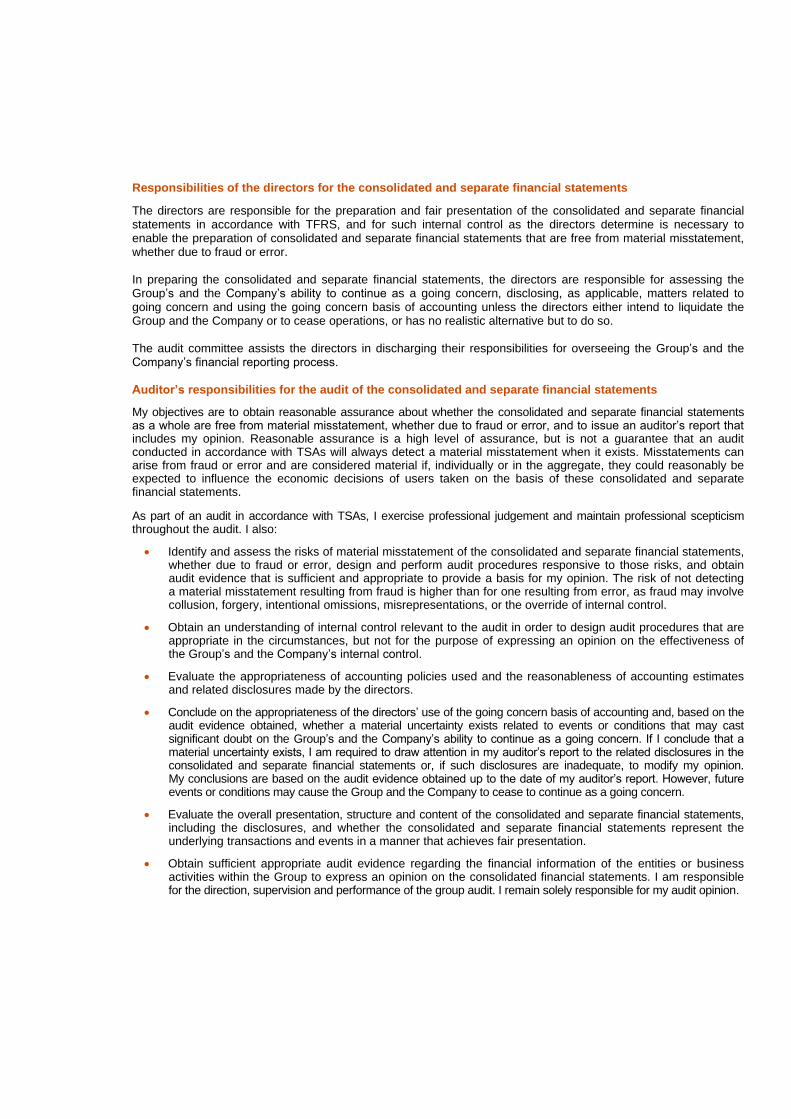
Responsibilities of the directors for the consolidated and separate financial statements
The directors are responsible for the preparation and fair presentation of the consolidated and separate financial statements in accordance with TFRS, and for such internal control as the directors determine is necessary to enable the preparation of consolidated and separate financial statements that are free from material misstatement, whether due to fraud or error. In preparing the consolidated and separate financial statements, the directors are responsible for assessing the Group’s and the Company’s ability to continue as a going concern, disclosing, as applicable, matters related to going concern and using the going concern basis of accounting unless the directors either intend to liquidate the Group and the Company or to cease operations, or has no realistic alternative but to do so. The audit committee assists the directors in discharging their responsibilities for overseeing the Group’s and the Company’s financial reporting process. Auditor’s responsibilities for the audit of the consolidated and separate financial statements
My objectives are to obtain reasonable assurance about whether the consolidated and separate financial statements as a whole are free from material misstatement, whether due to fraud or error, and to issue an auditor’s report that includes my opinion. Reasonable assurance is a high level of assurance, but is not a guarantee that an audit conducted in accordance with TSAs will always detect a material misstatement when it exists. Misstatements can arise from fraud or error and are considered material if, individually or in the aggregate, they could reasonably be expected to influence the economic decisions of users taken on the basis of these consolidated and separate financial statements.
As part of an audit in accordance with TSAs, I exercise professional judgement and maintain professional scepticism throughout the audit. I also:
• Identify and assess the risks of material misstatement of the consolidated and separate financial statements, whether due to fraud or error, design and perform audit procedures responsive to those risks, and obtain audit evidence that is sufficient and appropriate to provide a basis for my opinion. The risk of not detecting a material misstatement resulting from fraud is higher than for one resulting from error, as fraud may involve collusion, forgery, intentional omissions, misrepresentations, or the override of internal control.
• Obtain an understanding of internal control relevant to the audit in order to design audit procedures that are appropriate in the circumstances, but not for the purpose of expressing an opinion on the effectiveness of the Group’s and the Company’s internal control.
• Evaluate the appropriateness of accounting policies used and the reasonableness of accounting estimates and related disclosures made by the directors.
• Conclude on the appropriateness of the directors’ use of the going concern basis of accounting and, based on the audit evidence obtained, whether a material uncertainty exists related to events or conditions that may cast significant doubt on the Group’s and the Company’s ability to continue as a going concern. If I conclude that a material uncertainty exists, I am required to draw attention in my auditor’s report to the related disclosures in the consolidated and separate financial statements or, if such disclosures are inadequate, to modify my opinion. My conclusions are based on the audit evidence obtained up to the date of my auditor’s report. However, future events or conditions may cause the Group and the Company to cease to continue as a going concern.
• Evaluate the overall presentation, structure and content of the consolidated and separate financial statements, including the disclosures, and whether the consolidated and separate financial statements represent the underlying transactions and events in a manner that achieves fair presentation.
• Obtain sufficient appropriate audit evidence regarding the financial information of the entities or business activities within the Group to express an opinion on the consolidated financial statements. I am responsible for the direction, supervision and performance of the group audit. I remain solely responsible for my audit opinion.

I communicate with the audit committee regarding, among other matters, the planned scope and timing of the audit and significant audit findings, including any significant deficiencies in internal control that I identify during my audit. I also provide the audit committee with a statement that I have complied with relevant ethical requirements regarding independence, and to communicate with them all relationships and other matters that may reasonably be thought to bear on my independence, and where applicable, related safeguards. From the matters communicated with the audit committee, I determine those matters that were of most significance in the audit of the consolidated and separate financial statements of the current period and are therefore the key audit matters. I describe these matters in my auditor’s report unless law or regulation precludes public disclosure about the matter or when, in extremely rare circumstances, I determine that a matter should not be communicated in my report because the adverse consequences of doing so would reasonably be expected to outweigh the public interest benefits of such communication. PricewaterhouseCoopers ABAS Ltd. Pongthavee Ratanakoses Certified Public Accountant (Thailand) No. 7795 Bangkok 23 February 2021

Esso (Thailand) Public Company Limited
Statement of Financial Position
As at 31 December 2020
(All amounts in Baht thousand unless otherwise stated)
Notes 2020 2019 2020 2019
Assets
Current assets
Cash and cash equivalents 8 261,687 276,683 261,687 276,683
Trade receivables, net 9 5,083,153 6,464,042 5,083,153 6,464,042
Amounts due from related parties 35f 36,486 - 99,982 50,526
Inventories, net 10 13,144,237 19,085,170 13,144,237 19,085,170
Other receivables, net 11 2,888,219 1,377,578 2,888,219 1,377,578
Other current assets 4, 12 1,507,155 4,774,725 1,639,698 4,957,208
Total current assets 22,920,937 31,978,198 23,116,976 32,211,207
Non-current assets
Financial assets measured at fair value
through other comprehensive income 4, 13 1,071,000 - 1,071,000 -
Available-for-sale investments 4, 13 - 1,350,000 - 1,350,000
Investments in an associate 15 2,137,192 2,206,905 1,729,360 1,729,360
Investments in subsidiaries 15 - - 114,589 114,589
Long-term loans to related parties 35g - - 3,443,943 3,251,419
Property, plant and equipment, net 16 24,750,398 25,599,800 20,545,508 21,394,910
Right-of-use assets, net 4, 17 4,287,336 - 4,342,922 -
Intangible assets, net 18 181,195 181,174 181,195 181,174
Deferred income tax assets, net 19 3,511,731 1,500,999 3,400,712 1,388,763
Prepaid rental and deferred charges 4 265,474 1,725,830 484,098 2,118,327
Other non-current assets 20 2,252,822 1,699,723 2,252,822 1,699,723
Total non-current assets 38,457,148 34,264,431 37,566,149 33,228,265
Total assets 61,378,085 66,242,629 60,683,125 65,439,472
The notes on pages 12 to 50 are an integral part of these consolidated financial statements and separate financial statements.
Director …………………………………………………
SeparateConsolidated
financial statements financial statements
5

Esso (Thailand) Public Company Limited
Statement of Financial Position
As at 31 December 2020
(All amounts in Baht thousand unless otherwise stated)
Notes 2020 2019 2020 2019
Liabilities and equity
Current liabilities
Bank overdrafts and short-term borrowings
from financial institutions 21 6,081,506 6,488,377 6,081,506 6,488,377
Trade and other payables 22 4,451,951 5,020,169 4,451,535 5,019,720
Amounts due to related parties 35f 7,894,058 8,091,234 7,893,884 8,101,318
Current portion of long-term borrowings
from financial institutions 21 1,933,333 1,466,667 1,933,333 1,466,667
Current portion of long-term borrowings
from related parties 35h 3,233,333 1,633,333 3,233,333 1,633,333
Short-term loans from related parties 35h 10,621,104 13,188,379 10,621,980 13,189,278
Current income tax payables 617 632 - -
Current portion of lease liabilities 4 357,665 - 383,717 -
Short-term provisions for employee benefits 23 872,389 787,070 872,389 787,070
Total current liabilities 35,445,956 36,675,861 35,471,677 36,685,763
Non-current liabilities
Long-term borrowings from
financial institutions 21 1,716,667 1,816,667 1,716,667 1,816,667
Long-term loans from related parties 35h 4,616,667 2,350,000 4,617,968 2,350,756
Lease liabilities 4 2,439,856 - 2,469,911 -
Long-term provisions for employee benefits 23 2,799,408 3,280,326 2,799,408 3,280,326
Other non-current liabilities 5 1,845 5 1,845
Total non-current liabilities 11,572,603 7,448,838 11,603,959 7,449,594
Total liabilities 47,018,559 44,124,699 47,075,636 44,135,357
The notes on pages 12 to 50 are an integral part of these consolidated financial statements and separate financial statements.
financial statements
Consolidated Separate
financial statements
6

Esso (Thailand) Public Company Limited
Statement of Financial Position
As at 31 December 2020
(All amounts in Baht thousand unless otherwise stated)
Notes 2020 2019 2020 2019
Liabilities and equity (continued)
Equity
Share capital
Authorised share capital
3,467,916,666 ordinary shares
with par value
of Baht 4.9338 each 24 17,110,007 17,110,007 17,110,007 17,110,007
Issued and paid-up share capital
3,460,858,000 ordinary shares
with paid-up value
of Baht 4.9338 each 24 17,075,181 17,075,181 17,075,181 17,075,181
Share premium 24 4,031,711 4,031,711 4,031,711 4,031,711
Retained earnings (deficits)
Appropriated
Legal reserve 25 1,000,901 1,000,901 1,000,901 1,000,901
Unappropriated (8,080,990) (169,916) (8,832,838) (983,542)
Other components of equity 26 325,289 172,619 332,534 179,864
Equity attributable to owners of the parent 14,352,092 22,110,496 13,607,489 21,304,115
Non-controlling interests 7,434 7,434 - -
Total equity 14,359,526 22,117,930 13,607,489 21,304,115
Total liabilities and equity 61,378,085 66,242,629 60,683,125 65,439,472
The notes on pages 12 to 50 are an integral part of these consolidated financial statements and separate financial statements.
financial statements financial statements
Consolidated Separate
7
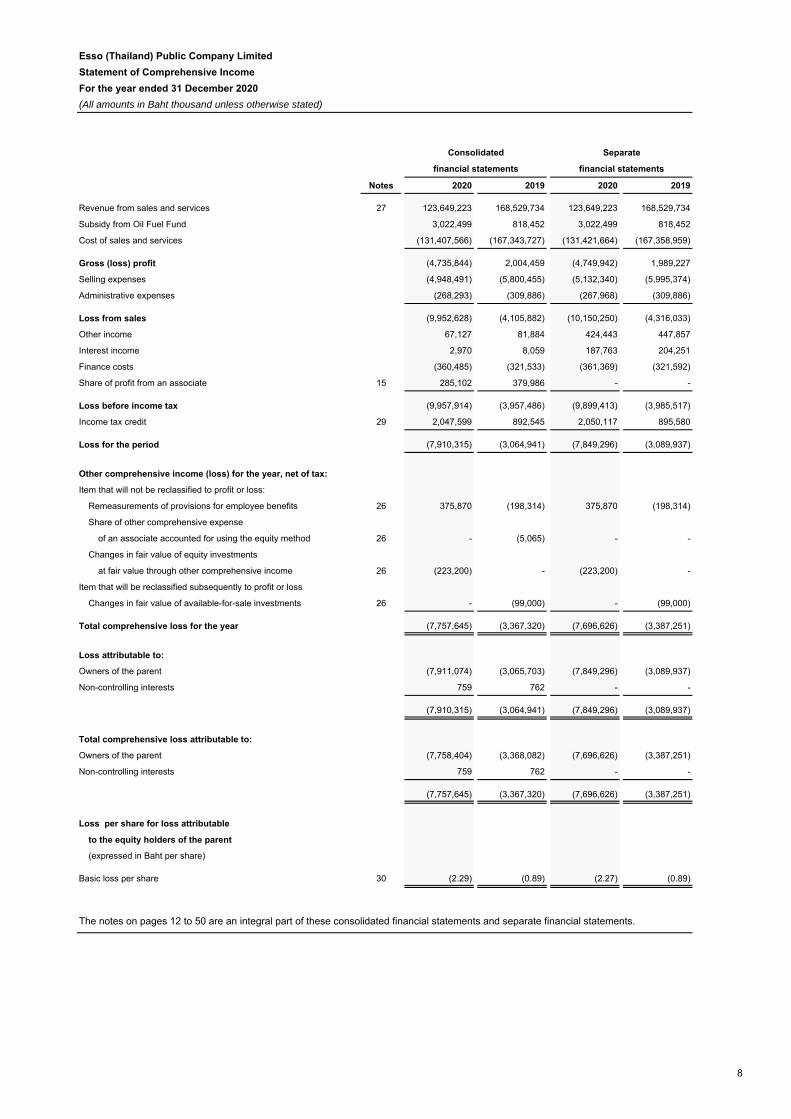
Esso (Thailand) Public Company Limited
Statement of Comprehensive Income
For the year ended 31 December 2020
(All amounts in Baht thousand unless otherwise stated)
Notes 2020 2019 2020 2019
Revenue from sales and services 27 123,649,223 168,529,734 123,649,223 168,529,734
Subsidy from Oil Fuel Fund 3,022,499 818,452 3,022,499 818,452
Cost of sales and services (131,407,566) (167,343,727) (131,421,664) (167,358,959)
Gross (loss) profit (4,735,844) 2,004,459 (4,749,942) 1,989,227
Selling expenses (4,948,491) (5,800,455) (5,132,340) (5,995,374)
Administrative expenses (268,293) (309,886) (267,968) (309,886)
Loss from sales (9,952,628) (4,105,882) (10,150,250) (4,316,033)
Other income 67,127 81,884 424,443 447,857
Interest income 2,970 8,059 187,763 204,251
Finance costs (360,485) (321,533) (361,369) (321,592)
Share of profit from an associate 15 285,102 379,986 - -
Loss before income tax (9,957,914) (3,957,486) (9,899,413) (3,985,517)
Income tax credit 29 2,047,599 892,545 2,050,117 895,580
Loss for the period (7,910,315) (3,064,941) (7,849,296) (3,089,937)
Other comprehensive income (loss) for the year, net of tax:
Item that will not be reclassified to profit or loss:
Remeasurements of provisions for employee benefits 26 375,870 (198,314) 375,870 (198,314)
Share of other comprehensive expense
of an associate accounted for using the equity method 26 - (5,065) - -
Changes in fair value of equity investments
at fair value through other comprehensive income 26 (223,200) - (223,200) -
Item that will be reclassified subsequently to profit or loss
Changes in fair value of available-for-sale investments 26 - (99,000) - (99,000)
Total comprehensive loss for the year (7,757,645) (3,367,320) (7,696,626) (3,387,251)
Loss attributable to:
Owners of the parent (7,911,074) (3,065,703) (7,849,296) (3,089,937)
Non-controlling interests 759 762 - -
(7,910,315) (3,064,941) (7,849,296) (3,089,937)
Total comprehensive loss attributable to:
Owners of the parent (7,758,404) (3,368,082) (7,696,626) (3,387,251)
Non-controlling interests 759 762 - -
(7,757,645) (3,367,320) (7,696,626) (3,387,251)
Loss per share for loss attributable
to the equity holders of the parent
(expressed in Baht per share)
Basic loss per share 30 (2.29) (0.89) (2.27) (0.89)
The notes on pages 12 to 50 are an integral part of these consolidated financial statements and separate financial statements.
Consolidated Separate
financial statements financial statements
8
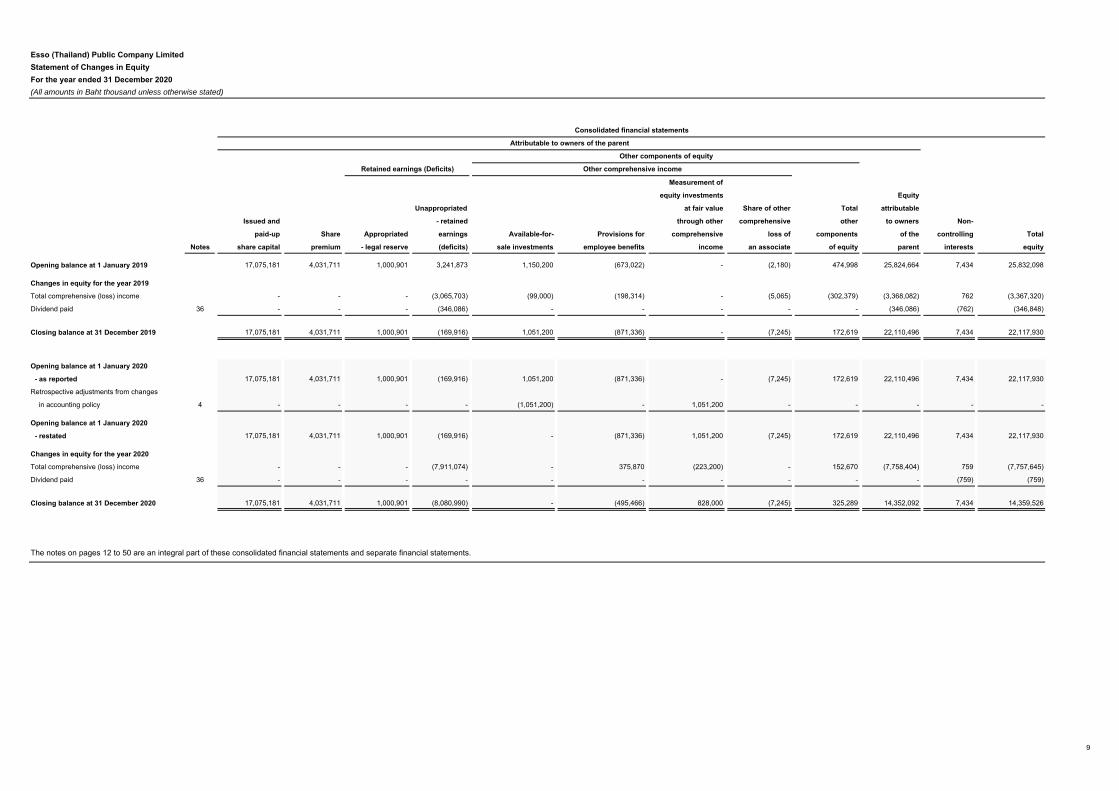
Esso (Thailand) Public Company Limited
Statement of Changes in Equity
For the year ended 31 December 2020
(All amounts in Baht thousand unless otherwise stated)
Measurement of
equity investments Equity
Unappropriated at fair value Share of other Total attributable
Issued and - retained through other comprehensive other to owners Non-
paid-up Share Appropriated earnings Available-for- Provisions for comprehensive loss of components of the controlling Total
Notes share capital premium - legal reserve (deficits) sale investments employee benefits income an associate of equity parent interests equity
Opening balance at 1 January 2019 17,075,181 4,031,711 1,000,901 3,241,873 1,150,200 (673,022) - (2,180) 474,998 25,824,664 7,434 25,832,098
Changes in equity for the year 2019
Total comprehensive (loss) income - - - (3,065,703) (99,000) (198,314) - (5,065) (302,379) (3,368,082) 762 (3,367,320)
Dividend paid 36 - - - (346,086) - - - - - (346,086) (762) (346,848)
Closing balance at 31 December 2019 17,075,181 4,031,711 1,000,901 (169,916) 1,051,200 (871,336) - (7,245) 172,619 22,110,496 7,434 22,117,930
Opening balance at 1 January 2020
- as reported 17,075,181 4,031,711 1,000,901 (169,916) 1,051,200 (871,336) - (7,245) 172,619 22,110,496 7,434 22,117,930
Retrospective adjustments from changes
in accounting policy 4 - - - - (1,051,200) - 1,051,200 - - - - -
Opening balance at 1 January 2020
- restated 17,075,181 4,031,711 1,000,901 (169,916) - (871,336) 1,051,200 (7,245) 172,619 22,110,496 7,434 22,117,930
Changes in equity for the year 2020
Total comprehensive (loss) income - - - (7,911,074) - 375,870 (223,200) - 152,670 (7,758,404) 759 (7,757,645)
Dividend paid 36 - - - - - - - - - - (759) (759)
Closing balance at 31 December 2020 17,075,181 4,031,711 1,000,901 (8,080,990) - (495,466) 828,000 (7,245) 325,289 14,352,092 7,434 14,359,526
The notes on pages 12 to 50 are an integral part of these consolidated financial statements and separate financial statements.
Consolidated financial statements
Attributable to owners of the parent
Other components of equity
Retained earnings (Deficits) Other comprehensive income
9

Esso (Thailand) Public Company Limited
Statement of Changes in Equity
For the year ended 31 December 2020
(All amounts in Baht thousand unless otherwise stated)
Measurement of
equity investments
Unappropriated at fair value Total
Issued and - retained Provisions for through other other
paid-up Share Appropriated earnings Available-for- employee comprehensive components Total
Notes share capital premium - legal reserve (deficits) sale investments benefits income of equity equity
Opening balance at 1 January 2019 17,075,181 4,031,711 1,000,901 2,452,481 1,150,200 (673,022) - 477,178 25,037,452
Changes in equity for the year 2019
Total comprehensive loss - - - (3,089,937) (99,000) (198,314) - (297,314) (3,387,251)
Dividend paid 36 - - - (346,086) - - - - (346,086)
Closing balance at 31 December 2019 17,075,181 4,031,711 1,000,901 (983,542) 1,051,200 (871,336) - 179,864 21,304,115
Opening balance at 1 January 2020 - as reported 17,075,181 4,031,711 1,000,901 (983,542) 1,051,200 (871,336) - 179,864 21,304,115
Retrospective adjustments from changes
in accounting policy 4 - - - - (1,051,200) - 1,051,200 - -
Opening balance at 1 January 2020 - restated 17,075,181 4,031,711 1,000,901 (983,542) - (871,336) 1,051,200 179,864 21,304,115
Changes in equity for the year 2020
Total comprehensive (loss) income - - - (7,849,296) - 375,870 (223,200) 152,670 (7,696,626)
Closing balance at 31 December 2020 17,075,181 4,031,711 1,000,901 (8,832,838) - (495,466) 828,000 332,534 13,607,489
Separate financial statements
Other components of equity
Retained earnings (Deficits)
The notes on pages 12 to 50 are an integral part of these consolidated financial statements and separate financial statements.
Other comprehensive income
10

Esso (Thailand) Public Company Limited
Statement of Cash Flows
For the year ended 31 December 2020
(All amounts in Baht thousand unless otherwise stated)
Notes 2020 2019 2020 2019
Cash flows from operating activities
Cash generated from (used in) operations 31 135,975 (9,947,982) 159,735 (9,930,863)
Interest paid (220,810) (237,803) (220,844) (237,864)
Income tax received 493,764 18,938 495,079 20,126
Net cash generated from (used in) operating activities 408,929 (10,166,847) 433,970 (10,148,601)
Cash flows from investing activities
Loan payments received from related parties 35 g - - 658 1,003
Loans made to related parties 35 g - - (193,182) (216,717)
Purchase of property, plant and equipment (1,468,673) (1,610,879) (1,468,673) (1,610,879)
Purchase of intangible assets 18 (17,923) (47,838) (17,923) (47,838)
Payments for right-of-use assets (181,872) - (181,872) -
Proceeds from disposal of property, plant
and equipment 31 13,292 15,437 13,292 15,437
Interest received 2,970 8,059 192,725 201,528
Dividends received from a subsidiary - - 2,500 3,700
Dividends received from an associate 354,815 362,271 354,815 362,271
Dividend received from financial assets measured at
fair value through other comprehensive income 45,900 61,650 45,900 61,650
Net cash used in investing activities (1,251,491) (1,211,300) (1,251,760) (1,229,845)
Cash flows from financing activities
Net (payments on) proceeds from short-term borrowings (406,872) 1,192,188 (406,872) 1,192,188
Payments on long-term borrowings (1,633,333) (1,616,666) (1,633,333) (1,616,666)
Proceeds from long-term borrowings 2,000,000 2,300,000 2,000,000 2,300,000
Net (payments on) proceeds from short-term loans
from related parties (2,641,717) 8,360,175 (2,641,740) 8,360,156
Payments on long-term loans from related parties (2,133,333) (2,416,667) (2,136,991) (2,421,629)
Proceeds from long-term loans from related parties 6,000,000 3,700,000 6,004,203 3,704,518
Dividends paid to group shareholders - (346,086) - (346,086)
Dividends paid to non-controlling interests (759) (762) - -
Payments on lease liabilities (356,420) - (382,473) -
Net cash generated from financing activities 827,566 11,172,182 802,794 11,172,481
Net decrease in cash and cash equivalents (14,996) (205,965) (14,996) (205,965)
Cash and cash equivalents at the beginning of the year 276,683 482,648 276,683 482,648
Cash and cash equivalents at the end of the year 8 261,687 276,683 261,687 276,683
The notes on pages 12 to 50 are an integral part of these consolidated financial statements and separate financial statements.
Consolidated Separate
financial statements financial statements
11

Esso (Thailand) Public Company Limited Notes to the Consolidated and Separate Financial Statements For the year ended 31 December 2020 (All amounts in Baht thousand unless otherwise stated)
12
1 General information
Esso (Thailand) Public Company Limited (“the Company”) is a public limited company incorporated and domiciled in Thailand. The address of its registered office is 3195/17-29 Rama IV Road, Klongton, Klongtoey, Bangkok, 10110. The Company listed on the Stock Exchange of Thailand (“SET”) on 6 May 2008. The Company and its subsidiaries (together “the Group”) are involved in the refining and marketing of petroleum products, which includes a network of retail service stations. The Group operates a refinery and chemical manufacturing plant in Sriracha, Thailand. The Group also operates distribution facilities and oil terminals throughout Thailand. The Group’s products are sold through a network of retail service stations, directly to industrial customers, and through export. Additionally, the Group is involved in the sale of chemical products to both domestic and overseas customers. The Company is a subsidiary of ExxonMobil Group which holds 65.99% of the Company’s shares. These consolidated and separate financial statements were authorised for issue by the Board of Directors on 23 February 2021.
2 Basis of preparation
The consolidated and separate financial statements have been prepared in accordance with Thai Financial Reporting Standards (“TFRS”) and the financial reporting requirements issued under the Securities and Exchange Act. The consolidated and separate financial statements have been prepared under the historical cost convention except as disclosed in the accounting policy for certain financial assets. The preparation of financial statements in conformity with TFRS requires management to use certain critical accounting estimates and to exercise its judgement in applying the Group’s accounting policies. The areas involving a higher degree of judgement or complexity, or areas where assumptions and estimates are significant to the consolidated and separate financial statements are disclosed in Note 6. As at 31 December 2020, the current liabilities of the Group exceeded the current assets by approximately Baht 12,525 million. The Group currently has adequate financing sources to generate operational cash flow and to enable the payment of liabilities when they become due as follows: (1) uncommitted borrowing facilities from related companies and financial institutions in the amount of Baht 76,866 million, and (2) the ability to offer Baht 11,500 million of bills of exchange in a revolving program as approved by the Securities and Exchange Commission. Even though the aforementioned situation exists, the Group continuously operates and considers operational and financial plans in order to ensure an ability to continue its operations as a going concern in accordance with the demand and supply of relevant industries of the Group. In addition, the Group places importance on and closely monitors the situations. Accordingly, the consolidated and separate financial statements have been prepared on a going concern basis and do not include any adjustments relating to the recoverability and classification of recorded asset amounts, or to amounts or classification of liabilities that may be necessary if the going concern basis of preparing the consolidated and separate financial statements is not appropriate. An English version of the consolidated and separate financial statements have been prepared from the statutory financial statements that are in the Thai language. In the event of a conflict or a difference in interpretation between the two languages, the Thai language statutory financial statements shall prevail.

Esso (Thailand) Public Company Limited Notes to the Consolidated and Separate Financial Statements For the year ended 31 December 2020 (All amounts in Baht thousand unless otherwise stated)
13
3 New and amended financial reporting standards
3.1 New and amended financial reporting standards that are effective for accounting period beginning on or
after 1 January 2020 and have significant impacts to the Group a) Financial instruments
The new financial standards related to financial instruments are as follows: TAS 32 Financial instruments: Presentation TFRS 7 Financial instruments: Disclosures TFRS 9 Financial instruments The new financial reporting standards related to financial instruments introduce new classification and measurement requirements for financial instruments as well as provide derecognition guidance on financial assets and financial liabilities.
The new classification requirements of financial assets require the Group to assess both i) business model for holding the financial assets; and ii) cash flow characteristics of the asset whether the contractual cash flows represent solely payments of principal and interest (SPPI). The classification affects the financial assets’ measurement. The new guidance requires assessment of impairment of financial assets as well as contract assets and recognition of expected credit loss from initial recognition. On 1 January 2020, the Group has adopted the financial reporting standards related to financial instruments in its financial statements. The impact from the first-time adoption has been disclosed in Note 4.
b) TFRS 16, Leases Where the Group is a lessee, TFRS 16, Leases will result in almost all leases being recognised on the balance sheet as the distinction between operating and finance leases is removed. A right-of-use asset and a lease liability will be recognised, with exception on short-term and low-value leases. On 1 January 2020, the Group has adopted the new lease standard in its financial statements. The impact from the first-time adoption has been disclosed in Note 4.
3.2 New and amended financial reporting standards that are effective for accounting period beginning or after 1 January 2021 and have significant impacts to the Group Certain new and amended financial reporting standards have been issued that are not mandatory for current reporting period and have not been early adopted by the Group. a) Revised Conceptual Framework for Financial Reporting added the following key principals and
guidance:
- Measurement basis, including factors in considering difference measurement basis
- Presentation and disclosure, including classification of income and expenses in other comprehensive income
- Definition of a reporting entity, which maybe a legal entity, or a portion of an entity
- Derecognition of assets and liabilities The amendment also includes the revision to the definition of an asset and liability in the financial statements, and clarification to the prominence of stewardship in the objective of financial reporting.
b) Amendment to TAS 1, Presentation of financial statements and TAS 8, Accounting policies, changes in accounting estimates and errors amended to definition of materiality. The amendment allows for a consistent definition of materiality throughout the Thai Financial Reporting Standards and the Conceptual Framework for Financial Reporting. It also explains more clearly the application of materiality in TAS 1.

Esso (Thailand) Public Company Limited Notes to the Consolidated and Separate Financial Statements For the year ended 31 December 2020 (All amounts in Baht thousand unless otherwise stated)
14
4 Impacts from initial application of the new and revised financial reporting standards
This note explains the impact of the adoption of TAS 32 Financial Instruments: Presentation, TFRS 7 Financial Instruments: Disclosure, TFRS 9 Financial Instruments and TFRS 16 Leases on the Group’s consolidated financial statements and the Company’s separate financial statements. The new accounting policies applied from 1 January 2020 were disclosed in Note 5.5 and 5.10. The Group and the Company have adopted those accounting policies from 1 January 2020 by applying the modified retrospective approach. The comparative figures have not been restated. The reclassifications and the adjustments arising from the changes in accounting policies were therefore recognised in the statement of financial position as of 1 January 2020. The impact of first-time adoption of new financial reporting standards on the consolidated and separate statements of financial position are as follows:
Consolidated financial statements
Notes 31 December
2019 TFRS 9 and
TAS 32
TFRS 16 1 January
2020
Current assets Other current assets B, C 4,774,725 - (141,336) 4,633,389 Non-current assets Financial assets measured
at fair value through other comprehensive income
A - 1,350,000
- 1,350,000 Available-for-sale investments A 1,350,000 (1,350,000) - - Right-of-use assets, net B, C - - 3,582,743 3,582,743 Prepaid rental and deferred charges B, C 1,725,830 - (1,367,374) 358,456
Total assets affected 7,850,555 - 2,074,033 9,924,588
Current liabilities Current portion of lease liabilities B, C - - 207,579 207,579 Non-current liabilities Lease liabilities B, C - - 1,866,454 1,866,454
Total liabilities affected - - 2,074,033 2,074,033
Separate financial statements
Notes 31 December
2019 TFRS 9 and
TAS 32
TFRS 16 1 January
2020
Current assets Other current assets B, C 4,957,208 - (141,336) 4,815,872 Non-current assets Financial assets measured
at fair value through other comprehensive income
A - 1,350,000
- 1,350,000 Available-for-sale investments A 1,350,000 (1,350,000) - - Right-of-use assets, net B, C - - 3,663,306 3,663,306 Prepaid rental and deferred charges B, C 2,118,327 - (1,367,292) 751,035
Total assets affected 8,425,535 - 2,154,678 10,580,213
Current liabilities Current portion of lease liabilities B, C - - 233,632 233,632 Non-current liabilities Lease liabilities B, C - - 1,921,046 1,921,046
Total liabilities affected - - 2,154,678 2,154,678
Esso (Thailand) Public Company Limited Notes to the Consolidated and Separate Financial Statements For the year ended 31 December 2020 (All amounts in Baht thousand unless otherwise stated)
15
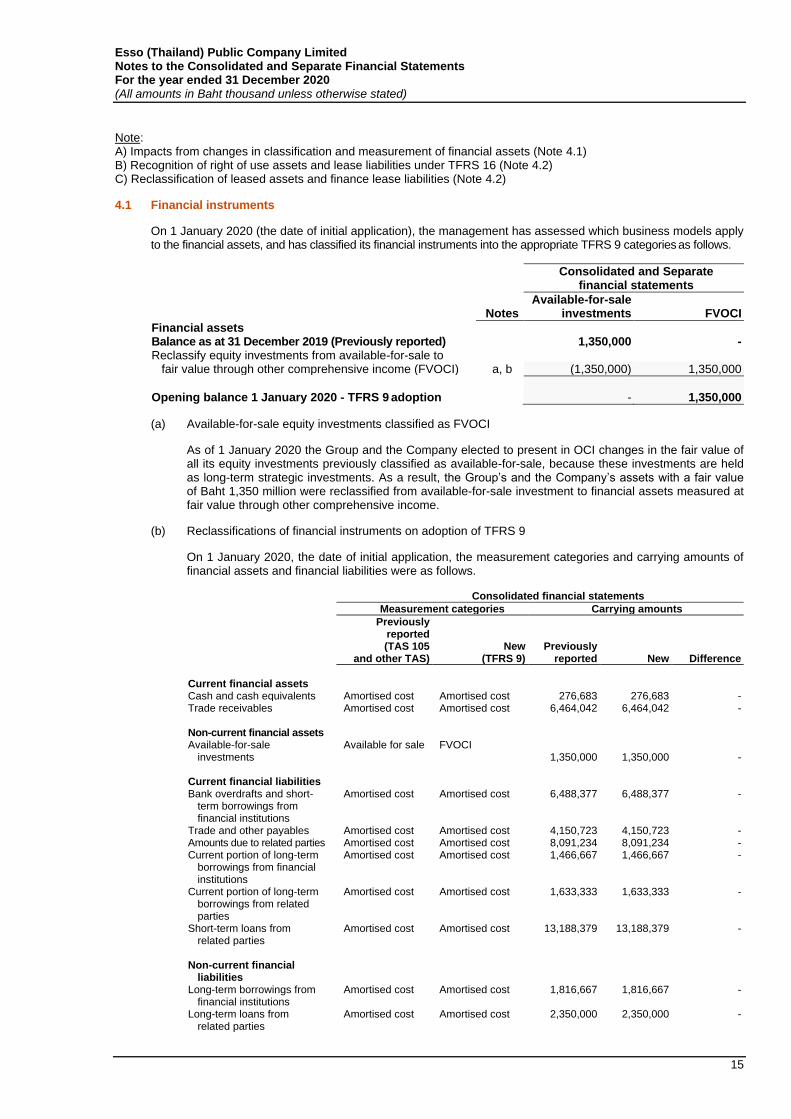
Note: A) Impacts from changes in classification and measurement of financial assets (Note 4.1) B) Recognition of right of use assets and lease liabilities under TFRS 16 (Note 4.2) C) Reclassification of leased assets and finance lease liabilities (Note 4.2)
4.1 Financial instruments
On 1 January 2020 (the date of initial application), the management has assessed which business models apply to the financial assets, and has classified its financial instruments into the appropriate TFRS 9 categories as follows.
Consolidated and Separate financial statements
Notes
Available-for-sale investments
FVOCI
Financial assets Balance as at 31 December 2019 (Previously reported) 1,350,000 - Reclassify equity investments from available-for-sale to fair value through other comprehensive income (FVOCI) a, b (1,350,000) 1,350,000
Opening balance 1 January 2020 - TFRS 9 adoption - 1,350,000
(a) Available-for-sale equity investments classified as FVOCI
As of 1 January 2020 the Group and the Company elected to present in OCI changes in the fair value of all its equity investments previously classified as available-for-sale, because these investments are held as long-term strategic investments. As a result, the Group’s and the Company’s assets with a fair value of Baht 1,350 million were reclassified from available-for-sale investment to financial assets measured at fair value through other comprehensive income.
(b) Reclassifications of financial instruments on adoption of TFRS 9
On 1 January 2020, the date of initial application, the measurement categories and carrying amounts of financial assets and financial liabilities were as follows. Consolidated financial statements
Measurement categories Carrying amounts
Previously reported (TAS 105
and other TAS) New
(TFRS 9)
Previously reported
New
Difference
Current financial assets Cash and cash equivalents Amortised cost Amortised cost 276,683 276,683 - Trade receivables Amortised cost Amortised cost 6,464,042 6,464,042 - Non-current financial assets Available-for-sale
investments Available for sale FVOCI
1,350,000 1,350,000 - Current financial liabilities Bank overdrafts and short-
term borrowings from financial institutions
Amortised cost Amortised cost 6,488,377 6,488,377 -
Trade and other payables Amortised cost Amortised cost 4,150,723 4,150,723 - Amounts due to related parties Amortised cost Amortised cost 8,091,234 8,091,234 - Current portion of long-term
borrowings from financial institutions
Amortised cost Amortised cost 1,466,667 1,466,667 -
Current portion of long-term borrowings from related parties
Amortised cost Amortised cost 1,633,333 1,633,333 -
Short-term loans from related parties
Amortised cost Amortised cost 13,188,379 13,188,379 -
Non-current financial
liabilities
Long-term borrowings from
financial institutions Amortised cost Amortised cost 1,816,667 1,816,667 -
Long-term loans from related parties
Amortised cost Amortised cost 2,350,000 2,350,000 -

Esso (Thailand) Public Company Limited Notes to the Consolidated and Separate Financial Statements For the year ended 31 December 2020 (All amounts in Baht thousand unless otherwise stated)
16
Separate financial statements
Measurement categories Carrying amounts
Previously reported (TAS 105
and other TAS) New
(TFRS 9)
Previously reported
New
Difference
Current financial assets Cash and cash equivalents Amortised cost Amortised cost 276,683 276,683 - Trade receivables Amortised cost Amortised cost 6,464,042 6,464,042 - Amounts due from
related parties Amortised cost
Amortised cost
50,526
50,526
-
Non-current financial assets Available-for-sale investments Available for sale FVOCI 1,350,000 1,350,000 - Long-term loans to
related parties Amortised cost
Amortised cost
3,251,419
3,251,419
-
Current financial liabilities Bank overdrafts and
short-term borrowings from financial institutions
Amortised cost Amortised cost 6,488,377 6,488,377 -
Trade and other payables Amortised cost Amortised cost 4,150,274 4,150,274 - Amounts due to related parties Amortised cost Amortised cost 8,101,318 8,101,318 - Current portion of long-term
borrowings from financial institutions
Amortised cost
Amortised cost
1,466,667
1,466,667
- Current portion of long-term
borrowings from related parties
Amortised cost
Amortised cost
1,633,333
1,633,333
- Short-term loans from
related parties Amortised cost
Amortised cost
13,189,278
13,189,278
-
Non-current financial
liabilities
Long-term borrowings from
financial institutions Amortised cost
Amortised cost
1,816,667
1,816,667
-
Long-term loans from related parties
Amortised cost
Amortised cost
2,350,756
2,350,756
-
(c) Impairment of financial assets
From 1 January 2020, the Group assesses expected credit loss on a forward looking basis for its financial assets carried at FVOCI and at amortised cost. The impairment methodology applied depends on whether there has been a significant increase in credit risk, except trade receivables which the Group applies the simplified approach in determining its expected credit loss.
The Group and the Company have following financial assets that are subject to the expected credit loss model:
• cash and cash equivalents
• trade receivables
• amounts due from related parties
• loans to related parties
While the above financial assets are subject to the new impairment requirement, the identified impact was immaterial.
Trade receivables
The Group applies the simplified approach in measuring expected credit losses, which uses a lifetime expected loss allowance for all trade receivables.
To measure the expected credit losses, trade receivables have been grouped based on shared credit risk characteristics and the days past due. The Group has concluded that the expected loss for trade receivables are a reasonable approach, based on the historical payment profiles of sales, the corresponding historical credit losses experienced as well as forward-looking information that may affect the ability of the customers to settle the receivables.
The impairment of trade receivables are disclosed in Note 9.

Esso (Thailand) Public Company Limited Notes to the Consolidated and Separate Financial Statements For the year ended 31 December 2020 (All amounts in Baht thousand unless otherwise stated)
17
4.2 Leases
On adoption of TFRS 16, the Group recognised lease liabilities in relation to leases which had previously been classified as operating leases under the principles of TAS 17 Leases for leases of properties and motor vehicles with lease terms more than 12 months. As at 1 January 2020, these liabilities were measured at the present value of the remaining lease payments, discounted using the lessee’s incremental borrowing rate. The Group’s incremental borrowing rates applied to the lease liabilities on 1 January 2020 for 1-5 years lease term and over than 5 years lease term were 1.53% and 1.84%, respectively. The Group measured right-of-use assets at the amount equal to the lease liability in which the incremental borrowing rate for the remaining lease terms from the initial application date is applied, adjusted by the amount of any prepaid or accrued lease payments relating to that lease recognised in the statement of financial position as at 31 December 2019. There were no onerous lease contracts that would have required an adjustment to the right-of-use assets at the date of initial application.
Consolidated financial
statement
Separate financial
statement
Operating lease commitments disclosed as at 31 December 2019 2,497,817 7,400,590 Less: Discounted using the lessee’s incremental borrowing rate (245,801) (247,848) Less: Non-qualified leases (177,983) (177,983) Less: Variable lease payments - (4,820,081)
Lease liability recognised as at 1 January 2020 2,074,033 2,154,678
Current lease liabilities 207,579 233,632 Non-current lease liabilities 1,866,454 1,921,046
2,074,033 2,154,678
Variable leases are from the leases of land from the Company’s subsidiaries under lease agreements effective in 2018. Rental was a variable lease payments as a cost plus basis over 30 years lease term. Therefore, it will not be included in the measurement of lease liabilities. Practical expedients applied In applying TFRS 16 for the first time for the lease contract available before 1 January 2020, the Group has used the following practical expedients permitted by the standard:
• the use of a single discount rate to a portfolio of leases with reasonably similar characteristics
• the operating leases with less than 12 months remaining lease term as at 1 January 2020 be defined as short-term leases
• the exclusion of initial direct costs for the measurement of the right-of-use asset at the date of initial application, and
• the election not to reassess whether a contract is, or contains a lease as defined under TFRS 16 at the date of initial application but relied on its assessment made applying TAS 17 and TFRIC 4 Determining whether an Arrangement contains a Lease.

Esso (Thailand) Public Company Limited Notes to the Consolidated and Separate Financial Statements For the year ended 31 December 2020 (All amounts in Baht thousand unless otherwise stated)
18
5 Accounting policies
5.1 Group Accounting - Investments in subsidiaries and associates
(a) Subsidiaries
Subsidiaries are all entities (including structured entities) over which the group has control. The group controls an entity when the group is exposed to, or has rights to, variable returns from its involvement with the entity and has the ability to affect those returns though its power over the entity. Subsidiaries are fully consolidated from the date on which control is transferred to the group. They are deconsolidated from the date that control ceases. The Group applies the acquisition method to account for business combinations. The consideration transferred for the acquisition of a subsidiary is the fair value of the assets transferred, the liabilities incurred to the former owners of the acquiree and the equity interests issued by the Group. The consideration transferred includes the fair value of any asset or liability resulting from a contingent consideration arrangement. Acquisition-related costs are expensed as incurred. Identifiable assets acquired and liabilities and contingent liabilities assumed in a business combination are measured initially at their fair values at the acquisition date. On an acquisition-by-acquisition basis, the Group recognises any non-controlling interest in the acquiree either at fair value or at the non-controlling interest’s proportionate share of the acquiree’s net assets. The excess of the consideration transferred, the amount of any non-controlling interest in the acquiree and the acquisition-date fair value of any previous equity interest in the acquiree over the fair value of the identifiable net assets acquired is recorded as goodwill. If the total of consideration transferred, non-controlling interest recognised and previously held interest measured is less than the fair value of the net assets of the subsidiary acquired in the case of a bargain purchase, the difference is recognised directly in profit or loss. Intercompany transactions, balances and unrealised gains or losses on transactions between Group companies are eliminated. Unrealised losses are also eliminated. Accounting policies of subsidiaries have been changed where necessary to ensure consistency with the policies adopted by the Group. In the Company’s separate financial statements, investments in subsidiaries are accounted for at cost less impairment. Cost also includes direct attributable costs of investments. Details of the subsidiaries are included in Note 15.
(b) Transactions with non-controlling interests The Group treats transactions with non-controlling interests as transactions with equity owners of the Group. For purchases from non-controlling interests, the difference between any consideration paid and the relevant share acquired of the carrying value of net assets of the subsidiary is recorded in equity. Gains or losses on disposals to non-controlling interests are also recorded in equity.
(c) Associates Associates are all entities over which the Group has significant influence but not control, generally accompanying a shareholding of between 20% and 50% of the voting rights. Investments in associates are accounted for using the equity method of accounting. Under the equity method, the investment is initially recognised at cost, and the carrying amount is increased or decreased to recognise the investor’s share of the profit or loss of the investee after the date of acquisition. The investments in associates of the Group including identifiable goodwill at the time the investment was acquired. The Group’s share of its associate’s post-acquisition profits or losses is recognised in the consolidated statement of comprehensive income, and its shares of post-acquisition movements in reserves are recognised in equity. The cumulative post-acquisition movements are adjusted against the carrying amount of the investment. When the Group’s share of losses in an associate equals or exceeds its interest in the associate, including any other unsecured receivables, the Group does not recognise further losses, unless it has incurred obligations or made payments on behalf of the associate. The Group determines at each reporting date whether there is any objective evidence that the investment in the associate is impaired. If this is the case, the group calculates the amount of impairment as the difference between the recoverable amount of the associate and its carrying value and recognises the amount related to share of profit/(loss) of associates in the income statement.

Esso (Thailand) Public Company Limited Notes to the Consolidated and Separate Financial Statements For the year ended 31 December 2020 (All amounts in Baht thousand unless otherwise stated)
19
Unrealised gains on transactions between the Group and its associates are eliminated to the extent of the Group’s interest in the associates. Unrealised losses are also eliminated unless the transaction provides evidence of an impairment of the asset transferred. Accounting policies of associates have been changed where necessary to ensure consistency with the policies adopted by the Group. In the Company’s separate financial statements, the investment in an associate is accounted for at cost less impairment. Cost also includes direct attributable costs of investments. Details of the associate are included in Note 15.
5.2 Cash and cash equivalents
Cash and cash equivalents includes cash on hand, deposits held at call with banks, and other short-term highly liquid investments with original maturities of three months or less. Bank overdrafts are shown within borrowings in current liabilities on the statement of financial position.
5.3 Trade receivables Trade receivables are carried at original invoice amount and subsequently measured at the invoice amount less allowance for impairment. An allowance for impairment is established when there is objective evidence that the Group will not be able to collect all amounts due according to the original terms of the receivables. Significant financial difficulties of the debtor, probability that the debtor will enter bankruptcy or financial reorganisation and default or delinquency in payments are considered indicators that the trade receivable is impaired. The amount of the allowance is the difference between the carrying amount and the amount expected to be collected. The carrying amount of the asset is reduced through the use of an allowance account, and the amount of the loss is recognised in the statement of comprehensive income within ‘selling expenses’. The receivables are written-off against the allowance account when it is uncollectible. Subsequent recoveries of accounts previously written-off are credited against ‘selling expenses’ in the statement of comprehensive income. The impairment of trade receivables are disclosed in Note 5.5(e).
5.4 Inventories Inventories are stated at the lower of cost or net realisable value. Cost is determined under the following methods: Crude oil and petroleum products First-in, first-out method Petrochemical products First-in, first-out method Materials and supplies Average unit cost method Other merchandise Average unit cost method Purchase cost includes the purchase price and costs directly attributable to the acquisition of the inventory, such as import duties and transportation charges, less all attributable discounts, allowances or rebates. The cost of finished goods is primarily comprised of raw materials, transportation costs, direct labour, and direct manufacturing expenditures. Net realisable value is the estimated selling price in the ordinary course of business, less applicable variable selling expenses. Allowance is made, where necessary, for obsolete, slow-moving, and defective inventories.
5.5 Financial asset
For the year ended 31 December 2020 a) Classification
From 1 January 2020, the Group classifies its financial assets in the following measurement categories
depending on i) business model for managing the asset and ii) the cash flow characteristics of the asset
whether they represent solely payments of principal and interest (SPPI).
- those to be measured subsequently at fair value (either through other comprehensive income or through profit or loss); and
- those to be measured at amortised cost.
For investments in equity instruments, the Group has an irrevocable election at the time of initial recognition to
account for the equity investment at fair value through profit or loss (FVPL) or at fair value through other
comprehensive income (FVOCI).
Esso (Thailand) Public Company Limited Notes to the Consolidated and Separate Financial Statements For the year ended 31 December 2020 (All amounts in Baht thousand unless otherwise stated)
20
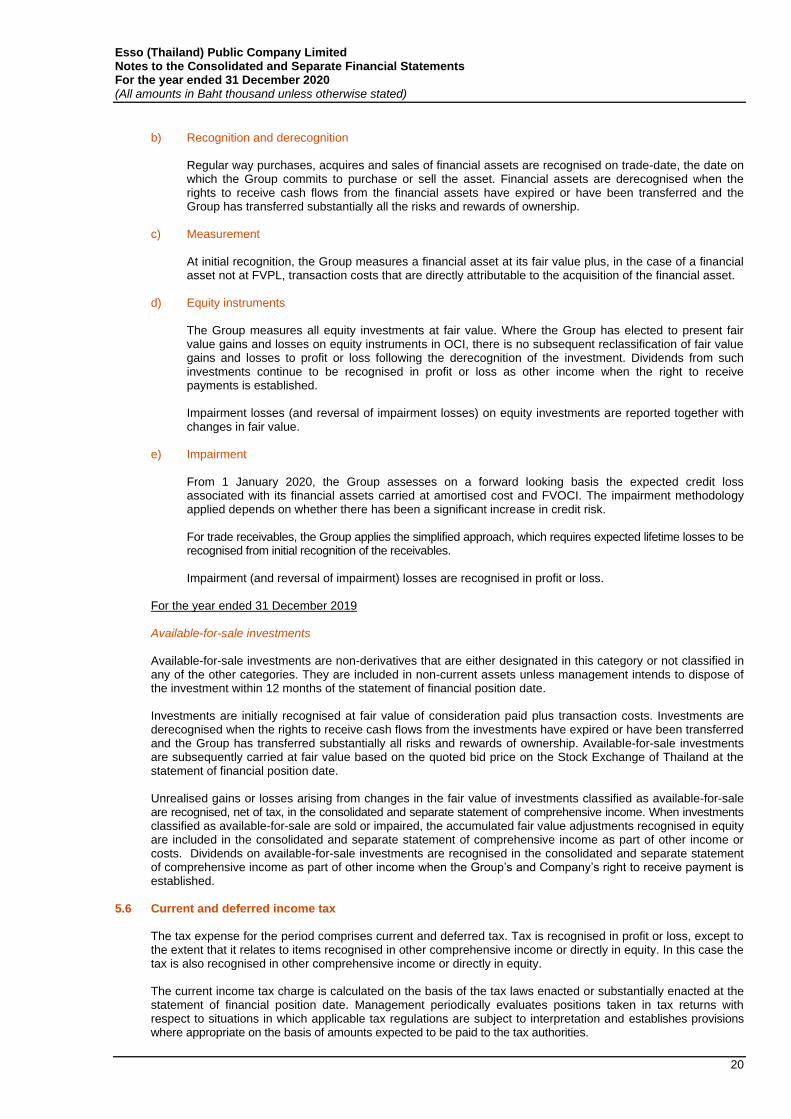
b) Recognition and derecognition
Regular way purchases, acquires and sales of financial assets are recognised on trade-date, the date on which the Group commits to purchase or sell the asset. Financial assets are derecognised when the rights to receive cash flows from the financial assets have expired or have been transferred and the Group has transferred substantially all the risks and rewards of ownership.
c) Measurement At initial recognition, the Group measures a financial asset at its fair value plus, in the case of a financial asset not at FVPL, transaction costs that are directly attributable to the acquisition of the financial asset.
d) Equity instruments The Group measures all equity investments at fair value. Where the Group has elected to present fair value gains and losses on equity instruments in OCI, there is no subsequent reclassification of fair value gains and losses to profit or loss following the derecognition of the investment. Dividends from such investments continue to be recognised in profit or loss as other income when the right to receive payments is established. Impairment losses (and reversal of impairment losses) on equity investments are reported together with changes in fair value.
e) Impairment From 1 January 2020, the Group assesses on a forward looking basis the expected credit loss associated with its financial assets carried at amortised cost and FVOCI. The impairment methodology applied depends on whether there has been a significant increase in credit risk. For trade receivables, the Group applies the simplified approach, which requires expected lifetime losses to be recognised from initial recognition of the receivables. Impairment (and reversal of impairment) losses are recognised in profit or loss.
For the year ended 31 December 2019 Available-for-sale investments Available-for-sale investments are non-derivatives that are either designated in this category or not classified in any of the other categories. They are included in non-current assets unless management intends to dispose of the investment within 12 months of the statement of financial position date. Investments are initially recognised at fair value of consideration paid plus transaction costs. Investments are derecognised when the rights to receive cash flows from the investments have expired or have been transferred and the Group has transferred substantially all risks and rewards of ownership. Available-for-sale investments are subsequently carried at fair value based on the quoted bid price on the Stock Exchange of Thailand at the statement of financial position date. Unrealised gains or losses arising from changes in the fair value of investments classified as available-for-sale are recognised, net of tax, in the consolidated and separate statement of comprehensive income. When investments classified as available-for-sale are sold or impaired, the accumulated fair value adjustments recognised in equity are included in the consolidated and separate statement of comprehensive income as part of other income or costs. Dividends on available-for-sale investments are recognised in the consolidated and separate statement of comprehensive income as part of other income when the Group’s and Company’s right to receive payment is established.
5.6 Current and deferred income tax The tax expense for the period comprises current and deferred tax. Tax is recognised in profit or loss, except to the extent that it relates to items recognised in other comprehensive income or directly in equity. In this case the tax is also recognised in other comprehensive income or directly in equity. The current income tax charge is calculated on the basis of the tax laws enacted or substantially enacted at the statement of financial position date. Management periodically evaluates positions taken in tax returns with respect to situations in which applicable tax regulations are subject to interpretation and establishes provisions where appropriate on the basis of amounts expected to be paid to the tax authorities.

Esso (Thailand) Public Company Limited Notes to the Consolidated and Separate Financial Statements For the year ended 31 December 2020 (All amounts in Baht thousand unless otherwise stated)
21
Deferred income tax is recognised, using the liability method, on temporary differences between the tax base of assets and liabilities and their carrying amounts in the financial statements.
However, the deferred income tax is not accounted for if it arises from initial recognition of an asset or liability in a transaction other than a business combination that at the time of the transaction affects neither accounting nor taxable profit or loss. Deferred income tax is determined using tax rates (and laws) that have been enacted or substantially enacted by the end of the reporting period and are expected to apply when the related deferred income tax asset is realised or the deferred income tax liability is settled.
Deferred income tax assets are recognised only to the extent that it is probable that future taxable profit will be available against which the temporary differences can be utilised. Deferred income tax is provided on temporary differences arising on investments in subsidiaries and associates, except where the timing of the reversal of the temporary difference is controlled by the Group and it is probable that the temporary difference will not reverse in the foreseeable future.
Deferred income tax assets and liabilities are offset when there is a legally enforceable right to offset current tax assets against current tax liabilities and when the deferred income tax assets and liabilities relate to income taxes levied by the same taxation authority.
5.7 Intangible assets
(a) Royalties and licenses
Acquired royalties and licenses are shown at historical cost. Royalties and licenses have a finite useful life and are carried at cost less accumulated amortisation. Amortisation is calculated using the straight line method to allocate the cost of royalties and licenses over their estimated useful lives (5 to 20 years).
(b) Computer software
Acquired computer software licenses are capitalised on the basis of costs incurred to acquire and bring to use the specific software. Costs associated with developing or maintaining computer software programs are recognised as an expense as incurred.
Costs that are directly associated with the development of identifiable and unique software products controlled by the Group, and which will probably generate economic benefits exceeding costs beyond one year, are recognised as intangible assets. Costs include the software development employee costs and an appropriate portion of relevant overhead.
Computer software development costs recognised as assets are amortised over their estimated useful lives (5 to 20 years).
5.8 Property, plant and equipment
Land is stated at historical cost. All other property, plant and equipment is stated at historical cost less accumulated depreciation. Historical cost includes expenditures that are directly attributable to the acquisition of the items.
Subsequent costs are included in the asset’s carrying amount or recognised as a separate asset, as appropriate, only when it is probable that future economic benefits associated with the item will flow to the Group and the cost of the item can be measured reliably. All other repairs and maintenance are charged to the consolidated and separate statement of comprehensive income during the financial period in which they are incurred.
Depreciation is calculated using the straight-line method to allocate the cost of each asset, except for land which is considered to have an indefinite life, to its residual value over its estimated useful life, as follows:
Buildings, plant and equipment 3 to 25 years
An asset’s carrying amount is written down immediately to its recoverable amount if the asset’s carrying amount is greater than its estimated recoverable amount (Note 5.9).
Gains and losses on disposals are determined by comparing the proceeds with the carrying amount and are recognised within ‘selling expenses’, ‘administrative expenses’ and ‘other income’ in the statement of comprehensive income.
The capitalisation rate used to determine the amount of borrowing costs to be capitalised is the weighted-average interest rate applicable to the outstanding borrowings during the year. Where funds are borrowed specifically for the construction of property, plant and equipment, the amount of borrowing costs for capitalisation is determined from the actual borrowing costs during the period less any income on the temporary investment of those borrowings.

Esso (Thailand) Public Company Limited Notes to the Consolidated and Separate Financial Statements For the year ended 31 December 2020 (All amounts in Baht thousand unless otherwise stated)
22
5.9 Impairment of non-financial assets
Assets that are subject to depreciation or amortisation are reviewed for impairment whenever events or changes in circumstances indicate that the carrying amount may not be recoverable. An impairment loss is recognised for the amount by which the asset’s carrying amount exceeds its recoverable amount. The recoverable amount is the higher of an asset’s fair value less costs to sell and value in use. For the purpose of assessing impairment, assets are grouped at the lowest levels for which there are separately identifiable cash flows (cash-generating units). Non-financial assets that have suffered an impairment are reviewed for possible reversal of the impairment at each reporting date.
5.10 Leases For the year ended 31 December 2020 Leases - where the Group is the lessee The Group leases office building, equipment, motor vehicle and various plots of land on which retail service stations are operated under lease agreement. The lease terms generally range between 3 to 30 years, and may have the renewal option at the end of the lease period. Leases are recognised as a right-of-use asset and a corresponding liability at the date at which the leased asset is available for use by the Group. Each lease payment is allocated between the liability and finance cost. The finance cost is charged to profit or loss over the lease period so as to produce a constant periodic rate of interest on the remaining balance of the liability for each period. The right-of-use asset is depreciated over the shorter of the asset's useful life and the lease term on a straight-line basis. Assets and liabilities arising from a lease are initially measured on a present value basis. Lease liabilities include the net present value of the lease payments. Lease payments to be made under reasonably certain extension options are also included in the measurement of the liability. The lease payments are discounted using the interest rate implicit in the lease. If that rate cannot be determined, the lessee’s incremental borrowing rate is used, being the rate that the lessee would have to pay to borrow the funds necessary to obtain an asset of similar value in a similar economic environment with similar terms and conditions. Right-of-use assets are measured at cost comprising the following:
• the amount of the initial measurement of lease liability, and
• any lease payments made at or before the commencement date Payments associated with short-term leases and leases of low-value assets are recognised on a straight-line basis as an expense in profit or loss. Short-term leases are leases with a lease term of 12 months or less. For the year ended 31 December 2019 Leases - where the Group is the lessee The Group leases certain property, plant or equipment. Leases of property, plant and equipment, where the Group has substantially all the risks and rewards of ownership, are classified as finance leases. Finance leases are capitalised at the inception of the lease at the lower of the fair value of the leased assets and the present value of the minimum lease payments. Leases in which a significant portion of the risks and rewards of ownership are retained by the lessor are classified as operating leases. Payments made under operating leases, net of any incentives received from the lessor, are charged to the statement of comprehensive income on a straight-line basis over the period of the lease.

Esso (Thailand) Public Company Limited Notes to the Consolidated and Separate Financial Statements For the year ended 31 December 2020 (All amounts in Baht thousand unless otherwise stated)
23
5.11 Financial liabilities
For the year ended 31 December 2020
a) Classification
Borrowings are classified as current liabilities unless the Group has an unconditional right to defer settlement of the liability for at least 12 months after the end of reporting date.
b) Measurement
Financial liabilities are initially recognised at contractual amounts, net of transaction costs incurred and are subsequently measured at amortised cost.
For the year ended 31 December 2019
Borrowings
Borrowings are recognised initially at contractual amounts, net of transaction costs incurred. Borrowings are subsequently stated at amortised cost with any difference between the proceeds, net of transaction costs, and the redemption value being recognised in the consolidated and separate statement of comprehensive income over the period of the borrowings using the effective interest method.
Borrowings are classified as current liabilities unless the Group has an unconditional right to defer settlement of the liability for at least 12 months after the end of reporting date.
5.12 Employee benefits
(a) Provident Fund Plan
The Group operates a Provident Fund that is a defined contribution plan, the assets of which are held in a separate trust fund, in accordance with the Provident Fund Act B.E. 2530. The Provident Fund is funded by payments from employees and the Group. Contributions to the Provident Fund are charged to the statement of comprehensive income in the year to which they relate. All employees hired on or after 1 September 1997 are required to be members of the Provident Fund.
The Group provides for post-employment benefits, payable to Provident Fund members reaching normal retirement age, in accordance with Thai Labour Law. The benefit liability is recorded as the present value of estimated future cash outflows using interest rates which have terms to maturity approximating the terms of the related liabilities.
(b) Employee Separation Benefit and Long Service Allowance Plan
The Group maintains a defined benefit plan for employees hired prior to 1 September 1997 and who do not elect to participate in the Provident Fund, with this plan being unfunded. The plan contains Employee Separation Benefit and Long Service Allowance Plans, which is in accordance with the retirement laws and regulations of Thailand. Entitlement to these benefits is based on a minimum service period, final month’s salary, and the plan provisions.
Actuarial valuations of the benefit plan requirements are performed every 3 years using the projected unit credit method. Based on the valuation, appropriate provisions are accrued and all payments are made against the accumulated provisions. The liability recognised in the statement of financial position is the present value of the defined benefit obligation at the end of the reporting period.
The present value of the defined benefit obligation is determined by discounting the estimated future cash flows using interest rates of Investment grade corporate bonds that are mainly denominated in the currency in which the benefits will be paid, and that have terms to maturity approximating to the terms of the related obligations.
Actuarial gains and losses arising from experience adjustments and changes in actuarial assumptions are charged or credited to equity in other comprehensive income in the period in which they arise.
Past-service costs are recognised immediately in profit or loss.
(c) Employee Savings Plan
Beginning 2009, the Group operates an Employee Savings Plan for all regular Thai employees. The entitlement to this plan is based on a minimum service period of three years and the plan’s provisions on withdrawal rights after vesting. This plan will vest 50 percent after three years and 100 percent after six years.

Esso (Thailand) Public Company Limited Notes to the Consolidated and Separate Financial Statements For the year ended 31 December 2020 (All amounts in Baht thousand unless otherwise stated)
24
5.13 Provisions
Provisions are recognised when the Group has a present legal or constructive obligation as a result of past events such that it is probable that an outflow of resources will be required to settle the obligation, and the amount has been reliably estimated. Where the Group expects a provision to be reimbursed, for example under an insurance contract, the reimbursement is recognised as a separate asset at the time when reimbursement is virtually certain. Provisions are measured at the present value of the expenditures expected to be required to settle the obligation. The increase in the provision due to passage of time is recognised as interest expense.
5.14 Share capital Ordinary shares are classified as equity. Incremental costs directly attributable to the issuance of new shares are shown in equity as a deduction, net of tax, from the proceeds.
5.15 Foreign currency translation Items included in the financial statements of each of the group’s entities are measured using the currency of the primary economic environment in which the entity operates (‘the functional currency’). The financial statements are presented in Thai Baht, which is the Company’s functional and the Group’s presentation currency. Foreign currency transactions are translated into the functional currency using the exchange rates prevailing at the dates of the transactions or valuation where items are re-measured. Foreign exchange gains and losses resulting from the settlement of such transactions and from the translation at year-end exchange rates of monetary assets and liabilities denominated in foreign currencies are recognised in profit or loss. When a gain or loss on a non-monetary item is recognised in other comprehensive income, any exchange component of that gain or loss is recognised in other comprehensive income. Conversely, when a gain or loss on a non-monetary item is recognised in profit or loss, any exchange component of that gain or loss is recognised in profit or loss.
5.16 Revenue recognition
Revenue include all revenues from ordinary business activities. All ancillary income in connection with the sales of goods and rendering of services in the course of the Group’s ordinary activities is also presented as revenue. Revenue are recorded net of value added tax. They are recognised in accordance with the provision of goods or services, provided that collectability of the consideration is probable. (a) Sales of goods
Sales are recognised when control of the products has transferred, being when the risks and rewards of ownership have passed to the buyer, which is generally at the point of delivery, and there is no unfulfilled obligation that could affect the customer’s acceptance of the products. Contract assets are mainly from marketing assistance programs. Contract liabilities are mainly customer prepayments and accruals of expected volume discounts.
(b) Sales of services and other operating revenues The Group receives rental income and franchise fees from dealers who operate branded retail stations. Rental income and franchise fees are recognised over the contract’s term. Service revenues are recognised in the period in which the services are provided.
(c) Interest income Interest income is recognised on a time-proportion basis using the effective interest method.

Esso (Thailand) Public Company Limited Notes to the Consolidated and Separate Financial Statements For the year ended 31 December 2020 (All amounts in Baht thousand unless otherwise stated)
25
(d) Dividend income
Dividend income is recognised when the right to receive payment is established.
When inventories are exchanged or swapped for inventories which are of a similar nature and value, the exchange is not considered a transaction which generates revenue.
5.17 Government Grants
Grants from the government are recognised at their fair value where there is a reasonable assurance that the grant will be received and the Company will comply with all attached conditions.
Government grants relating to the compensation of costs are recognised in profit or loss over the period necessary to match them with the costs they are intended to compensate.
Government grant, which is subsidy from oil fuel fund, is separately presented from revenue from sales.
5.18 Dividend distribution
Dividend distribution to the Company’s shareholders is recognised as a liability in the Group’s financial statements in the period in which the dividends are approved by the Company’s shareholders or Board of Directors (as the case maybe).
5.19 Financial instruments
Financial assets carried on the statement of financial position include cash and cash equivalents, trade receivables, amounts due from related parties, loans to related parties, and other assets. Financial liabilities carried on the statement of financial position include borrowings from financial institutions, trade and other payables, amounts due to related parties, loans from related parties, and other liabilities. The particular recognition methods adopted are disclosed in the individual policy statements associated with each item where applicable.
5.20 Segment reporting
Segment results that are reported to the Group’s Management Committee (the chief operating decision maker) include items directly attributable to a segment as well as those that can be allocated on a reasonable basis.
6 Critical accounting estimates and judgements
Estimates and judgements are continually evaluated and are based on historical experience and other factors, including expectations of future events that are believed to be reasonable under the circumstances.
Critical accounting estimates and assumptions
The Group makes estimates and assumptions concerning the future. The resulting accounting estimates will, by definition, not necessarily equal the related actual results. The estimates and assumptions that have a significant risk of causing a material adjustment to the carrying amounts of assets and liabilities within the next financial year are discussed below.
Recognition of deferred tax assets associated with tax losses carried forward
A deferred tax asset is recognised to the extent it is probable that the tax losses carried forward will be utilised. Such an assessment is based upon management’s review of the forecasted financial income.
Asset retirement obligations
It is recognised that the Group may incur asset retirement obligations for the dismantling and site restoration costs of its manufacturing facilities. The timing and amount of cash flows is difficult to estimate as the Group has no intention to decommission the sites in the near future. Accordingly and consistent with industry practice, no provision is recorded for asset retirement obligations as the amount cannot be measured with sufficient reliability due to the significant uncertainties involved.

Esso (Thailand) Public Company Limited Notes to the Consolidated and Separate Financial Statements For the year ended 31 December 2020 (All amounts in Baht thousand unless otherwise stated)
26
7 Segment information
As at 31 December 2020, the Group is organised into two main business segments, namely:
• Downstream, which includes the refining and marketing of petroleum products; and
• Petrochemicals, which includes the manufacturing and marketing of chemical products. Inter-segment transactions are priced under normal commercial terms and conditions that would also be available to unrelated third parties. The segment information for the year ended 31 December 2020 are as follows:
Downstream Petrochemicals Group
Total segment revenue 131,006,743 13,801,037 144,807,780 Inter-segment revenue (11,246,963) (6,889,095) (18,136,058)
Revenue 119,759,780 6,911,942 126,671,722
Segment loss from sales (8,326,795) (1,625,833) (9,952,628)
Segment fixed assets 23,798,891 951,508 24,750,399
Revenue from contracts with customers Timing of revenue recognition - At a point in time 116,559,511 6,911,886 123,471,397 - Over time 54,633 56 54,689
Total 116,614,144 6,911,942 123,526,086
Other revenue not from contracts with customers 3,145,636 - 3,145,636
Total revenue 119,759,780 6,911,942 126,671,722
The segment information for the year ended 31 December 2019 are as follows:
Downstream Petrochemicals Group
Total segment revenue 173,301,257 23,873,657 197,174,914 Inter-segment revenue (17,153,402) (10,673,326) (27,826,728)
Revenue 156,147,855 13,200,331 169,348,186
Segment loss from sales (2,593,424) (1,512,458) (4,105,882)
Segment fixed assets 24,190,455 1,409,345 25,599,800
Revenue from contracts with customers Timing of revenue recognition - At a point in time 155,149,479 13,183,309 168,332,788 - Over time 45,064 17,022 62,086
Total 155,194,543 13,200,331 168,394,874
Other revenue not from contracts with customers 953,312 - 953,312
Total revenue 156,147,855 13,200,331 169,348,186
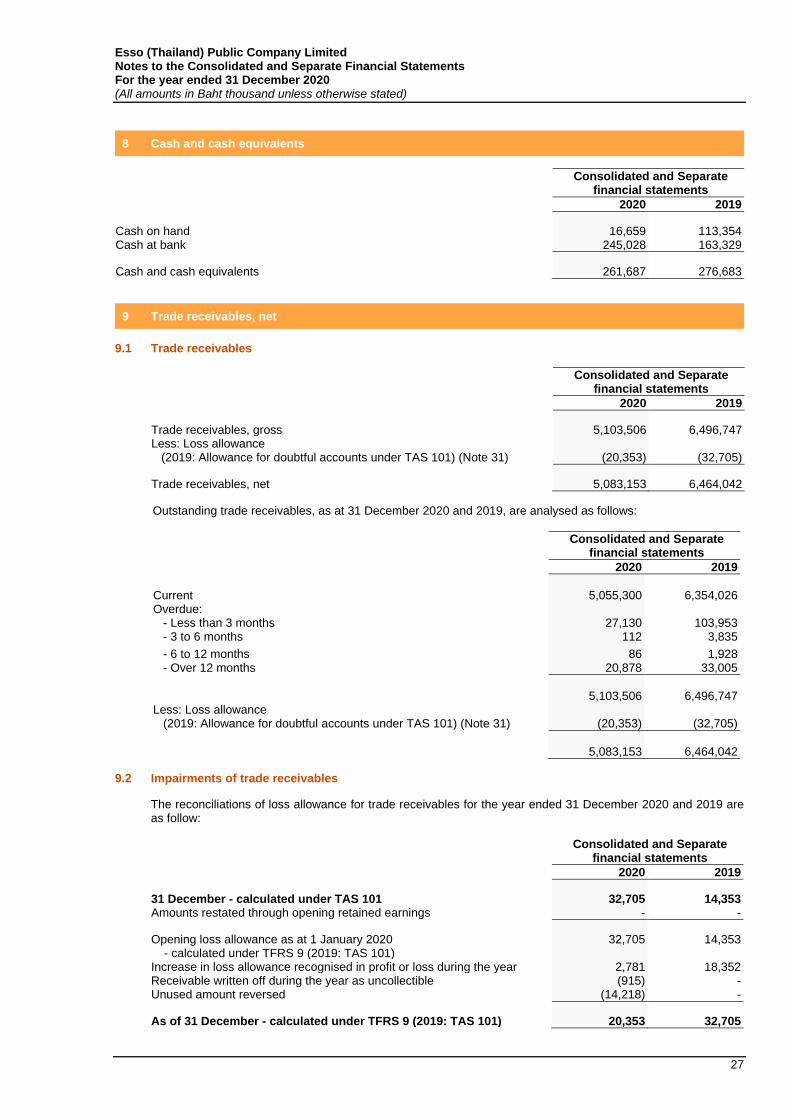
Esso (Thailand) Public Company Limited Notes to the Consolidated and Separate Financial Statements For the year ended 31 December 2020 (All amounts in Baht thousand unless otherwise stated)
27
8 Cash and cash equivalents
Consolidated and Separate
financial statements
2020 2019
Cash on hand 16,659 113,354 Cash at bank 245,028 163,329
Cash and cash equivalents 261,687 276,683
9 Trade receivables, net
9.1 Trade receivables
Consolidated and Separate financial statements
2020 2019
Trade receivables, gross 5,103,506 6,496,747 Less: Loss allowance (2019: Allowance for doubtful accounts under TAS 101) (Note 31)
(20,353)
(32,705)
Trade receivables, net 5,083,153 6,464,042
Outstanding trade receivables, as at 31 December 2020 and 2019, are analysed as follows:
Consolidated and Separate financial statements
2020 2019
Current 5,055,300 6,354,026 Overdue: - Less than 3 months 27,130 103,953 - 3 to 6 months 112 3,835
- 6 to 12 months 86 1,928 - Over 12 months 20,878 33,005
5,103,506 6,496,747 Less: Loss allowance (2019: Allowance for doubtful accounts under TAS 101) (Note 31) (20,353) (32,705)
5,083,153 6,464,042
9.2 Impairments of trade receivables
The reconciliations of loss allowance for trade receivables for the year ended 31 December 2020 and 2019 are as follow:
Consolidated and Separate financial statements
2020 2019
31 December - calculated under TAS 101 32,705 14,353 Amounts restated through opening retained earnings - -
Opening loss allowance as at 1 January 2020 - calculated under TFRS 9 (2019: TAS 101)
32,705 14,353
Increase in loss allowance recognised in profit or loss during the year 2,781 18,352 Receivable written off during the year as uncollectible (915) - Unused amount reversed (14,218) -
As of 31 December - calculated under TFRS 9 (2019: TAS 101) 20,353 32,705

Esso (Thailand) Public Company Limited Notes to the Consolidated and Separate Financial Statements For the year ended 31 December 2020 (All amounts in Baht thousand unless otherwise stated)
28
10 Inventories, net
Consolidated and Separate financial statements
2020 2019
Crude oil 7,193,780 10,023,865 Petroleum products 4,701,248 7,210,993 Petrochemical products 375,852 862,020 Materials and supplies 872,192 986,817 Other merchandise 1,165 1,475
Inventories, net 13,144,237 19,085,170
As at 31 December 2020, part of petroleum and petrochemical products in the consolidated and separate financial statements of Baht 212 million (2019: Baht 1,346 million) was carried at net realisable value with this being lower than cost.
The provisions of the Oil Trading Act B.E. 2543 require the Group to maintain certain minimum levels of inventory at all times. As at 31 December 2020, the value of this inventory amounted to Baht 2,823 million (2019: Baht 6,762 million).
11 Other receivables, net
Other receivables primarily relate to value-added tax and subsidy claims which are expected to be refunded within 12 months.
12 Other current assets
Consolidated
financial statements Separate
financial statements
2020 2019 2020 2019
Prepaid excise tax 1,061,081 3,530,592 1,061,081 3,530,592 Prepaid expenses and deferred charges 191,056 384,429 323,649 566,963 Contract assets 216,975 257,335 216,975 257,335 Income tax receivable 22,209 517,912 22,209 517,912 Other 15,834 84,457 15,784 84,406
1,507,155 4,774,725 1,639,698 4,957,208

Esso (Thailand) Public Company Limited Notes to the Consolidated and Separate Financial Statements For the year ended 31 December 2020 (All amounts in Baht thousand unless otherwise stated)
29
13 Financial assets and financial liabilities
As at 31 December 2020, classification of the Group’s financial assets and financial liabilities is as follows:
Consolidated financial statements
FVOCI Amortised
cost
Total
Financial assets Cash and cash equivalents - 261,687 261,687 Trade receivables, net - 5,083,153 5,083,153 Amounts due from related parties - 36,486 36,486 Financial assets measured at fair value through other comprehensive income
1,071,000
-
1,071,000
Consolidated financial statements
Amortised cost
Total
Financial liabilities Bank overdrafts and short-term borrowings from financial institutions 6,081,506 6,081,506 Trade and other payables 3,492,914 3,492,914 Amounts due to related parties 7,894,058 7,894,058 Current portion of long-term borrowings from financial institutions 1,933,333 1,933,333 Current portion of long-term borrowings from related parties 3,233,333 3,233,333 Short-term loans from related parties 10,621,104 10,621,104 Current portion of lease liabilities 357,665 357,665 Long-term borrowings from financial institutions 1,716,667 1,716,667 Long-term loans from related parties 4,616,667 4,616,667 Lease liabilities 2,439,856 2,439,856
Separate financial statements
FVOCI Amortised
cost
Total
Financial assets Cash and cash equivalents - 261,687 261,687 Trade receivables, net - 5,083,153 5,083,153 Amounts due from related parties - 99,982 99,982 Financial assets measured at fair value through other comprehensive income
1,071,000
-
1,071,000
Long-term loans to related parties - 3,443,943 3,443,943
Separate financial statements
Amortised cost
Total
Financial liabilities Bank overdrafts and short-term borrowings from financial institutions 6,081,506 6,081,506 Trade and other payables 3,492,498 3,492,498 Amounts due to related parties 7,893,884 7,893,884 Current portion of long-term borrowings from financial institutions 1,933,333 1,933,333 Current portion of long-term borrowings from related parties 3,233,333 3,233,333 Short-term loans from related parties 10,621,980 10,621,980 Current portion of lease liabilities 383,717 383,717 Long-term borrowings from financial institutions 1,716,667 1,716,667 Long-term loans from related parties 4,617,968 4,617,968 Lease liabilities 2,469,911 2,469,911

Esso (Thailand) Public Company Limited Notes to the Consolidated and Separate Financial Statements For the year ended 31 December 2020 (All amounts in Baht thousand unless otherwise stated)
30
13.1 Other financial assets at amortised cost
a) Classification of financial assets at amortised cost (2019: amortised cost TAS105) The Group classifies its financial assets as at amortised cost only if both of the following criteria are met:
• the asset is held within a business model whose objective is to collect the contractual cash flows; and
• the contractual terms give rise to cash flows that are solely payments of principal and interest Financial assets at amortised cost other than trade receivables: Consolidated financial statements
31 December 2020 31 December 2019
Current Non-current Total Current Non-current Total
Amounts due from
related parties
36,486
-
36,486
-
-
-
Total 36,486 - 36,486 - - -
Separate financial statements
31 December 2020 31 December 2019
Current Non-current Total Current Non-current Total
Amounts due from
related parties
99,982
-
99,982
50,526
-
50,526 Loans to related parties - 3,443,943 3,443,943 - 3,251,419 3,251,419
Total 99,982 3,443,943 3,543,925 50,526 3,251,419 3,301,945
b) Fair values of other financial assets at amortised cost
The fair values of loans to related parties carried at amortised cost approximate at their carrying amounts as the interest rates according to loan agreements are floating rates, reflective of market rates.
13.2 Financial assets at fair value through other comprehensive income
i) Classification of financial assets at fair value through other comprehensive income (2019: fair value under TAS 105) Financial assets at fair value through other comprehensive income (FVOCI) comprise:
• equity securities which are not held for trading, and which the Group has irrevocably elected at initial recognition to recognise in this category.
Financial assets at FVOCI comprise the following investments:
Consolidated and Separate financial statements
2020 Fair value
2019
Non-current assets Investments in equity investments - Listed securities (2019: fair value) 1,071,000 1,350,000
Total 1,071,000 1,350,000
The investments consist of an investment in equity securities of Bangkok Aviation Fuel Services Public Company Limited (BAFS) which is listed on the Stock Exchange of Thailand.

Esso (Thailand) Public Company Limited Notes to the Consolidated and Separate Financial Statements For the year ended 31 December 2020 (All amounts in Baht thousand unless otherwise stated)
31
ii) Amounts recognised in profit or loss and other comprehensive income
The following gains/(losses) were recognised in profit or loss and other comprehensive income during the year as follows:
Consolidated and Separate financial statements
2020 2019
Losses recognised in other comprehensive income (2019: relating to available-for-sale financial assets) (Note 26)
(279,000)
(123,750)
Dividends from equity investments at FVOCI recognised in profit or loss in other income
45,900
61,650
14 Fair value
Fair value estimation The table below demonstrates financial instruments carried at fair values, by the valuation methods (excluding where the fair values are approximately the carrying amount). The different levels have been defined as follows:
• Level 1: Quoted prices (unadjusted) in active markets for identical assets or liabilities.
• Level 2: Inputs other than quoted prices included within level 1 that are observable for the asset or liability, either directly (that is, as prices) or indirectly (that is, derived from prices).
• Level 3: Inputs for the asset or liability that are not based on observable market data (that is, unobservable inputs). The following table presents the Group’s financial assets that are measured and recognised at fair value Level 1 at 31 December 2020 and 2019.
Consolidated and Separate financial statements
2020 2019
Financial assets measured at fair value through
other comprehensive income Equity securities 1,071,000 - Available-for-sale investments Equity securities - 1,350,000
Total 1,071,000 1,350,000
The Group and the Company have financial assets that are measured at fair value level 2 (Note 13.1 (b)) but no financial assets are measured at fair value level 3. There are also no changes in valuation techniques during the year.

Esso (Thailand) Public Company Limited Notes to the Consolidated and Separate Financial Statements For the year ended 31 December 2020 (All amounts in Baht thousand unless otherwise stated)
32
15 Investments in subsidiaries and an associate
15.1 Subsidiaries
The principal subsidiaries, all of which are incorporated and domiciled in Thailand, are: Investment value % Ordinary share per cost method ownership
Business 2020 2019 2020 2019
Mobil Enterprises (Thailand) Limited Lubes and Specialties 833 833 100.00 100.00 Industry Promotion Enterprises Limited Real Estate Leasing 51,484 51,484 100.00 100.00 United Industry Development Real Estate Leasing 58,939 58,939 100.00 100.00 Company Limited and its subsidiaries Pacesetter Enterprises Limited Real Estate Leasing 3,333 3,333 99.99 99.99
The ownership percentages detailed above include the effects of both direct and indirect ordinary shareholdings, but exclude preferred shares. The Company does not own any of the preferred shares issued by these subsidiaries, but has the ability to govern the financial and operating policies of each subsidiary.
15.2 Associate
The Company holds a 20.78% interest in an associate, Thai Petroleum Pipeline Company Limited (“Thappline”), which is incorporated and domiciled in Thailand with its primary business activity being the operation of a petroleum pipeline business.
The movements in investments in an associate are as follows:
Consolidated
financial statements Separate
financial statements
2020 2019 2020 2019
At 1 January 2,206,905 2,194,255 1,729,360 1,729,360
Share of profit from an associate (Note 31) 285,102 379,986 - -
Dividend received (354,815) (362,271) - -
Share of other comprehensive expense
(Note 26) - (5,065) - -
At 31 December 2,137,192 2,206,905 1,729,360 1,729,360
The Group’s share of the results of its associate, which is unlisted, and its aggregated assets and liabilities, are as follows:
Consolidated
financial statements
2020 2019
Assets 2,540,060 2,393,469 Liabilities (402,868) (186,564)
Net assets 2,137,192 2,206,905
Revenues 616,146 755,342
Net profit 285,102 379,986

Esso (Thailand) Public Company Limited Notes to the Consolidated and Separate Financial Statements For the year ended 31 December 2020 (All amounts in Baht thousand unless otherwise stated)
33
16 Property, plant and equipment, net
Consolidated financial statements
Buildings, plant and Construction Land equipment in progress Total
At 1 January 2019 Cost 4,966,090 61,714,388 919,268 67,599,746 Less: Accumulated depreciation - (41,600,024) - (41,600,024)
Net book amount 4,966,090 20,114,364 919,268 25,999,722
Year ended 31 December 2019 Opening net book amount 4,966,090 20,114,364 919,268 25,999,722 Additions - 9,703 1,648,454 1,658,157 Disposals - (38,370) (870) (39,240) Transfers - 1,715,233 (1,715,233) - Depreciation charge (Note 31) - (2,018,839) - (2,018,839)
Closing net book amount 4,966,090 19,782,091 851,619 25,599,800
At 31 December 2019 Cost 4,966,090 63,081,062 851,619 68,898,771 Less: Accumulated depreciation - (43,298,971) - (43,298,971)
Net book amount 4,966,090 19,782,091 851,619 25,599,800
Year ended 31 December 2020 Opening net book amount 4,966,090 19,782,091 851,619 25,599,800 Additions - - 1,378,228 1,378,228 Disposals - (45,653) (1,395) (47,048) Transfers - 1,167,129 (1,167,129) - Depreciation charge (Note 31) - (2,058,703) - (2,058,703) Impairment (Note 31) - (121,879) - (121,879)
Closing net book amount 4,966,090 18,722,985 1,061,323 24,750,398
At 31 December 2020 Cost 4,966,090 63,966,523 1,061,323 69,993,936 Less: Accumulated depreciation - (45,243,538) - (45,243,538)
Net book amount 4,966,090 18,722,985 1,061,323 24,750,398

Esso (Thailand) Public Company Limited Notes to the Consolidated and Separate Financial Statements For the year ended 31 December 2020 (All amounts in Baht thousand unless otherwise stated)
34
Separate financial statements
Buildings, plant and Construction Land equipment in progress Total
At 1 January 2019 Cost 675,420 61,358,017 919,268 62,952,705 Less: Accumulated depreciation - (41,157,873) - (41,157,873)
Net book amount 675,420 20,200,144 919,268 21,794,832
Year ended 31 December 2019 Opening net book amount 675,420 20,200,144 919,268 21,794,832 Additions - 9,703 1,648,454 1,658,157 Disposals - (38,370) (870) (39,240) Transfers - 1,715,233 (1,715,233) - Depreciation charge (Note 31) - (2,018,839) - (2,018,839)
Closing net book amount 675,420 19,867,871 851,619 21,394,910
At 31 December 2019 Cost 675,420 62,724,691 851,619 64,251,730 Less: Accumulated depreciation - (42,856,820) - (42,856,820)
Net book amount 675,420 19,867,871 851,619 21,394,910
Year ended 31 December 2020 Opening net book amount 675,420 19,867,871 851,619 21,394,910 Additions - - 1,378,228 1,378,228 Disposals - (45,653) (1,395) (47,048) Transfers - 1,167,129 (1,167,129) - Depreciation charge (Note 31) - (2,058,703) - (2,058,703) Impairment (Note 31) - (121,879) - (121,879)
Closing net book amount 675,420 18,808,765 1,061,323 20,545,508
At 31 December 2020 Cost 675,420 63,610,152 1,061,323 65,346,895 Less: Accumulated depreciation - (44,801,387) - (44,801,387)
Net book amount 675,420 18,808,765 1,061,323 20,545,508
As at 31 December 2020, the cost of fully-depreciated property, plant and equipment of the Group and the Company that were still in use amounted to Baht 14,793 million and Baht 14,466 million, respectively (2019: Baht 12,169 million and Baht 11,842 million).
17 Right-of-use assets, net
As at 31 December, right-of-use asset balance are as follows:
Consolidated financial statements
Separate financial statements
2020 2019 2020 2019
Properties 3,812,185 - 3,867,771 - Motor vehicles 475,151 - 475,151 -
Total 4,287,336 - 4,342,922 -

Esso (Thailand) Public Company Limited Notes to the Consolidated and Separate Financial Statements For the year ended 31 December 2020 (All amounts in Baht thousand unless otherwise stated)
35
For the year ended 31 December, amounts charged to profit or loss and cash flows relating to leases are as follows:
Consolidated financial statements
Separate financial statements
2020 2019 2020 2019
Depreciation charge of right-of-use assets:
Properties (401,517) - (427,157) - Motor Vehicles (107,440) - (107,440) -
Total (508,957) - (534,597) -
Addition to the right-of-use assets during the year 1,213,550 - 1,214,213 -
Total cash outflow for leases (538,292) - (564,345) -
Expense relating to short-term leases 15,413 - 15,413 - Expense relating to variable lease payments 34,560 - 209,188 -
18 Intangible assets, net
Consolidated and Separate
financial statements
Computer Royalties software and licences Total
At 1 January 2019 Cost 706,609 802,047 1,508,656 Less: Accumulated amortisation (587,753) (759,945) (1,347,698)
Net book amount 118,856 42,102 160,958
Year ended 31 December 2019 Opening net book amount 118,856 42,102 160,958 Addition 47,838 - 47,838 Amortisation charge (Note 31) (11,502) (16,120) (27,622)
Closing net book amount 155,192 25,982 181,174
At 31 December 2019 Cost 754,447 802,047 1,556,494 Less: Accumulated amortisation (599,255) (776,065) (1,375,320)
Net book amount 155,192 25,982 181,174
Year ended 31 December 2020 Opening net book amount 155,192 25,982 181,174 Addition 17,923 - 17,923 Amortisation charge (Note 31) (14,435) (3,467) (17,902)
Closing net book amount 158,680 22,515 181,195
At 31 December 2020 Cost 772,371 802,047 1,574,418 Less: Accumulated amortisation (613,691) (779,532) (1,393,223)
Net book amount 158,680 22,515 181,195
All amortisation charges are recorded in cost of sales, selling expenses and administrative expenses in the statement of comprehensive income based on the nature of the asset.

Esso (Thailand) Public Company Limited Notes to the Consolidated and Separate Financial Statements For the year ended 31 December 2020 (All amounts in Baht thousand unless otherwise stated)
36
19 Deferred income tax, net
The analysis of deferred tax assets and deferred tax liabilities is as follows:
Consolidated
financial statements Separate
financial statements
2020 2019 2020 2019
Deferred tax assets: - To be recovered within 12 months 917,615 1,081,619 917,615 1,081,619 - To be recovered after more than 12 months 2,881,560 768,338 2,770,541 656,102
3,799,175 1,849,957 3,688,156 1,737,721
Deferred tax liabilities: - To be settled after more than 12 months (287,444) (348,958) (287,444) (348,958)
Deferred tax assets, net 3,511,731 1,500,999 3,400,712 1,388,763
Deferred income taxes are calculated on all temporary differences, under the liability method, using the statutory tax rates expected to apply in periods when the related deferred tax asset is realised or the deferred tax liability is settled. The gross movement of the deferred income tax account is as follows:
Consolidated financial statements
Separate financial statements
2020 2019 2020 2019
At 1 January 1,500,999 537,283 1,388,763 423,700 Charged to profit or loss (Note 29) 2,048,900 889,387 2,050,117 890,734 Charged to other comprehensive income (Note 26) (38,168) 74,329 (38,168) 74,329
At 31 December 3,511,731 1,500,999 3,400,712 1,388,763
The movement in deferred income tax assets and liabilities during the year, without taking into consideration the offsetting of balances within the same tax jurisdiction, is as follows:
Consolidated financial statements
(Charged)/Credited At to other At 1 January (Charged)/Credited comprehensive 31 December 2019 to profit or loss income 2019
Deferred tax assets Depreciation (18,542) 18,542 - - Provisions for employee benefits 715,377 38,179 49,579 803,135 Tax losses carried forward - 929,291 - 929,291 Others 127,998 (10,467) - 117,531
Deferred tax assets 824,833 975,545 49,579 1,849,957
Deferred tax liabilities Changes in fair value of available-for-sale investments (287,550) - 24,750 (262,800) Depreciation - (86,158) - (86,158)
Deferred tax liabilities (287,550) (86,158) 24,750 (348,958)

Esso (Thailand) Public Company Limited Notes to the Consolidated and Separate Financial Statements For the year ended 31 December 2020 (All amounts in Baht thousand unless otherwise stated)
37
Consolidated financial statements
(Charged)/Credited At to other At 1 January (Charged)/Credited comprehensive 31 December 2020 to profit or loss income 2020
Deferred tax assets Provisions for employee benefits 803,135 14,731 (93,968) 723,898 Tax losses carried forward 929,291 2,014,684 - 2,943,975 Others 117,531 13,771 - 131,302
Deferred tax assets 1,849,957 2,043,186 (93,968) 3,799,175
Deferred tax liabilities Changes in fair value of financial assets measured at fair value through other comprehensive income (262,800) - 55,800 (207,000) Depreciation (86,158) 5,714 - (80,444)
Deferred tax liabilities (348,958) 5,714 55,800 (287,444)
Separate financial statements
(Charged)/Credited At to other At 1 January (Charged)/Credited comprehensive 31 December 2019 to profit or loss income 2019
Deferred tax assets Depreciation (18,542) 18,542 - - Provisions for employee benefits 715,377 38,179 49,579 803,135 Tax losses carried forward - 923,988 - 923,988 Others 14,415 (3,817) - 10,598
Deferred tax assets 711,250 976,892 49,579 1,737,721
Deferred tax liabilities Changes in fair value of available-for-sale investments (287,550) - 24,750 (262,800) Depreciation - (86,158) - (86,158)
Deferred tax liabilities (287,550) (86,158) 24,750 (348,958)
Separate financial statements
(Charged)/Credited At to other At 1 January (Charged)/Credited comprehensive 31 December 2020 to profit or loss income 2020
Deferred tax assets Provisions for employee benefits 803,135 14,731 (93,968) 723,898 Tax losses carried forward 923,988 2,015,902 - 2,939,890 Others 10,598 13,770 - 24,368
Deferred tax assets 1,737,721 2,044,403 (93,968) 3,688,156
Deferred tax liabilities Changes in fair value of financial assets measured at fair value through other comprehensive income (262,800) - 55,800 (207,000) Depreciation (86,158) 5,714 - (80,444)
Deferred tax liabilities (348,958) 5,714 55,800 (287,444)
Deferred income tax assets are recognised for tax loss and carried forwards only to the extent that realisation of the related tax benefit through the future taxable profits is probable.

Esso (Thailand) Public Company Limited Notes to the Consolidated and Separate Financial Statements For the year ended 31 December 2020 (All amounts in Baht thousand unless otherwise stated)
38
20 Other non-current assets
Consolidated
financial statements Separate
financial statements
2020 2019 2020 2019
Contract assets 2,204,392 1,650,308 2,204,392 1,650,308 Income tax receivables 25,859 25,512 25,859 25,512 Other 22,571 23,903 22,571 23,903
2,252,822 1,699,723 2,252,822 1,699,723
21 Borrowings from financial institutions
Consolidated and Separate financial statements
2020 2019
Current Bank overdrafts 11,705 33,560 Short-term borrowings 5,570,000 5,955,000 Bills of exchange 499,801 499,817 Current portion of long-term loan 1,933,333 1,466,667
8,014,839 7,955,044
Non-current Bank borrowings 1,716,667 1,816,667
9,731,506 9,771,711
Bank borrowings and other facilities detailed above are unsecured and bear interest at rates based on prevailing market rates. The interest rates in 2020 ranged between 1% and 2% per annum (2019: 1% to 2% per annum).
Short-term borrowings
Short-term borrowings comprised bank revolving facilities (overnight loans and promissory notes due within 3 months).
Long-term borrowings
The long-term bank loans consisted of the following:
- A 5-year loan of Baht 1,000 million which was obtained in September 2015 and is repayable in 20 quarterly installments commencing from January 2016 to October 2020. The loan bears interest at 1-month Bangkok Interbank Offered Rate (BIBOR) plus a margin. As at 31 December 2020, there is no outstanding loan balance.
- A 3-year loan of Baht 1,500 million which was obtained in December 2018 and is repayable in 12 quarterly installments commencing from March 2019 to December 2021. The loan bears interest at 1-month (BIBOR) rate plus a margin. As at 31 December 2020, the outstanding loan balance was Baht 500 million, which is payable in 2021.
- A 3-year loan of Baht 1,300 million which was obtained in June 2019 and is repayable in 12 quarterly installments commencing from September 2019 to June 2022. The loan bears interest at 3-month (BIBOR) rate plus a margin. As at 31 December 2020, the outstanding loan balance was Baht 650 million, of which Baht 433 million is payable in 2021.
- A 3-year loan of Baht 1,000 million which was obtained in November 2019 and is repayable in 12 quarterly installments commencing from February 2020 to November 2022. The loan bears interest at 1-month (BIBOR) rate plus a margin. As at 31 December 2020, the outstanding loan balance was Baht 667 million, of which Baht 333 million is payable in 2021.
- A 3-year loan of Baht 2,000 million which was obtained in June 2020 and is repayable in 12 quarterly installments commencing from October 2020 to June 2023. The loan bears interest at 1-month (BIBOR) rate plus a margin. As at 31 December 2020, the outstanding loan balance was Baht 1,833 million, of which Baht 667 million is payable in 2021.
The carrying amounts at each year end of short-term borrowings and long-term borrowings approximate to their fair values. All borrowings are denominated in Baht.
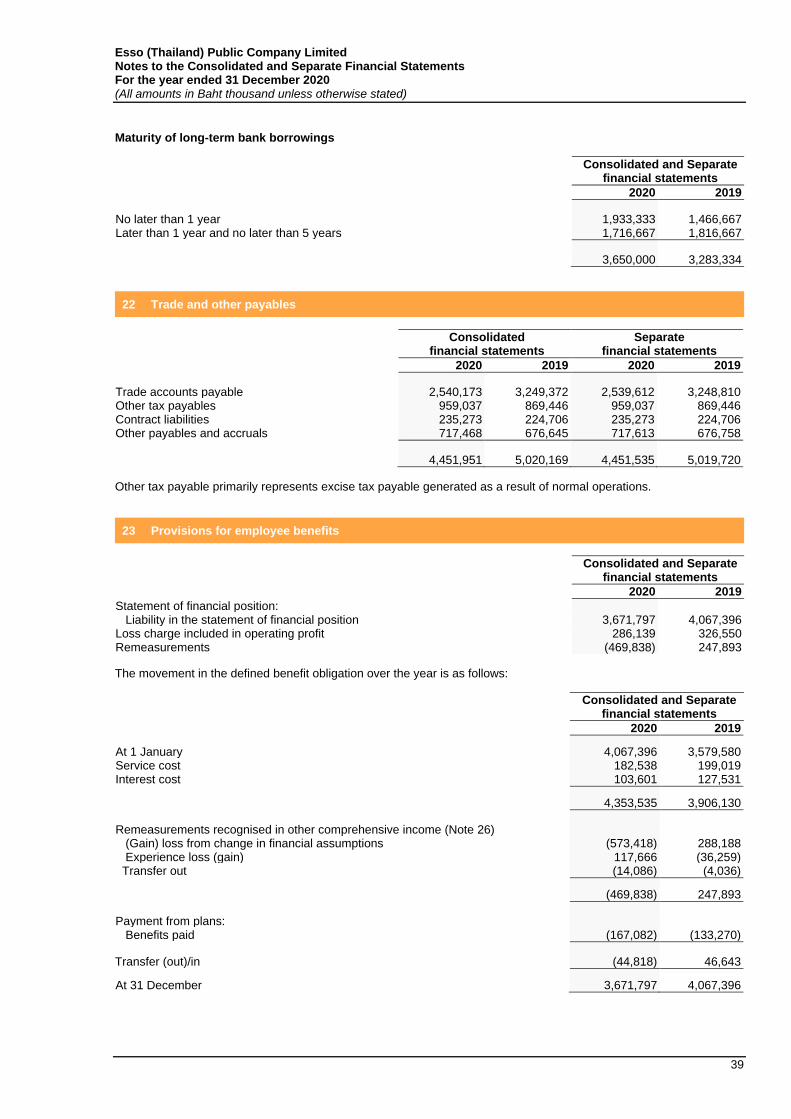
Esso (Thailand) Public Company Limited Notes to the Consolidated and Separate Financial Statements For the year ended 31 December 2020 (All amounts in Baht thousand unless otherwise stated)
39
Maturity of long-term bank borrowings
Consolidated and Separate
financial statements
2020 2019
No later than 1 year 1,933,333 1,466,667 Later than 1 year and no later than 5 years 1,716,667 1,816,667
3,650,000 3,283,334
22 Trade and other payables
Consolidated
financial statements Separate
financial statements
2020 2019 2020 2019
Trade accounts payable 2,540,173 3,249,372 2,539,612 3,248,810 Other tax payables 959,037 869,446 959,037 869,446 Contract liabilities 235,273 224,706 235,273 224,706 Other payables and accruals 717,468 676,645 717,613 676,758
4,451,951 5,020,169 4,451,535 5,019,720
Other tax payable primarily represents excise tax payable generated as a result of normal operations.
23 Provisions for employee benefits
Consolidated and Separate
financial statements
2020 2019
Statement of financial position: Liability in the statement of financial position 3,671,797 4,067,396 Loss charge included in operating profit 286,139 326,550 Remeasurements (469,838) 247,893
The movement in the defined benefit obligation over the year is as follows:
Consolidated and Separate financial statements
2020 2019
At 1 January 4,067,396 3,579,580 Service cost 182,538 199,019 Interest cost 103,601 127,531
4,353,535 3,906,130
Remeasurements recognised in other comprehensive income (Note 26) (Gain) loss from change in financial assumptions (573,418) 288,188 Experience loss (gain) 117,666 (36,259) Transfer out (14,086) (4,036)
(469,838) 247,893
Payment from plans: Benefits paid (167,082) (133,270)
Transfer (out)/in (44,818) 46,643
At 31 December 3,671,797 4,067,396

Esso (Thailand) Public Company Limited Notes to the Consolidated and Separate Financial Statements For the year ended 31 December 2020 (All amounts in Baht thousand unless otherwise stated)
40
Analysis of total provisions for employee benefits:
Consolidated and Separate financial statements
2020 2019
- Current 872,389 787,070 - Non-current 2,799,408 3,280,326
At 31 December 3,671,797 4,067,396
The principal actuarial assumptions used were as follows:
Impact on defined benefit obligation
Assumption
0.25 % Increase in assumption
0.25 % Decrease in assumption
2020 2019 2020 2019 2020 2019
Discount rate 3.00% 2.75% Decrease by
1.63 % Decrease by
1.85 % Increase by
1.68 % Increase by
1.90 % Salary growth rate 6.00% 7.00% Increase by
1.68 % Increase by
1.82 % Decrease by
1.62 % Decrease by
1.78 %
The discount rate used is based on investment grade corporate bonds with tenure approximating the tenure of the employee benefit liability. The salary growth rate takes into account market factors such as projected market salary growth and incorporates assumptions relating to inflation rates. The Group does not anticipate a change in expected rate of salary increase based on historical data. The above sensitivity analysis is based on a change in an assumption while holding all other assumptions constant. In practice, this is unlikely to occur, and changes in some of the assumptions may be correlated. When calculating the sensitivity of the defined benefit obligation to significant actuarial assumptions, the same method (present value of the defined benefit obligation calculated with the projected unit credit method at the end of the reporting period) has been applied as when calculating the pension liability recognised within the statement of financial position. The methods and types of assumptions used in preparing the sensitivity analysis did not change compared to the previous period. Through its defined benefit, the Group is exposed to a number of risks, the most significant of which are changes in bond yields. A decrease in Investment grade corporate bond yields will increase plan liabilities. Expected maturity analysis of undiscounted employee benefits:
Consolidated and Separate
financial statements
2020 2019
- Less than a year 129,653 96,158 - Between 1-2 years 147,690 125,367 - Between 2-5 years 640,384 803,793 - Over 5 years 4,980,634 6,055,307
5,898,361 7,080,625

Esso (Thailand) Public Company Limited Notes to the Consolidated and Separate Financial Statements For the year ended 31 December 2020 (All amounts in Baht thousand unless otherwise stated)
41
24 Share capital and premium
Issued and paid-up share capital
Number of shares Ordinary Share (million) shares premium Total
At 1 January and 31 December 2020 and 2019 3,461 17,075,181 4,031,711 21,106,892
As at 31 December 2020 and 2019, the total authorised number of ordinary shares is 3,468 million shares with a par value of Baht 4.9338 per share. All issued shares are fully paid.
25 Legal reserve
Consolidated and Separate
financial statements
2020 2019
At 1 January 1,000,901 1,000,901 Appropriation during the year - -
At 31 December 1,000,901 1,000,901
Under the Public Limited Companies Act B.E. 2535, the Company is required to set aside as a legal reserve at least 5 percent of its net profit after taking into account any accumulated deficit brought forward until the reserve is not less than 10 percent of the registered capital. The legal reserve is non-distributable.
26 Other component of equity
The movement of other component of equity are as follows:
Consolidated
financial statements Separate
financial statements
2020 2019 2020 2019
At 1 January 172,619 474,998 179,864 477,178 Remeasurement of provisions for employee benefits (Note 23) 469,838 (247,893) 469,838 (247,893) Share of other comprehensive expense of associate, net of tax (Note 15) - (5,065) - - Changes in fair value of financial assets measured at fair value through other comprehensive income (Note 13) (279,000) - (279,000) - Changes in fair value of available-for-sale investments (Note 13) - (123,750) - (123,750) Income tax relating to components of
other comprehensive income (Note 19) (38,168) 74,329 (38,168) 74,329
At 31 December 325,289 172,619 332,534 179,864

Esso (Thailand) Public Company Limited Notes to the Consolidated and Separate Financial Statements For the year ended 31 December 2020 (All amounts in Baht thousand unless otherwise stated)
42
27 Revenue from sales and services
Consolidated and Separate financial statements
2020 2019
Revenue from sales of goods 123,219,705 167,799,824
Revenue from sales of services 429,518 729,910
123,649,223 168,529,734
28 Expenses by nature
The following expenditure items, classified by nature, have been charged in arriving at the operating profit.
Consolidated financial statements
Separate financial statements
2020 2019 2020 2019
Net changes in inventories of finished goods 2,996,223 (587,551) 2,996,223 (587,551) Raw materials and consumables used 122,373,790 160,586,640 122,373,790 160,586,640 Depreciation and amortisation (Notes 16, 17, 18) 2,585,562 2,046,461 2,611,202 2,046,461 Employee expenses 1,717,368 1,864,270 1,717,368 1,864,270
29 Income tax expense
Consolidated financial statements
Separate financial statements
2020 2019 2020 2019
Current tax: Current tax on profits for the year 4,527 1,265 3,277 - Adjustments in respect to prior year (3,226) (4,423) (3,277) (4,846)
Total current tax 1,301 (3,158) - (4,846)
Deferred tax: Deferred tax for the year (Note 19) (2,048,900) (889,387) (2,050,117) (890,734)
Total deferred tax (2,048,900) (889,387) (2,050,117) (890,734)
Income tax credit (2,047,599) (892,545) (2,050,117) (895,580)
The tax on the Group’s and Company’s profit before tax differs from the theoretical amount that would arise using the weighted average tax rate applicable to profits of the Group and the Company as follows:
Consolidated financial statements
Separate financial statements
2020 2019 2020 2019
Loss before tax (9,957,914) (3,957,486) (9,899,413) (3,985,517)
Tax calculated at domestic tax rates (1,991,583) (791,497) (1,979,883) (797,103) Tax effect of: Income not subject to tax (69,702) (92,942) (83,920) (90,371) Expenses not deductible for tax purposes 27,416 3,818 27,416 3,818 Expenses more deductible for tax purposes (13,730) (11,924) (13,730) (11,924)
Income tax credit (2,047,599) (892,545) (2,050,117) (895,580)

Esso (Thailand) Public Company Limited Notes to the Consolidated and Separate Financial Statements For the year ended 31 December 2020 (All amounts in Baht thousand unless otherwise stated)
43
30 Earnings per share
Basic earnings per share is calculated by dividing the earnings attributable to equity holders of the Company by the weighted average number of ordinary shares in issue during the year.
Consolidated financial statements
Separate financial statements
2020 2019 2020 2019
Loss attributable to equity holders of the parent (7,911,074) (3,065,703) (7,849,296) (3,089,937) Weighted average number of ordinary shares in issue (million shares) 3,461 3,461 3,461 3,461 Basic loss earnings per share (Baht per share) (2.29) (0.89) (2.27) (0.89) There are no potential ordinary shares in issue during the years presented and as such diluted earnings per share is not presented.
31 Cash flow information
31(a) Reconciliation of net loss to cash flows from operating activities:
Consolidated
financial statements Separate
financial statements
2020 2019 2020 2019
Loss before income tax expense (9,957,914) (3,957,486) (9,899,413) (3,985,517) Adjustments for: Depreciation (Note 16,17) 2,567,660 2,018,839 2,593,300 2,018,839 Amortisation (Note 18) 17,902 27,622 17,902 27,622 Loss allowance (2019: Allowance for doubtful account) (Note 9)
(12,352) 18,352 (12,352) 18,352
Write-down of inventory to net realisable value 11,864 96,742 11,864 96,742 Impairment charge on non-financial assets (Note 16) 121,879 - 121,879 - Loss on disposal of property, plant and equipment and intangible assets 33,756 23,803 33,756 23,803 Share of profit from an associate (Note 15) (285,102) (379,986) - - Interest income (2,970) (8,059) (187,763) (204,251) Finance costs 360,486 321,533 361,369 321,592 Dividend income (45,900) (61,650) (403,215) (427,622) Net unrealised foreign exchange loss 21,042 88,706 21,042 88,706 Changes in working capital Trade receivables 1,391,767 (188,167) 1,391,767 (188,167) Amount due from related parties (36,486) 50 (54,417) - Inventories 5,929,070 (765,945) 5,929,070 (765,945) Other receivables (1,510,641) 953,184 (1,510,641) 953,184 Other current assets 2,631,106 (3,049,956) 2,681,047 (3,057,858) Prepaid rental and deferred charges 92,982 348,980 266,938 576,619 Other non-current assets (553,099) (1,650,390) (553,099) (1,650,664) Trade and other payables (483,832) (2,022,588) (483,800) (2,010,188) Amount due to related parties (227,642) (2,001,247) (237,898) (2,005,935) Income tax payables - (144) - - Provisions for employee benefits 74,239 239,923 74,239 239,923 Other non-current liabilities (1,840) (98) (1,840) (98)
Cash generated (used in) from operations 135,975 (9,947,982) 159,735 (9,930,863)

Esso (Thailand) Public Company Limited Notes to the Consolidated and Separate Financial Statements For the year ended 31 December 2020 (All amounts in Baht thousand unless otherwise stated)
44
In the cash flow statement, proceeds from sale of property, plant and equipment consist of:
Consolidated financial statements
Separate financial statements
2020 2019 2020 2019
Net book amount 47,048 39,240 47,048 39,240 Loss on disposal of property, plant and equipment (33,756) (23,803) (33,756) (23,803)
Proceeds from disposal of property, plant and equipment 13,292 15,437 13,292 15,437
31(b) Non-cash transactions of investing and financing activities:
Consolidated financial statements
Separate financial statements
2020 2019 2020 2019
Non-cash transactions
Acquisition of property, plant, equipment 202,592 293,037 202,592 293,037 Acquisition of right-of-use assets 1,031,678 - 1,032,341 -
31(c) Change in liabilities arising from financing activities:
Consolidated financial statements
Leases Borrowings Total
Liabilities as at 1 January 2019 - 15,345,350 15,345,350 Cash flows - 11,519,030 11,519,030 Other non-cash movement - 79,043 79,043
Liabilities as at 31 December 2019 - 26,943,423 26,943,423
Cash flows (356,420) 1,184,745 828,325 Other non-cash movement 3,153,941 74,442 3,228,383
Liabilities as at 31 December 2020 2,797,521 28,202,610 31,000,131
Separate financial statements
Leases Borrowings Total
Liabilities as at 1 January 2019 - 15,347,468 15,347,468 Cash flows - 11,518,567 11,518,567 Other non-cash movement - 79,043 79,043
Liabilities as at 31 December 2019 - 26,945,078 26,945,078
Cash flows (382,473) 1,185,267 802,794 Other non-cash movement 3,236,101 74,442 3,310,543
Liabilities as at 31 December 2020 2,853,628 28,204,787 31,058,415

Esso (Thailand) Public Company Limited Notes to the Consolidated and Separate Financial Statements For the year ended 31 December 2020 (All amounts in Baht thousand unless otherwise stated)
45
32 Contingent liabilities
As at 31 December 2020, the Group had contingent liabilities in respect to bank guarantees arising in the ordinary course of business, amounting to Baht 105 million (2019: Baht 70 million) to third parties. It is not anticipated that any material liabilities will arise from these bank guarantees.
33 Commitments
Capital commitments As at the statement of financial position date, the Group had capital commitments amounting to Baht 987 million (2019: Baht 640 million). Operating lease commitments - the Group and the Company as lessee As at 31 December 2019, the Group leases various plots of land on which retail service stations are operated under non-cancellable operating lease agreements. The lease terms generally range between 15 and 30 years, and the majority of lease agreements are renewable at the end of the lease period at market rates. The future aggregate minimum lease payments under non-cancellable operating leases are as follows:
Consolidated
financial information Separate
financial information
31 December
2020 31 December
2019 31 December
2020 31 December
2019
No later than 1 year - 237,472 - 263,524 Later than 1 year but no later than 5 years - 838,863 - 1,281,251 Later than 5 years - 1,421,482 - 5,855,815
- 2,497,817 - 7,400,590
34 Financial risk management
The Group’s activities expose it to a variety of financial risks, which include market risk (including market prices for petroleum commodities risk, foreign exchange risk and interest rate risk), credit risk, liquidity risk, and capital risk. 34.1 Market risk
(a) Market prices for petroleum commodities risk
The Group’s financial results can be significantly affected from time to time by volatility and cyclical movement in the market prices for crude oil, petroleum, and petrochemical products. Given the large size and the long-term nature of its business, the Group expects that this risk will be moderated over time. The Group does not employ the use of derivative instruments to manage the risk.
(b) Foreign exchange risk The Group's activities are exposed to foreign exchange risk arising from various currency exposures, primarily with respect to the US Dollar. Purchases of goods and export sales are primarily transacted in US Dollars. Domestic sales are transacted predominantly in Baht, and are thus not subject to foreign exchange risk. As at 31 December 2020 and 2019, the Group had no short-term or long-term debt denominated in foreign currencies. In 2020, the Group did not enter into any forward foreign currency contracts. The Group’s foreign exchange guidelines prohibit speculative foreign exchange transactions.

Esso (Thailand) Public Company Limited Notes to the Consolidated and Separate Financial Statements For the year ended 31 December 2020 (All amounts in Baht thousand unless otherwise stated)
46
(c) Interest rate risk
As the Group has no significant interest bearing assets, the Group’s income and operating cash flows are substantially independent of changes in market interest rates. The interest rate risk arises from borrowings that are issued at variable interest rates exposing the Group to cash flow interest rate risk. The Group continually optimises the mix in its borrowing facilities to maximise financing flexibility while minimising financing cost.
34.2 Credit risk
Credit risk is managed on a Group basis. Credit risk primarily arises from cash and cash equivalents, and credit exposures to commercial and retail customers, including outstanding receivables and committed transactions. Credit risk in respect to balances outstanding with related parties has been assessed to be low due to the overall strength of the ExxonMobil Group. In the case of cash and cash equivalents, only independently rated banks with a minimum rating of at least BBB-, or equivalent, are accepted. For trade customers, risk evaluations are performed internally which include reviews of financial position, business success indicators, past experience, and other factors. Individual risk limits are set based on the resulting internal ratings in accordance with limits set by management. Risk categories are established for individual customers based on internal credit guidelines ranging from very low to very high risk. The risk categories are intended to reflect the risk of payment default by a customer and are similar to the rating scales established by external rating agencies.
34.3 Liquidity risk
The Group manages liquidity risk by maintaining a minimum operating level of cash and cash equivalent balances. In addition, the Group maintains committed credit facilities as well as a number of uncommitted credit facilities from banks and related parties. The Group reviews requirements for future cash flows through the completion of an annual finance plan. The finance plan is completed for the forthcoming year to ensure that estimates of future requirements are analysed such that appropriate facilities can be made available. The Group currently has adequate financing sources. As at 31 December 2020, the Group has uncommitted facilities of Baht 76,866 million (2019: Baht 74,533 million). The Group has also received an approval from the Securities and Exchange Commission to offer for sale Baht 12,000 million of bills of exchange in a revolving program, of which Baht 500 million has been utilised as of 31 December 2020. Liquidity risk may also arise if customers are not able to settle obligations to the Group within the normal credit term. To manage this risk, the Group periodically assesses financial viability of customers and may require certain customers to provide bank guarantees or other similar instruments.
34.4 Capital risk The Group’s objective when managing capital is to safeguard the Group’s ability to continue as a going concern in order to provide returns to shareholders and benefits to other stakeholders. In the future, the Group may adjust the amount of dividend paid to shareholders in order to maintain an appropriate capital structure. Annually, the Group completes a finance plan which seeks to establish positions for the current and future years’ dividend projections.
35 Related party transactions
The Group is controlled by ExxonMobil Asia Holding Private Limited incorporated in Singapore, which owns 65.99% of the Company’s shares as at 31 December 2020. The ultimate holding company is Exxon Mobil Corporation incorporated in the United States of America. A further 9.7% of the shares are held by Vayupak Fund 1, a mutual fund established by the Ministry of Finance, with the remaining shares held by a variety of institutional and retail investors. The Vayupak Fund 1 acquired the shares from the Ministry of Finance on 15 September 2010. The significant investments in subsidiaries and an associate are set out in Note 15.

Esso (Thailand) Public Company Limited Notes to the Consolidated and Separate Financial Statements For the year ended 31 December 2020 (All amounts in Baht thousand unless otherwise stated)
47
The following transactions were carried out with related parties:
(a) Sales of goods and services
Consolidated and Separate financial statements
2020 2019
Sales of goods and services:
- Other related parties 5,268,661 7,935,657
5,268,661 7,935,657
Sales of goods and services between related parties are based on market prices and primarily relate to the sale of petroleum and petrochemical products.
(b) Purchases of goods and services
Consolidated and Separate
financial statements
2020 2019
Purchases of goods: - Other related parties 66,632,709 101,842,935
Purchases of services: - An associate 523,785 729,423
67,156,494 102,572,358
Purchases of goods from related parties primarily relate to the purchase of crude oil, petroleum and petrochemical products. Purchases of services from an associate relate to the provision of pipeline transportation services for the Group’s products. Purchases of goods and services are based on market prices.
(c) Expenses
Consolidated
financial statements Separate
financial statements
2020 2019 2020 2019
Expenses paid to:
- Subsidiaries - - 202,175 221,628
- Other related parties 3,069,594 3,490,201 3,067,500 3,487,558
3,069,594 3,490,201 3,269,675 3,709,186
Expenses primarily relate to the provision of support services and are charged on either a cost or cost plus basis.
(d) Finance costs, net
Consolidated
financial statements Separate
financial statements
2020 2019 2020 2019
Interest income received from: - Subsidiaries - - 184,794 196,199
- - 184,794 196,199
Interest expenses paid to: - Subsidiaries - - 883 58 - Other related parties 195,957 187,717 195,957 187,717
195,957 187,717 196,840 187,775
Interest charges and interest income are based on market rates at the time the agreements were entered.

Esso (Thailand) Public Company Limited Notes to the Consolidated and Separate Financial Statements For the year ended 31 December 2020 (All amounts in Baht thousand unless otherwise stated)
48
(e) Key management compensation
Consolidated and Separate financial statements
2020 2019
Salaries and other short-term employment benefits 76,449 72,593 Post-employment benefits 21,328 18,911
97,777 91,504
The above information is prepared in accordance with the Securities and Exchange Commission‘s regulations. This includes the managing director, the first four managers reporting to the managing director as well as all managers at the same level including Treasurer and Controller.
(f) Year-end balances arising from sales/purchases of goods/services and expenses
Consolidated
financial statements Separate
financial statements
2020 2019 2020 2019
Amounts due from: - Subsidiaries - - 63,496 50,526 - Other related parties 36,486 - 36,486 -
36,486 - 99,982 50,526
Amounts due to: - Subsidiaries - - 4 10,269 - Other related parties 7,894,058 8,091,234 7,893,880 8,091,049
7,894,058 8,091,234 7,893,884 8,101,318
Amounts due from related parties relate primarily to interest receivables on long-term loans (Note 35g). The amounts due to related parties reflect a net payable which arises mainly from the purchase and sales of crude oil, petroleum and petrochemical products under standard industry terms.
(g) Loans to related parties
Consolidated
financial statements Separate
financial statements
2020 2019 2020 2019
Long-term loans to: - Subsidiaries - - 3,443,943 3,251,419
Movements in long-term loans to related parties are analysed as follows:
Separate
financial statements
2020 2019
At 1 January 3,251,419 3,035,705 Loans advanced during the period 193,182 216,717 Loan repayments received (658) (1,003)
At 31 December 3,443,943 3,251,419
Long-term loans to related parties are unsecured. They bear interest based on the minimum lending rate of Bangkok Bank Public Company Limited.

Esso (Thailand) Public Company Limited Notes to the Consolidated and Separate Financial Statements For the year ended 31 December 2020 (All amounts in Baht thousand unless otherwise stated)
49
(h) Loans from related parties
Consolidated
financial statements Separate
financial statements
2020 2019 2020 2019
Current Short-term loans from: - Subsidiaries - - 876 899 - Other related parties 10,621,104 13,188,379 10,621,104 13,188,379
10,621,104 13,188,379 10,621,980 13,189,278
Current portion of long-term loans from: - Other related parties 3,233,333 1,633,333 3,233,333 1,633,333
13,854,437 14,821,712 13,855,313 14,822,611
Non-current Long-term loans from: - Subsidiaries - - 1,301 756 - Other related parties 4,616,667 2,350,000 4,616,667 2,350,000
4,616,667 2,350,000 4,617,968 2,350,756
Movements in loans from related parties are analysed as follows:
Consolidated
financial statements Separate
financial statements
2020 2019 2020 2019
At 1 January 17,171,712 7,449,161 17,173,367 7,451,279 Additional borrowings 10,417,652 14,814,162 10,421,864 14,818,695 Loans repaid during the period (9,118,260) (5,091,611) (9,121,950) (5,096,607)
At 31 December 18,471,104 17,171,712 18,473,281 17,173,367
Short-term loans from other related parties include: - Revolving loan from a related party totaling Baht 7,888 million out of facility size Baht 12,000 million at the end of
December 2020. - Short-term loan from a related party under Loan and Current Account Agreement totaling Baht 2,733 million
at the end of December 2020. Short-term loans from related parties are unsecured. They have no fixed term of repayment and bear interest based on the adjusted minimum lending rate of Bangkok Bank Public Company Limited or Bangkok Interbank Offered Rate (BIBOR).

Esso (Thailand) Public Company Limited Notes to the Consolidated and Separate Financial Statements For the year ended 31 December 2020 (All amounts in Baht thousand unless otherwise stated)
50
Long-term loans from other related parties include: - A 5-year loan of Baht 6,000 million which was obtained in September 2015 and is repayable in 20 quarterly
installments commencing from January 2016 to October 2020. The loan bears interest at 1-month (BIBOR) rate plus a margin. As at 31 December 2020, there is no outstanding loan balance.
- A 3-year loan of Baht 700 million which was obtained in June 2019 and is repayable in 12 quarterly
installments commencing from September 2019 to June 2022. The loan bears interest at 3-months (BIBOR) rate plus a margin. As at 31 December 2020, the outstanding loan balance was Baht 350 million, of which Baht 233 million is payable within 1 year.
- A 3-year loan of Baht 3,000 million which was obtained in November 2019 and is repayable in 12 quarterly installments commencing from February 2020 to November 2022. The loan bears interest at 1-month (BIBOR) rate plus a margin. As at 31 December 2020, the outstanding loan balance was Baht 2,000 million, of which Baht 1,000 million is payable within 1 year.
- A 3-year loan of Baht 6,000 million which was obtained in June 2020 and is repayable in 12 quarterly
installments commencing from October 2020 to June 2023. The loan bears interest at 1-month (BIBOR) rate plus a margin. As at 31 December 2020, the outstanding loan balance was Baht 5,500 million, of which Baht 2,000 million is payable within 1 year.
Long-term loans from related parties bear interest based on the adjusted minimum lending rate of Bangkok Bank Public Company Limited or Bangkok Interbank Offered Rate (BIBOR). Maturity of long-term loans from related parties
Consolidated
financial statements Separate
financial statements
2020 2019 2020 2019
No later than 1 year 3,233,333 1,633,333 3,233,333 1,633,333 Later than 1 year but no later than 5 years 4,616,667 2,350,000 4,617,968 2,350,756
7,850,000 3,983,333 7,851,301 3,984,089
36 Dividend paid
On 23 April 2019, the Annual General Meeting of shareholders resolved by majority vote that additional dividend payment for year 2018 be approved at a rate of Baht 0.10 per share, totalling Baht 346 million. The dividend was paid to the shareholders on 21 May 2019.