essential resources consumption vectors are parallel (essential) r1r1 r2r2 c i1 c i2 c1c1
Post on 22-Dec-2015
222 views
TRANSCRIPT

Essential resources
consumption vectors are parallel(essential)
R1
R2 Ci1
Ci2C1
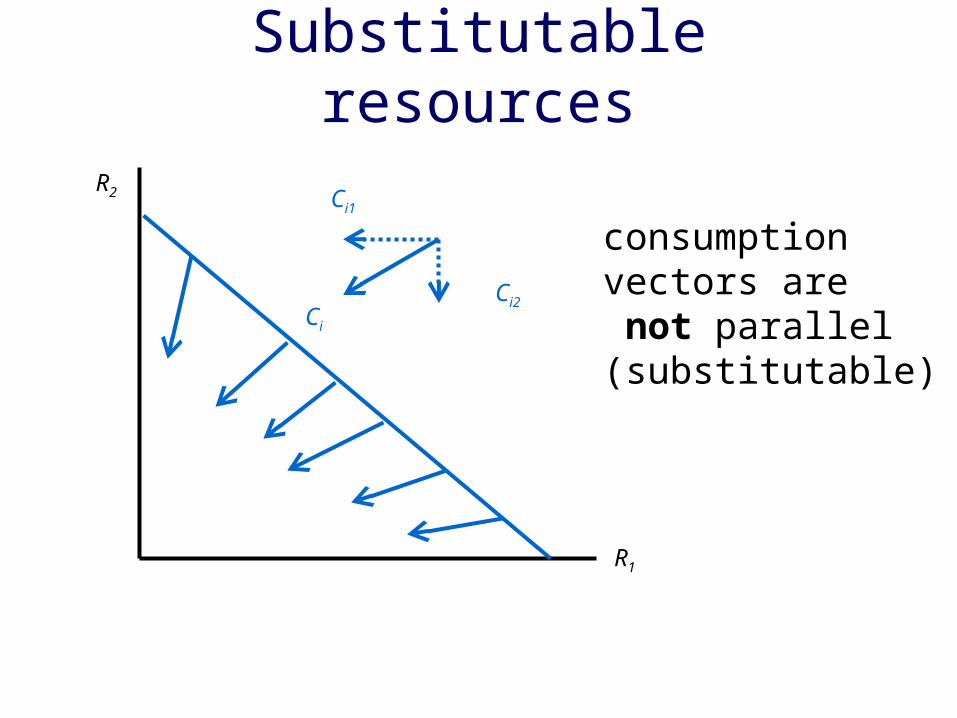
Substitutable resources
consumption vectors are not parallel(substitutable)
R1
R2 Ci1
Ci2Ci
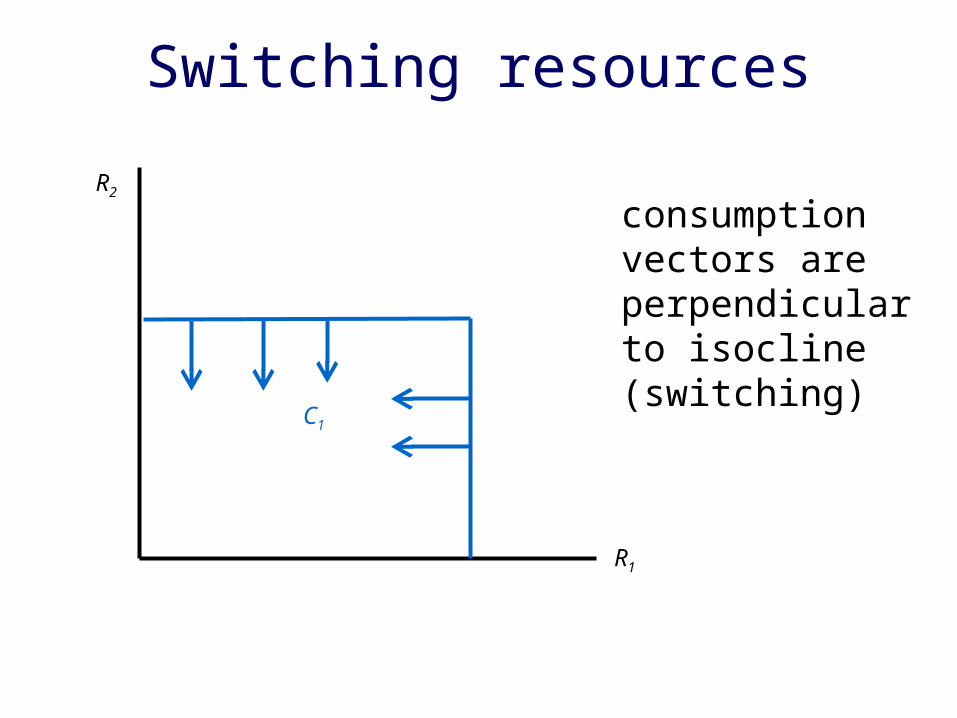
Switching resources
consumption vectors are perpendicularto isocline(switching)
R1
R2
C1

Renewal for 2 resources
supply vector: points at supplypoint S1,S2
R1
R2
S1,S2
U
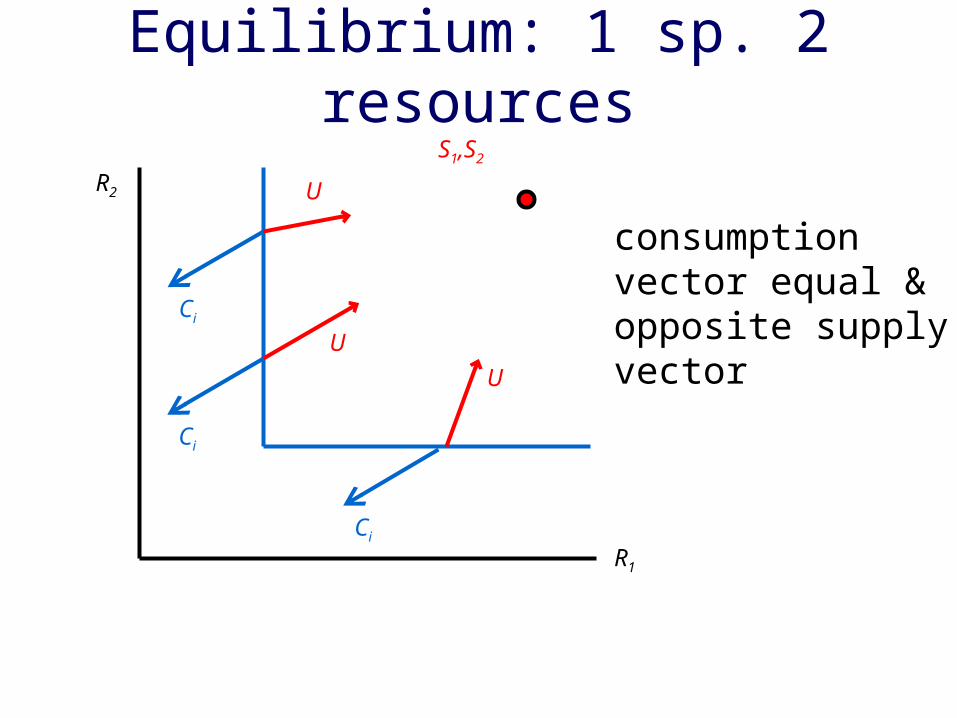
Equilibrium: 1 sp. 2 resources
consumption vector equal &opposite supplyvector
R1
R2
Ci
Ci
Ci
U
S1,S2
U
U
Equilibrium
• Equilibrium (R1,R2) falls on isocline
• therefore, dN / N dt =0• U and C vectors equal in magnitude,
opposite direction• therefore dR1 / dt = 0 and dR2 / dt = 0
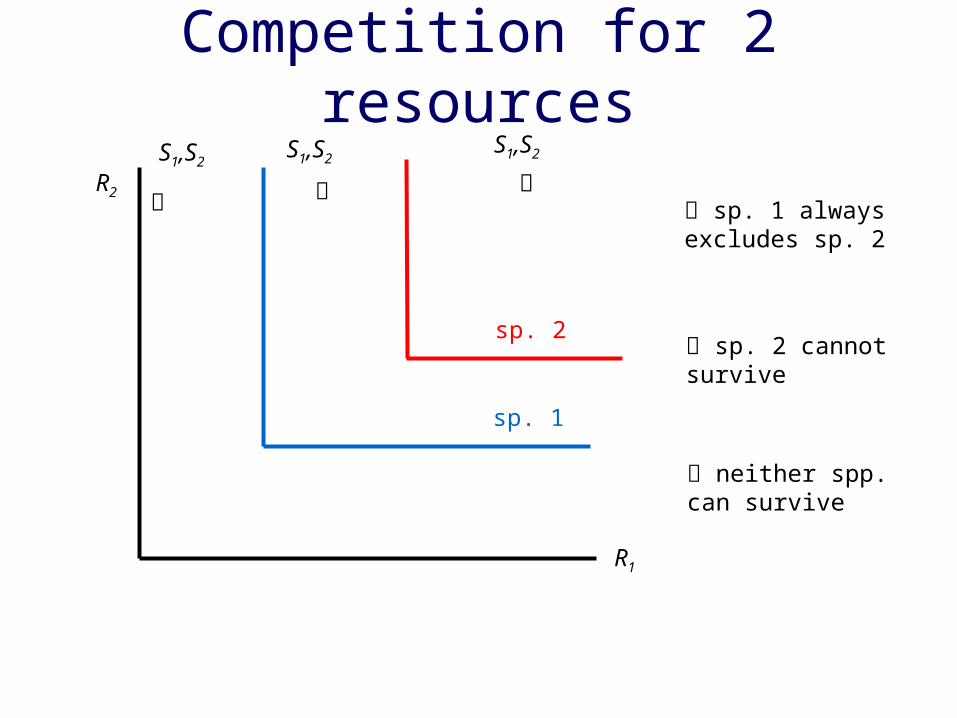
Competition for 2 resources
R1
R2
sp. 1
S1,S2
S1,S2
S1,S2
sp. 2
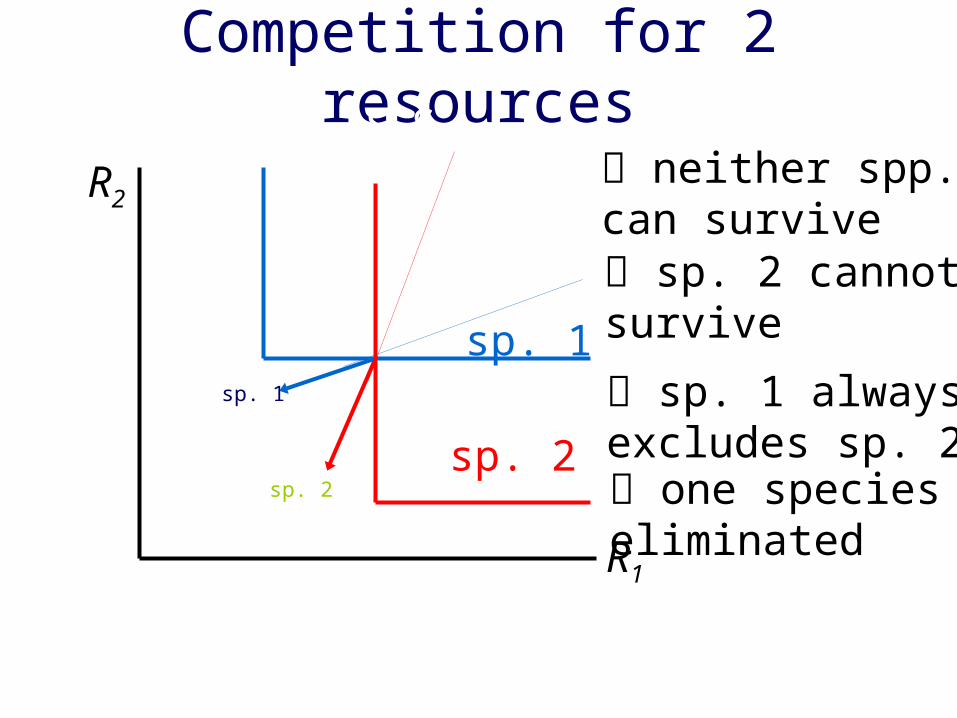
sp. 1 alwaysexcludes sp. 2
sp. 2 cannotsurvive
neither spp.can survive
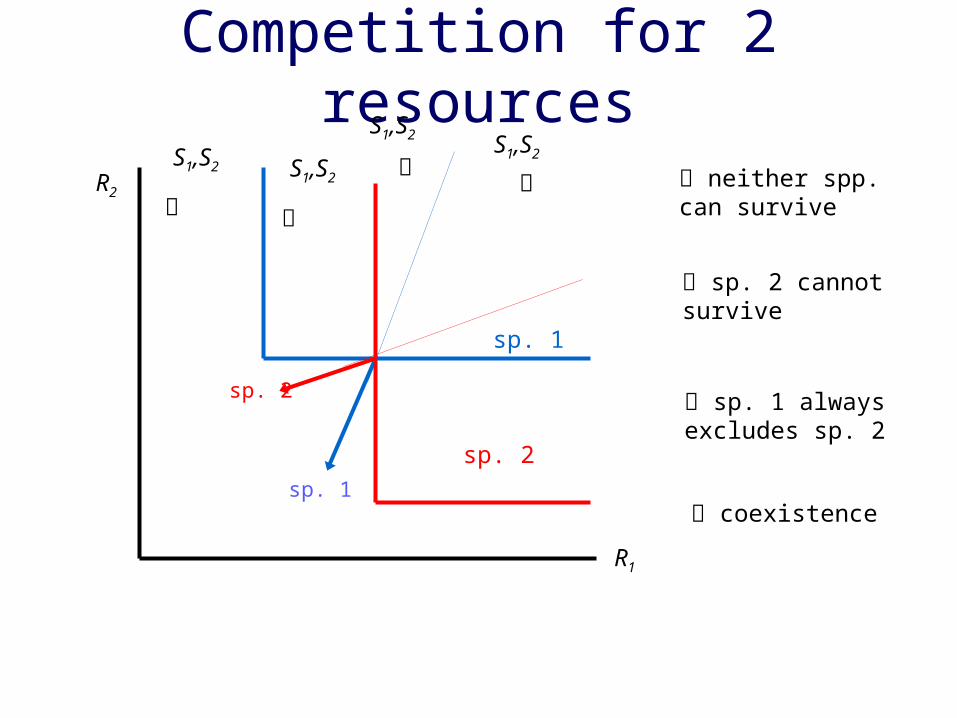
Competition for 2 resources
R1
R2
S1,S2
S1,S2
S1,S2 neither spp.can survive
sp. 2 cannotsurvive
sp. 1 alwaysexcludes sp. 2
S1,S2
coexistence
sp. 1
sp. 2
sp. 2
sp. 1
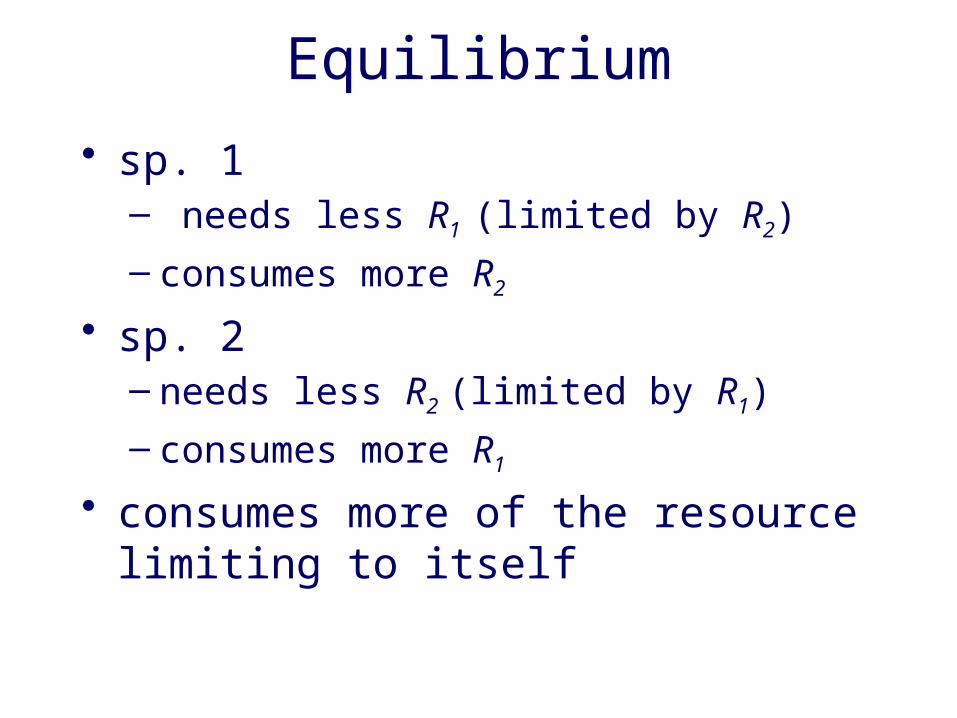
Equilibrium
• sp. 1– needs less R1 (limited by R2)
– consumes more R2
• sp. 2– needs less R2 (limited by R1)
– consumes more R1
• consumes more of the resource limiting to itself
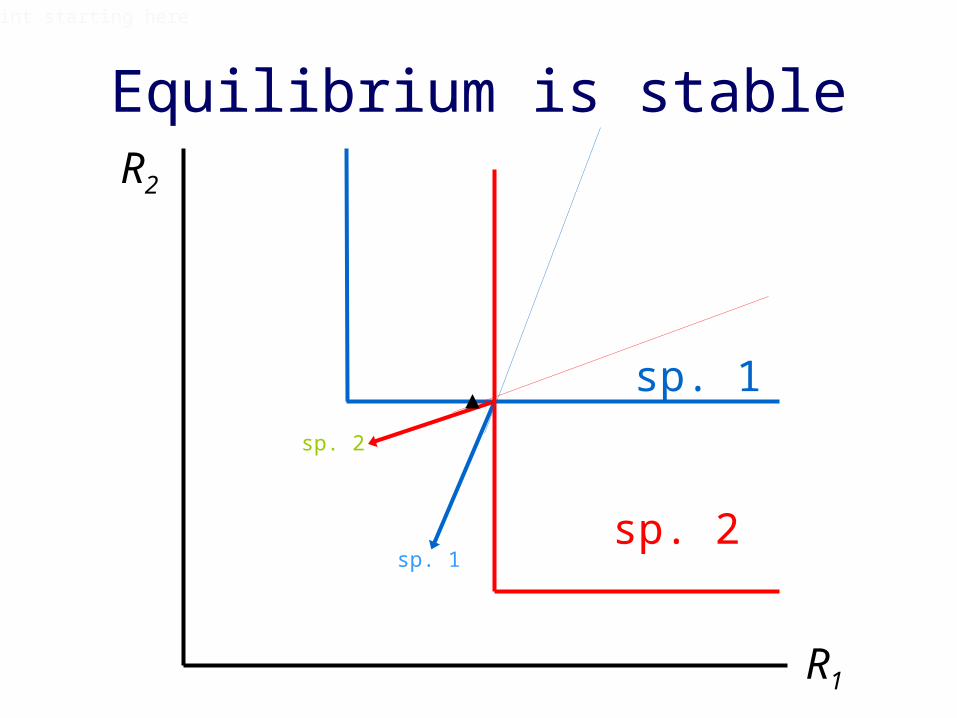
Equilibrium is stable
R1
R2
sp. 1
sp. 2
sp. 2
sp. 1
Print starting here
Competition for 2 resources
R1
R2
S1,S2
S1,S2
S1,S2 neither spp.
can survive sp. 2 cannotsurvive
sp. 1 alwaysexcludes sp. 2
S1,S2
one species eliminated
sp. 1
sp. 2sp. 2
sp. 1

Equilibrium
• sp. 1– needs less R1 (limited by R2)
– consumes more R1
• sp. 2– needs less R2 (limited by R1)
– consumes more R2
• consumes more of the resource limiting to its competitor
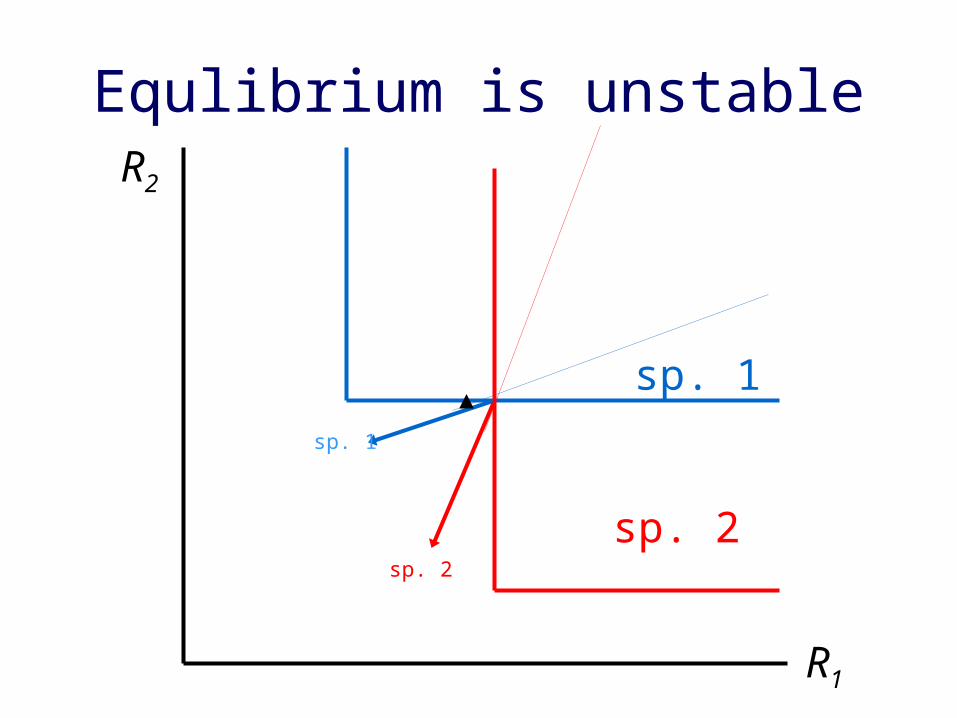
Equlibrium is unstable
R1
R2
sp. 1
sp. 2sp. 2
sp. 1

Substitutable resources (Tilman)
R1
R2
sp. 1
sp. 2
1 wins
R1
R2sp. 1
sp. 2
2 wins
R1
R2 sp. 1
sp. 2
stable
sp. 2
sp. 1
R1
R2 sp. 1
sp. 2
unstable
sp. 2
sp. 1

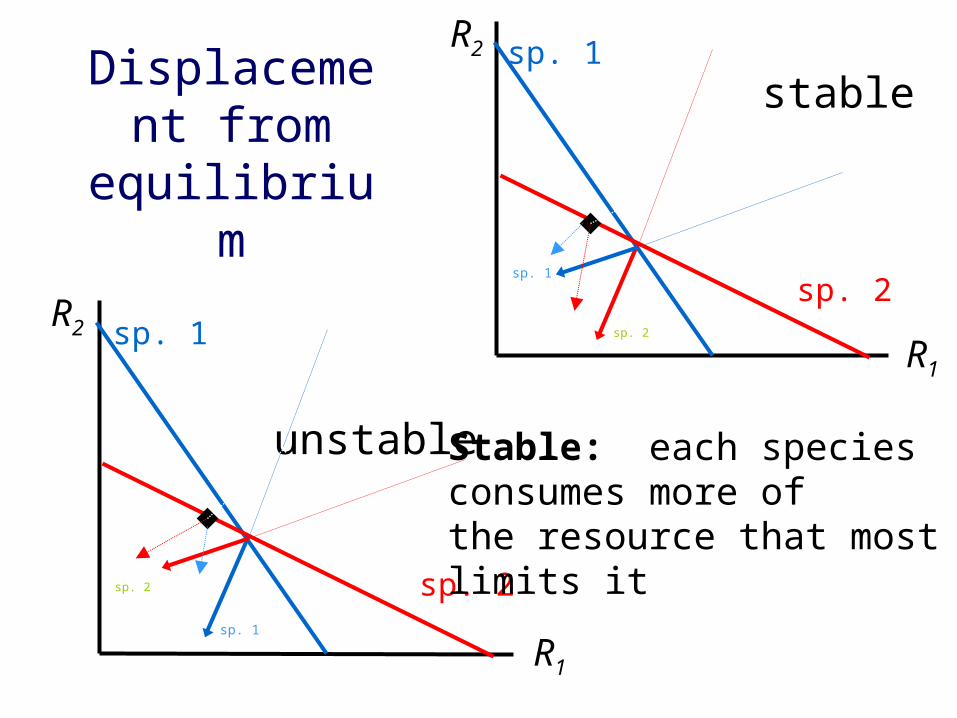
Displacement from
equilibrium
R1
R2 sp. 1
sp. 2
unstable
sp. 2
sp. 1
R1
R2 sp. 1
sp. 2
stable
sp. 2
sp. 1
Stable: each speciesconsumes more ofthe resource that most limits it
A digression: Conflicting diagrams
• Compare Fig. 27 C. of Tilman with Fig. 2.8 of Chase & Leibold
• Disagreement about what produces stable coexistence for substitutable resources
• Grover (1997) gives similar isoclines/consumption vectors to Tilman
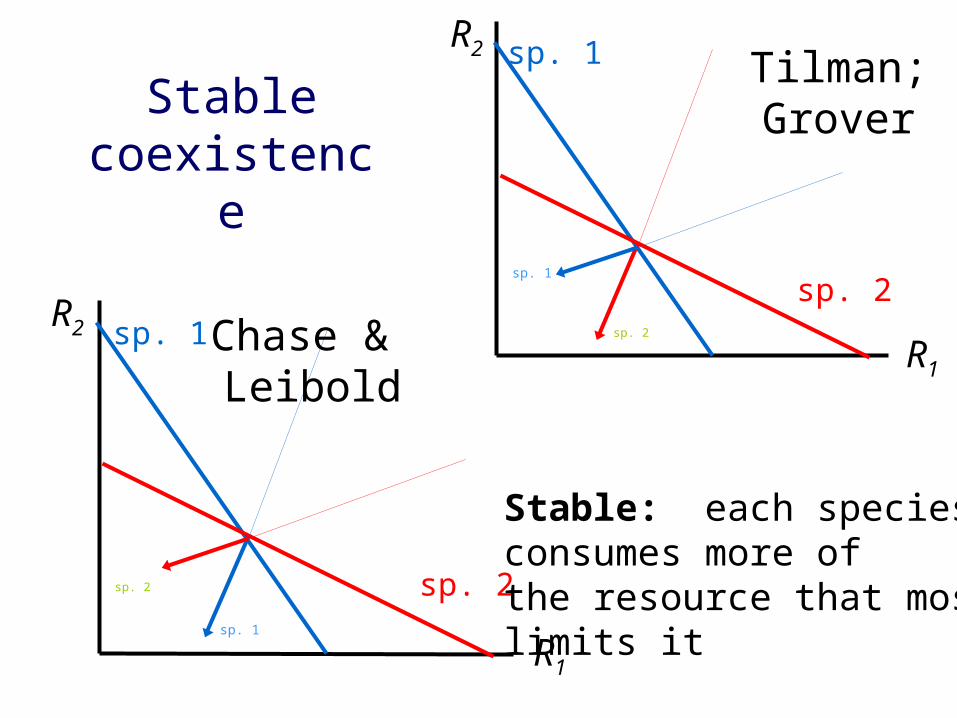
Stable coexistence
R1
R2 sp. 1
sp. 2
Chase & Leibold
sp. 2
sp. 1
R1
R2 sp. 1
sp. 2
Tilman;Grover
sp. 2
sp. 1
Stable: each speciesconsumes more ofthe resource that most limits it

Chase & Leibold, p. 47Mathematical appendix to ch. 2
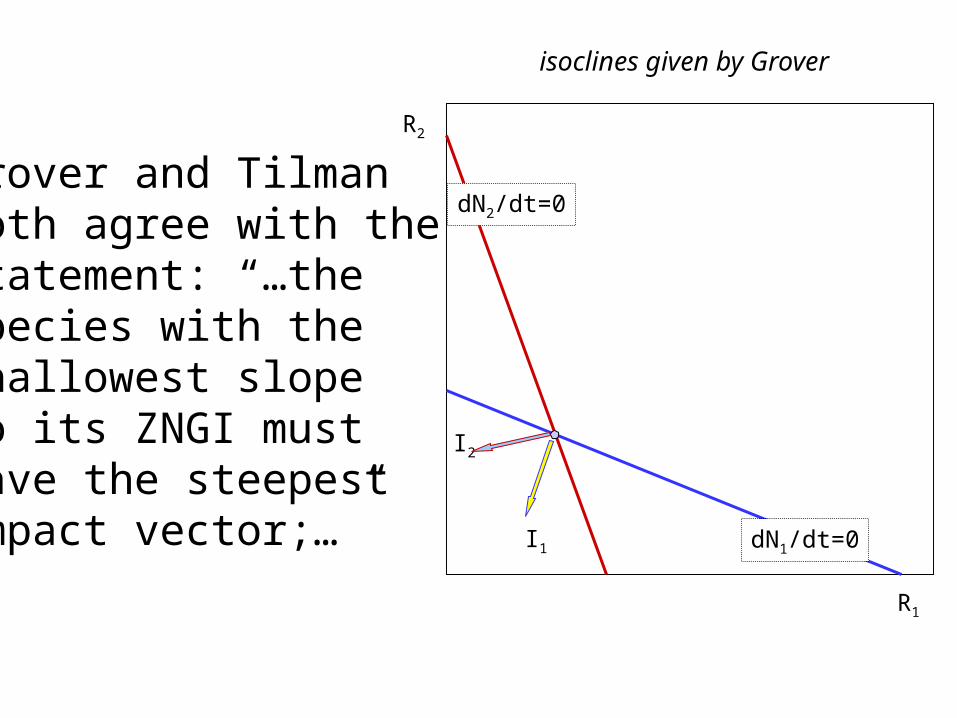
• For the equilibrium to be locally stable: “Verbally, the species with the shallowest slope to its ZNGI must have the steepest impact vector;…”
R1
R2 sp. 1
sp. 2
Chase & Leibold
sp. 2
sp. 1
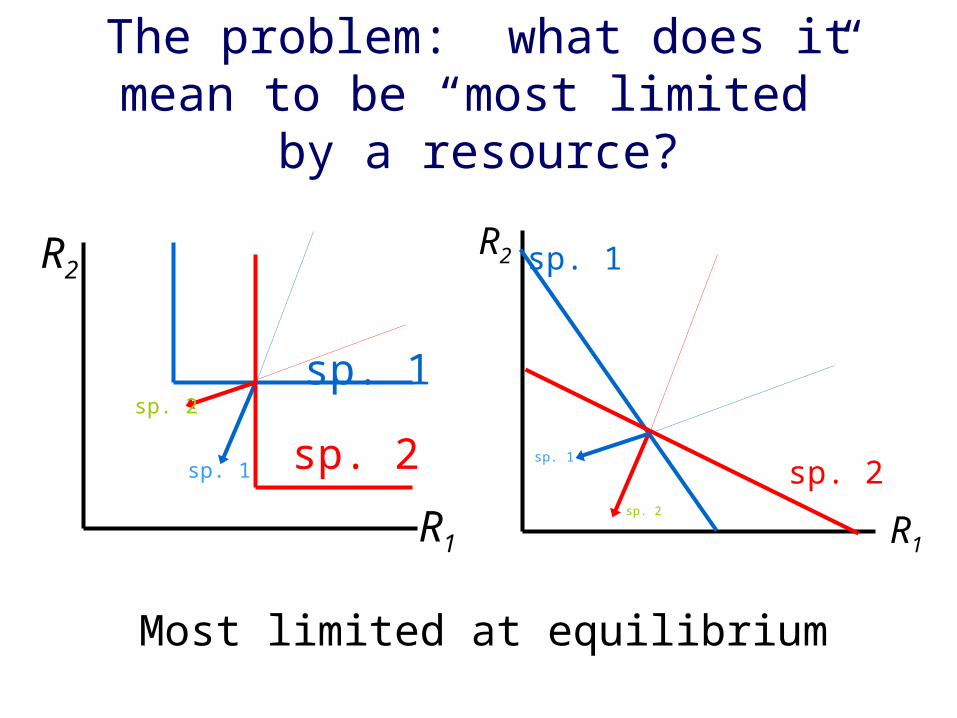
The problem: what does it mean to be “most limited” by a resource?
R1
R2
sp. 1
sp. 2sp. 2
sp. 1
R1
R2 sp. 1
sp. 2sp. 2
sp. 1
Most limited at equilibrium

Most limited by a resource: For a unit increase of a resource, the most limiting resource produces the greatest increase in dN/dt.
most limited by R2 (R*2 < R*
1)
dN/dt=0dN/dt>0
R2
R1
I
dN1/dt=0
dN2/dt=0
R2
R1
I1
I2
Grover and Tilmanboth agree with the statement: “…the species with the shallowest slope to its ZNGI must have the steepest impact vector;…”
isoclines given by Grover

Stable coexistence
R1
R2 sp. 1
sp. 2
Tilman;Grover
sp. 2
sp. 1
Species 1 is most limited by R1 because a given increase in R1
yields a greater increase in dN1/dt compared to the same increase in R2; Species 2 is most limited by resource 2 by similar logic.
These are the correct isoclines for stable coexistence
Displacement from
equilibrium
R1
R2 sp. 1
sp. 2
unstable
sp. 2
sp. 1
R1
R2 sp. 1
sp. 2
stable
sp. 2
sp. 1
Stable: each speciesconsumes more ofthe resource that most limits it
Kinds of resources
• General predictions do not depend on kind of resource (mostly)
• Suggests competition between autotrophs or between heterotrophs should lead to similar community structure– actually may not be true
• Combinations of resources can yield multiple equilibria
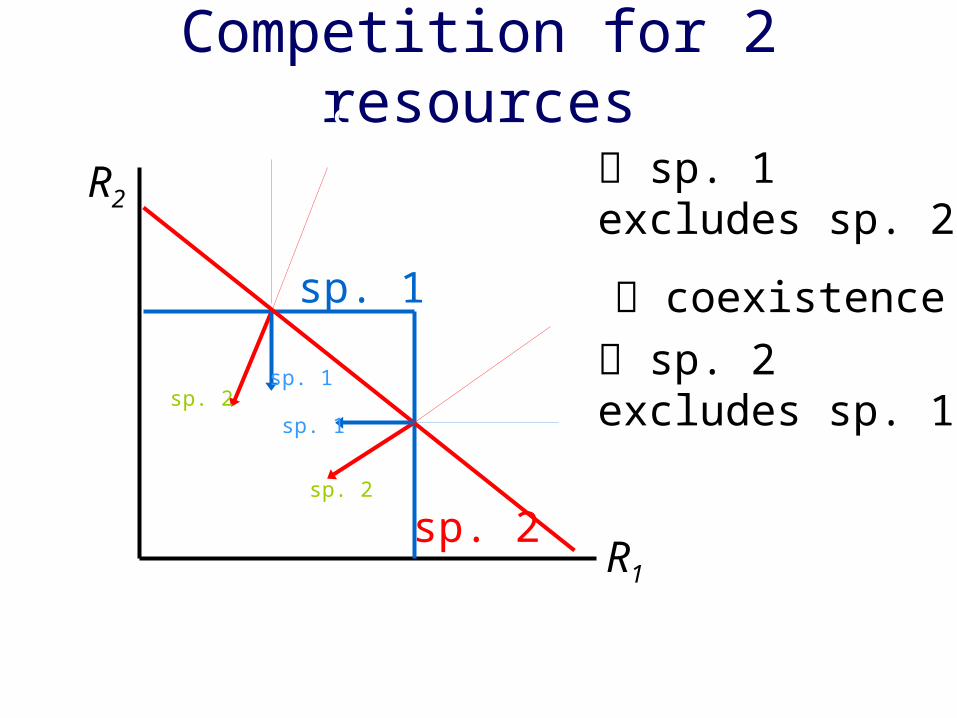
Competition for 2 resources
sp. 1 excludes sp. 2
coexistence
sp. 2 excludes sp. 1
R1
R2
S1,S2
S1,S2
S1,S2
sp. 1
sp. 2
S1,S2
S1,S2
sp. 2
sp. 2
sp. 1
sp. 1

Some relevant references
• Grover, J.P. 1997. Resource competition. Chapman & Hall NY
• Leon, J. A. & Tumpson, D. B. 1975. Competition between two species for two complementary or substitutable resources. J. Theoretical Biology 50:185-201
Common pattern predicted
• Coexistence among competitors– requires specific intermediate ratio of two
resources– extreme ratios lead to elimination of one or
the other competitor– resource ratio hypothesis: competitive
coexistence or exclusion are products of specific environmental resource ratios
Assumptions
• Simplifying environmental– environment is homogeneous and constant
except for resources• Simplifying biological
– individuals identical, constant through time• Explanatory
– competition is expressed only through depression of resources
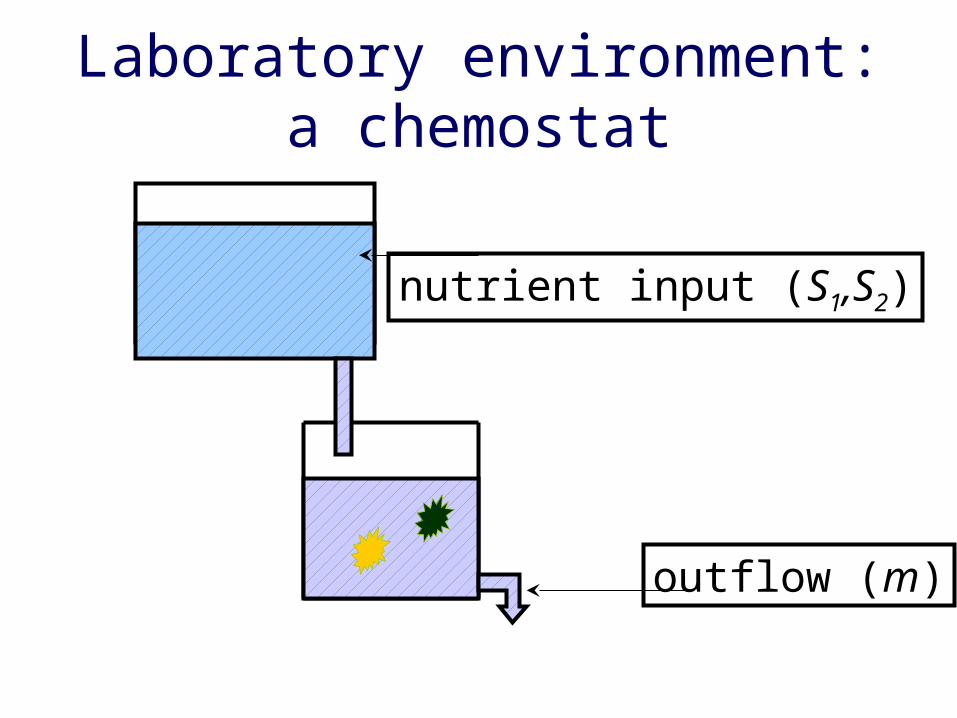
Laboratory environment:a chemostat
nutrient input (S1,S2)
outflow (m)
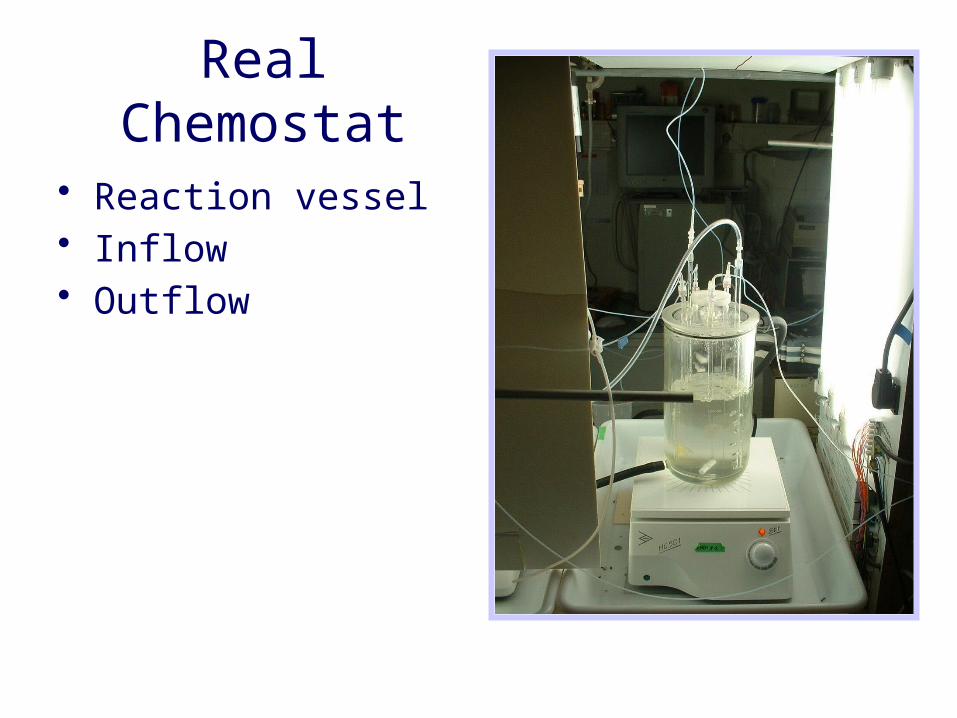
Real Chemostat
• Reaction vessel• Inflow• Outflow
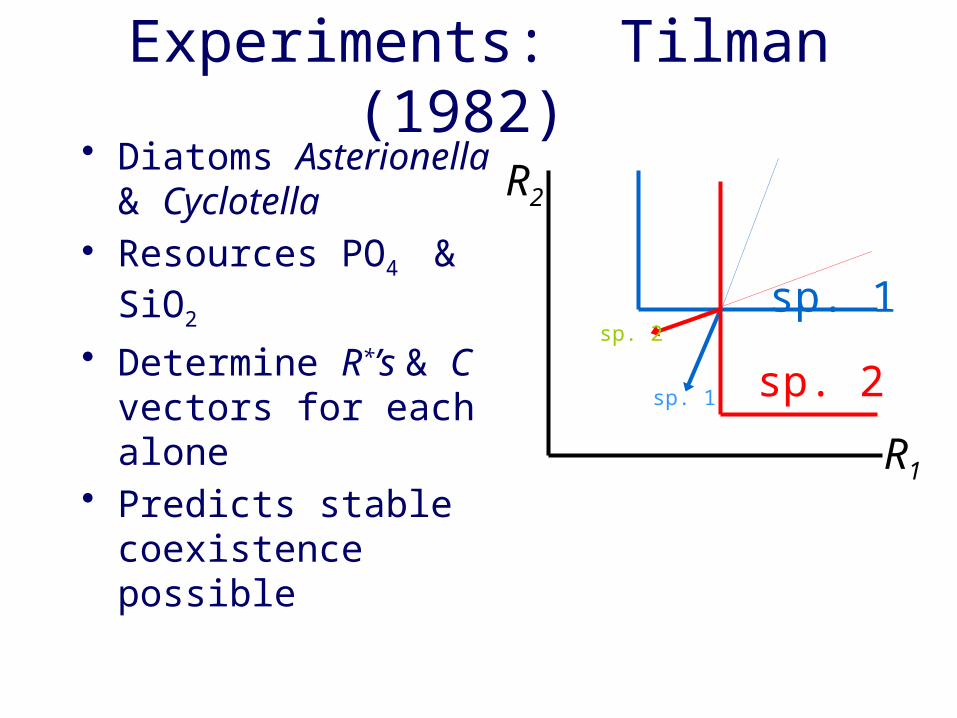
Experiments: Tilman (1982) • Diatoms Asterionella &
Cyclotella• Resources PO4 & SiO2
• Determine R*’s & C vectors for each alone
• Predicts stable coexistence possible R1
R2
sp. 1
sp. 2sp. 2
sp. 1
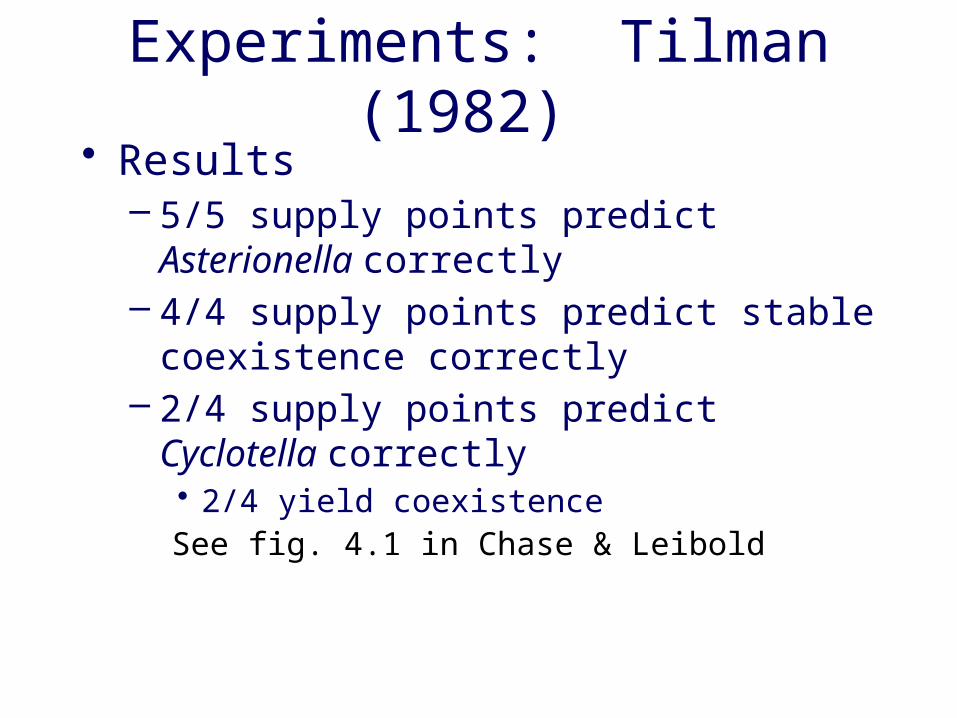
Experiments: Tilman (1982) • Results
– 5/5 supply points predict Asterionella correctly
– 4/4 supply points predict stable coexistence correctly
– 2/4 supply points predict Cyclotella correctly• 2/4 yield coexistence
See fig. 4.1 in Chase & Leibold
More experiments • Tilman (1982) summarizes many more
studies with phytoplankton• Grover (1997) summarizes recent work
with– phytoplankton– bacteria– terrestrial plants– zooplankton
• R* rule, resource ratio hypothesis, and specific predictions largely supported
Resource competition theory
• more precise statement of competitive exclusion principle
• R* rule• resource ratio hypothesis• ground work for models of multiple
interacting species
Testing the resource ratio hypothesis
• Competitive coexistence or exclusion are products of specific environmental resource ratios
• Miller et al. 2005– Predictions of the resource-ratio
hypothesis supported 75% of the time– Prediction that dominance changes with
resource ratio supported 13/16 tests– Many purported tests deemed inadequate
• Replication; Controls; Time scale

Miller et al.
Competition in nature
• Miller et al.: Resource ratio hypothesis rarely tested in nature
• Is resource competition common?• Does R* rule predict outcome?• Does resource ratio affect coexistence?• What other mechanisms of coexistence
are observed?
Competition in ecological time
• Observe: coexistence in nature• Hypotheses:
– competition is not occurring– coexistence based on resource ratios or
limitation by different resources – heterogeneity of environments creates
refuges from competition
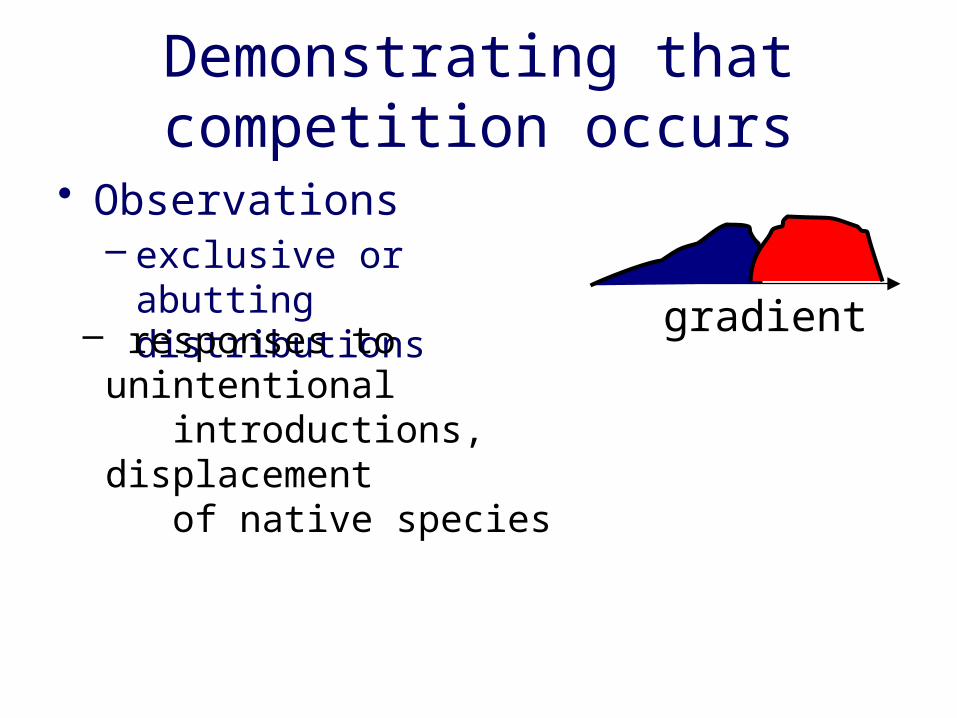
Demonstrating that competition occurs
• Observations– exclusive or abutting
distributions gradient– responses to unintentional
introductions, displacement of native species

Any natural pattern could be explained in
several ways

Distributions of barnacles
• Rocky intertidal zone
• adult barnacles immobile on rocks
• larvae settle on rocks from plankton
• Joseph Connell (1961)Ecology 42:710-723
• see Fig. 8.7
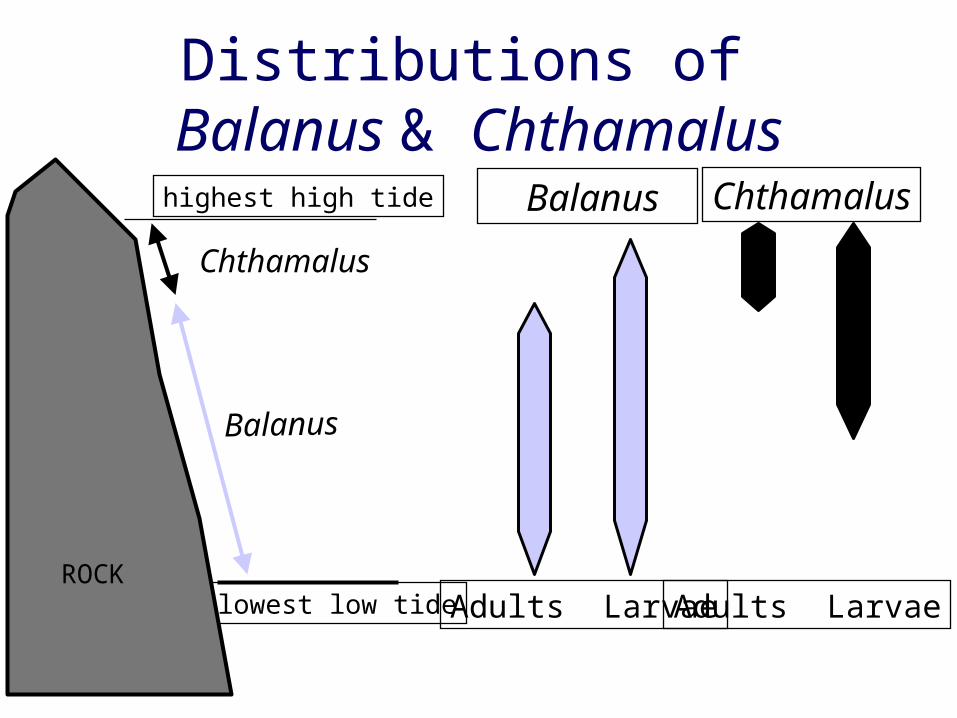
Distributions of Balanus & Chthamalus
lowest low tide
highest high tide Balanus
Adults Larvae
Balanus
Chthamalus
Chthamalus
Adults LarvaeROCK
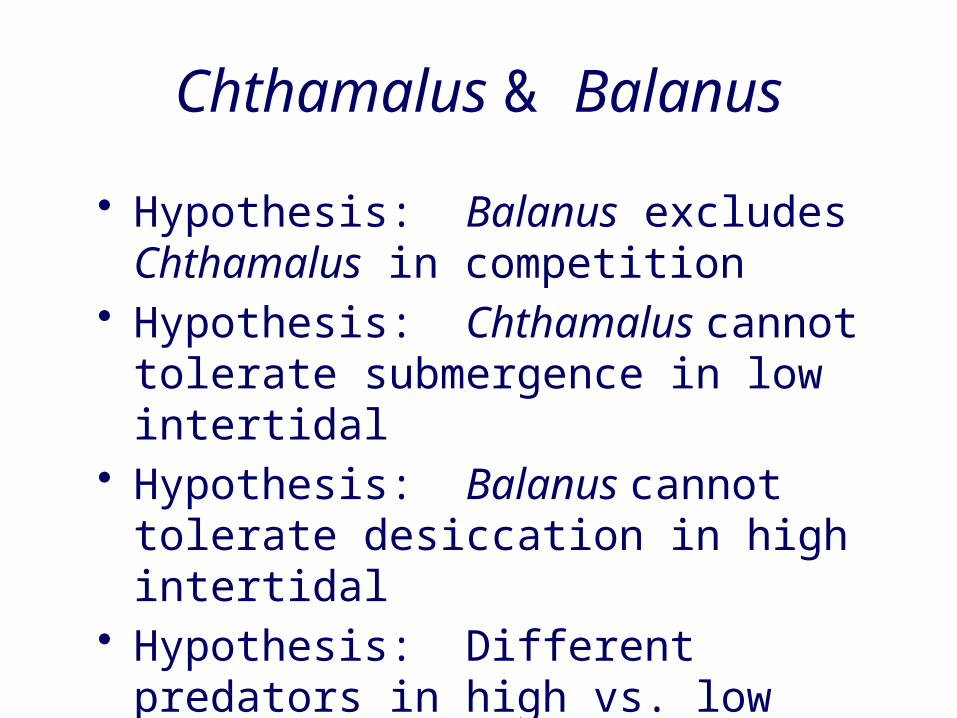
Chthamalus & Balanus
• Hypothesis: Balanus excludes Chthamalus in competition
• Hypothesis: Chthamalus cannot tolerate submergence in low intertidal
• Hypothesis: Balanus cannot tolerate desiccation in high intertidal
• Hypothesis: Different predators in high vs. low intertidal

Testing interspecific competition in nature
• Reynoldson & Bellamy 1971• 5 criteria
– Comparative distribution / abundance of species suggest competition
– Species share some resource (or interfere)
– Evidence for interspecific competition• performance of species + related to resources
• Observational criteria
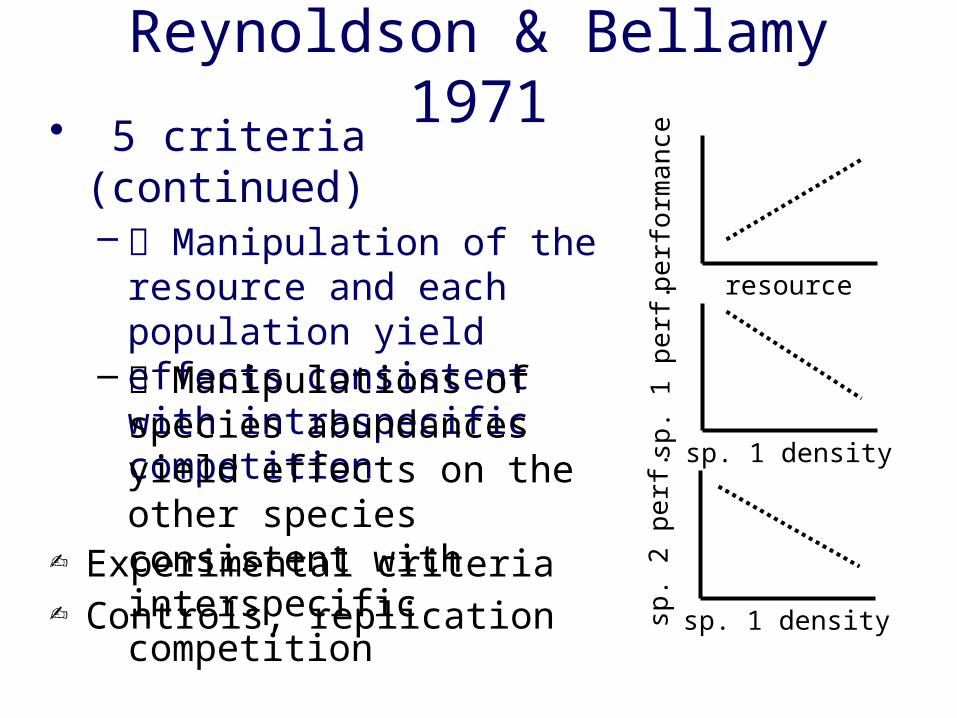
Reynoldson & Bellamy 1971• 5 criteria (continued)
– Manipulation of the resource and each population yield effects consistent with intraspecific competition
resource
perf
orm
ance
sp. 1 density
sp. 1
per
f.
sp. 1 density
sp. 2
per
f.
– Manipulations of species abundances yield effects on the other species consistent with interspecific competition
Experimental criteria Controls, replication

Performance
• Surivival• Growth• Feeding success• Fecundity• Assumed to be correlates of population
rate of increase

Experimental studies• Evidence is cumulative• Density manipulations are now the
standard• Not always feasible
– spatial scale– ethics
• Reviews of experiments– Connell 1983– Schoener 1983– Gurevitch et al. 1992