erläuterungen zum quartalsberichtir.nordex-online.com/download/companies/nordex... · q3/2015. 2...
TRANSCRIPT

Interim Report of the Nordex Groupas of 30 September 2015
Q3/2015
2
Contents
3 Key figures
4 Letter to the shareholders
5 The stock
Interim Group management report as of 30 September 2015
7 Economic conditions
8 Business performance
9 Results of operations and earnings
10 Financial condition and net assets
10 Capital spending
10 Research and development
11 Employees
12 Risks and opportunities
12 Outlook
13 Events after the conclusion of the period under review
Interim consolidated financial statements as of 30 September 2015
14 Consolidated balance sheet
15 Consolidated income statement
15 Consolidated statement of comprehensive income
16 Consolidated cash flow statement
17 Consolidated statement of changes in equity
19 Notes on the interim consolidated financial statement (IFRS)
20 Statement of changes in property, plant and equipment and intangible assets
23 Report on material transactions with related parties
23 Group segment report
25 Shares held by members of the Supervisory Board and the Management Board
26 Financial calendar/statutory disclosures/disclaimer

3
Key figures
Earnings
01.01.–
30.09.2015
01.01.–
30.09.2014
Sales EUR million 1,786.1 1,266.6
Total revenues EUR million 1,769.9 1,288.6
EBITDA EUR million 138.1 89,7
EBIT EUR million 97.6 59.9
Free cash flow EUR million 18.5 119.8
Capital spending EUR million 50.9 47.8
Consolidated net profit EUR million 45.4 28.0
Earnings per share* EUR 0.56 0.35
EBIT margin % 5.5 4.7
Balance sheet
30.09.2015 31.12.2014
Total assets EUR million 1,478.9 1,239.9
Equity EUR million 448.6 396.0
Equity ratio % 30.3 31.9
Working capital ratio % 1.0 -2.3
Employees
01.01.–
30.09.2015
01.01.–
30.09.2014
Employees ø 3,050 2,735
Personnel expenses EUR million 143.4 124.0
Sales per employee EUR thousand 585.6 463.1
Personnel expense ratio % 8.1 9.6
Company performance indicators
01.01.–
30.09.2015
01.01.–
30.09.2014
Order intake EUR million 1,964.0 1,253.2
Installed capacity MW 1,157.9 1,067.8
Share of exports % 70.6 69.2
**Undiluted on the basis of a weighted average of 80.882 million shares

4
In the last few months, we have achieved a decisive breakthrough in the long-term expansion of our
business – the strategic cooperation with the Acciona Group. Together with Acciona, we are
establishing a strong partnership which is well positioned to tackle the challenges of the future.
At the beginning of October 2015, we entered into an agreement with Acciona under which we will
acquire its turbine business, i.e. the development and production of wind power systems by Acciona
Windpower (AWP). At the same time, the Acciona Group will become a new principal shareholder in
Nordex. And this is of crucial importance for us. Acciona has adopted a long-term approach and
knows our market very well. As a developer and operator of wind farms, its subsidiary Acciona Energia
is one of the largest players in our industry.
The core argument in favour of acquiring AWP is the very largely complementary positioning of
Nordex and AWP in terms of markets, products, projects and customers. Moving forward, we will be
able to enter even more markets more effectively and eliminate the effects of possible fluctuation in
regional demand. This particularly concerns the dynamically growing emerging markets, in which AWP
holds a strong position – not least of all due to a turbine design which is particularly suited to the
requirements of these markets.
This means that we are an almost perfect fit for each other and do not expect any material
reorganisation expenses to arise from this business combination. This also forms an important basis
for the success of our companies’ planned transformation into a new global player. We expect to
receive the pending antitrust clearance in the first quarter of 2016. Until then, we will be continuing to
operate as two separate companies.
Nordex’s business continued to expand in the third quarter of 2015 and we grew more quickly again
than in the first half of the year. On this basis, we currently expect full-year sales to rise to EUR 2.4
billion. Looking forward over the next few years, we are also optimistic. Although regulatory challenges
will arise in some parts of our core European region, we will be able to fully address them from our
own resources and also through our partnership with Acciona.
We continue to pursue our strategic initiatives to grow revenues and achieve a further improvement in
earnings. I refer to the development of new turbines and technical solutions, for instance, which will
generate green electricity at even lower cost. A good example of this is the Nordex N131/3300, which
was unveiled in the summer. This new version from the Delta series boasts an increase of almost 10%
in energy yield.
We will present further details of our plans in connection with the partnership with Acciona and our
medium-term goals for the Nordex Group at our Capital Markets Day on 12 November 2015.
Yours sincerely,
Lars Bondo Krogsgaard
Chief Executive Officer
Nordex SE

5
The stock
In the first nine months of 2015, the main international equity indices exhibited volatile performance.
After posting gains in the first half of the year - reflected in a new all-time high in May for the DAX 30,
for example - they retreated again sharply from the summer. As a result, they were mostly at or slightly
below the levels at which they had entered the year by the end of September. This change of
sentiment was primarily triggered by doubt over the outlook for the Chinese economy. In addition to
the sharp economic slowdown in China and fears of more muted growth in other emerging markets
such as Brazil, nervousness ahead of a potential US Fed rate hike also exerted pressure on equities.
The US blue-chip Dow Jones index closed just under 9% down on the end of 2014 on 30 September
2015, with the EURO STOXX 50 ceding more than 1% in the same period. The main German equities
index DAX 30 closed the period at 9,660 points, also down 1% on the end of last year.
The technology stock index TecDAX, in which Nordex is also included, was affected only briefly by
these developments and, after a correction in August, was able to recoup a large part of its losses by
the end of the third quarter. At 1,748 points on 30 September 2015, it was up more than 27% on 30
December 2014. The RENIXX, a global index tracking shares in companies engaged in renewable
energies closed at 430 points, thus advancing by 15% over the end of 2014.
With a gain of 63%, Nordex SE was one of the top performers in the TecDAX, closing at EUR 24.43
on 30 September 2015. It reached a high for the period from January to September 2015 of EUR
27.58 on 10 August and a low of EUR 15.09 on 15 January. Average daily trading volume on the
XETRA electronic trading platform amounted to around 915,234 shares, a decline of 28.5% over the
same period of the previous year (1.28 million shares).
Nordex attended several international capital market conferences during the period under review. In
addition, the Management Board and the IR team utilised various opportunities for direct contact with
institutional and private investors.
As of the end of October 2015, Nordex SE’s business performance is covered and regularly analysed
by 17 national and international research companies. This coverage offers investors a high degree of
transparency and diverse views on the future outlook for Nordex SE. This year, five research
companies – Kepler Cheuvreux, Bankhaus Metzler, Oddo Seydler Bank, Société Générale and, most
recently in October, Citigroup – have added Nordex to their respective coverage universes, publishing
initiation of coverage reports. All five institutions have given Nordex stock a buy rating.
Information on Nordex stock as well as news, reports and presentations on the Company are regularly
available from the Investor Relations section of the Nordex Group’s website at www.nordex-
online.com/en/investorrelations. In addition, it is possible to subscribe to the e-mail newsletter service
to keep abreast of all main developments at Nordex with minimum delay.

6
Performance of Nordex stock from 1 January 2015 until 30 September 2015
(indexed, 30 December 2014 = 100)
Source: Deutsche Börse; IWR (Internationales Wirtschaftsforum Regenerative Energien) Shareholder structure as of 30 September 2015
7
Interim Group management report as of 30 September 2015
Economic conditions
Following its April 2015 report, the International Monetary Fund downgraded its forecast for growth in
the global economy in 2015 in two steps. It revised its global growth forecast for 2015 from 3.5% to
3.3% in July and then to 3.1% at the end of September in its October update of the World Economic
Outlook. This reflected the weaker-than-expected performance of the industrialised nations as well as
a further slowdown in activity in the emerging markets. Against a backdrop of low commodity prices,
the ailing currencies of the emerging markets and increased volatility in the financial markets, the IMF
sees a greater risk of a further decline in global economy growth. However, it is more optimistic in its
outlook for the coming year, although it also scaled back its forecast for global production growth in
2016 from 3.8% to 3.6% in September. Looking forward to the coming year, Brazil and Russia, whose
economies have been particularly weak in 2015, as well as other countries in South America and the
Middle East are expected to improve from a low level.
Although the chairwoman of the US Federal Reserve has not expressly ruled out a rate hike in 2015,
this has not materialised so far. Similarly, the European Central Bank (ECB) is pursuing an
expansionary monetary policy and has continued its asset-buying programme. At the same time, it has
left its main refinancing rate unchanged at a low level.
After dropping to a multi-year low of EUR 1.05 against the US dollar in mid-March, the euro recovered
slightly in the course of the period under review, closing at EUR 1.12 per USD on 30 September 2015.
This still relatively low level supports Eurozone exports in principle. Even so, German industry has
been able to benefit to only a limited degree. Although German exports reached a historical high of
EUR 107.1 billion in July 2015, order intake from non-Eurozone countries was disappointing again in
August, contracting by 3.7%.
European electricity prices remained persistently low in the first three quarters of 2015. On the
European Energy Exchange (EEX) in Leipzig, base load electricity for the coming year traded at an
average of EUR 29.08/MWh as of September 2015, a further 16% lower than in the previous year
(September 2014: EUR 34.72/MWh). Prices in the Scandinavian Nordpool wholesale market even
dipped below EUR 20/MWh in the period under review.
Renewables play an increasingly important role in global energy production. According to the BP
energy report, they currently account for 22.5% of global energy production, 0.7 percentage points up
on the figure reported in the previous year (21.8%). Growth in wind power is playing a crucial role in
this respect, which is also reflected in funding volumes. Bloomberg New Energy Finance (BNEF)
reports that funding volumes for investments in renewable energies amounted to USD 70 billion in the
third quarter of 2015 and were thus virtually unchanged over the previous year. The greatest
percentage growth was registered in North and South America according to Bloomberg. In Brazil,
funding volumes increased by 131% over the third quarter of 2014 to USD 2.3 billion primarily as a
result of wind power projects. Volume in Chile surged from EUR 180 million to USD 1.6 billion, while
the United States also recorded a substantial 25% increase to USD 13.4 billion.

8
Business performance
In the first three quarters of 2015, Nordex achieved a new record order intake. With firmly financed
new orders of EUR 1,964.0 million (previous year: EUR 1,253.2 million), new business exceeded the
previous year by 57% and, at the end of the first nine months, was only just under 12% short of the
full-year figure reported in 2014 (2014: EUR 1,753.9 million).
The core EMEA (Europe, Middle East including Pakistan and Africa) region contributed 87% and the
American markets 13% of order intake. Alongside Germany, the most important markets were Turkey,
South Africa, Uruguay and France. The N117/2400 Generation Gamma low-wind turbine was the top
seller, accounting for 38% of all turbines sold. The new Generation Delta contributed 25% (previous
year: 19%).
Turbine order intake by region
01.01.–
30.09.2015
%
01.01.–
30.09.2014
%
EMEA 87 93
The Americas 13 6
Asia* 0 1
*The Pakistan and Singapore business units are included in the EMEA segment as of 1 January 2015.
Consolidated sales amounted to EUR 1,786.1 million in the period under review, 41% up on the year-
ago period (EUR 1,266.6 million). With a share of 88% (previous year: 86%) of turbine construction
sales, EMEA continued to grow slightly in importance, while the Americas contributed 12% and no
notable turbine construction sales were generated in Asia. Given the rising proportion of orders from
the Americas and Asia, which currently stands at 20%, regional sales are likely to become more
diversified in the foreseeable future.
Turbine sales by region
01.01.–
30.09.2015
%
01.01.–
30.09.2014
%
EMEA 88 86
The Americas 12 13
Asia* 0 1
*The Pakistan and Singapore business units are included in the EMEA segment as of 1 January 2015.
Exports accounted for 70.6% of sales in the period under review, slightly up on the first nine months of
2014, when 69.2% of the Company’s products were sold in international markets.
Service business remained gratifying. The renewal rate for existing service contracts remained strong,
amounting to 95% (previous year: 98%) on a twelve-month rolling basis (October 2014 - September
2015). With sales of EUR 138.5 million, the proportion of service business in total sales stood at 7.8%.
This is 17.5% up on the previous year’s figure of EUR 117.9 million.
9
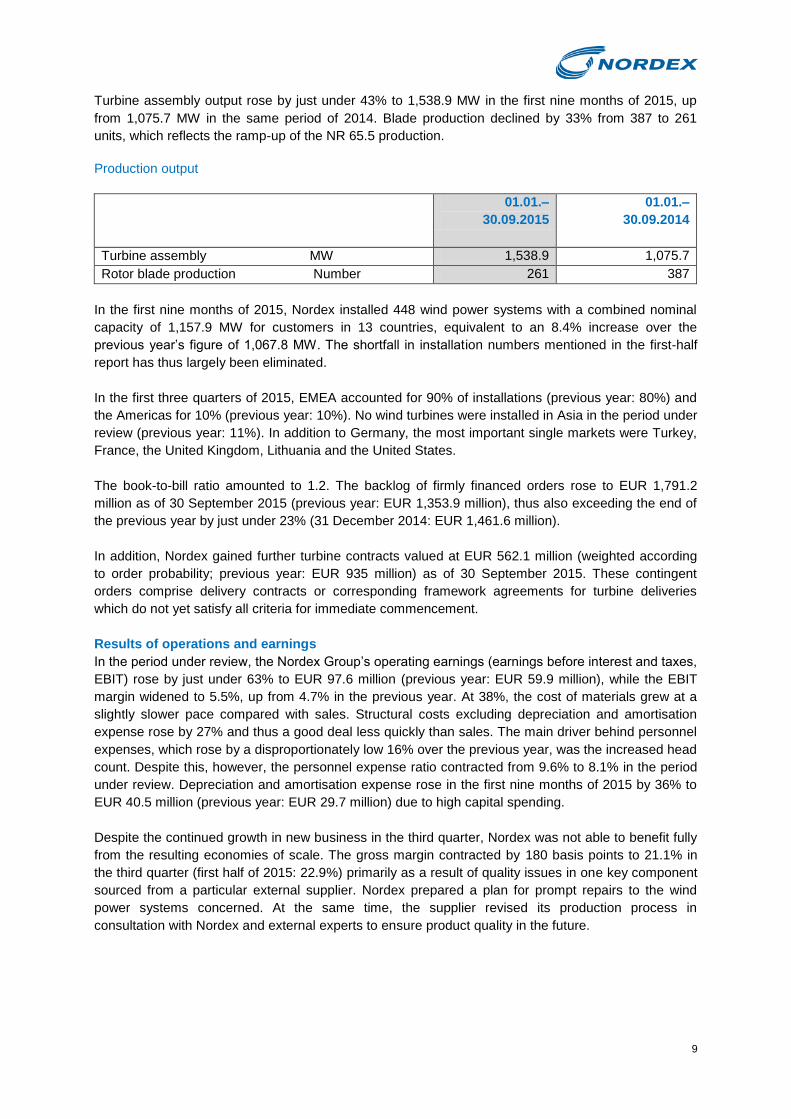
Turbine assembly output rose by just under 43% to 1,538.9 MW in the first nine months of 2015, up
from 1,075.7 MW in the same period of 2014. Blade production declined by 33% from 387 to 261
units, which reflects the ramp-up of the NR 65.5 production.
Production output
01.01.–
30.09.2015
01.01.–
30.09.2014
Turbine assembly MW 1,538.9 1,075.7
Rotor blade production Number 261 387
In the first nine months of 2015, Nordex installed 448 wind power systems with a combined nominal
capacity of 1,157.9 MW for customers in 13 countries, equivalent to an 8.4% increase over the
previous year’s figure of 1,067.8 MW. The shortfall in installation numbers mentioned in the first-half
report has thus largely been eliminated.
In the first three quarters of 2015, EMEA accounted for 90% of installations (previous year: 80%) and
the Americas for 10% (previous year: 10%). No wind turbines were installed in Asia in the period under
review (previous year: 11%). In addition to Germany, the most important single markets were Turkey,
France, the United Kingdom, Lithuania and the United States.
The book-to-bill ratio amounted to 1.2. The backlog of firmly financed orders rose to EUR 1,791.2
million as of 30 September 2015 (previous year: EUR 1,353.9 million), thus also exceeding the end of
the previous year by just under 23% (31 December 2014: EUR 1,461.6 million).
In addition, Nordex gained further turbine contracts valued at EUR 562.1 million (weighted according
to order probability; previous year: EUR 935 million) as of 30 September 2015. These contingent
orders comprise delivery contracts or corresponding framework agreements for turbine deliveries
which do not yet satisfy all criteria for immediate commencement.
Results of operations and earnings
In the period under review, the Nordex Group’s operating earnings (earnings before interest and taxes,
EBIT) rose by just under 63% to EUR 97.6 million (previous year: EUR 59.9 million), while the EBIT
margin widened to 5.5%, up from 4.7% in the previous year. At 38%, the cost of materials grew at a
slightly slower pace compared with sales. Structural costs excluding depreciation and amortisation
expense rose by 27% and thus a good deal less quickly than sales. The main driver behind personnel
expenses, which rose by a disproportionately low 16% over the previous year, was the increased head
count. Despite this, however, the personnel expense ratio contracted from 9.6% to 8.1% in the period
under review. Depreciation and amortisation expense rose in the first nine months of 2015 by 36% to
EUR 40.5 million (previous year: EUR 29.7 million) due to high capital spending.
Despite the continued growth in new business in the third quarter, Nordex was not able to benefit fully
from the resulting economies of scale. The gross margin contracted by 180 basis points to 21.1% in
the third quarter (first half of 2015: 22.9%) primarily as a result of quality issues in one key component
sourced from a particular external supplier. Nordex prepared a plan for prompt repairs to the wind
power systems concerned. At the same time, the supplier revised its production process in
consultation with Nordex and external experts to ensure product quality in the future.

10
Net finance expense contracted by 15% from EUR 17.8 million as of September 30, 2014 to EUR 15.2
million in the first three quarters of 2015. This particularly reflects the improved conditions for the
guarantee facility established in the prior year, which applied to the entire reporting period for the first
time in 2015. The higher tax rate in the third quarter 2015 results from the fact that potential future tax
benefits of some Nordex entities could not yet been realized. Nordex posted consolidated profit after
interest and taxes of EUR 45.4 million in the first nine months of 2015, an increase of 62% over the
previous year (previous year: EUR 28.0 million).
Financial condition and net assets
As of 30 September 2015, the Nordex Group had an equity ratio of 30.3%. Despite the substantial
increase in total assets, this was only slightly down on the end of 2014 (31 December 2014: 31.9%).
Total assets rose by 19% to EUR 1,478.9 million (31 December 2014: EUR 1,239.9 million), while
equity climbed by 13% to EUR 448.6 million. Cash and cash equivalents including fixed-term deposits
amounted to a total of EUR 454.4 million as of 30 September 2015, resulting in a 17% increase in
liquidity over the end of 2014 (31 December 2014: EUR 388.4 million). Among other things, this
increase was due to the contractual utilisation of the EIB loan of EUR 50.0 million shortly before the
end of the period under review. Net liquidity stood at EUR 250.2 million at the end of the period under
review (31 December 2014: EUR 232.2 million).
The working capital ratio rose to a positive 1.0% as of 30 September 2015, compared with a negative
2.3% at the end of 2014. Nordex is continuing to produce solely for firm contracts for which
prepayments have already been received. Given the large order backlog, optimum use is made of
production capacities in terms of timing in order to satisfy delivery obligations.
Inventories declined by 19% to EUR 223.3 million in the first nine months of 2015 (31 December 2014:
EUR 273.9 million). The start of work on a greater number of contracts resulted in a sharp 86%
increase in trade receivables and future receivables from construction contracts to EUR 345.0 million
(31 December 2014: EUR 185.5 million). At the same time, trade payables climbed by 74% to EUR
308.9 million.
In the first three quarters of 2015, Nordex generated a net cash inflow of EUR 67.3 million from
operating activities (previous year: EUR 162.7 million). Net cash outflow from investing activities
amounted to EUR 48.8 million in the same period (previous year: net outflow of EUR 43.0 million),
leading to free cash flow of EUR 18.5 million (previous year: EUR 119.8 million).
Capital spending
Capital spending on property, plant and equipment and intangible assets amounted to EUR 50.9
million in the period under review (previous year: EUR 47.8 million). A large part of this was accounted
for by capitalised development, which came to a total of EUR 19.1 million. Capital spending on
property, plant and equipment amounted to EUR 30.4 million, primarily for conversion and expansion
activities in blade production.
Research and development
In order to steadily enhance the competitiveness of Nordex turbines and wind farms, the Company is
primarily concentrating on lowering the cost of energy in each wind class and on safeguarding and
improving the basis for obtaining the necessary approvals and grid connection capabilities in
established and new markets. In the period under review, product development primarily involved
further work on and the standardisation of the Generation Delta turbines.
11
This is the fourth-generation Nordex multi-megawatt platform comprising the N100/3300 turbine for
strong wind locations (IEC 1a), the N117/3000 turbine for moderate wind locations (IEC 2a) and the
N131/3000 for low wind locations (IEC 3a). This was supplemented in the period under review by the
N131/3300 (IEC 3a), which is specially designed for the low wind regions and other requirements of
the German market.
The Generation Delta turbines are characterised by larger rotor diameters and a increased nominal
output, resulting in gains of up to 30% in annual energy yield. The complete documentation and
certificates are available for all Generation Delta turbines, allowing customers and investors to apply
for building permits for ten different hub heights between 75 metres and 144 metres.
In the period under review, testing and measuring activities were continued on the first N131/3000
turbine to be installed, which are also required for type certification in accordance with the international
IEC standard. Preliminary results indicate that the turbine meets and, in some cases, even
outperforms very low noise emission calculations. This means that it is particularly suitable for non-
coastal locations. Product development is continuing to focus on the series launch of the N131/3000
as part of a largely standardised Generation Delta platform.
In addition, Nordex added a further hub height of 164 m to its range with the development of the
N131/3300 (IEC 3a). This turbine is scheduled to go into production in 2016.
With respect to further enhancements to Generation Gamma, particularly the highly efficient
N117/2400 for low-wind locations (IEC 3a), the main focus in the period under review was on
measures to lower product costs by widening the pool of suppliers for the main components as well as
further optimisation of the nacelle and towers.
Nordex will also be able to incorporate many of these and other developments, e.g. control systems as
well as operations management and monitoring of wind power systems and wind farms, in Generation
Delta turbines thanks to its platform strategy.
Work on optimising the Nordex Anti-Icing System (AIS) also continued. The introduction of the system
to the 131-metre rotor of the N131/3000 is scheduled for the first installations at the end of the year.
A further key aspect of development activities included projects to satisfy updated grid connection
requirements in existing target markets and to ensure grid conformance in new markets and
corresponding modifications to the electrical systems.
Employees
As of the reporting date, the Nordex Group had 3,213 employees, an increase of just under 13% over
the previous year (30 September 2014: 2,852). Employee numbers were thus up 10% on the end of
2014 (2,919 employees). This increase was primarily due to recruiting in the production – specifically
turbine assembly – and service areas. At the end of the period under review, 94% of Nordex’s
employees were based in EMEA, i.e. Europe, South Africa and Pakistan, 4% in the Americas and just
under 2% in Asia.

12
Risks and opportunities
In the period under review, there were no material changes in the opportunities and risks to the
Group’s expected performance described in detail in the Nordex SE annual report for 2014. However,
increased customer activity is discernible in certain markets in which legislative changes are
foreseeable. This is currently having a positive impact on Nordex’s order intake in Germany and
Turkey.
In the assessment of the Management Board, there are currently no significant individual risks that are
liable to compromise the Nordex Group’s going-concern status. The same is also true with respect to
an overall consideration of all risks.
Outlook
The International Monetary Fund (IMF) revised its July forecast in October and now expects growth of
3.1% this year (July 2015: 3.4%). The industrialised nations are expected to expand by 2.2% (July
2015: 2.3%) and the emerging markets by 4.0% (July 2015: 4.2%). Among industrialised nations, the
highest growth is expected in Spain (3.1%) and the United States (2.6%), while among the emerging
markets India (7.3%) and China (6.8%) are likely to achieve the strongest momentum.
According to the IMF, the German economy will remain on its growth trajectory and expand again by
1.5% in 2015. In fact, the German federal government projects growth of 1.7% this year. On a similarly
favourable note, the ifo business confidence barometer has risen slightly by 0.1 points to 108.5 in
September 2015.
MAKE Consulting forecasts a record volume of new wind power installations in 2015, with nominal
output of more than 54 GW in the onshore segment, equivalent to an increase of just under 16%.
While the wind market in EMEA is expected to contract by 6%, it is expected to grow by 30% in the
Americas and by 21% in Asia.
In the important German market, VDMA (German Federal Mechanical Engineering Association) and
BWE (German Wind Power Association) expect a further sharp rise in onshore capacity of at least
4,000 MW despite the adjustments to tariffs.
Nordex expects that its order intake and sales will remain strong and largely stable. Against this
backdrop, the Management Board is raising its targets for 2015 and now expects for order intake of
EUR 2.3 - 2.4 billion (previously EUR 2.1 - 2.3 billion) and sales of EUR 2.3 - 2.4 billion (previously
EUR 1.9 - 2.1 billion). With respect to profitability, it confirms the expected EBIT range of 5 - 6%.
The still low working capital as of the reporting date may fluctuate during the year due to the typical
characteristics of project business. A working capital ratio of less than 5% remains the target. Capital
spending in the current year is likely to lie in a range of EUR 65 - 70 million, up from the previously
forecast range of EUR 60 - 65 million. This increase is necessary as new business is exceeding the
budget, necessitating higher capital spending particularly on property, plant and equipment.

13
Events after the conclusion of the period under review
On 1 October 2015, Nordex announced that it has entered into a contract with Frodsham Wind Farm
Limited, a subsidiary of Peel Energy und Belltown Power, for the delivery of 19 N90/2650 wind power
systems. This version of the N90/2500 Gamma strong-wind turbine has been especially developed for
the “Frodsham” project. With an output of 50.35 MW, the project is to be executed by the second
quarter of 2016.
In an ad-hoc bulletin published on 4 October 2015, Nordex announced that it has signed a business
combination agreement for the acquisition of Acciona Windpower. Under the terms of the agreed
transaction, Acciona S.A. will be transferring the wind power business which it operates directly or
indirectly via its 100% subsidiary Acciona Windpower S.L. (Acciona Windpower) to Nordex SE in the
form of a combined cash/non-cash capital contribution. The transaction of up to EUR 785 million will
be financed through the exercise of the capital authorised in accordance with Nordex SE’s articles of
incorporation in order to issue 16.1 million new shares subject to the exclusion of shareholders’ pre-
emptive subscription rights and to grant Acciona new shares at an issue amount of EUR 26.00 per
share plus cash of EUR 366.4 million – adjusted for net financial liabilities. Execution of the business
combination agreement including the issue of new share capital is expected in the first quarter of 2016
subject to the discharge of the customary conditions precedent as provided for in the agreement
(particularly antitrust clearance). Following the completion of the transaction, Acciona S.A. will hold
16.6% of Nordex SE’s shares. As the previous anchor shareholder SKion/momentum will sell shares
to Acciona S.A. after the execution of the business combination agreement, Acciona S.A. will become
the new principal shareholder of Nordex SE with 29.9% of its capital.
On 16 October, Nordex reported that it has signed three delivery contracts with customers in Turkey.
The contracts comprise power station capacity of 45 MW in total, spread across eleven Generation
Delta (N117/3000) turbines and five Generation Gamma (N117/2400) turbines.
14
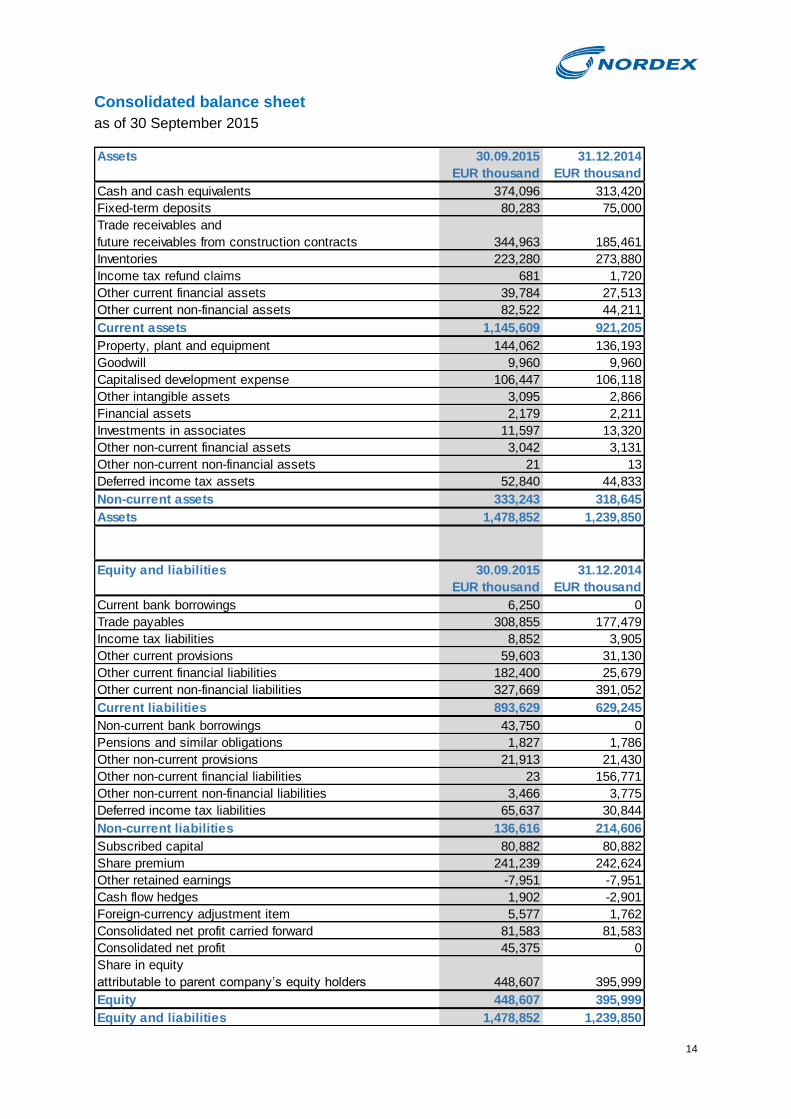
Consolidated balance sheet
as of 30 September 2015
Assets 30.09.2015 31.12.2014
EUR thousand EUR thousand
Cash and cash equivalents 374,096 313,420
Fixed-term deposits 80,283 75,000
Trade receivables and
future receivables from construction contracts 344,963 185,461
Inventories 223,280 273,880
Income tax refund claims 681 1,720
Other current financial assets 39,784 27,513
Other current non-financial assets 82,522 44,211
Current assets 1,145,609 921,205
Property, plant and equipment 144,062 136,193
Goodwill 9,960 9,960
Capitalised development expense 106,447 106,118
Other intangible assets 3,095 2,866
Financial assets 2,179 2,211
Investments in associates 11,597 13,320
Other non-current financial assets 3,042 3,131
Other non-current non-financial assets 21 13
Deferred income tax assets 52,840 44,833
Non-current assets 333,243 318,645
Assets 1,478,852 1,239,850
Equity and liabilities 30.09.2015 31.12.2014
EUR thousand EUR thousand
Current bank borrowings 6,250 0
Trade payables 308,855 177,479
Income tax liabilities 8,852 3,905
Other current provisions 59,603 31,130
Other current financial liabilities 182,400 25,679
Other current non-financial liabilities 327,669 391,052
Current liabilities 893,629 629,245
Non-current bank borrowings 43,750 0
Pensions and similar obligations 1,827 1,786
Other non-current provisions 21,913 21,430
Other non-current financial liabilities 23 156,771
Other non-current non-financial liabilities 3,466 3,775
Deferred income tax liabilities 65,637 30,844
Non-current liabilities 136,616 214,606
Subscribed capital 80,882 80,882
Share premium 241,239 242,624
Other retained earnings -7,951 -7,951
Cash flow hedges 1,902 -2,901
Foreign-currency adjustment item 5,577 1,762
Consolidated net profit carried forward 81,583 81,583
Consolidated net profit 45,375 0
Share in equity
attributable to parent company’s equity holders 448,607 395,999
Equity 448,607 395,999
Equity and liabilities 1,478,852 1,239,850

15
Consolidated income statement
for the period from 1 January to 30 September 2015
Consolidated statement of comprehensive income
for the period from 1 January to 30 September 2015
01.01.2015- 01.01.2015- 01.07.2015- 01.07.2014-
30.09.2015 30.09.2014 30.09.2015 30.09.2014
EUR thousand EUR thousand EUR thousand EUR thousand
Sales 1,786,146 1,266,644 685,828 451,211
Changes in inventories and other
own work capitalised -16,263 22,004 269 62,973
Total revenues 1,769,883 1,288,648 686,097 514,184
Other operating income 7,572 19,289 -6,092 2,912
Cost of materials -1,389,014 -1,008,168 -541,122 -410,488
Personnel expenses -143,412 -123,967 -50,030 -42,975
Depreciation/amortisation -40,463 -29,720 -14,110 -10,983
Other operating expenses -106,931 -86,139 -38,649 -29,771
Earnings before interest and taxes (EBIT) 97,635 59,943 36,094 22,879
Income from investments 1,043 330 0 0
Net profit/loss from at-equity valuation -1,723 -2,613 -163 -314
Other interest and similar income 1,757 1,589 509 614
Interest and similar expenses -16,232 -17,106 -5,242 -5,224
Net finance expense -15,155 -17,800 -4,896 -4,924
Net profit/loss from ordinary activity 82,480 42,143 31,198 17,955
Income taxes -37,105 -14,173 -22,729 -6,498
Consolidated profit 45,375 27,970 8,469 11,457
Of which attributable to:
Parent company’s equity holders 45,375 27,970 8,469 11,457
Earnings per share (in EUR)
Basic* 0.56 0.35 0.10 0.14
Diluted** 0.56 0.35 0.10 0.14
*Based on a weighted average of 80.882 million shares (previous year 80.882 million shares)
**Based on a weighted average of 80.882 million shares (previous year 80.957 million shares)
01.01.- 01.01.-
30.09.2015 30.09.2014
EUR thousand EUR thousand
Consolidated profit 45,375 27,970
Other comprehensive income
Items which may be recycled to profit and loss
Foreign currency translation difference 3,815 -756
Cash flow hedges 7,064 -11,732
Deferred income taxes -2,261 3,520
Consolidated comprehensive income 53,993 19,002
Of which attributable to:
Parent company’s equity holders 53,993 19,002

16
01.01.- 01.01.-
30.09.2015 30.09.2014
EUR thousand EUR thousand
Operating activities:
Consolidated profit 45,375 27,970
+ Depreciation/amortisation of non-current assets 40,463 29,720
= Consolidated profit plus depreciation/amortisation 85,838 57,690
+ Decrease in inventories 50,600 7,293
-/+ Increase/decrease in trade receivables and
future receivables from construction contracts -159,502 16,727
+ Increase in trade payables 131,376 69,907
- Decrease in prepayments received - non-capitalised - -84,379 -6,720
= Payments made/received from changes in working capital -61,905 87,207
-/+ Increase/decrease in other assets not allocated to investing or
financing activities -56,136 4,115
+ Increase in pension provisions 41 26
+ Increase in other provisions 28,956 14,648
+/- Increase/decrease in other liabilities not allocated to investing or
financing activities 36,431 -2,672
+/- Loss/gain from the disposal of non-current assets 931 -6,085
- Other interest and similar income -1,757 -1,589
+ Interest received 1,194 1,566
+ Interest and similar expenses 16,232 17,106
- Interest paid -18,234 -19,137
+ Income taxes 37,105 14,173
- Taxes paid -2,516 -1,536
+/- Other non-cash expenses/income 1,138 -2,778
= Payments received from remaining operating activities 43,385 17,837
= Cash flow from operating activities
from continuing operations 67,318 162,734
Investing activities:
+ Payments received from the disposal of property, plant and equipment/
intangible assets 242 10,337
- Payments made for investments in property, plant and equipment/
intangible assets -50,932 -47,785
+ Payments received from the disposal of financial assets 2,182 2,910
- Payments made for investments in financial assets -329 -8,426
= Cash flow from investing activities
from continuing operations -48,837 -42,963
Financing activities:
+ Bank loans raised 50,000 0
- Bank loans repaid 0 -25,316
- Amounts invested in fixed-term deposits -5,283 -105,000
- Repayment of finance leases 0 -12,963
= Cash flow from financing activities
from continuing operations 44,717 -143,279
Cash change in cash and cash equivalents
from continuing operations 63,198 -23,508
+ Cash and cash equivalents at the beginning of the period 313,420 332,963
-/+ Exchange rate-induced change in cash and cash equivalents -2,522 2,506
= Cash and cash equivalents at the end of the period
(Cash and cash equivalents carried on the face of the consolidated balance
sheet) 374,096 311,961
Consolidated cash flow statement
for the period from 1 January to 30 September 2015
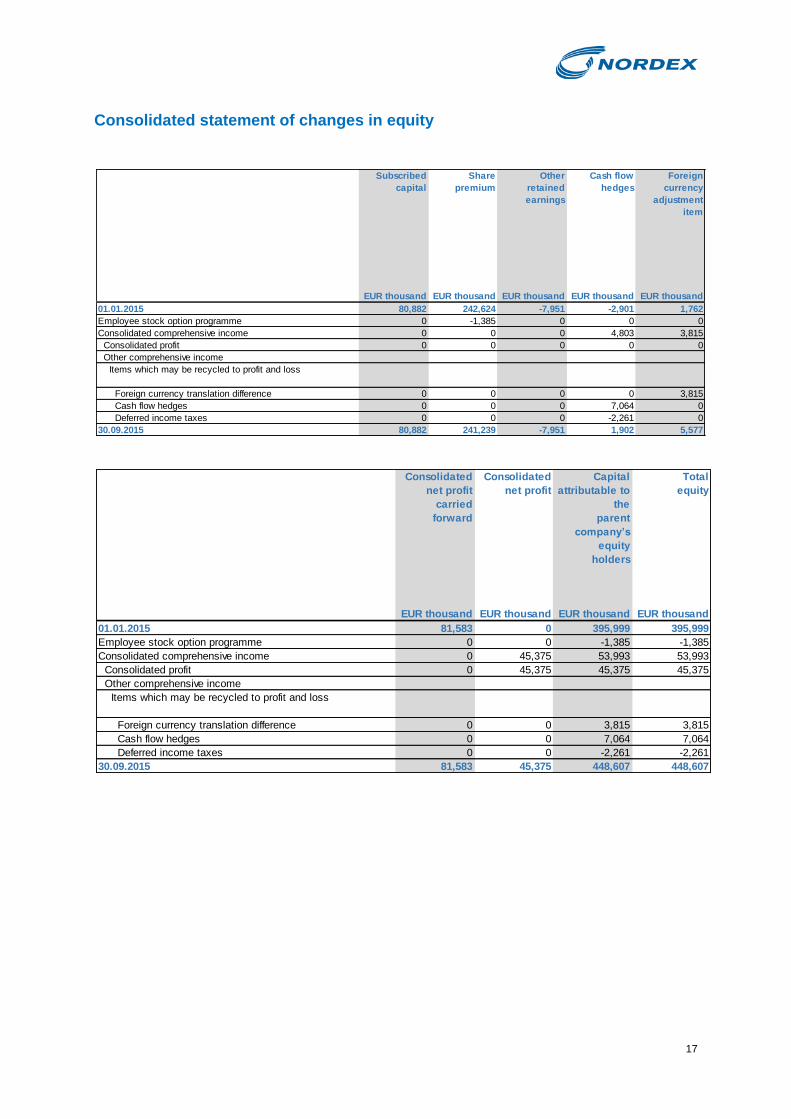
17
Subscribed
capital
Share
premium
Other
retained
earnings
Cash flow
hedges
Foreign
currency
adjustment
item
EUR thousand EUR thousand EUR thousand EUR thousand EUR thousand
01.01.2015 80,882 242,624 -7,951 -2,901 1,762
Employee stock option programme 0 -1,385 0 0 0
Consolidated comprehensive income 0 0 0 4,803 3,815
Consolidated profit 0 0 0 0 0
Other comprehensive income
Items which may be recycled to profit and loss
Foreign currency translation difference 0 0 0 0 3,815
Cash flow hedges 0 0 0 7,064 0
Deferred income taxes 0 0 0 -2,261 0
30.09.2015 80,882 241,239 -7,951 1,902 5,577
Consolidated
net profit
carried
forward
Consolidated
net profit
Capital
attributable to
the
parent
company’s
equity
holders
Total
equity
EUR thousand EUR thousand EUR thousand EUR thousand
01.01.2015 81,583 0 395,999 395,999
Employee stock option programme 0 0 -1,385 -1,385
Consolidated comprehensive income 0 45,375 53,993 53,993
Consolidated profit 0 45,375 45,375 45,375
Other comprehensive income
Items which may be recycled to profit and loss
Foreign currency translation difference 0 0 3,815 3,815
Cash flow hedges 0 0 7,064 7,064
Deferred income taxes 0 0 -2,261 -2,261
30.09.2015 81,583 45,375 448,607 448,607
Consolidated statement of changes in equity
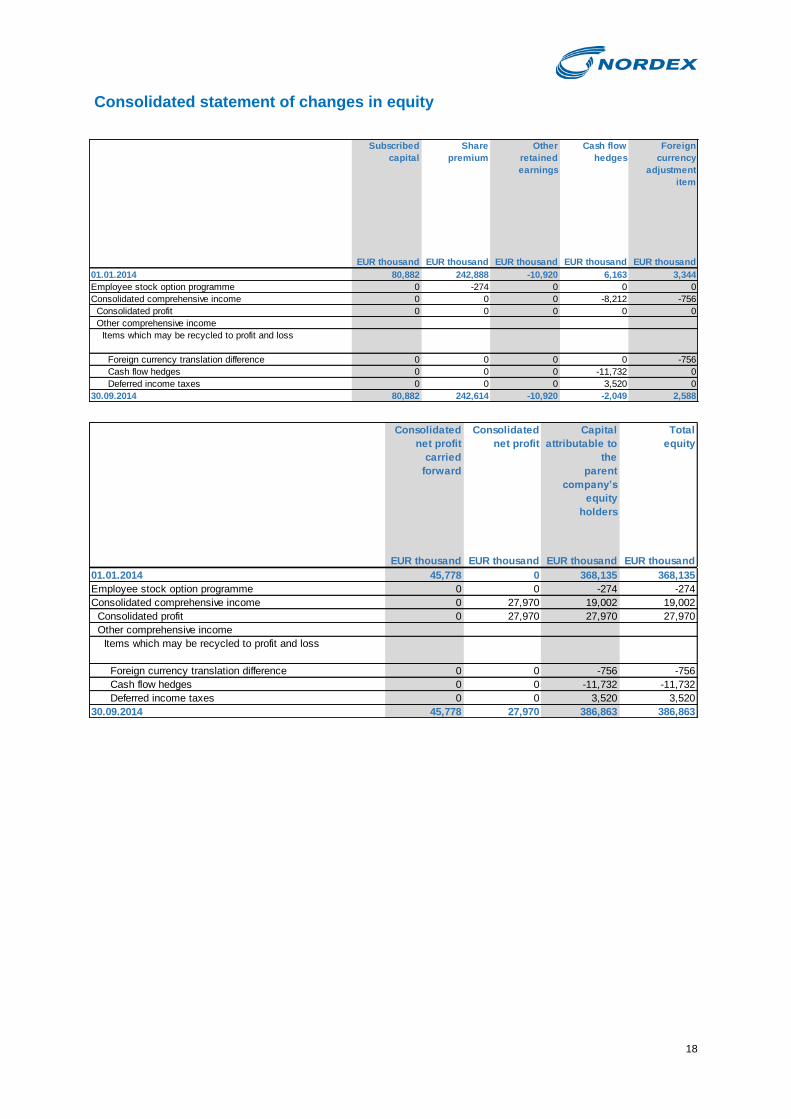
18
Subscribed
capital
Share
premium
Other
retained
earnings
Cash flow
hedges
Foreign
currency
adjustment
item
EUR thousand EUR thousand EUR thousand EUR thousand EUR thousand
01.01.2014 80,882 242,888 -10,920 6,163 3,344
Employee stock option programme 0 -274 0 0 0
Consolidated comprehensive income 0 0 0 -8,212 -756
Consolidated profit 0 0 0 0 0
Other comprehensive income
Items which may be recycled to profit and loss
Foreign currency translation difference 0 0 0 0 -756
Cash flow hedges 0 0 0 -11,732 0
Deferred income taxes 0 0 0 3,520 0
30.09.2014 80,882 242,614 -10,920 -2,049 2,588
Consolidated
net profit
carried
forward
Consolidated
net profit
Capital
attributable to
the
parent
company’s
equity
holders
Total
equity
EUR thousand EUR thousand EUR thousand EUR thousand
01.01.2014 45,778 0 368,135 368,135
Employee stock option programme 0 0 -274 -274
Consolidated comprehensive income 0 27,970 19,002 19,002
Consolidated profit 0 27,970 27,970 27,970
Other comprehensive income
Items which may be recycled to profit and loss
Foreign currency translation difference 0 0 -756 -756
Cash flow hedges 0 0 -11,732 -11,732
Deferred income taxes 0 0 3,520 3,520
30.09.2014 45,778 27,970 386,863 386,863
Consolidated statement of changes in equity
19
Notes on the interim consolidated financial statements as of 30 September 2015
I. General
The interim consolidated financial statements of Nordex SE and its subsidiaries for the first nine
months as of 30 September 2015, which have not been audited or reviewed by a statutory auditor,
were prepared in accordance with the International Financial Reporting Standards (IFRS) issued by
the International Accounting Standards Board (IASB) as endorsed by the European Union. In this
connection, all International Financial Reporting Standards and Interpretations, particularly IAS 34
Interim Financial Reporting, binding as of 30 September 2015 were applied.
These interim financial statements must be read in conjunction with the consolidated annual financial
statements for 2014. Further information on the accounting principles applied can be found in the
notes to the consolidated financial statements. The consolidated financial statements for 2014 are
available on the Internet at www.nordex-online.com in the Investor Relations section.
In the absence of express reference to any changes, the recognition and measurement principles
applied to the consolidated financial statements as of 31 December 2014 are also used in the interim
financial statements as of 30 September 2015.
The income statement has again been prepared in accordance with the total cost method.
The business results for the first nine months of 2015 are not necessarily an indication of expected
results for the year as a whole. Any irregular expenses occurring in the year are only included or
deferred in the interim financial report to the extent that such inclusion or deferral would also be
reasonable at the end of the year.
The interim financial statements were prepared in the Group currency, i.e. the euro.

20
Initial
amount
Additions Disposals Reclassi-
fications
Foreign
currency
Closing
amount
01.01.2015 30.09.2015
EUR thousand EUR thousand EUR thousand EUR thousand EUR thousand EUR thousand
Property, plant and equipment
Land and buildings 75,485 3,105 69 6,853 741 86,115
Technical equipment and machinery 110,568 14,813 8,006 2,625 -896 119,104
Other equipment, operating and business equipment 58,036 10,573 4,898 0 469 64,180
Prepayments made and assets under construction 15,508 1,937 0 -9,478 -12 7,955
Total property, plant and equipment 259,597 30,428 12,973 0 302 277,354
Intangible assets
Goodwill 14,461 0 0 0 0 14,461
Capitalised development expense 148,633 19,132 60 0 0 167,705
Other intangible assets 20,200 1,372 512 0 187 21,247
Total intangible assets 183,294 20,504 572 0 187 203,413
Historical cost
Initial
amount
Additions Disposals Foreign
currency
Closing
amount
30.09.2015 31.12.2014
01.01.2015 30.09.2015
EUR thousand EUR thousand EUR thousand EUR thousand EUR thousand EUR thousand EUR thousand
Property, plant and equipment
Land and buildings 33,007 2,174 41 706 35,846 50,269 42,478
Technical equipment and machinery 52,546 12,548 6,969 27 58,152 60,952 58,022
Other equipment, operating and business equipment 36,229 5,882 4,851 395 37,655 26,525 21,807
Prepayments made and assets under construction 1,622 0 0 17 1,639 6,316 13,886
Total property, plant and equipment 123,404 20,604 11,861 1,145 133,292 144,062 136,193
Intangible assets
Goodwill 4,501 0 0 0 4,501 9,960 9,960
Capitalised development expense 42,515 18,744 1 0 61,258 106,447 106,118
Other intangible assets 17,334 1,115 510 213 18,152 3,095 2,866
Total intangible assets 64,350 19,859 511 213 83,911 119,502 118,944
Depreciation/amortisation Carrying amount
II. Notes on the balance sheet Current assets Trade receivables and future receivables from construction contracts stood at EUR 345.0 million as of
30 September 2015 (31 December 2014: EUR 185.5 million) and include impairments of EUR 1.5
million (31 December 2014: EUR 2.4 million). Of the future (gross) receivables from construction
contracts of EUR 2,332.1 million (31 December 2014: EUR 1,846.0 million), prepayments received of
EUR 2,052.5 million (31 December 2014: EUR 1,719.3 million) were capitalised. In addition,
prepayments received of EUR 237.6 million (31 December 2014: EUR 322.0 million) were reported
within other current non-financial liabilities.
Non-current assets
Changes in non-current assets are set out in the statement of changes in property, plant and
equipment and intangible assets. As of 30 September 2015, capital spending was valued at EUR 50.9
million, while depreciation/amortisation expense came to EUR 40.5 million. Capital spending
comprised capitalised development costs and particularly also the expansion of rotor blade production
capacity.
Deferred income tax assets primarily comprise unused tax losses which the Company expects to be
able to utilise against corporate and trade tax.
Statement of changes in property, plant and equipment and intangible assets
21
Current liabilities Current liabilities comprise trade payables of EUR 308.9 million and chiefly also prepayments received
of EUR 237.6 million. In addition, this item includes the corporate bond issued by Nordex SE. The
bond has a fixed coupon of 6.375% p.a. and a tenor of five years expiring on 12 April 2016. The
current bank borrowings of EUR 6.2 million refer to the utilisation of the loan granted by the European
Investment Bank.
Non-current liabilities Non-current liabilities comprise deferred income tax liabilities and primarily also the non-current portion
of provisions.
In addition, the Nordex Group has a syndicated multi-currency credit facility of EUR 550.0 million,
which was renewed on 24 February 2014 on substantially improved terms and expires on 30 June
2017.
Collateral was provided in the form of land changes as well as pledges on assets located on the land
in question. The borrowers and guarantors are Nordex SE and other main Nordex Group companies.
In addition, the Company has a long-term facility with the European Investment Bank of up to EUR
100.0 million to fund its research and development activities. The loan has a term of eight years from
the date on which it is drawn and is repaid in instalments. The borrower is Nordex Energy GmbH with
the main Nordex Group companies holding joint and several liability. In addition, the European
Investment Bank is providing collateral for the multi-currency guarantee facility. As of September 30,
2015, EUR 50.0 million had been drawn; of this, an amount of EUR 43.8 million is classified as non-
current.
All facilities/loans are subject to uniform financial and non-financial covenants such as equity ratio,
leverage, interest coverage and order receipts, compliance with which is confirmed in quarterly reports
to the banks. The banks may only terminate the existing facilities for good cause, which includes the
breach of the financial covenants.
Equity
Reference should be made to the Nordex Group’s statement of changes in equity (see page xxx) for a
breakdown of changes in equity.
22
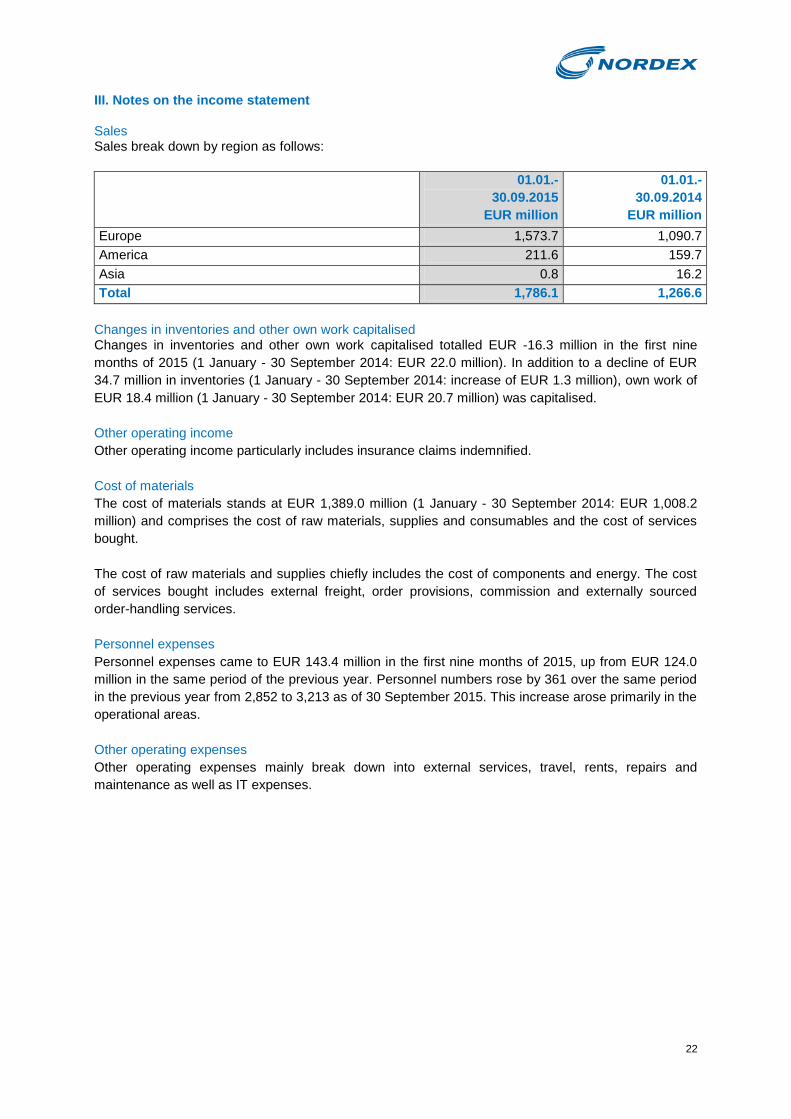
III. Notes on the income statement Sales Sales break down by region as follows:
01.01.-
30.09.2015
EUR million
01.01.-
30.09.2014
EUR million
Europe 1,573.7 1,090.7
America 211.6 159.7
Asia 0.8 16.2
Total 1,786.1 1,266.6
Changes in inventories and other own work capitalised Changes in inventories and other own work capitalised totalled EUR -16.3 million in the first nine
months of 2015 (1 January - 30 September 2014: EUR 22.0 million). In addition to a decline of EUR
34.7 million in inventories (1 January - 30 September 2014: increase of EUR 1.3 million), own work of
EUR 18.4 million (1 January - 30 September 2014: EUR 20.7 million) was capitalised.
Other operating income
Other operating income particularly includes insurance claims indemnified.
Cost of materials
The cost of materials stands at EUR 1,389.0 million (1 January - 30 September 2014: EUR 1,008.2
million) and comprises the cost of raw materials, supplies and consumables and the cost of services
bought.
The cost of raw materials and supplies chiefly includes the cost of components and energy. The cost
of services bought includes external freight, order provisions, commission and externally sourced
order-handling services.
Personnel expenses
Personnel expenses came to EUR 143.4 million in the first nine months of 2015, up from EUR 124.0
million in the same period of the previous year. Personnel numbers rose by 361 over the same period
in the previous year from 2,852 to 3,213 as of 30 September 2015. This increase arose primarily in the
operational areas.
Other operating expenses
Other operating expenses mainly break down into external services, travel, rents, repairs and
maintenance as well as IT expenses.

23
IV. Related parties disclosures
Jan Klatten, a member of Nordex SE’s Supervisory Board holds a 40% share of the Polish wind farm
company C&C Wind Sp. z o.o. via momentum infra 1 GmbH; the Nordex Group also holds a 40%
share in this company via Nordex Windpark Beteiligung GmbH. The majority of the shares in
momentum infra 1 GmbH, of which Mr. Klatten is also managing director, are held by momentum-
capital Verwaltungsgesellschaft mbH. The share was acquired by momentum infra 1 GmbH in a
market-wide tender process. Accordingly, a potential conflict of interests can be ruled out. As in the
previous year, there were no business transactions with Mr. Klatten or momentum infra 1 GmbH.
In addition, the Nordex Group holds a 75% interest in natcon7 GmbH via Nordex SE. Accordingly,
natcon7 GmbH is a non-consolidated affiliated company.
The transactions executed are set out in the following table.
Related parties Amount concerned
Amount concerned
Outstanding balances
Outstanding balances
Receivables (+)/ liabilities (–)
Receivables (+)/ liabilities (–)
01.01. - 30.09.2015
01.01. - 30.09.2014
30.09.2015 30.09.2014
EUR thousand EUR thousand EUR thousand EUR thousand
natcon7 GmbH 6,348 5,896 –2,688 –2,260
Other than this, there were not material transactions with related parties. V. Group segment report The Nordex Group is engaged in the development, production, servicing and marketing of wind power
systems. In addition to development and production, it provides preliminary project development
services to support marketing, acquires rights and creates the infrastructure required to construct wind
power systems at suitable locations. The Nordex Group is essentially a single-product company.
Segment reporting follows the internal reports submitted to the chief operating decision maker. Nordex
SE’s Management Board has been identified as the chief operating decision maker. Three reportable
segments which are based on the geographic markets and managed separately have been
designated. Nordex SE operates solely as a holding company and can therefore not be allocated to
any of the three segments.
Internal reporting is based on the accounting policies applied to the consolidated financial statements.
Segment sales comprise sales with third parties (external sales) as well as internal sales between the
individual regions (internal sales). The prices of deliveries between the individual segments are
determined on an arm’s length basis. External sales are assigned in accordance with the sales
destination. Segment earnings are consolidated on the basis of external sales. The following table
reconciles segment earnings with earnings before interest and taxes (EBIT) and segment assets with
consolidated assets.

24
Q1-Q3/2015 Q1-Q3/2014 Q1-Q3/2015 Q1-Q3/2014 Q1-Q3/2015 Q1-Q3/2014
EUR thousand EUR thousand EUR thousand EUR thousand EUR thousand EUR thousand
Sales 1,701,049 1,164,898 799 16,224 211,611 159,721
Depreciation/amortisation -38,943 -27,660 -127 -124 -704 -770
Interest income 1,011 978 109 124 2 3
Interest expenses -9,989 -8,888 -222 0 -97 -1,196
Income taxes -33,643 -14,998 -444 -70 661 -1,936
Earnings before interest and taxes (EBIT); segment earnings 141,451 58,084 -2,000 -1,364 -8,788 19,289
Investments in property, plant and equipment and intangible assets 48,446 47,526 54 35 1,904 118
Cash and cash equivalents 52,285 65,788 7,639 6,499 10,471 12,696
Europe Asia America
Q1-Q3/2015 Q1-Q3/2014 Q1-Q3/2015 Q1-Q3/2014 Q1-Q3/2015 Q1-Q3/2014
EUR thousand EUR thousand EUR thousand EUR thousand EUR thousand EUR thousand
Sales 0 0 -127,313 -74,199 1,786,146 1,266,644
Depreciation/amortisation -689 -1,166 0 0 -40,463 -29,720
Interest income 2,926 3,004 -2,291 -2,520 1,757 1,589
Interest expenses -8,215 -9,542 2,291 2,520 -16,232 -17,106
Income taxes -3,679 2,831 0 0 -37,105 -14,173
Earnings before interest and taxes (EBIT); segment earnings -6,888 14,160 -26,140 -30,226 97,635 59,943
Investments in property, plant and equipment and intangible assets 528 105 0 0 50,932 47,784
Cash and cash equivalents 303,701 226,978 0 0 374,096 311,961
Group totalCentral units Consolidation
Group segment report
The business units Nordex Pakistan (Private) Ltd., Nordex Singapore Equipment Private Ltd. and
Nordex Singapore Service Private Ltd. have been assigned to the Europe segment in 2015; the
figures for the previous year have been restated accordingly.
VI. Events after the interim report
On 4 October 2015, the Management Board of Nordex SE decided with the approval of the
Supervisory Board to acquire Corporación Acciona Windpower S.L. (Acciona Windpower) from
Acciona S.A. (Acciona). Under the terms of the business combination agreement, Acciona will be
transferring the wind power business which it operates directly or indirectly via its 100% subsidiary
Acciona Windpower to Nordex SE in the form of a combined cash/non-cash capital contribution. In
return, Nordex SE will be utilising the capital authorised in accordance with its articles of incorporation
to issue 16.1 million new shares subject to the exclusion of shareholders’ pre-emptive subscription
rights to grant Acciona new shares at an issue amount of EUR 26.00 per share. In addition, Acciona is
to receive a cash payment of EUR 366.4 million adjusted for an amount equalling the net financial
liabilities held by Acciona Windpower. The agreed purchase price before adjustments for net financial
liabilities stands at EUR 785.0 million. Execution of the business combination agreement including the
issue of new share capital is expected for the first quarter of 2016 subject to the discharge of the
customary conditions precedent as provided for in the agreement (particularly antitrust clearance).
Hamburg, November 2015
L. Krogsgaard B. Schäferbarthold
Chairman of the Member of the
Management Board Management Board
25
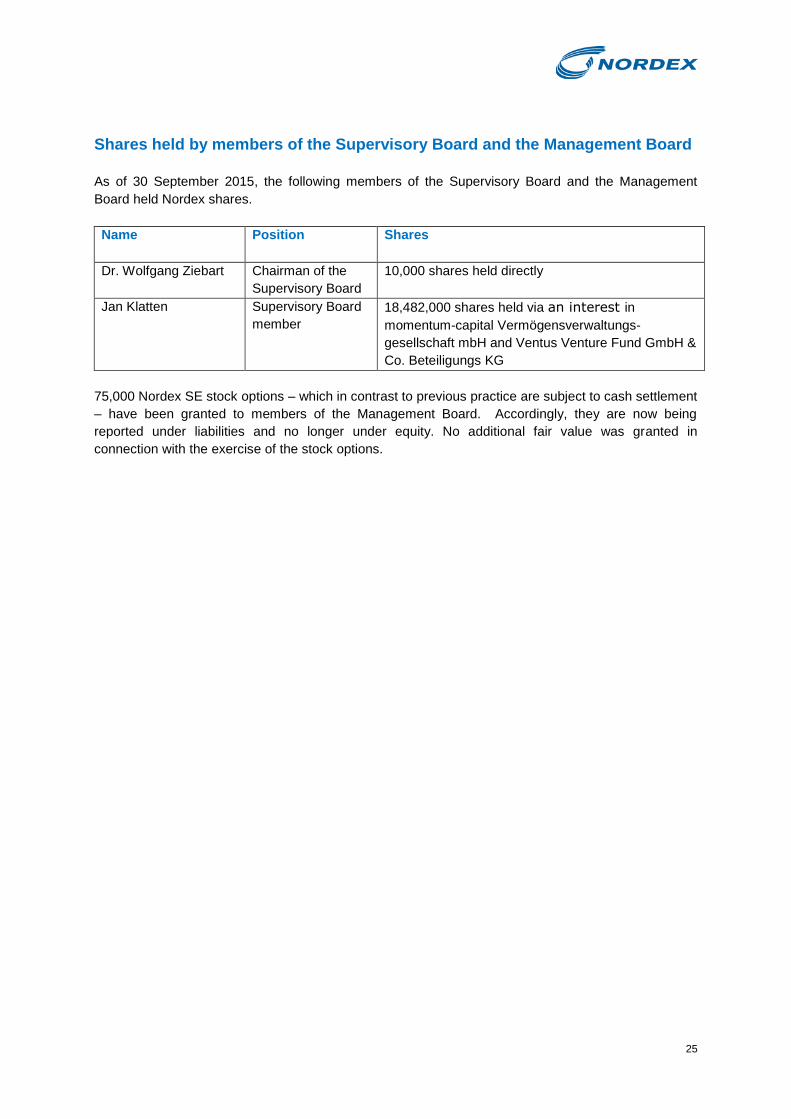
Shares held by members of the Supervisory Board and the Management Board
As of 30 September 2015, the following members of the Supervisory Board and the Management
Board held Nordex shares.
Name
Position Shares
Dr. Wolfgang Ziebart
Chairman of the
Supervisory Board
10,000 shares held directly
Jan Klatten Supervisory Board
member
18,482,000 shares held via an interest in
momentum-capital Vermögensverwaltungs-
gesellschaft mbH and Ventus Venture Fund GmbH &
Co. Beteiligungs KG
75,000 Nordex SE stock options – which in contrast to previous practice are subject to cash settlement
– have been granted to members of the Management Board. Accordingly, they are now being
reported under liabilities and no longer under equity. No additional fair value was granted in
connection with the exercise of the stock options.
26
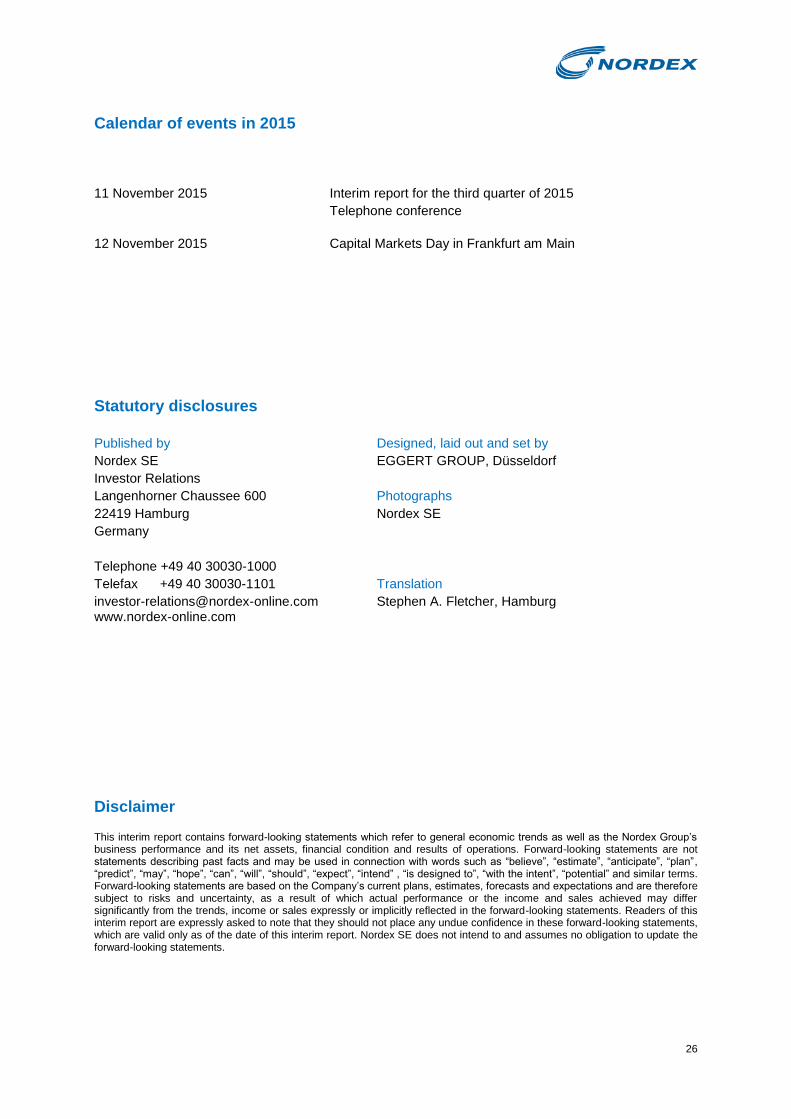
Calendar of events in 2015
11 November 2015 Interim report for the third quarter of 2015
Telephone conference
12 November 2015 Capital Markets Day in Frankfurt am Main
Statutory disclosures
Published by Designed, laid out and set by
Nordex SE EGGERT GROUP, Düsseldorf
Investor Relations
Langenhorner Chaussee 600 Photographs
22419 Hamburg Nordex SE
Germany
Telephone +49 40 30030-1000
Telefax +49 40 30030-1101 Translation
[email protected] Stephen A. Fletcher, Hamburg www.nordex-online.com
Disclaimer
This interim report contains forward-looking statements which refer to general economic trends as well as the Nordex Group’s business performance and its net assets, financial condition and results of operations. Forward-looking statements are not statements describing past facts and may be used in connection with words such as “believe”, “estimate”, “anticipate”, “plan”, “predict”, “may”, “hope”, “can”, “will”, “should”, “expect”, “intend” , “is designed to”, “with the intent”, “potential” and similar terms. Forward-looking statements are based on the Company’s current plans, estimates, forecasts and expectations and are therefore subject to risks and uncertainty, as a result of which actual performance or the income and sales achieved may differ significantly from the trends, income or sales expressly or implicitly reflected in the forward-looking statements. Readers of this interim report are expressly asked to note that they should not place any undue confidence in these forward-looking statements, which are valid only as of the date of this interim report. Nordex SE does not intend to and assumes no obligation to update the forward-looking statements.