nordex group nordex se nine-month figures...
TRANSCRIPT
|
9M-figures 2019 | 13 Nov 2019
Nordex Group
Nordex SE – Nine-month figures 2019
Conference Call, 13 November 2019

|
9M-figures 2019 | 13 Nov 2019
Disclaimer
2
› All financial figures within this presentation are unaudited.
› This presentation was produced in November 2019 by Nordex SE solely for use as a source of general information regarding the economic circumstances and status of Nordex SE. It does not constitute an offer for the sale of securities or an invitation to buy or otherwise acquire securities in the Federal Republic of Germany or any other jurisdiction. In particular it is not intended to be an offer, an investment recommendation or a solicitation of an offer to anyone in the U.S., Canada, Japan and Australia or any other jurisdiction. This presentation is confidential. Any reproduction or distribution of this presentation, in whole or in part, without Nordex SE’s prior written consent is expressly prohibited.
› This presentation contains certain forward-looking statements relating to the business, financial performance and results of Nordex SE and/or the industry in which Nordex SE operates, these statements are generally identified by using phrases such “aim”, “anticipate”, “believe”, “estimate”, “expect”, “forecast”, “guidance”, “intend”, “objective”, “plan”, “predict”, “project”, and “will be” and similar expressions. Although we believe the expectations reflected in such forward-looking statements are based upon reliable assumptions, they are prepared as up-to-date and are subject to revision in the future. We undertake no responsibility to update any forward-looking statement. There is no assurance that our expectations will be attained or that any deviations may not be material. No representation or warranty can be given that the estimates, opinions or assumptions made in, or referenced by, this presentation will prove to be accurate.

|
9M-figures 2019 | 13 Nov 2019
Agenda
3
Executive summary José Luis Blanco
Markets and orders Patxi Landa
Financials Christoph Burkhard
Operations and technology José Luis Blanco
Guidance 2019 José Luis Blanco
Q&As All
Key takeaways José Luis Blanco

|
9M-figures 2019 | 13 Nov 2019
Increased activity in Q3/2019 according to expectations
4 Executive summary
9M/2019 RESULTS
Sales
EUR 1,943m
EBITDA margin
3.1%
Working capital ratio
-5.2%
› Guidance for full year 2019 confirmed.
› Q3/2019 another strong quarter with order intake of 1.7 GW (Q3/2018: 974 MW).
› Around 50 percent of Q3 order intake volume accounts for latest turbine generation Delta4000.
› Delta4000 product portfolio with meanwhile five different product types covering all customer requirements.
› On October 8th cash capital increase of EUR 99.0m through private placement to anchor shareholder Acciona.
|
9M-figures 2019 | 13 Nov 2019
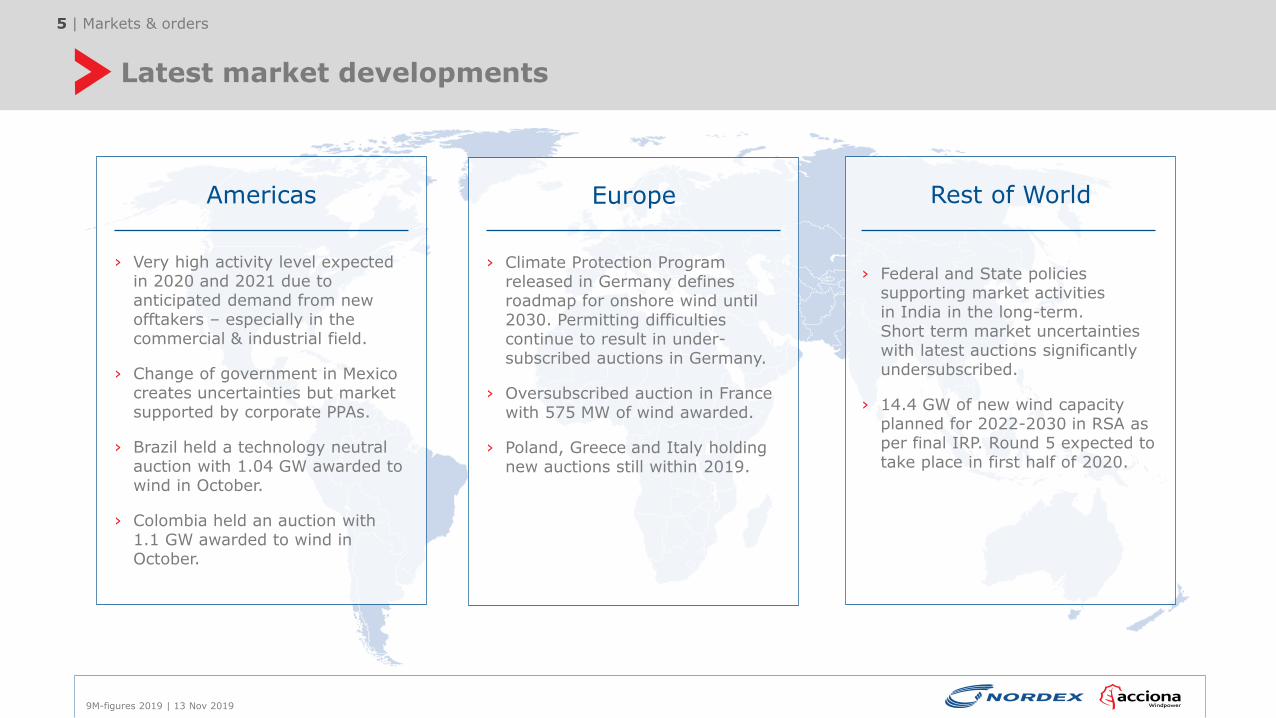
Latest market developments
5 Markets & orders
Europe
› Climate Protection Program released in Germany defines roadmap for onshore wind until 2030. Permitting difficulties continue to result in under-subscribed auctions in Germany.
› Oversubscribed auction in France with 575 MW of wind awarded.
› Poland, Greece and Italy holding new auctions still within 2019.
Americas
› Very high activity level expected in 2020 and 2021 due to anticipated demand from new offtakers – especially in the commercial & industrial field.
› Change of government in Mexico creates uncertainties but market supported by corporate PPAs.
› Brazil held a technology neutral auction with 1.04 GW awarded to wind in October.
› Colombia held an auction with 1.1 GW awarded to wind in October.
Rest of World
› Federal and State policies supporting market activities in India in the long-term. Short term market uncertainties with latest auctions significantly undersubscribed.
› 14.4 GW of new wind capacity planned for 2022-2030 in RSA as per final IRP. Round 5 expected to take place in first half of 2020.

|
9M-figures 2019 | 13 Nov 2019
Order intake 9M/2019
6 Markets & orders
Order intake turbine* (in MW) Order intake turbine* by regions (in %)
› Strong order intake in 9M/2019: EUR 3,314m (EUR 2,343m in previous year period)
thereof in Q3/2019: EUR 1,199m (EUR 733m in Q3/2018)
› Stable ASP of EUR 0.70m/MW for 9M/2019
› Largest order volume coming from USA, Brazil, Sweden and Spain in 9M/2019
› 40 percent of order intake accounts for new Delta4000 generation in first nine months
› Order intake received from 21 different countries showing Nordex global footprint
9M/2018 9M/2019
3,070
4,742
+54%
13%
38%
18%
17%
34%
32%45%
9M/2019
3%
9M/2018
North AmericaEurope Latin America RoW
*Group segment „Projects“

|
9M-figures 2019 | 13 Nov 2019
Further growth of service business
7 Markets & orders
Service sales (in EUR m) Comments
› Service sales share amounted to 14.8% of group sales in 9M/2019
› Service EBIT margin of for 17.6% in first nine months 2019
› 97.5% average availability of WTG under service
› Strong Service order backlog of EUR around 2.5bn
287.1
9M/2018 9M/2019
258.4
+11%

|
9M-figures 2019 | 13 Nov 2019
Combined order backlog of EUR 8.1bn as of 9M/2019
8 Markets & orders
Order backlog turbines (EUR m) Order backlog service (EUR m)
› Strong increase in turbine order backlog to EUR 5,651m at the end of 9M/2019 due to continuously high order intake over the last quarters
› Order backlog reflects Nordex geographical footprint on focus markets: Europe (43%), North America (22%), Latin America (22%), RoW (13%)
› Increasing number of wind turbines under service: 7,791 – corresponding to 19.7 GW at the end of 9M/2019
9M/2018 9M/2019
5,651
3,140
+80%
9M/20199M/2018
2,477
2,151
+15%

|
9M-figures 2019 | 13 Nov 2019
Income statement 9M/2019
9 Financials
Comments
› Q3/2019 sales figures of EUR 952m reflecting expected high execution
› High total revenues signal further increasing sales in Q4/2019
› Further normalization of gross margin as anticipated
› EBITDA margin in line with increasing business activities in Q3/2019
› PPA depreciation amounted to EUR 18.3m in 9M/2019 (EUR 45.5m in 9M/2018)
in EUR m 9M/2019 9M/2018 abs. change
Sales 1,943.0 1,772.9 170.1
Total revenues 2,519.7 1,753.3 766.4
Cost of materials -2,004.3 -1,281.5 -722.8
Gross profit 515.4 471.8 43.6
Personnel costs -264.9 -238.1 -26.8
Other operating (expenses)/income -190.3 -162.3 -28.0
EBITDA 60.2 71.4 -11.2
Depreciation/amortization -102.4 -110.4 8.0
EBIT -42.2 -39.0 -3.2
Net profit -76.5 -51.8 -47.7
Gross margin* 26.5% 26.6%
EBITDA margin 3.1% 4.0%
EBIT margin w/o PPA -1.2% 0.4%
*Gross profit in relation to sales
|
9M-figures 2019 | 13 Nov 2019
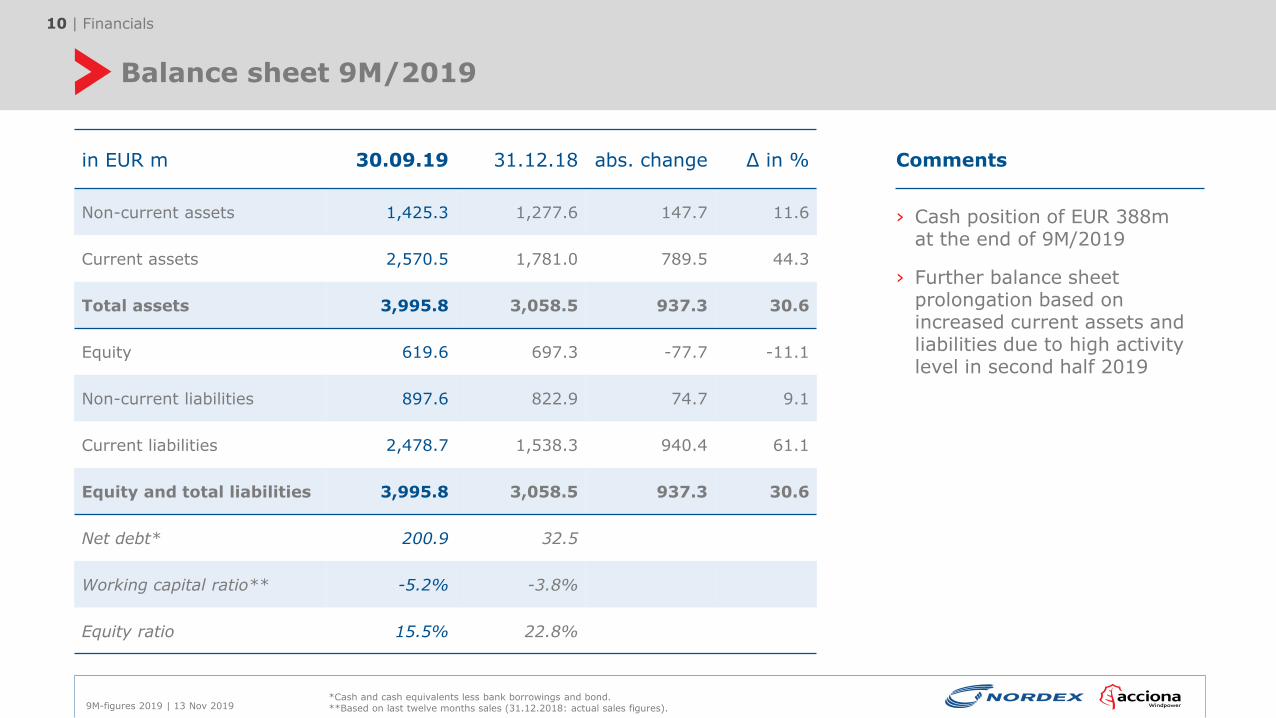
Balance sheet 9M/2019
10 Financials
Comments
› Cash position of EUR 388m at the end of 9M/2019
› Further balance sheet prolongation based on increased current assets and liabilities due to high activity level in second half 2019
in EUR m 30.09.19 31.12.18 abs. change Δ in %
Non-current assets 1,425.3 1,277.6 147.7 11.6
Current assets 2,570.5 1,781.0 789.5 44.3
Total assets 3,995.8 3,058.5 937.3 30.6
Equity 619.6 697.3 -77.7 -11.1
Non-current liabilities 897.6 822.9 74.7 9.1
Current liabilities 2,478.7 1,538.3 940.4 61.1
Equity and total liabilities 3,995.8 3,058.5 937.3 30.6
Net debt* 200.9 32.5
Working capital ratio** -5.2% -3.8%
Equity ratio 15.5% 22.8%
*Cash and cash equivalents less bank borrowings and bond. **Based on last twelve months sales (31.12.2018: actual sales figures).

|
9M-figures 2019 | 13 Nov 2019
Working capital development 9M/2019
11 Financials
Working capital ratio (in % of sales) Working capital development (in EUR m)*
-3.8
5.4
Q2/2019
Q3/2018
Q4/2018
Q1/2019
Q3/2019
-1.5*
-4.7-5.2
› Working capital ratio remains on low level due to consistently high order intake
› Increase in receivables due to strong sales volume in Q3/2019
› Increase in payables corresponds to an ongoing high activity level
-117-136
175
318
Receiva-bles
Q2/2019
277
Prepay-ments
Inven-tories
153
Pay-ables
Q3/ 2019
FY guidance 2019 < 2%
*Based on last twelve months sales
|
9M-figures 2019 | 13 Nov 2019
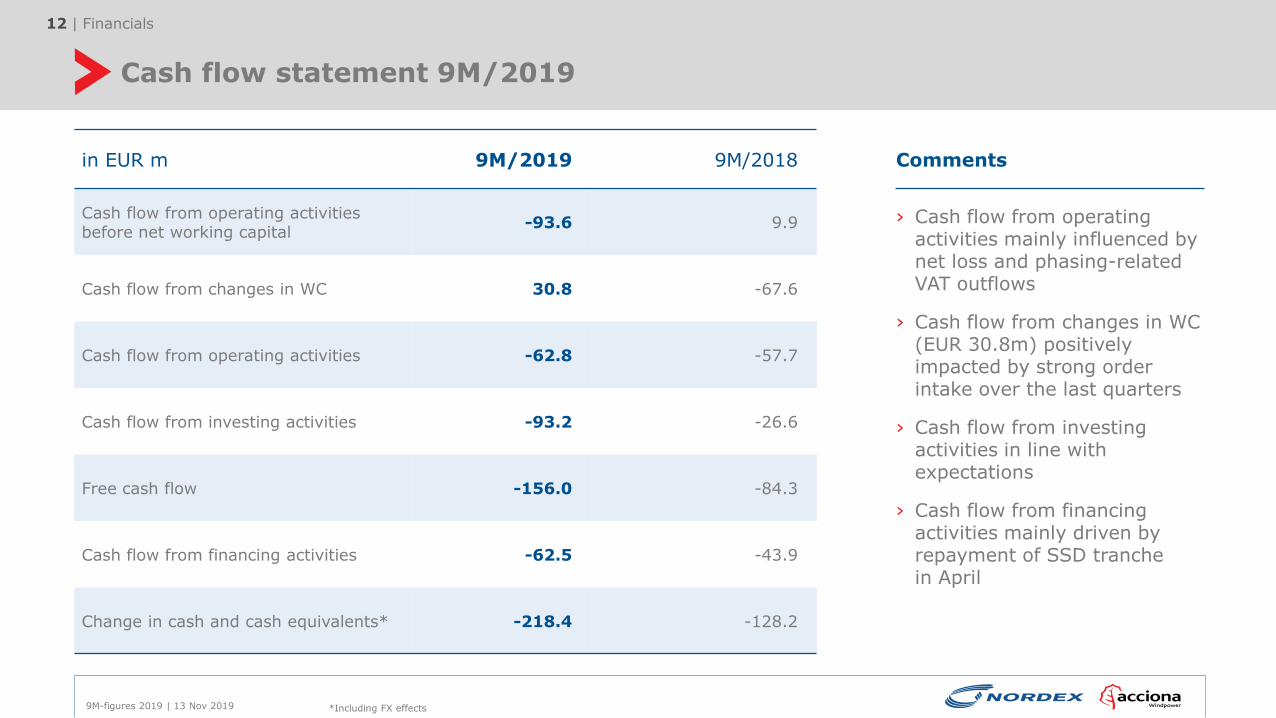
Cash flow statement 9M/2019
12 Financials
Comments
› Cash flow from operating activities mainly influenced by net loss and phasing-related VAT outflows
› Cash flow from changes in WC (EUR 30.8m) positively impacted by strong order intake over the last quarters
› Cash flow from investing activities in line with expectations
› Cash flow from financing activities mainly driven by repayment of SSD tranche in April
in EUR m 9M/2019 9M/2018
Cash flow from operating activities before net working capital
-93.6 9.9
Cash flow from changes in WC 30.8 -67.6
Cash flow from operating activities -62.8 -57.7
Cash flow from investing activities -93.2 -26.6
Free cash flow -156.0 -84.3
Cash flow from financing activities -62.5 -43.9
Change in cash and cash equivalents* -218.4 -128.2
*Including FX effects
|
9M-figures 2019 | 13 Nov 2019
Total investments 9M/2019
13 Financials
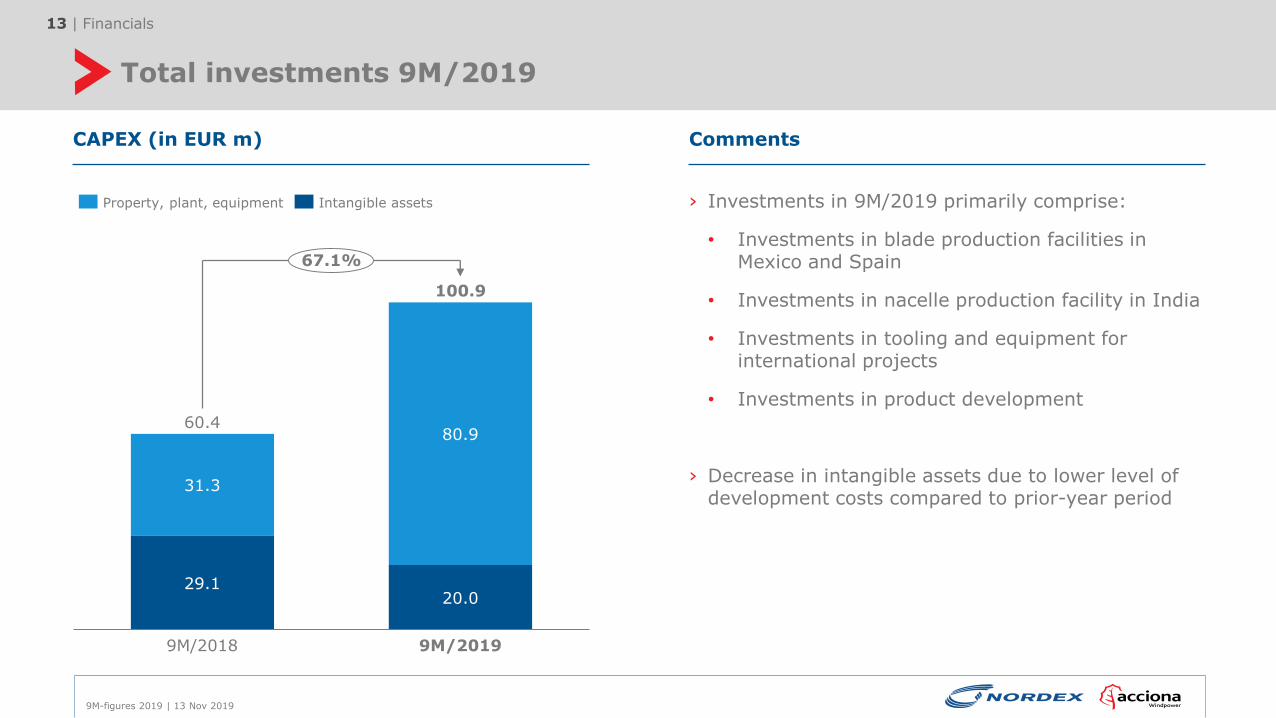
CAPEX (in EUR m) Comments
› Investments in 9M/2019 primarily comprise:
• Investments in blade production facilities in Mexico and Spain
• Investments in nacelle production facility in India
• Investments in tooling and equipment for international projects
• Investments in product development
› Decrease in intangible assets due to lower level of development costs compared to prior-year period
9M/2018
31.3
20.029.1
80.9
9M/2019
100.9
60.4
67.1%
Property, plant, equipment Intangible assets
|
9M-figures 2019 | 13 Nov 2019
Capital structure 9M/2019
14 Financials
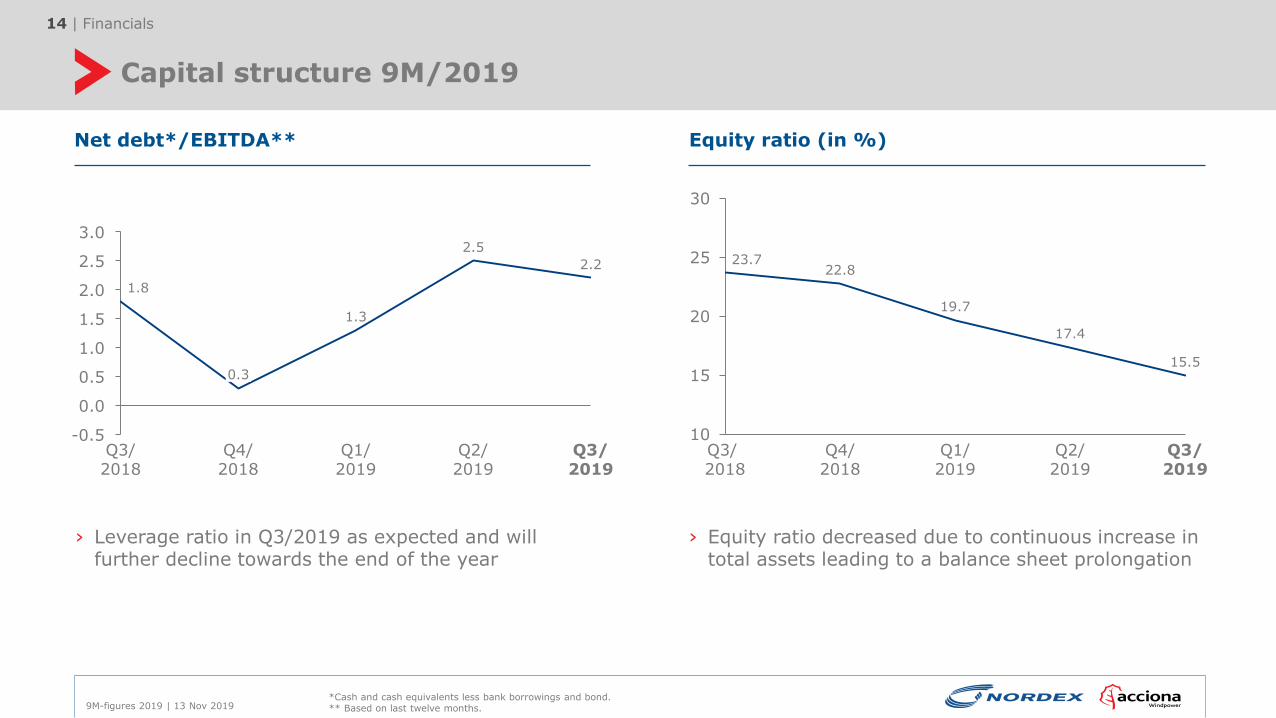
Net debt*/EBITDA** Equity ratio (in %)
› Leverage ratio in Q3/2019 as expected and will further decline towards the end of the year
› Equity ratio decreased due to continuous increase in total assets leading to a balance sheet prolongation
1.0
1.5
-0.5
2.5
0.0
2.0
0.5
3.0
1.8
Q3/2019
Q3/2018
0.3
Q4/2018
1.3
Q1/2019
2.5
Q2/2019
2.2
10
15
20
25
30
Q3/ 2018
Q4/2018
23.7
19.7
22.8
Q1/2019
17.4
Q2/2019
15.5
Q3/2019
*Cash and cash equivalents less bank borrowings and bond. ** Based on last twelve months.

|
9M-figures 2019 | 13 Nov 2019
Operations 9M/2019
15 Operations & technology
Installations (MW) Production
› Total installations of 476 WTGs in 16 countries in the first nine months 2019: 47% Europe, 24% Latin America and 29% North America
› Output turbines amounts to 920 units in 9M/2019: 348 GER, 357 ESP, 46 BRA, 150 IND and 19 ARG
› Inhouse blade production of 1,093 units in 9M/2019: 328 GER, 561 ESP, 24 MEX and 180 IND
› Outscourced blade production of 1,695 units in 9M/2019
1,719
9M/2018 9M/2019
1,565
-9%
3,095
9M/2018 9M/2019
1,736
+78%
Turbine assembly (MW)
648
1.093
9M/2018 9M/2019
+69%
Blade production (#)
|
9M-figures 2019 | 13 Nov 2019
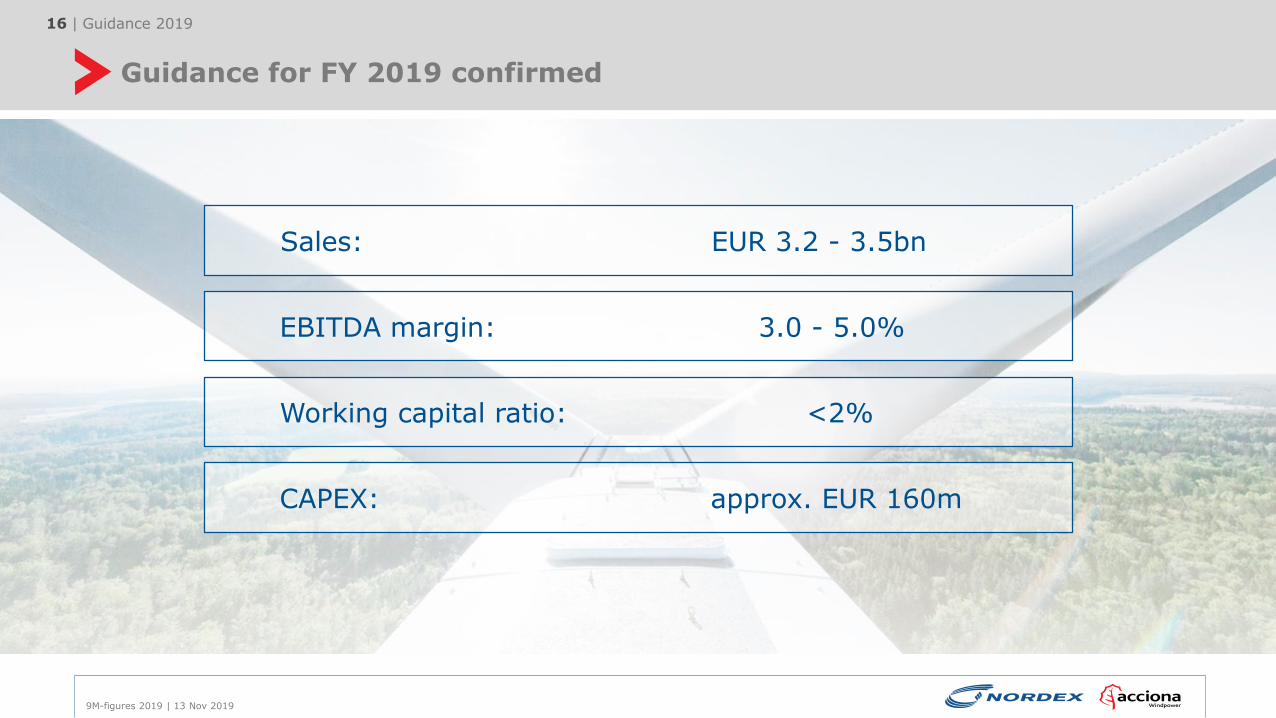
Guidance for FY 2019 confirmed
16 Guidance 2019
Working capital ratio: <2%
Sales: EUR 3.2 - 3.5bn
EBITDA margin: 3.0 - 5.0%
CAPEX: approx. EUR 160m

|
9M-figures 2019 | 13 Nov 2019
Time for your questions
17
Questions
Answers
Q&As

|
9M-figures 2019 | 13 Nov 2019
Key takeaways
18 Key takeaways
Nordex confirming guidance for 2019.
Back-end loaded year showing high activity level in the fourth quarter.
Full year 2019 with strong seasonal pattern is developing as anticipated.
Order intake will remain on a good level driven by further demand for Delta4000 product portfolio.

|
9M-figures 2019 | 13 Nov 2019
Thank you for your attention
19

|
9M-figures 2019 | 13 Nov 2019
Financial calendar 2020
20
2020* Event
9 March Publication of preliminary figures FY 2019
24 March Publication of Annual Report 2019
11 May Interim Statement Q1 2020
10 June Annual General Meeting (Rostock)
13 August Interim Report H1 2020
12 November Interim Statement Q3 2020
*Preliminary dates

|
9M-figures 2019 | 13 Nov 2019
Contact details
21
IF YOU HAVE ANY QUESTIONS PLEASE
CONTACT THE INVESTOR RELATIONS TEAM:
Felix Zander
Tobias Vossberg
Rolf Becker
Nordex SE
Langenhorner Chaussee 600
22419 Hamburg
Germany
Phone: +49-40-30030-1000
Email: [email protected]
Web: www.nordex-online.com