equalization aid emily koczela, brown deer business manager karen kucharz robbe, school financial...
TRANSCRIPT

Equalization AidEmily Koczela,
Brown Deer Business ManagerKaren Kucharz Robbe,
School Financial Services Consultant
Department of Public Instruction
January 23,2014
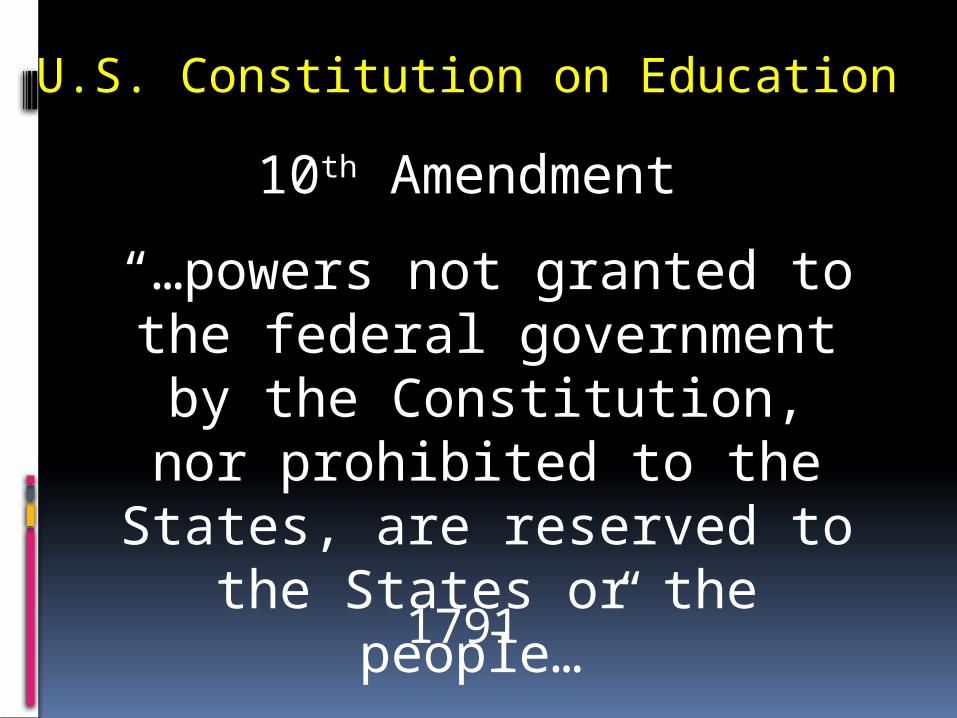
U.S. Constitution on Education
10th Amendment
“…powers not granted to the federal government by
the Constitution, nor prohibited to the States, are
reserved to the States or the people…”
1791

1848 Wisconsin Constitution
“Each town and city shall be required to raise by tax,
annually, for the support of common schools therein……”
Article X, Section 4.
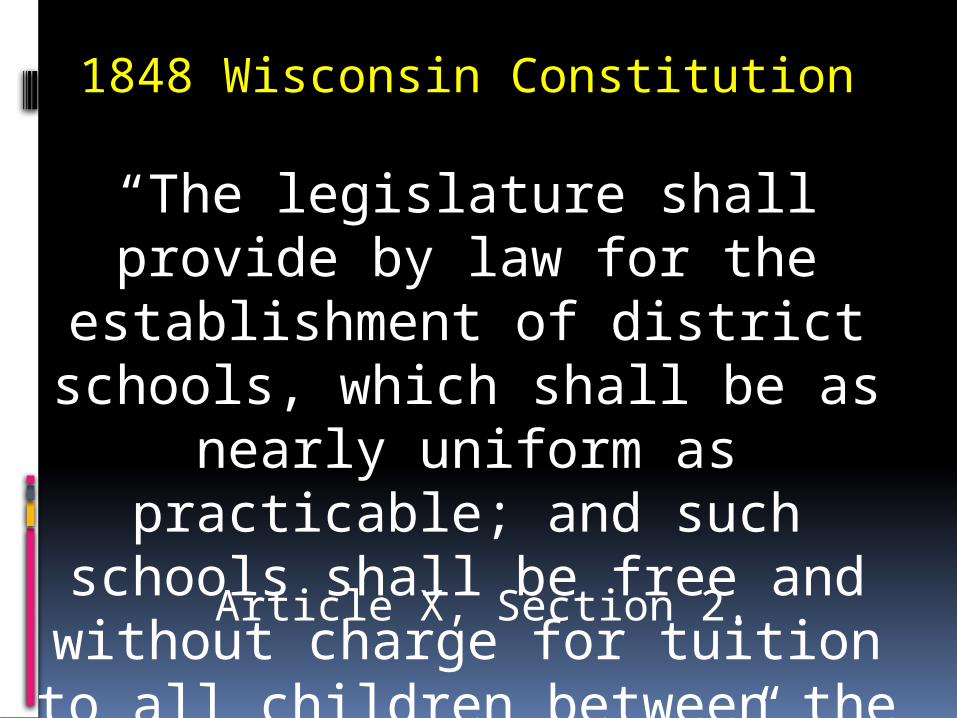
1848 Wisconsin Constitution
“The legislature shall provide by law for the establishment of
district schools, which shall be as nearly uniform as practicable;
and such schools shall be free and without charge for tuition to all children between the ages of
4 and 20.”Article X, Section 2.

Basic Framework
State ResponsibilityDistrict Schools
As Nearly Uniform as PracticableFree
Local Tax

Supreme Court
Uniformity goes to the “character of education,”
not to the total amount spent.
However, funding “character” cannot result in too great of a
disparity of cash.

Modern-Day Wisconsin
In Wisconsin, the primary funding source for public
schools is the property tax, but we know the property values
across the state are not uniform.
The challenge is defining “uniformity.”

$1,000,000
$2,000,000
$3,000,000
$4,000,000
$5,000,000
10 mil tax(Example: $1,000,000 x
.010)
$10,000
$20,000
$30,000
$40,000
$50,000
What is “uniformity”?
$20,000
$20,000
$20,000
$20,000
$20,000$30,00
0$40,000
$50,000
$60,000
$70,000
(state aid is the same?)

$1,000,000
$2,000,000
$3,000,000
$4,000,000
$5,000,000
What is “uniformity”?
$10,000
$20,000
$30,000
$40,000
$50,000$20,00
0$10,000
$ 0
$-10,000
$-20,000$30,00
0$30,000
$30,000
$30,000
$30,000
(“Robin Hood” principle with local tax?)

NOT LEGAL
Buse vs. Smith(1976)
State cannot “recapture” from local tax base.

$1,000,000
$2,000,000
$3,000,000
$4,000,000
$5,000,000
What is “uniformity”?
$10,000
$20,000
$30,000
$40,000
$50,000$40,00
0$30,000
$20,000
$10,000
$ 0 $50,00
0$50,000
$50,000
$50,000
$50,000
(state aid is related to local value)
Starting to Come Together
More local property wealth means
less aid from the state.

$1,000,000
$2,000,000
$3,000,000
$4,000,000
$5,000,000
Number of Children to Educate
2010 10 10 10$100,000
$400,000 $250,000
$300,000
$200,000
Notice how the tax base per child changes after incorporating the number of children to
educate.

State Formula
Takes into account BOTH property tax base AND number
of children to educate.

2013-14 General Aid*
Equalization $4,295,238,507 98.03%
Special Adjustment
$18,167,259 0.41%
Inter-District $22,239,425 0.51%
Intra-District $45,947,412 1.05%
Total General Aid
$4,381,592,603 100%
Most districts receive only Equalization Aid.
* Prior to Choice/Charter deductions.

16
Property Value per Member

17
Property Value per Member

18
Property Value per Member
Equalization Aid
Property Tax Base

Equalization Aid
What about two-thirds funding?Two-thirds NEVER meant that each district would get 66.7% state aid!
It was a STATE computation that added together several statewide revenue sources, (all local levies, state and categorical aid and levy credit) and multiplied that number by 66.7%. The result of this equation was put into the formula.
Two-thirds is no longer law.

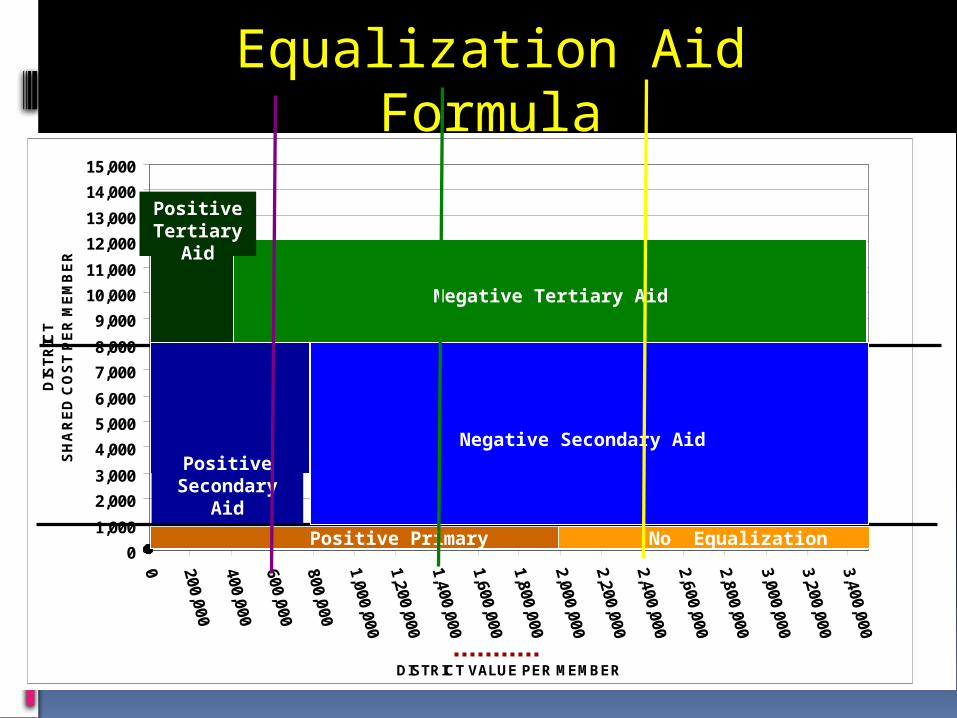
Equalization Aid Formula
A cost-sharing formula that incorporates:
Property Value Number of Students to Educate Spending

General Fund Shared Cost
Local Property
Tax43%
Local Misc. Receipts
1%Other Misc.3%
State General
Aid44%
Categor-ical
State Aid3%
Federal Aid5%

Debt Service Funds Shared Cost
Local Property
Tax98%
Misc Local Revenue
2%

Total General Fund (Fund 10) Expenditures
+ (plus)Total Debt Service Funds (Funds
38 & 39) Expenditures
- (minus)all local misc. revenue, grant
revenue,and categorical aid.
Result is “Shared Cost”
District Factor – Shared Cost

District Factor - Wealth
Property tax base is used to determine district wealth and
ability to support district expenditures.
Uses Equalized Valuation or Fair Market Value.
(NOT Assessed Value)

District Factor – Membership
F.T.E. = full-time equivalent2 halftime kindergarten students = 1 F.T.E.
Average of 3rd Friday F.T.E. - September
2nd Friday F.T.E. - January
+ Summer School F.T.E
Summer School = 48,600 minutes of instruction = 1 F.T.E.

The Computation
…….is actually 3 individual computations……..
The results of all 3 are summed to get the district’s total aid.

3 State Factors
Cost CeilingsGuaranteed Valuations Per Member
Amount of Money to Distribute

3 District Factors
Spending (“Shared Cost”)Wealth/Property Tax BaseStudents (“Membership”)

0
1,000
2,000
3,000
4,000
5,000
6,000
7,000
8,000
9,000
10,000
11,000
12,000
13,000
14,000
15,000
0 200,000
400,000
600,000
800,000
1,000,000
1,200,000
1,400,000
1,600,000
1,800,000
2,000,000
2,200,000
2,400,000
2,600,000
2,800,000
3,000,000
3,200,000
3,400,000
DISTRICT VALUE PER MEMBER
DIS
TR
ICT
SH
AR
ED
CO
ST
PE
R M
EM
BE
R
Positive Primary Aid
Positive Secondary
Aid
Positive Tertiary
Aid
District Value per Member
10% 90%
75%25%
50%50%
Equalization Aid Formula

Sample District ResultsPer-Pupil Funding
DISTRICT10% x $1,000
= $100
25% x $7,000
=$1,750
50% x $4,000
=$2,000
$3,850
STATE90% x $1,000
= $900
75% x $7,000
= $5,250
50% x $4,000
= $2,000
$8,150
$3,850 + $8,150 = $12,000
0
1,000
2,000
3,000
4,000
5,000
6,000
7,000
8,000
9,000
10,000
11,000
12,000
13,000
14,000
15,000
0 200,000
400,000
600,000
800,000
1,000,000
1,200,000
1,400,000
1,600,000
1,800,000
2,000,000
2,200,000
2,400,000
2,600,000
2,800,000
3,000,000
3,200,000
3,400,000
DISTRICT VALUE PER MEMBER
DIS
TR
ICT
SH
AR
ED
CO
ST
PE
R M
EM
BE
R
Positive Primary Aid
Positive Secondary
Aid
Positive Tertiary
Aid
Negative Tertiary Aid
Negative Secondary Aid
No Equalization Aid
Equalization Aid Formula

Where Can I Find This Grid For My District?
“2013-14 Equalization Aid Formula Position”
http://sfs.dpi.wi.gov/sfs_buddev_eq

0
1,000
2,000
3,000
4,000
5,000
6,000
7,000
8,000
9,000
10,000
11,000
12,000
13,000
14,000
15,000
0 200,000
400,000
600,000
800,000
1,000,000
1,200,000
1,400,000
1,600,000
1,800,000
2,000,000
2,200,000
2,400,000
2,600,000
2,800,000
3,000,000
3,200,000
3,400,000
DISTRICT VALUE PER MEMBER
DIS
TR
ICT
SH
AR
ED
CO
ST
PE
R M
EM
BE
R
Positive Primary Aid
Positive Secondary
Aid
Positive Tertiary
Aid
District Value per Member
Negative Tertiary Aid
Negative Secondary Aid
No Equalization Aid
Equalization Aid Formula

Watch Value Per Member Over Time

Where Can I Find Value Per Member Over Time
For My District?
http://sfs.dpi.wi.gov/sfs_buddev_valuation
“School Aid Property Valuation” (Used in the Equalization Aid
Formula)

0
1,000
2,000
3,000
4,000
5,000
6,000
7,000
8,000
9,000
10,000
11,000
12,000
13,000
14,000
15,000
0 200,000
400,000
600,000
800,000
1,000,000
1,200,000
1,400,000
1,600,000
1,800,000
2,000,000
2,200,000
2,400,000
2,600,000
2,800,000
3,000,000
3,200,000
3,400,000
DISTRICT VALUE PER MEMBER
DIS
TR
ICT
SH
AR
ED
CO
ST
PE
R M
EM
BE
R
Positive Primary Aid
Positive Secondary
Aid
Positive Tertiary
Aid
District Value per Member
Negative Tertiary Aid
Negative Secondary Aid
No Equalization Aid
Equalization Aid Formula
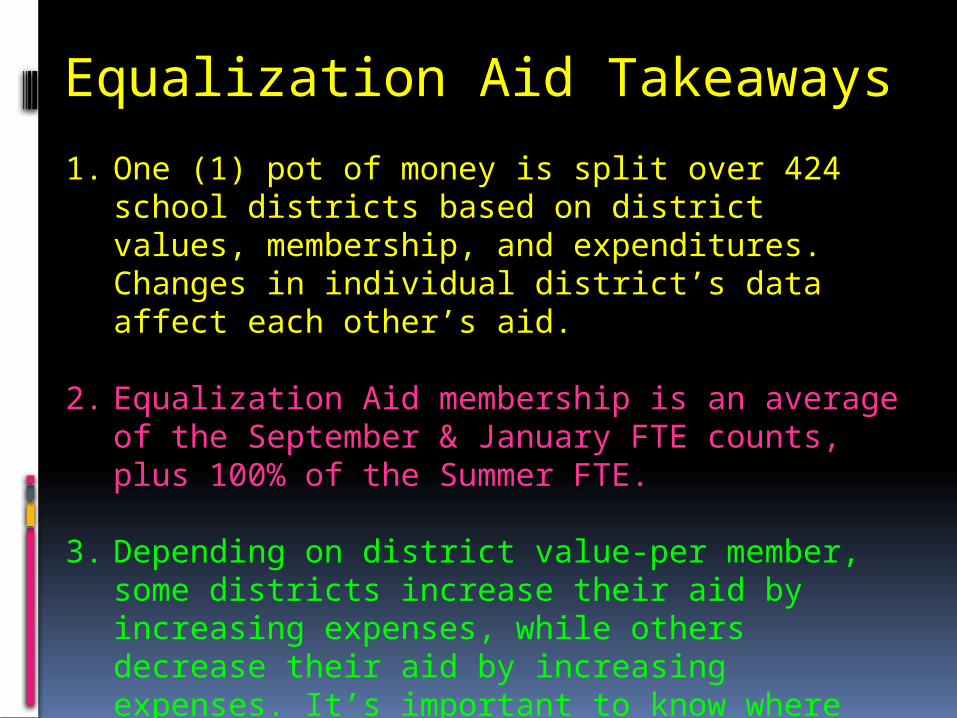
Equalization Aid Takeaways
1. One (1) pot of money is split over 424 school districts based on district values, membership, and expenditures. Changes in individual district’s data affect each other’s aid.
2. Equalization Aid membership is an average of the September & January FTE counts, plus 100% of the Summer FTE.
3. Depending on district value-per member, some districts increase their aid by increasing expenses, while others decrease their aid by increasing expenses. It’s important to know where your district is in the formula.
4. Be aware of what is happening to your district over time.

Equalization Aid
Knowing where your district is in the formula will help you better explain
how changes in local finances might affect your state aid.
What if we
underspend
our budget?
How does
that affect
our aid?
If we go to referendum, how will our aid
change?

Thanks to WASB, WASDA and WASBO for the opportunity to speak to you
today!
* * *DPI School Financial Services
Homepage
WASBO Homepage
…..whew! you made it!....
http://dpi.wi.gov/sfs/index.html
http://www.wasbo.com/
Please feel free to stop by the DPI booth if you’d like to chat more about your
specific district data!
We’ll have the 2013-14 Equalization Aid and 2013-14 Revenue Limit data available so you can continue the
conversation with us……..
See you later!

0
1,000
2,000
3,000
4,000
5,000
6,000
7,000
8,000
9,000
10,000
11,000
12,000
13,000
14,000
15,000
0 200,000
400,000
600,000
800,000
1,000,000
1,200,000
1,400,000
1,600,000
1,800,000
2,000,000
2,200,000
2,400,000
2,600,000
2,800,000
3,000,000
3,200,000
3,400,000
DISTRICT VALUE PER MEMBER
DIS
TR
ICT
SH
AR
ED
CO
ST
PE
R M
EM
BE
R
Positive Primary Aid
Positive Secondary
Aid
Positive Tertiary
Aid
District Value per Member
10% 90%
75%25%
50%50%Negative Tertiary Aid
Negative Secondary Aid
No Equalization Aid
Equalization Aid Formula