episode 3 - eurocontrol · episode 3 d5.3.5-01 - separation management in the tma plan version :...
TRANSCRIPT

Episode 3
D5.3.5-01 - Separation Management in the TMA Plan
Version : 1.00
Page 1 of 69
Issued by the Episode 3 consortium for the Episode 3 project co-funded by the European Commission and Episode 3 consortium.
EPISODE 3 Single European Sky Implementation support through Validation
Document information
Programme Sixth framework programme Priority 1.4 Aeronautics and Space
Project title Episode 3
Project N° 037106
Project Coordinator EUROCONTROL Experimental Centre
Deliverable Name Separation Management in the TMA Plan
Deliverable ID D5.3.5-01
Version 1.00
Owner
Patricia Ayllón AENA
Contributing partners
INECO, SICTA, ISDEFE, ENAV

Episode 3
D5.3.5-01 - Separation Management in the TMA Plan
Version : 1.00
Page 2 of 69
Issued by the Episode 3 consortium for the Episode 3 project co-funded by the European Commission and Episode 3 consortium.
- This page is intentionally blank -

Episode 3
D5.3.5-01 - Separation Management in the TMA Plan
Version : 1.00
Page 3 of 69
Issued by the Episode 3 consortium for the Episode 3 project co-funded by the European Commission and Episode 3 consortium.
DOCUMENT CONTROL
Approval
Role Organisation Name
Document owner AENA Patricia Ayllón
Technical approver DFS Matthias Poppe
Quality approver EUROCONTROL Ludovic Legros
Project coordinator EUROCONTROL Philippe Leplae
Version history
Version Date Status Author(s) Justification - Could be a
reference to a review form or a comment sheet
1.00 27/01/2009 Approved Patricia Ayllón Formal approval from the EP3 Consortium

Episode 3
D5.3.5-01 - Separation Management in the TMA Plan
Version : 1.00
Page 4 of 69
Issued by the Episode 3 consortium for the Episode 3 project co-funded by the European Commission and Episode 3 consortium.
TABLE OF CONTENTS
0 EXECUTIVE SUMMARY................................................................................................... 6
1 INTRODUCTION ............................................................................................................... 7 1.1 PURPOSE OF THE DOCUMENT ....................................................................................... 7 1.2 INTENDED AUDIENCE.................................................................................................... 7 1.3 DOCUMENT STRUCTURE............................................................................................... 7 1.4 BACKGROUND.............................................................................................................. 7 1.5 GLOSSARY OF TERMS .................................................................................................. 8
2 EXERCISE SCOPE AND JUSTIFICATION.................................................................... 10 2.1 STAKEHOLDERS AND THEIR EXPECTATIONS ................................................................. 10 2.2 DESCRIPTION OF ATM CONCEPT BEING ADDRESSED;................................................... 12 2.3 EXERCISE OBJECTIVES. .............................................................................................. 23
2.3.1 High level objectives ........................................................................................ 23 2.3.2 Low Level objectives........................................................................................ 23
2.4 CHOICE OF INDICATORS AND METRICS ......................................................................... 24 2.5 VALIDATION SCENARIO ............................................................................................... 25
2.5.1 Hypotheses ...................................................................................................... 28 2.5.2 Hypotheses and associated metrics................................................................ 28 2.5.3 Airport Information ........................................................................................... 29 2.5.4 Airspace Information........................................................................................ 31 2.5.5 Traffic Information............................................................................................ 42 2.5.6 Validation Scenarios ........................................................................................ 43 2.5.7 Additional Information ...................................................................................... 44 2.5.8 Equipment scenario requirements ................................................................... 46
2.6 EQUIPMENT REQUIRED TO CONDUCT THE EXERCISE ................................................... 46 2.7 LINKS TO OTHER VALIDATION EXERCISES .................................................................... 48 2.8 CONCEPT ASSUMPTIONS. ........................................................................................... 48 2.9 SUMMARY.................................................................................................................. 50
3 PLANNING AND MANAGEMENT.................................................................................. 51 3.1 ACTIVITIES................................................................................................................. 51 3.2 RESOURCES. ............................................................................................................. 52 3.3 RESPONSIBILITIES IN THE EXERCISE ............................................................................ 53 3.4 TRAINING................................................................................................................... 54 3.5 TIME PLANNING .......................................................................................................... 54 3.6 RISKS........................................................................................................................ 54
4 ANALYSIS SPECIFICATION.......................................................................................... 55 4.1 DATA COLLECTION METHODS ...................................................................................... 55 4.2 OPERATIONAL AND STATISTICAL SIGNIFICANCE ............................................................ 56 4.3 ANALYSIS METHOD ..................................................................................................... 56 4.4 DATA LOGGING REQUIREMENTS .................................................................................. 57 4.5 OUTLINE REPORTING PLANS........................................................................................ 57
5 DETAILED EXERCISE DESIGN..................................................................................... 57 5.1 DEPENDENT AND INDEPENDENT VARIABLES ................................................................ 57
5.1.1 Capacity ........................................................................................................... 57 5.1.2 Safety............................................................................................................... 58 5.1.3 Efficiency.......................................................................................................... 58
5.2 LENGTH AND NUMBER OF RUNS................................................................................... 58 5.3 TIME PLANNING FOR THE EXERCISE ............................................................................. 59
6 REFERENCES AND APPLICABLE DOCUMENTS....................................................... 61 6.1 APPLICABLE DOCUMENTS ........................................................................................... 61 6.2 REFERENCES............................................................................................................. 61
ANNEX A EXERCISE OVERVIEW TABLE............................................................................ 62

Episode 3
D5.3.5-01 - Separation Management in the TMA Plan
Version : 1.00
Page 5 of 69
Issued by the Episode 3 consortium for the Episode 3 project co-funded by the European Commission and Episode 3 consortium.
LIST OF TABLES Table 2-1 Stakeholder expectations........................................................................................................12 Table 2-2 OIs addressed and corresponding IPs....................................................................................19 Table 2-3 KPAs and Focus Areas...........................................................................................................21 Table 2-4 ATM Initiatives and Maturity Level ..........................................................................................22 Table 2-5 Metrics and Indications ...........................................................................................................25 Table 2-6 Validation Scenarios Objectives..............................................................................................28 Table 2-7 Exercise Hypothesis and Associated Metrics..........................................................................29 Table 2-8 TMA Sectors and Separation..................................................................................................32 Table 2-9 Elementary Volumes CNFW5 Barcelona TMA........................................................................38 Table 2-10 CNFW5 Barcelona TMA separation......................................................................................38 Table 2-11 Validation Scenario Summary...............................................................................................44 Table 3-1 Expected effort........................................................................................................................53 Table 3-2 Risk identification ....................................................................................................................55 Table 5-1 Detailed Planning....................................................................................................................60 Table 6-1 Applicable documents.............................................................................................................61 Table 6-2 References..............................................................................................................................61 Table 6-3 Overview exercise scope ........................................................................................................68
LIST OF FIGURES Figure 2-1: Rome Fiumicino Airport Layout.............................................................................................30 Figure 2-2: Barcelona El Prat Airport Layout...........................................................................................31 Figure 2-3: Rome TMA............................................................................................................................32 Figure 2-4: Rome Fiumicino STARs .......................................................................................................33 Figure 2-5: Rome Fiumicino STARs routed for RWY16L and RWY16R .................................................34 Figure 2-6: Rome Fiumicino SIDs from RWY07/25.................................................................................35 Figure 2-7: Detailed Rome Ciampino SIDs from RWY07/25...................................................................36 Figure 2-8: FTS1.A1 Rome Fiumicino STARs ........................................................................................37 Figure 2-9: Barcelona CFN5W Sectorisation .........................................................................................38 Figure 2-10: Barcelona RNAV SIDs (DME/DME)....................................................................................39 Figure 2-11: Barcelona RNAV STARs (DME/DME) ................................................................................40 Figure 2-12: Generic TMA for Transition Issues Study ...........................................................................41 Figure 2-13: WP5.3.5 Links to other WPs...............................................................................................48 Figure 4-1: Validation Exercises Analysis Method ..................................................................................56 Figure 4-2: Transition Issues Analysis Method .......................................................................................57

Episode 3
D5.3.5-01 - Separation Management in the TMA Plan
Version : 1.00
Page 6 of 69
Issued by the Episode 3 consortium for the Episode 3 project co-funded by the European Commission and Episode 3 consortium.
0 EXECUTIVE SUMMARY This document provides the Validation Exercise Plan for WP5.3.5 Separation Management in the TMA and describes the work to be carried out conducting a set of fast-time simulations that tests a number of operational improvements related to the new separation modes in the TMA described in the SESAR Concept. The initial emphasis is on obtaining a system level assessment of the concept’s ability to deliver the defined performance benefits in the 2020 time horizon corresponding to ATM Capability Level 2/3 and the second Implementation Package (IP 2). A sensitivity analysis will be done to provide guidelines on the required task load reduction needed from new support tools (Conflict Detection, Conflict Resolution and Monitoring tools). It also contains an exercise aiming at clarifying the transition process between a complex and structured TMA to a bigger one.
The exercise will be focused on capacity, efficiency and safety. This exercise is important as a first step in evaluating potential gains in terms of:
• Increase of TMA capacity and reduction of Controller workload (reducing controller task load per flight and the need for tactical interventions);
• Increase of Flight efficiency (temporal efficiency);
• Reduction of the number of potential conflicts and the number of controller overloads / under loads.
The methodology employed is to simulate reference scenarios i.e. current operations, then to simulate those scenarios with variations applied, allowing comparison between the reference and modified scenarios. Results will be expressed in terms of:
• Maximum number of aircraft that can enter/exit in one hour;
• Maximum number of aircraft that exited per hour with the considered traffic demand;
• Maximum simultaneous aircraft being controlled in the TMA;
• Total number of aircraft controlled in the TMA during the 6h00-22h00 period;
• Number of conflicts in the TMA;
• Number of separation losses in the TMA;
• Total overload / underload duration (minutes);
• Sum of the real flight durations in the TMA and of the best controlled time durations;
• Sum of delays due to the TMA, for arrivals and for departures and Number of aircraft delayed by more that 3 minutes.
Episode 3
D5.3.5-01 - Separation Management in the TMA Plan
Version : 1.00
Page 7 of 69
Issued by the Episode 3 consortium for the Episode 3 project co-funded by the European Commission and Episode 3 consortium.
1 INTRODUCTION
1.1 PURPOSE OF THE DOCUMENT
This document provides the Validation Exercise Plan for WP5.3.5 Separation Management in the TMA. This exercise plan is based on a general template that has been produced collaboratively between WP2.3 and the Validation Strategy and Support Tasks within WP 3, 4 & 5 (x.2.1) and complementary guidance material for E-OCVM Step 2, as provided by WP2.3.4 [11].
1.2 INTENDED AUDIENCE
This document is intended for use by the exercise leaders involved in EP3 WP5 and in EP3 WP2.3 Validation Process Management for the consolidated validation strategy. Moreover, it forms the basis for further elaboration of the detailed WP5 validation and exercise planning (E-OCVM step 2).
The intended audience includes:
• EP3 WP5 Leader;
• EP3 WP5.2 Validation strategy, support and operational concept refinement;
• EP3 WP5.3.1 TMA Expert Group;
• EP3 WP5.3.4 Multi Airport TMA Fast Time;
• EP3 WP5.3.6 Prototyping of Dense TMA.
1.3 DOCUMENT STRUCTURE
The document is structured in four main parts. The first details the scope, justification and objectives of the exercise together with the methodology, indicators and metrics, hypotheses and scenarios tested. The second part describes the activities, resources and time planning. The third part describes the data collection and analysis methodology. Finally the fourth part details the exercise design.
1.4 BACKGROUND
Episode 3 is charged with beginning the validation of the operational concept expressed by SESAR Task 2.2 and consolidated in SESAR D3 [7]. The initial emphasis is on obtaining a system level assessment of the concept’s ability to deliver the defined performance benefits in the 2020 time horizon corresponding to ATM Capability Level 2/3 and the Operational Improvement Step IP 2. The validation process as applied in EP3 is based on version 2 of the E-OCVM [2], which describes an approach to ATM Concept validation, and is managed and coordinated by EP3/WP2.3.
Validation exercises should provide evidence (preferably measured) about the ability (of some aspect) of the concept to deliver on (some aspect) of the performance targets. In order to prepare well the validation exercises, an exercise plan should be produced according to step 2 of the E-OCVM.
The exercise plan in this document describes the validation exercise WP5.3.5 Separation Management in the TMA which is done within WP5: Airport and TMA. This Exercise will analyse the impact of several separation concepts and their associated airspace on several KPAs, such as capacity, safety and efficiency. It will be focused on a high complexity TMA as they could be a constraint in the overall ATM System these new concepts include:

Episode 3
D5.3.5-01 - Separation Management in the TMA Plan
Version : 1.00
Page 8 of 69
Issued by the Episode 3 consortium for the Episode 3 project co-funded by the European Commission and Episode 3 consortium.
• An alternative complex 2D and 3D route structure, both in Departures and Arrivals;
• Alternative 3D PRNAV structures in Arrivals;
• 2D and 3D Precision Clearance Trajectories (PTC) in Arrivals and Departures.
Furthermore, this exercise will address the transition issues for those cases where would be beneficial to enlarge the TMA.
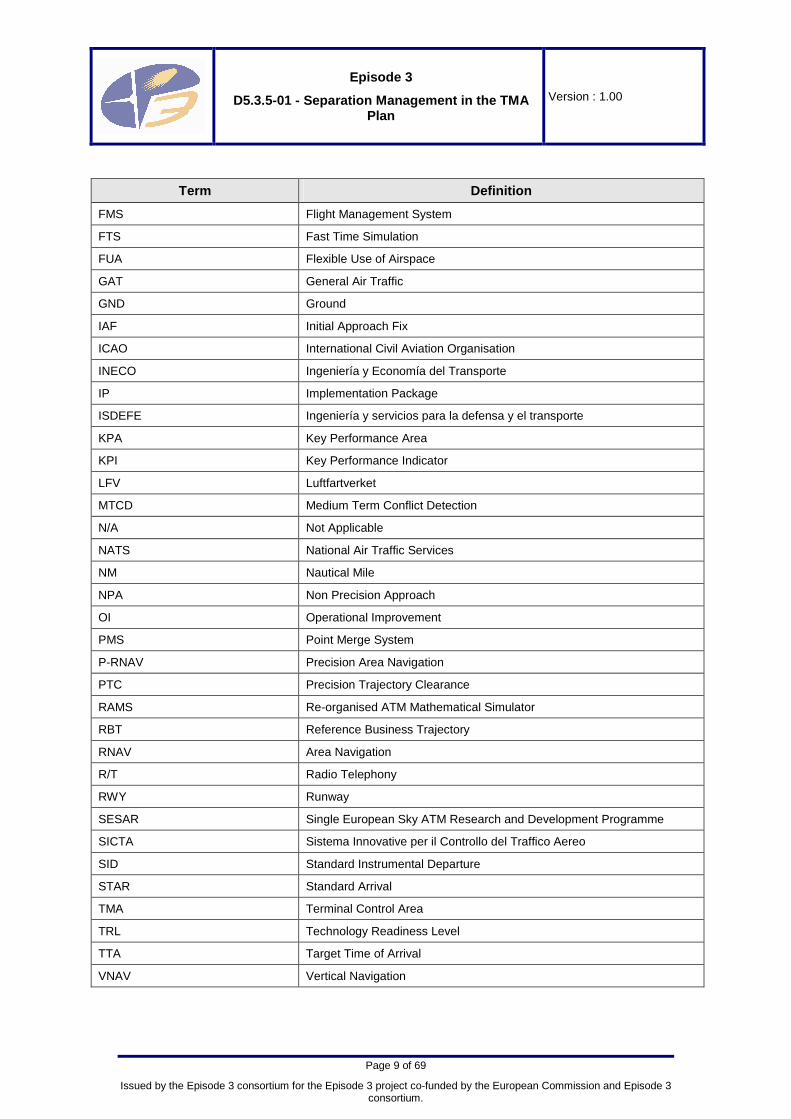
1.5 GLOSSARY OF TERMS
Term Definition
2D 2 Dimensions
3D 3 Dimensions
2D-PTC 2 Dimension Precision Trajectory Clearance
3D-PTC 3 Dimension Precision Trajectory Clearance
ACDA Advanced Continuous Descent Approach
AENA Aeropuertos Españoles y Navegación Aérea
AMAN Arrival MANager
ANSP Air Navigation Service Provider
APV Approach Vertical Guidance
ATC Air Traffic Control
ATCo Air Traffic Controller
ATM Air Traffic Management
AUs Airspace Users
CDA Continuous Descent Approach
CFN Configuration
CFMU Central Flow Management Unit
ConOps Concept of Operations
CRE Concept Refinement Exercise
CTA Controlled Time of Arrival
CTO Controlled Time of Overfly
DCB Demand and Capacity Balancing
DME Distance Measurement Equipment
DOD Detailed Operational Description
DTG Distance To Go
ENAV Ente Nazionale di Assistenza al Volo
EP3 Episode 3
E-OCVM European Operational Concept Validation Methodology
FA Focus Area
FL Flight Level
Episode 3
D5.3.5-01 - Separation Management in the TMA Plan
Version : 1.00
Page 9 of 69
Issued by the Episode 3 consortium for the Episode 3 project co-funded by the European Commission and Episode 3 consortium.
Term Definition
FMS Flight Management System
FTS Fast Time Simulation
FUA Flexible Use of Airspace
GAT General Air Traffic
GND Ground
IAF Initial Approach Fix
ICAO International Civil Aviation Organisation
INECO Ingeniería y Economía del Transporte
IP Implementation Package
ISDEFE Ingeniería y servicios para la defensa y el transporte
KPA Key Performance Area
KPI Key Performance Indicator
LFV Luftfartverket
MTCD Medium Term Conflict Detection
N/A Not Applicable
NATS National Air Traffic Services
NM Nautical Mile
NPA Non Precision Approach
OI Operational Improvement
PMS Point Merge System
P-RNAV Precision Area Navigation
PTC Precision Trajectory Clearance
RAMS Re-organised ATM Mathematical Simulator
RBT Reference Business Trajectory
RNAV Area Navigation
R/T Radio Telephony
RWY Runway
SESAR Single European Sky ATM Research and Development Programme
SICTA Sistema Innovative per il Controllo del Traffico Aereo
SID Standard Instrumental Departure
STAR Standard Arrival
TMA Terminal Control Area
TRL Technology Readiness Level
TTA Target Time of Arrival
VNAV Vertical Navigation
Episode 3
D5.3.5-01 - Separation Management in the TMA Plan
Version : 1.00
Page 10 of 69
Issued by the Episode 3 consortium for the Episode 3 project co-funded by the European Commission and Episode 3 consortium.
2 EXERCISE SCOPE AND JUSTIFICATION
2.1 STAKEHOLDERS AND THEIR EXPECTATIONS
With en-route sector contribution to delays at historically low levels, TMA and Airports are the primary limiting factor of overall system capacity. The particular challenge for terminal area operations is to increase the overall capacity such that closely located airports can operate at maximum capacity, allowing the over-flying traffic to be accommodated.
The most important stakeholders are the airspace users and their requirements as expressed in SESAR D2. There are two other groups of stakeholders involved: the external ones to Episode 3 and the internal project participants. The table below shows the main stakeholders needs and expectations from an increment on TMA capacity.
Stakeholder External / Internal
Involvement Why it matters to stakeholder
Performance expectations
ANSPs External Represented by AENA as exercise leader and ENAV and NATS as Exercise Members
- Provide a common view between air and ground Integration and cooperation of Airport, ATC, DCB and Aircraft Operator operations.
- Task load remains acceptable.
- Well define the management of 3D capable and non-3D capable aircraft (includes P-RNAV, mixed mode operations).
- Knowledge of controller’s working procedures.
- Knowledge of supporting tools that will be available to controllers.
- More generally: acceptance by the human actors (ATCos).
- Reduce the number of tactical actions needed due to a greater degree of anticipation where possible.
- Mitigate radio frequencies congestion by extended use of data-link (less R/T communication decreases part of task load).
- Increased knowledge of the position and planned movements of aircraft. Enabling fine-tuning of the airport ATC and turn around processes (e.g. early sequence renegotiation).
- Knowledge of the areas where more investment is needed to increase TMA and airport capacity.
Airport Operator External Represented by AENA (Spanish ANSP) since currently manages all the Spanish Airports
- Airport capacity is the key challenge in the SESAR timeframe. Runway throughput must be optimised at congested airports to levels that exceed current ‘best-in-class’ operations. One of
- Increased TMA Capacity, and therefore airport declared capacity

Episode 3
D5.3.5-01 - Separation Management in the TMA Plan
Version : 1.00
Page 11 of 69
Issued by the Episode 3 consortium for the Episode 3 project co-funded by the European Commission and Episode 3 consortium.
Stakeholder External / Internal
Involvement Why it matters to stakeholder
Performance expectations
the constraining factors taken into account during the process for establishing a declared airport capacity is the TMA capacity. Therefore, Increasing TMA capacity may lead to increase airport declared capacity.
Airlines External N/A - An increment of TMA Capacity will be translated into a better accommodation of the airlines demand. It will increase the business possibilities at congested TMAs/airports.
- Adequate equipment must be provided (FMS).
- Knowledge of Flight planning and processing tools that will be required.
- Knowledge of procedures and technical tools that must be specified and developed.
- Increased TMA Capacity, and therefore airport declared capacity.
- Situation awareness is improved (positive factor for safety and anticipation): Procedures and tools support the tasks: efficiency and safety are improved.
- Mitigate radio frequencies congestion by extended use of data-link (less R/T communication decreases part of task load).
- Being able to fly the flight profile, which is embodied within this trajectory. Increased fuel efficiency,
Pilots External N/A - Assurance that task load remains acceptable.
- Guarantee a common view between air and ground.
- Have an initial definition of the pilot’s responsibilities
- Clear definition and understanding of fall back, degraded operations, contingency procedures and measures.
- Pilot’s Situation awareness is improved (positive factor for safety and anticipation) Procedures and tools support the tasks: efficiency and safety are improved.
- Mitigate radio frequencies congestion by extended use of data-link (less R/T communication decreases part of task load).
- Safe application of CDA’s in TMA

Episode 3
D5.3.5-01 - Separation Management in the TMA Plan
Version : 1.00
Page 12 of 69
Issued by the Episode 3 consortium for the Episode 3 project co-funded by the European Commission and Episode 3 consortium.
Stakeholder External / Internal
Involvement Why it matters to stakeholder
Performance expectations
Research and development centres
External Represented by Ineco, Isdefe and Sicta as exercise members
- Deeper knowledge of the complex TMA.
- Knowledge of the areas where more research is needed to increase airport and TMA capacity.
Table 2-1 Stakeholder expectations
2.2 DESCRIPTION OF ATM CONCEPT BEING ADDRESSED;
This exercise will analyse the impact of the effect of Optimum Spacing Techniques, supported by new separation modes, and the impact of new routing techniques in the Arrival and Departures phases. More specifically, the following ATM Concepts will be analysed in WP5.3.51:
• Terminal Area Operations during periods of high complexity: During periods of high complexity, Terminal area operations will be based primarily on the issuance of clearances on 2D or 3D routes, the choice being dependant on aircraft capability and the specific traffic situation. Conventional SID/STAR will be used for non-capable aircraft but such aircraft may be subject to restrictions (e.g. less advantageous routing). Controllers will use surveillance, constraint management or ASAS separation to complement the route allocation;
• New Separation Modes: 2D and 3D Precision Trajectory Clearances (PTC-2D and PTC-3D): The objective of a Precision Trajectory Clearance is to authorise the execution of a segment of trajectory with the required precision. Although they are described as “clearances” they should be thought of as “rolling authorisation” ahead of the passage of the aircraft and will be heavily supported by automation. Precision trajectory clearances take advantage of the capabilities offered by ATM Capability Levels 1/2/3 in performance terms of navigational and constraint management. The goal is to enable controllers, supported by conflict prediction and resolution tools and conformance and intent monitoring, to manage a significant increase in traffic while keeping total task load at acceptable levels. Such clearances may include CTO/CTA for traffic queue management purposes. PTC may be in terms of 2D (lateral route portion only) or 3D (lateral and vertical trajectory);
• Precision Trajectory Clearance - 2D (2D-PTC):
2D-PTC will be used to authorise the execution of 2D route with the required precision. Depending on the airspace and operational environment, the 2D route may be predefined (i.e. published), user defined as part of a user preferred trajectory or created on an ad-hoc basis by an ANSP (i.e. a closed-loop route portion to resolve a conflict). Whilst one specific route will be included in the RBT, alternative routes may be dynamically allocated in a trajectory revision process for separation provision reasons. The precision with which the 2D route should be flown will be specified and combined with the lateral spacing of the routes will ensure separation between the subject aircraft and other aircraft on adjacent 2D routes, subject also to ground and airborne monitoring requirements. Summarizing, the allocation of 2D routes is a de-confliction method with vertical and longitudinal separation (if required) provided by conventional techniques to complement the 2D route. The 2D-PTC will be complimented by level instructions
1 Unless specifically indicated, the information presented within this section has been obtained from SESAR ConOps.

Episode 3
D5.3.5-01 - Separation Management in the TMA Plan
Version : 1.00
Page 13 of 69
Issued by the Episode 3 consortium for the Episode 3 project co-funded by the European Commission and Episode 3 consortium.
and may include other constraints such as speed, CTA or relative instructions such as ASPA-S&M.
• Precision Trajectory Clearance - 3D (3D-PTC):
3D-PTC will be used to authorise the execution of a trajectory defined both laterally and vertically. Depending on the airspace, the traffic complexity and the ATM level capability of the service provider and the aircraft concerned, the 3D route may be pre-defined (i.e. published – such as a 3D SID or STAR), user defined as part of a user preferred trajectory. The separation mode using 3D is applicable to ATM Level 3 and ATM Level 4 capable aircraft. They are applied dynamically so that the optimum aircraft’s performance capability is applied and “contain” the vertical evolution of the trajectory. This has the potential to increase airspace capacity and will be supported by automation tools to assess trajectories and propose 3D separation provision solutions under time critical conditions. The precision with which the 3D trajectory should be flown will be specified. This, combined with continuous airborne and ground monitoring will ensure separation between the subject aircraft and other aircraft on adjacent 3D trajectories. Summarizing, the allocation of 3D routes is a powerful de-confliction method with longitudinal separation (if required) provided by ATC to complement the 3D route. This may be achieved through surveillance based separation. The 3D-PTC may include other constraints such as speed, CTA or relative instructions such as ASPA-S&M.
• 3D P-RNAV2: The P-RNAV concept is based on the application of RNP capability and on emerging technology to ensure efficient timing and accurate approach sequencing. P-RNAV is the capability indicated for the complex terminal environment able to provide the necessary track-keeping accuracy of ±1 nm. 3D-RNP refers to P-RNAV capability in the vertical plane also, in addition to the longitudinal one.
Controller task-load per flight is a major factor in airspace capacity. The SESAR concept will increase capacity by reducing the requirement for tactical intervention (as headings and temporary levels). In highly congested terminal areas dominated by climbing and descending traffic flows this will be achieved by deploying route structures that provide a greater degree of strategic de-confliction and procedures that capitalise on the greater accuracy of aircraft navigation. New separation modes supported by controller tools, utilising shared high precision trajectory data, will reduce uncertainty and increase the valid duration of each clearance. Tools will also support task identification, clearance compliance and monitoring. SESAR techniques include de-confliction by the deployment of advanced PRNAV route structures (2D and 3D) in dense traffic situations but in all other situations separation will be assured by the use of new trajectory based separation modes in which aircraft will be provided with conflict free trajectory segments to be flown;
• Continuous Descent Approach (CDA)3: Continuous Descent Approach is an aircraft operating technique in which an arriving aircraft descends from an optimal position with minimum thrust and avoids level flight to the extent permitted by the safe operation of the aircraft and compliance with published procedures and ATC instructions. As local conditions require, CDA may comprise any of the following:
o Standard Arrival Routes (STARs) (including transitions) which may be designed with vertical profiles. The routes may be tailored to avoid noise-
2 PRNAV is not directly referenced within SESAR ConOps. Source: ICAO 3 CDA is not directly referenced within SESAR ConOps. Source: EUROCONTROL

Episode 3
D5.3.5-01 - Separation Management in the TMA Plan
Version : 1.00
Page 14 of 69
Issued by the Episode 3 consortium for the Episode 3 project co-funded by the European Commission and Episode 3 consortium.
sensitive areas as well as including the vertical profile and the provision of Distance To Go (DTG) information;
o Provision of ‘distance from touchdown’ (also referred to ‘distance to go’ (DTG)) information by Air Traffic Control during vectoring; or
o Combination of these: STARs being used in low traffic density, and DTG estimates being issued by ATC as and when radar intervention is required, e.g. during busy periods.
The CDA concept aims at environmental or flight efficiency benefits. Two CDA procedures are identified:
o Basic CDA: The tactical procedure where ATC provides DTG information during vectoring is also known as “Basic CDA” or “B-CDA”;
o Advanced CDA: The term “Advanced CDA” (A-CDA) is generally referring to further developments of CDA, involving P-RNAV procedures, and appropriate sequencing tools to allow their use even in high density traffic situations.
• Transition Issues: In addition, WP535 will investigate the transition between one structured complex TMA to a larger TMA and how this transition can affect both the TMA and the surrounding en-route airspace where there is a User Preferred Route environment.
In managed airspace, particularly in the cruising level regime, user preferred routing will apply without the need to adhere to a fixed route structure. Route structures will however be available for operations that require such support. In either case the user will share a trajectory the execution of which is subject to an appropriate clearance. It is recognised however that in especially congested airspace, the trade off between flight efficiency and capacity will require that a fixed route structure will be used to enable the required capacity. Fixed route procedures will be suspended when traffic density no longer requires their use. Where major hubs are close, the entire area below a certain level will be operated as an extended terminal area, with route structures eventually extending also into en-route airspace to manage the climbing and descending flows from and into the airports concerned. User preferred routings will also have to take into account the airspace volumes established for the operation of diverse (mainly military) aerial activities.
EP3 Initial DOD (G – General) [12] contains a more detailed description of these Operational Improvements. Furthermore, for the analysis of the Alternative Complex 2D/3D routes Concept and for the analysis of 3D P-RNAV, the following Operational Scenarios defined within the General DOD have been used as a basis;
• Allocation of the Departure Route;
• Allocation of the Departure Profile;
• TMA support tools.
The DOD Arrival and Departure – High and Medium/Low Density Operations E5 [13] is also used as a reference for WP5.3.5, specially the following sections:
• Section 2.3.1 Trajectory-based operations, in particular the information related to Trajectory Ownership and 4-D Trajectories;
• Section 2.3.3 Airspace Capacity;
• Section 2.3.4 New Separation Modes;
• Section 3.1 “Aspects of today's operations that will remain”.
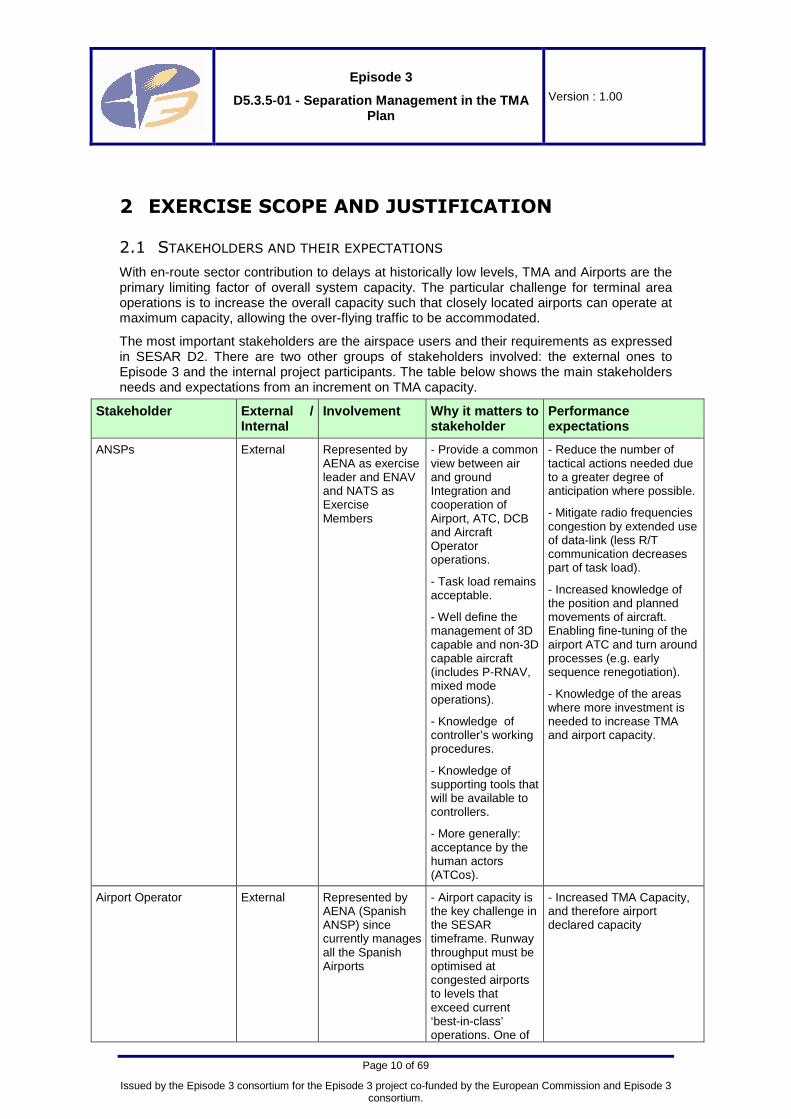
The following table shows the list of Operational Improvements (OI) steps that will be addressed by the EP3 WP5.3.5 exercise using Fast Time Simulation Techniques:

Episode 3
D5.3.5-01 - Separation Management in the TMA Plan
Version : 1.00
Page 15 of 69
Issued by the Episode 3 consortium for the Episode 3 project co-funded by the European Commission and Episode 3 consortium.
OI Id OI Title OI Step Id OI Step Title OI Step Description IP
IOC/FOC How addressed? FTS14 FTS2 CRE
L07-01 Arrival Traffic Synchronisation
TS-0102 Arrival Management Supporting TMA Improvements (incl. CDA, P-RNAV)
Arrival Management support is improved to facilitate the use of PRNAV in the terminal area together with the use of CDA approaches. Sequencing support based upon trajectory prediction will also enhance operations within the terminal area thus allowing a mixed navigation capability to operate within the same airspace and provide a transition to eventual 4D operations.
IP1
2008/2015
The introduction of guidance capability in vertical plan will be used to test CDAs in Rome TMA, otherwise difficult to implement due to orographical constraints.
����
L07-01 Arrival Traffic Synchronisation
TS-0103 Controlled Time of Arrival (CTA) through use of datalink
All ATM partners work towards achieving Controlled Time of Arrival (CTA) through use of datalink and with enhanced accuracy to optimize arrival sequence. The CTA is an ATM imposed time constraint on a defined merging point associated to an arrival runway. The CTA (which includes wake vortex optimisation) is calculated after the flight is airborne and published to the relevant controllers, arrival
IP2
2016/2019
This OI will be addressed through the application of 2D P-RNAV Pointe Merge System technique allowing working methods that determine a decrease in task load
����
4 More detail of the simulation scenarios FTS1, FTS2 and CRE can be found in §2.5
Episode 3
D5.3.5-01 - Separation Management in the TMA Plan
Version : 1.00
Page 16 of 69
Issued by the Episode 3 consortium for the Episode 3 project co-funded by the European Commission and Episode 3 consortium.
OI Id OI Title OI Step Id OI Step Title OI Step Description IP
IOC/FOC How addressed? FTS14 FTS2 CRE
airport systems and the pilot.
L08-02 Precision Trajectory Operations
CM-0601 Precision Trajectory Clearances (PTC)-2D Based On Pre-defined 2D Routes
After allocation of 2D routes, vertical constraint and longitudinal separation is provided by ATC to complement the 2D route. This may be achieved through surveillance based separation and/or the dynamic application of constraints. New support tools (incl. MTCD) and procedures and working methods have to be put in place.
IP2
2013/2020
This OI will be analysed through the introduction of tools that will support the depart/arrival routes. This assignment will be done in such a way that there are less conflicts, and the flight performance is improved. Therefore, a capacity gain will be achieved.
����
L08-02 Precision Trajectory Operations
CM-0602 Precision Trajectory Clearances (PTC)-3D Based On Pre-defined 3D Routes
After allocation of 3D routes, longitudinal separation is provided by ATC to complement the 3D route. This may be achieved through surveillance based separation and/or the dynamic application of constraints. New support tools and procedures and working methods have to be put in place. This mode relies on aircraft capabilities enabling barometric vertical navigation (VNAV) with the required accuracy (3D cones).
IP2
2017/2022
This OI will be analysed through the introduction of tools that will support the depart/arrival profiles. This assignment will be don in such a way that there are less conflicts, and the flight performance is improved. Therefore, a capacity gain will be achieved.
����
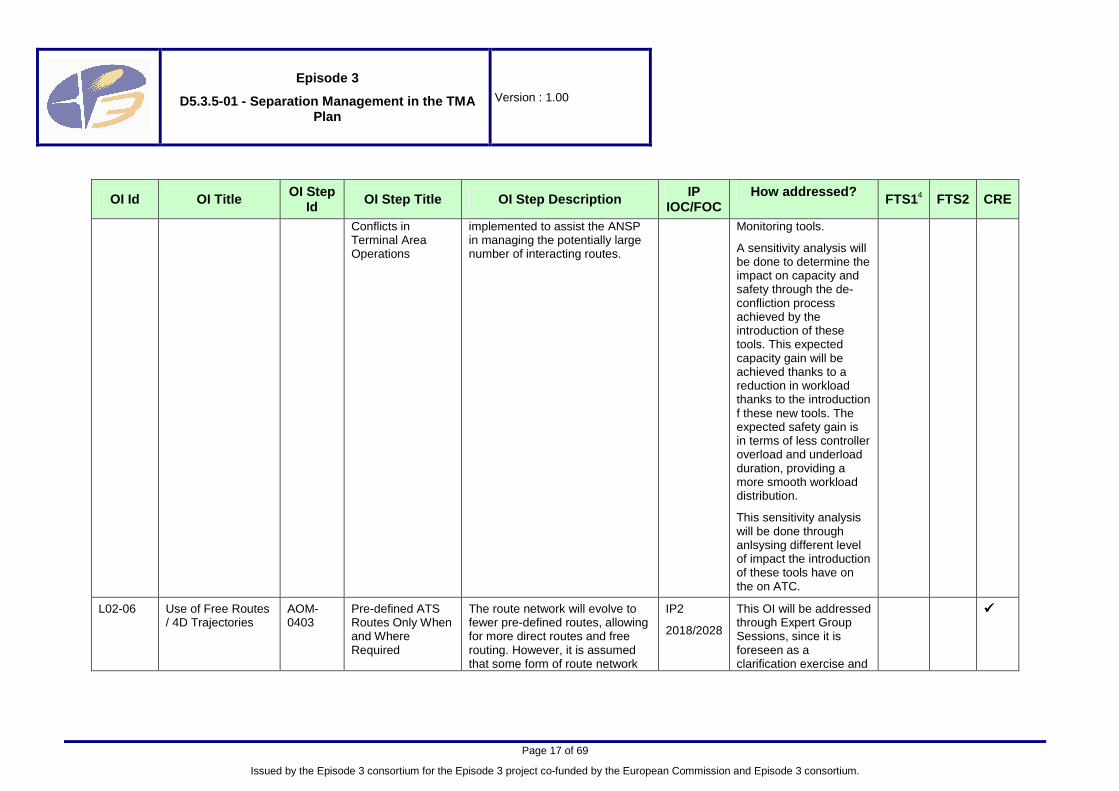
L06-03 ATC Automation in the Context of Terminal Area Operations
CM-0405 Automated Assistance to ATC Planning for Preventing
Ground system route allocation tools that automatically select the optimum conflict-free route when triggered by a specific event are
IP2
2015/2020
This OI will be analysed through the introduction of Conflict Detection, Conflict Resolution and
����
Episode 3
D5.3.5-01 - Separation Management in the TMA Plan
Version : 1.00
Page 17 of 69
Issued by the Episode 3 consortium for the Episode 3 project co-funded by the European Commission and Episode 3 consortium.
OI Id OI Title OI Step Id OI Step Title OI Step Description IP
IOC/FOC How addressed? FTS14 FTS2 CRE
Conflicts in Terminal Area Operations
implemented to assist the ANSP in managing the potentially large number of interacting routes.
Monitoring tools.
A sensitivity analysis will be done to determine the impact on capacity and safety through the de-confliction process achieved by the introduction of these tools. This expected capacity gain will be achieved thanks to a reduction in workload thanks to the introduction f these new tools. The expected safety gain is in terms of less controller overload and underload duration, providing a more smooth workload distribution.
This sensitivity analysis will be done through anlsysing different level of impact the introduction of these tools have on the on ATC.
L02-06 Use of Free Routes / 4D Trajectories
AOM-0403
Pre-defined ATS Routes Only When and Where Required
The route network will evolve to fewer pre-defined routes, allowing for more direct routes and free routing. However, it is assumed that some form of route network
IP2
2018/2028
This OI will be addressed through Expert Group Sessions, since it is foreseen as a clarification exercise and
����

Episode 3
D5.3.5-01 - Separation Management in the TMA Plan
Version : 1.00
Page 18 of 69
Issued by the Episode 3 consortium for the Episode 3 project co-funded by the European Commission and Episode 3 consortium.
OI Id OI Title OI Step Id OI Step Title OI Step Description IP
IOC/FOC How addressed? FTS14 FTS2 CRE
will be retained to cater for specific requirements (e.g. non capable aircraft, transition of medium complexity operations to/from TMA lower airspace, segregation between managed and unmanaged airspace, military flight planning, etc.).
it is considered as IP3. It will not provide quantitative results. There will be cases that, due to the complexity of the TMA, due to the need for more space needed for the sequencing, or due to any other cause, the TMA will need to be extended
L02-07 Enhance Terminal Airspace
AOM-0602
Enhanced Terminal Airspace with Curved/Segmented Approaches, Steep Approaches and RNAV Approaches Where Suitable
P-RNAV SIDs and STARs are increasingly used. RNP-based curved/segmented approaches and steep approaches are implemented to respond to local operating requirements (e.g. terrain or environmental reasons). Where precision approaches are not feasible, reductions in minima decisions with respect to conventional NPA are made it possible through the implementation of RNAV approach procedures with vertical guidance (APV).
IP1
2010/2016
This OI will be addressed through the application of a 2D P-RNAV with a Point Merge System allowing working methods that will decrease task load.
����
L02-08 Optimising Climb/Descent
AOM-0702
Advanced Continuous Descent Approach (ACDA)
This improvement involves the progressive implementation of harmonised procedures for CDAs in higher density traffic.
IP2
2013/2017
This OI will be addressed with the introduction of guidance capability in vertical plan will be used
����

Episode 3
D5.3.5-01 - Separation Management in the TMA Plan
Version : 1.00
Page 19 of 69
Issued by the Episode 3 consortium for the Episode 3 project co-funded by the European Commission and Episode 3 consortium.
OI Id OI Title OI Step Id OI Step Title OI Step Description IP
IOC/FOC How addressed? FTS14 FTS2 CRE
Continuous descent approaches are optimised for each airport arrival procedure. New controller tools and 3D trajectory management enable aircraft to fly, as far as possible, their individual optimum descent profile (the definition of a common and higher transition altitude would be an advantage).
to test that aircraft are able to fly CDAs in Rome TMA, otherwise difficult to implement due to orographical constraints.
L02-08 Optimising Climb/Descent
AOM-0704
Tailored Arrival Tailored arrival procedures are defined from Top of descent to Initial Approach Fix (IAF) or to runway taking into account the other traffic and constraints, to optimize the descent. The concept is based on the downlink to the ANSP of actual aircraft information (like weight, speed, weather, etc.) and the uplink of cleared route (STAR) calculated by the ANSP.
IP2
2015/2018
This OI will be addressed by introducing the guidance capability in vertical plan will be used to test CDAs in Rome TMA, otherwise difficult to implement due to orographical constraints
����
L02-09 Increasing Flexibility of Airspace Configuration
AOM-0804
Dynamic Management of Terminal Airspace
Benefits may be gained by dynamic adjustment of airspace boundaries of terminal airspace in order to respond in real time to changing situations in traffic patterns and/or runway(s) in use.
IP3 2025/2030
See previous OI Step AOM-0403.
����
Table 2-2 OIs addressed and corresponding IPs

Episode 3
D5.3.5-01 - Separation Management in the TMA Plan
Version : 1.00
Page 20 of 69
Issued by the Episode 3 consortium for the Episode 3 project co-funded by the European Commission and Episode 3 consortium.
Furthermore, the following OI Steps will be assumed as available, even though their impact is not being analysed;
• TS-0202 Departure Management Synchronised with Pre-departure Sequencing;
• TS-0301 Integrated Arrival Departure Management for full traffic optimisation, including within the TMA airspace;
• IS-0401 Automatic Terminal Information Service Provision through Use of Datalink;
• IS-0402 Extended Operational Terminal Information Service Provision Using Datalink;
• IS-0706 SWIM - European Air-Ground Communication Infrastructure;
• IS-0707 SWIM - Air-Ground limited services.
SESAR has defined a set of 11 Key Performance Areas, and within each area a set of Focus areas (FA) focussing on well defined understandable subjects. This exercise will be focused on the KPA Capacity, and more specifically on the Focus Area “Airspace Capacity, although some results related to other KPAs will be provided.
The table below summarises the KPAs, Focus Areas and main KPIs covered by this validation exercise.
SESAR KPA Description Focus Area Description KPI
CAPACITY Capacity addresses the ability of the ATM system to cope with air traffic demand (in number and distribution through time and space).
The global ATM system should exploit the inherent capacity to meet airspace user demand at peak times and locations while minimizing restrictions on traffic flow. To respond to future growth, capacity must increase, along with corresponding increases in efficiency, flexibility, and predictability while ensuring that there are no adverse impacts to safety giving due consideration to the environment. The ATM system must be resilient to service disruption, and the resulting temporary loss of capacity.
Airspace Capacity
Airspace Capacity covers the capacity of any individual or aggregated airspace volume within the European airspace. It relates to the throughput of that volume per unit of time, for a given safety level.
Maximum number of aircraft that can exit in one hour.
Maximum simultaneous aircraft being controlled in the TMA.
Total number of aircraft controlled in the TMA during the 6h00-22h00 period.
Maximum number of aircraft that actually existed per hour with the considered traffic demand.
SAFETY Safety will be address in terms of impact in the number of conflicts related to new methods
ATM-related safety outcome
Safety criteria define the level of acceptable safety. Safety is a complex multi-
Conflict number in the TMA
Number of separation

Episode 3
D5.3.5-01 - Separation Management in the TMA Plan
Version : 1.00
Page 21 of 69
Issued by the Episode 3 consortium for the Episode 3 project co-funded by the European Commission and Episode 3 consortium.
SESAR KPA Description Focus Area Description KPI
of conflict management and separation provision.
dimensional subject. The exercises will focus on the controller overload and the number of conflicts.
losses in the TMA
Total overload duration (minutes)
Total underload duration (minutes)
EFFICIENCY Efficiency focused on the impact of flying optimum trajectory and the introduction of new separation modes in the “Temporal Efficiency”. It will measure the deviations from the optimal flight duration.
Temporal Efficiency
Temporal Efficiency covers the magnitude and causes of deviations from planned (on-time) departure time and deviations from Initial Shared Business Trajectory durations (taxi time, airborne time).
Sum of the flight durations in the scenario.
Sum of the “best controlled” flight durations.
Number of aircraft delayed by more that 3 minutes.
Sum of delays due to the TMA, for arrivals and for departures.
Table 2-3 KPAs and Focus Areas
The analysis of transition from one structured TMA to a larger TMA will include the identification of KPAs that could be affected by this transition, and how they can be affected (including the impact at airport level, at en-route level, and at TMA level)
Finally, it would be highlighted that SESAR WP3.1 has performed a survey of existing ATM initiatives that have been carried out a previous evaluation of some elements of the SESAR Concept of Operations [8]. The following table shows the main ATM initiatives related to the issues addressed by the WP5.3.5 exercise together with the addressed Key Performance Areas.
Project Description Maturity Level (E-OCVM)
KPAs
Approach Tools and Traffic Management
The work is concerned with the development of operational concepts and controller support tools that can improve the safety, capacity, efficiency and environmental impact on the approach operations at major airports. The team is supporting near term developments and analysis of the approach operation. It is supporting the development of evidence for new regulation for Time Based Separation for arrivals; and the development of new approach delivery tools providing sequencing and spacing support advice with the introduction of an electronic environment for the TMA and approach environments, enabling many of the subsequent controller support functions.
TRL5 2/3 Environmental Sustainability, Efficiency and Predictability
5 Technology Readiness Level (TRL) is a measure used by some United States government agencies and many more major world companies (and agencies) to assess the maturity of evolving technologies (materials, components,

Episode 3
D5.3.5-01 - Separation Management in the TMA Plan
Version : 1.00
Page 22 of 69
Issued by the Episode 3 consortium for the Episode 3 project co-funded by the European Commission and Episode 3 consortium.
Project Description Maturity Level (E-OCVM)
KPAs
FAGI – Future Air Ground Integration
The FAGI project delivers a new concept for arrival management in an extended Terminal Manoeuvring Area (TMA). The concept integrates future air/ground capabilities to enable Continuous Descent Approaches (CDA) and Noise Abatement Procedures without having a diminishing effect on capacity or safety, and will be applicable even in high density traffic operations. The FAGI concept covers application of parallel 3D-Routes, Late Merging Point and procedures to mix traffic of both equipped (4D-FMS, datalink) and unequipped aircraft.
V2 Environmental Sustainability, Efficiency and Cost Effectiveness
TMA 2010+ The project intends to develop and validate the concepts of P-RNAV, CDAs and AMAN by developing a prototype trajectory management system for arriving aircraft using advanced automated support in the ground system. From this activity the project will specify the operational and technical requirements for a ground-based trajectory management system (including system and controller tools)
V2 Environmental Sustainability, Efficiency, Predictability, Capacity and Cost-Effectiveness.
“Point Merge”: Improving the management of arrival flows
Point Merge is a new method to merge arrival flows, based on a specific P-RNAV (Precision Area Navigation) route structure. It also enables continuous descent approach (CDA). The route structure is made of a point (merge point) with predefined legs (sequencing legs) equidistant to this point for path shortening or stretching. The sequence is achieved with conventional direct-to instructions to the merge point. (Open-loop vectoring should only be used for recovery from unexpected situations). Point Merge relies on existing technology: P-RNAV and AMAN (Arrival Manager) metered traffic
V2/V3 (towards V4/V5 with some ANSP’s)
Environmental Sustainability, Predictability and Capacity.
Table 2-4 ATM Initiatives and Maturity Level
devices, etc.) prior to incorporating that technology into a system or subsystem. Generally speaking, when a new technology is first invented or conceptualized, it is not suitable for immediate application. Instead, new technologies are usually subjected to experimentation, refinement, and increasingly realistic testing. Once the technology is sufficiently proven, it can be incorporated into a system/subsystem.
TRL 3: Analytical and experimental critical function and/or characteristic proof-of-concept: at this step in the maturation process, active research and development (R&D) is initiated. This must include both analytical studies to set the technology into an appropriate context and laboratory-based studies to physically validate that the analytical predictions are correct. These studies and experiments should constitute "proof-of-concept" validation of the applications/concepts formulated at TRL 2

Episode 3
D5.3.5-01 - Separation Management in the TMA Plan
Version : 1.00
Page 23 of 69
Issued by the Episode 3 consortium for the Episode 3 project co-funded by the European Commission and Episode 3 consortium.
2.3 EXERCISE OBJECTIVES.
2.3.1 High level objectives
Complex TMAs can be a constraint in the overall ATM System. The declaration of the airport capacity is a complex process that takes into account several contributions. One of the most influential factors is the capacity of the TMA to manage arrivals/departures flows to/from the airport/s included within the TMA. Increasing TMA Capacity will contribute to reduce this constraining factor and to increase airport declared capacity. Therefore, there is a need to investigate new concepts that could improve the trajectory and separation management at TMA level and analyse their effect in the overall ATM System.
In this context, the aim of WP5.3.5 is to provide evidence on the expected increment of Capacity in High density TMAs through the implementation of new separation modes included in the SESAR Concept.
2.3.2 Low Level objectives
In the following paragraphs, the main objectives of WP5.3.5 are described:
Carry out a sensitivity analysis on the effect of introduction of Conflict Detection, Conflict Resolution and Monitoring support tools in terms of;
Airspace Capacity (reducing controller task load per flight and the need for tactical interventions)
Safety aspects: Number of controllers overloads / under loads.
The main objective of this sensitivity analysis will be to provide support in defining the task load reduction needed by these supporting tools to obtain the required capacity gain needed with 2020 traffic levels.
1. Assess the operational impact of the introduction of the Allocation of Departure/Arrival Route, the Allocation of Departure/Arrival Profile, 2D/3D Departure/Arrival routes and PTC-2D/3D SESAR concepts (see § 2.2 for further details on the related OIs), in terms of:
• Airspace capacity and Controller workload (reducing controller task load per flight and the need for tactical interventions);
• Flight efficiency (temporal efficiency);
• Safety aspects: Number of potential conflicts and number of controller overloads / under loads.
2. Assess the operational impact of the introduction of 3D P-RNAV + CDAs SESAR concepts focused on Arrivals (see § 2.2 for further details on the related OIs)6:
• Airspace capacity and Controller workload (reducing controller task load per flight and the need for tactical interventions);
• Flight efficiency (temporal efficiency);
• Safety aspects: Number of potential conflicts and number of controller overloads / under loads.
3. Clarify, in close relation with the Expert Group, how the transition from one structured TMA to a small or larger TMA can affect both the TMA and the surrounding En-route airspace, where there is a User Preferred Route environment.
6 The possibility of reduced separation values due to the use of vertical guidance capability will be investigated.
Episode 3
D5.3.5-01 - Separation Management in the TMA Plan
Version : 1.00
Page 24 of 69
Issued by the Episode 3 consortium for the Episode 3 project co-funded by the European Commission and Episode 3 consortium.
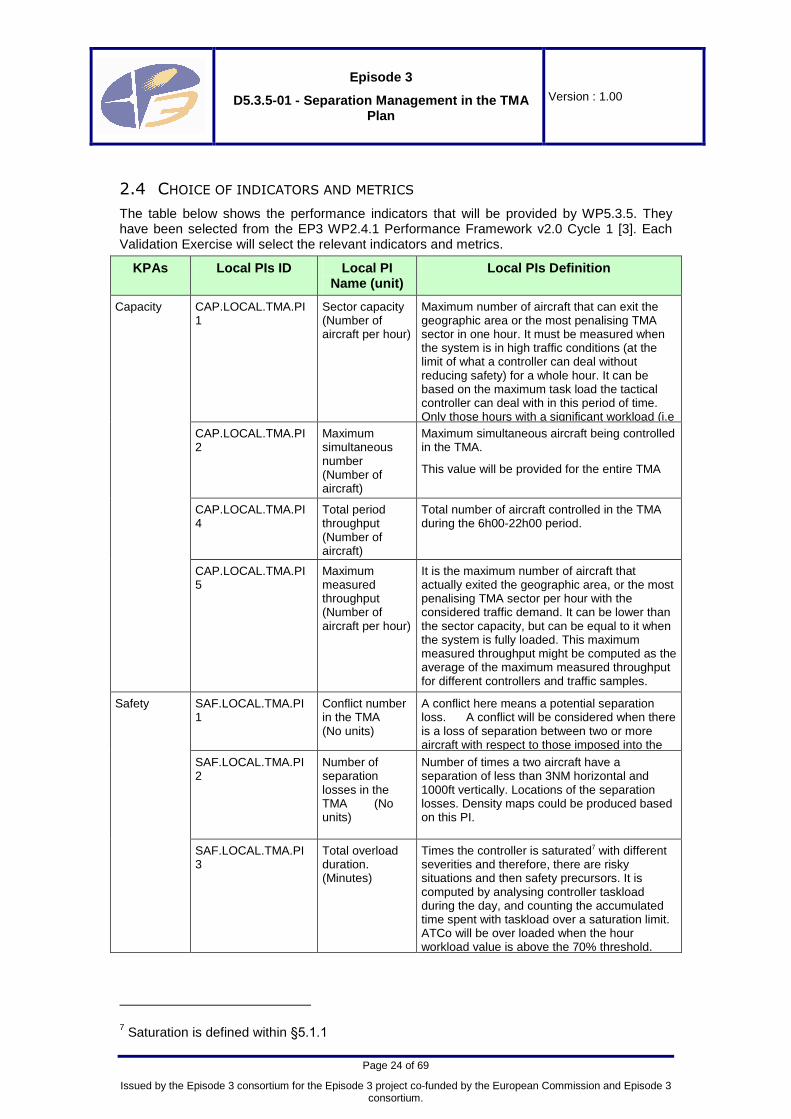
2.4 CHOICE OF INDICATORS AND METRICS
The table below shows the performance indicators that will be provided by WP5.3.5. They have been selected from the EP3 WP2.4.1 Performance Framework v2.0 Cycle 1 [3]. Each Validation Exercise will select the relevant indicators and metrics.
KPAs Local PIs ID Local PI Name (unit)
Local PIs Definition
CAP.LOCAL.TMA.PI 1
Sector capacity (Number of aircraft per hour)
Maximum number of aircraft that can exit the geographic area or the most penalising TMA sector in one hour. It must be measured when the system is in high traffic conditions (at the limit of what a controller can deal without reducing safety) for a whole hour. It can be based on the maximum task load the tactical controller can deal with in this period of time. Only those hours with a significant workload (i.e
CAP.LOCAL.TMA.PI 2
Maximum simultaneous number (Number of aircraft)
Maximum simultaneous aircraft being controlled in the TMA.
This value will be provided for the entire TMA
CAP.LOCAL.TMA.PI 4
Total period throughput (Number of aircraft)
Total number of aircraft controlled in the TMA during the 6h00-22h00 period.
Capacity
CAP.LOCAL.TMA.PI 5
Maximum measured throughput (Number of aircraft per hour)
It is the maximum number of aircraft that actually exited the geographic area, or the most penalising TMA sector per hour with the considered traffic demand. It can be lower than the sector capacity, but can be equal to it when the system is fully loaded. This maximum measured throughput might be computed as the average of the maximum measured throughput for different controllers and traffic samples.
SAF.LOCAL.TMA.PI 1
Conflict number in the TMA (No units)
A conflict here means a potential separation loss. A conflict will be considered when there is a loss of separation between two or more aircraft with respect to those imposed into the
SAF.LOCAL.TMA.PI 2
Number of separation losses in the TMA (No units)
Number of times a two aircraft have a separation of less than 3NM horizontal and 1000ft vertically. Locations of the separation losses. Density maps could be produced based on this PI.
Safety
SAF.LOCAL.TMA.PI 3
Total overload duration. (Minutes)
Times the controller is saturated7 with different severities and therefore, there are risky situations and then safety precursors. It is computed by analysing controller taskload during the day, and counting the accumulated time spent with taskload over a saturation limit. ATCo will be over loaded when the hour workload value is above the 70% threshold.
7 Saturation is defined within §5.1.1

Episode 3
D5.3.5-01 - Separation Management in the TMA Plan
Version : 1.00
Page 25 of 69
Issued by the Episode 3 consortium for the Episode 3 project co-funded by the European Commission and Episode 3 consortium.
KPAs Local PIs ID Local PI Name (unit)
Local PIs Definition
SAF.LOCAL.TMA.PI 4
Total underload duration (Minutes)
Times the controller has quite nothing to do and therefore, there are risky situations and then safety precursors. It is computed by analysing controller taskload during the day, and counting the accumulated time spent with taskload under a minimal activity limit. ATCo will be considered as under loaded when the hour workload value is below the 15% value.
EFF.LOCAL.TMA.PI 1
Total flight duration. (Minutes)
Sum of the flight durations in the scenario. Times during which aircraft are not in the geographic area are not considered. Time during which aircraft are flying before the beginning of the scenario are not considered. Flight duration is measured by taking into account flown procedures (nominal or not)
EFF.LOCAL.TMA.PI 2
Optimal total flight duration. (Minutes)
Sum of the “best controlled” flight durations. The “best controlled” flight duration is the one the aircraft would have if it were alone in the TMA, following applicable procedures, from the first point of the geographic area to the last point of the geographic area of the TMA. It can be computed by taking into account aircraft performances. Flight duration is measured by taking into account only Nominal procedures.
EFF.LOCAL.TMA.PI 5
Number of delayed aircraft. (Number of aircraft)
Number of aircraft delayed by more that 3 minutes (a delay is the difference between expected time and actual time). The delay will be measured by analysing the delay in exiting the TMA boundary, due to the use non-nominal procedures
Efficiency
EFF.LOCAL.TMA.PI 6
Total Delays (Minutes)
Sum of delays due to the TMA, for arrivals and for departures. The delay will be measured by analysing the delay in exiting the TMA boundary, due to the use of non-nominal procedures
Table 2-5 Metrics and Indications
The Transition Issues to be analysed will not address quantitative data related to Local Performance Indicators, since the objective is to clarify the Concept regarding the transition aspects when the TMA needs to be changed. This analysis will provide, as an output, conclusions from the study produced following close consultation with the TMA EG for those aspects indicated in § 2.3. These conclusions will be incorporated in the final report.
2.5 VALIDATION SCENARIO
Within WP5.3.5 activities, three Validation Exercises will be performed in different complex TMAs:
• FTS1, in Rome TMA8, will assess the performance impact of the introduction of 3D-PRNAV and CDAs in the arrival sequence of a complex TMA;
8 Rome TMA has been the selected as an example of complex TMA due to the following reasons:

Episode 3
D5.3.5-01 - Separation Management in the TMA Plan
Version : 1.00
Page 26 of 69
Issued by the Episode 3 consortium for the Episode 3 project co-funded by the European Commission and Episode 3 consortium.
• FTS2, in Barcelona TMA9, will carry out the sensitivity analysis of Conflict Detection tool, Conflict Resolution tool, Conformance Monitoring tool, and will assess the performance impact of the Allocation of Departure/Arrival Route, Allocation of Departure/Arrival Profile, , PTC-2D, PTC-3D and 3D Departure and Arrival Routes, in a complex TMA;
• CRE (Concept Refinement Exercise), in a generic complex TMA, will analyse how the move from one structured high complexity TMA with a fixed route network to a smaller/larger TMA can affect both the TMA and the surrounding En-Route airspace.. This exercise will be focused on a generic complex TMA, so that the conclusions obtained can be applied in any other comparable TMA existing across the ECAC area.
Taking into account the objectives of this exercise, a series of Validation Scenarios will be carried out to test the effects of the operational improvements steps described in § 2.2. Next table shows a summary of the Validation Scenarios that will be addressed by WP5.3.5, as well as the specific objectives of each of them.
Validation Scenario ID Validation Scenario Objective
FTS1.A0 A0 - Baseline Scenario (Traffic 2020 - Current E-TMA sectorisation; current SIDs/STARs network; traditional working methods to separate arrivals)
Provide an overview of current ATC practice in the Rome Terminal Area managing traffic growth foreseen in 2020.
FTS1.A1
A1 – 2D P-RNAV (Traffic 2020 – Current E-TMA sectorisation; 2D P-RNAV application with Pointe Merge System).
Estimate the benefits due to the analysed concepts (2D PRNAV, application of Point Merge System) associated to the SESAR OIs AOM-0602 and TS-0103.
FTS1.A2
A2 – 3D P-RNAV + CDAs (Traffic 2020 – Current E-TMA sectorisation; guidance capability in vertical plan will be introduced (3D – PRNAV). This last capability will be used to test CDAs in Rome TMA, otherwise difficult to implement due to orographical constraints.
Estimate the benefits due to the analysed concepts (3D-PRNAV with Pont Merge System application together with CDA) associated to the SESAR OIs AOM-0702, AOM-0704, TS-0102 and TS-0103.
FTS2.A0 Current Concept (traffic 2020 – current routes and sectors network)
Highlight the need of a new design of SID, STAR network
FTS2.A1 Current Concept (traffic 2020 – new routes network)
Using the new SID, STAR network, this scenario should show that there will still be a lack of capacity. So the SESAR OIs are needed to meet the 2020 capacity requirements.
FTS2.A2 Conflict Detection, Conflict Resolution and Conformance Monitoring tools (traffic 2020 – new routes network)
By analysing different impacts on ATC of the supporting tools, this scenario will provide support in
• Rome TMA experiments problems linked to interactions of arrival and departures flows to complex and busy airports, expected to become even more serious to 2020.
• The complexity of the geographical characteristics making it difficult to implement procedures as CDAs.
9 Barcelona TMA has been the selected as an example of complex TMA due to the following reasons: • Barcelona TMA is in the European Top 15 TMAs in terms of traffic demand • Barcelona has a traffic mixture such that it makes it feasible to obtain general results • The good availability of the necessary specific information to perform this type of assessments. • The management of the crosses between SIDs and STARs is an important issue in this TMA and will
surely be more difficult in 2020. • The existence of a published RNAV SIDs and STARs network.

Episode 3
D5.3.5-01 - Separation Management in the TMA Plan
Version : 1.00
Page 27 of 69
Issued by the Episode 3 consortium for the Episode 3 project co-funded by the European Commission and Episode 3 consortium.
Validation Scenario ID Validation Scenario Objective
definition of the task load reduction needed by these supporting tools to obtain the required capacity gain needed with 2020 traffic levels. The associated OI is CM-0405
FTS2.A3 Allocation of Departure/Arrival + Conflict Detection, Conflict Resolution and Conformance Monitoring tools + PTC-2D (traffic 2020 – new routes network).
To estimate the benefits due to the analysed ATM Concepts (Allocation of Departure/Arrival Route + Conflict Detection tool + PTC-2D) associated to the SESAR OI CM-0601.
FTS2.A4a
Allocation of Departure/Arrival Profile + 3D Departure and arrival routes + Conflict Detection, Conflict Resolution and Conformance Monitoring tools + PTC-3D. (traffic 2020 – new routes network).
50% Aircraft are 2D Capable, 50% Aircraft are 3D Capable
To estimate the benefits due to the analysed ATM Concepts (Allocation of Departure/Arrival Profile + 3D Departure and Arrival routes + Conflict Detection, Conflict Resolution and Conformance Monitoring tools + PTC-3D) associated to SESAR OI CM-0602.
Due to uncertainty on the level of 3D capable aircraft in 2020, in this first approximation, it will be assumed that 50% of aircraft are 2D capable and 50% will be 3D capable
FTS2.A4b
Allocation of Departure/Arrival Profile + 3D Departure and Arrival routes + Conflict Detection, Conflict Resolution and Conformance Monitoring tools + PTC-3D. (traffic 2020 – new routes network).
100% Aircraft are 3D Capable
To estimate the full benefits due to these SESAR OIs (Allocation of Departure/Arrival Profile + 3D Departure and Arrival routes + Conflict Detection, Conflict Resolution and Conformance Monitoring tools + PTC-3D) associated to SESAR OI CM-0602.
The full benefits will be investigated by assuming that all aircraft are 3D capable in 2020.
CRE Transition Issues related to the move from one structured and complex TMA to a bigger/smaller TMA affecting therefore the En-Route Airspace around the TMA.
Analyse the SESAR OIs AOM-0804 and AOM-0403 in terms of;
- Identification of triggers of the transition process.
- Description of the process and procedures, and identification of the actors involved, roles and responsibilities.
- Identification of KPAs that could be affected by this transition and description of the expected changes.
- Clarify the relation between transition issues and other concepts such as the Extended TMA concept, sequencing within the En-route area (the use of AMAN in the en-route phase), etc.

Episode 3
D5.3.5-01 - Separation Management in the TMA Plan
Version : 1.00
Page 28 of 69
Issued by the Episode 3 consortium for the Episode 3 project co-funded by the European Commission and Episode 3 consortium.
Table 2-6 Validation Scenarios Objectives
2.5.1 Hypotheses
The list below contains the main hypothesis identified for this exercise:
The introduction of 3D-PRNAV and CDAs in the arrival sequence of a complex TMA:
• H1: will reduce the tactical controller workload (reducing controller task load per flight and the need for tactical interventions) and, therefore, increase the airspace capacity;
• H2: will increase flight efficiency in terms of flight duration (temporal efficiency). In this sense, the increment in flight efficiency should result from the possibility to fly an optimum and more efficient trajectory;
• H3: will reduce the number of potential conflicts and the number of controller overloads / underloads.
The introduction of Conflict Detection, Conflict Resolution and Monitoring Tools in a Complex TMA:
• H4: will reduce the tactical controller workload (reducing controller task load per flight and the need for tactical interventions) and, therefore, increase the airspace capacity;
• H5: will reduce the number of controller overloads / underloads.
The Allocation of Departure/Arrival Route, Allocation of Departure/Arrival Profile, PTC-2D, PTC-3D and 3D Departure and Arrival Routes, in a complex TMA:
• H6: will reduce the tactical controller workload (reducing controller task load per flight and the need for tactical interventions) and, therefore, increase the airspace capacity;
• H7: will increase flight efficiency in terms of flight duration (temporal efficiency). In this sense, the increment in flight efficiency should result from the possibility to fly an optimum and more efficient trajectory;
• H8: will reduce the number of potential conflicts and the number of controller overloads / underloads.
2.5.2 Hypotheses and associated metrics
The table below shows the performance indicators linked to the hypotheses described in the previous section:
HYPOTHESES INDICATORS
HI & H6 CAP.LOCAL.TMA.PI 1
CAP.LOCAL.TMA.PI 2
CAP.LOCAL.TMA.PI 4
CAP.LOCAL.TMA.PI 5
H2 & H7 EFF.LOCAL.TMA.PI 1
EFF.LOCAL.TMA.PI 2
EFF.LOCAL.TMA.PI 5
EFF.LOCAL.TMA.PI 6
H3 & H8 SAF.LOCAL.TMA.PI 1

Episode 3
D5.3.5-01 - Separation Management in the TMA Plan
Version : 1.00
Page 29 of 69
Issued by the Episode 3 consortium for the Episode 3 project co-funded by the European Commission and Episode 3 consortium.
SAF.LOCAL.TMA.PI 2
SAF.LOCAL.TMA.PI 3
SAF.LOCAL.TMA.PI 4
H4 CAP.LOCAL.TMA.PI 1
H5 SAF.LOCAL.TMA.PI 3
SAF.LOCAL.TMA.PI 4
Table 2-7 Exercise Hypothesis and Associated Metrics
2.5.2.1 Assumptions
As the main scope of the exercise project is to assess the impact of a set of operational improvements steps on the TMA performance (capacity, efficiency and safety), the level of detail of the airport modelling will be one needed in order to avoid that the TMA results obtained could be biased.
• Weather conditions: weather constraints (night / low visibility, strong wing or bad weather conditions) will not be considered;
• Equipment Failure; no systems failures and consequently no emergencies have been considered;
• Aircraft types; military aircraft will not be considered if it participates in military exercises and will be take into account if it flies as GAT;
• FUA: no active military areas will be considered;
• No reserves/prohibited areas will be introduced;
• All aircraft will be Data-Link capable (ATM Capability Level 0);
• Fixed route structure and procedures will be defined;
• All aircraft will be able to fly P-RNAV procedures;
• All aircraft are suitably equipped to carry out new procedures and manoeuvres;
• En-route arrival queue management has already been performed and different flows of arrival have been merged.
2.5.3 Airport Information
Rome TMA and Barcelona TMA have been selected as examples of complex TMAs to assess the impact of the new separation modes described in the SESAR Concept.
FTS1, in Rome TMA, will assess the performance impact of the introduction of 3D-PRNAV and CDAs in the arrival sequence, while FTS2, in Barcelona TMA, will carry out the sensitivity analysis in the introduction of the Conflict Detection, Conflict Resolution and Conformance Monitoring tools and will assess the performance impact of the Allocation of Departure/Arrival Route, Allocation of Departure/Arrival Profile, PTC-2D, PTC-3D and 3D Departure and Arrival Routes.
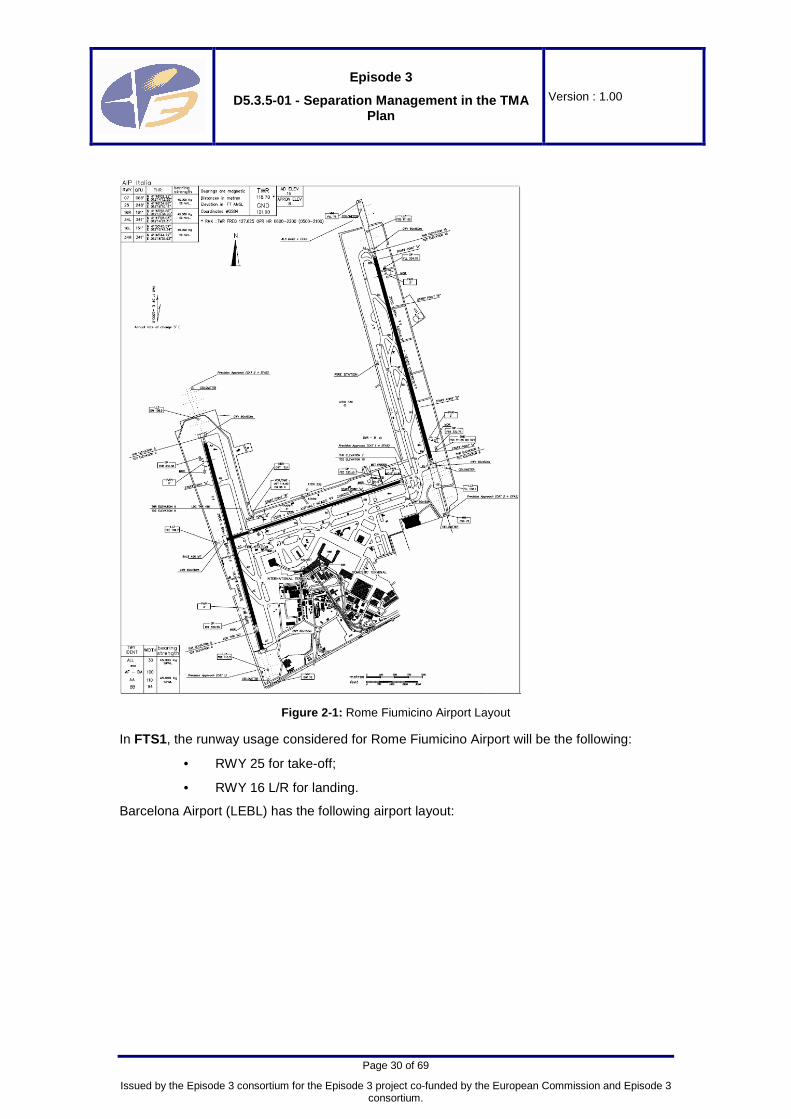
The following figure shows Rome Fiumicino Airport (LIRF) layout.
Episode 3
D5.3.5-01 - Separation Management in the TMA Plan
Version : 1.00
Page 30 of 69
Issued by the Episode 3 consortium for the Episode 3 project co-funded by the European Commission and Episode 3 consortium.
Figure 2-1: Rome Fiumicino Airport Layout
In FTS1, the runway usage considered for Rome Fiumicino Airport will be the following:
• RWY 25 for take-off;
• RWY 16 L/R for landing.
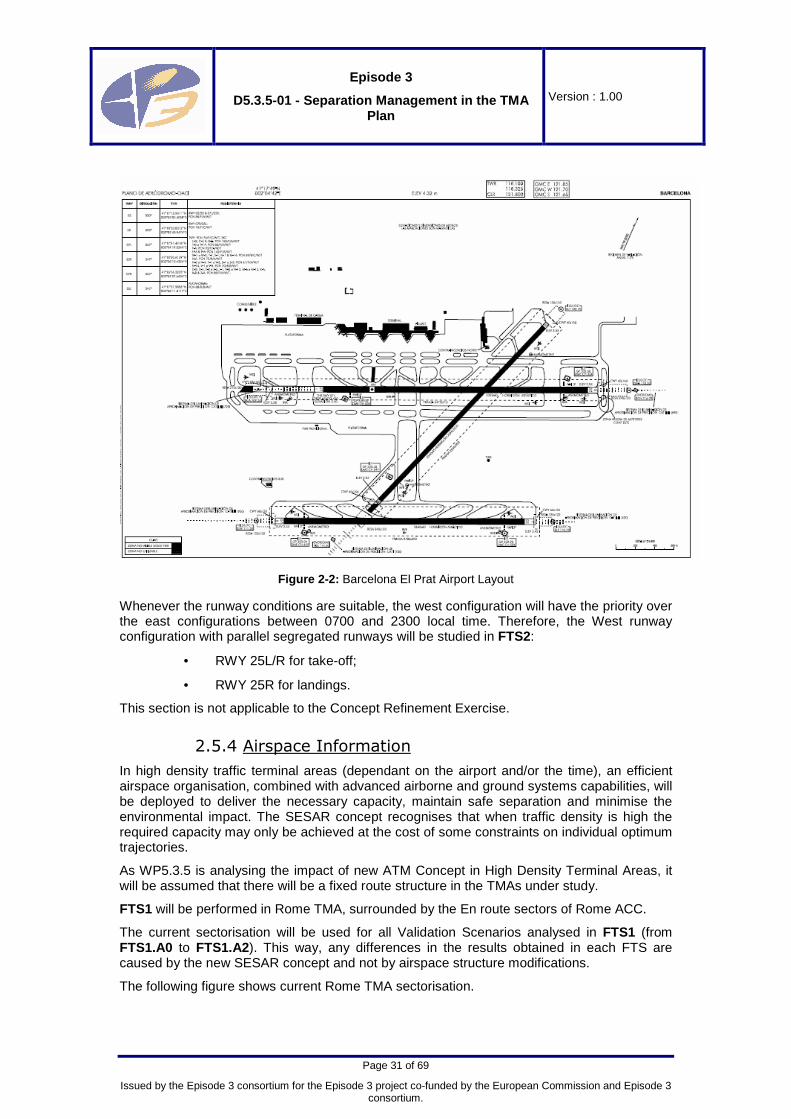
Barcelona Airport (LEBL) has the following airport layout:
Episode 3
D5.3.5-01 - Separation Management in the TMA Plan
Version : 1.00
Page 31 of 69
Issued by the Episode 3 consortium for the Episode 3 project co-funded by the European Commission and Episode 3 consortium.
Figure 2-2: Barcelona El Prat Airport Layout
Whenever the runway conditions are suitable, the west configuration will have the priority over the east configurations between 0700 and 2300 local time. Therefore, the West runway configuration with parallel segregated runways will be studied in FTS2:
• RWY 25L/R for take-off;
• RWY 25R for landings.
This section is not applicable to the Concept Refinement Exercise.
2.5.4 Airspace Information
In high density traffic terminal areas (dependant on the airport and/or the time), an efficient airspace organisation, combined with advanced airborne and ground systems capabilities, will be deployed to deliver the necessary capacity, maintain safe separation and minimise the environmental impact. The SESAR concept recognises that when traffic density is high the required capacity may only be achieved at the cost of some constraints on individual optimum trajectories.
As WP5.3.5 is analysing the impact of new ATM Concept in High Density Terminal Areas, it will be assumed that there will be a fixed route structure in the TMAs under study.
FTS1 will be performed in Rome TMA, surrounded by the En route sectors of Rome ACC.
The current sectorisation will be used for all Validation Scenarios analysed in FTS1 (from FTS1.A0 to FTS1.A2). This way, any differences in the results obtained in each FTS are caused by the new SESAR concept and not by airspace structure modifications.
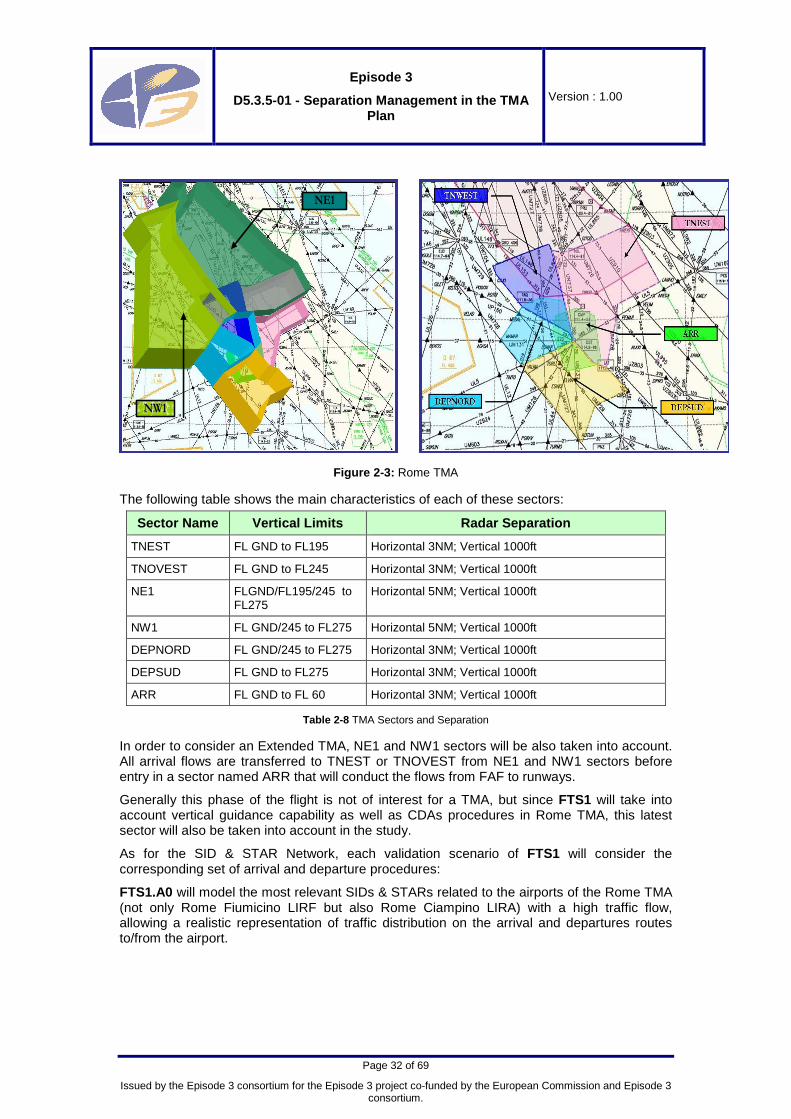
The following figure shows current Rome TMA sectorisation.
Episode 3
D5.3.5-01 - Separation Management in the TMA Plan
Version : 1.00
Page 32 of 69
Issued by the Episode 3 consortium for the Episode 3 project co-funded by the European Commission and Episode 3 consortium.
NNWW11
NE1
Figure 2-3: Rome TMA
The following table shows the main characteristics of each of these sectors:
Sector Name Vertical Limits Radar Separation
TNEST FL GND to FL195 Horizontal 3NM; Vertical 1000ft
TNOVEST FL GND to FL245 Horizontal 3NM; Vertical 1000ft
NE1 FLGND/FL195/245 to FL275
Horizontal 5NM; Vertical 1000ft
NW1 FL GND/245 to FL275 Horizontal 5NM; Vertical 1000ft
DEPNORD FL GND/245 to FL275 Horizontal 3NM; Vertical 1000ft
DEPSUD FL GND to FL275 Horizontal 3NM; Vertical 1000ft
ARR FL GND to FL 60 Horizontal 3NM; Vertical 1000ft
Table 2-8 TMA Sectors and Separation
In order to consider an Extended TMA, NE1 and NW1 sectors will be also taken into account. All arrival flows are transferred to TNEST or TNOVEST from NE1 and NW1 sectors before entry in a sector named ARR that will conduct the flows from FAF to runways.
Generally this phase of the flight is not of interest for a TMA, but since FTS1 will take into account vertical guidance capability as well as CDAs procedures in Rome TMA, this latest sector will also be taken into account in the study.
As for the SID & STAR Network, each validation scenario of FTS1 will consider the corresponding set of arrival and departure procedures:
FTS1.A0 will model the most relevant SIDs & STARs related to the airports of the Rome TMA (not only Rome Fiumicino LIRF but also Rome Ciampino LIRA) with a high traffic flow, allowing a realistic representation of traffic distribution on the arrival and departures routes to/from the airport.

Episode 3
D5.3.5-01 - Separation Management in the TMA Plan
Version : 1.00
Page 33 of 69
Issued by the Episode 3 consortium for the Episode 3 project co-funded by the European Commission and Episode 3 consortium.
The following map shows all the current STARs used in FTS1.A0 for Rome/Fiumicino (LIRF).
Figure 2-4: Rome Fiumicino STARs
According to the RWY in use, the following routes are to be considered as compulsory STAR if the ending point is also an IAF, or as LINK ROUTES if followed in the ATC Clearance by a STAR to the relevant IAF.
The figures below show the arrival procedures used in Fiumicino Airport routed to RWY 16 L/R.

Episode 3
D5.3.5-01 - Separation Management in the TMA Plan
Version : 1.00
Page 34 of 69
Issued by the Episode 3 consortium for the Episode 3 project co-funded by the European Commission and Episode 3 consortium.
Figure 2-5: Rome Fiumicino STARs routed for RWY16L and RWY16R

Episode 3
D5.3.5-01 - Separation Management in the TMA Plan
Version : 1.00
Page 35 of 69
Issued by the Episode 3 consortium for the Episode 3 project co-funded by the European Commission and Episode 3 consortium.
The following maps show all the current Rome/Fiumicino (LIRF) SIDs.
Figure 2-6: Rome Fiumicino SIDs from RWY07/25
The following maps show the current Rome/Ciampino (LIRA) STARs and SIDs.

Episode 3
D5.3.5-01 - Separation Management in the TMA Plan
Version : 1.00
Page 36 of 69
Issued by the Episode 3 consortium for the Episode 3 project co-funded by the European Commission and Episode 3 consortium.
Figure 2-7: Detailed Rome Ciampino SIDs from RWY07/25
FTS1.A1 will introduce a 2D P-RNAV route network through the Point Merge System for the Arrival flows to RWY 16 L/R of Fiumicino Airport. The current SID and STAR network will be applied in FTS1.A1 for Ciampino Airport. For the application of the PMS concept in Rome TMA, two triangles will be introduced, one on the East, the other one on the west. Each triangle is associated to one point merge and to one runway that is intended to feed: that one on the East is to make traffic from the East landing on RWY 16L, and that one on the West is to make traffic from the west landing on RWY 16R (see figure below).
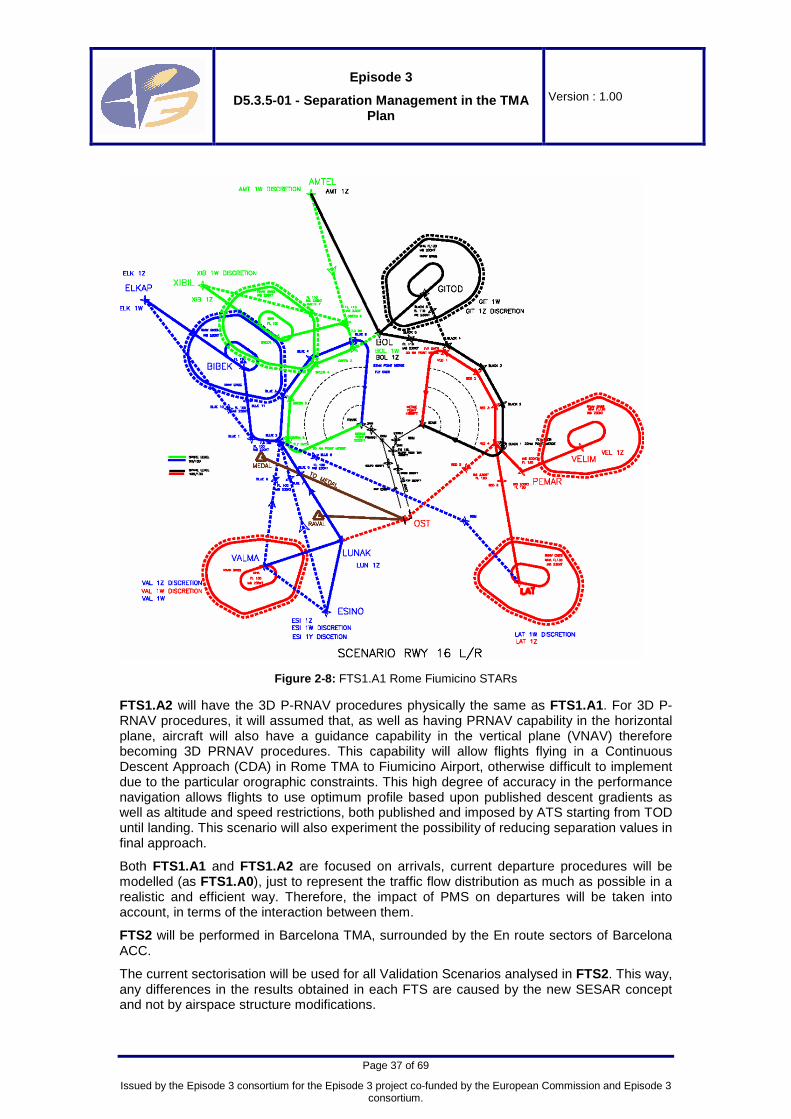
Episode 3
D5.3.5-01 - Separation Management in the TMA Plan
Version : 1.00
Page 37 of 69
Issued by the Episode 3 consortium for the Episode 3 project co-funded by the European Commission and Episode 3 consortium.
Figure 2-8: FTS1.A1 Rome Fiumicino STARs
FTS1.A2 will have the 3D P-RNAV procedures physically the same as FTS1.A1. For 3D P-RNAV procedures, it will assumed that, as well as having PRNAV capability in the horizontal plane, aircraft will also have a guidance capability in the vertical plane (VNAV) therefore becoming 3D PRNAV procedures. This capability will allow flights flying in a Continuous Descent Approach (CDA) in Rome TMA to Fiumicino Airport, otherwise difficult to implement due to the particular orographic constraints. This high degree of accuracy in the performance navigation allows flights to use optimum profile based upon published descent gradients as well as altitude and speed restrictions, both published and imposed by ATS starting from TOD until landing. This scenario will also experiment the possibility of reducing separation values in final approach.
Both FTS1.A1 and FTS1.A2 are focused on arrivals, current departure procedures will be modelled (as FTS1.A0), just to represent the traffic flow distribution as much as possible in a realistic and efficient way. Therefore, the impact of PMS on departures will be taken into account, in terms of the interaction between them.
FTS2 will be performed in Barcelona TMA, surrounded by the En route sectors of Barcelona ACC.
The current sectorisation will be used for all Validation Scenarios analysed in FTS2. This way, any differences in the results obtained in each FTS are caused by the new SESAR concept and not by airspace structure modifications.

Episode 3
D5.3.5-01 - Separation Management in the TMA Plan
Version : 1.00
Page 38 of 69
Issued by the Episode 3 consortium for the Episode 3 project co-funded by the European Commission and Episode 3 consortium.
The Barcelona TMA lateral boundaries are in the North the Spanish-French border, in the East Spanish FIR/UIR limit, and in the West and South the Barcelona ACC. Its vertical boundaries are from Ground or Sea level up to FL195 or FL255.
Barcelona TMA is based on a dynamic sectorisation that changes throughout the day, taking into account the different elementary volumes that are defined. However, the West Configuration CNF5W is the most common configuration, and therefore it will be used as the basis for the Validation Scenarios. The following table and graph show the sectors (and their elementary volumes) that compose this configuration:
Configuration Sectors
CNF5W LEBLFIN LEBLT1W LEBLT2W LEBLT3W LEBLT4W
Table 2-9 Elementary Volumes CNFW5 Barcelona TMA
LEBLGARI
LEBLGONA
LEBLFIN
LEBLNE1LEBLNW4
LEBLSABAH/L
LEBLVIBIH/L
LEBLSE2
LEBLSW3
Figure 2-9: Barcelona CFN5W Sectorisation
The following table indicates the characteristics of each sector:
Sector Vertical Limits Radar Separation
LEBLFIN GND-FL065 3NM
LEBLT1W GND-FL255 (Several intermediate limits) 5NM
LEBLT2W GND-FL195 (Several intermediate limits)
5NM
LEBLT3W GND-FL195 (Several intermediate limits) 5NM
LEBLT4W GND-FL195 (Several intermediate limits) 5NM
Table 2-10 CNFW5 Barcelona TMA separation
Each FTS2 Validation Scenario will consider the correspondent set of arrival and departure procedures:

Episode 3
D5.3.5-01 - Separation Management in the TMA Plan
Version : 1.00
Page 39 of 69
Issued by the Episode 3 consortium for the Episode 3 project co-funded by the European Commission and Episode 3 consortium.
FTS2.A0 will model the current RNAV network for Barcelona TMA. The following figures show the current Barcelona El Prat SID and STAR network.
Figure 2-10: Barcelona RNAV SIDs (DME/DME)
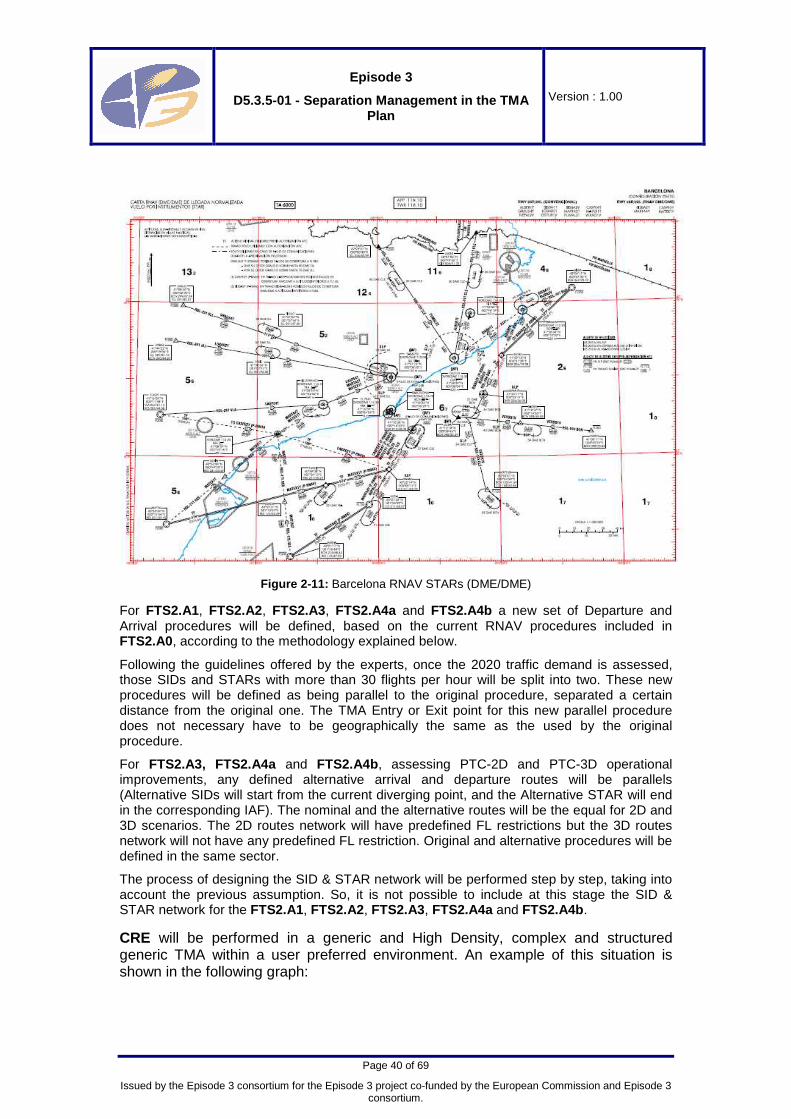
Episode 3
D5.3.5-01 - Separation Management in the TMA Plan
Version : 1.00
Page 40 of 69
Issued by the Episode 3 consortium for the Episode 3 project co-funded by the European Commission and Episode 3 consortium.
Figure 2-11: Barcelona RNAV STARs (DME/DME)
For FTS2.A1, FTS2.A2, FTS2.A3, FTS2.A4a and FTS2.A4b a new set of Departure and Arrival procedures will be defined, based on the current RNAV procedures included in FTS2.A0, according to the methodology explained below.
Following the guidelines offered by the experts, once the 2020 traffic demand is assessed, those SIDs and STARs with more than 30 flights per hour will be split into two. These new procedures will be defined as being parallel to the original procedure, separated a certain distance from the original one. The TMA Entry or Exit point for this new parallel procedure does not necessary have to be geographically the same as the used by the original procedure.
For FTS2.A3, FTS2.A4a and FTS2.A4b, assessing PTC-2D and PTC-3D operational improvements, any defined alternative arrival and departure routes will be parallels (Alternative SIDs will start from the current diverging point, and the Alternative STAR will end in the corresponding IAF). The nominal and the alternative routes will be the equal for 2D and 3D scenarios. The 2D routes network will have predefined FL restrictions but the 3D routes network will not have any predefined FL restriction. Original and alternative procedures will be defined in the same sector.
The process of designing the SID & STAR network will be performed step by step, taking into account the previous assumption. So, it is not possible to include at this stage the SID & STAR network for the FTS2.A1, FTS2.A2, FTS2.A3, FTS2.A4a and FTS2.A4b.
CRE will be performed in a generic and High Density, complex and structured generic TMA within a user preferred environment. An example of this situation is shown in the following graph:

Episode 3
D5.3.5-01 - Separation Management in the TMA Plan
Version : 1.00
Page 41 of 69
Issued by the Episode 3 consortium for the Episode 3 project co-funded by the European Commission and Episode 3 consortium.
HighHigh DensityDensity TMATMA
TMA TMA EntryEntry PointPoint
StructuredStructured SIDSID
RBTsRBTs enen--routeroute
Extended TMAExtended TMA
NewNew EntryEntry PointPoint
RBT RBT needneed updateupdate
HighHigh DensityDensity TMATMA
TMA TMA EntryEntry PointPoint
StructuredStructured SIDSID
RBTsRBTs enen--routeroute
Extended TMAExtended TMA
NewNew EntryEntry PointPoint
RBT RBT needneed updateupdate
Figure 2-12: Generic TMA for Transition Issues Study
There is a High Density TMA (brown shape) with certain fixed entry points (red circles) and a certain pre-defined set of arrival and departure procedures (in green). The surrounding En-Route airspace is an User Preferred Route environment where flights are flying their RBTs (in blue) until the TMA entry point. Departures fly their departures procedures up to their correspondent TMA Exit points.
There will be cases that, due to the complexity of the TMA, due to the need for more space needed for the sequencing, or due to any other cause, the TMA will need to be extended (pink shape), and this will also mean a change in the location of the TMA Entry and Exit points (pink circles). These TMA Entry and Exit points may change (they could be the same but displaced, or they could be completely new entry points, as well as the set of Arrival and Departure Procedures from the TMA).
When this happens, there will be several aspects that may change. These could include:
• The RBT need to be updated to the new fixed pre-defined arrival procedures (the initial RBTs within the blue circle in the area between the brown area and the pink area have changed due to the extension of the TMA boundaries). This trajectory updates may affect to all the flights arriving at the airport. The same for departures;
• The sequence within the new TMA area needs to be recalculated. The sequence may include flights that are now inside the TMA and those flights in the vicinity of the new TMA area.
This Exercise does not involve the modelling of any specific procedures. The proposed line of work for this exercise includes a close relation with WP531 TMA Expert Group through specific questionnaires and alternative scenarios.

Episode 3
D5.3.5-01 - Separation Management in the TMA Plan
Version : 1.00
Page 42 of 69
Issued by the Episode 3 consortium for the Episode 3 project co-funded by the European Commission and Episode 3 consortium.
2.5.5 Traffic Information
Validation Exercise FTS1 will use traffic available within SICTA. For this, they will use a 2006 Rome TMA traffic sample as a reference and will update this traffic to 2020 levels, taking into account the following;
• WP2 forecast will be considered. That is, the 2020 traffic sample will have the same number of aircraft in a similar geographical distribution;
• SESAR ConOps aspects for 2020 will be considered, including UPTs, direct routing and equipment;
• For the FTS1.A the 2020 traffic sample will be adapted to take into account 2D P-RNAV routes for arrivals to LIRF;
• For the FTS1.A2 the 2020 traffic sample will be adapted to model CDAs to LIRF.
2020 traffic sample provided by WP2 will be used in Validation Exercises FTS2. This traffic sample will need to be adapted to the procedures defined in each Validation Scenario. In order to do this, the following tasks will be carried out;
• Link every city-pair of 2020 to the SID-STAR network (this link has not been supplied by WP2);
• Solve the bunch of arrivals and departures taking into account the guidelines given by WP2 a pre-processing tool designed ad-hoc will be used to adapt the 2020 traffic sample;
• To use a more realistic traffic, assuming that the en-route and planning phases work properly, the demand will be modified to avoid 2 flights entering the TMA by the same entry point are not properly separated;
• In order to obtain the new route network for FTS2.A1, FTS2.A2, FTS2.A3, FTS2.A4a and FTS2.A4b, some tasks have to be considered. Pre-processing tools designed ad-hoc will assess on the count of traffic using the same procedure and will help in the rough design process of alternatives procedures.
Furthermore, the following assumption will be made;
• The aircraft performances (descent rate, speed, etc) used will be the ones used in current Barcelona studies performed by INECO;
In order to consider two different percentage of equipment of the fleet, the following values will be used:
• For FTS.A4a, 50% of the fleet will be 2D capable and the rest will be 50% 3D capable. As for FTS.A4b, 100% of the fleet will be 3D capable.
There is a risk that the task of adapting the traffic delivered by WP5 becomes too complex or too time consuming. If this is the case, FTS2 will use traffic available within INECO.
Due to the nature of Validation Exercise CRE, no traffic will be used for this Exercise.

Episode 3
D5.3.5-01 - Separation Management in the TMA Plan
Version : 1.00
Page 43 of 69
Issued by the Episode 3 consortium for the Episode 3 project co-funded by the European Commission and Episode 3 consortium.
2.5.6 Validation Scenarios
The table below summarises the information related to the set of Validation Scenarios included in WP5.3.5:
Validation Scenario ID
Traffic Used (Date)
Sectorization Used / Separation
applied
Route Structure
Used
Enablers/ OIs Introduced
FTS1.A0 2020 Current Tome TMA Sectorisation. Separation: 5NM for NE1 and NW1. 3NM for the rest.
Current Rome TMA Route Structure
N/A
FTS1.A1 2020 Current Rome TMA Sectorisation. Separation: 5NM for NE1 and NW1. 3NM for the rest.
New 2D P-RNAV
2D P-RNAV
AOM-0602, TS-0103
FTS1.A2 2020 Current Rome TMA Sectorisation. Separation: 5NM for NE1 and NW1. 3NM for the rest.
The possibility of reduced separation values due to the use of vertical guidance capability will be investigated.
New 3D PRNAV (2D-PRNAV + VNAV) with CDAs.
3D P-RNAV + CDAs
AOM-0602, AOM-0704, AOM-0702, TS-0102, TS-0103
FTS2.A0 2020 Current Barcelona TMA Sectorisation, slight modifications if needed. Separation: 3NM for sector Final, 5NM for
Current Barcelona TMA Route Structure
N/A
FTS2.A1 2020
Current Barcelona TMA Sectorisation, slight modifications if needed. Separation: 3NM for sector Final, 5NM for
New Route Structure for Barcelona TMA
N/A
FTS2.A2 2020
Current Barcelona TMA Sectorisation, slight modifications if needed. Separation: 3NM for sector Final, 5NM for other sectors
New Route Structure for Barcelona TMA. Same as FTS2.A1
Conflict Detection, Conflict Resolution, and Conformance Monitoring Tools.
CM-0405
FTS2.A3 2020 Current Barcelona TMA Sectorisation, slight modifications if needed. Separation: 3NM for sector Final, 5NM for other sectors
New Route Structure for Barcelona TMA Same as FTS2.A1
Allocation of Departure/Arrival Route & PTC-2D
CM-0601
Episode 3
D5.3.5-01 - Separation Management in the TMA Plan
Version : 1.00
Page 44 of 69
Issued by the Episode 3 consortium for the Episode 3 project co-funded by the European Commission and Episode 3 consortium.
Validation Scenario ID
Traffic Used (Date)
Sectorization Used / Separation
applied
Route Structure
Used
Enablers/ OIs Introduced
FTS2.A4a 2020 50% aircraft are 2-D Capable 50% aircraft are 3D Capable
Current Barcelona TMA Sectorisation, slight modifications if needed. Separation: 3NM for sector Final, 5NM for other sectors
New Route Structure for Barcelona TMA Same as FTS2.A1
Allocation of Departure/Arrival Profile & 3D Departure and arrival routes & PTC-3D
CM-0602
FTS2.A4b 2020 100% 3D Capable
Current Barcelona TMA Sectorisation, slight modifications if needed. Separation: 3NM for sector Final, 5NM for other sectors
New Route Structure for Barcelona TMA Same as FTS2.A1
Allocation of Departure/Arrival Profile & 3D Departure and arrival routes & PTC-3D
CM-0602
Table 2-11 Validation Scenario Summary
2.5.7 Additional Information
The following section summarises the main assumptions taken into consideration in Validation Exercises FTS1 and FTS2. These assumptions have been agreed by Experts:
Validation Exercise FTS1 and FTS2. Common Assumptions
1. Runway Capacity and TMA Capacity will not be a limiting factor. In this sense, there is no need to apply any holding procedures.
Validation Exercise FTS1. Scenario Assumptions
• Assumptions Regarding Airspace Sectorisation
2. In order to compare the results obtained in each Validation Scenario, and to be sure that these results are a consequence of the new SESAR concepts and not of any other scenario modifications, the three FTS1 Validation Scenarios will use the current airspace volumes in Rome TMA. However, since new procedures will be defined for FTS1.A1 and FTS1.A2, if minor changes are needed in the actual Rome TMA sectorisation, these changes will also be applied in the baseline FTS1.A0 Validation Scenario;
3. Rome TMA sector configuration refers to Rwy configuration of Fiumicino Airport using RWY 16L/R for landing and RWY 25 for take off;
4. The separation applied in Final Approach (ARR) and Departure sectors (DEPNORD & DEPSUD) is 3NM. In all other sectors, a 5NM separation is applied;
5. The same minimum separations conditions (e.g. 3NM) to detect a conflict and trigger the resolution tasks will be assumed for all scenarios;
• Assumptions Regarding Procedures
6. For FTS1.A0 the most relevant SIDs & STARs related to the airport of the Rome TMA with a high traffic flow (Rome Fiumicino LIRF, Rome Ciampino LIRA) will be modelled;
7. For FTS1.A1, a new 2D P-RNAV route network through the Point Merge System for the Arrival flows will be modelled for Arrival to Fiumicino Airport RWY 16L/R;

Episode 3
D5.3.5-01 - Separation Management in the TMA Plan
Version : 1.00
Page 45 of 69
Issued by the Episode 3 consortium for the Episode 3 project co-funded by the European Commission and Episode 3 consortium.
8. For FTS1.A1 and FTS1.A2 the current SID and STAR network will be applied for Rome Ciampino Airport;
9. The current departures procedures for Rome Fiumicino Airport will be considered in all FTS1 Validation Simulations, just to represent the traffic flow distribution as much as possible in a realistic and efficient way;
10. The impact of PMS on SIDs will be also taken into account, in terms of the interaction between them. For Validation Scenario FTS1.A1 and FTS1.A2, the impact on SIDs will be also taken into account, in terms of the interaction between them;
11. For Validation Scenario FTS1.A2, the guidance capability in the vertical plane will be considered, allowing the assessment of CDAs in Rome TMA, otherwise difficult to implement due to the particular orographic constraints;
• Assumptions Regarding ATCo Support Tools
12. En-route arrival queue management has already been performed before entering the TMA sectors and different flows of arrival have been merged.
Validation Scenario FTS2. Scenario Assumptions
• Assumptions Regarding Airspace Sectorisation
13. In order to compare the results obtained in each Validation Scenario, and to be sure that these results are a consequence of the new SESAR concepts and not of any other scenario modifications, the current sectorisation will be used all through FTS2. If any slight modifications is required in the definition of the new SID/STAR network for Validation Scenario FTS2.A1. (Current Concept, traffic 2020 – new routes network), the changes will also be applied in all other Validation Scenarios (FTS2.A0, FTS2.A2, FTS2.A3, FTS2.A4a and FTS2.A4b);
14. Controllers have a geographical assignment. That is, one controller manages departures and one controller manages arrivals;
15. The same minimum separations conditions to detect a conflict and trigger the resolution tasks will be assumed for all scenarios;
16. The separation applied in Final Approach and Departure sectors is 3NM. In all other sectors, a 5NM separation is applied;
• Assumptions Regarding Procedures
17. The pre-defined 3D arrival trajectories will be pre-designed until IAF, as arrivals to the same runway have to be integrated in the final approach;
18. The alternative SIDs or STARs will be designed as parallel to the nominal ones at 6NM (between centrelines) for same-direction routes and 7NM when there is opposite direction traffic (to be still agreed by Expert Group);
19. The current divergence point will be used as the starting point to design the pre-defined alternative SIDs;
20. SID & STAR network published in AIP already incorporates FL restrictions not only for obstacles issues but also for helping to “manage” the crossing points. This network will be considered for FTS2.A3 (2D). However, for FTS2.A4a and FTS2.A4b (3D) these “managing” FL restrictions will be removed, to let AUs propose their preferred vertical profile;
• Assumptions Regarding Traffic
21. For Validation Scenario FTS2.A0, the 2020 traffic will be injected in the current SID/STAR network. For the rest of the Validation Scenarios those SID/STARs with a traffic demand higher than 30 flights per hour (1 flight every two min) will be

Episode 3
D5.3.5-01 - Separation Management in the TMA Plan
Version : 1.00
Page 46 of 69
Issued by the Episode 3 consortium for the Episode 3 project co-funded by the European Commission and Episode 3 consortium.
split into two different nominal routes, each one having two alternative routes (one left and one right). Each route will be separated at least 6NM with respect the nearest one. The assignment will be done using ad-hoc pre-processing tools considering traffic count and traffic distribution;
• Assumptions Regarding ATCo Support Tools
For simulation purposes, the Conflict Detection tool and humans will have the same perception of a conflict;
For Validation Scenario FTS2.A2 (sensitivity analysis), three possible reductions in the task load of the associated ATC tasks affected by the introduction of the supporting tools will be analysed. A nominal value will be used as agreed by WP5.3.1 (Expert Group TMA). Two other values will be a certain percentage plus/minus this nominal value to be define depending on the values obtained wit these nominal values;
For Validation Scenario FTS2.A3, FTS2.A4a and FTS2.A4b, the support tools will be assumed but not analysed. Therefore, for these Validation Scenarios, a fixed reduction in the task load due to the monitoring tools will be selected and kept constants all through the three Validation Scenarios. These values will be selected depending on the outputs obtained from FTS2.A2.
2.5.8 Equipment scenario requirements
RAMS Plus will be used for the analysis of Optimum Spacing Techniques, supported by new separation modes, as well as for the analysis of new routing techniques in the Arrival and Departures phases.
In order to analyse some of these aspects, some updates need to be done to these Fast Time Simulation Tool. The validation needs have been identified and reported to ISA software (owner of the tool), which include:
• The introduction of New Separation Modes;
• The application of different Separation Modes to an aircraft according to its ATM Capability Level;
• Improvements in the sequencing of arriving aircraft;
• Improvements in the modelling of 3D P-RNAV;
• Introduction of the possibility to define 2D and 3D SIDs and STARs;
• Capability to simulate the execution of the Allocation of Departure Route/Profile processes.
A new final version of the tool is expected by the end of December 2008. However, an interim version has been provided, and more interim versions will be provided when new functions are incorporated.
2.6 EQUIPMENT REQUIRED TO CONDUCT THE EXERCISE
The Concept Validation Exercise will be performed using RAMS Plus, a Fast-Time Simulator that runs under PC Windows. Its mains applications are:
• En route, regional airspace and gate-to-gate models;
• Strategic Decision Making;
• Operational Decision Making;
• Airfield Elements Covered;
• Airside Elements Covered.

Episode 3
D5.3.5-01 - Separation Management in the TMA Plan
Version : 1.00
Page 47 of 69
Issued by the Episode 3 consortium for the Episode 3 project co-funded by the European Commission and Episode 3 consortium.
RAMS Plus is a fast-time discrete-event simulation software package providing functionality for the study and analysis of airspace structures, Air Traffic Control systems (e.g. separation assurance and separation monitoring), aircraft operations. RAMS Plus allows the simulation of a broad of current and future ATM concepts, enabling analysis of the effect of these Concepts in different KPAs such as capacity, safety and efficiency.
RAMS Plus features include an integrated editor and display tool, rapid data development, stochastic traffic generation, 4D flight profile calculation, 4D sectorisation, ATC controller elements (including multi-sector planners), airspace restrictions, airspace routes, 4D spatial conflict detection, rulebase conflict resolution, 4D resolution manoeuvring, workload assignment, TMA runway/holdstacks, free-flight and RVSM multi-use airspace, and graphic animation.
RAMS Plus relies on high-level-of-detail network representations of airfields and airspace. One of the principal perceived strengths of RAMS Plus is that allows traffic to move in tactical way: follow the nominal trajectory until a controller decides to change its trajectory for any reason. It also can check for lateral or vertical separation violations. Moreover, to avoid several potential pitfalls, RAMS Plus users should have a very good understanding of ATM and airport operations.
Within RAMS Plus, traffic moves along a network of links and nodes with each link or node (depending on whether airspace or airport surface operations are being modelled) being able to accommodate a single aircraft at a time. Whenever two aircraft converge on the same node or link, the rules programmed into the model determine how it would be managed by a controller and take the corresponding decision. These rules used to avoid conflicts are flexible and can be modified by the user depending on traffic characteristics, taking into account the operational methodology within the study.
Further information regarding RAMS Plus can be obtained from www.ramsplus.com.
Rams Plus will be used for the Workload Calculation. Discrete events are reported by Rams Plus, that define controller practices and allow the definition of future behaviour.
The user can assign any ATC Tasks to each involved ATC Actor associated to the discrete events reported given a certain set of conditions, also defined by the user. In this sense, one simulation event can trigger more than one ATC tasks, and one same ATC Task can be assigned to different ATC Actors. The ATC Tasks can be set to occur at the same time as its associated Simulation Event, or it can be set to occur a time before or after the Simulation Event, defined by the user.
Each ATC Task associated to each ATC Actor has a task weight assigned by the user, defined by its duration in seconds. Rams Plus calculates the workload in one hour associated to each actor by summing up the duration of each ATC Task that occurs within that hour for the corresponding ATC Actor.
The analysis of the transition issues related to the move from one structured and complex TMA to a bigger TMA will have theoretical approach.
This cooperation will be through the definition of a set of questions, in form of a Questionnaire, divided in different blocks, according to the different issues affected by the transition. This Questionnaire will be sent to the experts to obtain their feedback. Once this feedback is received, a working document will be produced and the questionnaire will be updated.
Both the working document and the updated questionnaire will be sent to the Experts for the feedback. With this feedback, a second version of the document will be prepared taking into account comments and answers from the Experts, after which a meeting will be organised to reach an consensus on all the aspects treated.

Episode 3
D5.3.5-01 - Separation Management in the TMA Plan
Version : 1.00
Page 48 of 69
Issued by the Episode 3 consortium for the Episode 3 project co-funded by the European Commission and Episode 3 consortium.
2.7 LINKS TO OTHER VALIDATION EXERCISES
The following graph shows the relationship between WP5.3.5 and other Validation Exercises within Episode 3 Project:
WP5.3.5
FTS
WP5.3.1
EXPERT GROUP
WP5.3.6
PROTOTYPING
Figure 2-13: WP5.3.5 Links to other WPs
WP5.3.1 TMA Expert Group provides important source of input to WP5.3.5. Work has done in a close relationship between both WPs in order to;
• Clarify these ATM Concept aspects addressed in the questionnaire;
• Agree on the hypothesis and assumptions made in both Validation Exercises.
This working relationship has been done via questionnaires and through a face to face meeting. All aspects discussed in the meeting have been used in the definition of the Validation Exercises within this Experimental Plan.
During the execution phase of WP5.3.5, this relationship between WP5.3.5 and WP5.3.1 will continue to carry out the analysis of the transition issues. The TMA Expert Group has an important role in the analysis of all transition aspects included in the scope of WP5.3.5.
WP5.3.5 and WP5.3.6 will have a close relationship during the whole duration of both Exercises, as some Validation Scenarios of both exercises have a similar scope, both exercises address Point Merge System (PMS) Concept. SICTA, partner in WP5.3.5 analysing PMS, is also involved in WP5.3.6. Even though that the outputs from one Exercise can not be used as an input to the other, due to time scales, both Exercises will work in an integrated manner.
Due to the application of different Validation Techniques (WP5.3.5 uses Fast Time Simulation, WP5.3.6 has several Prototyping Sessions) both Exercises will focus the problem, in different manners and will provide outputs with a different feedback. The first WP5.3.6 Prototyping Session has been held at EEC from 10th to 14th of November 2008, where a first application of PMS was analysed on Dublin TMA. Moreover, the fourth Prototyping Session will be organised under the leadership of ENAV with SICTA as a main contributor and based on Rome TMA. This participation of SICTA in WP5.3.6 will help WP5.3.5 to better focus the concept which will be analysed in WP5.3.5.
Furthermore, WP5.3.5 and WP5.3.6 will analyse the application of the P-RNAV Concept in two different TMAs (Dublin and Rome). This can provide evidence of the application of the same Concept in different parts the ECAC area.
2.8 CONCEPT ASSUMPTIONS.
The main assumptions for this Validation Exercise are completely aligned with those applied in SESAR T231/D4.

Episode 3
D5.3.5-01 - Separation Management in the TMA Plan
Version : 1.00
Page 49 of 69
Issued by the Episode 3 consortium for the Episode 3 project co-funded by the European Commission and Episode 3 consortium.
Further assumptions have been made from the definition of the concepts and processes defined in the General DOD [12] and DOD E5 [13]. These assumptions aim at clarifying the concept and have been agreed by Experts.
The following Concept Assumptions are applied for analysing 2D-PRNAV routes the arrival sequence of a complex TMA (Validation Scenario FTS1.A1):
1. P-RNAV/PMS technique will replace open-loop vectoring instructions, determining a decrease of ATCo Workload;
2. Separation loss will be taken as trigger of the alternate STARS of P-RNAV system;
3. The PMS Concept will facilitate the merging of traffic from a number of RNAV arrival routes;
4. The PMS Concept will allow the Controller to clear the aircraft off the arc direct to the merge point when separation from the preceding aircraft is assured;
5. Each arc has a published altitude that the aircraft must have reached before establishing on the arc. In general the arc nearest to the merge point has the highest altitude and that furthest away has the lowest altitude. If the aircraft reaches the end of the arc without receiving a “direct to” clearance, it automatically turns towards the merge point;
6. The clearance to descend is not given until the aircraft is clear of all other traffic and is usually the responsibility of the first Executive Controller in charge the final approach;
All aircraft have to fly, with an appropriate spacing/separation, at a common speed and altitude when they enter the arc, these constraints should be published at the entry waypoint and reached at least 10 NM before entering the sequencing leg. Traffic not properly pre-sequenced or outside the applied constraints is allowed only in case of contingency;
The following Concept Assumptions are applied for analysing 3D-PRNAV routes and CDAs in the arrival sequence of a complex TMA (Validation Scenario FTS1.A2):
All aircrafts are assumed to have guidance capability in the vertical plan;
Continuous Descent Profiles starting from TOD will be applied;
The following general Concept Assumptions are applied for the sensitivity analysis of the supporting tools (Validation Scenario FTS2.A2)10:
The Conflict Detection tool will alert the controller of possible conflicts, taking into account the latest RBTs available in the FMS ;
The Conflict Resolution tool will provide a set of possible resolutions for each detected conflict;
The Monitoring tool will alert the controller of any deviations or unexpected event that requires the attention of the controller;
The following general Concept Assumptions are applied for the validation of Allocation of Departure and Arrival Routes and Profiles, supported by PTC-2D and PTC-3D (FTS2.A3, FTS2.A4a & FTS2.4b):
8. The controller affected by the allocation tool and responsible to manage the clearance is the “first entry” TMA sector controller in arrivals and the departure controller in departures;
10 These assumptions will also apply to Validation Scenarios FTS2.A3, FTS2.A4a and FTS2.A4b.

Episode 3
D5.3.5-01 - Separation Management in the TMA Plan
Version : 1.00
Page 50 of 69
Issued by the Episode 3 consortium for the Episode 3 project co-funded by the European Commission and Episode 3 consortium.
9. The ground system will allocate Departure Profiles and Arrival Profiles. The Conflict Detection tool, taking into account the PT updated will alert of conflicts;
10. The SIDs & STARs network is the same for 2D Capable aircraft and for 3D Capable Aircraft;
11. The steps of the allocation of Departure Route (PTC 2D), Arrival Route (PTC 2D) Departure Profile (PTC 3D) and Arrival Profile (PTC 3D) processes are described in detail in the General DOD [12] and DOD E5 [13];
The following Concept Assumptions are applied for assessing the impact of the allocation of Departure/Arrival Route + Conflict Detection, Conflict Resolution and Monitoring Tools + PTC-2D (Validation Scenario FTS2.A3):
12. RBT portion is unlimited. One RBT clearance will be provided for the whole TMA transit. In case a potential conflict happens, a vertical profile restriction (RBT revision) will be performed. FL restriction as first option vectoring will be avoided;
13. Only if there is a potential conflict in sector A, the A executive controller will apply a new 2D clearance, constraining a FL to solve it as first option;
14. The longitudinal (time) dimension is relatively unconstrained other than by speed control;
15. There will be less lateral interventions needed, as there are more available routes;
16. The lateral uncertainty disappears. However, the vertical and time uncertainties remain;
The following Concept Assumptions are applied for assessing the impact of the allocation of Departure/Arrival Route + Conflict Detection, Conflict Resolution and Monitoring Tools + PTC-3D (FTS2.A4a and FTS2.A4b):
17. To apply PTC-3D concept, there will be an "allocation of arrival profile 3D" tool that will offer arrival conflict-free-tubes to avoid (x,y,z) ARR-ARR and ARR-DEP conflicts in the whole TMA. This tool will provide the initial allocation of the 3D arrival 200 NM before the runway The TMA arrival profile will be cleared with updated conflict management just before entering the TMA;
18. Automated allocation of 3D routes will be conflict-free along the TMA transit. This means that RBT portion is unlimited within the whole TMA transit, and therefore there is no need to provide any intermediate clearances to flights using 3D routes;
19. The vertical separation between two 3D flights evolving in the same procedure is the current vertical separation;
The following Concept Assumptions apply in Validation Scenario FTS2.A4a, where there is a mixed mode environment, coexisting 2D capable flights and 3D capable flights;
The 3D capable flights will be cleared all through the Arrival or Departure Procedure in the first TMA sector the flight enters; hence there is no need to provide them consecutive RBT clearances. Therefore there is no workload due to RBT Clearances for those 3D capable flights already cleared. (Except Departure and First Entry Sector). However, for 2D capable flights, the RBT clearance is needed.
2.9 SUMMARY
Annex A provides a summary and overview of the exercise scope.

Episode 3
D5.3.5-01 - Separation Management in the TMA Plan
Version : 1.00
Page 51 of 69
Issued by the Episode 3 consortium for the Episode 3 project co-funded by the European Commission and Episode 3 consortium.
3 PLANNING AND MANAGEMENT
3.1 ACTIVITIES
The main activities to perform the Validation Exercise are divided into three phases:
• Preparatory activities, which include:
1. Definition of the exercise, including selection of the SESAR CONOPS elements, platform, scenarios, identification of the principal variables, metrics to be measured and the identification of the hypotheses. The main output of this activity is this deliverable (D5.3.5-01 Experimental Plan);
2. Update of the FTS Platform. All specific requirements needed to update the FTS platform will be documented and sent to ISA Software who, as developer of RAMS, will carry out the necessary updates to the platform. Once the platform is updated, the new version will be analysed in order to determine the correct implementation of the requirements;
3. Adaptation of Traffic for the Simulation. The traffic will be adapted according to the modifications indicated in § 2.5.5;
4. Modelling of Scenarios. This includes, amongst other:
• Physical sectorisation, with all the necessary parameters (separation standards, control tools, etc);
• Arrival and/or Departure procedures, adaptations of the traffic needed and the rough design of alternative procedures;
• ATCo behaviour (including modification of resolution rules).
5. Definition of a Questionnaire. The definition of this questionnaires includes an initial assessments of what aspects could be affected by the transition, and how. This Questionnaire will be sent to experts within WP5.3.1 TMA Expert Group, who will provide answers;
• Execution activities, which include:
6. Simulation Execution for each Validation Scenario. Once the Validation Exercise has been correctly modelled, the scenario is simulated, and final results obtained;
Update Questionnaire and definition of Working Document. With the answers provided by the Experts, a second version of the Questionnaire will be produced with outstanding questions. Also a working document including the understanding, from the answers to the Questionnaire, of what and how is affected by the transition and sending to the Experts. Both the Questionnaire and the Working Document will be sent to experts;
• Post-Exercise Activities, which include:
7. Output data post-processing to obtain the selected metrics. The raw Fast-Time Simulation to the Performance Indicators and Key Performance Indicators;
8. Analysis of Simulation Results. The results obtained from the Simulation Activities will be analysed, in terms of Key Performance Indicators and in terms of Key Performance Areas and their corresponding Local Focus areas. This analysis includes obtaining conclusions from the specific Validation Exercises that will feed the Fast-Time Simulation Report;
Analysis of Answers to Questionnaire. The final answers and any comments made to the Working Document will be analysed within WP5.3.5. All conclusion obtained will be discussed with WP5.3.1 TMA Expert Group in a face-to-face meeting;

Episode 3
D5.3.5-01 - Separation Management in the TMA Plan
Version : 1.00
Page 52 of 69
Issued by the Episode 3 consortium for the Episode 3 project co-funded by the European Commission and Episode 3 consortium.
Preparation of the Simulation Report (D5.3.5-02), with indication on the work done, values obtained and conclusions for each Exercise. This report will include general conclusions regarding the feasibility of the SESAR Concept applied in a general complex TMA.
3.2 RESOURCES.
To perform this validation activity, several skills are required from the participants:
Experience in Validation Activities;
Knowledge of FTS tools, in particular, RAMS Plus;
Experience in data analysis.
The following table shows the expected effort in person weeks to perform all activities described in the previous section;

Episode 3
D5.3.5-01 - Separation Management in the TMA Plan
Version : 1.00
Page 53 of 69
Issued by the Episode 3 consortium for the Episode 3 project co-funded by the European Commission and Episode 3 consortium.
EFFORT (per week)
Activities Detail AENA ENAV INECO ISA ISDEFE LVF NATS SICTA
Exercise Definition 4 4 8 ---- 6 ---- ---- 4
Platform Update 2 ---- 4 8 ---- ---- ---- 4
Traffic Adaptation ---- ---- 2 ---- ---- ---- ---- 4
Modelling ---- ---- 21 ---- ---- ---- ---- 5
Preparatory
Questionnaire Definition 4 ---- ---- ---- ---- ---- ---- ----
Simulation Execution ---- ---- 1 ---- ---- ---- ---- 1.5
Execution Update Questionnaire 6 ---- ---- ---- ---- ---- ---- ----
Process Outputs
---- ---- 4 ---- ---- ---- ---- 1.5
Analysis Results ---- ---- 4 ---- 8 ---- ---- 4
Analysis Questionnaire 4 ---- ---- ---- ---- ---- ---- ----
Post-Exercise
Preparation Simulation Report
4 ---- 4 ---- 2 2 2 4
TOTAL (pw) 24 4 48 8 16 2 2 28
Table 3-1 Expected effort
3.3 RESPONSIBILITIES IN THE EXERCISE
This FTS Simulation Exercise has seven partners:
• AENA is Exercise Leader. Its main tasks are to coordinate all activities within the exercise and provide support to other partners of this sub-WP. AENA is also responsible for the integration of the contribution to the deliverables provided by the different partners to produce the final version of the deliverables. AENA will also carry out the analysis of transition issues;
• INECO is responsible for the sensitivity analysis for the introduction of support tools and for the analysis of the Allocation of Departure/Arrival Route and Allocation of Departure/Arrival Profile Concepts. They will prepare and conduct the exercise, provide support to AENA in all the activities required, and provide AENA their contributions to the Deliverables (D5.3.5-01 Experimental Plan and D5.3.5-02 Simulation Report);
• SICTA is responsible for the analysis of 3D P-RNAV and CDAs. They will prepare and conduct the exercise, provide support to AENA in all the activities requires, and provide AENA their contributions to the Deliverables (D5.3.5-01 Experimental Plan and D5.3.5-02 Simulation Report).

Episode 3
D5.3.5-01 - Separation Management in the TMA Plan
Version : 1.00
Page 54 of 69
Issued by the Episode 3 consortium for the Episode 3 project co-funded by the European Commission and Episode 3 consortium.
• ENAV will provide support in the definition of the Exercise. They will also review experimental plan;
• ISDEFE will analyse the outcomes of both validation exercises and they will also review the Deliverables D5.3.5-01 Experimental Plan and D5.3.5-02 Simulation Report;
• LFV will be to review the final Delivery D5.3.5-02 Simulation Report;
• NATS will be to review the final Delivery D5.3.5-02 Simulation Report.
3.4 TRAINING
The Exercises will be carried out by simulation and validation experts with background in the use of the different Fast-Time Simulation tools. The experience of the personnel involved should be adequate and no further training would be needed. However, some effort will be needed in order to master the new functionalities of Rams Plus (see §2.5.8).
3.5 TIME PLANNING
Indicators, and the requirements for the updating of the FTS tool. Due to the Project’s suspension and later new kick-off, a new scope was defined in September 2008. The Experimental Plan will be delivered for EP3 review on the 2nd of December, and will be delivered to the Commission on the 30th of December.
The exercise will finish in March 2009, when the joint Simulation Report for the Validation Exercises will be delivered.
A detailed planning of the activities will be specified in § 5.3.
3.6 RISKS.
The following table indicates the foreseen risk for this Exercise.
Risk 1: Platform’s update
Description: Some update needs to be implemented for those new enablers
Impacted Area: Own Exercise Other Exercise WP
Level: Low Medium High
Possibility of occurrence: Low Medium High
Contingency Actions Use of internal pre-processing and post-processing
Mitigation Actions: Continuous monitoring
Responsible party: WP5.3.5
Risk 2: WP2 Traffic adaptation
Description: The adaptation of the traffic delivered by WP2 might be too complex to adapt to a FTS
Impacted Area: Own Exercise Other Exercise WP

Episode 3
D5.3.5-01 - Separation Management in the TMA Plan
Version : 1.00
Page 55 of 69
Issued by the Episode 3 consortium for the Episode 3 project co-funded by the European Commission and Episode 3 consortium.
Level: Low Medium High
Possibility of occurrence: Low Medium High
Contingency Actions Use of internal traffic
Mitigation Actions: Continuous monitoring
Responsible party: WP2
Risk 3: No agreement on Transition Aspect
Description: Each Expert could have a different view on aspects under analysis, and an agreement is not reached
Impacted Area: Own Exercise Other Exercise WP
Level: Low Medium High
Possibility of occurrence: Low Medium High
Contingency Actions N/A
Mitigation Actions: N/A
Responsible party: WP5
Table 3-2 Risk identification
4 ANALYSIS SPECIFICATION
4.1 DATA COLLECTION METHODS
Two types of information can be obtained from the Exercises: quantitative, qualitative, and subjective data. Generally, “quantitative” information is related to objective measurements while “qualitative” information refers to subjective measurements.
• Quantitative data is obtained from information recorded by the simulations tool during each run. These data contain information regarding traffic trajectories, number of movements, etc and can be provided by FTS;
• Qualitative data is provided by human actors (pilots/controllers) intervening in the exercises and obtained by means of subjective data collection methods such as questionnaires or real time measurements. This information can be obtained only by prototyping sessions;
• Subjective data will be collected by opinion of several experts through the distribution of questionnaires.
The FTS tool that will be used for this exercise will produce quantitative data on different TMA aspect that are saved up in different files.
For the analysis of transition issues, a set of questionnaires will be sent to WP531 TMA Expert Group members to obtain their feedback. The information collected will be used to determine the need for an larger TMA, what aspects are affected by the transition from one

Episode 3
D5.3.5-01 - Separation Management in the TMA Plan
Version : 1.00
Page 56 of 69
Issued by the Episode 3 consortium for the Episode 3 project co-funded by the European Commission and Episode 3 consortium.
structured TMA to a larger TMA, how these aspects affect the overall system, and how this transition takes place.
4.2 OPERATIONAL AND STATISTICAL SIGNIFICANCE
Operationally significant changes are those that have a significant impact on ATM operations and are measured considering the exercises objectives. An operationally significant improvement will be recognised if the expected benefits are achieved.
For the Validation Exercises carried out by means of simulation, a baseline scenario will be performed and it will be calibrated. The statistical confidence level is considered acceptable if the simulation results of the model representing the operational context to be investigated are in line with the expected behaviour.
For the Validation Exercise regarding transition issues will be considered with a confidence level depending on the agreement achieved by all Experts involved in the process.
Often a result may be determined as being statistically significant but still may not be considered as operationally significant when viewed against the operational context. The comparison to operational context determines which of the results are meaningful.
4.3 ANALYSIS METHOD
For the Validation Exercise by means of Fast Time Simulation, the quantitative analysis will be done to reach a specific numerical result, often with an associated statistical level of confidence.
Descriptions of the data, such as by making graphs and histograms, will be provided in order to aid the interpretation of the results.
The analysis and reporting activities will include:
• Obtain raw data results recorded by the Fast-Time Simulation Tool;
• Post-processing of the Raw FTS data to into Performance Indicators. This will be done using in-house post-processing tools;
• Analysis of results, taking into account the PIs, KPIs and KPAs under study;
• Preparation of the simulation report.
This analysis method is summarised in the figure below.
Figure 4-1: Validation Exercises Analysis Method
The process for analysing Transition Issues is shown in the figure below.

Episode 3
D5.3.5-01 - Separation Management in the TMA Plan
Version : 1.00
Page 57 of 69
Issued by the Episode 3 consortium for the Episode 3 project co-funded by the European Commission and Episode 3 consortium.
First
Questionnaire
Experts
Feedback
Initial
Analysis
Updated
Questionnaire
Conclusions
Document
Experts
Feedback
Final
Analysis
First
Questionnaire
Experts
Feedback
Initial
Analysis
Updated
Questionnaire
Conclusions
Document
Experts
Feedback
Final
Analysis
Figure 4-2: Transition Issues Analysis Method
4.4 DATA LOGGING REQUIREMENTS
Data logging must be sufficient for the scope of the FTS validation exercises, in particular for reconstruction and analysis of the simulation results. Rams Plus will be set to produce and register the necessary data in order to calculate the necessary metrics.
The questionnaires prepared for the analysis of the transition issues will be done in form of an Spreadsheet in order to facilitate the data logging from each TMA Expert.
4.5 OUTLINE REPORTING PLANS
The Simulation Report will be delivered for EP3 Internal review on the 10th of March 2009. The format of this report will be that provided by WP2.5 through the Coordination Cell.
5 DETAILED EXERCISE DESIGN
5.1 DEPENDENT AND INDEPENDENT VARIABLES
Within each exercises, all environmental variables (such as sectorisations and separation) will be kept the same. Only the procedures under analysis will be modified in the different Validation Scenarios, as they have different characteristics according to the SESAR OI being addressed.
In one case (FTS2.A4a and FTS2.A4b), everything will be kept the same, including the procedures. However, the aircraft equipment will vary. For FTS2.A4a, 50% of the traffic will be 2D capable, whist the other 50% will be 3D capable. By doing so, it is possible to analyse the impact of the percentage of equipped aircraft when introducing the Allocation of Departure/Arrival profile, 3D Departure and Arrival routes, Conflict Detection, Resolution Tools and Conformance Monitoring Tools, and PTC-3D.
The following sections explains the dependent and independent variables associated to each KPAs addressed by this Validation Exercise.
5.1.1 Capacity
As for the metrics to be provided by WP5.3.5, capacity is not a parameter that can be obtained directly form the simulation. ATC Workload and the Number of flights within a sector are dependent variables contributing to capacity calculation.

Episode 3
D5.3.5-01 - Separation Management in the TMA Plan
Version : 1.00
Page 58 of 69
Issued by the Episode 3 consortium for the Episode 3 project co-funded by the European Commission and Episode 3 consortium.
Sector capacity is obtained using a mathematical approach taking into account the number of flights entering a sector in an hour and the ATCo workload related to the management of this traffic load.
Sector Capacity is calculated by plotting the ATC workload versus the corresponding number of flights in the sector in the period of time. Once this is plotted, a tendency line is obtained that is used to calculate the sector capacity. The capacity will be that where the predefined workload saturation value, defined as the maximum workload assumable by a controller, cuts this tendency line.
It is commonly accepted in the ATM environment, through several studies (documents [15], [16] and [17]), that a controller can not be performing tasks 100% of his time, he needs approximately 30% of his time for recovering. Therefore, it is assumed that the ATCo saturation limit corresponds to 70% of his workload.
5.1.2 Safety
Safety cannot be measured directly from the simulation. Therefore, safety will be assessed in terms of the expected reduction in the number of potential separation losses (i.e. conflicts). In this sense, the less potential conflicts occur, the safer the system is.
Safety will also be measured by the expected reduction in the time ATCos are overloaded or under-loaded. Normally, during overload periods, the situational awareness decreases because the controller has to put more attention to handle the traffic, and, as consequence the safety is decreased. On the other hand, the underload periods could lead to a lack of concentration reducing safety.
5.1.3 Efficiency
Efficiency will be measured in terms of the difference between the actual flying time and the optimum one11. The simulation will provide both values, and the corresponding deviation from the optimum flight time will be analysed to assess the potential efficiency improvement.
5.2 LENGTH AND NUMBER OF RUNS
Each Validation Scenario, a 24 hour traffic sample will be simulated.
A series of statistical concepts are used in order to establish the number of periods of simulation that are needed to achieve a high confidence in the obtained results. These concepts are explained within this section.
There are some tolerance statistical limits that are independent of the main distribution shape. These limits are based on the lowest and the highest value from a sample composed by “n” simulated elements (where “n” in this exercise is the number workload-per-hour values estimated from the fast time simulation each 20 minutes).
Taking into account the previous paragraph, the number of elements required to achieve, with a probability of γ%, that at least the 100(1-α)% of the distribution is in between of the highest and the lowest measured values is expressed by:
11 The optimum flight time is the time associated to RBT.

Episode 3
D5.3.5-01 - Separation Management in the TMA Plan
Version : 1.00
Page 59 of 69
Issued by the Episode 3 consortium for the Episode 3 project co-funded by the European Commission and Episode 3 consortium.
Where is the 100(1-γ) percentage point of the distribution with 4 degrees of freedom.
For this exercise, although absolute capacity values are going to be obtained, the main results will come from the observation of the improvement due to the introduction of new OI steps. In comparison studies the following statistics parameters are usually considered.
With a 95% probability, the 90% of the main distribution is in between the highest and the lowest measured values.
α=0.10, γ=0.95 ⇒ n = 46 workload FTS estimations
In order to reach this number of workload estimations, hourly workload values will be obtained with a sliding window of 20 minutes12, obtaining therefore 72 workload-per-hour values estimates, that will be used for the capacity estimation indicated in the previous section.
For the Transition Issues under analysis, a first questionnaire will be delivered to the experts, and with the answers provided, it will be updated and sent again for further refinement. In order to ensure the successful completion of the expert group sessions, prior to the first delivery of the questionnaire, the questions (wording, content and scope) will be discuss with the experts.
Also, a working document will be produced including conclusions and findings, and will also be provided to the experts, in a first version after the first questionnaire is answered, and on a final version for review after the second questionnaire has been answered.
5.3 TIME PLANNING FOR THE EXERCISE
The planning is summarised in the following table;
Week
2008 2009 Activity
36 37 38 …41 42 43 44 …52 1 2 3 4 5 6 7 8 9 10 11
Exercise Definition
Platform Update
Modelling (inc. traffic adaptation)
Questionnaire Definition
Simulation Execution
Update Questionnaire
Process Outputs and Analysis
12A sliding window of 20 minutes implies calculating hourly workload every 20 minutes instead of every hour. This means providing three workload values per hour period.

Episode 3
D5.3.5-01 - Separation Management in the TMA Plan
Version : 1.00
Page 60 of 69
Issued by the Episode 3 consortium for the Episode 3 project co-funded by the European Commission and Episode 3 consortium.
Analysis Questionnaire
Simulation Report
Table 5-1 Detailed Planning

Episode 3
D5.3.5-01 - Separation Management in the TMA Plan
Version : 1.00
Page 61 of 69
Issued by the Episode 3 consortium for the Episode 3 project co-funded by the European Commission and Episode 3 consortium.
6 REFERENCES AND APPLICABLE DOCUMENTS
6.1 APPLICABLE DOCUMENTS
Ref. Document Name
[1] EP3 / Proposal 037106 / V2.8/ Contract Amendment N°2
Episode3 DoW
[2] E-OCVM E-OCVM Version 2.0
[3] E3-WP2-D2.0-03-RQT Performance Framework cycle 1
[4] E3-WP2-D2.3-01-WKP Guidance Material for identification of Validation issues at WP and programme level: steps 0.1 to 1.7 of the E-OCVM
[5] DLM-0607-001-01-00 SESAR D2: Air Transport Framework, The Performance Target
[6] RPT-0708-001-01-01 The SESAR Performance Booklet
[7] DLM-0612-001-02-00 SESAR D3: The ATM Target Concept
[8] DLT-0612-222-01-00 SESAR Concept of Operations
[9] DLM-0706-001-01-00 SESAR D4: ATM Deployment Sequence
[10] DLT-0707-008-01-00 9 Scenarios illustrating the SESAR CONOPS
[11] E3-WP2-D2.3-03-WKP Guidance Material for identification of Validation issues at WP and programme level: steps 2.1 to 2.6 of the E-OCVM
[12] E3-D2.2-020-V3.0 SESAR Detail Operational Description- General Purpose DOD –G
[13] E3-WP2-D2.2-027--V3.0 Arrival and Departure – High and Medium/Low Density Operations – E5
Table 6-1 Applicable documents
6.2 REFERENCES
Ref. Document Name
[14] CDA Implementation Guidance Continuous Descent Approach, Implementation Guidance Information, May 2008
[15] CAPAN. (CENA) CAPAN The ATC Sector Anyliser
[16] Technique de détermination de la Capacité. (CENA)
Technique de détermination de la Capacité des sectors de contrôle de l’espace aèrien.
[17] Controller Roles. (Graham, Mardsen, Dowling. EUROCONTROL)
Controller Roles – time to change..
Table 6-2 References
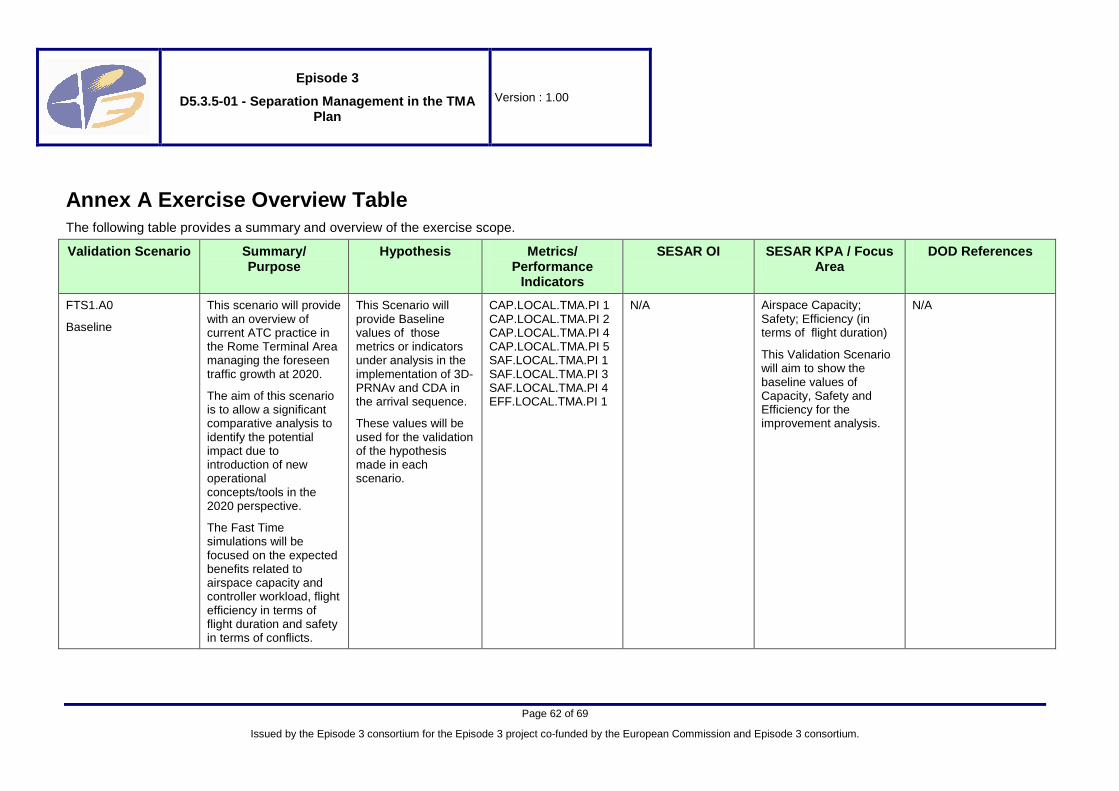
Episode 3
D5.3.5-01 - Separation Management in the TMA Plan
Version : 1.00
Page 62 of 69
Issued by the Episode 3 consortium for the Episode 3 project co-funded by the European Commission and Episode 3 consortium.
Annex A Exercise Overview Table The following table provides a summary and overview of the exercise scope.
Validation Scenario Summary/ Purpose
Hypothesis Metrics/ Performance
Indicators
SESAR OI SESAR KPA / Focus Area
DOD References
FTS1.A0
Baseline
This scenario will provide with an overview of current ATC practice in the Rome Terminal Area managing the foreseen traffic growth at 2020.
The aim of this scenario is to allow a significant comparative analysis to identify the potential impact due to introduction of new operational concepts/tools in the 2020 perspective.
The Fast Time simulations will be focused on the expected benefits related to airspace capacity and controller workload, flight efficiency in terms of flight duration and safety in terms of conflicts.
This Scenario will provide Baseline values of those metrics or indicators under analysis in the implementation of 3D-PRNAv and CDA in the arrival sequence.
These values will be used for the validation of the hypothesis made in each scenario.
CAP.LOCAL.TMA.PI 1 CAP.LOCAL.TMA.PI 2 CAP.LOCAL.TMA.PI 4 CAP.LOCAL.TMA.PI 5 SAF.LOCAL.TMA.PI 1 SAF.LOCAL.TMA.PI 3 SAF.LOCAL.TMA.PI 4 EFF.LOCAL.TMA.PI 1
N/A Airspace Capacity; Safety; Efficiency (in terms of flight duration)
This Validation Scenario will aim to show the baseline values of Capacity, Safety and Efficiency for the improvement analysis.
N/A
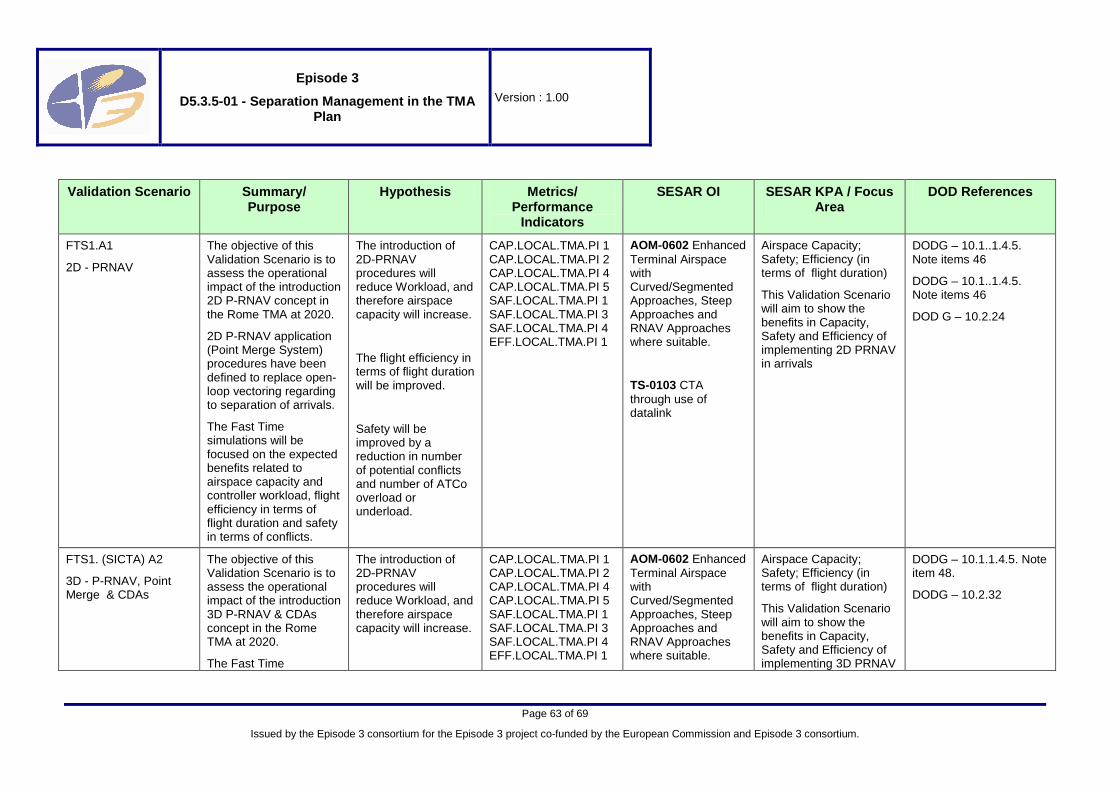
Episode 3
D5.3.5-01 - Separation Management in the TMA Plan
Version : 1.00
Page 63 of 69
Issued by the Episode 3 consortium for the Episode 3 project co-funded by the European Commission and Episode 3 consortium.
Validation Scenario Summary/ Purpose
Hypothesis Metrics/ Performance
Indicators
SESAR OI SESAR KPA / Focus Area
DOD References
FTS1.A1
2D - PRNAV
The objective of this Validation Scenario is to assess the operational impact of the introduction 2D P-RNAV concept in the Rome TMA at 2020.
2D P-RNAV application (Point Merge System) procedures have been defined to replace open-loop vectoring regarding to separation of arrivals.
The Fast Time simulations will be focused on the expected benefits related to airspace capacity and controller workload, flight efficiency in terms of flight duration and safety in terms of conflicts.
The introduction of 2D-PRNAV procedures will reduce Workload, and therefore airspace capacity will increase.
The flight efficiency in terms of flight duration will be improved.
Safety will be improved by a reduction in number of potential conflicts and number of ATCo overload or underload.
CAP.LOCAL.TMA.PI 1 CAP.LOCAL.TMA.PI 2 CAP.LOCAL.TMA.PI 4 CAP.LOCAL.TMA.PI 5 SAF.LOCAL.TMA.PI 1 SAF.LOCAL.TMA.PI 3 SAF.LOCAL.TMA.PI 4 EFF.LOCAL.TMA.PI 1
AOM-0602 Enhanced Terminal Airspace with Curved/Segmented Approaches, Steep Approaches and RNAV Approaches where suitable.
TS-0103 CTA through use of datalink
Airspace Capacity; Safety; Efficiency (in terms of flight duration)
This Validation Scenario will aim to show the benefits in Capacity, Safety and Efficiency of implementing 2D PRNAV in arrivals
DODG – 10.1..1.4.5. Note items 46
DODG – 10.1..1.4.5. Note items 46
DOD G – 10.2.24
FTS1. (SICTA) A2
3D - P-RNAV, Point Merge & CDAs
The objective of this Validation Scenario is to assess the operational impact of the introduction 3D P-RNAV & CDAs concept in the Rome TMA at 2020.
The Fast Time
The introduction of 2D-PRNAV procedures will reduce Workload, and therefore airspace capacity will increase.
CAP.LOCAL.TMA.PI 1 CAP.LOCAL.TMA.PI 2 CAP.LOCAL.TMA.PI 4 CAP.LOCAL.TMA.PI 5 SAF.LOCAL.TMA.PI 1 SAF.LOCAL.TMA.PI 3 SAF.LOCAL.TMA.PI 4 EFF.LOCAL.TMA.PI 1
AOM-0602 Enhanced Terminal Airspace with Curved/Segmented Approaches, Steep Approaches and RNAV Approaches where suitable.
Airspace Capacity; Safety; Efficiency (in terms of flight duration)
This Validation Scenario will aim to show the benefits in Capacity, Safety and Efficiency of implementing 3D PRNAV
DODG – 10.1.1.4.5. Note item 48.
DODG – 10.2.32

Episode 3
D5.3.5-01 - Separation Management in the TMA Plan
Version : 1.00
Page 64 of 69
Issued by the Episode 3 consortium for the Episode 3 project co-funded by the European Commission and Episode 3 consortium.
Validation Scenario Summary/ Purpose
Hypothesis Metrics/ Performance
Indicators
SESAR OI SESAR KPA / Focus Area
DOD References
simulations will be focused on the expected benefits related to airspace capacity and controller workload, flight efficiency in terms of flight duration and safety in terms of conflicts.
The flight efficiency in terms of flight duration will be improved.
Safety will be improved by a reduction in number of potential conflicts and number of ATCo overload or underload.
AOM-0702 Advanced Continuous Descent Approach
TS-0102 Arrival Management Supporting TMA Improvements (incl. CDA, P-RNAV)
AOM-0704 Tailored Arrivals
in conjunction with CDAs and Point Merge Techniques in arrivals
FTS2. A0
Current Concept (traffic 2020 – current routes and sectors network)
The current working methodology, with the current route structure will be applied with the 2020 trafficsample.
The purpose of the Scenario is to highlight the need of a new design of SID, STAR and sector net.
The values obtained for each SESAR KPI will be worse than current values. That is, workload will be higher than actual, reducing therefore Airspace Capacity. Also, safety and efficiency will be worsen with respect to the actual situation.
CAP.LOCAL.TMA.PI 1 CAP.LOCAL.TMA.PI 2 SAF.LOCAL.TMA.PI 2 SAF.LOCAL.TMA.PI 3 SAF.LOCAL.TMA.PI 4 EFF.LOCAL.TMA.PI 1 EFF.LOCAL.TMA.PI 2 EFF.LOCAL.TMA.PI 5 EFF.LOCAL.TMA.PI 6
N/A Airspace Capacity; Safety; Efficiency (in terms of flight duration)
This Validation Scenario will aim to show the values of Capacity, Safety and Efficiency if no improvements are introduced.
N/A
FTS2. A1
Current Concept (traffic 2020 – new routes network, current sectors network)
New procedures will be introduced for 2020 traffic sample, keeping the current working methodology, with the objective of determining
Using the new SID and STAR network, this scenario will show that there will still be a lack of capacity. So the SESAR OIs are
CAP.LOCAL.TMA.PI 1 CAP.LOCAL.TMA.PI 2 SAF.LOCAL.TMA.PI 2 SAF.LOCAL.TMA.PI 3 SAF.LOCAL.TMA.PI 4 EFF.LOCAL.TMA.PI 1
N/A Airspace Capacity; Safety; Efficiency (in terms of flight duration)
This Validation Scenario will aim to show the
DOD E5 – 7. Annex A. Operational Scenarios.

Episode 3
D5.3.5-01 - Separation Management in the TMA Plan
Version : 1.00
Page 65 of 69
Issued by the Episode 3 consortium for the Episode 3 project co-funded by the European Commission and Episode 3 consortium.
Validation Scenario Summary/ Purpose
Hypothesis Metrics/ Performance
Indicators
SESAR OI SESAR KPA / Focus Area
DOD References
the impact of introducing new procedures.
needed to meet the 2020 capacity requirements.
The values obtained for each SESAR KPI will be better that for FTS2.A1 with the introduction of new procedures.
Using the new SID and STAR network, this scenario will show that there will still be a lack of capacity. So the SESAR OIs are needed to meet the 2020 capacity requirements.
EFF.LOCAL.TMA.PI 2 EFF.LOCAL.TMA.PI 5 EFF.LOCAL.TMA.PI 6
baseline values of Capacity, Safety and Efficiency for the improvement analysis.
FTS2.A2
Conflict Detection, Conflict Resolution and Monitoring Tools. Sensitivity Analysis.
This Scenario will analysis the effect of introduction of Conflict Detection, Conflict Resolution and Monitoring tools with different levels of support, specially in Airspace Capacity.
The main objective of this sensitivity analysis
The introduction of advanced support tools will reduce Workload, and therefore airspace capacity will increase.
Safety will be improved by a reduction in number of ATCo overload .
CAP.LOCAL.TMA.PI 1 CAP.LOCAL.TMA.PI 2 SAF.LOCAL.TMA.PI 2 SAF.LOCAL.TMA.PI 3 SAF.LOCAL.TMA.PI 4 EFF.LOCAL.TMA.PI 1 EFF.LOCAL.TMA.PI 2 EFF.LOCAL.TMA.PI 5 EFF.LOCAL.TMA.PI 6
CM-0405 Automated Assistance to ATC Planning for Preventing Conflicts in Terminal Area Operations
Airspace Capacity; Safety;)
This Validation Scenario will aim to show the baseline values of Capacity, Safety and Efficiency for the improvement analysis and to provide best reduction of support tools
DOD E5 – 7. Annex A. Operational Scenarios.

Episode 3
D5.3.5-01 - Separation Management in the TMA Plan
Version : 1.00
Page 66 of 69
Issued by the Episode 3 consortium for the Episode 3 project co-funded by the European Commission and Episode 3 consortium.
Validation Scenario Summary/ Purpose
Hypothesis Metrics/ Performance
Indicators
SESAR OI SESAR KPA / Focus Area
DOD References
will be to provide support in defining the task load reduction needed by these supporting tools to obtain the required capacity gain needed with 2020 traffic levels.
This Scenario will provide the baseline PIs values to determine the expected improvements achieved by the introduction of the concept analysed in FTS2.A3, FTS2.4a and FTS2.A4b.
FTS2.A3
Allocations Depart / Arrival Routes & PTC-2D
To estimate the benefits due to the introduction of Allocation of Departure / Arrival Route concept and the introduction of PTC-2D.
The introduction of analysed concepts will reduce Workload, and therefore airspace capacity will increase.
The flight efficiency in terms of flight duration will be improved.
Safety will be improved by a reduction in number of potential conflicts
CAP.LOCAL.TMA.PI 1 CAP.LOCAL.TMA.PI 2 SAF.LOCAL.TMA.PI 2 SAF.LOCAL.TMA.PI 3 SAF.LOCAL.TMA.PI 4 EFF.LOCAL.TMA.PI 1 EFF.LOCAL.TMA.PI 2 EFF.LOCAL.TMA.PI 5 EFF.LOCAL.TMA.PI 6
CM-0601 Precision Trajectory Clearances (PTC)-2D Based On Pre-defined 2D Routes
Airspace Capacity; Safety; Efficiency (in terms of flight duration)
This Validation Scenario will aim to show the values of Capacity, Safety and Efficiency and the improvement with respect to FTS2.A2.
DOD G – 9.2.22 Allocation of the Departure Route
DOD E5 – 7. Annex A. Operational Scenarios

Episode 3
D5.3.5-01 - Separation Management in the TMA Plan
Version : 1.00
Page 67 of 69
Issued by the Episode 3 consortium for the Episode 3 project co-funded by the European Commission and Episode 3 consortium.
Validation Scenario Summary/ Purpose
Hypothesis Metrics/ Performance
Indicators
SESAR OI SESAR KPA / Focus Area
DOD References
and number of ATCo overload or underload.
FTS2.A4a
Allocations Depart / Arrival Routes & PTC-3D. Mixed environment
To estimate the benefits due to the introduction of Allocation of Departure / Arrival Route concept, the introduction of 3D Departure and arrival routes and the introduction of PTC-3D.
It will be assumed that 50% of flights are 3D Capable and 50% of flights are 2D Capable in order to analyse the effect of having a mixed capability environment.
The introduction of analysed concepts will reduce Workload, and therefore airspace capacity will increase.
The flight efficiency in terms of flight duration will be improved.
Safety will be improved by a reduction in number of potential conflicts and number of ATCo overload or underload.
CAP.LOCAL.TMA.PI 1 CAP.LOCAL.TMA.PI 2 SAF.LOCAL.TMA.PI 2 SAF.LOCAL.TMA.PI 3 SAF.LOCAL.TMA.PI 4 EFF.LOCAL.TMA.PI 1 EFF.LOCAL.TMA.PI 2 EFF.LOCAL.TMA.PI 5 EFF.LOCAL.TMA.PI 6
CM-0602 Precision Trajectory Clearances (PTC)-3D Based On Pre-defined 3D Routes
Airspace Capacity; Safety; Efficiency (in terms of flight duration)
This Validation Scenario will aim to show the values of Capacity, Safety and Efficiency and the improvement with respect to FTS2.A2 and FTS2.A3.
DOD G – 9.2.23 Allocation of the Departure Profile.
DOD E5 – 7. Annex A. Operational Scenarios.
FTS2.A4b
Allocations Depart / Arrival Routes & PTC-3D. Fully equipped environment
To estimate the benefits due to the introduction of Allocation of Departure / Arrival Route concept, the introduction of 3D Departure and arrival routes and the
The introduction of analysed concepts will reduce Workload, and therefore airspace capacity will
CAP.LOCAL.TMA.PI 1 CAP.LOCAL.TMA.PI 2 SAF.LOCAL.TMA.PI 2 SAF.LOCAL.TMA.PI 3 SAF.LOCAL.TMA.PI 4 EFF.LOCAL.TMA.PI 1 EFF.LOCAL.TMA.PI 2
CM-0405 Automated Assistance to ATC Planning for Preventing Conflicts in Terminal Area Operations
Airspace Capacity; Safety; Efficiency (in terms of flight duration)
This Validation Scenario will aim to show the values of Capacity,
DOD G – 9.2.23 Allocation of the Departure Profile.
DOD E5 – 7. Annex A. Operational Scenarios.

Episode 3
D5.3.5-01 - Separation Management in the TMA Plan
Version : 1.00
Page 68 of 69
Issued by the Episode 3 consortium for the Episode 3 project co-funded by the European Commission and Episode 3 consortium.
Validation Scenario Summary/ Purpose
Hypothesis Metrics/ Performance
Indicators
SESAR OI SESAR KPA / Focus Area
DOD References
introduction of PTC-3D.
It will be assumed that all aircraft will be 3D Capable to analyse the full benefits of the Concepts introduced.
increase.
The flight efficiency in terms of flight duration will be improved.
Safety will be improved by a reduction in number of potential conflicts and number of ATCo overload or underload.
EFF.LOCAL.TMA.PI 5 EFF.LOCAL.TMA.PI 6
CM-0602 Precision Trajectory Clearances (PTC)-3D Based On Pre-defined 3D Routes
Safety and Efficiency and the improvement with respect to FTS2.A2., FTS2.A3 and FTS2.A4a.
Table 6-3 Overview exercise scope

Episode 3
D5.3.5-01 - Separation Management in the TMA Plan
Version : 1.00
Page 69 of 69
Issued by the Episode 3 consortium for the Episode 3 project co-funded by the European Commission and Episode 3 consortium.
END OF DOCUMENT