episode 3 - eurocontrol · simulated part of german airspace ... sectors for the advanced...
TRANSCRIPT
Episode 3
D5.3.4-02 - Results of FTS on Multi-Airport TMA operations in the core area of Europe
Version : 1.00
Page 1 of 125
Issued by the Episode 3 consortium for the Episode 3 project co-funded by the European Commission and Episode 3 consortium.
EPISODE 3 Single European Sky Implementation support through Validation
Document information
Programme Sixth framework programme Priority 1.4 Aeronautics and Space
Project title Episode 3
Project N° 037106
Project Coordinator EUROCONTROL Experimental Centre
Deliverable Name Results of FTS on Multi-Airport TMA operations in the core area of Europe
Deliverable ID D5.3.4-02
Version 1.00
Owner
Hugo de Jonge NLR
Contributing partners
DFS, LVNL, LFV

Episode 3
D5.3.4-02 - Results of FTS on Multi-Airport TMA operations in the core area of Europe
Version : 1.00
Page 2 of 125
Issued by the Episode 3 consortium for the Episode 3 project co-funded by the European Commission and Episode 3 consortium.
- This page is intentionally blank -

Episode 3
D5.3.4-02 - Results of FTS on Multi-Airport TMA operations in the core area of Europe
Version : 1.00
Page 3 of 125
Issued by the Episode 3 consortium for the Episode 3 project co-funded by the European Commission and Episode 3 consortium.
DOCUMENT CONTROL
Approval
Role Organisation Name
Document owner NLR Hugo de Jonge
Technical approver NATS Richard Powell
Quality approver ERC Catherine Palazo
Project coordinator ERC Philippe Leplae
Version history
Version Date Status Author(s) Justification - Could be a
reference to a review form or a comment sheet
1.00 14/10/2009 APPROVED Hugo de Jonge The document is approved by the Episode 3 consortium
Episode 3
D5.3.4-02 - Results of FTS on Multi-Airport TMA operations in the core area of Europe
Version : 1.00
Page 4 of 125
Issued by the Episode 3 consortium for the Episode 3 project co-funded by the European Commission and Episode 3 consortium.
TABLE OF CONTENTS
EXECUTIVE SUMMARY........................................................................................................... 9
1 INTRODUCTION ............................................................................................................. 10 1.1 PURPOSE OF THE DOCUMENT ..................................................................................... 10 1.2 INTENDED AUDIENCE.................................................................................................. 10 1.3 SCOPE AND STRUCTURE OF THE DOCUMENT............................................................... 11 1.4 EXPERIMENT BACKGROUND AND CONTEXT.................................................................. 11 1.5 CONCEPT OVERVIEW ................................................................................................. 12 1.6 GLOSSARY OF TERMS ................................................................................................ 12
2 EXERCISE SCOPE AND EXECUTION.......................................................................... 16 2.1 STAKEHOLDERS AND THEIR EXPECTATIONS ................................................................. 16 2.2 DESCRIPTION OF ATM CONCEPT BEING ADDRESSED.................................................... 20
2.2.1 Scope of the Operational Concept of Interest ................................................. 20 2.2.2 Detailed outline of the Operational Concept of Interest................................... 21 2.2.3 Level of Maturity of Concept of Interest........................................................... 30 2.2.4 KPAs related to the Concept of Interest .......................................................... 31
2.3 EXERCISE OBJECTIVES ............................................................................................... 32 2.4 CHOICE OF INDICATORS AND METRICS ......................................................................... 36 2.5 VALIDATION SCENARIO ............................................................................................... 40
2.5.1 Hypothesis ....................................................................................................... 43 2.5.2 Airport Information ........................................................................................... 46 2.5.3 Airspace Information........................................................................................ 50 2.5.4 Traffic Information............................................................................................ 54 2.5.5 Additional Information ...................................................................................... 56 2.5.6 Equipment scenario requirements ................................................................... 56
2.6 EXERCISE TOOLS AND/OR PLATFORMS TO CONDUCT THE EXERCISE ............................ 57 2.7 LINKS TO OTHER VALIDATION EXERCISES .................................................................... 58 2.8 CONCEPT ASSUMPTIONS ............................................................................................ 61
3 CONDUCT OF THE VALIDATION EXERCISE RUNS............ ....................................... 66 3.1 EXPERIMENT PREPARATION........................................................................................ 66
3.1.1 Simulation runs ................................................................................................ 66 3.1.2 Data collection methods .................................................................................. 66 3.1.3 Operational and statistical significance ........................................................... 67 3.1.4 Data logging requirements............................................................................... 67 3.1.5 Summary.......................................................................................................... 68
3.2 CONDUCT OF EXPERIMENT ......................................................................................... 69 4 EXPERIMENT RESULTS................................................................................................ 75
4.1 OVERVIEW ................................................................................................................. 75 4.2 RESULTS FOR FOUR AIRPORTS BY COMPARING OUTCOME OF EXPERIMENTAL RUNS........ 76
4.2.1 Controller required actions............................................................................... 76 4.2.2 Average Flight Time......................................................................................... 78 4.2.3 Average Fuel Consumption and Flown Distance ............................................ 79 4.2.4 Arrival Traffic Synchronisation ......................................................................... 80
4.3 RESULTS PER AIRPORT BY COMPARING OUTCOME OF EXPERIMENTAL RUNS................... 81 4.3.1 Amsterdam, Schiphol (EHAM)......................................................................... 81 4.3.2 The Düsseldorf area, Düsseldorf (EDDL) and Köln (EDDK) ........................... 84 4.3.3 Brussels Airport, Zaventem (EBBR) ................................................................ 87
5 ANALYSIS OF EXPERIMENT OUTCOMES .................... .............................................. 90 5.1 ANALYSIS OF OUTCOMES ON THE BASIS OF DETERMINED HYPOTHESES ....................... 90 5.2 ANALYSIS OF CONSEQUENCES OF OUTCOMES FOR EXPERIMENT OBJECTIVES AND ASSUMPTIONS ....................................................................................................................... 92

Episode 3
D5.3.4-02 - Results of FTS on Multi-Airport TMA operations in the core area of Europe
Version : 1.00
Page 5 of 125
Issued by the Episode 3 consortium for the Episode 3 project co-funded by the European Commission and Episode 3 consortium.
6 CONLUSIONS AND RECOMMENDATIONS ..................... ............................................ 94 6.1 KEY FINDINGS ............................................................................................................ 94 6.2 ISSUES ...................................................................................................................... 95 6.3 RECOMMENDATIONS .................................................................................................. 96
6.3.1 General recommendations .............................................................................. 96 6.3.2 Recommendations on supporting DODs and Operational Scenarios ............. 97 6.3.3 Conclusions and Recommendations for Project Level .................................... 97
6.4 CONCLUSIONS ........................................................................................................... 97 7 REFERENCES AND APPLICABLE DOCUMENTS................ ..................................... 100
7.1 REFERENCES........................................................................................................... 100 7.2 APPLICABLE DOCUMENTS ......................................................................................... 101
A ANNEX : APPLICABLE OPERATIONAL IMPROVEMENTS ........ .............................. 103
B ANNEX : INPUTS BY EP3 WP5 TMA EXPERT GROUP ......... ................................... 107
B.1 STORY-BOARD ........................................ .................................................................... 107
B.2 ASSUMPTIONS AND EXPLANATIONS CONCERNING THE STORY-B OARD, FIGURE 28 110
C ANNEX : DETAILS OF MEASUREMENTS AND ANALYSIS....... ............................... 115
C.1 INTRODUCTION ........................................................................................................... 115
C.2 SUMMARIES OF CONTROLLER ACTIVITIES FOR ALL FOUR AIR PORTS............ 115
C.3 AVERAGE FLIGHT TIMES FOR ALL FOUR AIRPORTS ......... .................................. 117
C.4 AVERAGE FUEL CONSUMPTION AND FLOWN DISTANCES FOR AL L FOUR AIRPORTS ............................................................................................................................ 118
C.5 ARRIVAL SEQUENCING RESULTS FOR FOUR AIRPORTS AND TH E INDIVIDUAL AIRPORTS ............................................................................................................................ 119
C.6 SPECIFIC RESULTS FOR AMSTERDAM SCHIPHOL (EHAM) ..... ............................ 121
C.7 SPECIFIC RESULTS FOR DÜSSELDORF AIRPORT (EDDL) ..... .............................. 122
C.8 SPECIFIC RESULTS FOR KÖLN AIRPORT (EDDK) ........... ...................................... 122
C.9 SPECIFIC RESULTS FOR BRUSSELS AIRPORT (EBBR) ....... ................................. 123

Episode 3
D5.3.4-02 - Results of FTS on Multi-Airport TMA operations in the core area of Europe
Version : 1.00
Page 6 of 125
Issued by the Episode 3 consortium for the Episode 3 project co-funded by the European Commission and Episode 3 consortium.
LIST OF TABLES
Table 1 - Stakeholder expectations ......................................................................... 20
Table 2 - Multi-airports aspects of traffic flows simulated in the FTS experiment ..... 36
Table 3 - KPIs applicable to Capacity KPA.............................................................. 37
Table 4 - KPIs applicable to Efficiency KPA ............................................................ 38
Table 5 - KPI applicable to predictability KPA.......................................................... 38
Table 6 - KPIs applicable to FTS on Multi Airport TMA operations .......................... 39
Table 7 - Validation exercise description according to the EP3 WP5 Validation Strategy, Ref. [22] ............................................................................................ 40
Table 8 - Relationship between hypothesis assessment and related validation scenarios/experimental steps ........................................................................... 46
Table 9 - Summary of departure and arrival operations in the reference scenario of simulated part of German airspace................................................................... 55
Table 10 - Overview of simulation runs to execute the performance assessment experiment ....................................................................................................... 69
Table 11 - Overview of performed FTS simulation runs........................................... 72
Table 12 - Overview of simulated air traffic to and from the 4 airports of interest: EHAM, EBBR, EDDK, and EDDL..................................................................... 72
Table 13 - Benefits from arrival traffic synchronisation for all 4 airports on 2008 traffic demand............................................................................................................ 81
Table 14 - Summary table of yearly flight time and fuel benefits for Amsterdam Schiphol (EHAM).............................................................................................. 83
Table 15 - Summary table of yearly flight time and fuel benefits for Düsseldorf Airport (EDDL)............................................................................................................. 86
Table 16 - Summary table of yearly flight time and fuel benefits for Köln Airport (EDDK) ............................................................................................................ 87
Table 17 - Summary table of yearly flight time and fuel benefits for Brussels Airport (EBBR)............................................................................................................. 89
Table 18 - Summary of flight benefits per year during the arrival phase, over a distance of 200 NM out .................................................................................... 95
Table 19 - Concluding summary of experimental results ......................................... 99
Table 20 - References and applicable documents..................................................102
Table 21 - Operational Improvements addressed by this Simulation ......................106
Table 22 - Controller activities, unconstrained ideal profiles, current flow (2008) and future flow (2020) ............................................................................................116
Table 23 – Controller activities, actual operations compared to DCB (2008 traffic demand)..........................................................................................................117
Table 24 - Controller activities, actual operations compared to DCB (2020 traffic demand)..........................................................................................................117
Episode 3
D5.3.4-02 - Results of FTS on Multi-Airport TMA operations in the core area of Europe
Version : 1.00
Page 7 of 125
Issued by the Episode 3 consortium for the Episode 3 project co-funded by the European Commission and Episode 3 consortium.
Table 25 - Average flight times, 4 airports, current flows (2008) and future flows (2020) .............................................................................................................118
Table 26 - Fuel consumption and Flown distances for 4 airports, current flows (2008) and future flows (2020)....................................................................................118
Table 27 – Arrival sequencing results for 4 airports, current flows (2008) and future flows (2020) ....................................................................................................119
Table 28 - Arrival sequencing results for Schiphol Airport, EHAM, current flows (2008) and future flows (2020) ........................................................................119
Table 29 - Arrival sequencing results for Düsseldorf Airport, EDDL, current flows (2008) and future flows (2020) ........................................................................120
Table 30 - Arrival sequencing results for Köln Airport, EDDK, current flows (2008) and future flows (2020)....................................................................................120
Table 31 - Arrival sequencing results for Brussels Airport, EBBR, current flows (2008) and future flows (2020)....................................................................................121
Table 32 - Average flight times measured for Amsterdam Schiphol Airport (EHAM)........................................................................................................................121
Table 33 - Fuel consumption measured for Amsterdam Schiphol Airport (EHAM)..122
Table 34 - Average flight times measured for Düsseldorf Airport (EDDL) ...............122
Table 35 - Fuel consumption measured for Düsseldorf Airport (EDDL) ..................122
Table 36 - Average flight times measured for Köln Airport (EDDK).........................123
Table 37 - Fuel consumption measured for Köln Airport (EDDK)............................123
Table 38 - Average flight times measured for Brussels Airport (EBBR) ..................124
Table 39 - Fuel consumption measured for Brussels Airport (EBBR) .....................124
LIST OF FIGURES
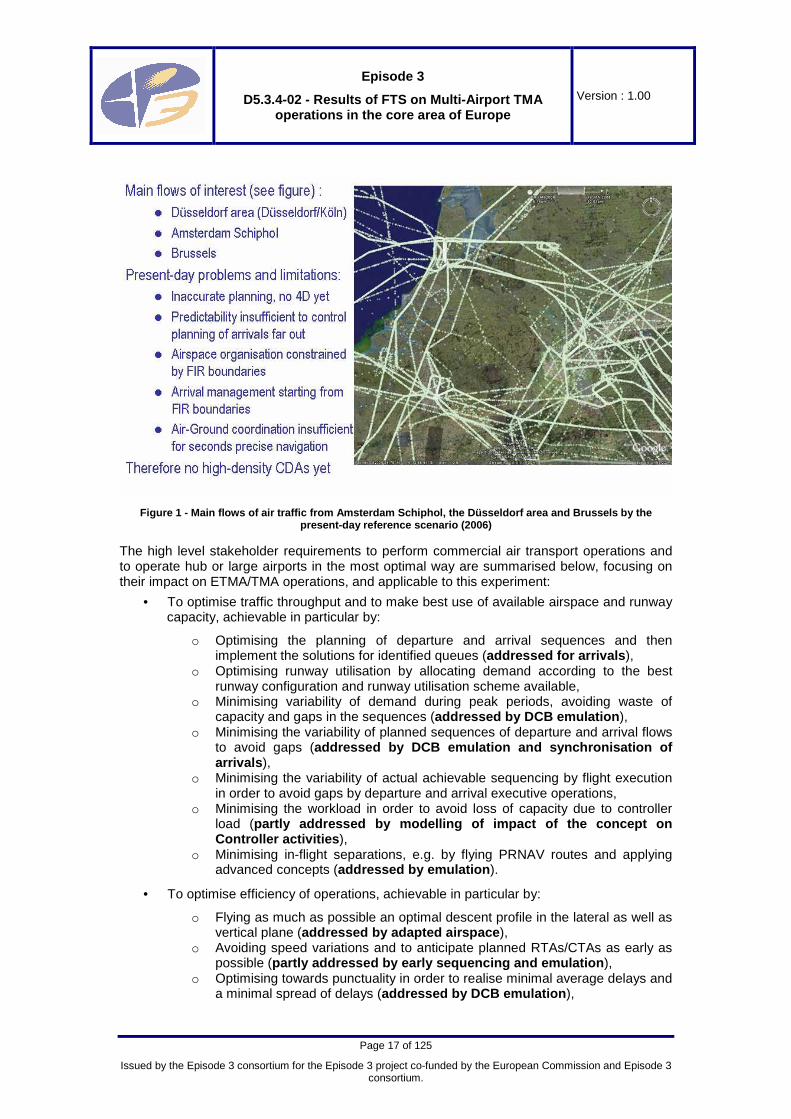
Figure 1 - Main flows of air traffic from Amsterdam Schiphol, the Düsseldorf area and Brussels by the present-day reference scenario (2006).................................... 17
Figure 2 - Timing of planning processes related to management of congested arrival flows................................................................................................................. 22
Figure 3 – Example of a CDA approach over TMA entry-point via multiple IAFs to multiple runways .............................................................................................. 28
Figure 4 - Example of a CDA approach over TMA entry-point via one IAF to one runway ............................................................................................................. 28
Figure 5 – Example of a staggered CDA approach over TMA entry-point via one IAF to one runway .................................................................................................. 29
Figure 6 - Overview of aircraft mov. at airports in the core area of Europe during 24 hours (2005, Ref. [1]) ....................................................................................... 34
Figure 7 - Schematic figure of allocation of enhanced TMAs and stretched arrival sectors for the advanced organisation.............................................................. 41

Episode 3
D5.3.4-02 - Results of FTS on Multi-Airport TMA operations in the core area of Europe
Version : 1.00
Page 8 of 125
Issued by the Episode 3 consortium for the Episode 3 project co-funded by the European Commission and Episode 3 consortium.
Figure 8 - Present-day approach procedures for Düsseldorf (EDDL) (Source: DFS) 48
Figure 9 - Advanced approach procedures for Köln (EDDK) (Source: DFS)............ 49
Figure 10 - Advanced procedures for Schiphol TMA operations.............................. 53
Figure 11 - Rough estimated design of airspace volumes dedicated to service provision to arrival flows for the airports of interest in the area ......................... 54
Figure 12 - Example of network of interest to be analysed with Network Analysis Model ............................................................................................................... 57
Figure 13 - Global picture of simulated traffic following traditional descent procedures, including vectoring........................................................................ 73
Figure 14 - Global picture of simulated traffic following early sequenced advanced CDA procedures............................................................................................... 74
Figure 15 - Average flight time performance results for arrival traffic of all 4 airports (2008 and 2020)............................................................................................... 78
Figure 16 - Average reduction in fuel consumption for arrival traffic of all 4 airports (2008 and 2020)............................................................................................... 79
Figure 17 - Overview of benefits of Fuel consumption and Distance flown, going from Baseline to Advanced (CDA), and going from 2008 to 2020 scenarios............. 80
Figure 18 - Schiphol, EHAM, Baseline scenario in lower TMA airspace (2008/2020)......................................................................................................................... 82
Figure 19 - Schiphol, EHAM, advanced CDA scenario in lower TMA airspace (2008/2020)...................................................................................................... 82
Figure 20 – Simulated throughput characteristics of Amsterdam, Schiphol (EHAM) 83
Figure 21 – Düsseldorf area, EDDL and EDDK, Baseline scenario in lower TMA airspace (2008/2020) ....................................................................................... 84
Figure 22 - Düsseldorf area, EDDL and EDDK, advanced CDA scenario in lower TMA airspace (2008/2020)............................................................................... 85
Figure 23 – Simulated throughput characteristics of Düsseldorf Airport (EDDL) ...... 85
Figure 24 – Simulated throughput characteristics of Köln Airport (EDDK) ............... 86
Figure 25 – Brussels Airport EBBR, Baseline scenario in lower TMA airspace (2008/2020)...................................................................................................... 87
Figure 26 – Brussels Airport, EBBR, advanced CDA scenario in lower TMA airspace (2008/2020)...................................................................................................... 88
Figure 27 – Simulated throughput characteristics of Brussels Airport (EBBR) ......... 88
Figure 28 - Story-Board representation of Arrival management process in ETMA and TMA airspace..................................................................................................109
Figure 29 - Scheme of planning constraints to feed congested arrival flows in a flight efficient manner...............................................................................................111
Episode 3
D5.3.4-02 - Results of FTS on Multi-Airport TMA operations in the core area of Europe
Version : 1.00
Page 9 of 125
Issued by the Episode 3 consortium for the Episode 3 project co-funded by the European Commission and Episode 3 consortium.
EXECUTIVE SUMMARY
This document describes the design, set-up and conduct of a fast-time simulation experiment addressing Arrival Management and Trajectory Management to enable advanced Continuous Descent Approaches (CDAs) in a multi-airport Terminal Manoeuvring Area (TMA).
The experiment is based on validation of elements of the SESAR Operational Concept and the Detailed Operational Descriptions (DODs), which aim to refine this concept.
The experiment was performed at NLR in Amsterdam, simulating the Dutch/Belgian/German airspace and the impact of SESAR on a multi-airport TMA environment by fast-time simulation.
“Dedicated arrival flow corridors” were modelled to facilitate undisturbed descent operations from Top Of Descent (TOD) to landing for the airports of Amsterdam, Düsseldorf, Köln and Brussels, assuming airspace availability. Flight-time reductions and fuel savings were assessed, providing indicative figures for significant potential savings for descent operations to hub airports in the core area of Europe. The savings are attributable partly to redesign of airspace, and partly to applying advanced demand and capacity balancing and planning concepts. The accurate sequencing is an enabler for CDAs in lower airspace with benefits for flight efficiency, emissions and noise abatement.
The simulations show that, in the ideal case, providing full support for undisturbed operations for the airports of Amsterdam (Schiphol), Düsseldorf, Köln and Brussels (Zaventem), total fuel savings of up to about 53.000 tons per year are achievable for present-day (2009) operations. This is based on a comparison of today’s airspace organisation with efficient routings from 200 NM out. However, results should be considered as upper limits because of simplifications used such 100% equipage. These results are achievable provided that: appropriate solutions are identified to accommodate the needs of other airspace users in full harmony with the proposed procedures; however, solutions will need be balanced with other operations, such as those from/to regional airports, En-route, and those operations conducted by the Military.
In conclusion:
• CDA profiles from TOD provide significant benefits in terms of flight efficiency and workload, if operated along undisturbed “Dedicated Arrival Flow Corridors”. These corridors allow for more efficient use of airspace than today’s (2009) airspace organisation.
• DCB measures are contributing to optimise arrival operations at airports of interest by prioritisation of departure operations, benefiting services for on-time arrival at congested destinations.
• Airspace improvement and DCB measures set the scene for advanced arrival traffic synchronisation that ensures sequencing at IAF and enables flight-efficient, noise-limiting CDAs.
The report recommends that fast-time experiments are continued to validate the concept on a more complete redesign of airspace with support of the ANSPs involved. More realistic simulation of DCB effects improves the quality of performance assessment. Finally, the report also recommends that the scope of the experiments is extended to include the London area, the Paris area and the Frankfurt area.

Episode 3
D5.3.4-02 - Results of FTS on Multi-Airport TMA operations in the core area of Europe
Version : 1.00
Page 10 of 125
Issued by the Episode 3 consortium for the Episode 3 project co-funded by the European Commission and Episode 3 consortium.
1 INTRODUCTION
1.1 PURPOSE OF THE DOCUMENT
This document describes the design, set-up and conduct of the experiment on Multi-Airport TMA operations in the core area of Europe. This experiment is conducted by NLR in work package WP5.3.4 of the Episode 3 project, and the experiment is based on the Experimental Plan of this work package, Ref. [28]. The report includes copies of relevant material of this plan, slightly adapted as required, and the report concludes with conduct, results, analysis and key findings of the experiment.
This report describes:
• The concept addressed,
• Objectives, metrics and indicators of the validation experiment,
• Scenarios, experimental set-up and conduct of the experiment,
• Experimental results and analysis.
The experiment addressed enhanced sequencing and traffic synchronisation of high density traffic flows in high complexity airspace in the core area of Europe. The aim was to assess the potential to improve arrival operations to hub airports in this area. The experiment has been performed by fast-time simulation of air traffic in an area that covers the Benelux and part of the West side of Germany. The airports of interest were: Amsterdam Schiphol (EHAM), Düsseldorf (EDDL), Köln (EDDK) and Brussels Zaventem (EBBR).
The concept of interest is adopted from SESAR, the ATM target concept, D3, Ref. [14], and its Concept of Operations, Ref. [15]. The experiment, being part of the early validation process of Episode 3, aimed to contribute to the validation of part of this concept, i.e. the validation of high density arrival operations. Concept assessment demonstrated the potential to bring significant benefits in terms of flight efficiency and cost savings if implemented in an appropriately re-organised airspace environment. The conclusion is that under optimal conditions yearly fuel savings are possible on descent operations up to a maximum of roughly 53.000 ton fuel for the four airports addressed by the experiment, i.e. Amsterdam Schiphol, Düsseldorf, Köln and Brussels Zaventem.
1.2 INTENDED AUDIENCE
This document is intended to be used by the participants of the Episode 3 project. This report is part of the results of Episode 3 and describes approach, conduct and results of the fast-time experiment performed in Work package EP3 WP5.3.4, Multi-Airport TMA operations in the core area of Europe. The experiment and its results are presented therefore to the customers of Episode 3 project:
• The European Commission,
• The SESAR Joint Undertaking (SJU), and
• The Air Traffic Management community.
The report is public and available for a wider audience.

Episode 3
D5.3.4-02 - Results of FTS on Multi-Airport TMA operations in the core area of Europe
Version : 1.00
Page 11 of 125
Issued by the Episode 3 consortium for the Episode 3 project co-funded by the European Commission and Episode 3 consortium.
1.3 SCOPE AND STRUCTURE OF THE DOCUMENT
The scope of the document is to describe the experiment, explains background, objectives, approach and conduct of the experiment, as well as its results, analysis and findings. The document is structured as follows:
• Chapter 2 introduces the scope and justification of the validation exercise. This chapter provides an overview of the concept of interest, the KPAs and the exercise objectives. This is followed by an overview of experimental set-up, applicable validation scenarios and metrics.
• Chapter 3 describes the conduct of the experiment, the scope of validation and scope of results obtained for further analysis.
• Chapter 4 describes the experimental results and its analysis. The relevance of results is discussed.
• Chapter 5 summarises experimental outcomes, followed by Chapter 6 presenting key findings, recommendations.
• Chapter 7 lists the references and applicable documents.
• Some annexes are added providing tables and relevant data.
1.4 EXPERIMENT BACKGROUND AND CONTEXT
Episode 3 (EP3) is charged with beginning the validation of the operational concept expressed by SESAR Task 2.2 and consolidated in SESAR D3, Ref. [14]. The initial emphasis is on obtaining a system level assessment of the concept’s ability to deliver the defined performance benefits in the 2020 time horizon corresponding to ATM Capability Level 2/3 and the Implementation Package 2 (IP2).
The validation process as applied in EP3 is based on the E-OCVM, Ref. [9], which describes an approach to ATM Concept validation. However, to date the E-OCVM has not been applied to validation of a concept on the scale and complexity of SESAR. Such a system level validation assessment must be constructed from data derived from a wide range of different validation activities, integrating many different levels of system description, different operational segments and contexts and different planning horizons. The data will be collected through a variety of methods and tools and will vary in its quality and reliability.
The process of performing systematic validation and the integration of results must be actively planned and managed from the beginning of the whole validation activity. This validation management is coordinated by EP3 WP2.3, which is responsible for ensuring the effective application of the E-OCVM, the consolidation of the Episode 3 Validation Strategy, and establishing a Validation Framework.
Validation exercises should produce evidence, and preferably measured, about the ability of some aspect of the concept to deliver on some aspect of the performance targets. In order to be able to do Validation Exercises, there is a need for concept clarification, requirements development or elaboration activities in preparation for down line validation activities.
The experiment described in this report is part of an initial validation process situated in a selected part of the core area of Europe. The exercise aimed to validate that significant benefits can be obtained by applying parts of the advanced planning concepts of SESAR to arriving air traffic flows in a highly congested part of the core area of Europe. Moreover, the simulated airspace is currently yet managed in a segregated way determined by national borders and letters of agreement to coordinate air traffic. The benefits of the concept of

Episode 3
D5.3.4-02 - Results of FTS on Multi-Airport TMA operations in the core area of Europe
Version : 1.00
Page 12 of 125
Issued by the Episode 3 consortium for the Episode 3 project co-funded by the European Commission and Episode 3 consortium.
SESAR could be demonstrated by assuming simplified solutions for integrated airspace management to be in place that could facilitate the service provision to hub airport arrival traffic as intended by the concept. Also, important is the assumed acceptance of En-route service provision to play a more significant role in providing services to realise an accurately planned sequencing of arrival traffic. Comparing today’s operations, i.e. 2008, with the advanced scenario of 2020, allowed to quantify potential benefits that could be achievable.
1.5 CONCEPT OVERVIEW
The fast-time experiment addressed the quantified benefits of implementation of an operational concept of arrival sequencing with an extended planning horizon to multiple airports being allocated in the core area of Europe.
The following Operational Improvements (OIs) of SESAR were addressed:
• DCB-0103: SWIM enabled NOP (layered 4D planning) (emulated )
• TS0305: Arrival Management extended to en-route airspace (simulated )
• TS0303: Arrival Management into multiple airports (simulated )
• AM-0702: Advanced Continuous Descent Approach (ACDA) (simulated )
• IS-0303: Use of Predicted Trajectory (PT) to enhance ATM ground system performance
• TS-0102: Arrival Management supporting TMA improvements (incl. CDA, PRNAV)
• TS-0103: Controlled Time of Arrival (CTA) through use of data link
The concept of interest had its focus on validating enhanced operations in the area of:
• Demand and Capacity Balancing : o Trajectory-based operations: short-term, pre-departure 4D planning o Pre-departure planning ensures low variation of traffic demand at start of
arrival management process for congested destination airport
• Airspace Management and Organisation : o “Dedicated arrival flow corridors” through en-route and ETMA airspace o Flight-efficient descent path through TMA entry-point to IAF o Noise-friendly ACDA through TMA to FAF
• Flight Management, planning and executive control : o Arrival sequencing up to ~60 min. before arrival, most traffic must be airborne o Down-linked 4D trajectories o Sequencing accomplished at TMA entry-point o Issue noise-friendly CDA at IAF, including merging of inbound flows
1.6 GLOSSARY OF TERMS
Term Definition
A/C Aircraft
ACC Area Control Centre
ACDA Advanced Continuous Descent Approach
A-G Air-Ground
AMAN Arrival Management (tool)
Episode 3
D5.3.4-02 - Results of FTS on Multi-Airport TMA operations in the core area of Europe
Version : 1.00
Page 13 of 125
Issued by the Episode 3 consortium for the Episode 3 project co-funded by the European Commission and Episode 3 consortium.
Term Definition
ANSP Air Navigation Service Provider
AOM Airspace Organisation and Management
ASAS Airborne Separation Assistance System
ATC Air Traffic Control
ATFCM Air Traffic Flow and Capacity Management
ATM Air Traffic Management
BT Business Trajectory
CDA Continuous Descent Approach
CDM Collaborative Decision Making
CONOPS Concept of Operations
CDTI Cockpit Display of Traffic Information
CNS Communication, Navigation, Surveillance
CTA Controlled Time of Arrival
DCB Demand & Capacity Balancing
dDCB Dynamic DCB
DOD SESAR Detailed Operational Description (developed by Episode 3)
DOW Description Of Work
DTG Distance To Go
ECAC European Civil Aviation Conference
E-OCVM European Operational Concept Validation Methodology
EP3 Episode 3
ETA Estimated Time of Arrival
ETMA Extended Terminal Manoeuvring Area
FAB Functional Airspace Block
FAF Final Approach Fix
FAP Future ATM Profile (EEC)
FIR Flight Information Region
FMS Flight Management System
FOC Flight Operations Centre
FTS Fast-Time Simulation
HIL Human In the Loop
HLT Heavy workload Threshold
HMI Human Machine Interface
IAF Initial Approach Fix
ICAO International Civil Aviation Organisation
ILS Instrument Landing System
IP Implementation Package (SESAR)

Episode 3
D5.3.4-02 - Results of FTS on Multi-Airport TMA operations in the core area of Europe
Version : 1.00
Page 14 of 125
Issued by the Episode 3 consortium for the Episode 3 project co-funded by the European Commission and Episode 3 consortium.
Term Definition
KPA Key Performance Area
KPI Key Performance Indicator
LAQ Local Air Quality
Lden Load, during Day, Evening, Night (Noise)
Lnight Load, during Night (Noise)
LoC Lines of Change (SESAR)
MTCD Medium-Term Conflict Detection
NAM Network Analysis Model (Modelling tool)
NLR National Aerospace Laboratory of the Netherlands
NM Nautical Mile
NOP Network Operations Plan
OI Operational Improvement (SESAR)
OPTIMAL Optimised Procedures and Techniques for Improvement of Approach and Landing (EU, 6th Framework Programme)
PI Performance Indicator
PRNAV Precision Area Navigation
PRR Performance Review Report (EUROCONTROL)
PT Predicted Trajectory
PTC Precision Trajectory Clearance
RBT Reference Business Trajectory
RFM Refined Flow Management
RNAV Area Navigation
RNP Required Navigation Performance
RTA Required Time of Arrival
RTS Real-Time Simulator
RWY Runway
SBT System managed Business Trajectory
SESAR Single European Sky ATM Research
SID Standard Instrument Departure
SJU SESAR Joint Undertaking
STAR Standard Arrival Route
STATFOR EUROCONTROL’s Statistics and Forecast Service
SWIM System Wide Information Management
TAAM© Total Airport and Airspace Model® (Fast-time simulation tool)
TMA Terminal Manoeuvring Area
TBS Time Based Separation
TOC Top of Climb

Episode 3
D5.3.4-02 - Results of FTS on Multi-Airport TMA operations in the core area of Europe
Version : 1.00
Page 15 of 125
Issued by the Episode 3 consortium for the Episode 3 project co-funded by the European Commission and Episode 3 consortium.
Term Definition
TOD Top of Descent
TTA Target Time of Arrival
TTOT Target Take-Off Time
WP Work Package
WP5 TMA EG Episode 3 WP5 TMA Expert Group
2D/3D/4D In 2/3/4 Dimensions
Episode 3
D5.3.4-02 - Results of FTS on Multi-Airport TMA operations in the core area of Europe
Version : 1.00
Page 16 of 125
Issued by the Episode 3 consortium for the Episode 3 project co-funded by the European Commission and Episode 3 consortium.
2 EXERCISE SCOPE AND EXECUTION This chapter provides information on the operational and experimental background of the fast-time experiment. The following topics are addressed:
• Stakeholders and expectations • Description of the ATM concept being addressed • Exercise objectives • Choice of indicators and metrics • Validation scenario • Exercise Tool, Technique and/or Platform • Links to other Validation Exercises • Concept Assumptions
2.1 STAKEHOLDERS AND THEIR EXPECTATIONS
Hub airports are characterised by delivering and receiving continuous flows of traffic. Runway capacity as well as TMA capacity limitations are constraining the throughput in busy hours, or even continuously, starting from 7:00 in the morning until late in the evening, 22:00 hours, i.e. the busy performance reference hours according to SESAR D2, Ref. [12]. The problem to accommodate the demand in an appropriate and cost-efficient way is highly complex because these airports are constrained usually by restricted use of runway configurations, by limited access to airspace and by operations of other nearby large and/or regional airports. These constraints are conditioned often by history and environment, i.e. by nearby urbanised areas, and have to be considered therefore as unavoidable and persistent in most cases.
The problems with hub airport ATM operations are focussing on:
• Traffic congestion problems, causing inefficiency of operations and waste of airspace,
• Traffic sequencing problems, causing waste of runway capacity and inefficiency,
• Loss of capacity in airspace and at the runway, causing reduced throughput and delays,
• Limited predictability and unnecessary inefficiency in turn-around operations caused by delays and inaccurate planning,
• Overload of controllers, causing loss of capacity and loss of efficiency,
• And also, a non-optimal environmental load, caused by flying non-optimal landing profiles as a consequence of restrictions to perform arrival and departure operations in controlled airspace under high density traffic conditions.
Addressing Multi-Airport TMA operations in the core area of Europe (see Figure 1), stakeholders want to solve those problems that are limiting their operations. Improved operations have to facilitate higher throughput, removing capacity constraining bottlenecks. This has to be accomplished in a most efficient way, saving flight duration and fuel, and it has to be accomplished in a most environmental friendly way, reducing emissions and noise. In some cases, noise is even the most constraining element to accommodate increased demand, and noise-friendly descent profiles are for that reason a highest priority mandatory improvement.
Episode 3
D5.3.4-02 - Results of FTS on Multi-Airport TMA operations in the core area of Europe
Version : 1.00
Page 17 of 125
Issued by the Episode 3 consortium for the Episode 3 project co-funded by the European Commission and Episode 3 consortium.
Figure 1 - Main flows of air traffic from Amsterdam Schiphol, the Düsseldorf area and Brussels by the present-day reference scenario (2006)
The high level stakeholder requirements to perform commercial air transport operations and to operate hub or large airports in the most optimal way are summarised below, focusing on their impact on ETMA/TMA operations, and applicable to this experiment:
• To optimise traffic throughput and to make best use of available airspace and runway capacity, achievable in particular by:
o Optimising the planning of departure and arrival sequences and then implement the solutions for identified queues (addressed for arrivals ),
o Optimising runway utilisation by allocating demand according to the best runway configuration and runway utilisation scheme available,
o Minimising variability of demand during peak periods, avoiding waste of capacity and gaps in the sequences (addressed by DCB emulation ),
o Minimising the variability of planned sequences of departure and arrival flows to avoid gaps (addressed by DCB emulation and synchronisation of arrivals ),
o Minimising the variability of actual achievable sequencing by flight execution in order to avoid gaps by departure and arrival executive operations,
o Minimising the workload in order to avoid loss of capacity due to controller load (partly addressed by modelling of impact of the conc ept on Controller activities ),
o Minimising in-flight separations, e.g. by flying PRNAV routes and applying advanced concepts (addressed by emulation ).
• To optimise efficiency of operations, achievable in particular by:
o Flying as much as possible an optimal descent profile in the lateral as well as vertical plane (addressed by adapted airspace ),
o Avoiding speed variations and to anticipate planned RTAs/CTAs as early as possible (partly addressed by early sequencing and emulation ),
o Optimising towards punctuality in order to realise minimal average delays and a minimal spread of delays (addressed by DCB emulation ),

Episode 3
D5.3.4-02 - Results of FTS on Multi-Airport TMA operations in the core area of Europe
Version : 1.00
Page 18 of 125
Issued by the Episode 3 consortium for the Episode 3 project co-funded by the European Commission and Episode 3 consortium.
o To identify those concepts that are best performing in final adjustments regarding achievable separations at runway threshold,
o To achieve reduced uncertainties in departure and arrival planning, and in this way to support operations with minimal turn-around times.
• To preserve safety at an acceptable level, maintaining or improving previous levels of safety, achievable in particular by:
o Proper adjustment of applicable separations according to the capabilities of concepts to provide guidance, monitoring and control to flight operations,
o To identify and promulgate those solutions that are providing stability and robustness of flight operations in highly tactical manoeuvring areas like hub airport ETMA/TMAs (addressed by emulation ),
o To identify those concepts that are best performing with respect to (short-term) predictability of flight operations,
o To ensure the effectiveness of monitoring, alerting and last resort services under operations of advanced concepts,
o To ensure the effectiveness of exception handling under new procedures for departure and arrival operations (addressed by selected airspace usage for the advanced CDA scenario ).
• To control the environmental load and to ensure an acceptable level of emissions and noise, achievable in particular by:
o Flying as much as possible an optimal descent profile in the lateral as well as vertical plane, and specifically to fly CDAs to the Final Approach Fix (FAF) (addressed ),
o Avoiding speed variations as much as possible and to anticipate the planned RTAs/CTAs (partly addressed by early sequencing ),
o Flying an optimal initial climb profile with respect to environment and efficiency and ensure undisturbed departure operations as much as possible (taken as constraining condition ),
o Designing arrival and departure procedures that respect noise abatement restrictions (addressed ), and
o Maximise capacity, so that delays are minimised, aiming to reduce airborne holding and ground queuing (addressed by emulation ).
Table 1 below contains a summary of reasons why the stakeholders expect improved operations from an enhanced concept of operations of ATM operating in ETMA/TMA airspace to improve hub and large airport operations.
Stake-holder
External / Internal
Involvement Expectations Concerns
Controllers Not part of FTS exp.
Responsible for executive control and separation
Expecting sufficient anticipation for planning and execution and safety ensured.
Planning and control are impacted but not addressed by FTS. Given an extension of sequencing into en-route airspace more planning data exchange and more coordination is expected. Also En-route, control is loaded by extra tasks in support of lower airspace control.
Pilots Not part of FTS exp.
Pilots will get an extended involvement in flight planning
Better predictability may help to have better control on flight execution against some extra effort in planning.
Flight-efficient descent paths combined with sequencing effort requires a strategy to meet time constraints. It might be complex for the pilot to understand how to

Episode 3
D5.3.4-02 - Results of FTS on Multi-Airport TMA operations in the core area of Europe
Version : 1.00
Page 19 of 125
Issued by the Episode 3 consortium for the Episode 3 project co-funded by the European Commission and Episode 3 consortium.
Stake-holder
External / Internal
Involvement Expectations Concerns
meet time constraints.
Airline Internal SESAR
Owner of flight, having an interest to perform their flights as planned
Accommodating more traffic and flying scheduled traffic as planned, is most economic and gives satisfaction to the passengers and meets their expectations.
There is a trade-off between optimised flight efficiency and optimised capacity. The Airline has an interest in non-delayed but flight efficient arrivals, and to find a “true” optimum. This is impacted by the established arrival procedures.
Airport Internal SESAR
Service provider to facilitate flight operations
Flying as planned ensures maximum throughput and best deployment of scarce resources (runways, gates and stands). Flight connectivity is important for transfer passengers.
It is important also to achieve maximum throughput with minimal environmental load for reasons of community acceptance. The risk is to loose capacity due to noise restrictions, therefore the definition of CDA patterns in the TMA is critical.
ANSP Internal SESAR / involved in experim.
Service provider to facilitate flight operations
Flying as planned allows to manage the controller workload and helps to manage the cost of service provision.
Extended sequencing and CDAs have an impact on airspace organisation, coordination procedures and ATC planning and control task distributions. The results of the FTS are indicative but don’t solve these issues.
A DCB process that limits variability of demand reduces the controller load and allows to perform traffic synchronisation in a most effective way, but it is not clear how effective the DCB process could be and how to anticipate its performance.
A DCB process allows to ensure safety and to restrict airspace requirements but again this depends on reliability and effectiveness.
The FTS improves operations by enabling CDAs. It is not sure if CDA approaches on parallel runways are feasible and safe. This is a problem for airports operating parallel runway configurations such as e.g. Schiphol.
Pas-sengers
External SESAR
Customers, receiving travelling services
Safe, low cost, on-time service provision is his natural interest.
Their interest in ANSPs services is high for reasons of safety and predictability, i.e. to ensure an expeditious and orderly process of ATM.
The FTS gives an indication of enhanced predictability, but the experiment ignores constraining interests of other airspace users.

Episode 3
D5.3.4-02 - Results of FTS on Multi-Airport TMA operations in the core area of Europe
Version : 1.00
Page 20 of 125
Issued by the Episode 3 consortium for the Episode 3 project co-funded by the European Commission and Episode 3 consortium.
Stake-holder
External / Internal
Involvement Expectations Concerns
The community
External SESAR
External interests, community shares and third parties interests
The government shall ensure low cost and best use of resources by competition.
The government shall ensure least hindrance and minimal hazards for all inhabitants affected by flight operations.
Their interest is minimal hazards, a high level of safety and minimal environmental load, in terms of emissions and noise (at low altitude e.g. below 3000 ft).
The FTS does not address safety and environmental performance, and the applicable profiles are assumed to be acceptable.
Table 1 - Stakeholder expectations
2.2 DESCRIPTION OF ATM CONCEPT BEING ADDRESSED
This section explains how the subject of interest in this experiment is linked to SESAR and how this subject relates to the DODs, which provide a more detailed description of the Operational Concept of SESAR. The following topics are addressed:
• The scope of the operational concept of interest, providing links to LoCs and OIs, • The detailed outline of the operational concept, derived from the DODs, • The level of maturity of the concept of interest, and • The KPAs related to the concept of interest, giving indications of relevant areas of
potential benefits and performance assessment.
2.2.1 Scope of the Operational Concept of Interest
According to the Episode 3 DOW, Ref. [8], the experiment shall validate how operations in part of the network can be served in an optimised way against minimal penalties and imposing minimal requirements on airspace usage. The increased demand has to be accommodated by high performance ATM, capable to serve dense departure and arrival flows in limitedly available volumes of airspace.
SESAR operational concepts can help to optimise the service provision to these air traffic flows by:
• Ensuring low variability of departure and arrival flows in order to ensure best use of available capacity, a result of DCB and Departure Management at airport level.
• Ensuring highly accurate arrival management and flight trajectory planning, guidance and control through new ATM techniques and air-ground information exchange realising accurately sequenced and separated arrival flows at multiple TMA entry-points.
• Allowing fuel-efficient, noise-friendly advanced CDAs supported by SESAR 4D planning and Performance Based Navigation which ensures maximum runway utilisation.
• Ensuring accurately 3D planned departures to be operated in a noise-friendly, efficient and undisturbed way in order to achieve maximum runway utilisation and terminal airspace efficiency.
• To achieve this against minimal airspace required in terms of TMA and ACC/En-route airspace, and to allow structuring of departure and arrival flows over safe and efficient routings, taking into account requirements of other operations in the same airspace.
This scope of validation targets are addressing:
• F6.2 (3D routing and selection and allocation of routing), and • F3.3 (3D Departure and arrival routes, including pre-defined and dynamic 3D routing).

Episode 3
D5.3.4-02 - Results of FTS on Multi-Airport TMA operations in the core area of Europe
Version : 1.00
Page 21 of 125
Issued by the Episode 3 consortium for the Episode 3 project co-funded by the European Commission and Episode 3 consortium.
Referring to the DODs, mainly DOD E5, Ref. [19], the following Operational Improvements (OIs) are addressed:
• L02 Moving from Airspace to trajectory based operations: o AOM-0702: Advanced Continuous Descent Approach (ACDA):
� ACDAs are subject of the simulations, i.e. the simulations demonstrate feasibility to perform ACDAs in lower airspace with sufficient capacity and efficiency by accurate delivery on TMA entry-point. However, no specific operational executive issues are investigated in detail.
• L03-01 Collaborative layered planning through NOP: o DCB-0103: SWIM enabled NOP:
� Enhanced planning is expected to result in predictable, stable and balanced demand at the start of the arrival management process. The scenarios are required to deliver conditions that represent present-day operational conditions and accurately managed future conditions.
• L01-05 Airspace User data to improve Ground Tools Performance: o IS-0303: Use of predicted trajectory to enhance ATM Ground system
performance through TMA: � Accurate 4D trajectory prediction and enhanced arrival management
can be emulated, whereas the effect of enhanced arrival management on performance of sequencing and metering can be validated by simulation.
• L07-01 Arrival traffic synchronisation: o TS-0102: Arrival Management, supporting TMA improvements (including
CDAs and PRNAV): � Arrival Management in support of accurate sequencing at TMA entry-
point is addressed and its performance shall be validated by fast-time simulation and assessment of achievable accuracy of operations.
o TS-0103: Controlled Time of Arrival (CTA) through use of data link: � An agreed CTA as part of the execution of a sequencing process is
assumed. No data link procedures are included in the simulation or the validation process; validation will focus on performance assessment of flight execution in compliance with planning.
o TS-0303: Arrivals into multiple airports: � Delivery to multiple airports is simulated and is applicable in the TMA
of the Düsseldorf/Köln area. o TS-0305: Arrival management extended to en-route airspace:
� Arrival flows are assumed to be sequenced and metered from ~60 min. before landing (up to 150 to 200 NM out) through so-called “Dedicated Arrival Flow Corridors”. Air traffic service provision is assumed, but appropriate sectorisation is not the focus of the current simulation experiment. Applicable workload was assessed by evaluating the required controller activities by event counts along the descent paths of the arriving traffic flows of interest for different scenarios.
A full description of OIs, adopted from DOD E5, Ref. [19], is included in Annex A of this document.
2.2.2 Detailed outline of the Operational Concept of Interest
The outline of the Operational Concept below summarises the DODs, in particular DOD E5, Ref. [19], DOD M2, Ref. [20] and the Operational Concept of the CASSIS project, Ref. [7].

Episode 3
D5.3.4-02 - Results of FTS on Multi-Airport TMA operations in the core area of Europe
Version : 1.00
Page 22 of 125
Issued by the Episode 3 consortium for the Episode 3 project co-funded by the European Commission and Episode 3 consortium.
The current conceptual overview is not deviating from SESAR and its Operational Concept, but presents an overview with the following purpose:
• The experiment can not be understood without an understanding of the Concept of Operation; a comprehensible overview is presented.
• The DODs are not describing a systematic justification of conceptual improvements, but explicit justification is required in order to understand validation.
• The present description is more explicit than the DODs, because the text is focused on direct applicability and performance assessment.
The way the concept is addressed by the experiment is described in section 2.3, Exercise Objectives. Details on solving specific issues are added in the section 2.8 on Concept Assumptions and Annex B. These statements are all concluded from Expert Group discussions.
Figure 2 - Timing of planning processes related to management of congested arrival flows
Dealing with a convergent layered planning process from top-down perspective, i.e. see Figure 2, the following conceptual elements can be considered for arrival/departure operations in ETMA/TMA airspace around a hub airport, i.e. a large airport or group of large airports:
� Demand and Capacity Balancing - DOD E4, Network Man agement in the Execution Phase, Ref. [21], DOD M2, Network Support to DCB, S ection 4.4, Ref. [20] - The concept of operations for hub/large airports and their environment is focussed on high density air traffic operations with a secondary interest in occasional periods of low density traffic, for example in the evening and during the night. The concept assumes that operations are determined by planning available in a Network Operations Plan (NOP) that is converging in level of confidence, in level of detail and in quality of planning towards the executive phase. On the one hand, departure operations are expected to follow the NOP and to behave in compliance with the planning, making the planning reliable, on the other hand arrival operations are expected to be executed in compliance with high predictability by high quality and up-to-date planning to accomplish traffic synchronisation.

Episode 3
D5.3.4-02 - Results of FTS on Multi-Airport TMA operations in the core area of Europe
Version : 1.00
Page 23 of 125
Issued by the Episode 3 consortium for the Episode 3 project co-funded by the European Commission and Episode 3 consortium.
This implies for departing and arriving traffic, that:
• Pre-departure planning is accomplished by 4D high precision planning, planning on a Target Time of Arrival (TTA).
• The traffic synchronisation process is successful to manage bottlenecks and hot spots, in particular at airport level and in TMA airspace, and will result in ground holdings that manage the throughput and the workload, and that ensure that 4D-planning is compliant with selected and accepted departure constraints.
• Traffic synchronisation ensures also minimal variation of traffic demand at the start of arrival management for a congested hub airport. This can be achieved by managing arrival load by DCB on TTAs. The requirement is to start Arrival Management roughly 60 min. before landing (from around 150-200 NM from the airport), while the actual descent starts from Top of Descent (TOD) with active executive control on sequencing starting as soon as the arrival sequence is established. This assumes active support en-route to meet certain time constraints, being input to a dynamic DCB (dDCB) process. See also EP3 D4.3.4-02, on en-route support to TMA, Ref. [29].
• There is no (significant) overload of declared capacity of departure and arrival sectors of each hub/large airport, ensured by traffic synchronisation.
• The maximum load of arrival and departure flows is not exceeding the permissible levels of traffic load, given the runway configuration in use.
• The departure flows at the airports of interest are following the accomplished planning and selected/accepted planning constraints and are departing in conformance with their planning.
� Airspace Management and Organisation - DOD E5, Opti mise Arrival Queue, Section 4.1.4.1, Ref. [19], Network Support to DCB, Section 4.4, Ref. [20] - Airspace requirements are derived from an optimised routing network. This network is based on:
• City-pair connectivity and to a large extent unconstrained routing, • Ideal vertical and lateral profiles to reach destination in the most fuel-efficient way, • Constraints at departure and destination to follow flight profiles in agreement with
available capacity around the airport of interest, • Constraints that respect environmental regulations, optimised towards fuel efficiency
but constrained by minimal noise load, • A routing structure required to build up manageable traffic flows to and from the
airport of interest, • All constraints imposed to meet the requirements of other traffic flows and other flight
operations and to establish a best compromise for conflicts of interest.
The airspace required comprises the airspace needed to perform optimised advanced-concept operations for the airport of interest:
• To accommodate all departure and arrival flows to and from the airport in a most expeditious, efficient, safe and environmental friendly way,
• To maintain separations for all traffic that meets the declared runway capacity levels, • To permit to apply speed and profile variations, sufficient to realise the planned
landing sequence for the foreseen variability in departure and arrival demand, • To perform stack manoeuvring in case of exception handling and to cope with
unforeseen arrival traffic overloads, and • To perform exception handling in case of breaking-off an initiated CDA procedure
and/or in case of performing a go-around.
It is required to define routings that allow to fly with minimum separation but that realise the maximum capacity and efficiency in airspace as well on the runway. The more independent the flights are, the better the control on 4D-precision guidance. If necessary,

Episode 3
D5.3.4-02 - Results of FTS on Multi-Airport TMA operations in the core area of Europe
Version : 1.00
Page 24 of 125
Issued by the Episode 3 consortium for the Episode 3 project co-funded by the European Commission and Episode 3 consortium.
double, parallel, CDA arrival paths might be required in order to enlarge the capacity of TMA CDA arrival paths over a specific Initial Approach Fix (IAF) by approaching in a “staggered” way, to be defined by specific RNAV tracks. An alternative might be to follow tight-sequenced ASAS CDA approaches when these approaches are sufficiently stable in spite of tight sequencing. However, ASAS was beyond the scope and was not selected to be part of research of this experiment.
In summary, it is envisaged that these requirements are sufficient to define and accomplish an airspace structure that is ideal for the airport or airport group of interest, but with requirements to be balanced against requirements and constraints forthcoming from all other operations in the area of interest.
Sectorisation1 is derived from the amount of traffic, the complexity and manoeuvring intensity of traffic, and the scope of control of the executive controller to manage and control flows of air traffic in a volume of airspace operating under a given concept of operation. The routing, the manageable amount of air traffic and the expected variability of air traffic determine the acceptable declared capacity of airspace sectors. However, the declared capacity shall be in balance with airport declared capacity, runway capacity and the expected demand through the sectors.
� Flight management and planning - DOD E5, Implement Arrival Queue, Section 4.1.4.2, Ref. [19] - Flight management and planning is considered separately for arrivals and departures.
For arriving flights three stages of flight management and planning can be discerned:
1. Before executing an arrival sequencing process roughly 60 min. before landing, between roughly 200 and 150 NM out, and still En-route, an early arrival sequence is established and coordinated.
2. En-route and/or at ETMA entrance, sequencing monitoring, re-sequencing and re-planning is part of the ATM process. The AMAN calculates a CTA based on the available RBT and down linked 4D trajectory information. A CTA clearance is issued to meet accurate sequencing at final merging or at IAF.
3. Before and at the moment to issue the final CDA clearance, the planned TTA at threshold has been confirmed while ensured separation is accomplished.
It should be noted that if no down-linked 4D trajectory is available, it will be possible for ATC to issue the requested trajectory or to make a request to the pilot/aircraft to downlink its trajectory. Once available on the Ground this trajectory will be applicable. When this trajectory is not available, the Ground Support Tools will provide a calculated trajectory functioning as a planning back-up function with higher uncertainty.
Ad 1, before executing an arrival sequencing proces s:
Different contributions may determine the sequence and may support each flight in preparing implementation of the planned sequence:
• Accurate pre-departure planning and on-time departures are the primary means to support En-route sectors to deliver traffic on-time at those exit points where being on-time is critical regarding the arrival management process at the destination airport, i.e.
1 It should be noted that sectorisation and assessment of declared capacity are essential elements of airspace management. However, sectorisation and redesign of airspace is not subject of this experiment. Rather airspace reservations were made, just sufficient to allocate dedicated arrival flows. Capacity assessment was not applied yet because assessment of appropriate re-sectorisation was outside the scope of the experiment.
Episode 3
D5.3.4-02 - Results of FTS on Multi-Airport TMA operations in the core area of Europe
Version : 1.00
Page 25 of 125
Issued by the Episode 3 consortium for the Episode 3 project co-funded by the European Commission and Episode 3 consortium.
by determining a TTA managed by DCB and dynamic DCB with their specific achievable tolerances (see DOD M2 and E4).
• Planning and surveillance information are the starting point on the ground to perform arrival management that uses the planned TTA at threshold, and determines a CTA, by solving queuing problems and optimised towards punctuality. The planning, including eventually prioritisation, is optimised against minimal deviation from the planned, most beneficial, descent path.
• Down-linked 4D trajectory information can be made available to the Arrival Manager. This will improve the level of confidence of arrival management and is expected to reduce the need to deviate from an undisturbed arrival.
• An established and sequenced CTA for each flight at any intermediate waypoint can be up-linked to the aircraft as the outcome of sequencing by arrival management. The pilot can re-plan its descent profile to meet the up-linked CTA constraint at the agreed waypoint.
• Other constraints, constraining the planned descent profile in ETMA/TMA airspace, can be uplinked.
• The established CTA, and its related profile, can be coordinated also with the En-route ANSP. This can be used to modify the planned level and exit time of the En-route sector or area and the Executive Controller can use this calculated exit condition to deliver the flight as good as possible on-time and at the planned level at the exit waypoint, being input to a dynamic DCB (dDCB) process.
Ad 2, during building up the planned sequence :
The early phase of building-up the arrival sequence shall provide a planned conflict-free routing first up to an agreed CTA, later up to threshold and shall provide Time-Based Separation (TBS) at the threshold, ensuring wake-vortex separation. Different kinds of planning information can be made available:
• An established ground-based 4D planning shall be the starting point to plan a conflict-free routing for each flight. The stability of planning may increase if planning of “staggered” approaches over specific RNAV tracks can be supported, merging after meeting the CTA constraint. A received down-linked ETA might be applicable to confirm planning and agreement of a consolidated CTA between air and ground.
• Ground-based 4D planning is considered mandatory in order to preserve integrity and consistency of data. Down-linked trajectory information can be used by ATC to adopt or to find a best match with a 3D profile and up-linked trajectories can be used by the pilot to adopt a 3D constrained descending trajectory.
• Iterating a down-linked ETA by the aircraft and an up-linked CTA constraint by ATC can be used to update the planning, e.g. by speed adjustments.
Ad 3, when ready to issue the final CDA clearance :
The moment of issuing final CDA clearance will confirm ATC planning and may initiate last short-term planning changes. The interest is to rely on the aircraft’s planning because the intention is to delegate final descent operation to the Pilot and to rely on the aircraft’s planned routing and on the aircraft’s guidance process. The down-linked 4D trajectory is applicable to support executive control on the ground and can be used in addition to monitor flight progress.
For departing flights , flight management and planning takes place before pre-departure clearance and before going off-blocks. Afterwards, planning deviations will be monitored and anticipated, whilst a significant update of 4D planning can be expected after take-off.
Multiple inputs are possible at this stage of planning (CDM processes):
• 4D System managed Business Trajectories (SBTs), specified by Airline Operators Centres, are main inputs to define departure planning. Three hours before departure, the trajectory will include the preferred departure runway and the estimated taxiing

Episode 3
D5.3.4-02 - Results of FTS on Multi-Airport TMA operations in the core area of Europe
Version : 1.00
Page 26 of 125
Issued by the Episode 3 consortium for the Episode 3 project co-funded by the European Commission and Episode 3 consortium.
routing and timing. The planning may include a prioritisation indication specifying the importance of adherence to punctuality.
• The traffic synchronisation process may lead to accept planning constraints due to sector loading problems and Airport capacity deficiencies, solved by selected and accepted departure slots (ATFCM). Also, arrival constraints at congested destinations may lead to imposed departure constraints by calculated mini-slots [+2,-3 min].
• The Airport may impose constraints on departure planning due to Gate planning, Airport service provision, and runway configuration changes.
• The ANSP determines an optimised departure planning, taking into account all external (other stakeholders’ inputs) and internal constraints (restrictions due to operating the Airport executive ATC process) as well as all late changes in planning.
The planning process by ATC is a process optimised towards punctuality of departures according to trajectory management and the planning of RBTs for each flight including a Target Take-Off Time (TTOT), derived from the Target Arrival time (TTA):
• Departure planning is iterative and convergent taking into account late planning changes and possibly prioritisation requests.
• The planning process includes to retain some buffer capacity and to improve the punctuality at a late stage in order to benefit expeditious departures of delayed flights.
• The departure planning process takes into account taxiing times and ground congestion problems.
• The process optimises also towards balanced accommodation of departure and arrival traffic in agreement with the applicable runway configuration scheme.
• Efficient use of available runway capacity implies optimisation towards punctuality, including possibly optimisation towards wake vortex separation.
� Collaborative Decision Making (CDM) during planning - DOD E5, Optimise and Implement Arrival Queue, Section 4.1.4.1 and 4.1.4. 2, Ref. [19] -
Different CDM options are envisaged during traffic management and planning:
• In principle, departure and arrival sequencing takes place in an equity respecting way aiming to reach overall optimised punctuality with minimal average delay and minimal spread in delay.
• Down-linked and up-linked 4D trajectories may play a role in increasing the level of confidence of the accomplished planning on the Ground and in the Air. The interest is to establish a planning:
o That provides planning consistency, o That defines a highly efficient approach path, and o That is safe to fly.
• Airlines preferences and solutions are part of the departure planning process by being able to monitor departure sequence planning and applicable traffic synchronisation constraints. Optimisation can be achieved by selecting alternative routings and by adapting the prioritisation of specific flights.
� Short-term planning in ETMA/TMA airspace and Execut ive control:
In ETMA Airspace - DOD E5, Implement Arrival Queue, Section 4.1.4.2, Ref. [19] -
Short-term planning and executive control of arrival traffic in ETMA airspace aim to achieve:
• Increased capacity by reduction of controller workload, • Increased capacity by reduced separations, building up tight sequences, • Increased punctuality by adherence to planning whilst building up the sequence.

Episode 3
D5.3.4-02 - Results of FTS on Multi-Airport TMA operations in the core area of Europe
Version : 1.00
Page 27 of 125
Issued by the Episode 3 consortium for the Episode 3 project co-funded by the European Commission and Episode 3 consortium.
Assuming that minimal airspace requirements were ensured by pre-departure control on low variability of demand, available capacity is limited further by effort required by controller workload. Therefore, concepts are favoured in the executive control phases that aim to reduce controller workload and that allow to increase declared capacity and thus the amount of traffic present in the sector. The same holds for reduced separations during approach that will support tighter sequencing and thus increased throughput.
Increased punctuality in reaching the planned TMA-entry condition, supports execution of optimal CDA operations in the TMA and thus to realise timely and undisturbed arrival at runway threshold. A feasible and acceptable accuracy could be to reach a TMA entry-point or applicable CTA merge point with 30 s accuracy. (See also Annex B.2, inputs from the TMA Expert Group.)
The operational concepts supporting these ETMA objectives are concepts to reach a predetermined exit condition with highest accuracy against minimised controller workload:
• 4D Guidance by the aircraft : The aircraft supports accurate guidance along a trajectory segment to a planned 4D waypoint. The controller has to make sure that this trajectory segment is conflict-free.
• ASAS 2 Sequencing : The controller controls the safe execution of a sequencing manoeuvre of one aircraft behind its predecessor and delegates the execution to the pilot.
• ASAS 2 Merging : The controller controls the safe merging of a flight between two consecutive flights and delegates the execution to the pilot.
Departure traffic in ETMA airspace sectors have to merge in En-route traffic flows in the most efficient and expeditious way. No specific concepts are foreseen as long as merging is not originating from several airports merging at one En-route merge point and as long as the flow is not so dense that regulation on merging is required. If this is the case, departure metering is applicable, but this was judged not to be applicable to operations in the AMS-DUS TMA within the anticipated timeframe.
In TMA Airspace - DOD E5, Deconflict and Separate T raffic, Section 4.3, Ref. [19] -
It is assumed that sequencing of planned arrivals is accomplished in ETMA airspace. Time-based separation is ensured following a planned descent path for all flights to one TMA entry-point, dedicated to feed one airport with one sequence of arriving flights feeding one runway. It is more complicated if multiple (parallel) runways are addressed or even, runways allocated at different airports. In this case, there is not one sequence of separated flights passing and flights are required to pass the TMA entry-point independent from other flows for other runways or other airports. One option to deal with multiple arrival flows over one TMA entry-point is to ensure independency of entering traffic flows either by lateral or by vertical separation. In the case of the TMA of the Düsseldorf area, the most relevant airports, Köln and Düsseldorf are located at considerable distance from each other, allowing arriving flights for both airports to pass vertically separated over each TMA entry-fix. This procedure is illustrated by an example TMA design (see Figure 3).
2 ASAS is a concept of SESAR that can be applied under these conditions but ASAS has not been part of the current experiment.

Episode 3
D5.3.4-02 - Results of FTS on Multi-Airport TMA operations in the core area of Europe
Version : 1.00
Page 28 of 125
Issued by the Episode 3 consortium for the Episode 3 project co-funded by the European Commission and Episode 3 consortium.
Figure 3 – Example of a CDA approach over TMA entry -point via multiple IAFs to multiple runways
The flights, entering TMA airspace and belonging to one arrival flow for one specific runway, are required to be prepared for final CDA clearance by final adjustment. The clearance will be issued after passing the IAF. The effectiveness of ATM in TMA airspace depends on planning accuracy and reliability. The better the capability to follow the CDA descent path and to correct for deviations, the more successful TMA controllers will be in meeting their objectives: to achieve optimal use of available capacity in the most efficient, environmental-friendly and safe way. This procedure is illustrated by an example TMA design (see Figure 4).
Figure 4 - Example of a CDA approach over TMA entry -point via one IAF to one runway
Success in the planning phase is dependent on the quality of 4D planning capability to ensure the planning of an undisturbed conflict-free landing at threshold. Success in the

Episode 3
D5.3.4-02 - Results of FTS on Multi-Airport TMA operations in the core area of Europe
Version : 1.00
Page 29 of 125
Issued by the Episode 3 consortium for the Episode 3 project co-funded by the European Commission and Episode 3 consortium.
executive phase is dependent on 4D-guidance capability and a tight control loop of monitoring, guidance and control. There are five options to improve execution of CDAs:
• 4D Guidance by the aircraft : The aircraft provides 4D guidance to the FAF. The aircraft’s FMS has the superior control loop to realise the planned FAF interception time with highest precision, but there has to be freedom to perform speed adjustments and the descent path has to be conflict-free.
• ASAS Sequencing : The aircraft has a superior control loop to maintain distance to its predecessor, and assuming that this aircraft arrives on-time on the FAF, and that the next one is capable to maintain time-based minimal spacing, maximum capacity can be realised.
• ASAS Merging : The aircraft has the capability to merge at a waypoint (the FAF) with high 4D precision, and assuming that the predecessor arrives at the FAF on-time with minimal separation, also the next one will arrive with minimal time-based separation.
• “Staggered” approach paths : Whenever the sequencing of aircraft is not stable enough to follow the CDA descent path through TMA to realise tight sequencing at the FAF, required for maximum throughput, there is an option to create independent descent manoeuvring by staggered approaches over parallel RNAV tracks. Each aircraft has ensured freedom now to accelerate and decelerate along the prescribed CDA, correcting for 4D deviations and merging as late as possible. However, the requirement to respect e.g. noise abatement policies at lower altitude, may cause a constraint. It might be prohibitive to accept complex structures of traffic flows in lower airspace.
• PRNAV: High precision navigation is applicable, along precisely planned routings, using predefined 3D profiles, limited to speed corrections only. It reduces airspace needs and will facilitate de-confliction of air traffic.
The experiment has assumed options to apply staggered approaches on dense arrival flows over one TMA-entry-point, using PRNAV tracks (see dotted tracks in Figure 5). Also 4D-guidance capability was assumed to be applicable on 100% of the traffic. Differentiation in performance due to partial equipage was difficult to model. Technically it is not simple to model differences in performance behaviour due to cockpit equipment levels. Therefore, partly equipped scenarios had not the priority. Also, no ASAS procedures were applicable.
Figure 5 – Example of a staggered CDA approach over TMA entry-point via one IAF to one runway

Episode 3
D5.3.4-02 - Results of FTS on Multi-Airport TMA operations in the core area of Europe
Version : 1.00
Page 30 of 125
Issued by the Episode 3 consortium for the Episode 3 project co-funded by the European Commission and Episode 3 consortium.
Departure traffic in TMA airspace has to be able to perform the initial climb in optimal way regarding noise load and has to respect noise abatement regulations. In addition, a wide spread of climbing profiles has to be anticipated due to differences in climb performance behaviour of departing traffic. By preference, departing traffic has to be kept separated from arrival traffic by structured routing schemes.
Based on these basic requirements, departure traffic has to be accommodated such that traffic is optimised towards a most efficient way to merge into en-route traffic flows. Departure traffic will fly over arrival flows in the experiment, but in conflicting cases, it will be necessary to split traffic and to guide part of the traffic over and part of the traffic under the arrival flow. RNP is assumed to support ensured separation.
� Interoperability between Air and Ground In order to keep 4D planning up-to-date, an update is expected directly after departure or at Top-of-Climb. This update makes 4D planning more accurate and reliable than before take-off. The executive phase of departure operations is expected to be in-line with this updated 4D planning.
2.2.3 Level of Maturity of Concept of Interest
Concerning the level of maturity of the concept of interest, the following can be stated:
� Demand and Capacity Balancing: DCB is a pre-departure process. The process doesn’t make use of any advanced technology and therefore there are no transition issues. The process is in a V3 status, and validation can be consolidated quite easily. The most complicated issue will be agreement and operational implementation may be dependent therefore on stakeholders’ acceptance mainly.
� Airspace Management and Organisation: Airspace re-organisation will be initiated by the process of creating Functional Airspace Blocks (FABs). However, it is doubtful if, at a first stage, agreement on FABs will be so far reaching as required for arrival management in the core area according to the operational concept of SESAR. Given the interests of all airspace users, a more refined step-by-step approach is more likely than a solution fulfilling all requirements at once. Therefore, far reaching assumptions are mandatory for the achievable level of concept validation in this experiment.
� Flight management, planning and Automation support: Flight management, planning and automation support with its main focus on traffic synchronisation and sequencing, is not highly safety critical, whereas the benefits can be considerable. It is estimated therefore that this part of the concept is appropriate to be brought to maturity for implementation at an early stage. Part of the concept has passed the V3 stage.
� Collaborative Decision Making (CDM) during planning : CDM during departure and arrival management is relatively mature. Parts of this concept are in operation and passed the V5 status.
� Short-term Planning in ETMA/TMA airspace and Execut ive control:

Episode 3
D5.3.4-02 - Results of FTS on Multi-Airport TMA operations in the core area of Europe
Version : 1.00
Page 31 of 125
Issued by the Episode 3 consortium for the Episode 3 project co-funded by the European Commission and Episode 3 consortium.
Planning and executive control have to be considered separately due to the technical complications and the safety issues related to operational implementation.
The 4D planning concept, including air-ground exchange can be considered as good candidates for short-term implementation if applied to arrival management, by time-based planning, and not for the planning of de-confliction and separation. Integration of down-linked information is relatively simple as long as applicable to arrival management and not to de-confliction. Therefore, the short-term focus shall be on demonstrating the benefits of using 4D planning information to enhance the accuracy of the arrival management process.
Enhancement of executive control is difficult to overview. The implications of 4D-guidance as well as ASAS for executive ATC are badly known. Also, the implications of applying ASAS on 4D precision approach processes are unknown as well as the best way to combine 4D-guidance with ASAS applications. The FTS modelling is difficult anyhow. For that reason, performance assessment by fast-time simulation has problems to assess the benefits. The concept must be considered as being still in a V1 or V2 stage.
� Interoperability between Air and Ground: There are no technical problems to implement data link. Bandwidth, reliability and communication protocols can be implemented easily. The problems are related to two aspects mainly:
• How to integrate data linked information exchange within ATM ground systems and avionics systems, and
• How to come to standardisation and to address transition issues, and to achieve implementation with mixed equipage levels providing still the expected benefits.
The data link applications are in a V3 stage due to integration aspects and performance benefits that are not yet fully solved.
2.2.4 KPAs related to the Concept of Interest
As demonstrated by the previous sections, the departure and arrival procedures are strongly dependent on AOM in ETMA/TMA airspace and on DCB performed in a European context. The focus was in this experiment on ETMA/TMA operations to multiple airports in the core area, whereas DCB effects determined the simulation initiating conditions. DCB effects operating under an advanced concept of operation are unknown and not validated yet. Effects of DCB on Arrival Management had to be emulated therefore, and the contributing performance of DCB is “assumed”.
The following list formulates some high level benefits expectations for applicable KPAs:
• Cost-Effectiveness : This is a main issue; the overall costs of flight operations in the ETMA/TMA environment of the airport are expected to decrease in costs due to less human interventions, shorter flight duration and optimised profiles to be flown. Operational assessment experiments will typically evaluate critical inputs to cost-effectiveness, such as flight efficiency, throughput, delays and workload. These are dealt with under their associated KPAs.
• Capacity : The capacity of the airspace volumes and applicable runway configurations involved in the operations to serve a hub airport had to be evaluated, because throughput and delays are critical issues of appraisal of advanced concepts of operation. If the concept ensures more efficient use of airspace, capacity may increase and throughput may increase whilst delays decrease.
Secondly, the capacity of the network of airspace volumes and airports has to be in proper balance in order to avoid bottlenecks. In this respect, TMA operations are most critical.

Episode 3
D5.3.4-02 - Results of FTS on Multi-Airport TMA operations in the core area of Europe
Version : 1.00
Page 32 of 125
Issued by the Episode 3 consortium for the Episode 3 project co-funded by the European Commission and Episode 3 consortium.
• Efficiency : Efficiency can be improved by reduced flight duration, by enhanced punctuality, reducing Airline’s internal costs, and by reduction of workload. These cases are all critical for the success of concepts of operation around a hub airport.
• Flexibility : The concepts investigated are designed to serve congested hub airport operations and to improve the use of scarce resources. This requires planning and strict adherence to planning. The benefits are expected to come from enhanced predictability by iterative and accurate planning and adherence to planning. Nevertheless, the iterative character is meant to support the flexibility needed to cope with incidental and badly predictable events during flight preparation and execution. The success of flexibility and its operations can not easily be incorporated in fast-time simulation experiments to evaluate capacity, efficiency and cost-effectiveness at the same time.
• Predictability : Because benefits of enhanced operations are strongly dependent on enhanced predictability, the concept supports enhanced predictability and its impact has to be assessed to and from the airport, as well as by enhanced turn-around. The former is addressed, the latter not.
• Safety : Safety is critical for operations in ETMA/TMA airspace. There are many safety-related issues, however, these are not part of assessment for general traffic operations by fast-time simulation. The separation standards of part the operations, i.e. the CDAs, are critical and are evaluated separately, see OPTIMAL, Stroeve, Ref. [23]. The findings of this study are used in this validation experiment. Another critical issue is to perform CDA approaches simultaneously on parallel runways. This is addressed by applying lateral separated inbound turns and different glide slopes (see also section 2.5.3).
• Environmental sustainability : The concept to be validated is sensitive for environmental sustainability. Quantitative noise assessment for CDAs, however, requires taking into account the population density in the TMA3. This was not part of the experiment; however, the selected CDA profiles were identified as noise preferential profiles. In addition, optimised routing was considered from the point of view of shortest routes and most fuel-efficient routings. This relates to emissions but not to noise.
Security, Access and Equity, Interoperability, and Participation by the ATM community are not addressed in this experiment.
2.3 EXERCISE OBJECTIVES
This section identifies the subject of the fast-time simulation experiment. A distinction is made between validation objectives (“addressed” concepts) and concept clarification objectives (“emulated” concepts) and also the scope of validation is summarised briefly.
The present experiment shall address those elements of the SESAR concept:
• That allow to improve departure and arrival operations to and from hub and large airports by enhanced flight management and planning,
• That are expected to be effective when traffic is operated within an enhanced airspace environment, and
• That are operating under enhanced executive procedures.
3 Quantitative noise assessment can be performed by calculating the area of the noise contours for Lden and Lnight (this will be done in WP2.4.4). In addition, it should be noted that fuel optimised routes will have a large negative impact on the noise hindrance.

Episode 3
D5.3.4-02 - Results of FTS on Multi-Airport TMA operations in the core area of Europe
Version : 1.00
Page 33 of 125
Issued by the Episode 3 consortium for the Episode 3 project co-funded by the European Commission and Episode 3 consortium.
The focus of the experiment is to measure the effect of enhanced planning on executive operations to and from hub airports within an airspace environment that is optimised towards the requirements of the airports of interest under partly idealised airspace conditions.
The hub airports selected are located in the core area and at such distances that their TMAs are small and constrained by other airspace user activities and that their extended arrival operations are heavily dependent on each other. In order to facilitate these extended arrival operations for all hub airports in the area in an undisturbed and equivalent way, there is a need to create fairly concise but dedicated arrival flow corridors for all dense arrival flows in the area of interest. One objective of the experiment is to demonstrate the benefits of the creation and use of these dedicated arrival flow corridors for all concerned arrival flows. The advanced design of ETMA airspace in the area of interest shall provide the aimed benefits for all airports involved together with extensions of these flow corridors in En-route airspace, under partly realistic constraining conditions, i.e. no guarantee of services to regional airports and the Military. The adapted planning, coordination and executive procedures, adopted from SESAR, shall provide the means to deploy the airspace in a meaningful way. The integrated use of airspace establishes a "super"-ETMA/TMA airspace area servicing a multi-hub airport environment in this way.
Considering the operational concept of SESAR, Ref. [15], and the DOD E5, Ref. [19], addressing the arrival and departure operations in high density airspace, the high level concept elements are:
• Queue management, • Separation provision, • Collision Avoidance.
The emphasis in this experiment is put on performance assessment of Queue Management, comprising traffic management, traffic synchronisation, sequencing and planning. The experiment aims to measure achievable performance improvement by advanced Queue Management under realistically simulated future operational conditions. It is assumed that conceptual ideas can be brought to operation, but it has to be validated yet, if success is achievable in dense traffic complex areas, operating under “real” constraining conditions. For applying CDAs, the experiment investigates achievable accurate sequencing at TMA entry-point, assuming that operating CDAs is feasible under the modes of operation, assessed by Expert Judgement, Expert Group Plan, Ref. [26] (see also assumptions, section 2.8). The experimental set-up is not appropriate to investigate and validate for example separation, stability of sequencing, and experienced Controllers workload (in absolute figures), however, the experiment is able to assess overall impact of separation problems, and impact on workload (indicative trend), flight efficiency and throughput under assumed and modelled conditions of operations over large time periods and large areas of ATM applicability.
The following main areas of operational improvement are described by DOD E5, Ref. [19], and addressed partly by the experiment:
• Trajectory based operations by 4D trajectories (emulated ), • Extended temporal scope of arrival queue management (addressed ), • Introduction of new types of airspace structures (re-organisation of airspace
addressed ), • The introduction of new separation modes, including the introduction of initial ASAS
based operations (not addressed, for technical reasons ), • Information managed on a system-wide basis and air-ground data link (emulated ), • Automation support – contributing to capacity increase through workload reduction
(emulated ).
The experiment focused on measuring improvement of operations of part of the operations in the core area of Europe. Specifically, the arrival operations have to suffer at present from restrictions imposed by traditional routings and national boundaries, and these limitations are

Episode 3
D5.3.4-02 - Results of FTS on Multi-Airport TMA operations in the core area of Europe
Version : 1.00
Page 34 of 125
Issued by the Episode 3 consortium for the Episode 3 project co-funded by the European Commission and Episode 3 consortium.
prohibitive for implementation of advanced SESAR concepts of operation. For that reason two focal points have been selected at both sides of the Dutch-German border that are suffering both from airspace restrictions.
Figure 6 - Overview of aircraft mov. at airports in the core area of Europe during 24 hours (2005, Ref . [1])
Figure 6 presents hot spots of hub airports in congested Multi-Airport TMA areas of Europe. The selected area comprises Amsterdam-Schiphol, Düsseldorf, Köln and Brussels-Zaventem. Other areas of high congestion could have been: the London area, the Paris area, the Frankfurt/Munich area and possibly Milan, showing similar congestion levels.
At the German side, the Düsseldorf area is selected as a cluster of airports. The airports in this cluster, Düsseldorf and Köln, are heavily dependent on each other and can be considered as large airports that may profit from enhanced arrival/departure operations. The airports may profit from redesign of the TMA facilitating flight-efficient CDAs. The operations inside this TMA are facilitated by creation of long stretched “Dedicated Arrival Flow Corridors”, feeding the TMA-entry points. One of these ETMA arrival corridors operates cross-border, stretching at least 150 NM out inside Dutch airspace. Inside the TMA, departure flows are structurally separated from arrival flows.
At the Dutch side, Schiphol Airport is selected, acting as the dominating airport in Dutch airspace. On the one hand the airports operate with an enlarged TMA compared to today, 2009, to allow deployment of a 2x2 runway configuration, operating with 4 TMA-entry points (and stacks) and staggered approaches by CDAs, structurally separated from departure flows. The TMA entry-points are fed by stretched “Dedicated Arrival Flow Corridors” of which two are allocated partly in Belgian and Germany: one over the present-day, 2009, East-bound arrival routes and a new one feeding the newly created South-East TMA-Entry point.
En-route traffic and traffic to and from other large and small hub and regional airports in the area are simulated but not measured. The objective of the simulation is to measure the performance of the two areas of interest, i.e. around the Düsseldorf area and around the Schiphol airport by measuring the performance improvement of all arrival and departure flows to and from the airports of interest. Improvement is defined in this case by comparing the performance of present-day, 2009, operations operating in present-day airspace, with the performance of future operations, operating under the assumed implementation of part of the operational concept of SESAR and operating in an assumed re-organised airspace that fulfils the SESAR operational requirements.

Episode 3
D5.3.4-02 - Results of FTS on Multi-Airport TMA operations in the core area of Europe
Version : 1.00
Page 35 of 125
Issued by the Episode 3 consortium for the Episode 3 project co-funded by the European Commission and Episode 3 consortium.
In addition, departure/arrival traffic operations are simulated for the airport of Brussels, Zaventem, because the arrival flows for this airport can not be ignored when simulating advanced departure/arrival procedures for Amsterdam and the Düsseldorf area. The same is applicable for an extra arrival flow through the Netherlands to the London area.
This means that the experiment is focused on operations of the airports of Schiphol (EHAM), Düsseldorf (EDDL), Köln (EDDK and Brussels (EBBR). These airports are characterised by "multi-airport" interdependencies summarised in the following table (Table 2).
Airport of interest
Dependent relationship Type of dependency
Role in FTS experiment
Amsterdam (EHAM operations)
Rotterdam and Eindhoven mainly
Regional airport dependencies
nearby, and simulated but not investigated
Düsseldorf area (EDDL/EDDK) - East-bound traffic
Hub airport dependencies
ETMA dependent, and simulated
Brussels (EBBR) - South-bound traffic
Düsseldorf area (EDDL and EDDK operations)
Düsseldorf (EDDL) and Koln (EDDK)
Nearby hub airport dependencies
Simulated
Nieder-Rhein, Dortmund, Hannover etc., but also Luik (Liege) and Maastricht-Aken
Regional airport dependencies
nearby, and simulated but not investigated
Schiphol (EHAM) - West-bound traffic
Hub airport dependencies
ETMA dependent, and simulated
Brussels (EBBR) - South-West-bound traffic
Frankfurt (EDDF) Hub airport dependencies
ETMA dependent and simulated but not investigated
Brussels area (EBBR operations)
Charlerois, Luik (Liege) and Antwerpen mainly
Regional airport dependencies
nearby, and simulated but not investigated
Schiphol (EHAM) - North-bound traffic
Hub airport dependencies
ETMA dependent, and simulated
Düsseldorf area (EDDL and EDDK) - North-East-bound traffic
London area - West-bound traffic
Hub airport dependencies
ETMA dependent and partly simulated

Episode 3
D5.3.4-02 - Results of FTS on Multi-Airport TMA operations in the core area of Europe
Version : 1.00
Page 36 of 125
Issued by the Episode 3 consortium for the Episode 3 project co-funded by the European Commission and Episode 3 consortium.
Airport of interest
Dependent relationship Type of dependency
Role in FTS experiment
Paris area - South-bound traffic
Table 2 - Multi-airports aspects of traffic flows s imulated in the FTS experiment
2.4 CHOICE OF INDICATORS AND METRICS
This section describes applicability of the Key Performance Areas and the use of Performance Indicators derived from the EP3 Performance Framework, Ref. [10].
The concepts studied have an impact on several KPAs. Some high level benefits expectations are formulated for KPAs in section 2.2.4, while fast-simulation was selected in order to address quantitative performance benefits assessment. The expected outcome by quantitative fast-time validation assessment of the most relevant KPAs is described below:
� Capacity: Due to the bottleneck behaviour of the ATM network , the performance of the network is critical for the most constraining sectors and airports. For hub airport operations, the TMAs are the most critical sectors. The aim was to realise sufficient capacity through all departure and arrival sectors to realise forecasted Airport capacity with sufficient robustness to cover variations in departure/arrival rates and to deal with typical flow bunching in different directions. Present-day, 2008, routing and sectorisation had to be compared with a more ideal airspace organisation, operated by application of advanced SESAR concept elements operated through “Dedicated Arrival Flow Corridors”.
• Throughput potential of the network can be measured with the Network Analysis Model (NAM), counting number of flights through sectors, length of queues and accumulating waiting time.
• Delays can be measured with TAAM©, simulating different scenarios and comparing measured results. Departure delays and imposed ground delays, necessary to realise minimum in-flight delays, are characterising capacity limitations as well.
• Workload can be measured as load on human actors, required to provide control services to a flight, if the applicable sectorisation and tasking of controllers is known. The workload modelling is based on an acceptable 70% load in an average en-route sector controlled by one controller (giving 70% of 3600s is: 2520 sec/hour).
KPAs Local PIs ID Local PI Name (unit)
Local PIs Definition
CAP.LOCAL.TMA.PI 1 Sector capacity (Nr. aircraft/h)
Maximum number of aircraft that can exit the geographic area or the most penalising TMA sector in one hour. It must be measured when the system is in high traffic conditions (at the limit of what a controller can deal without reducing safety) for a whole hour. It can be based on the maximum task load the tactical controller can deal with in this period of time.
Capacity
CAP.LOCAL.TMA.PI 2
Maximum simultaneous number (Nr. aircraft)
Maximum simultaneous aircraft being controlled in the TMA.

Episode 3
D5.3.4-02 - Results of FTS on Multi-Airport TMA operations in the core area of Europe
Version : 1.00
Page 37 of 125
Issued by the Episode 3 consortium for the Episode 3 project co-funded by the European Commission and Episode 3 consortium.
KPAs Local PIs ID Local PI Name (unit)
Local PIs Definition
CAP.LOCAL.TMA.PI 3 Total delays (min)
Sum of delays, due to the TMA, for arrivals and for departures. The delay for arrivals is the difference between the planned arrival time and the actual arrival time. The delay for departures is given while it is on the ground.
CAP.LOCAL.TMA.PI 4 Total period throughput (Nr. aircraft)
Total number of aircraft controlled in the TMA during the 6h00-22h00 period.
CAP.LOCAL.TMA.PI 5
Maximum measured throughput (Nr. aircraft/h)
It is the maximum number of aircraft that actually exited the geographic area, or the most penalising TMA sector per hour with the considered traffic demand. It can be lower than the sector capacity, but can be equal to it when the system is fully loaded. This maximum measured throughput might be computed as the average of the maximum measured throughput for different controllers and traffic samples.
Table 3 - KPIs applicable to Capacity KPA
� Efficiency: The airspace users wish is to fly undisturbed city-pair connections following an optimised vertical profile , while present operations are inefficient due to all kinds of constraining conditions by other airspace users. An increased level of efficiency is expected by early planning and anticipation through all phases of flight. Enhanced ATFCM, departure operations and in-flight operations will result in higher punctuality and less variability of demand at TOD , and enhanced arrival management will increase the punctuality at touch-down against fewer deviations from the optimal Reference Business Trajectory (RBT). The efficiency is measured by delays related to the RBT and its related flight duration as a measure of fuel consumption and emissions.
• Improvement of flight efficiency is measured by comparing actual flight time between the start of arrival management (200NM out) before TOD and Touch-down for different scenarios.
• The same aspect of flight performance is assessed by measuring fuel consumption as a rough indicator of flight benefits by optimised arrival procedures.
KPAs Local PIs ID Local PI Name (unit)
Local PIs Definition
Efficiency
EFF.ECAC.TMA.PI 1 Total flight duration (min)
Sum of the flight durations in the scenario. Times during which aircraft are not in the geographic area are not considered.

Episode 3
D5.3.4-02 - Results of FTS on Multi-Airport TMA operations in the core area of Europe
Version : 1.00
Page 38 of 125
Issued by the Episode 3 consortium for the Episode 3 project co-funded by the European Commission and Episode 3 consortium.
KPAs Local PIs ID Local PI Name (unit)
Local PIs Definition
EFF.ECAC.TMA.PI 2 Optimal total flight duration (min)
Sum of the “best controlled” flight durations. The “best controlled” flight duration is the one the aircraft would have if it were alone in the geographic area, following applicable procedures, from the first point of the geographic area to the last point of the geographic area. It can be computed by taking into account aircraft performances. See the beginning of the TMA section for precisions on the geographic area.
EFF.ECAC.TMA.PI 3 Total Fuel consumption (kg)
Fuel consumption in the geographic area. If it is not computable, then fuel consumption can be replaced by the flown distance (NM).
EFF.ECAC.TMA.PI 4 Optimal total fuel consumption (kg)
Sum of the “best controlled” fuel consumptions. The “best controlled” fuel consumption of an aircraft is its fuel consumption that would be used to travel in the geographic area if it was alone, with no other traffic to disturb its trajectory. If not computable, it can be replaced by total effective distance in the “general performance indicators” section.
EFF.ECAC.TMA.PI 5 Number of delays (Nr. aircraft)
Number of aircraft delayed by more than 3 minutes (a delay is the difference between expected time and actual time). Delay information can be found using flight plan data.
EFF.ECAC.TMA.PI 6 Total delays (min)
Sum of delays due to the TMA, for arrivals and for departures.
Table 4 - KPIs applicable to Efficiency KPA
� Predictability: The concepts of flight management, regulating flows, arrival sequencing, and planning, are improving predictability as long as flight plans are updated and the executive process adheres to the planning.
• The quality of predictability increases by enhanced (in-flight) planning. The planned arrival time of the managed trajectory, the RBT, is compared with actual arrival time and is a measure of predictability.
KPAs Local PIs ID Local PI Name (unit)
Local PIs Definition
Predictability
PRE.ECAC.TMA.PI 2 Flight time deviation (no unit)
Flight time standard deviation divided by mean flight time. This PI does not capture the fact that sub-groups of trajectories can have regular flight times internally, while their average flight time is different (two different procedures in TMA for example). It also does not capture the fact that aircrafts of different category have different speeds. Those two points could make flight time deviation big, while flight times are actually very predictable.
Table 5 - KPI applicable to predictability KPA

Episode 3
D5.3.4-02 - Results of FTS on Multi-Airport TMA operations in the core area of Europe
Version : 1.00
Page 39 of 125
Issued by the Episode 3 consortium for the Episode 3 project co-funded by the European Commission and Episode 3 consortium.
� Safety: At the level of anticipated validation experiments, safety assessment will be restricted to ensure that similar levels of safety as at present, 2009, can be expected, and that no new risks are introduced by the concepts to be validated. This is not measured but comprised in the imposed separations applicable to simulated air traffic.
� Environmental sustainability: Environmental sustainability is in the context of present validation experiments a secondary assessment KPA. Although admittedly, an important reason to introduce CDAs is to improve noise load, the first objective of the experiment was to facilitate CDAs under high density conditions, and not to validate the optimal CDA profiles. Effects on noise can be derived from calculated footprints below 3000 ft.
� Summary of applicable KPIs: The FTS experiment was planned to be performed as a 2-phase simulation experiment, first ECAC-wide on DCB applications, than regional on detailed operations at the level of arrival flows. Due to project suspension, only the second part was executed, and simulated DCB processes had to be strongly simplified therefore by emulation. Also, re-sectorisation was beyond the scope of the present experiment. As a consequence:
• Flight performance was analysed from ETMA entry up to touch-down. • Controller action-requiring events were counted instead of analysing workload.
A summary table of applicable KPIs, derived from the KPI-tables above, are listed in Table 6.
Identification of KPI
Measured quantity and Units KPA related
Traffic load Deps/Arrs per airport in nr. of flights per day Capacity
Controller required actions
Events per day ((possible) conflicts, holdings, levelling, vectoring, sector entries)
Capacity, workload
Throughput (airport) Arrival throughput in nr. of flights per hour Capacity
Average flight time Flight time in seconds from ETMA entry-point Efficiency
Average pre-departure delay
Imposed delays (between 0 and 10 min) in sec. Efficiency
Average fuel consumption
Fuel from ETMA to touch-down in kg. Efficiency
Flown distance Flown distance from ETMA to touch-down in NM Efficiency
Cumulative KPI figures
Traffic load Arrivals per airport in nr. of flights per day with >200NM flight distance
Efficiency (Costs)
Flight time Cumulative savings per year (300 days) for flights (>70NM) in flight hours
Efficiency (Costs)
Fuel Cumulative savings per year (300 days) for flights (>70NM) in kg.
Efficiency (Costs)
Table 6 - KPIs applicable to FTS on Multi Airport T MA operations

Episode 3
D5.3.4-02 - Results of FTS on Multi-Airport TMA operations in the core area of Europe
Version : 1.00
Page 40 of 125
Issued by the Episode 3 consortium for the Episode 3 project co-funded by the European Commission and Episode 3 consortium.
2.5 VALIDATION SCENARIO
This section provides a detailed description of applicable validation scenarios referencing different time frames and advanced concept application levels.
A performance assessment validation experiment had to be executed to assess performance improvement by SESAR conceptual improvements in ETMA and TMA operations in the core area of Europe. The operational impact had to be measured for operations of airports in the Düsseldorf area and in Amsterdam Schiphol, EP3 WP5 validation Strategy, Ref. [22], see also Table 7. Because an extended time horizon for arrival management was addressed, a coherent airspace area was selected that covers part of the core area, but that excludes at least the London area, the Paris area and the Frankfurt area.
Validation Objective : The objective of this fast-time exercise is to validate that the ATM capability of ETMA/TMA airspace in a multi hub-airport environment (Schiphol and Düsseldorf.) is sufficient to cope with increased demand in each airport, taking into account the forecast capacity of each of the airports.
Descent operations starting from Top-of-Descent, typically 100NM out, have to become highly efficient compared to today’s operations, i.e. 2009, by starting an arrival sequencing process ~150-200NM out.
Rationale : The ATM capability, including the SESAR 2020 conceptual improvements, will facilitate the required highly accurate operations with minimised airspace requirements. In 2020 the scope of hub airport operations are extended significantly due to implementation of the SESAR concept of 4D trajectory management, supporting at least 3D with predicted RTA and high-precision departure and approach operations. The ETMA/TMA operations of a hub airport are growing therefore so much in size and complexity that several hub airports in the core area are to be considered now to belong to one single ETMA/TMA environment. The operations in this environment have to be integrated and harmonised in order to achieve maximum efficiency under heavily constrained conditions.
The experiment shall validate how operations in part of the network can be served in an optimised way against minimal penalties and imposing minimal requirements on airspace usage. The increased demand has to be accommodated by high performance ATM, capable to serve dense departure and arrival flows in limitedly available airspace volumes.
Reference to SESAR Con. Ops .: F3.3 High Complexity Terminal Operations, F.6.2 Terminal Area Operations
Table 7 - Validation exercise description according to the EP3 WP5 Validation Strategy, Ref. [22]
The reference “Baseline” scenario had to be a present-day airspace organisation, 2008, aligned along the national boundaries, following present-day procedures and letters-of-agreement. Arrival Management is performed, starting implementation of sequencing from the national/FIR boundaries, using conventional flightplan information and delivering flights rate-based into the TMA. Actual sequencing takes place by vectoring.
The advanced “CDA” scenario had to be organised in such a way that all arriving and departing flows to the Düsseldorf area and Amsterdam Schiphol were following an optimised routing scheme, descending by efficient CDA profiles in ETMA airspace and by noise-friendly CDA profiles in TMA airspace below 6000 ft. Dedicated arrival flow corridors in ETMA airspace allowed to simulate performance of 4D trajectory management in compliance with SESAR, including arrival management with a long planning horizon up to 200 NM out and an emulated DCB application to balance demand against available capacity. All air traffic to and from other airports was simulated as much as possible in a similar and equivalent way, including Brussels traffic which received an equivalent set of dedicated arrival flow corridors and the London area with allocation of at least one dedicated arrival flow corridor for Nord-bound traffic through Dutch airspace (see Figure 7).

Episode 3
D5.3.4-02 - Results of FTS on Multi-Airport TMA operations in the core area of Europe
Version : 1.00
Page 41 of 125
Issued by the Episode 3 consortium for the Episode 3 project co-funded by the European Commission and Episode 3 consortium.
Figure 7 - Schematic figure of allocation of enhanc ed TMAs and stretched arrival sectors for the advan ced organisation
Demand for different years was assessed in order to be able:
• To assess the performance improvement of reorganised airspace and new operational conceptual elements under present-day conditions, year 2008, and
• To assess SESAR required levels of traffic demand, year 2020, with an average increase of 50% of air traffic demand (number of flights) for the airspace area of interest, compared to the reference year 2008.
Therefore, four different scenarios had to be evaluated and compared with each other:
• 2008, current flow, Baseline scenario : The 2008 traffic demand represents light flow densities, in good balance, and without disruption. The simulation demonstrates performance under present-day airspace organisation and concept, and may serve as a performance reference for today’s operations.
• 2008, current flow, CDA scenario : The CDA 2008 scenario offers the opportunity to compare performance of advanced airspace organisation and advanced operational concept under exactly the same traffic loading conditions as the previous scenario. This makes it possible to assess achievable benefits with traffic load of today. This is very realistic because for example a credit crisis, an ecological crisis, or an oil crisis may make it urgent to improve flight efficiency under present-day traffic levels.
• 2020, future flow, Baseline scenario : The 2020 traffic demand represents heavy flow densities, unbalanced, and including unintended disruption, although without reactionary delays. The fundamental problem with this scenario is that there is a reasonable reliable estimate of traffic growth, but there is no way to estimate the anticipation on how to accommodate the growth by new infrastructure. It is extremely difficult to foresee where and how airports will expand, as well as how to change airspace operations in order to cope with increased airport capacity. The result is a highly unlikely “Do Nothing” scenario for which air traffic demand will increase as expected, while there is no success in improving operations. The simulation demonstrates performance of heavy traffic under present-day airspace organisation
Episode 3
D5.3.4-02 - Results of FTS on Multi-Airport TMA operations in the core area of Europe
Version : 1.00
Page 42 of 125
Issued by the Episode 3 consortium for the Episode 3 project co-funded by the European Commission and Episode 3 consortium.
and concept, and may serve as a performance reference for future operations in future airspace applying the future concept.
• 2020, future flow, CDA scenario : The CDA 2020 scenario offers the opportunity to compare performance of advanced airspace organisation and advanced operational concept under exactly the same traffic loading conditions as the previous scenario. The result gives an indication of what can be achieved in terms of performance improvement compared to the 2020 “Do Nothing” strategy. However, it has to be stressed that the outcome is still extremely unlikely due to the missing improvements of infrastructure. The penalties are extreme and therefore also the benefits are much larger than they will ever be!
Concluding, it can be stated that comparing the 2008 Baseline scenario with the 2008 CDA scenario, is expected to give the best results and the highest level of confidence on the performance capabilities of the operational concept operating under properly adapted airspace organisation.
Nevertheless all four scenarios are evaluated, and evaluation is accomplished by step-wise validation. Four “Baseline ” and four “”Advanced CDA ” scenarios were defined to assess the step-wise improved evaluation of the performance of air traffic demand under different operational conditions, and these eight scenarios are run all with low traffic (2008) as well as with heavy traffic (2020). In addition, there was an extra advanced scenario to improve executive operations which was defined but not implemented and simulated, i.e. scenario 2.5.
The following four + five steps were defined to perform the fast-time performance assessment experiment (for each year, i.e. 2008 and 2020):
1.1 Baseline, “unconstrained ideal profiles” : The reference scenario was simulated with TAAM© without solving any potentially conflicting situation. This simulation run provided ideal trajectories flown under traditional airspace organisation. The outcome provides information on how to fly vectored arrival procedures in the most flight-efficient way by levelling off, but without extended vectoring. The outcome is theoretical, giving reference information, and has no real operational significance!
1.2 Baseline, “Operational realistic” : The reference scenario was simulated with TAAM© in traditional airspace. Ensured separation and traditional metering and sequencing procedures were applicable, measuring throughput and efficiency. The outcome gives results of present day’s performance levels under today’s procedures and today’s concept of operation.
1.3 Baseline, “DCB emulated” : The reference scenario was simulated in traditional airspace again, but traffic demand was regulated by applying pre-departure constraints to prioritise on-time departures to congested destinations. The outcome gives information of potential improvement by departing “on-time” whilst operating under present day’s procedures. Its significance is that even if airports/ATCs are not able to improve arrival management and to apply CDAs, they can still benefit from “on-time” departures and enhanced DCB.
1.4 Baseline, “arrival synchronised” : The reference scenario was simulated by TAAM© in traditional airspace again. The DCB regulated traffic was arrival synchronised this time when reaching the arrival sequencing conditions in traditional airspace. Arrival synchronised means in the traditional context, that implementation of the sequence starts from national/FIR boundaries, whilst the sequence is accomplished earlier at TMA-entry-point, CTA waypoint or IAF. The obtained benefits are expected to be modest because levelling-off and vectoring procedures are still applicable, although possibly in a more efficient way.

Episode 3
D5.3.4-02 - Results of FTS on Multi-Airport TMA operations in the core area of Europe
Version : 1.00
Page 43 of 125
Issued by the Episode 3 consortium for the Episode 3 project co-funded by the European Commission and Episode 3 consortium.
2.1 Advanced CDA, “unconstrained ideal profiles” : The reference scenario was simulated with TAAM© without solving any potentially conflicting situation. This simulation run provided ideal trajectories flown under advanced future airspace organisation including CDAs. The outcome provides information on how to fly CDA arrival procedures in the most flight-efficient and undisturbed way. The outcome is theoretical, giving reference information, and has no real operational significance!
2.2 Advanced CDA, “operational realistic” : The reference scenario was simulated with TAAM© in advanced future airspace. Ensured separation and metering and sequencing procedures in support of CDAs were applicable, measuring throughput and efficiency. Because CDAs don’t allow vectoring in lower airspace, vectoring was suppressed and, in addition to speed adjustments, only holding manoeuvres were permitted. The outcome gives results of future performance levels by implementing part of the future concept of operations (CDAs). Because CDAs are constrained operations, the missing part of the concept (DCB and AMAN) is needed for better synchronised operations. Therefore, the outcome is theoretical and has no re al operational significance!
2.3 Advanced CDA, “DCB emulated” : The reference scenario was simulated in advanced future airspace again, including CDAs, but traffic demand was regulated by applying pre-departure constraints to prioritise on-time departures to congested destinations. The outcome gives results of future performance levels by implementing part of the future concept of operations (CDAs), including DCB. Because traffic synchronisation ensures better performance of constrained CDA operations, performance improvement can be expected.
2.4 Advanced CDA, “arrival synchronised” : The reference scenario was simulated by TAAM© in advanced future airspace again. The DCB regulated traffic was arrival synchronised this time when reaching the arrival sequencing conditions in future airspace around 200NM out (roughly 60 min. flight time). The outcome gives results of future performance levels by implementing the full planning part of the future concept of operations (CDAs). Because this was the most complete implementation of the concept, experienced by fast-time simulation, these results are expected to be the best achievable results.
2.5 Advanced CDA, “arrival synchronised, including 4D-guidance” : The same scenario as for 2.4, but short-term planning and control were enriched now with 4D guidance support. This last option was added, time and effort permitt ing. The question was also, whether it was feasible to model emulation of 4D-enhanced guidance and to measure the added value of the concept.
The final result in terms of benefits are assessed by comparing the 1.2, Baseline, “Operational realistic” scenario with the 2.4, Advanced CDA, “arrival synchronised” scenario. The 1.2, Baseline “Operational realistic” scenario represents today’s operations, operating from national/FIR boundaries under the present operational concept, whilst the 2.4, Advanced CDA, “arrival synchronised” scenario represents the most optimal scenario. These scenarios are ran with 2008 as well as with 2020 traffic demand, and the 2008 scenarios will give the best measured results of the benefits of the concept.
Scenario 2.5 was planned but there was no performance of any experimental simulation.
2.5.1 Hypothesis
In this section the hypothesis for each metric is mentioned. The hypotheses are different by comparing each time two scenarios, assessing the expected outcome of the critical metrics.

Episode 3
D5.3.4-02 - Results of FTS on Multi-Airport TMA operations in the core area of Europe
Version : 1.00
Page 44 of 125
Issued by the Episode 3 consortium for the Episode 3 project co-funded by the European Commission and Episode 3 consortium.
The experiment executed a performance assessment experiment applying scenarios with several parameters being relevant to indicate possible changes in performance. The scenarios were ordered such that significance of changes could be judged one by one. The hypothesis of this experiment is formulated therefore as a set of step-wise incremental performance assessment criteria, providing the benefits expected.
1. Network performance : Network throughput analysis leads to adding required capacity at those nodes of the network that are critical bottlenecks of the network. It assumed that small changes at critical nodes, changing “declared capacity” of these selected nodes in “required capacity”, can have a more than proportional impact on reduction of delays and increase of throughput through the network. The added capacity is not “created” but “assumed”.
o The 2008 and 2020 validation scenarios were assessed with NAM and results compared with original SESAR Definition Phase scenarios. The scenarios were appropriate to provide sufficient capacity through the network, measured as effective throughput.
2. Advanced airspace management : Due to the enlarged scope of operations for each airport/airport-area of interest, it is assumed to be possible to define a network of operations with significant higher throughput potential than the network based on “traditional” airspace organisation. Assuming realistic “declared” capacities for the newly created “Dedicated Arrival Flow Corridors”, the throughput capacity shall be sufficient to cope with forecasted expected airport demand.
o Validation scenarios 1.2 and 2.2 are executed and compared with respect to effective throughput.
3. ATM enhanced delivery : SESAR processing by DCB and early arrival traffic synchronisation accomplished by 4D trajectory management and advanced planning shall have a positive effect on in-flight delays and workload at sector level. The trade-off is pre-departure delay and inefficiency by tactical manoeuvring against in-flight efficiency. The assumption is that even within a “traditionally” organised airspace structure benefits must be achievable, although against high penalties.
o Validation scenarios 1.3 and 1.4 are executed and results are compared with scenario 1.2 results; throughput, flight efficiency and predictability are measured.
4. ATM enhanced delivery in enhanced airspace : Operating within an advanced airspace organisation, the SESAR processing by DCB and early arrival traffic synchronisation accomplished by 4D trajectory management and advanced planning, shall have an even stronger positive effect on in-flight delays and workload at sector level. The trade-off is again pre-departure delay and inefficiency by tactical manoeuvring against in-flight efficiency, but the penalties will be significantly reduced compared to “traditional” airspace. The assumption is that the achievable benefits must be much higher within “advanced” organised airspace structures due to better tuning to required airspace, and at the same time the penalties are expected to be significantly lower than with a “traditional” organisation of airspace.
o Validation scenario 2.3 and 2.4 are executed and results are compared with scenario 2.2 results; throughput, flight efficiency and predictability are measured.
o Also, the achievable performance improvement is expected to be better than for hypotheses 3.
5. Executive services (RNAV+4D) : The performance can still be improved by providing ATM services that will contribute to enforce the punctuality objectives of planning by changing the objective of flight executive services from “safe, orderly and expeditious” to

Episode 3
D5.3.4-02 - Results of FTS on Multi-Airport TMA operations in the core area of Europe
Version : 1.00
Page 45 of 125
Issued by the Episode 3 consortium for the Episode 3 project co-funded by the European Commission and Episode 3 consortium.
“safe, orderly and on-time”. The priority is given to those flights that are approaching a congested area. Because Amsterdam airport and the airports in the Düsseldorf area are going through periods of congestion, benefits are expected to be measured in those time periods for flights arriving at these airports of interest.
o This last hypothesis could not be assessed because scenario 2.5 could not be implemented in a feasible and acceptable way. Implementation was pre-mature.
The following table, Table 8, summarises the hypotheses and how to assess performance benefits. The table relates Validation scenarios to applicable Hypotheses, starting from applicable input scenarios and creating different reference and advanced scenarios.
Hypothesis
Scenario
Network performance
and optimum
flight profiles
Impact of Airspace on
flight efficiency
and throughput
ATM enhanced delivery in traditional airspace
ATM enhanced delivery in enhanced airspace
Optimisation of Executive performance
services
Baseline
1.1 unconstrained ideal profiles
Max. throughput, minimum flight time traditional
1.2
operational realistic
Traditional performance by constrained profiles
1.3
DCB emulated
Flight efficiency by DCB in traditional airspace
1.4
arrival synchronised
Flight efficiency by arrival man. in traditional airspace
Advanced CDAs
2.1 unconstrained ideal profiles
Max. throughput, minimum flight time advanced
2.2
operational realistic
Enhanced performance by more efficient CDA profiles
2.3
DCB emulated
Flight efficiency by DCB in advanced airspace
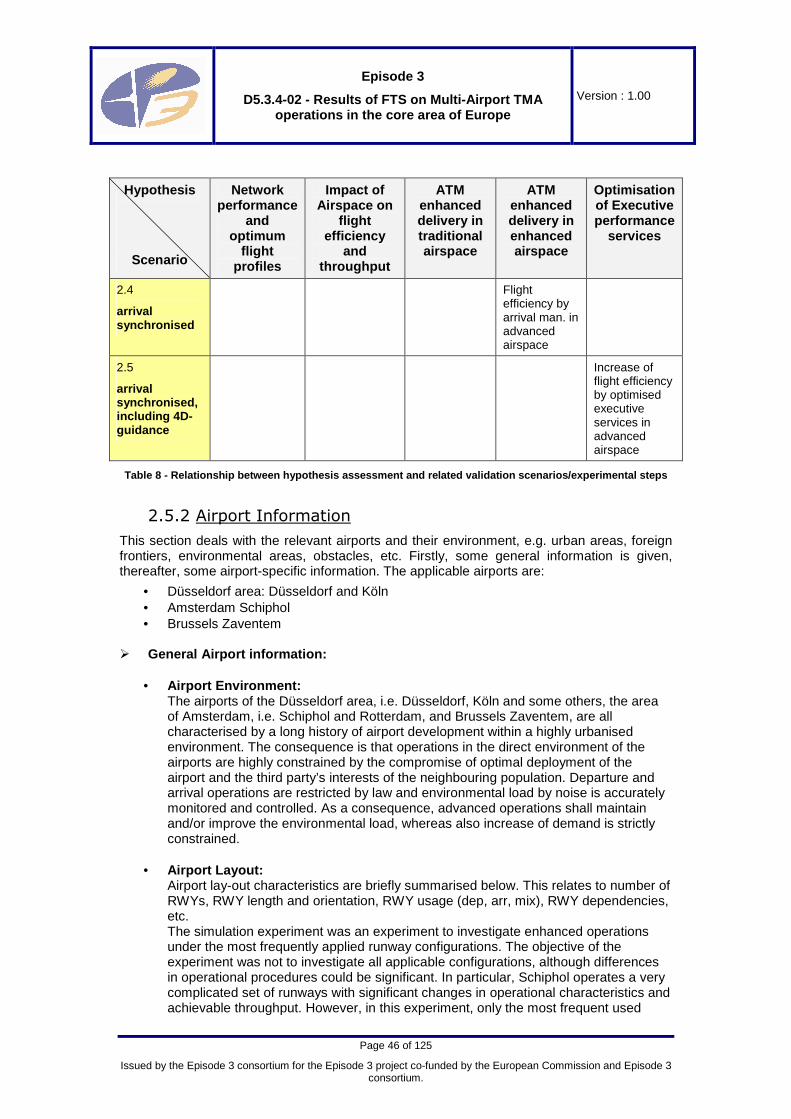
Episode 3
D5.3.4-02 - Results of FTS on Multi-Airport TMA operations in the core area of Europe
Version : 1.00
Page 46 of 125
Issued by the Episode 3 consortium for the Episode 3 project co-funded by the European Commission and Episode 3 consortium.
Hypothesis
Scenario
Network performance
and optimum
flight profiles
Impact of Airspace on
flight efficiency
and throughput
ATM enhanced delivery in traditional airspace
ATM enhanced delivery in enhanced airspace
Optimisation of Executive performance
services
2.4
arrival synchronised
Flight efficiency by arrival man. in advanced airspace
2.5
arrival synchronised, including 4D-guidance
Increase of flight efficiency by optimised executive services in advanced airspace
Table 8 - Relationship between hypothesis assessmen t and related validation scenarios/experimental ste ps
2.5.2 Airport Information
This section deals with the relevant airports and their environment, e.g. urban areas, foreign frontiers, environmental areas, obstacles, etc. Firstly, some general information is given, thereafter, some airport-specific information. The applicable airports are:
• Düsseldorf area: Düsseldorf and Köln • Amsterdam Schiphol • Brussels Zaventem
� General Airport information:
• Airport Environment: The airports of the Düsseldorf area, i.e. Düsseldorf, Köln and some others, the area of Amsterdam, i.e. Schiphol and Rotterdam, and Brussels Zaventem, are all characterised by a long history of airport development within a highly urbanised environment. The consequence is that operations in the direct environment of the airports are highly constrained by the compromise of optimal deployment of the airport and the third party’s interests of the neighbouring population. Departure and arrival operations are restricted by law and environmental load by noise is accurately monitored and controlled. As a consequence, advanced operations shall maintain and/or improve the environmental load, whereas also increase of demand is strictly constrained.
• Airport Layout:
Airport lay-out characteristics are briefly summarised below. This relates to number of RWYs, RWY length and orientation, RWY usage (dep, arr, mix), RWY dependencies, etc. The simulation experiment was an experiment to investigate enhanced operations under the most frequently applied runway configurations. The objective of the experiment was not to investigate all applicable configurations, although differences in operational procedures could be significant. In particular, Schiphol operates a very complicated set of runways with significant changes in operational characteristics and achievable throughput. However, in this experiment, only the most frequent used
Episode 3
D5.3.4-02 - Results of FTS on Multi-Airport TMA operations in the core area of Europe
Version : 1.00
Page 47 of 125
Issued by the Episode 3 consortium for the Episode 3 project co-funded by the European Commission and Episode 3 consortium.
configuration (18R and 18C) was simulated with the maximum achievable throughput for this airport.
• Airport Technologies: The runways on all airports of interests are equipped with ILSs and no advanced procedures on Final Approach were applicable. Advanced technology and CNS systems at airport level were irrelevant for that reason.
• Airport characteristics: The experiment was an en-route to runway experiment. The interest in airport characteristics was restricted therefore to operational characteristics and runway configurations available. No attention was spent on local facilities and ground movement operations.
� Düsseldorf area (Düsseldorf - EDDL):
• Airport Layout - EDDL (See Figure 8): o The airport was operated in the simulations with the preferred runway
configuration 23L/23R, departures RWY 23L, inbounds both from 23L and 23R4. Runway 23L was operated in mixed-mode, 23R in segregated mode.
o The operations are capacity restricted according to capacity agreements by law rather than physical runway capacity. Therefore, the runways are operating far below their physical maximum capacity.
o The climb and descend profiles are restricted due to noise abatement regulations. SIDs are applicable, and in the arrival phase, flights will follow CDAs that are in agreement with present-day, 2009, procedures for the last segments.
• Airport characteristics - EDDL:
o Total number of movements per year: 215.000 at present, 2008, growing possibly to 270.000, provided 8 hours of limited operation at present will increase to an hourly capacity of 45-47 mov. as well.
o The applicable RWY configuration in the reference organisation is 23L/23R, (see inbounds, present-day operations, 2008, Figure 8).
o The sustainable capacity of DUS International airport can go up to 60 mov/hour peak capacity.
o Düsseldorf airport operates within strict limitations regulated by court. The permissible operating characteristics seem to be stable for the next years. As the airport is a fully coordinated one, till the end of 2005 a total 40-42 aircraft were coordinated per hour with an increase to 45-47 aircraft per hour starting in 2006, thus leading nowadays to a traffic volume of up to 55-58 aircraft per hour depending on daily delay situation. These traffic figures are valid for 8 hours a day between 06:00 and 22:00 hours. In the remaining 8 hours at present, 2008, 40 coordinated movements are allowed. (These 8 hours will have single runway operations only, the additional 8 hours with increased traffic will be allowed to operate on both runways. In addition there are reduced operations (33 mov/h) up to 23:00, single runway operation.)
4 It should be noticed that preferred RWY operations maybe simplified in the simulations to evaluate easier the effects of CDA operations and enhanced guidance on arrival operations. This is accomplished by separating departures and arrivals as much as possible.

Episode 3
D5.3.4-02 - Results of FTS on Multi-Airport TMA operations in the core area of Europe
Version : 1.00
Page 48 of 125
Issued by the Episode 3 consortium for the Episode 3 project co-funded by the European Commission and Episode 3 consortium.
Figure 8 - Present-day approach procedures for Düss eldorf (EDDL) (Source: DFS)
� Düsseldorf area (Köln - EDDK):
• Airport Layout - EDDK (see runway 24, Figure 9): o The airport was operated in the simulations by flying departure/arrival
procedures on runway 14 and 24, 60% of all air traffic is for RWY 14, 40% is RWY 24. The inbounds were mainly operated from 24..
o The runways are operated in mixed mode. o Vectored arrival procedures are applicable in the reference scenarios, more
direct CDAs in the advanced scenarios. The same TMA entry-points were applicable for both scenarios.
• Airport characteristics - EDDK:
o The total amount of mov/year is 153.000 at present, 2008. o The airport operates with two runways: 14 and 24. (See inbounds on 24,
present-day and future operations, Figure 9).

Episode 3
D5.3.4-02 - Results of FTS on Multi-Airport TMA operations in the core area of Europe
Version : 1.00
Page 49 of 125
Issued by the Episode 3 consortium for the Episode 3 project co-funded by the European Commission and Episode 3 consortium.
Figure 9 - Advanced approach procedures for Köln (E DDK) (Source: DFS)
� Amsterdam area (Schiphol - EHAM):
• Airport layout - EHAM: o Runways are operated in segregated mode. 18R and 18C are used for arrival
traffic, 24 and 18L are used for departures. o There are dependencies in case of overshoots between 18R, 18C and 24. o Other runway configurations were ignored in the simulation experiment, and
this relates to the associated capacity changes as well as the usual configuration changes over the day.
o There are strict noise regulations applicable for each runway for arriving as well as departing traffic. The applicable profiles (possibly in CDA-applicable versions) were simulated and all noise abatement agreements were respected as good as possible in both types of scenarios: traditional and advanced airspace organisation.
• Airport characteristics - EHAM:
o Total number of movements per year: 450.000 at present, 2008, growing to 480.000 mov/year in 2010, and with a growth capacity of roughly 600.000 mov/year for the long term.
o The maximum hourly capacity is at present 108 mov/hour sustainable capacity under nominal weather conditions. The maximum hourly capacity can increase to 120 mov/hour if operations with 2x2 runways will be applied for the major part of the operations. 2x2 runway configurations can be applicable for North-bound as well as South-bound operations.
o The experiment focused on the most frequently applicable configuration, operating inbounds on 18C and 18R and outbounds on 24 and 18L, all operated in segregated mode.
� Brussels (Zaventem – EBBR):
• Airport layout - EBBR: o The only airport fully simulated in addition to Schiphol and the Düsseldorf
area was Brussels Zaventem because the arriving flows are showing critical
Episode 3
D5.3.4-02 - Results of FTS on Multi-Airport TMA operations in the core area of Europe
Version : 1.00
Page 50 of 125
Issued by the Episode 3 consortium for the Episode 3 project co-funded by the European Commission and Episode 3 consortium.
interference with Schiphol and Düsseldorf area arrival operations through CDAs. The airport was operated with a default west-wind scenario.
o The airport operates with three runways, two being (almost) parallel independent runways, separated ~1.5 km, The most frequent configuration is applicable to the simulations: Departures from 25R and Arrivals on 25L.
o Inbounds are operated by three flows over KERKY (West of Brussels), XANT/ANTWE (North of Brussels), and FLO/FLORA (East of Brussels).
• Airport characteristics – EBBR: o Total number of movement per year in 2008: 259.000 in 2008 (255.000 in
2006). o The airport operates more than 80% passenger flights, remaining flights are:
cargo, general aviation and some military flights. o The airport characteristics of Brussels EBBR are derived from the Baseline
scenario of SESAR Definition Phase, Ref. [1] and their web-site.
� Other Airports of interest:
• Regional airports in the Netherlands, • Regional airports in Germany, • Regional airports in Belgian and Luxembourg, and • Airports and airport areas at the boundaries of part of the core area of interest:
London Area, Paris area and Frankfurt area.
2.5.3 Airspace Information
This section provides information on vertical and lateral boundaries, prohibited/ restricted/segregated areas, sectorisation as well as other possible airspace restrictions. Thereafter, airspace usage and procedures through TMA and ETMA airspace are discussed.
Airspace Characteristics The airspace in the area of interest is characterised at present by large airports operating in the neighbourhood of national boundaries. Heavily constrained procedures are applied to operate the airports while respecting the national boundary conditions with negative effects on capacity and flight efficiency.
The advanced airspace organisation aimed to provide an airspace environment in which advanced ATM as described by SESAR can be applied in a beneficial way. The assumption was that these benefits are not achievable when operating in the present-day constrained airspace environment. The most important change is that generic airspace volumes are defined for each major flow of arriving traffic in the area, and that other operations such as operations for regional airports and the Military are adapted in one way or another in order to respect undisturbed arrival procedures as much as possible.
Therefore, the advanced airspace organisation expresses the requirements of hub airport operations in this area in the case that no further restrictions are applicable and that hub airports are allowed to specify their preferred departure/arrival procedures taking into account only each others interest.
All present-day applicable routings were adapted to follow flight efficient flight profiles towards the destination airport. Prohibited areas and restrictions were ignored, and the same for sector boundaries. No regulations were applicable to force flights to follow sub-optimal flight profiles.
Episode 3
D5.3.4-02 - Results of FTS on Multi-Airport TMA operations in the core area of Europe
Version : 1.00
Page 51 of 125
Issued by the Episode 3 consortium for the Episode 3 project co-funded by the European Commission and Episode 3 consortium.
Flights were entering TMAs by most efficient and/or shortest routings; prohibited areas were available for civil use and no area were closed.
TMA Procedures Now, routes / arrivals / approach procedures / departures / holdings information and conflicting points are described.
The experiment runs scenarios with two types of airspace organisation:
• Traditional airspace organisation, applying present-day, 2008, applicable procedures, using present-day route structures and using present-day sectorisation.
• Advanced airspace organisation , applying advanced procedures, using an extension on and modifications of present-day route structures and using a sectorisation adapted to use of “Dedicated Arrival Flow Corridors ”.
The experiment had a focus on the Düsseldorf area (EDDL, EDDK and EDLW) and Amsterdam Schiphol (EHAM). There was an interest therefore in detailed airspace characteristics for applicable TMAs, servicing those airports, and ETMA characteristics (routings and procedures) for those traffic flows servicing these TMAs. In addition, there was a limited interest in how to accommodate traffic flows in ETMA airspace for all traffic to and from other airports in the area, such as in particular to and from Brussels airport, and its specific arrival procedures.
The TMAs of interest are:
• The TMA of the Düsseldorf area (feeding EDDL, EDDK and EDLW): o Two airports were simulated and measured: EDDL and EDDK. o The lay-out of those parts of this TMA, feeding the airports EDDL and EDDK,
are given in Figure 8 and Figure 9. o EDDL was operated with 2 runways (23R/23L), fed from 4 TMA entry-
points/IAFs: � ARKON FL 170 � DOMUX FL 140 � KUBIM FL 150 � LIMA -
o EDDK was operated with 1 runway (24), fed from 3 TMA entry-points/IAFs: � KOPAG FL 80-120 � GULKO FL 100-140 � NOR FL120
o EDLW: unspecified, no advanced CDAs were applicable for this airport. o The traditional scenario simulated approach procedures by levelling off,
giving vectors on downwind. o The advanced scenario simulated CDA procedures by curved approach
procedures.
• The TMA of Amsterdam (feeding Schiphol, EHAM): o Schiphol plans to operate in the future 2x2 runway configurations. Two
arrival, two departure runways with dedicated arrival and departure flows. The most frequently used configuration was applicable to the experiment (see Figure 10, left-side picture).
o Schiphol will operate in the future with four TMA-entry points, the TMA entry-point at the TMA South-East side is new. This new TMA-entry-point requires also a new en-route flow to allow South-East inbound traffic to descend, to be sequenced and metered towards this TMA entry-point.

Episode 3
D5.3.4-02 - Results of FTS on Multi-Airport TMA operations in the core area of Europe
Version : 1.00
Page 52 of 125
Issued by the Episode 3 consortium for the Episode 3 project co-funded by the European Commission and Episode 3 consortium.
o Each runway is fed by two TMA-entry-points. Traffic is sequenced accurately with ~30 s. precision when passing this entry-point.
o CDAs were applicable for all descending traffic after passing the IAF by issuing a CDA clearance, applying 4D-guidance or otherwise manually controlled. The clearance was applicable when the merging conditions were fulfilled. If necessary, traffic could be guided by a two-step CDA descent clearance to FAF. The first CDA clearance was to reach the merging point of two flows, the second CDA clearance was given after successful merging on the cross-wind leg.
o To ensure high flight efficiency and large stability, 4D-guided flights were made independent of each other by approaching each entry-point in a staggered way, separated sufficiently to be independent of its predecessor flight. After merging, at low altitude below 4000 ft and above populated areas there was one merged flow of traffic left over only.
o Above populated areas and at low altitude, CDAs and optimal noise-friendly profiles were not compromised, except to accommodate optimised noise-friendly departure operations. At higher altitude CDA profiles were the most optimal to realise, but compromises were acceptable to accommodate all traffic flows in the best structural way, achieving strategic de-confliction of traffic.
o The CDA arrival flows in the advanced scenario were approaching the SPL parallel runway configuration simultaneously. Because CDAs were not allowed to apply vertical separation, other ways had to be applied to separate these flows. The East-bound arrival flow proceeded further North and was separated horizontally from the West-bound flow. In addition, the flows followed different glide slopes: the East-bound flow applied 3.5 deg., the West-bound flow 3 deg.
o East-bound and West-bound traffic is not in balance in principle. Therefore, RWY assignment had to take into account the required balance. Present traffic demand is divided in 42% West-bound traffic and 58% East-bound. To accomplish balanced demand the Southern traffic had to be assigned to the appropriate runway and had to follow STARs to guide them to the designated runway, linked to the designated TMA entry-point, i.e. Tiel or River. RWY assignment was accomplished around 150 to 200 NM out at the same time to establish the sequencing.
o Departure flows were guided in a structured way as much as possible over arrival flows. However, it was anticipated that flights had to be split in flows that had to be guided partially under CDA arrival flows, partially above. Because this could have strong negative effects on fuel efficiency, emissions and noise, this had to be monitored carefully and had to be measured.

Episode 3
D5.3.4-02 - Results of FTS on Multi-Airport TMA operations in the core area of Europe
Version : 1.00
Page 53 of 125
Issued by the Episode 3 consortium for the Episode 3 project co-funded by the European Commission and Episode 3 consortium.
Figure 10 - Advanced procedures for Schiphol TMA op erations
ETMA procedures
ETMA traffic flows are addressing:
• ETMA “Dedicated Arrival Flow Corridors” : Different from today, 2009, long stretched dedicated arrival corridors, i.e. dedicated tunnels in the sky to accommodate arrival flows, were assumed that allow providing ATM service provision to arrival flows for hub airports with maximum efficiency, following continuous descent profiles, while metering and sequencing was applied using RNAV techniques. Because benefits due to operations by appropriately dimensioned departure and arrival sectors could be measured only when the airports of interest were serviced in all directions and when arrival management was performed on the joint flows of traffic for each airport of interest, the ETMA arrival airspace volumes were created in all directions for the airports of interest. These airspace volumes cannot be associated with traditional sectors because they are occupying too much airspace with a too complex interdependent structure. These volumes have to be considered therefore as airspace volumes that are controlled by different controllers, possibly belonging to different organisations and coordinating with each other in other to achieve their ATM objectives. Typically, these volumes will stretch out up to deep into en-route airspace. The arrival flows of air traffic using these volumes of airspace were intercepting these arrival flow corridors at the most suitable points, keeping their flight profile as flight efficient as possible. After interception of the arrival flow corridor, each flight descended using a calculated and assigned RNAV track. Very high altitude flights were descending from their TOD to intercept the start of the dedicated arrival corridor as appropriate. The airspace volumes of these flow corridors had to be monitored and measured in order to assess workload associated with management of dense arrival flows following CDA-like procedures whilst being sequenced at the same time. An intertwined collection of arrival flow corridors for all hub airport operations in the area spanned the airspace available, leaving as much remaining airspace to other users, such as departure traffic, regional airport flows and Military operations. The dedicated

Episode 3
D5.3.4-02 - Results of FTS on Multi-Airport TMA operations in the core area of Europe
Version : 1.00
Page 54 of 125
Issued by the Episode 3 consortium for the Episode 3 project co-funded by the European Commission and Episode 3 consortium.
arrival flow corridors were feeding the TMAs (see Figure 11). In this respect, there were two types of TMA entry-points:
o TMA entry-points, dedicated to one runway and feeding (part of) one arrival flow to one runway.
o TMA entry-points, feeding more than one runway and accommodating (parts of) arrival flows for several runways and possibly several airports.
• ETMA departure sectors: ETMA departure sectors had to accommodate departure flows from the hub airports in the area. The airports served were: EHAM, EDDL, EDDK and EBBR. These sectors/volumes of airspace had to be kept separated from the previously defined dedicated arrival flow corridors.
Figure 11 - Rough estimated design of airspace volu mes dedicated to service provision to arrival flows for the airports of interest in the area
2.5.4 Traffic Information
This section describes traffic demand and presently available scenarios. Some assumptions about the traffic or required adaptations are included.
There were several traffic demand scenarios that were candidate to be applied in the simulation experiment:
• Present-day traffic, traditional scenario (2008 traffic demand, confirmed by ANSP),

Episode 3
D5.3.4-02 - Results of FTS on Multi-Airport TMA operations in the core area of Europe
Version : 1.00
Page 55 of 125
Issued by the Episode 3 consortium for the Episode 3 project co-funded by the European Commission and Episode 3 consortium.
• Growth scenario , traditional forecast (2020 traffic demand, confirmed by ANSP’s growth expectations),
• Present-day traffic, STATFOR scenario by Episode 3 (2006 traffic demand, confirmed by EUROCONTROL as specified reference scenario of SESAR ),
• Growth scenario , STATFOR scenario by Episode 3 (2020 traffic demand, confirmed by EUROCONTROL as specified scenario of SESAR ).
Traditional scenarios The table below specifies the traditional scenarios, present-day, 2008, and growth scenario, 2020, with 6052 flight and increased linear by cloning to 8204 flights (+35% of air traffic of the 2008 scenario added). In detail: 887 flights (70% of air traffic) in level flight and not departing or landing in ED*, ET* EH* and EB* (4-letter ICAO Code) were added. To identify these flights, they are marked in the Excel sheet (see scenario files), Column "MV Type" = 2 and in the ACF File "O_" in front of the Call sign. Time offsets range from minimal 10 min to maximal 60 min, to follow the traffic characteristics. Flights marked with "A_," are departures or arrivals in ED* and ET*. An average of ~20% of air traffic has been added compared to 2008. Time offsets range minimal 10 min to maximal 30 min to follow the characteristics of traffic demand.
The table below lists German airports and their expected growth figures. Only flights are selected that have an impact on the Düsseldorf area and/or the BENELUX. Traffic through Belgian and the Netherlands are listed separately. It should be noted that EDLW has got 0% projected growth, its growth figures are comprised already in the figures for EDDL, because of the interconnection between EDDL and EDLW.
The total growth of traffic volumes of EHAM and EBBR is estimated at +40%, relative 2005. Based on experience of Germans Airport’s growth expectations, German air traffic to and from EBBR is assumed to increase with 10% and to and from EHAM to increase with 7%. Missing traffic to EHAM and EBBR has been added by cloning.
Table 9 - Summary of departure and arrival operatio ns in the reference scenario of simulated part of G erman airspace

Episode 3
D5.3.4-02 - Results of FTS on Multi-Airport TMA operations in the core area of Europe
Version : 1.00
Page 56 of 125
Issued by the Episode 3 consortium for the Episode 3 project co-funded by the European Commission and Episode 3 consortium.
Advanced SESAR scenarios
The traffic scenarios of SESAR are obtained in a fully different way, received from data available in Episode 3 scenarios, received from EP3 WP2.4.1. Again, there is a “present-day” and an “advanced” growth scenario. The present-day scenario represents 2006 air traffic, the growth scenario represents 2020 traffic. The core area traffic is selected from ECAC-wide traffic scenarios, simulated under different conditions of applying SESAR enhanced operational concepts. The difference is that the traffic conditions around TOD have to be different in order to reflect advanced DCB conditions. In the advanced scenarios there is more stability of demand then in the baseline scenarios.
Simulations with long-term advanced scenarios make sense only if the conditions are fulfilled to play their role in the validation process. The basic requirements are:
• There is balance between demand and capacity within the simulated airspace/airport environment. Airports are able to accommodate the traffic through acceptable use of available runway capacity and airspace can be dimensioned in such a way that traffic can be controlled by a control process which is supported by advanced automation support within the scope of the experimental set-up.
• There are scenarios available that allow processing DCB in a way that reflects appropriately the working of DCB mechanisms now and in the future. It is mandatory specifically that the variability of TOD conditions are managed in such a way as required by the advanced concept of arrival management validated by the current experiment.
• The scenarios of this experiment have to fulfil the need of an appropriate structuring as part of the required airspace design adaptation rules. (See section 2.5.3). In dense areas like the core area, air traffic has to be structured in clearly identified and manageable traffic flows.
Therefore, the use of STATFOR 2020 scenarios made sense only if there was support to generate the effects that are outside the scope of the present experiment, and if they represent air traffic in a way compliant with the experimental requirements. The STATFOR 2020 scenarios were used to assess balanced levels of air traffic demand for the airports of interest, using the traditional scenarios as reference scenarios for the experiment. The traditional scenarios were completed with traffic from the STATFOR 2020 scenarios in compliance with the assessed traffic levels.
2.5.5 Additional Information
Additional information relates to simulation conditions such as weather conditions, ATC information, on-board information and scenario assumptions.
The simulated scenarios are stable scenarios without wind, without disruption, without delays caused by external factors outside the scope of ATM operations. Therefore, the results are representing ATM performance under ideal conditions. The most important assumption on the quality of the scenarios is the requirement for flow stability at the start of the arrival management process, because this determines the performance of ATM as well as the airspace needed.
2.5.6 Equipment scenario requirements
This section specifies the scenario assumptions on specific equipment availability. The changes are described to equipment capability requirements, such as specifically 4D capabilities.

Episode 3
D5.3.4-02 - Results of FTS on Multi-Airport TMA operations in the core area of Europe
Version : 1.00
Page 57 of 125
Issued by the Episode 3 consortium for the Episode 3 project co-funded by the European Commission and Episode 3 consortium.
As discussed in the TMA Expert Group of EP3 WP5, mixed 4D-equipment levels will have an impact on workload and control in the executive phase in the first place. Assumed mixed levels of equipment require not only some changes in executive functionality of the guidance and control process, but will have also an impact on awareness and interoperable effort needed. These impacts have to be modelled carefully if the outcome of specific experimental sessions with mixed equipment levels is aiming to generate relevant and valid results.
Specific modelling is required to implement the impact of equipment differences, moreover this modelling has to be based on evaluated assessment results derived e.g. from Real-Time Simulation (RTS) experiments. No appropriate data was available on questions concerning the impact of for example 4D-guidance and control and data link services under mixed-equipage conditions in ETMA and TMA airspace. Therefore, the simulations were run with 100% equipment levels . The impact on the experiment, however, is modest because workload was addressed partially only with the objective to measure traffic flow behaviour rather than individual Controller workload.
2.6 EXERCISE TOOLS AND/OR PLATFORMS TO CONDUCT THE EXERCISE
This section describes the tools, techniques and/or platforms used by the experiment. References are provided as applicable.
Figure 12 - Example of network of interest to be an alysed with Network Analysis Model
The following models and tools were applicable to this performance assessment experiment:
• Network Analysis Model (NAM): There is a need to be able to judge the balance between air traffic demand in terms of scheduled air traffic flows from departure airport to destination airport through specified routings and the capacity provided in terms of declared capacities per airport and per airspace volume, i.e. a sector. Capacity deficiencies can be assessed by this model by accumulating delay in each node that will cause this delay.
An example of the network of interest is given for a present-day structuring of the network (see Figure 12). This tool is developed by NLR in support of research on network balancing. More information can be found in specific reports on ATM network

Episode 3
D5.3.4-02 - Results of FTS on Multi-Airport TMA operations in the core area of Europe
Version : 1.00
Page 58 of 125
Issued by the Episode 3 consortium for the Episode 3 project co-funded by the European Commission and Episode 3 consortium.
analysis, SESAR Performance assessment, Ref. [1] and [2], and NLR reporting on performance assessment of the ATM network of operations, Ref. [3] and [4].
• Optimising Air Traffic Flow and Capacity Management (ATFCM) and Refined Flow Management (RFM):
The SESAR concept identifies the need for optimum utilisation of network resources. Optimising the throughput through bottlenecks, in particular TMA and Airport nodes, offers a strategy to mitigate congestion and to achieve the efficiency objectives of the operational concept. There is a need in addition to adjust departure planning to meet optimised arrival slots for congested arrival flows. The benefits are assessed as reduced arrival sequencing delays.
A prototype module for ATFCM to achieve traffic synchronisation at pre-departure level was available to provide scenarios with low variability of traffic demand for the TMAs and airports of interest. A second module for RFM provides refinement of (part of) the planned departure traffic, which fits into the ideas of convergent layered planning to meet accurately precision departure times that will mitigate congestion problems of congested arrival flows.
• Total Airspace and Airport Modeller (TAAM ®):
TAAM© is the actual fast-time simulation facility that allows to simulate the large volumes of traffic according to a planned scheduling. Different planned schedules of different scenarios were simulated in fast-time. The outcome and analysis of TAAM© simulation results served to validate the performance of the DCB and traffic synchronisation processes, executed by simulated and emulated modules in this experiment.
TAAM© is widely used for assessment of airspace and airport performance behaviour. In this experiment, TAAM© was used to assess ATM performance at airspace level. No Airport operations and no ground movement operations were simulated. NLR has broad experience to use TAAM© to validate ATM performance under varying operational conditions, see global and airport fast-time simulations results in Gate-to-Gate, Ref. [5] and [6]. Also, in this experiment different FTS-sensitive effects were investigated:
o Optimising airspace routing, i.e. horizontal and vertical profiles,
o Optimising speed and descent profiles, i.e. simulating and emulating CDAs,
o Optimising planning of arrival sequences (mainly by emulation),
o Optimising flight executive processes such as applying PRNAV tracks, advanced conflict detection and minimised workload.
The experiment was planned to assess DCB by using NAM, ATFCM and RFM and to create in this way a DCB-balanced scenario. Processing this scenario with TAAM© would have produced the benefits results of DCB. Instead DCB is emulated in a simplified way, however, more realistic and more reliable results regarding DCB can be achieved yet by continuing this experiment at a later stage as intended.
2.7 LINKS TO OTHER VALIDATION EXERCISES
The relationships or dependencies are specified in this section between this and other Episode 3 planned validation exercises, i.e. internal stakeholders. It is indicated for which exercises the present results serve as input and which output from other exercises will be used as input.
Input :
Episode 3
D5.3.4-02 - Results of FTS on Multi-Airport TMA operations in the core area of Europe
Version : 1.00
Page 59 of 125
Issued by the Episode 3 consortium for the Episode 3 project co-funded by the European Commission and Episode 3 consortium.
• EP3 WP5.2.2, Validation Strategy : o The objective of this fast-time exercise was to validate that the ATM capability
of ETMA/TMA airspace in a multi hub-airport environment is sufficient to cope with increased demand in each airport, taking into account the forecast capacity of each of the airports, EP3 WP5 validation strategy, Ref. [22], and, in addition, that benefits are achievable by enhanced planning and airspace organisation.
• EP3 WP5.3.1, Expert Group on TMA; the expert group was expected to advise on critical aspects of operations in TMA and ETMA airspace:
o In TMA airspace, on stability and optimal separation of CDAs, o In TMA airspace, on safety related to exception handling for CDA operations
at parallel runways, o In TMA airspace on staggered approaches for CDAs in order to maximise
throughput, o In ETMA airspace on optimised sequencing in support of arrival flows for
several airports and runway, arriving over one IAF, o In ETMA airspace on minimised use of airspace while optimising efficiency
during synchronisation and sequencing.
• Description of the TMA related aspects of the SESAR Concept of Operations: o The concepts of operations are derived from the SESAR Con. Ops., Ref. [15]
and the DOD E5, Ref. [19].
• Assumptions and hypothesis necessary to run the Fas t Time Simulation exercises; see also the EP3 WP5.3.1, expert Group o n TMA and section 2.8:
o Each element of the fast-time simulation experiment is modelled based on knowledge derived from detailed simulation experiments and real-life experience. However, advanced conceptual elements are often not validated at a sufficient level of confidence to know exactly under which conditions the benefits are perceived, how many benefits are perceived and at which costs. Either, advanced conceptual elements are ignored, assuming that they have not a significant impact on the assessment issues raised, i.e. advanced planning can benefit arrival operation at hub airports executed within an appropriate organisation of airspace but without advanced executive support, or advanced conceptual elements are emulated, assuming that an inaccurate modelling by emulation will not influence performance assessment results in a significant way.
• From EP3 WP2.4.1, data needed for extrapolation to ECAC wide level: o The applicable scenarios for all experiments are defined by EP3 WP2.4.1. o These scenarios are balanced by assessment with a static model (FAP) to
ensure that traffic demand is roughly in balance with available capacity throughout the network.
o A dynamic network balancing process was previously foreseen, but not anymore, to be executed to assess balance in the Network at a more accurate level. This process can be compared with a long-term network balancing process to obtain a seasonal scheduling for all airspace users.
o More short-term network balancing and traffic synchronisation is applicable and needed to synchronise the traffic flows to and from the large airports in the area of interest at pre-departure level. This process can be compared with short-term traffic balancing, although all event-driven delays and incidental planning deviations are not yet incorporated in this planning process.
o All these steps at the level of DCB are necessary inputs to the experiment, because they contribute to deliver stable arrival traffic demand flows to the
Episode 3
D5.3.4-02 - Results of FTS on Multi-Airport TMA operations in the core area of Europe
Version : 1.00
Page 60 of 125
Issued by the Episode 3 consortium for the Episode 3 project co-funded by the European Commission and Episode 3 consortium.
airports of interest, prepared at pre-departure level. The result is the advanced scenario that contributes to deliver the expected benefits.
o There is no evidence anymore how to accomplish equivalent inputs, and scripting or emulation is probably the only applicable last resort solution.
Output :
• External, to stakeholders of ATM: Results shall be produced on the required quality of operations in ETMA/TMA airspace for a multi-hub airport environment. The expected outcome is an indicator that clarifies the potential of CDA operations for airports in the core area with sufficient capacity to accommodate the traffic demand expected by SESAR.
• To EP3 WP5.3.1, TMA Expert Group: The TMA Expert Group will use the results of the FTS experiment to assess the validity of earlier visions and to use results for their final report. In particular, the so-called “Story-board” is a condensed view on the results of discussions within the Expert Group, and this result can be compared with experimental experience. See also Annex B.1.
• To EP3 WP2.3, Validation Management: The Validation Management group will receive results and monitor progress on the preparation, execution and analysis of results of the experiment.
• EP3 WP2.4.4 (Environmental impact) has the objective to look into ECAC-wide effects on the environment. Although this experiment considers a limited number of airports and a limited area only, it still may give insight in beneficial effects of several OIs in the departure/arrival phase on environmental sustainability. The results of this experiment can be considered as specific additional information, see further document: ENV_Assessment_Input_Data_Requirements, Episode-3 environment assessment, Ref. [27].
In addition, existing expertise and knowledge is adopted from other projects, prototyping and validating advanced scenarios in the environment of Schiphol airport.
The OPTIMAL project has executed validation experiments on Advanced CDAs (ACDAs) in the environment of Schiphol. The OPTIMAL deliverables, Ref. [23], [24] and [25], are reporting on:
• Arrival Procedures: o The OPTIMAL project has accomplished fast-time and real-time simulation
experiments on CDA and ETMA/TMA approach procedures. The OPTIMAL project simulated a concept of CDA, supported by 4D planning in ETMA/TMA airspace, applying ASAS sequencing in TMA airspace.
• Airspace design: o The OPTIMAL project simulated CDA approaches partly in a present-day
environment, partly in a future or experimental environment. The TMA of Schiphol Airport was largely kept as operated at present, although a fourth TMA entry-point, South-East of Schiphol, was added. The approach paths were present-day lateral profiles, although adapted to CDA patterns.
o The ETMA airspace was applied in an unrestricted way, making use of airspace up to 120 NM out of the Airport. However, it was not the objective of the project to investigate in-depth the airspace needs, and therefore no airspace organisation requirements were derived from the OPTIMAL experiments.
• Safety and hazards: o The achievable spacing of arriving flights is critical for the success of flying
CDAs under high throughput conditions. The OPTIMAL project performed a safety assessment study analysing the stability of queues and the safely achievable separations at the start and at the end of a CDA. A general
Episode 3
D5.3.4-02 - Results of FTS on Multi-Airport TMA operations in the core area of Europe
Version : 1.00
Page 61 of 125
Issued by the Episode 3 consortium for the Episode 3 project co-funded by the European Commission and Episode 3 consortium.
summarising statement declared a safe minimum time-based separation at the initial CDA point of more than 60 seconds, see Optimal Stroeve, Ref. [23].
2.8 CONCEPT ASSUMPTIONS
This section describes the assumptions concerning the problem and concept to be analysed. Applicable assumptions were discussed and concluded by the EP3 WP5 Expert Group on TMA operations during their meetings. The guidelines for these discussions were series of questions on critical issues concerning the concept and the scenarios. The concluding assumptions are listed below, followed by a summary of series of questions and their replies. The ultimate result was a condensed view on a possible implementation of the concept within the applicable operational environment and how this would operate. This view was laid down in the so-called “Story-board” and this view was added to the experimental plan of this exercise Ref. [28] as annex 2.1. Finally, the issue of required low variability of demand at the start of the arrival management process was the most critical issue. The list of statements to support this assumption was added in the experimental Plan Ref. [28] as well as annex 2.2.
Part of the discussions in the Expert Group were devoted to the airborne-side operations of the concept, i.e. the interoperability of ground operations with airborne 4D planning, guidance and control capabilities, supported by advanced 4D FMS. Although the fast-time simulations with TAAM© are not well positioned to simulate airborne behaviour in full detail, the answers by Airbus are relevant to understand the possibilities and limitations of the role of airborne 4D FMS and precision navigation capabilities in operating advanced arrival management with support of 4D. The questions and answers were added in annex 2.3 of the Experimental Plan, Ref. [28].
The following assumptions are applicable on the operational concept and the implementation of the concept:
• Because noise-friendly approaches are mandatory for any increase of capacity, the gain in environmental benefits cannot be compromised, unless this is required to maintain the noise-friendly character of departure operations.
• Because efficiency of operations is a major driver for SESAR and because inefficiency of operations can hardly be solved better than before departure, the simulations of advanced scenarios depend on Demand and Capacity Balancing achieved before departure.
• Sequencing and spacing is assumed to start from 60 min. before landing (~200 NM out) in order to reach maximum efficiency of operations approximately. However, the precise measure of time/distance is dependent on local conditions as well; e.g. arrival management makes sense only if most of the traffic is airborne.
• Sequencing and high precision 4D-guidance leads to high precision arrivals over the TMA-entry points, allowing a high degree of CDAs (from 120 NM to TMA-entry-point) and full CDAs from 7000 ft (IAF) to touch-down This is applicable for example for Schiphol but local conditions may lead to other distance/altitude preferences.
• CDAs are applicable from 7000 ft, but that implies also the assumption to be able to apply CDAs for all traffic arriving at the airport. No alternative approach procedure can be accommodated.
• The CDAs are feasible due to an assumed high RNP capability of all traffic, however for reasons of realism different levels of RNP capabilities are accepted as well.
• The highly accurate planning of arrivals by CDAs is assumed to be realised by planning and control by time-based separations.
• A feasible implementation of a high-capacity arrival concept requires a highly systemised approach. It is assumed that highly accurate predictions are obtained by Air-Ground exchanges, sequencing by AMAN based on down-linked 3D unconstrained trajectories, continuous monitoring on 4D performance and interoperable planning, guidance and control.

Episode 3
D5.3.4-02 - Results of FTS on Multi-Airport TMA operations in the core area of Europe
Version : 1.00
Page 62 of 125
Issued by the Episode 3 consortium for the Episode 3 project co-funded by the European Commission and Episode 3 consortium.
• The automation is assumed to be highly interoperable and human centred.
Assumptions are applicable also on accomplishing feasible scenarios :
• The SESAR growth scenario (+70% of air traffic demand in the 2020 reference scenario, compared to the number of flights in the 2008 “Current” scenario) is deemed not possible in the area, therefore growth scenarios are limited to the acceptable growth estimates of the applicable airports in the area.
• The advanced scenarios are addressing a time horizon set by SESAR, but hard constraints such as airport growth figures are respected.
• The National boundaries are ignored, allowing the creation of ideal arrival sectors/airspace control volumes for the airports and TMAs of interest, but also assuming other traffic to be adaptable to these requirements.
• Stability of demand/capacity is assumed. This is assumed to be achievable by balancing capacity and by applying ATFCM on advanced scenarios, but otherwise the scenarios have to provide stability in a different way.
• The scenarios are respecting noise abatement regulations, because these regulations are enforced by law and these constraints will not vanish. Populated areas are to be considered as critical and persistent constraints.
• The scenarios shall address not only 100% equipage levels, but also mixed equipage levels in order to cope with sufficient realism5.
Several assumptions are applicable to performance assessment by this fast-time simulation experiment. The scenarios as well as the applicable models are simplified compared to reality. This leads to assumptions on approximations of performance measurements :
• Al flights in the scenarios are single independent flights without knowledge of any connectivity to other flights, such as deploying the same aircraft, the same crew, or transporting transfer passengers with implicit connectivity between flights. Therefore, no reactionary delays, no incidental delays and no company-induced delays are measured.
• The scheduling of future scenarios are obtained by “cloning”-techniques, i.e. by multiplying flights. Even after corrections, this is far inferior to the process applied by negotiations between ATM stakeholders to make up their scheduling of coming seasons. For that reason, pre-departure DCB delays have to be interpreted as delays to repair the scheduling. Nevertheless, the amount of delays is representative and indicative for the measure of saturation of the network or parts of the network.
• The obtainable benefits of the concept are dependent on accurate planning, achieved by information supply by Airlines in the first place. The benefits regarding efficiency, i.e. flight duration, fuel consumption and airspace requirements, are mainly dependent on departure ground holdings. It is assumed that all stakeholders are willing ultimately to maximise the achievable benefits by selecting a planning, optimised towards ATM efficiency and otherwise at least optimised towards their own most economic resources deployment criteria.
• The benefits achieved by optimised planning depend on execution as planned. It is assumed that departure management acts as an enabler and will allow high precision departures to congested arrivals with sufficient precision to reach the start of the arrival management process on-time.
• The modelling of executive services will be modelled according to expectations of achievable performance. It is assumed that this can be accomplished in a sufficient realistic way.
5 The simulations are conducted on 100% equipage levels only. See section 2.5.6 for justification.

Episode 3
D5.3.4-02 - Results of FTS on Multi-Airport TMA operations in the core area of Europe
Version : 1.00
Page 63 of 125
Issued by the Episode 3 consortium for the Episode 3 project co-funded by the European Commission and Episode 3 consortium.
A set of assumptions are derived from questions formulated to identify those topics that are critical to bring the operational concept successfully into operation. The questions and the most appropriate ways to address these topics, are identified below6.
1. How to approach the IAF in a structured way through a stretched arrival sector applying performance based navigation?
• Flight performance objectives are presented to the pilot and the aircraft’s FMS through arrival management and A-G data communication.
• The guidance and control loop performed by ATC/pilot are considered capable to achieve the CTA within a defined tolerance.
• The quality of navigation and the achievable accuracy in time is determined by aircraft navigational performance characteristics. The levels of navigation performance that are required, and possibly also achievable in 2020, are deferred to be determined by technical evaluation.
• An achievable quality factor of [+2,-3 min.] is assumed when aircraft enter the 60 min. (200NM) arrival management horizon.
• A typical quality factor of ± 30 sec at IAF is assumed to be required for issuing CDAs to tightly sequenced sequences of aircraft. It should be noticed, however, that advanced 4D-equipped aircraft will perform with better performance characteristics and will achieve a tolerance of ± 10s probably. This level of performance might be a requirement even in order to allow ATC to cope with that part of the fleet that is not yet fully equipped.
2. How to improve planning, guidance and control by A-G exchange of 4D-planning and use of FMS?
• 4D downlink prior to start of AMAN process is assumed, specifying a fully unconstrained arrival by nominal arrival procedure.
• An AMAN target time is agreed (the CTA) and the aircraft’s FMS follows the CTA, unless significant deviations occur. If the expected efficient Estimated Time of Arrival (ETA) differs above a threshold, a delta is normally down-linked and re-sequencing may be accomplished.
• Targets for IAF are defined, taking complexity and traffic volumes into account; a typical value of 2 min. between arrivals is applicable. However, these flights may arrive over different TMA entry-points, merging during descent inside the TMA.
• A procedure is assumed to start with 4D downlink, followed by uplink of a ground system constraint, resulting in an efficient CTA usage to ensure pre-sequencing on IAF.
3. How to deal with CDAs of dense flow over one IAF to one runway, merging with a second flow over a second IAF (converging flows )?
• Smooth merging is dependent amongst others on tight sequencing and applicable equipment levels. Dependent on equipment levels, the workload induced by the operations might be different. Therefore, time constraints need to be assumed in TAAM©, implying controller procedures and workload being differentiated according to applicable equipment levels.
6 It should be noted here that the list of assumptions are related to requirements of aircraft and ATC to perform the executive process in an operationally acceptable way. Most of the assumptions are reflected in the TAAM simulations by setting appropriate values for simulated or emulated processes. In general, the level of modelling of simulation of air traffic is too much simplified to address the requirements at the level of detailed modelling.

Episode 3
D5.3.4-02 - Results of FTS on Multi-Airport TMA operations in the core area of Europe
Version : 1.00
Page 64 of 125
Issued by the Episode 3 consortium for the Episode 3 project co-funded by the European Commission and Episode 3 consortium.
• In case of merging inside the TMA, CDAs are assumed to be split in two parts with the merge(s) to be accomplished under control of ATC.
• Different equipment levels are applicable in real-life and therefore also during simulation.
4. How to deal with CDAs of dense flow over one TMA entry-point diverging to several runways/airports (diverging flow )?
• Lateral separation is preferred if possible, second is time difference and third is level separation. However, if the distance to be flown from TMA entry-point to airport is significantly different for two flows, also the flights will enter the TMA at different altitudes, making a split of flows at vertical levels attractive.
5. How to ensure undisturbed departure operations during initial cli mb , while operating the airport(s) with several dense departure and CDA arrival flows?
• Departure constraints of today, 2009, are to be respected. • A departure and arrival route structure of “cones and tubes” is assumed to be
developed for 2020 scenario. • The preference is to guide departure flows over the arrival flows. Nevertheless, it is
anticipated that departure flows have to be split sometimes, respecting the CDA paths and keeping both flows separated at a structural level. Part of the departure flows may have to stay below the arrival flow.
6. How to service and to control non-4D equipped, 4D-equipped and mixed equipped traffic in ETMA and in TMA airspace (Mixed equipage and CDAs )?
• Figures for equipment level are to be determined in compliance with forecast estimates.
• Different spacing requirements are assumed for different equipment levels, resulting in capacity loss and increased ATC workload.
• FTS has to address workload increase resulting from e.g. 15% non 4D-equipped aircraft7.
7. How to cope with stacking as well as high precision sequencing on IAF?
• Holdings are not expected during normal operations, but may be a result of unexpected shortage of capacity in the tactical phase.
• It can be investigated which aircraft capabilities are applicable to support on-time operations for timely leaving of the holding pattern and to meet downstream time constraint.
• Holdings are assumed to be allocated sufficiently far from IAF to allow to accomplish a sequenced arrival flow over the IAF.
8. A flight deviating during CDA , extending the flight path, how to cope with deviations, which impact on the sequence and the capacity, and how to anticipate? And the same questions for flights aborting the CDA and rejoining the sequence later on? And the same question for overshoots , and how to re-join the sequence again?
• Deviating or non-compliant aircraft need to be re-inserted into the sequence; delay for others may be the inevitable result.
• Some headroom might be required to cope with frequently occurring deviations.
11. How to operate CDAs on parallel runways in a safe way?
7 Although advised to be included, the experiment could not address mixed-equipage levels, and traffic is assumed to be 100% equipped. See also section 2.5.6.

Episode 3
D5.3.4-02 - Results of FTS on Multi-Airport TMA operations in the core area of Europe
Version : 1.00
Page 65 of 125
Issued by the Episode 3 consortium for the Episode 3 project co-funded by the European Commission and Episode 3 consortium.
• RNP will bring high precision navigation. • Approach paths could provide slowly converging tracks, avoiding head-on conditions. • Monitoring/responsibility can be provided by the flight-deck (CDTI).

Episode 3
D5.3.4-02 - Results of FTS on Multi-Airport TMA operations in the core area of Europe
Version : 1.00
Page 66 of 125
Issued by the Episode 3 consortium for the Episode 3 project co-funded by the European Commission and Episode 3 consortium.
3 CONDUCT OF THE VALIDATION EXERCISE RUNS
3.1 EXPERIMENT PREPARATION
3.1.1 Simulation runs
Fast-time experiments are conducted by sets of experimental runs, performed often in an iterative way. Most important was to start from a traditional scenario with present-day levels of traffic and to add new elements in the scenarios step-by-step. The following experimental runs were planned to be executed, all simulating a core area scenario, including at least traffic to and from the Düsseldorf area, the airport of Amsterdam, Schiphol and Brussels airport, Zaventem:
1. Simulation of baseline scenarios with 2008 and 2020 levels of air traffic demand (Present-day airspace organisation, present-day routing and procedures and present-day concept of operations). These scenarios served as reference scenarios to compare with more advanced scenarios and to allow assessment of benefits.
2. Simulation of advanced airspace scenarios with 2008 and 2020 levels of air traffic demand (Extended arrival sectors/dedicated volumes of airspace to allow continuous descent procedures, however planning and control are still organised in a traditional way, missing 4D planning, guidance and control precision and missing advanced AMAN support and Air-Ground data link exchanges.) These scenarios were used to evaluate airspace usage, feasibility to separate arrival flows from other traffic (except the military), and to get first results on benefits due to stretched arrival procedures, not yet optimised towards minimised sequencing delays.
3. Simulation of scenarios including modelling of advanced operational elements of SESAR. DCB was modelled by emulation of enhanced pre-departure planning8 and also advanced arrival management was emulated.
3.1.2 Data collection methods
The fast-time experiment made use of TAAM®, Total Airport and Airspace Modeller. TAAM© uses airspace and airport environment description data and a time table as input, comprising the scheduling of air traffic. Experimental runs are compared by varying these input data and comparing the differences in generated output data. For example, the time tables can be modified by off-line calculating pre-departure time constraints, and comparing the effects of these time constraints on the simulation of air traffic and measuring their performance.
TAAM© will record all significant events in principle, and the analysis takes place by filtering the relevant events. In addition, several post-processing runs will be applied to calculate summary results and derived results. For example, average delays are calculated over each run and collected in tables; also derived quantities are processed off-line such as workload, derived from conflict counts.
8 It should be noted that scenarios including appropriate application of DCB to ensure sufficient low variability of traffic demand, are obtained by simulating on-time departures. However, this relates to only a small part of the anticipated DCB process, not yet known in full detail.
Episode 3
D5.3.4-02 - Results of FTS on Multi-Airport TMA operations in the core area of Europe
Version : 1.00
Page 67 of 125
Issued by the Episode 3 consortium for the Episode 3 project co-funded by the European Commission and Episode 3 consortium.
3.1.3 Operational and statistical significance
This section describes the likely operational and statistical significance levels of the experiment, with an explanation of the reasons why these levels were chosen.
All experimental runs were performed on scenarios representing 24 hours of traffic. The selected baseline sample is a normal sample, derived from a representative day operated under nominal conditions. The variations in operational conditions were assumed to be fully included in this one-example traffic sample, because it represents all periods of the day, including nightly hours, peak hours and more relaxed periods of the day. In addition, the traffic was evaluated for four airports, each operating its specific procedures within a specific airspace context of operations.
From the point of view of relevance, the weakest points were the simplifications in operations and simplifications in modelling. Operations are simplified because flights are following a pre-defined adherence to the scheduling and no exception handling cases will occur. Also, no deviations will occur that stem from a systematic delaying nature of ATM evolvement. For example, PRR reports are showing systematic increase of delays over the day, caused by knock-on effects and by connectivity of the planning of flights. This connectivity is ignored.
Another weak point is the modelling of ground and airborne behaviour. Fast-time simulations derive their force from processing large volumes of flights and producing high statistics. On the other hand the applied modelling is relatively simple. Therefore, the confidence level of fast-time simulations relies on simulating a very large number of events occurring under slightly different circumstances, but the relevance of each event is determined by the modelling of the detection mechanism and the experience leading to the selected modelling.
The modelling is sometimes strongly simplified, such as e.g. the modelling of the aircraft. This implies that fast-time simulations with tools like TAAM© are not appropriate to validate dynamic flight behaviour and human behaviour, but rather to collect statistical relevant data from a relatively large scope of simulation.
In summary:
• Fast-time simulation takes place over 4 airports, giving large variation in operational context.
• Fast-time simulation takes place over 24 hours giving large variation in traffic density conditions.
• Fast-time simulation takes place using present-day traffic (2008: busy, but very well feasible) and very dense traffic situations (2015/2020: at saturation level of the applicable airports).
• Processing more than one day of traffic will not overcome the problems of modelling simplifications and lack of non-nominal behaviour in the scenarios.
• Statistical significance comes from the number of flights processed during one day of operations and the number of events that take place under slightly varying conditions.
3.1.4 Data logging requirements
Each experimental run was identified by the applicable scenario and its associated description of airport and airspace environment, and in addition, by its time table (scheduling) and year of reference. Altogether there were 16 runs, derived from two original time tables (2008 and 2020).
Data logging took place per flight, per airport/runway of interest, per sector or volume of airspace of interest. Several quantities of interest were determined only afterwards by post-

Episode 3
D5.3.4-02 - Results of FTS on Multi-Airport TMA operations in the core area of Europe
Version : 1.00
Page 68 of 125
Issued by the Episode 3 consortium for the Episode 3 project co-funded by the European Commission and Episode 3 consortium.
processing. A standardised procedure was followed to produce the relevant data, achieved by direct logging as well as by post-processing.
For each experimental run the following data is collected:
• Average delay overview of each element of delay of flows and traffic of interest,
• Average fuel, number of passengers (pax.nr.) and flight duration of flows and air traffic of interest,
• The performance per airport/runway of interest in terms of delay and throughput over the day,
• Average performance of sectors/volumes of airspace over the day,
• The performance per sector/airspace volume of interest in terms of delay and throughput over the day,
• The performance per sector/airspace volume of interest in terms of number of required controller activities and throughput over the day, and
• Flight plan and actual performance of flight per individual flight, including data concerning flight delaying events.
3.1.5 Summary
The planned simulation steps are summarised and presented in Table 10.
The experiment was planned to be executed by incremental steps, including iterations. The resulting achievements were consolidated as a set of end-state simulation results for each year. These end-states permitted to assess intermediate results and to assess the quality of results by comparing different steps with each other.
The Baseline runs were executed on traditional airspace organisation, i.e. including vectoring, the advanced runs on advanced airspace organisation, based on performance of CDAs. Both sets of runs were executed with and without the SESAR OIs to improve the performance; see Table 10. Further two scenarios were simulated: Current flow, 2008, and Future flow, 2020.
Current (2008) Future (2020, +50% added traffic)
Scenario: Baseline
(vectoring)
CDAs
(from TOD,
ACDA in TMA)
Baseline
(vectoring
CDAs
(from TOD,
ACDA in TMA)
Unconstrained ideal profiles
ideal Ideal
Operational realistic
(separation ensured)
Today penalised very busy penalised
DCB emulated
(on-time at 200NM out)
improved improved
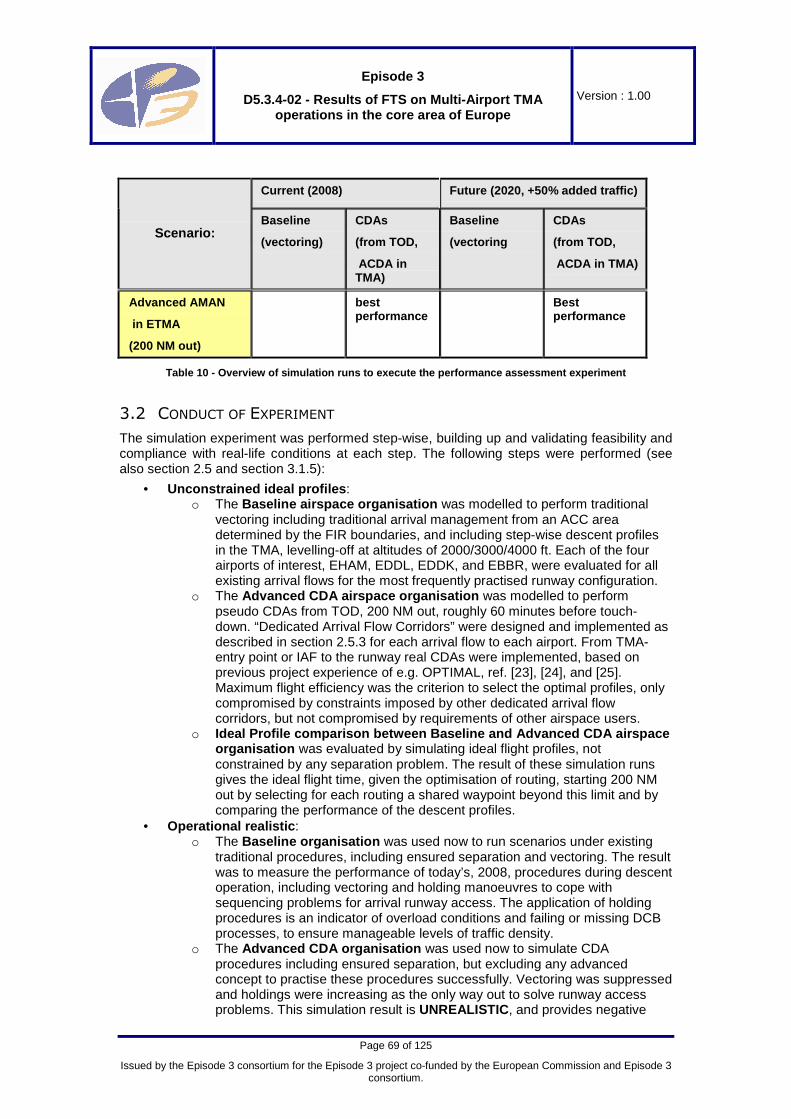
Episode 3
D5.3.4-02 - Results of FTS on Multi-Airport TMA operations in the core area of Europe
Version : 1.00
Page 69 of 125
Issued by the Episode 3 consortium for the Episode 3 project co-funded by the European Commission and Episode 3 consortium.
Current (2008) Future (2020, +50% added traffic)
Scenario: Baseline
(vectoring)
CDAs
(from TOD,
ACDA in TMA)
Baseline
(vectoring
CDAs
(from TOD,
ACDA in TMA)
Advanced AMAN
in ETMA
(200 NM out)
best performance
Best performance
Table 10 - Overview of simulation runs to execute t he performance assessment experiment
3.2 CONDUCT OF EXPERIMENT
The simulation experiment was performed step-wise, building up and validating feasibility and compliance with real-life conditions at each step. The following steps were performed (see also section 2.5 and section 3.1.5):
• Unconstrained ideal profiles : o The Baseline airspace organisation was modelled to perform traditional
vectoring including traditional arrival management from an ACC area determined by the FIR boundaries, and including step-wise descent profiles in the TMA, levelling-off at altitudes of 2000/3000/4000 ft. Each of the four airports of interest, EHAM, EDDL, EDDK, and EBBR, were evaluated for all existing arrival flows for the most frequently practised runway configuration.
o The Advanced CDA airspace organisation was modelled to perform pseudo CDAs from TOD, 200 NM out, roughly 60 minutes before touch-down. “Dedicated Arrival Flow Corridors” were designed and implemented as described in section 2.5.3 for each arrival flow to each airport. From TMA-entry point or IAF to the runway real CDAs were implemented, based on previous project experience of e.g. OPTIMAL, ref. [23], [24], and [25]. Maximum flight efficiency was the criterion to select the optimal profiles, only compromised by constraints imposed by other dedicated arrival flow corridors, but not compromised by requirements of other airspace users.
o Ideal Profile comparison between Baseline and Advanced CDA airspa ce organisation was evaluated by simulating ideal flight profiles, not constrained by any separation problem. The result of these simulation runs gives the ideal flight time, given the optimisation of routing, starting 200 NM out by selecting for each routing a shared waypoint beyond this limit and by comparing the performance of the descent profiles.
• Operational realistic : o The Baseline organisation was used now to run scenarios under existing
traditional procedures, including ensured separation and vectoring. The result was to measure the performance of today’s, 2008, procedures during descent operation, including vectoring and holding manoeuvres to cope with sequencing problems for arrival runway access. The application of holding procedures is an indicator of overload conditions and failing or missing DCB processes, to ensure manageable levels of traffic density.
o The Advanced CDA organisation was used now to simulate CDA procedures including ensured separation, but excluding any advanced concept to practise these procedures successfully. Vectoring was suppressed and holdings were increasing as the only way out to solve runway access problems. This simulation result is UNREALISTIC , and provides negative

Episode 3
D5.3.4-02 - Results of FTS on Multi-Airport TMA operations in the core area of Europe
Version : 1.00
Page 70 of 125
Issued by the Episode 3 consortium for the Episode 3 project co-funded by the European Commission and Episode 3 consortium.
benefits due to the penalties imposed by enforced procedures. Its significance is to identify those penalties that are significant and that have to be removed by the beneficial effects of advanced concepts of SESAR.
o Operational Realistic comparison of Baseline and Ad vanced CDA organisation provided an overview of where and when the problems occurred and to which extent. The assessment addressed the performance of each of the four airports.
• DCB emulated : o As expected, performance problems in the arrival phase were concerning
flight efficiency problems in the first place. Available capacity was limited by runway throughput and dense traffic scenarios could be used to assess throughput limitations. However, flight inefficiency can be related to planning, extending even to the pre-departure planning phase. See for example, the assumptions, section 2.8. The ideal modelling in FTS experiments is in this case to filter a regional or local context of operations from a larger, e.g. ECAC-wide sample, and to consider DCB in an ECAC-wide context. Because no realistic modelling of ECAC-wide scenarios and DCB processes could be used, unfortunately, an oversimplified modelling was applied. Departure constraints were imposed as required, in seconds precise, with only one restriction, i.e. not to exceed the limit of 10 minutes imposed delay, compared to the ideal scheduled departure time. The result was that current scenarios, i.e. 2008, were simulated with success, but that more dense scenarios were less successful in achieving the aimed improvement in performance. This could be recognised and interpreted as flow saturation problems. These problems could not be solved by missing appropriate scenarios to reach balanced demand, balanced scheduling and balanced use of available capacity.
o DCB was applied on the Baseline organisation to solve a significant part of the delays, identified as extensions on the ideal duration of flight descent profiles. Precision departures forced flights to arrive at FIR boundary in a more favourable position to be sequenced for Final Approach. Arrival sequencing was linked to an appropriate designated waypoint on these boundary conditions.
o DCB was applied on the Advanced CDA organisation to solve the more serious unsolved problem of forced holdings enabling the advanced CDAs. A highly accurate DCB process, based on 4D trajectory management must be considered as almost mandatory to practise TOD CDA procedures on high density flows without severe penalties. The amount of penalty reduction was assessed, and pre-departure planned high precision departures forced flights to arrive at TOD in a more favourable position to be sequenced for separation over an IAF Metering Fix. The sequencing process started 200 NM out at a designated “ETMA” boundary condition, whilst the sequencing at IAF was forced by suppressing vectoring as well as holding beyond these waypoints.
o Comparison of DCB on Baseline and Advanced CDA orga nisation was used to evaluate the role of DCB in future concepts as well as in providing the benefits expected by SESAR.
• Arrival synchronised : o The DCB process had controlled the variability of traffic arriving at the start of
the arrival sequencing process, and in addition, to a limited, partially realistic and incomplete extent only. Further, there was no control to prioritise departures selectively, and no sequencing was applied yet. Also En-route support to arrive on-time is missing. Nevertheless, the result offers an improved situation to initiate arrival sequencing.
o The planned next step was to improve the results by adding emulation of advanced arrival management. Arrival sequencing was based on available

Episode 3
D5.3.4-02 - Results of FTS on Multi-Airport TMA operations in the core area of Europe
Version : 1.00
Page 71 of 125
Issued by the Episode 3 consortium for the Episode 3 project co-funded by the European Commission and Episode 3 consortium.
4D trajectory planning and the process was executed when passing the appropriate designated waypoint.
o Advanced arrival management was executed in the Baseline organisation in traditional airspace at FIR boundary (roughly 70 NM out) for reasons of comparison of performance, and sequencing was accomplished at FAF.
o Advanced arrival management was executed in the Advanced CDA organisation from “ETMA” boundary, 200 NM out, and sequencing was accomplished at TMA entry-point.
o The implementation of arrival management was based on 4D trajectories, being overly accurate for the Baseline, whilst wake vortex optimisation was not yet implemented, having some impact on throughput and efficiency.
o The results could be compared between Baseline and Advanced CDA organisation, but more important was the question how effective the layered planning concept could be to apply first high-precision DCB on prioritised departure flows to congested destinations, and secondly advanced arrival management in order to enable advanced CDAs in a highly efficient way, while maintaining high throughput during period of dense arrival flows.
The optional last step to include the modelling of performance benefits during the executive phase was omitted. There was no evident reference available that could be used to model quantified benefits during the descent process due to application of enhanced 4D navigation and data link during descent in dense traffic flows and within a mixed equipage environment.
The fast-time experiment, as described above consisting of eight experimental runs, was performed on two scenarios:
• Current scenario, 2008 : The air traffic demand of this scenario was in perfect balance with the available capacity because the selected and simulated day was a perfect day without reactionary delays and without disruption. The simulated time tables followed the schedules. The outcome of this experiment shows the effectiveness of advanced operational concept to function in an environment of advanced airspace design, enabling parts of the advanced operational concept of SESAR to provide the expected benefits. These benefits were measured.
• Future scenario, 2020 : The air traffic demand of this scenario was heavily loaded with 50% more traffic than the current situation in 2008. The scheduling of such a scenario is by definition out of balance due to the complexity of a strategic DCB process to reach this balance. In addition, an increase of 50% of air traffic demand is more than what the infrastructure at and around the airports of interest can support. Therefore, serious saturation effects and high delays and high levels of inefficiency can be expected. Reversely, the savings and benefits are increasing steeply. However, these benefits can be considered to consist mainly of savings on excessive levels of inefficiency by missed opportunities to balance the demand and capacity in an appropriate way. This must be considered as unavoidable in simulated advanced far-future experiments as long as infrastructure and capacity can not be treated in a serious and realistic balanced way.
• Comparison of the results of both scenarios allows to assess a possible indicative trend in development of use of airspace, penalties due to inefficiency as well as capacity limitations, and to explore potential to profit from benefits of advanced use of airspace and an advanced operational concept, i.e. SESAR.
The combined set of simulation runs yield to results with a full scope of applicable variability in performance. An overview is presented in Table 11. All runs were analysed, and the critical characteristics of significance of results of the most relevant runs were highlighted.

Episode 3
D5.3.4-02 - Results of FTS on Multi-Airport TMA operations in the core area of Europe
Version : 1.00
Page 72 of 125
Issued by the Episode 3 consortium for the Episode 3 project co-funded by the European Commission and Episode 3 consortium.
Table 11 - Overview of performed FTS simulation run s
The two scenarios, both, simulated air traffic to and from all airports in the region. However, air traffic of interest was only the traffic to and from the four hub airports of interest: Amsterdam Schiphol (EHAM), Brussels (EBBR), Köln (EDDK) and Düsseldorf (EDDL). The following table presents the traffic to and from these airports of interest.
Table 12 - Overview of simulated air traffic to and from the 4 airports of interest: EHAM, EBBR, EDDK, and EDDL

Episode 3
D5.3.4-02 - Results of FTS on Multi-Airport TMA operations in the core area of Europe
Version : 1.00
Page 73 of 125
Issued by the Episode 3 consortium for the Episode 3 project co-funded by the European Commission and Episode 3 consortium.
Figure 13 - Global picture of simulated traffic fol lowing traditional descent procedures, including ve ctoring
Apart from results discussed in the next section, section 4, the simulation offered a global overview of the mapping of simulated flows on airspace usage. The two figures are offering results that allow comparing the flow patterns and the airspace occupied by simulated traffic. Both pictures present two types of traffic flows: departure and arrival flows. The departure flows are coloured brown, the arrival flows are coloured by sliding colours from high to low altitude. Figure 13 shows the traditional controlled flows of traffic; Figure 14 shows the advanced CDA patterns. The striking difference is the vectoring at lower altitude, coloured dark blue.

Episode 3
D5.3.4-02 - Results of FTS on Multi-Airport TMA operations in the core area of Europe
Version : 1.00
Page 74 of 125
Issued by the Episode 3 consortium for the Episode 3 project co-funded by the European Commission and Episode 3 consortium.
Figure 14 - Global picture of simulated traffic fol lowing early sequenced advanced CDA procedures
The second figure, Figure 14, presenting advanced CDA patterns, can be compared also with Figure 11, which presents the design of these patterns in ETMA airspace.
Also more direct arrival flows can be observed. For example, the S-E arrival flow to Schiphol is added to offer SE-bound traffic more direct access to Schiphol than today, 2009. The airport operates now with four arrival-path approach procedures to two parallel runways which is more compliant with a generic model for hub airport operations in Europe.

Episode 3
D5.3.4-02 - Results of FTS on Multi-Airport TMA operations in the core area of Europe
Version : 1.00
Page 75 of 125
Issued by the Episode 3 consortium for the Episode 3 project co-funded by the European Commission and Episode 3 consortium.
4 EXPERIMENT RESULTS
4.1 OVERVIEW
The results of the different fast-time simulation runs are compared with each other at several levels:
• Results of several experimental runs for all airpor ts : The results of this scenario give the performance benefits for the descent profiles of the four airports of interest.
• Results per airport , being specific on achievable benefits in the performance benefits of each airport.
• Results comparing the “Baseline ”, “operational realistic ” scenario with the “Advanced CDA ”, “DCB emulated ” scenario: The results of this scenario give the achievable performance benefits by:
o Introducing full advanced CDA profiles at lower altitude, o Changed use of airspace to allow more efficient routing of ideal descent
profiles in ETMA airspace, and o Application of Demand and Capacity Balancing (DCB) and arrival
synchronisation which allows a flight efficient profile by compliance to accurately planned 4D-trajectory-based planning.
The results are analysed by several metrics for all four airports, measured over 24 hours:
• Controller required actions 9: This is an overview of all action requiring events during simulation of part of each flight. These events represent flight mode changes, probably leading to controller activities at tactical level. The accumulation of these actions from different designated points of the flight until the landing (from 200 NM out), gives an indication of required workload and the level of inefficiency of a chosen scenario. A first indication of benefits is obtained by comparing equivalent scenarios regarding accumulated controller-required-action values for these scenarios.
• Flight times : The reduction in average flight time gives an indication of benefits over the descent profile of all flights to all four airports. This is measured again from a given initial waypoint, 200 NM out, down to the threshold.
• Fuel consumption : The reduction in average fuel consumption gives an indication of achievable benefits over the decent profile of all flights to all four airports. This is measured again from 200 NM down to the threshold.
• Also, flown distances and in-flight delays were measured but the reporting on these data is less relevant and is therefore omitted.
Finally, additional runs were performed to assess benefits by arrival traffic synchronisation .
Thereafter, benefits are presented per airport, which yield:
• Throughput per hour over the day • The potential savings in flight time per year • The potential savings in fuel per year.
9 N.B., it should be noted that Controller required actions are subdivided in 5 categories of actions, i.e. Conflict, Holding, Level, Vector, and Entries. It is good to emphasise that “Conflict” relates to a condition where an action of the controller is required to ensure separation. It is not counting for any loss of separation.

Episode 3
D5.3.4-02 - Results of FTS on Multi-Airport TMA operations in the core area of Europe
Version : 1.00
Page 76 of 125
Issued by the Episode 3 consortium for the Episode 3 project co-funded by the European Commission and Episode 3 consortium.
The monitoring of flight performance took place over several significant waypoints, each point being able to provide information on an aspect of flight performance:
• Over the whole flight , giving information of relative and absolute gains for each individual flight,
• From the last “common” waypoint until the landing, giving information of the difference in performance between Baseline and Advanced CDA scenarios,
• From “ETMA entry-point ” (200 NM out) until the landing, giving information that allows to compare the outcome for different airports and overall results,
• From “Top Of Descent ” until landing, giving information that is flight specific, • From “STAR-passage ” until landing, giving information that is specific for each arrival
routing for a specific airport, • From “7000 ft ” and “4000 ft ” until landing, giving information on flight performance at
lower altitude.
The reporting of almost all results is derived from “ETMA entry-point ” data, 200 NM out , because this data is best comparable and most relevant for the objectives of this study, i.e. to assess the benefits from early arrival management on performance and execution of advanced CDA procedures. However, it must be stressed that there is one case where “ETMA entry-point” was not the best waypoint to monitor, and this yields those descent operations that depart from nearby airports. Flights still within their climb phase within the 200 NM range could give unpredictable results if their flight profile was adapted in the lateral plane. For example, a flight could be given a more direct route, which results now in a more significant part of the climbing phase of the flight within the 200 NM range, which results than in an increase in flight duration and fuel consumption if measured from 200 NM until the landing! This is correct but it does not reflect the findings in an appropriate manner.
A few reporting data was based on “7000 ft” and “4000 ft” data. This yields to those issues addressing flight performance during the CDA within the TMA. Other data is available and was used for analysis, but was not used for reporting purposes.
4.2 RESULTS FOR FOUR AIRPORTS BY COMPARING OUTCOME OF EXPERIMENTAL
RUNS
4.2.1 Controller required actions
Results of “Controller required actions ” of arrival traffic for all four airports for 24 hours operations were compared. See for details Annex C.2.
The “Unconstrained Ideal Profiles ” showed the following trends, comparing “Baseline” with “Advanced CDA” for “Current”, 2008, as well as “Future”, 2020, scenario:
• All “Conflict”, “Holding” and “Vectoring” activities were suppressed which was the reason that the performance of “Ideal profiles” could be measured.
• Level instructions were strongly decreasing from “Baseline” to “Advanced CDA”, which is comprehensible. In particular, there are few level instructions to control the execution of CDAs. The number of level-instructions left over was 65%, at low altitude even a stronger decrease of instructions was observed: below 7000 ft 23% left , and below 4000 ft 11% left (compared to Baseline).
• The number of “Entries”, i.e. transition activities of one sector to another, is increasing from “Baseline” to “Advanced CDA”. The reason is that dedicated arrival flow corridors were created without adapting the sectorisation. The new routing requires evidently a further adaptation to reach the most appropriate level of sectorisation. A 13% increase of sector transition activities was observed.
• From “Current” to “Future” there is a trend that the number of activities is increasing. For ideal trajectories this can not be caused by the behaviour of individual flights. The

Episode 3
D5.3.4-02 - Results of FTS on Multi-Airport TMA operations in the core area of Europe
Version : 1.00
Page 77 of 125
Issued by the Episode 3 consortium for the Episode 3 project co-funded by the European Commission and Episode 3 consortium.
conclusion is that the “market-driven” traffic growth pattern has caused a strong increase of activities to control dense air traffic under future operational conditions.
The “Operational Realistic Profiles ” and “DCB Profiles ” showed the following trends, comparing “Baseline” with “Advanced CDA” and comparing “Operational Realistic” with “DCB emulated” for the “Current”, 2008, scenario:
• CDAs were realised by suppressing vectoring at all altitudes. However, the result was that holdings had to be applied as long as no means were available to accomplish sequencing and metering in another way. Therefore, the number of holdings was increasing for CDAs in these runs (98% increase of holding manoeuvres compared to Baseline).
• Conflicts (actions by controllers to prevent loss of separation!) were decreasing strongly at all altitudes for CDAs. This is a consequence of introduction of dedicated arrival flow corridors; only 10% of potential conflicting situations were observed now compared to the Baseline scenario.
• At low altitudes there were few conflicts and holdings left; 6% of all recorded activities were left compared to the Baseline scenario.
• DCB regulated the flows to achieve low variability at the start of arrival management, 200 NM out. This DCB regulation was accomplished in a simple and straightforward manner, by shifting departure times in seconds precise. This was overly optimistic, on the other hand, by lack of a real DCB process, the performance of the emulated DCB process was less than optimal. The result is not necessarily unrealistic. Nevertheless, it would be strongly preferable to perform a real DCB process, ECAC-wide, instead of this emulated process.
• The positive effect of applying DCB was that the decrease of number of holding manoeuvres of CDA operations was significant. Only 44% of holdings were left.
• The effect of DCB on Baseline scenario was almost as positive as for the Advanced CDA scenario. However, the positive effect is distributed over holding and vectoring activities. In total 58% of vector and holding activities were left.
The “Operational Realistic Profiles ” and “DCB Profiles ” showed the following trends, comparing “Baseline” with “Advanced CDA” and comparing “Operational Realistic” with “DCB emulated” for the “Future”, 2020, scenario:
• Compared to the 2008 scenario the observed numbers of controller required activities were increasing in the 2020 scenario more than linear. This is an expected consequence of saturation of operated air traffic demand.
• The increase of number of holdings is significant. Reduction of these holding manoeuvres is indicative for what can be achieved by application of accurate planning concepts of SESAR.
• At low altitude, below 7000 ft, there were still few holdings left, being indicative for a successful simulation process to force CDAs.
• Regulations by DCB were less effective now. This is partly a consequence of saturation, partly a consequence of simplified emulation of DCB. Never more than 10 minutes imposed delay were accepted, and under a normal DCB managed traffic sample, this should be sufficient, but with the applicable scenario it was often failing. Under these conditions 60% of the holding manoeuvres were maintained, whilst below 7000 ft 68% was left compared to Baseline.
In summary, the controller required actions could be interpreted to understand the significance of change of operations of the different experimental runs, each with their specific scenarios and their specific operational conditions. By comparing these experimental runs one by one, each difference could be explained in terms of performances and their causes.

Episode 3
D5.3.4-02 - Results of FTS on Multi-Airport TMA operations in the core area of Europe
Version : 1.00
Page 78 of 125
Issued by the Episode 3 consortium for the Episode 3 project co-funded by the European Commission and Episode 3 consortium.
4.2.2 Average Flight Time
The “Unconstrained Ideal Profiles ” showed the minimum achievable flight time for a given descent profile by measuring flight times whilst avoiding any action to solve a traffic problem. These minimum achievable “average flight times” show a significant decrease of flight time, compared to Baseline due to more direct horizontal routing and a more optimal vertical descent profile. Nevertheless, the profiles are still such that the ACDA from low altitude, 7000 ft, to the runway can be flown by all types of aircraft, respects noise abatement and is appropriate to deal with dense arrival flows; see Figure 15. An average benefit in flight time was measured of 2454-2277 = 177 sec. during the descent from ETMA entry-point to touch-down in 2008 , and 2483-2251 = 232 sec. in 2020 . The re-routing benefits are not the same for all arrival flows and the difference between 2008 and 2020 is therefore likely to be caused by non-proportional changes in growth of air traffic.
The “Operational realistic Profiles ” are presenting fewer or comparable benefits, compared to the unconstrained ideal profiles. The observed benefits were 2523-2377 = 146 sec. in 2008 and 2775-2626 = 149 sec. in 2020 . The reason for possible decrease in benefits is that benefits are more difficult to be preserved due to restrictions on CDA procedures. Significant sequencing and potentially conflicting conditions are forced to be resolved by applying holding manoeuvres, instead of vectoring.
The “DCB Profiles ” are ensuring more accurately smoothed arrival demand and thus low variability of arrival demand at TOD (see also Figure 29). This is achieved by imposed, and presumably accepted, pre-departure constraints. Although these constraints are in reality constraints within -5 and +10 minutes and therefore not necessarily delays, these were in the simulations constraints within 0-10 minutes. The net result was a decrease in average in-flight duration and an increase in total average flight duration.
Figure 15 - Average flight time performance results for arrival traffic of all 4 airports (2008 and 20 20)
Figure 15 presents “flight duration ” results for 2008 and 2020. The yellow blocks show the achievable benefits by optimising flight profiles. The total (yellow+light-blue, left) values show the operational realistic performances including penalties due to sequencing, vectoring and holdings. The total (yellow+violet, right) values show how much can be win by applying DCB, and DCB is somewhat less effective for CDAs compared to the traditional Baseline

Episode 3
D5.3.4-02 - Results of FTS on Multi-Airport TMA operations in the core area of Europe
Version : 1.00
Page 79 of 125
Issued by the Episode 3 consortium for the Episode 3 project co-funded by the European Commission and Episode 3 consortium.
procedures. The interest is how much there is to win to change from present-day’s . The gain is:
• For the 2008 traffic demand scenario, from Baseline to CDA: 2523-2325 = 198 sec. reduction of in-flight flight duration (-8%), and
• For the 2020 traffic demand scenario, from Baseline to CDA: 2775-2521 = 254 sec. reduction of in-flight flight duration (-9%).
It should be noted, however, that the increase of benefits in 2020 has been lost first by increased inefficiency caused by creation of the highly congested 2020 scenario.
4.2.3 Average Fuel Consumption and Flown Distance
A similar story as for average flight time can be described for “Fuel consumption” and “Flown distance”. It should be noted however that Flight time and Distance flown are measured accurately, although based on simple aircraft modelling, whilst figures for Fuel consumption have an indicative value only because no appropriate modelling is applicable in fast-time simulation for aircraft performance and its relationship to fuel consumption.
The “Unconstrained Ideal Profiles ” showed the minimum achievable fuel consumption and flown distance for a given descent profile by measuring these quantities whilst avoiding any action to solve a traffic problem. The minimum achievable “average fuel consumption” shows a significant decrease of fuel consumption due to more direct horizontal (lateral) routing and a more optimal vertical descent profile. Nevertheless, the profiles are still such that the ACDA from low altitude, 7000 ft, to the runway can be flown by all types of aircraft, respects noise abatement and is appropriate to deal with dense arrival flows; see Figure 16. An average benefit in fuel consumption was measured of 828-738 = 90 kg. during descent from ETMA entry-point to touch-down in 2008 , and 830-735 = 95 kg. in 2020 . Comparable results are achieved for Distance flown. The re-routing benefits are again not the same for all arrival flows and the difference between 2008 and 2020 is therefore likely to be caused by non-proportional changes in growth of air traffic.
The “Operational realistic Profiles ” are presenting fewer or comparable benefits compared to the unconstrained ideal profiles, i.e. 870-793 = 77 kg. in 2008 and 1005-922 = 83 kg. in 2020. The reason for possible decrease in benefits is again that benefits are more difficult to be preserved due to restrictions on CDA procedures. All sequencing and potentially conflicting conditions are forced to be resolved by applying holding manoeuvres.
The “DCB Profiles ” are showing again benefits by ensured low variability of arrival demand at TOD.
Figure 16 - Average reduction in fuel consumption f or arrival traffic of all 4 airports (2008 and 2020 )

Episode 3
D5.3.4-02 - Results of FTS on Multi-Airport TMA operations in the core area of Europe
Version : 1.00
Page 80 of 125
Issued by the Episode 3 consortium for the Episode 3 project co-funded by the European Commission and Episode 3 consortium.
Figure 16 presents “Fuel consumption ” results for 2008 and 2020, in the same way as for flight duration. The yellow blocks show the achievable benefits by optimising flight profiles. The total (yellow+light-blue, left) values show the operational realistic performances including penalties due to sequencing, vectoring and holdings. The total (yellow+violet, right) values show how much can be win by applying DCB, and DCB is somewhat less effective for CDAs compared to the traditional Baseline procedures. The interest is how much there is to win to change from present-day’s . The gain is:
• For the 2008 traffic demand scenario, from Baseline to CDA: 870-762 = 108 kg. reduction of fuel consumption (-12%), and
• For the 2020 traffic demand scenario, from Baseline to CDA: 1005-857 = 148 kg. reduction of fuel consumption (-15%).
However, again, it should be noted, that the increase of benefits in 2020 is obtained by first losses due to increased inefficiency caused by creation of the highly congested 2020 scenario.
A summarising table, see Annex C.4, provides the relevant data concerning achievable benefits in transition of Baseline to advanced CDA concept, and going from current 2008 scenario to future 2020 scenario, see Figure 17.
Figure 17 - Overview of benefits of Fuel consumptio n and Distance flown, going from Baseline to Advanc ed (CDA), and going from 2008 to 2020 scenarios
4.2.4 Arrival Traffic Synchronisation
Arrival traffic synchronisation was addressed by emulating an advanced AMAN process by modelling enhanced sequencing and wake vortex differences. In this way, the ATM process could provide benefits by increased throughput during peak load conditions when one of the following conditions was fulfilled:
1. if the metering and sequencing could be optimised towards minimal spacing, and 2. if wake vortex optimisation could be realised.
The metering and sequencing result was very likely lower than in real-life because fast-time simulation generates less disturbances on the planned sequencing than experienced in real life. Moreover, the options to benefit from wake vortex optimisation are rare. Only traffic with

Episode 3
D5.3.4-02 - Results of FTS on Multi-Airport TMA operations in the core area of Europe
Version : 1.00
Page 81 of 125
Issued by the Episode 3 consortium for the Episode 3 project co-funded by the European Commission and Episode 3 consortium.
options to cluster wake vortex sequences within relative short sequences, offer a chance to generate concrete benefits. The measured benefits were relatively small for that reason, although not negligible.
Results are calculated in terms of flight time, fuel consumption and flown distances, specified in Annex C.5 for all four airports and for each individual airport. One result for current flow10, 2008 air traffic demand, is added below in Table 13.
Table 13 - Benefits from arrival traffic synchronis ation for all 4 airports on 2008 traffic demand
The following can be concluded:
• Arrival traffic synchronisation by AMAN plays an essential role in the convergent layered planning process, giving the ANSP control to refine DCB results and flight-executive deviations. This is not measured but concluded from simplified modelling of DCB results and somewhat overly predictive results of processing the FTS.
• AMAN is more successful for CDAs than for the Baseline because CDAs are more sensitive for disruption.
• Further it can be concluded from results in Annex C.5 that the future flow, 2020, offers more potential for benefits due to more congestion and more opportunities to cluster flights from the same weight category in the optimised arrival sequence.
• Looking at the individual airports, it can be observed that Schiphol, EHAM, profits most due to the large amount of peak load traffic and large differentiation in applicable weight categories.
4.3 RESULTS PER AIRPORT BY COMPARING OUTCOME OF EXPERIMENTAL RUNS
The simulation results in the previous section were average results achieved by middling over the four applicable airports. The most relevant individual results are presented in the following sections per airport. The three airport areas, i.e. four airports, are compared for performance of arrival flows regarding throughput, average flight time and fuel consumption.
4.3.1 Amsterdam, Schiphol (EHAM)
Firstly, two figures, Figure 18 and Figure 19, represent the Baseline horizontal characteristics and the advanced CDA horizontal characteristics in the lower TMA airspace of Amsterdam, Schiphol Airport (EHAM).
The Baseline figure presents low-altitude vectoring at altitudes of 2000/3000 ft, whilst the advanced CDA figure presents a simulated final CDA profile, prepared in ETMA airspace.
10 All runs were repeated but all with minor effects. Improved results can be expected if DCB processes are simulated under more realistic conditions and if emulation of arrival synchronisation is improved.

Episode 3
D5.3.4-02 - Results of FTS on Multi-Airport TMA operations in the core area of Europe
Version : 1.00
Page 82 of 125
Issued by the Episode 3 consortium for the Episode 3 project co-funded by the European Commission and Episode 3 consortium.
It should be noted that the simulated operations were applicable to the most frequent used runway configuration of EHAM. However, several other configurations are applicable in daily operations today and it should be taken into account that in the future extended CDA profiles have to be adapted more extensively than only for routings in lower TMA airspace.
Figure 18 - Schiphol, EHAM, Baseline scenario in lo wer TMA airspace (2008/2020)
Figure 19 - Schiphol, EHAM, advanced CDA scenario i n lower TMA airspace (2008/2020)

Episode 3
D5.3.4-02 - Results of FTS on Multi-Airport TMA operations in the core area of Europe
Version : 1.00
Page 83 of 125
Issued by the Episode 3 consortium for the Episode 3 project co-funded by the European Commission and Episode 3 consortium.
Four experimental runs were compared now to present throughput characteristics, see Figure 20:
• Current flow, 2008, comparing Baseline and CDA throughput characteristics • Future flow, 2020, comparing Baseline and CDA throughput characteristics
The throughput is slightly delayed by simulating final CDA flight procedures.
Figure 20 – Simulated throughput characteristics of Amsterdam, Schiphol (EHAM)
The yearly benefits were calculated, based on measured average flight time savings and fuel savings of all flights with a total flight distance above 70 NM. The benefits were calculated by applying CDA profiles and benefiting from low variation in traffic demand load by departure prioritisation. The calculated benefits are applicable over the last 200 NM of the flight only. See Table 14.
It should be noted that Schiphol received some extra benefits, compared to the other airports, by adding a 4th TMA entry-point in S-E of the Airport, making the procedures more straightforward, and shortening parts of the arrival routings to Schiphol.
Table 14 - Summary table of yearly flight time and fuel benefits for Amsterdam Schiphol (EHAM)

Episode 3
D5.3.4-02 - Results of FTS on Multi-Airport TMA operations in the core area of Europe
Version : 1.00
Page 84 of 125
Issued by the Episode 3 consortium for the Episode 3 project co-funded by the European Commission and Episode 3 consortium.
4.3.2 The Düsseldorf area, Düsseldorf (EDDL) and Köln (EDDK)
Firstly, two figures, Figure 21 and Figure 22, represent the Baseline horizontal characteristics and the advanced CDA horizontal characteristics in the lower TMA airspace of the Düsseldorf area, servicing Düsseldorf Airport (EDDL) as well as Köln Airport (EDDK).
The Baseline figure presents low-altitude vectoring, whilst the advanced CDA figure presents a simulated final CDA profile, prepared in ETMA airspace.
It should be noted that the simulated operations are applicable to the most frequent used runway configurations of EDDL and EDDK. CDA operations at EDDL were simulated by CDA profiles derived from current procedures, whilst EDDK operated newly developed procedures with short-turn inbounds. See also Figure 9, presenting the lay-out of these procedures.
Figure 21 – Düsseldorf area, EDDL and EDDK, Baselin e scenario in lower TMA airspace (2008/2020)
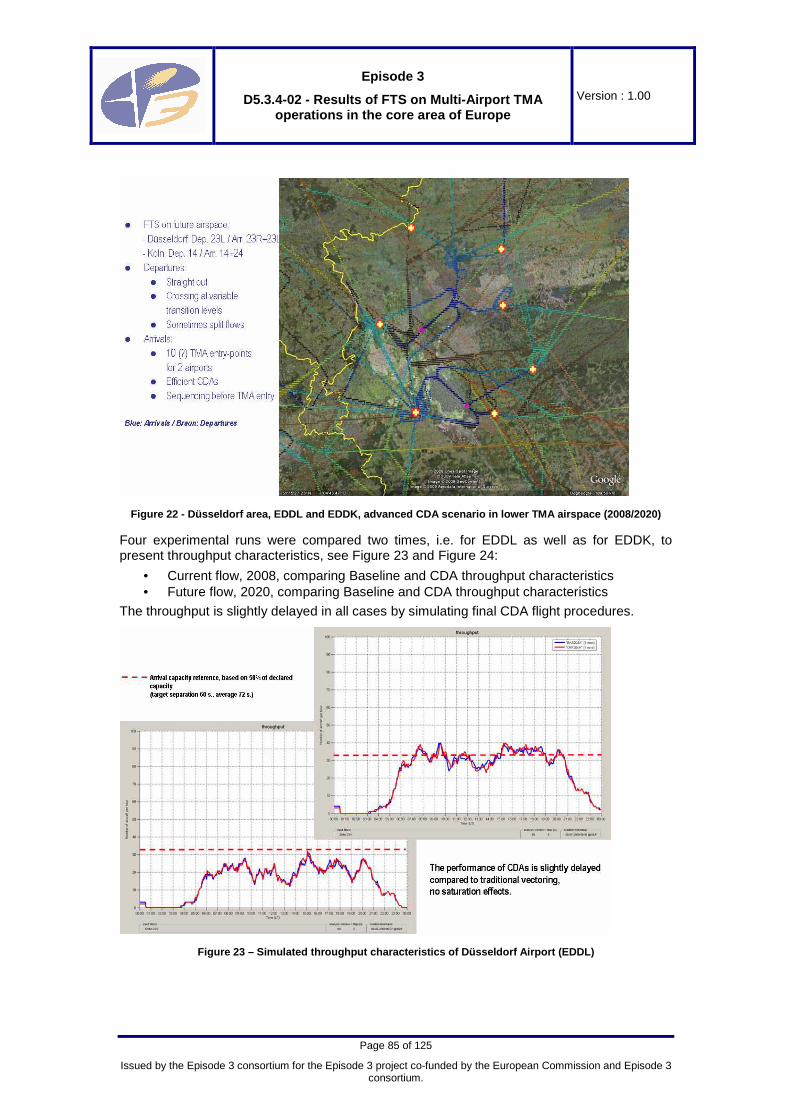
Episode 3
D5.3.4-02 - Results of FTS on Multi-Airport TMA operations in the core area of Europe
Version : 1.00
Page 85 of 125
Issued by the Episode 3 consortium for the Episode 3 project co-funded by the European Commission and Episode 3 consortium.
Figure 22 - Düsseldorf area, EDDL and EDDK, advance d CDA scenario in lower TMA airspace (2008/2020)
Four experimental runs were compared two times, i.e. for EDDL as well as for EDDK, to present throughput characteristics, see Figure 23 and Figure 24:
• Current flow, 2008, comparing Baseline and CDA throughput characteristics • Future flow, 2020, comparing Baseline and CDA throughput characteristics
The throughput is slightly delayed in all cases by simulating final CDA flight procedures.
Figure 23 – Simulated throughput characteristics of Düsseldorf Airport (EDDL)

Episode 3
D5.3.4-02 - Results of FTS on Multi-Airport TMA operations in the core area of Europe
Version : 1.00
Page 86 of 125
Issued by the Episode 3 consortium for the Episode 3 project co-funded by the European Commission and Episode 3 consortium.
Figure 24 – Simulated throughput characteristics of Köln Airport (EDDK)
Also the yearly benefits were calculated, based on measured average flight time savings and fuel savings of all flights with a total flight distance above 70 NM. The benefits were calculated by applying CDA profiles and benefiting from low variation in traffic demand load by departure prioritisation. The calculated benefits are applicable over the last 200 NM of the flight only. See for Düsseldorf Airport, Table 15, and for Köln Airport, Table 16.
It should be noted that the benefits for Düsseldorf Airport are relatively low, compared to for example Köln. Apart from routing, i.e. the short inbound turns of Köln, a systematic reason comes from the average cruise levels of Düsseldorf inbounds (Fl 262), flying significantly higher in average than Köln inbounds (Fl 217). High flights consume less fuel and there is less to win. The average gain per NM is for Düsseldorf 2.29 kg/NM and for Köln 3.45 kg/NM.
Table 15 - Summary table of yearly flight time and fuel benefits for Düsseldorf Airport (EDDL)

Episode 3
D5.3.4-02 - Results of FTS on Multi-Airport TMA operations in the core area of Europe
Version : 1.00
Page 87 of 125
Issued by the Episode 3 consortium for the Episode 3 project co-funded by the European Commission and Episode 3 consortium.
Table 16 - Summary table of yearly flight time and fuel benefits for Köln Airport (EDDK)
4.3.3 Brussels Airport, Zaventem (EBBR)
Firstly, two figures, Figure 25 and Figure 26, represent the Baseline horizontal characteristics and the advanced CDA horizontal characteristics in the lower TMA airspace of Brussels Airport, Zaventem (EBBR). The Baseline figure presents low-altitude vectoring, whilst the advanced CDA figure presents a simulated final CDA profile, prepared in ETMA airspace.
It should be noted that the simulated operations are applicable to the most frequent used runway configuration of EBBR. However, other configurations are applicable as well and in that case extended CDA profiles have to be adapted more significantly than only the routings in lower TMA airspace.
Figure 25 – Brussels Airport EBBR, Baseline scenari o in lower TMA airspace (2008/2020)

Episode 3
D5.3.4-02 - Results of FTS on Multi-Airport TMA operations in the core area of Europe
Version : 1.00
Page 88 of 125
Issued by the Episode 3 consortium for the Episode 3 project co-funded by the European Commission and Episode 3 consortium.
Figure 26 – Brussels Airport, EBBR, advanced CDA sc enario in lower TMA airspace (2008/2020)
Four experimental runs are compared to present throughput characteristics, see Figure 27:
• Current flow, 2008, comparing Baseline and CDA throughput characteristics • Future flow, 2020, comparing Baseline and CDA throughput characteristics
The throughput is slightly delayed by simulating final CDA flight procedures.
Figure 27 – Simulated throughput characteristics of Brussels Airport (EBBR)
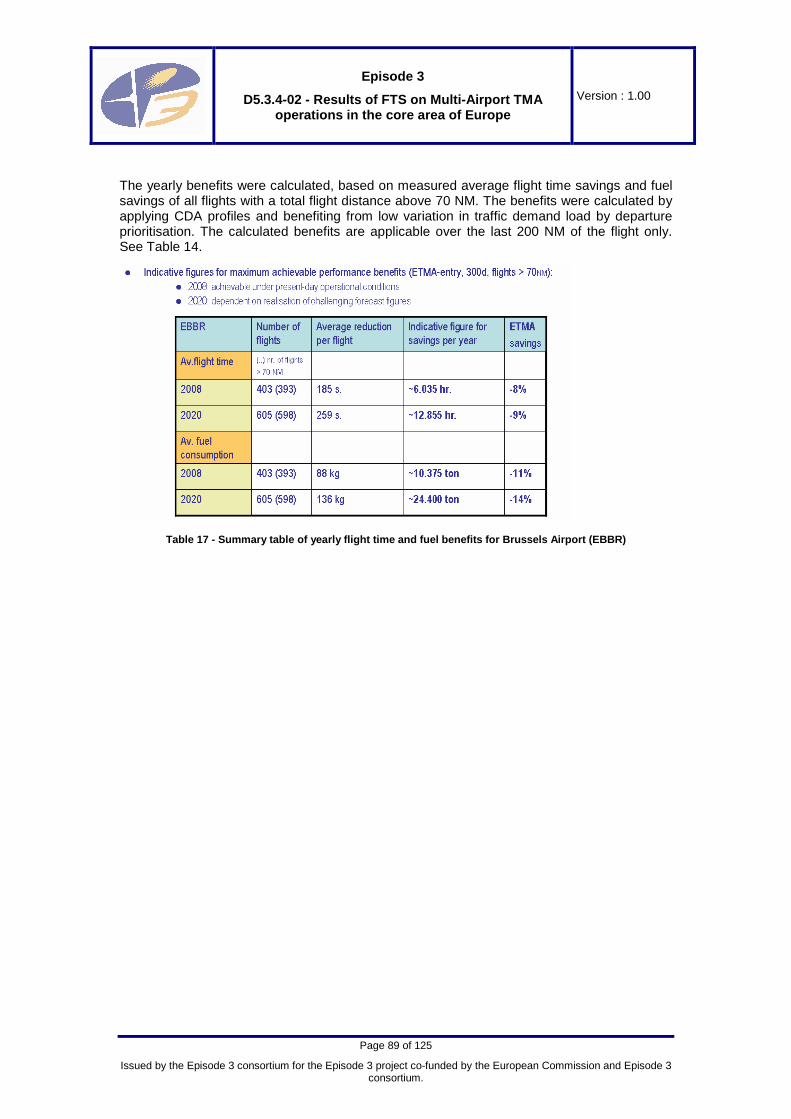
Episode 3
D5.3.4-02 - Results of FTS on Multi-Airport TMA operations in the core area of Europe
Version : 1.00
Page 89 of 125
Issued by the Episode 3 consortium for the Episode 3 project co-funded by the European Commission and Episode 3 consortium.
The yearly benefits were calculated, based on measured average flight time savings and fuel savings of all flights with a total flight distance above 70 NM. The benefits were calculated by applying CDA profiles and benefiting from low variation in traffic demand load by departure prioritisation. The calculated benefits are applicable over the last 200 NM of the flight only. See Table 14.
Table 17 - Summary table of yearly flight time and fuel benefits for Brussels Airport (EBBR)
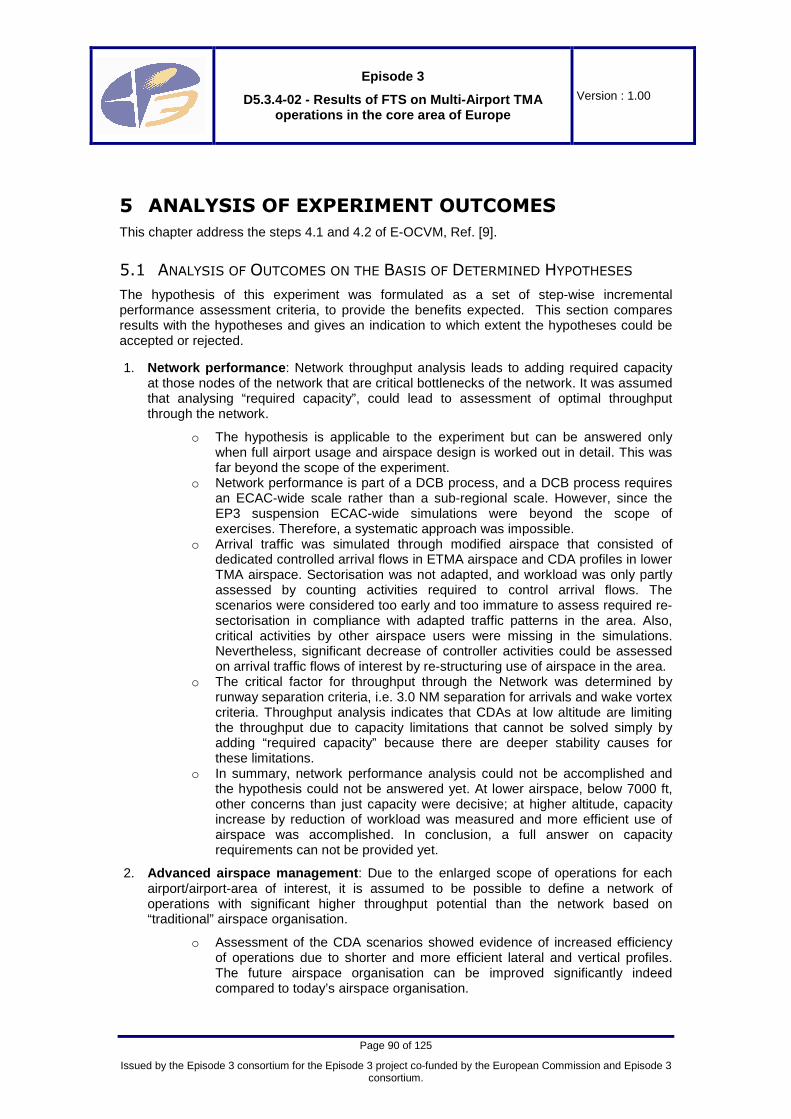
Episode 3
D5.3.4-02 - Results of FTS on Multi-Airport TMA operations in the core area of Europe
Version : 1.00
Page 90 of 125
Issued by the Episode 3 consortium for the Episode 3 project co-funded by the European Commission and Episode 3 consortium.
5 ANALYSIS OF EXPERIMENT OUTCOMES This chapter address the steps 4.1 and 4.2 of E-OCVM, Ref. [9].
5.1 ANALYSIS OF OUTCOMES ON THE BASIS OF DETERMINED HYPOTHESES
The hypothesis of this experiment was formulated as a set of step-wise incremental performance assessment criteria, to provide the benefits expected. This section compares results with the hypotheses and gives an indication to which extent the hypotheses could be accepted or rejected.
1. Network performance : Network throughput analysis leads to adding required capacity at those nodes of the network that are critical bottlenecks of the network. It was assumed that analysing “required capacity”, could lead to assessment of optimal throughput through the network.
o The hypothesis is applicable to the experiment but can be answered only when full airport usage and airspace design is worked out in detail. This was far beyond the scope of the experiment.
o Network performance is part of a DCB process, and a DCB process requires an ECAC-wide scale rather than a sub-regional scale. However, since the EP3 suspension ECAC-wide simulations were beyond the scope of exercises. Therefore, a systematic approach was impossible.
o Arrival traffic was simulated through modified airspace that consisted of dedicated controlled arrival flows in ETMA airspace and CDA profiles in lower TMA airspace. Sectorisation was not adapted, and workload was only partly assessed by counting activities required to control arrival flows. The scenarios were considered too early and too immature to assess required re-sectorisation in compliance with adapted traffic patterns in the area. Also, critical activities by other airspace users were missing in the simulations. Nevertheless, significant decrease of controller activities could be assessed on arrival traffic flows of interest by re-structuring use of airspace in the area.
o The critical factor for throughput through the Network was determined by runway separation criteria, i.e. 3.0 NM separation for arrivals and wake vortex criteria. Throughput analysis indicates that CDAs at low altitude are limiting the throughput due to capacity limitations that cannot be solved simply by adding “required capacity” because there are deeper stability causes for these limitations.
o In summary, network performance analysis could not be accomplished and the hypothesis could not be answered yet. At lower airspace, below 7000 ft, other concerns than just capacity were decisive; at higher altitude, capacity increase by reduction of workload was measured and more efficient use of airspace was accomplished. In conclusion, a full answer on capacity requirements can not be provided yet.
2. Advanced airspace management : Due to the enlarged scope of operations for each airport/airport-area of interest, it is assumed to be possible to define a network of operations with significant higher throughput potential than the network based on “traditional” airspace organisation.
o Assessment of the CDA scenarios showed evidence of increased efficiency of operations due to shorter and more efficient lateral and vertical profiles. The future airspace organisation can be improved significantly indeed compared to today’s airspace organisation.

Episode 3
D5.3.4-02 - Results of FTS on Multi-Airport TMA operations in the core area of Europe
Version : 1.00
Page 91 of 125
Issued by the Episode 3 consortium for the Episode 3 project co-funded by the European Commission and Episode 3 consortium.
o The Controller activities showed a decrease of interactions with other air traffic due to the creation of “Dedicated Arrival Flow Corridors”. This is an indicator for increased capacity.
o The conclusion regarding hypothesis 2 is positive: Dense traffic flows can be sequenced at IAF with the required accuracy. However, evidently the question is not answered yet how to accommodate these dedicated flow corridors taking into account the needs of other airspace users. In addition, CDAs impose limitations on capacity in lower airspace for reasons of stability of tight sequences.
3. ATM enhanced delivery : SESAR processing by DCB and early arrival traffic synchronisation accomplished by 4D trajectory management and advanced planning shall have a positive effect on in-flight delays and workload at sector level. The trade-off is pre-departure delay and in-flight efficiency against inefficiency by tactical manoeuvring. The assumption is that even within a “traditionally” organised airspace structure benefits must be achievable, although against high penalties.
o A simplified and emulated DCB process was applied with positive outcome. Experience in other projects shows similar results as measured in this experiment. See e.g. SESAR, Ref. [1] and [2], and Gate-to-Gate, Ref. [5]. Nevertheless, although positive, the results can be only indicative.
o For unambiguous positive assessment, it is required: � To apply scenarios with an appropriate and acceptable balance
between demand and capacity throughout the network, � To apply a DCB process that will result to a balance between
demand and capacity throughout the network, based on 4D-trajectory planning and that ensures sufficient capacity in terms of throughput through the network, and
� To apply a refined DCB process on congested arrival flows to ensure low variability of arrival flows at the start of the arrival management process.
o In conclusion, the hypothesis is confirmed by the experiment, but the quantitative outcome is not definite yet.
4. ATM enhanced delivery in enhanced airspace : Operating within an advanced airspace organisation, the SESAR processing by DCB and early arrival traffic synchronisation accomplished by 4D trajectory management and advanced planning, shall have an even stronger positive effect on in-flight delays and workload at sector level.
o The stronger positive effect is measured indeed. Advanced CDAs can be flown under traditional procedures only by accepting significant amounts of holding manoeuvres. Advanced DCB and planning procedures are needed to accommodate the CDAs in advanced organised airspace, whilst sufficient control on planning and execution of arrival flows is required to execute the advanced procedures without strong increase of penalties, i.e. holdings.
o The trade-off is again pre-departure delay and in-flight efficiency against inefficiency by tactical manoeuvring, and the penalties will be significantly reduced compared to “traditional” airspace.
o Also, the achievable performance improvement was measured to be better than for hypothesis 3. The numbers of controller actions, i.e. (potential) conflicts and holdings dropped down.
o Therefore, the answer for hypothesis 3 is confirmative.
5. Executive services (RNAV+4D) : The performance can still be improved by providing ATM services that will contribute to enforce the punctuality objectives of planning by changing the objective of flight executive services from “safe, orderly and expeditious” to “safe, orderly and on-time”.

Episode 3
D5.3.4-02 - Results of FTS on Multi-Airport TMA operations in the core area of Europe
Version : 1.00
Page 92 of 125
Issued by the Episode 3 consortium for the Episode 3 project co-funded by the European Commission and Episode 3 consortium.
o The advanced scenarios had to be modelled now with the modelling of advanced navigational and executive services. This has not been done due to uncertainty about the proper dimensioning of benefits due to e.g. 4D-guidance support.
o The conclusion is inconclusive due to problems of proper modelling. Input is needed from real-time simulation experiments that can assess evidence of benefits for workload and performance of achievable metering and spacing.
Although not all hypotheses could be confirmed in an unconditional and conclusive way, there is evidence from the results of fast-time simulations that improvements in arrival management over an extended planning horizon servicing congested arrival flows are achievable and significant. These benefits were measured in terms of flight efficiency, flight duration, fuel consumption, and thus also emissions, and controller workload, i.e. measured as impact on controller activities.
5.2 ANALYSIS OF CONSEQUENCES OF OUTCOMES FOR EXPERIMENT OBJECTIVES
AND ASSUMPTIONS
This section reports on the consequences of the evidence for reaching the experiment objectives, i.e. it is determined which parts of the experiments were successful and which parts might need further study.
The exercise objectives were achieved by step-wise incremental performance of the experiment. The following steps were envisaged as described in sections 3.1.5 and 3.2:
• Unconstrained ideal profiles : Simulation runs were performed to assess benefits by definition of advanced CDA profiles.
o This part of the experiment was successful in defining advanced CDA profiles, starting 200 NM out by efficient routings. Indicative quantitative benefits could be obtained with a fairly high level of confidence.
• Operational realistic : Simulation runs were performed to assess the penalties of flying advanced CDA profiles under present-day procedures.
o Because advanced CDAs were imposed by suppressing vectoring, the number of holdings increased as a negative benefit, reducing the benefits by advanced CDA profiles. The net result was still positive, but the number of holding manoeuvres was unnecessary large. Also this part of the experiment was successfully completed and gave the expected results to feed the next steps of the experiment.
• DCB emulated : The scenarios were balanced by imposing emulated departure constraints on flights in order to ensure more punctuality of arriving on-time at TOD. This permitted the flight to fit into an arrival sequence with minimal corrections on the arrival flight operations towards congest hub airports.
o Departure constraints could help to reduce the sequencing effort from TOD to touch-down. The number of holding manoeuvres was strongly reduced and it was validated therefore that accurate and prioritised planning of departures can help to minimise the sequencing effort to build arrival sequences at the destination airport. The benefits due to DCB are a significant part of the final benefits results, and these are complementary to benefits by efficient profiles.
• Arrival synchronised : The next part of the experiment tried to assess benefits of sequencing and metering of flights from TOD to IAF with high time accuracy on arriving over the IAF, by emulation of advanced AMAN and based on 4D trajectory planning.
o The sequence has to be built up before TOD. Careful planning, including DCB, can help to minimise inefficiency, but arrival traffic synchronisation and reiteration is required in order to achieve the high precision sequencing and spacing over the IAF. The FTS results showed some achievable benefits in
Episode 3
D5.3.4-02 - Results of FTS on Multi-Airport TMA operations in the core area of Europe
Version : 1.00
Page 93 of 125
Issued by the Episode 3 consortium for the Episode 3 project co-funded by the European Commission and Episode 3 consortium.
addition to other effort to enhance planning and to increase predictability of flight execution. However, very likely the need for traffic synchronisation and the added value of reiteration is more essential than could be validated by the experiment. The FTS process is probably somewhat more predictable than can be expected from real-life operations.
• Short-term planning in ETMA/TMA airspace and Execut ive control : Improvements were anticipated in planning, coordination, monitoring and control, however, no modelling was applied yet in the experiment to validate potential benefits.
The incremental steps and their outcome, explained above, were performed on a current flow, 2008 scenario, as well as on a future flow, 2020 scenario. This difference between both scenarios was just the amount of traffic demand. It is evident and natural therefore that the 2020 scenario showed more congestion and delivered systematically more delays than the 2008 scenario.
The experiment could validate sufficient airspace capacity available to operate with sufficient throughput to operate the anticipated traffic demand for both scenarios, the 2008 and 2020 scenario, assuming acceptable accommodation of the needs of other airspace users possible. Overall, the experiment could validate significant potential savings in terms of flight time, fuel consumption and distance flown.

Episode 3
D5.3.4-02 - Results of FTS on Multi-Airport TMA operations in the core area of Europe
Version : 1.00
Page 94 of 125
Issued by the Episode 3 consortium for the Episode 3 project co-funded by the European Commission and Episode 3 consortium.
6 CONLUSIONS AND RECOMMENDATIONS
6.1 KEY FINDINGS
There has been increasing pressure over the last 10-15 years to bring CDAs into operation for flight-efficiency and environmental reasons. These CDA operations have to be operated in the case of multi-airport operations in the Core Area of Europe on dense arrival flows to hub airports in highly complex airspace. Arrival procedures in dense airspace are highly dependent on each other and on the availability of sufficient, dedicated airspace. Because the hub airports of interest are located nearby each other and because advanced arrival management requires implementation of arrival procedures over long distances up to 200 NM, arrival procedures were therefore investigated in a coherent way. The FTS experiment was based on hypotheses that successful implementation of an advanced concept like ACDAs depend on implementation of the advanced layered and convergent planning concept of SESAR together with appropriate allocation of airspace to accommodate highly efficient arrival procedures by creation of “Dedicated Arrival Flow Corridors”.
The fast-time experiment, conducted with TAAM© and simulating 24 hours of traffic demand in the core area of Europe for a current flow (2008) and a future flow (2020) scenarios, was able to validate successfully that:
• CDA profiles from TOD provide significant benefits in terms of flight efficiency and workload, if operated undisturbed along dedicated arrival flow corridors.
• “Dedicated Arrival Flow Corridors” offer more efficient use of airspace than today’s (2009) airspace organisation, but that these corridors are compromised with the needs of other airspace users. These corridors have to be considered therefore as airspace requirements for future arrival operations of hub airports of interest in this experiment.
• DCB measures contribute to optimisation of arrival operations at airports of interest by prioritising departure operations, benefiting services for on-time arrivals of congested arrival flows, and contributing therefore to minimising the variability of traffic demand of these flows. These measures contribute by reducing flight duration of flights involved and by limiting the airspace needed to create the “Dedicated Arrival Flow Corridors”.
• Arrival traffic synchronisation by an advanced AMAN operating with 4D trajectory planning can provide additional benefits, depending on deviations of arrivals from earlier planning. In addition, advanced AMAN provides opportunities to optimise wake vortex sequences and to control realisation of high-accuracy sequencing over the IAFs.
• Together, airspace improvement, layered planning and arrival traffic synchronisation with high accuracy sequencing over the IAF enable the noise-limiting final CDAs in lower TMA airspace.
The FTS experiment could assess those expected benefits impacting controller activities by operating the advanced concept. Also, benefits regarding average flight-time, fuel consumption, distance flown and throughput were measured and confirmed.
An indicative calculation of savings of flight duration and fuel consumption per year shows significant and firm benefits to operate air transport at hub airports of interest in the area. Table 18 presents a summary of arrival flight benefits per year achieved over an arrival distance of 200 NM out. The airports of interest were:
• Amsterdam Schiphol Airport (EHAM) • Brussels Zaventem (EBBR) • Köln Airport (EDDK)

Episode 3
D5.3.4-02 - Results of FTS on Multi-Airport TMA operations in the core area of Europe
Version : 1.00
Page 95 of 125
Issued by the Episode 3 consortium for the Episode 3 project co-funded by the European Commission and Episode 3 consortium.
• Düsseldorf Airport (EDDL)
Table 18 - Summary of flight benefits per year duri ng the arrival phase, over a distance of 200 NM out
Clearly outside the scope of the experiment was the full redesign of airspace, controller procedures and HMI as well as safety and exception handling. Those issues are dealt with in the following section, which are tightly related to the results of the FTS experiment.
6.2 ISSUES
There were several issues that could not be solved because of the scope of the simulation experiment as well as the project. These issues are summarised below:
• The experiment had to focus on main interest. The needs of other airspace users in the area of interest were ignored. Compromising solutions have yet to be evaluated.
• The focus was on hub airport operations, but even this subject could not be fully addressed. For increased realism, also an arrival flow to the London area was allocated over the Netherlands, but this addresses only one specific flow. There is a need to look at “Dedicated Arrival Flow Corridors” for other airports that will impose similar requirements on advanced arrival procedures in the area of interest, i.e. airports of the London area, the Paris area, and Frankfurt. At least part of the arrival procedures to these airports will cover parts of the airspace that was simulated in this experiment.
• The selected profiles are CDA profiles from TOD to touch-down. These profiles are applicable to one selected runway configuration. Switching to other configurations will require other profiles, and if the same TMA entry-points are applicable, these profiles will impact at least the required TMA-entrance altitudes.
• Some impact on workload was assessed by evaluating required controller activities to control the flight along designated profiles. However, no complete workload assessment has been addressed. On the one hand, an appropriate sectorisation and view on re-allocation of tasks was not foreseen; on the other hand, the concept remains unclear as yet in respect of controller roles. For example, what is the impact of the advanced concept on monitoring and alerting functions and associated workload issues?
• The “Dedicated Arrival Flow Corridors” in ETMA airspace have to be dimensioned in such a way that sequencing can be accomplished under heavy traffic density conditions. For worst-case conditions, accommodation of airspace for holdings and stacking must be provided. The required airspace depends on (among other factors)

Episode 3
D5.3.4-02 - Results of FTS on Multi-Airport TMA operations in the core area of Europe
Version : 1.00
Page 96 of 125
Issued by the Episode 3 consortium for the Episode 3 project co-funded by the European Commission and Episode 3 consortium.
the effectiveness of control on variability of arrival demand. However, those issues were outside the scope of the investigation.
• Not yet departed traffic within the 200 NM range will complicate arrival traffic synchronisation. No particular attention was paid to integration of lately departing traffic.
• The profiles in lower airspace are feasible profiles. However, there is no evidence yet that these profiles can be operated in a safe and orderly way. Also, this was also outside the scope of the experiment.
6.3 RECOMMENDATIONS
6.3.1 General recommendations
In view of the success of the FTS to validate benefits for hub-airport arrival flow operations, this section describes recommendations aiming to promulgate successful and expeditious implementation of the concept.
• Critical parts of the concept address adapted use of airspace and airspace management. This aspect is the responsibility of several ANSPs involved in the applicable operations and it might be in their interest to look at appropriate compromising solutions for all airspace users; for example, in the context of creating Functional Airspace Blocks (FABs).
• A more complete plan for airspace reorganisation can lead to firmer results by fast-time simulation.
• The FTS experiment has addressed operations on four hub airports. These airports are characterised by operating dense arrival flows and arrival operations that exceed national and FIR boundaries. There are more airports that may profit from the concept:
o Firstly, airports with an interest in the simulated part of the Core Area: the London area, the Paris area and Frankfurt,
o Other possible candidates; for example: Milan Malpensa and Milan Linate, Munich, Zürich, Vienna, Prague, Geneva and Lyon.
• The validation of the concept underlined the need to extend En-route service provision with a new service to support on-time arrivals over a significant waypoint in support of arrival traffic synchronisation of hub airports. It is recommended to further develop this aspect of En-route service provision. (See also en-route experiments, i.e,. EP3 D4.3.4-02, Ref. [29]).
• Part of the validated benefits was derived from DCB measures to arrive on-time at TOD. These measures were beneficial by ensuring low variability of demand at TOD and benefits were achievable by imposing highly accurate departure constraints. Further development is recommended for this concept element as part of DCB.
o First, DCB has to be ensured ECAC-wide and throughout the Network, which means that balancing is achieved by deployment of available capacity.
o Second, prioritisation by precision departures is applied throughout the whole Network in support of low variability of Arrival Management, taking into account all constraints of other planned Network operations.
o Third, the first two steps are repeated taking into account full connectivity of flights and flight operations, and by simulating delays and reactionary delays.
In summary, the best estimates of achievable benefits can be assessed by: improving realism of basic DCB operations; by applying DCB for precision departures under realistically simulated operational conditions; and by extending the fast-time simulations to a full re-design of applicable airspace with support of the ANSPs involved.

Episode 3
D5.3.4-02 - Results of FTS on Multi-Airport TMA operations in the core area of Europe
Version : 1.00
Page 97 of 125
Issued by the Episode 3 consortium for the Episode 3 project co-funded by the European Commission and Episode 3 consortium.
6.3.2 Recommendations on supporting DODs and Operational
Scenarios
This report is specific in the Operational Concept of interest that is applicable to the FTS experiment. The concept is detailing OIs, listed and referred to in section 2.2.1; the detailed description is outlined in section 2.2.2, and applicable concept assumptions are described in section 2.8. It is recommended that account is taken of the statements on explicit conditions to make the concept beneficial in the simulated application domain. These statements address topics regarding:
• Demand and Capacity Balancing in support of dense arrival operations to hub airports
• Airspace Management and Organisation in support of CDA operations of hub airports • Flight management, planning and arrival traffic synchronisation of dense arrival flows,
and • Short-term planning and Executive control on dense CDA arrival flows.
The experiment could validate significant benefits by structuring airspace, by prioritisation of departures to congested destinations, and by promulgating on-time arrival at ETMA entry-point, 200 NM out. These benefits are dependent on appropriate support of the Concept of Operations; it is recommended therefore that the following are included:
• A concept element description on structuring of airspace in support of advanced arrival procedures in DOD E5 and M2
• A concept element description on prioritisation of departure operations in support of congested arrival traffic by DCB in DOD M2, and
• A concept element description on En-route support by on-time arrival over designated waypoints in support of management of congested arrival traffic to designated airports in DOD E6.
6.3.3 Conclusions and Recommendations for Project Level
The FTS experiment could benefit from project-wide evaluations of the Operational Concept and the Validation Strategy in WP2 of Episode 3, with more focused attention given to EP3 WP5. The experiment was conducted as part of coherent validation strategy on TMA operations in WP5 and the applicable concept of operations was discussed and advised in the TMA Expert Group in EP3 WP5.3.1. It is recommended that inputs are consolidated: assumptions, analysis, results and conclusions of each coherent validation experiment in Episode 3 in a single consolidated reporting deliverable for reasons of easy access and traceability.
6.4 CONCLUSIONS
“Dedicated Arrival Flow Corridors” were modelled to facilitate undisturbed descent operations from Top Of Descent (TOD) to landing for the airports of Amsterdam, Düsseldorf, Köln and Brussels, assuming airspace availability. Flight-time reductions and fuel savings were assessed, giving indicative figures for significant potential savings for descent operations to hub airports in the core area of Europe. The savings can be contributed partly to redesign of airspace, partly to applying advanced Demand and Capacity Balancing (DCB) and planning concepts. The accurate sequencing is an enabler for CDAs in lower airspace with benefits for flight efficiency, emissions and noise abatement.
The FTS experiment on Multi-Airport TMA operations in the Core Area of Europe could validate significant benefits for arrival operations for an advanced concept in an appropriately adapted airspace organisation. Regarding the most relevant KPAs, the following validation results could be obtained:

Episode 3
D5.3.4-02 - Results of FTS on Multi-Airport TMA operations in the core area of Europe
Version : 1.00
Page 98 of 125
Issued by the Episode 3 consortium for the Episode 3 project co-funded by the European Commission and Episode 3 consortium.
• Capacity : o Available throughput can provide the required capacity under nominal
conditions. The airports of interest, that is, Schiphol Airport, Brussels Zaventem, Köln Airport and Düsseldorf Airport could operate increased demand with improved predictability and without excessive delays.
o CDAs can be accommodated, but these tend to lead to some delaying effects under saturated conditions (2020). Successfully operating CDAs on dense flows is sensitive and dependent on the success of highly accurate planning and realisation of congested arrival operations. Therefore, prioritisation of departures for congested destinations could contribute to obtaining the expected benefits even for high-density 2020 operations.
• Efficiency : o Improved performance of CDA operations is possible in ETMA airspace by
the creation of “Dedicated Arrival Flow Corridors”. However, this has to be compromised with other airspace users.
o Significant flight time and fuel savings are achievable (see also section 6.1). o Less controller actions (potential conflicts) are required when CDAs are
operated in dedicated airspace over significantly enlarged arrival flight phases. The arrival flight phase extends from roughly 70 NM in the airports of interest today (2009) even up to 200 NM in 2020 under the concept of SESAR.
o Efficient and noise-limiting CDAs in lower airspace are likely to become feasible and operational by redesign of Core Area airspace, by early anticipation in ETMA and En-route airspace, as well as by accurate sequencing to meet the IAF with an uncertainty ranging from 10s to 30s.
• Predictability : o The predictability is strongly improved, but this was input to the experiment
rather than output. It was possible in the experiment to create realistic 4D trajectory planning data, and its use was beneficial, but implementation of SWIM has to enable the system-wide availability.
• Environment : o The fuel savings, which reduce emissions, were significant (see also section
6.1). o Final CDA clearances at low altitude are a benefit to the noise load below
6000 ft. The experiment was successful in validating that appropriate airspace organisation, 4D trajectory-based planning, DCB and trajectory synchronisation are able to support the operations of noise-reducing CDAs in lower airspace on dense arrival flows in a feasible way.
• Safety : o The selected CDA profiles are starting-points to converge to safe CDA
operations. Structured solutions for airspace organisational problems contribute to ensure safe operations. Also, the selected profiles in lower airspace are selected such as to offer structural solutions in separating flows. Nevertheless, CDAs operated in tight sequences are yet to be validated on safe operations, and this was beyond the scope of this experiment. The selected profiles were input, rather than output.
o CDA approaches on parallel runways are still a critical issue regarding safety, and not addressed by this FTS. Also, appropriate separation of parallel flows of arrivals was input to the experiment, rather than output. Safety assessment of selected profiles and lower airspace procedures has yet to be addressed.
A summary of experimental achievements is added in Table 19.
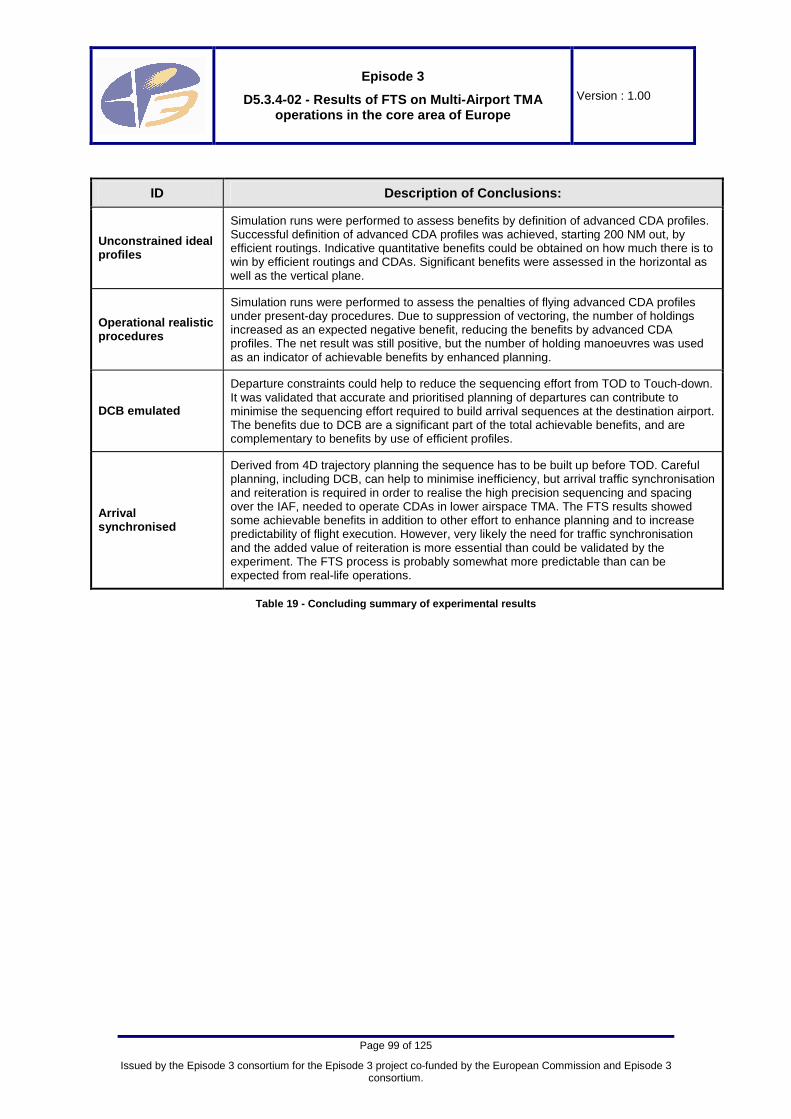
Episode 3
D5.3.4-02 - Results of FTS on Multi-Airport TMA operations in the core area of Europe
Version : 1.00
Page 99 of 125
Issued by the Episode 3 consortium for the Episode 3 project co-funded by the European Commission and Episode 3 consortium.
ID Description of Conclusions:
Unconstrained ideal profiles
Simulation runs were performed to assess benefits by definition of advanced CDA profiles. Successful definition of advanced CDA profiles was achieved, starting 200 NM out, by efficient routings. Indicative quantitative benefits could be obtained on how much there is to win by efficient routings and CDAs. Significant benefits were assessed in the horizontal as well as the vertical plane.
Operational realistic procedures
Simulation runs were performed to assess the penalties of flying advanced CDA profiles under present-day procedures. Due to suppression of vectoring, the number of holdings increased as an expected negative benefit, reducing the benefits by advanced CDA profiles. The net result was still positive, but the number of holding manoeuvres was used as an indicator of achievable benefits by enhanced planning.
DCB emulated
Departure constraints could help to reduce the sequencing effort from TOD to Touch-down. It was validated that accurate and prioritised planning of departures can contribute to minimise the sequencing effort required to build arrival sequences at the destination airport. The benefits due to DCB are a significant part of the total achievable benefits, and are complementary to benefits by use of efficient profiles.
Arrival synchronised
Derived from 4D trajectory planning the sequence has to be built up before TOD. Careful planning, including DCB, can help to minimise inefficiency, but arrival traffic synchronisation and reiteration is required in order to realise the high precision sequencing and spacing over the IAF, needed to operate CDAs in lower airspace TMA. The FTS results showed some achievable benefits in addition to other effort to enhance planning and to increase predictability of flight execution. However, very likely the need for traffic synchronisation and the added value of reiteration is more essential than could be validated by the experiment. The FTS process is probably somewhat more predictable than can be expected from real-life operations.
Table 19 - Concluding summary of experimental resul ts

Episode 3
D5.3.4-02 - Results of FTS on Multi-Airport TMA operations in the core area of Europe
Version : 1.00
Page 100 of 125
Issued by the Episode 3 consortium for the Episode 3 project co-funded by the European Commission and Episode 3 consortium.
7 REFERENCES AND APPLICABLE DOCUMENTS
7.1 REFERENCES
Ref Project/Author Title of document Identification Version/date
[1] SESAR Definition Phase, Task 2.3.1/D3
Compute and Map Operational Concepts & Airspace KPIs based on identified available Tools and Methodologies
DLT-0612-231-00-02, Toulouse
Version 00-02, June 2007
[2] Jonge H.W.G. de, Seljée, R.R., Beers J.N.P., NLR
Demand and Capacity Balancing and Collaborative Flow Management in Europe, Performance assessment study by fast-time simulation
NLR-CR-2007-778, Amsterdam
October 2007
[3] Seljée, R.R, NLR A generic transformation model extended with prioritisation for optimising flows in route networks
NLR-CR-2008-047, Amsterdam
August 2008
[4] Jonge H.W.G. de, Seljée, R.R., Beers J.N.P, NLR
Flow Management and Airspace Management impacting Schiphol operations, Validation Strategy on Demand and Capacity Balancing
NLR-CR-2008-047, Amsterdam
August 2008
[5] Jonge H.W.G. de, Beers J.N.P., Seljée R.R.
The simulation report of global fast-time simulations in Gate-to-Gate, Gate-to-Gate Flow and Departure management
NLR-CR-2006-795, Amsterdam
December 2006
[6] Jonge H.W.G. de, Dronkelaar J.H., Beers J.N.P , NLR
The simulation report for fast-time simulations at airport level for Gate-to-Gate, Gate-to-Gate Flow and Departure management
NLR-CR-2006-796, Amsterdam
December 2006
[7] CASSIS, LFV CTA/ATC System Integration Studies (CASSIS), Concept of Operations
D-LFV 2008-056339 Version 1.0, December 2008
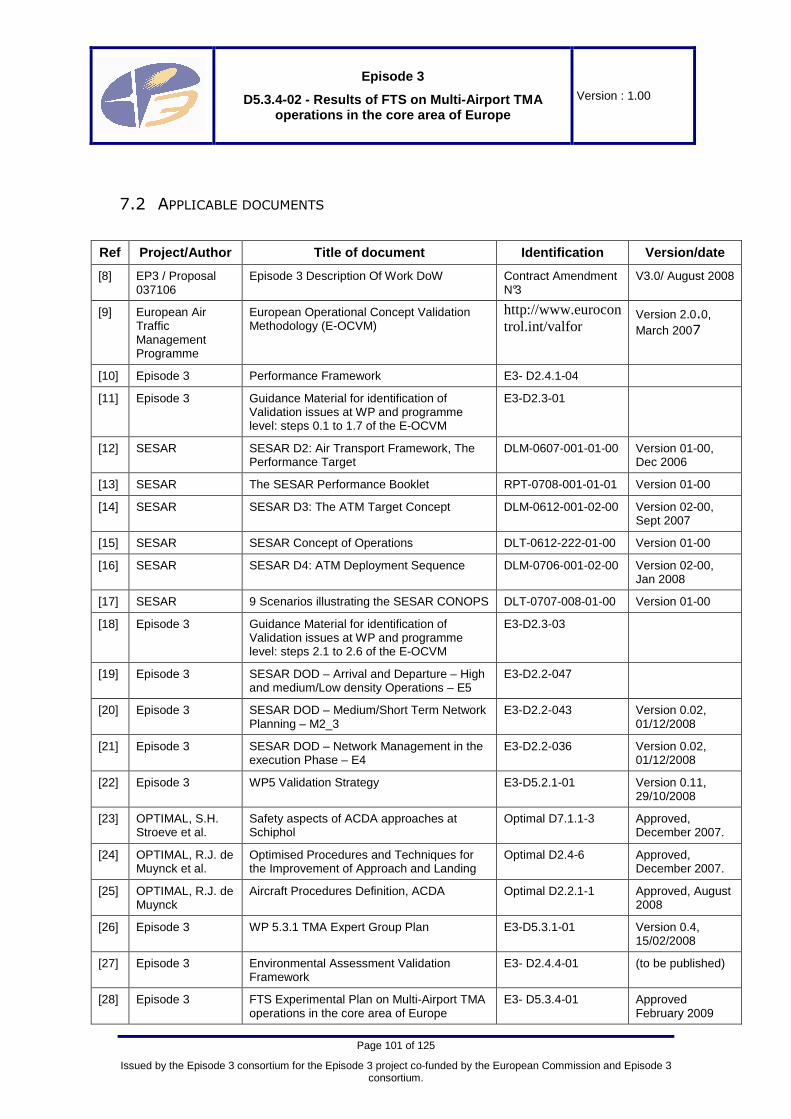
Episode 3
D5.3.4-02 - Results of FTS on Multi-Airport TMA operations in the core area of Europe
Version : 1.00
Page 101 of 125
Issued by the Episode 3 consortium for the Episode 3 project co-funded by the European Commission and Episode 3 consortium.
7.2 APPLICABLE DOCUMENTS
Ref Project/Author Title of document Identification Version/date
[8] EP3 / Proposal 037106
Episode 3 Description Of Work DoW Contract Amendment N°3
V3.0/ August 2008
[9] European Air Traffic Management Programme
European Operational Concept Validation Methodology (E-OCVM)
http://www.eurocontrol.int/valfor
Version 2.0.0, March 2007
[10] Episode 3 Performance Framework E3- D2.4.1-04
[11] Episode 3 Guidance Material for identification of Validation issues at WP and programme level: steps 0.1 to 1.7 of the E-OCVM
E3-D2.3-01
[12] SESAR SESAR D2: Air Transport Framework, The Performance Target
DLM-0607-001-01-00 Version 01-00, Dec 2006
[13] SESAR The SESAR Performance Booklet RPT-0708-001-01-01 Version 01-00
[14] SESAR SESAR D3: The ATM Target Concept DLM-0612-001-02-00 Version 02-00, Sept 2007
[15] SESAR SESAR Concept of Operations DLT-0612-222-01-00 Version 01-00
[16] SESAR SESAR D4: ATM Deployment Sequence DLM-0706-001-02-00 Version 02-00, Jan 2008
[17] SESAR 9 Scenarios illustrating the SESAR CONOPS DLT-0707-008-01-00 Version 01-00
[18] Episode 3 Guidance Material for identification of Validation issues at WP and programme level: steps 2.1 to 2.6 of the E-OCVM
E3-D2.3-03
[19] Episode 3 SESAR DOD – Arrival and Departure – High and medium/Low density Operations – E5
E3-D2.2-047
[20] Episode 3 SESAR DOD – Medium/Short Term Network Planning – M2_3
E3-D2.2-043 Version 0.02, 01/12/2008
[21] Episode 3 SESAR DOD – Network Management in the execution Phase – E4
E3-D2.2-036 Version 0.02, 01/12/2008
[22] Episode 3 WP5 Validation Strategy E3-D5.2.1-01 Version 0.11, 29/10/2008
[23] OPTIMAL, S.H. Stroeve et al.
Safety aspects of ACDA approaches at Schiphol
Optimal D7.1.1-3 Approved, December 2007.
[24] OPTIMAL, R.J. de Muynck et al.
Optimised Procedures and Techniques for the Improvement of Approach and Landing
Optimal D2.4-6 Approved, December 2007.
[25] OPTIMAL, R.J. de Muynck
Aircraft Procedures Definition, ACDA Optimal D2.2.1-1 Approved, August 2008
[26] Episode 3 WP 5.3.1 TMA Expert Group Plan E3-D5.3.1-01 Version 0.4, 15/02/2008
[27] Episode 3 Environmental Assessment Validation Framework
E3- D2.4.4-01 (to be published)
[28] Episode 3 FTS Experimental Plan on Multi-Airport TMA operations in the core area of Europe
E3- D5.3.4-01 Approved February 2009

Episode 3
D5.3.4-02 - Results of FTS on Multi-Airport TMA operations in the core area of Europe
Version : 1.00
Page 102 of 125
Issued by the Episode 3 consortium for the Episode 3 project co-funded by the European Commission and Episode 3 consortium.
Ref Project/Author Title of document Identification Version/date
[29] Episode 3 Results of FTS on Multi-Airport TMA operations in the core area of Europe
E3-D4.3.4-02, version 1.0
Approved June 2009
Table 20 - References and applicable documents

Episode 3
D5.3.4-02 - Results of FTS on Multi-Airport TMA operations in the core area of Europe
Version : 1.00
Page 103 of 125
Issued by the Episode 3 consortium for the Episode 3 project co-funded by the European Commission and Episode 3 consortium.
A Annex : Applicable Operational Improvements The following list of Operational Improvements (OIs) are addressed by the experiment of “Multi-airport TMA operations in the core area”, and are adopted from the Detailed Operational description (DOD) E5, version 2.0, Ref. [19].

Episode 3
D5.3.4-02 - Results of FTS on Multi-Airport TMA operations in the core area of Europe
Version : 1.00
Page 104 of 125
Issued by the Episode 3 consortium for the Episode 3 project co-funded by the European Commission and Episode 3 consortium.
Line of Change OI Step Description Rationale Related Processes
L02 Moving from airspace to trajectory based operations
Advanced Continuous Descent Approach (ACDA)
[AOM-0702]
This improvement involves the progressive implementation of harmonised procedures for CDAs in higher density traffic. Continuous descent approach procedures are used from Initial Approach Fix (IAF) or transition altitude to the runway. New controller tools and 3D trajectory management enable aircraft to fly, as far as possible, their individual optimum descent profile (the definition of a common and higher transition altitude would be an advantage).
Clean environmental approach paths, reduced noise level and emissions (although the accuracy with which paths are flown may exacerbate the impact for those directly under the route).
Implement Arrival Queue
Implement Separation in Terminal Area
L03-01 Collaborative Layered Planning Supported by Network Operations Plan
SWIM enabled NOP
[DCB-0103]
The NOP is in fact a 4 dimensional virtual model of the European ATM environment. It is a dynamic, rolling picture that provides a relational image of the state of the ATM environment for past, present and future. The user, via the appropriate applications, is able to view this image, moving the window along the timeline and focusing on any particular aspect or aspects he or she is interested in.
The plan itself is the result of the complex interactions between the trajectories shared into the system, the capacity being offered, the actual and forecast MET conditions, resource availability, etc. and the automatic and manual negotiations that have been carried out. While a user will only need to see the part of the picture he is concerned with together with its broader implications in order to carry out an action on and with the plan, the applications themselves always use the totality of the information available in the SWIM environment.
(virtually all Queue Management and separation provision – related processes in E5)
L01-05 Airspace User Data to Improve Ground Tools Performance
Use of Predicted Trajectory (PT) to Enhance ATM Ground System Performance
The trajectory sharing process is automatic and transparent to the crew and the controller unless the update results in a new interaction for the aircraft. RBT revision is triggered at air or ground initiative when constraints are to be changed (modified by
The objective is to improve ground trajectory prediction by use of airborne data.
Implement Terminal Area Exit Queue
Optimise Arrival Queue
Implement Arrival Queue
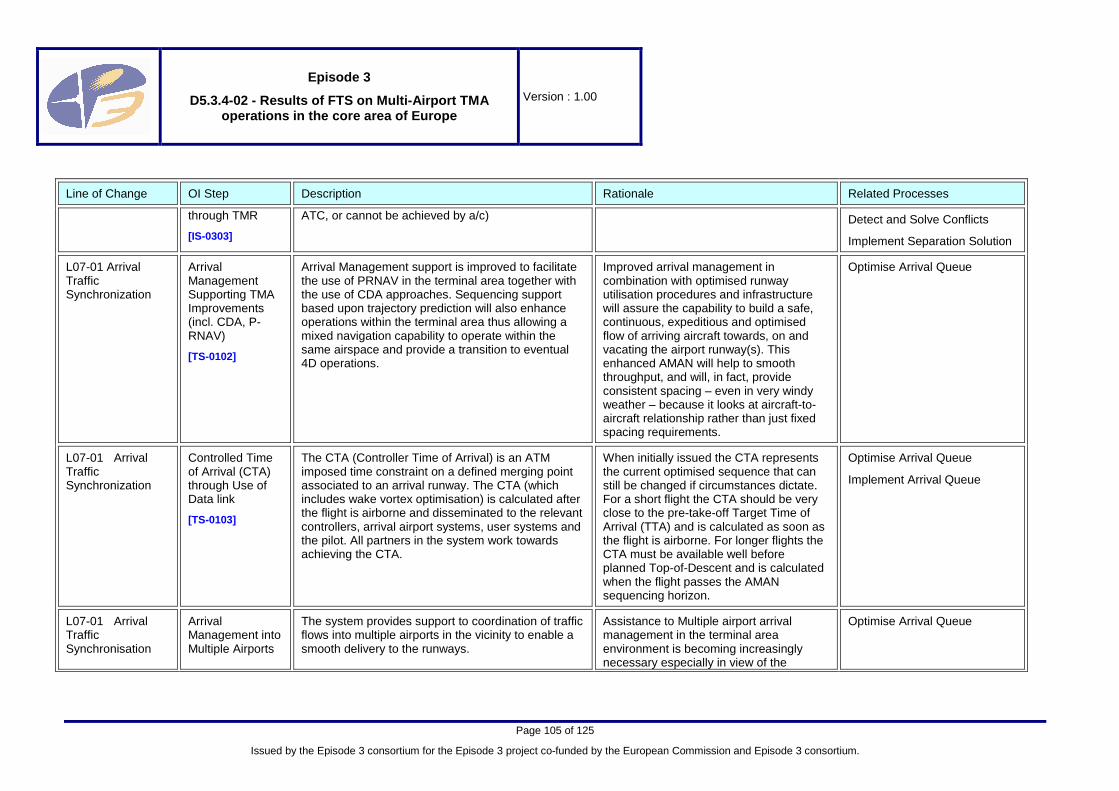
Episode 3
D5.3.4-02 - Results of FTS on Multi-Airport TMA operations in the core area of Europe
Version : 1.00
Page 105 of 125
Issued by the Episode 3 consortium for the Episode 3 project co-funded by the European Commission and Episode 3 consortium.
Line of Change OI Step Description Rationale Related Processes
through TMR
[IS-0303]
ATC, or cannot be achieved by a/c) Detect and Solve Conflicts
Implement Separation Solution
L07-01 Arrival Traffic Synchronization
Arrival Management Supporting TMA Improvements (incl. CDA, P-RNAV)
[TS-0102]
Arrival Management support is improved to facilitate the use of PRNAV in the terminal area together with the use of CDA approaches. Sequencing support based upon trajectory prediction will also enhance operations within the terminal area thus allowing a mixed navigation capability to operate within the same airspace and provide a transition to eventual 4D operations.
Improved arrival management in combination with optimised runway utilisation procedures and infrastructure will assure the capability to build a safe, continuous, expeditious and optimised flow of arriving aircraft towards, on and vacating the airport runway(s). This enhanced AMAN will help to smooth throughput, and will, in fact, provide consistent spacing – even in very windy weather – because it looks at aircraft-to-aircraft relationship rather than just fixed spacing requirements.
Optimise Arrival Queue
L07-01 Arrival Traffic Synchronization
Controlled Time of Arrival (CTA) through Use of Data link
[TS-0103]
The CTA (Controller Time of Arrival) is an ATM imposed time constraint on a defined merging point associated to an arrival runway. The CTA (which includes wake vortex optimisation) is calculated after the flight is airborne and disseminated to the relevant controllers, arrival airport systems, user systems and the pilot. All partners in the system work towards achieving the CTA.
When initially issued the CTA represents the current optimised sequence that can still be changed if circumstances dictate. For a short flight the CTA should be very close to the pre-take-off Target Time of Arrival (TTA) and is calculated as soon as the flight is airborne. For longer flights the CTA must be available well before planned Top-of-Descent and is calculated when the flight passes the AMAN sequencing horizon.
Optimise Arrival Queue
Implement Arrival Queue
L07-01 Arrival Traffic Synchronisation
Arrival Management into Multiple Airports
The system provides support to coordination of traffic flows into multiple airports in the vicinity to enable a smooth delivery to the runways.
Assistance to Multiple airport arrival management in the terminal area environment is becoming increasingly necessary especially in view of the
Optimise Arrival Queue

Episode 3
D5.3.4-02 - Results of FTS on Multi-Airport TMA operations in the core area of Europe
Version : 1.00
Page 106 of 125
Issued by the Episode 3 consortium for the Episode 3 project co-funded by the European Commission and Episode 3 consortium.
Line of Change OI Step Description Rationale Related Processes
[TS-0303] emerging use of secondary airports which are located in close proximity to major airport hubs. In a complex terminal airspace environment there may be significant interaction between traffic flows into a number of these airports. The interaction of such traffic flows in relation to arrival management must be analyzed.
L07-01 Arrival Traffic Synchronisation
Arrival Management Extended to En Route Airspace
[TS-0305]
The system integrates information from arrival management systems operating out to a distance of up to 200 NM to provide an enhanced and more consistent arrival sequence. The system helps to reduce holding by using speed control to absorb some of the queuing time.
Optimise Arrival Queue
Implement Arrival Queue
Table 21 - Operational Improvements addressed by th is Simulation

Episode 3
D5.3.4-02 - Results of FTS on Multi-Airport TMA operations in the core area of Europe
Version : 1.00
Page 107 of 125
Issued by the Episode 3 consortium for the Episode 3 project co-funded by the European Commission and Episode 3 consortium.
B Annex : Inputs by EP3 WP5 TMA Expert Group
B.1 Story-Board
This storyboard attempts, in a simple visual way, to present proposed procedures/methods to be used in a forthcoming SESAR/EP3 Fast-Time Simulation validation exercise [EP3 WP5.3.4], covering the management of arrival traffic into busy TMAs, in the core area of Europe, in the medium term timeframe [approx. 2020]. The area of interest for the EP3 WP5.3.4 simulation includes one TMA managing an airport with high-density traffic (Schiphol) and a second TMA, handling a number of large interacting airports within the TMA (Düsseldorf area).
It should be noted that for the simulation, and for the SESAR operation itself, Arrival Manager (AMAN) functionality should be considered to be operating within a horizon (time or distance to destination) that would allow minimum flight-efficiency impact on flights that have a time constraint at their destination. This would imply AMAN operating to horizons above its current use, and also operating seamlessly across ACC borders. This simulation does not consider how these processes/improvements will be put in place.
It is assumed, for the simulation and for the context of operations in SESAR, that a degree of ‘smoothing’ of traffic will be achieved by DCB, such that arrival traffic will enter the AMAN Horizon smoothed to approx. +2/-3 minutes, in relation to their planning. It is also assumed that this ‘degree of smoothing’ will allow adequate time for further smoothing and control of the flights by application of an AMAN constraint at the IAF, without major flight inefficiency or loss of arrival capacity – Assumptions A, B, C.
On ‘capturing’ the flight, the AMAN will downlink the trajectory projection [based on unconstrained arrival] from 4D capable aircraft, and will process and present a planned sequence. AMAN sequencing will rely on the aircraft capability of meeting the IAF with an accuracy of +/- 30 sec. - Assumption D. 4D aircraft will fly autonomously to their given constraint, while ground system will provide trajectory management support to non-4D equipped aircraft to achieve this accuracy.
In the en route and E-TMA sectors arrival flows will follow dedicated routes towards each TMA entry point. In each flow there will exist mixed-equipped traffic. Some aircraft will be 4D capable and will ‘self-manage’ their time constraint, and others will be managed by ATC, with system support, to meet their AMAN-planned time and sequence. It is assumed that system support will be in place, and of a level, to allow ATC to cater for this mixed-equipped traffic without significant workload impact – Assumption E.
After TOD aircraft will be facilitated, to as large a degree as possible, with a flight efficient descent, constrained only by other traffic (inbounds or crossings). The ATC ground system will continuously monitor flights with regard to them meeting their time constraints. If aircraft appear to be deviating significantly from their times, the ground system will alert the controller, in order for appropriate action to be taken – Assumption F.
Flights will be spaced to allow a continuous CDA for the portion of the flight from FL70 to touch-down. If aircraft are to be left ‘unconstrained’ in this final portion of flight a spacing of approx. 2min will be required at around 30NM DTG – Assumption G. This is supported by previous OPTIMAL studies in Amsterdam. A spacing of less than 2min [but still respecting normal separation criteria] may be considered however, if a portion of the CDA is ‘prescribed’, which would reduce aircraft performance/speed variability in this arrival segment – Assumption H.
Exception handling by ATC for missed approaches/go-arounds would be routine in nature, and aircraft would be reinserted in the sequence where/when appropriate. An element of headroom in the capacity figure would reduce the impact these cases would have on

Episode 3
D5.3.4-02 - Results of FTS on Multi-Airport TMA operations in the core area of Europe
Version : 1.00
Page 108 of 125
Issued by the Episode 3 consortium for the Episode 3 project co-funded by the European Commission and Episode 3 consortium.
following traffic. No headroom in the capacity would have a more significant impact on following traffic – Assumption I.

Episode 3
D5.3.4-02 - Results of FTS on Multi-Airport TMA operations in the core area of Europe
Version : 1.00
Page 109 of 125
Issued by the Episode 3 consortium for the Episode 3 project co-funded by the European Commission and Episode 3 consortium.
Figure 28 - Story-Board representation of Arrival m anagement process in ETMA and TMA airspace

Episode 3
D5.3.4-02 - Results of FTS on Multi-Airport TMA operations in the core area of Europe
Version : 1.00
Page 110 of 125
Issued by the Episode 3 consortium for the Episode 3 project co-funded by the European Commission and Episode 3 consortium.
B.2 Assumptions and explanations concerning the Sto ry-Board, Figure 28
Assumption A/C: Low variability of demand, 200NM ou t / 60 min.
Benefits:
• Airspace utilisation : With low variability there is control on the amount of airspace needed to accomplish the sequencing, without such control the required airspace for dedicated arrival flows cannot be limited to narrow tubes without including at least the use of holding stacks.
• Capacity : Without ensured low variability there will be dips in demand resulting in loss of capacity.
• Efficiency : Low variability ensures limited deviations from the ideal CDA profile to accomplish the required sequencing at TMA entry-point, no control on variability may result in unconstrained loss of flight efficiency.
• Safety : Low variability ensures control on traffic complexity during descent operations, lack of control on variability of demand may result in otherwise avoided tactical manoeuvring.
• Environment : All non flight-efficient manoeuvring in the descent will cost extra fuel, and is preferable avoided on the condition that low variability of demand will not be accomplished by flight inefficient manoeuvring in the en-route flight phase.
200 NM out / 60 min.:
• Time-based or distance based : Both, flight planning and the AMAN, operate on time and therefore time is the preferred dimension, and 200NM out equals roughly 60 min. However, AMAN operational conditions will often be determined by local geographical constraints. If such constraints are applicable, the effective range will be less than 200NM, corresponding with less than 60 min.
• AMAN operational range : AMAN is an interoperable tool; AMAN is able to update an arrival sequence continuously and can make use of planning information with different levels of uncertainty without restrictions to processing but with restrictions to operational relevance. The controller, however, has an interest to assess the planned sequence only if there is operational relevance:
o The accurate flightplan information is complete or fairly complete, o The managed arrival sequence is stable and deserves sufficient confidence
to uplink planning constraints to 4D-equipped flights and to coordinate with neighbouring control centres, and
o The applicable flights are preferably all, or almost all, before their Top-of-Descent (TOD).
Therefore: o All or almost all flights have to be airborne before establishing the arrival
sequence. The under limit can be laid therefore roughly at 40 min. because flights with shorter flight times tend to be replaced by high speed trains.
o If there are flights incidentally not yet airborne and within the applicable time zone, AMAN can reserve an arrival slot based on the planned departure time, accepting the need to re-sequence as soon as the aircraft is airborne; in that case a 4D re-planning is received and the planning uncertainty is suppressed.
Managing low variability of demand (see Figure 29):
• Flow control, information supply : The flow of arriving traffic 200 NM out / -60 min, is as large as the flow of traffic arriving at the airport of interest. It is sufficient therefore to apply accurate flow regulations on airport arrival flows during periods of congestion, which are determined by the declared airport arrival capacity. The Airport
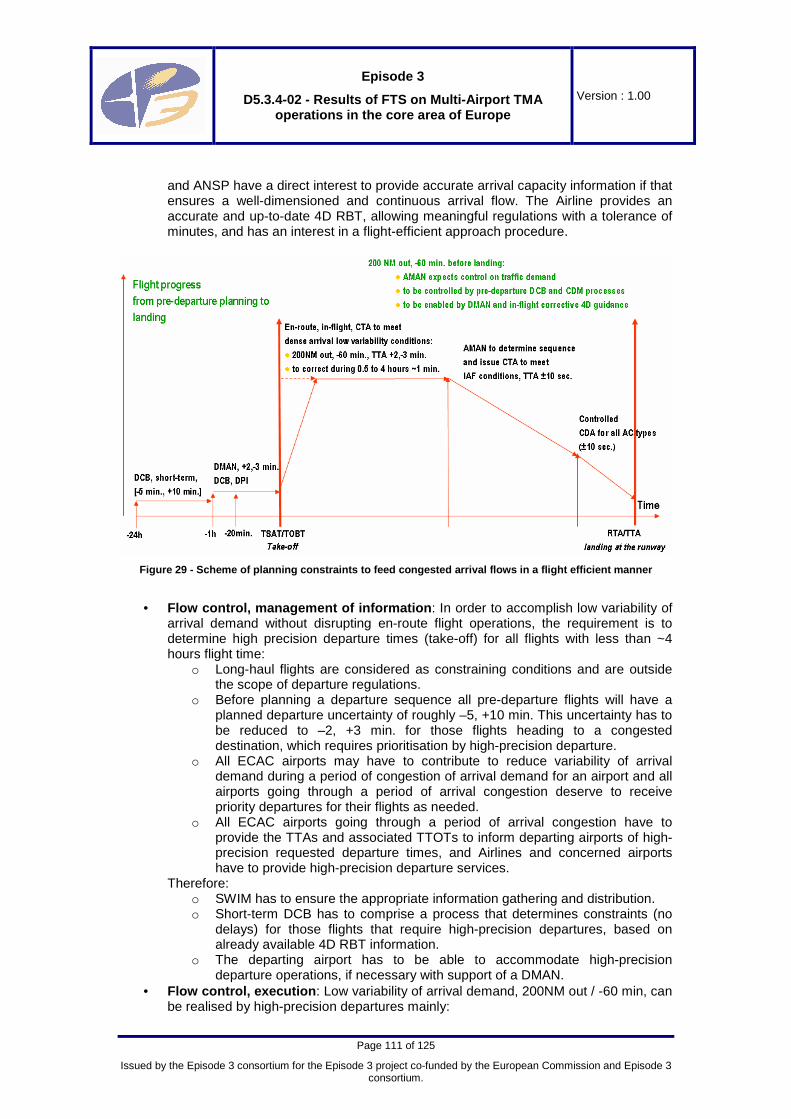
Episode 3
D5.3.4-02 - Results of FTS on Multi-Airport TMA operations in the core area of Europe
Version : 1.00
Page 111 of 125
Issued by the Episode 3 consortium for the Episode 3 project co-funded by the European Commission and Episode 3 consortium.
and ANSP have a direct interest to provide accurate arrival capacity information if that ensures a well-dimensioned and continuous arrival flow. The Airline provides an accurate and up-to-date 4D RBT, allowing meaningful regulations with a tolerance of minutes, and has an interest in a flight-efficient approach procedure.
Figure 29 - Scheme of planning constraints to feed congested arrival flows in a flight efficient manne r
• Flow control, management of information : In order to accomplish low variability of
arrival demand without disrupting en-route flight operations, the requirement is to determine high precision departure times (take-off) for all flights with less than ~4 hours flight time:
o Long-haul flights are considered as constraining conditions and are outside the scope of departure regulations.
o Before planning a departure sequence all pre-departure flights will have a planned departure uncertainty of roughly –5, +10 min. This uncertainty has to be reduced to –2, +3 min. for those flights heading to a congested destination, which requires prioritisation by high-precision departure.
o All ECAC airports may have to contribute to reduce variability of arrival demand during a period of congestion of arrival demand for an airport and all airports going through a period of arrival congestion deserve to receive priority departures for their flights as needed.
o All ECAC airports going through a period of arrival congestion have to provide the TTAs and associated TTOTs to inform departing airports of high-precision requested departure times, and Airlines and concerned airports have to provide high-precision departure services.
Therefore: o SWIM has to ensure the appropriate information gathering and distribution. o Short-term DCB has to comprise a process that determines constraints (no
delays) for those flights that require high-precision departures, based on already available 4D RBT information.
o The departing airport has to be able to accommodate high-precision departure operations, if necessary with support of a DMAN.
• Flow control, execution : Low variability of arrival demand, 200NM out / -60 min, can be realised by high-precision departures mainly:

Episode 3
D5.3.4-02 - Results of FTS on Multi-Airport TMA operations in the core area of Europe
Version : 1.00
Page 112 of 125
Issued by the Episode 3 consortium for the Episode 3 project co-funded by the European Commission and Episode 3 consortium.
o Most airports, but even hub airports must be able to accommodate high-precision departures as long as pre-departure DMAN provides an accurate and reliable planning and as long as there are sufficient facilities to overtake at the holding point or to service priority departures by an extra runway entry-point.
o Low variability can be realised when most flights are departing within a narrow time window and will arrive within the same time window. Outliers departing outside their time window can proceed unimpeded because they are not challenging the objective of low variability as long as there is feed-back on the statistical performance of the achieved variability of demand.
o It is not compulsory to provide en-route ATC services guiding all traffic of congested arrival flows on-time to their designated arrival-flow interception waypoint, because that was not the requirement. However, it is required to guide them to their designated waypoint as good as possible “on-time”, however in acceptable balance with flight-efficiency objectives.
o The Airline (FOC) is able, thanks to SWIM, to monitor the expected arrival demand on the destination airport and is able to decide on the trade-off of optimal cost-index, optimal flight efficiency and possible draw-backs of anticipated congestion problems. The FOC, the flight dispatcher, can decide therefore to change an RTA and to agree on a modified TTA (at destination, modifying estimates over planned waypoints), coordinating with the pilot. The pilot may agree a modified CTA with ATC.
• Flow control, performance monitoring : There is no need to monitor the performance of individual flights regarding their success in meeting their agreed time window, because low variability of arrival demand has performance targets with statistical relevance only, and because the outcome of performance of each individual flight is determined now by a complex and coherent process with many actors involved. However, it is relevant to monitor statistics on performance, which implies a task for the Performance Review Report services. The objective of this task is to provide the information to improve the process in such a way that low variability is achieved when and where needed. Monitoring information may comprise:
o Statistical information on the performance of all airports going through periods of congestion of arrival traffic regarding predictability and punctuality of arriving traffic.
o Statistical information on the performance of departure traffic of all airports servicing high-precision departures regarding predictability and punctuality of these flights.
o Information on the dependency of predictability and punctuality of other operations on high-precision departures and the percentage of these operations.
Step 5: Unconstrained 4D arrival prediction by the aircraft
4D prediction:
• 4D-equiped flights: The confidence level of planning is higher than for non-4D flights, but down-linked planning and ground-based planning have to be compared and decisions on CTA agreements have to be taken at the level of planning tasks. This cost effort.
• Non-4D-equipped flights: Ground-based tools will accomplish the planning of the sequence with not too-much human interaction, however:
o The agreement is missing and has to be accomplished by clearance instructions, and this might be labour intensive,
o The work is moved from short-term planning to executive phase, o The confidence level of planning is not as high as for equipped traffic.
Episode 3
D5.3.4-02 - Results of FTS on Multi-Airport TMA operations in the core area of Europe
Version : 1.00
Page 113 of 125
Issued by the Episode 3 consortium for the Episode 3 project co-funded by the European Commission and Episode 3 consortium.
4D execution, making a CTA:
• Workload : Presumably the workload during descent is not much different under nominal conditions between flying an agreed CTA for 4D flights (monitoring rather than giving any instructions) and non-equipped flights giving one or two clearance instructions, based on advisories from available automation support tools (assumption). However, the workload may increase significantly if complexity increase and flights may deviate more than expected from their planned slot in the arrival sequence.
• Workload: Another possible effect on workload is that non-equipped flights must be advised similarly to 4D flights, but monitored more. There will be probably an increase of workload, because the monitoring tools will not support very well the Controller due to the lower quality of available data information. These effects are to be evaluated in more detail.
Step 9a/9B: Reaching a TMA-entry-point/IAF
30 sec. precision over the TMA-entry-point/IAF:
• Navigation precision : 4D-equiped flights can do better and can realise 10 s. precision. Probably that is needed to operate CDAs, however, their guidance process should be as independent as possible from non-equipped flights, which can be achieved by “staggering” (see below).
• Workload : Less than 30s precision may introduce unfavourable workload and flight inefficiency; however, exact optima can not be determined without experimental validation.
2 min. interval between succeeding flights:
• Achievable minimum distance : This minimum is derived from Monte-Carlo simulation on a simplified model under simplified conditions. Experimental validation has to show which minimum distance is feasible and safe.
Step 10: Applying prescribed CDA
Prescribed CDA:
• Universal procedure : CDA procedures can be defined that can be flown by most aircraft feeding the arrival flows. The prescribed procedure will satisfy the requirements:
o To be within the flight envelope of most aircraft, at least jets, o To be flight-efficient, safe and environmental friendly, and o To allow as high throughput as achievable.
First the SOURDINE project, later OPTIMAL, have specified feasible and appropriate procedures that can be flown from 6000/7000 ft by most aircraft types. These procedures will be adopted.
• Staggering : Staggering after TMA-entry-point towards a merge point can contribute to maximised capacity. The flight guidance during CDA has two objectives:
o Flights are guided towards their planned landing time, and o Flights are required to maintain separation from the preceding flight.
"Staggering" has the objective to avoid dependence on preceding flights as long as possible. The last option for final merging is on the cross-wind leg, or engaging an in-bound turn at an altitude of 3000/4000 ft or above. Staggering is accomplished by alternative selection between two PRNAV tracks. The selection is based on planned traffic feeding the dedicated arrival flows and can be accomplished in an early stage by AMAN.

Episode 3
D5.3.4-02 - Results of FTS on Multi-Airport TMA operations in the core area of Europe
Version : 1.00
Page 114 of 125
Issued by the Episode 3 consortium for the Episode 3 project co-funded by the European Commission and Episode 3 consortium.
• Merging on inbound turn : The controller will have to decide on successful merging at IAF. Either the flight is within the acceptable time-window and the CDA-clearance can be submitted or a non-nominal procedure is initiated.
• Parallel runway operations : CDAs on parallel runways have to be safe, whilst continuous flows have to be facilitated on both runways, independent of each other, at the same time. An option is to separate inbound turns by lateral separation and to descend by different glide-paths (e.g. 3 and 3.5 degrees).
Exception handling:
• Stacking : There is one arrival flow at Final and somewhere there are stacks, probably one per TMA entry-point. Exception handling will make use of one of those stacks, or possibly even a specific overshoot stack area. Headroom capacity has to be ensured in order to be able to feed stacked flights in the regular traffic flow. (A complete design of exception handling procedures is clearly outside the scope.)
Episode 3
D5.3.4-02 - Results of FTS on Multi-Airport TMA operations in the core area of Europe
Version : 1.00
Page 115 of 125
Issued by the Episode 3 consortium for the Episode 3 project co-funded by the European Commission and Episode 3 consortium.
C Annex : Details of Measurements and Analysis
C.1 Introduction
This annex presents the following measurement results:
• Controller activities for four airports • Average flight times for four airports • Average fuel consumption and flown distances for four airports • Arrival sequencing results for four airports • Some specific results for each airport of interest: EHAM, EDDK, EDDL, and EDDK
C.2 Summaries of Controller activities for all four Airports
The required workload to control the traffic is considered as one measure representing the success to organise the traffic in an optimised way. Because the fast-time simulation experiment did not analyse in detail how to adapt the sectorisation, the workload was monitored by counting the controller required activities to control the arriving traffic flows to the hub airports of interest, i.e. Amsterdam Schiphol, Düsseldorf, Köln and Brussels Zaventem, from 200NM out over 24 hours (see also Chapter 4). These activities were related to the following set of activities :
• “Conflicts”, i.e. those activities indicating a possibility to loose separation and that are required to avoid loss of separation.
• “Holdings”, i.e. stacking operations required due to the impossibility to arrive in compliance with the applicable procedure and to make a planned slot in the arrival sequence.
• “Level”, i.e. all activities required to change altitude by a level instruction, required to intercept a landing glide path in a successful way.
• “Vector”, i.e. all activities required to vector a flight in the Baseline scenarios; in the CDA scenarios, all vector instructions were suppressed and flights were forced to land by a CDA or to accept a holding manoeuvre.
• “Entries”, i.e. all activities required to transfer a flight to another sector.
Two remarks can be made considering these measured activities:
1. Due to CDAs most level instructions will disappear. However, more level instructions remained than expected. The reason is that the estimated arrival time was corrected after intercepting the glide path, and due to re-calculation and re-assessment of the planned arrival time, a corrective instruction was calculated. The correction is unnatural for human-controlled activities, but maybe natural for a more automatically controlled guidance and control loop.
2. Due to re-routing without adapting the sectorisation, an increase of sector transfer activities was measured. This increase is unnatural, but the measurements were correct, given the applicable scenario.
The following tables are presented:
• Unconstrained ideal profiles: o Current flows (2008), Baseline event counts versus CDA event counts to
compare workload impact from Baseline to CDA. • Unconstrained ideal profiles:

Episode 3
D5.3.4-02 - Results of FTS on Multi-Airport TMA operations in the core area of Europe
Version : 1.00
Page 116 of 125
Issued by the Episode 3 consortium for the Episode 3 project co-funded by the European Commission and Episode 3 consortium.
o Future flows (2020), Baseline event counts versus CDA event counts to compare workload impact from Baseline to CDA and to compare current traffic demand (2008) with high density future demand (2020).
• Current flows (2008) : o Actual operational conditions, Baseline event counts versus CDA event
counts to compare workload impact from Baseline to CDA. • Current flows (2008):
o Future departure planned operations (DCB), Baseline event counts versus CDA event counts to compare workload impact from Baseline to CDA and to compare actual operational conditions with future departure planned operations (DCB).
• Future flows (2020) : o Actual operational conditions, Baseline event counts versus CDA event
counts to compare workload impact from Baseline to CDA. • Future flows (2020):
o Future departure planned operations (DCB), Baseline event counts versus CDA event counts to compare workload impact from Baseline to CDA and to compare actual operational conditions with future departure planned operations (DCB).
Table 22 - Controller activities, unconstrained id eal profiles, current flow (2008) and future flow ( 2020)

Episode 3
D5.3.4-02 - Results of FTS on Multi-Airport TMA operations in the core area of Europe
Version : 1.00
Page 117 of 125
Issued by the Episode 3 consortium for the Episode 3 project co-funded by the European Commission and Episode 3 consortium.
Table 23 – Controller activities, actual operations compared to DCB (2008 traffic demand)
Table 24 - Controller activities, actual operations compared to DCB (2020 traffic demand)
C.3 Average Flight times for all four Airports
Average flight times were measured for different scenarios under different operational conditions for all four airports:
• Unconstrained ideal profiles • Actual operational conditions • Future departure planned operations (DCB)
The tables compare:
• Baseline operations with CDA operations, and • Current flows (2008) with future flows (2020)

Episode 3
D5.3.4-02 - Results of FTS on Multi-Airport TMA operations in the core area of Europe
Version : 1.00
Page 118 of 125
Issued by the Episode 3 consortium for the Episode 3 project co-funded by the European Commission and Episode 3 consortium.
Table 25 - Average flight times, 4 airports, curren t flows (2008) and future flows (2020)
C.4 Average Fuel consumption and Flown distances fo r all four Airports
Fuel consumption and Flown distances were measured for different scenarios under different operational conditions for all four airports:
• Unconstrained ideal profiles • Actual operational conditions • Future departure planned operations (DCB)
The tables compare:
• Baseline operations with CDA operations, and • Current flows (2008) with future flows (2020)
Table 26 - Fuel consumption and Flown distances for 4 airports, current flows (2008) and future flows (2020)

Episode 3
D5.3.4-02 - Results of FTS on Multi-Airport TMA operations in the core area of Europe
Version : 1.00
Page 119 of 125
Issued by the Episode 3 consortium for the Episode 3 project co-funded by the European Commission and Episode 3 consortium.
C.5 Arrival sequencing results for four Airports an d the individual Airports
Average flight times, Fuel consumption and Flown distances were measured for different scenarios for all four airports:
• DCB emulated (simulating the “DCB emulated” scenario, whilst maintaining the planned sequence and metering on separation)
• Arrival synchronised (simulating DCB emulated, followed by emulation of advanced sequencing with AMAN)
The tables compare:
• Baseline operations with CDA operations, and • Current flows (2008) with future flows (2020)
The tables for all four airports are followed by tables for each individual airport.
Table 27 – Arrival sequencing results for 4 airport s, current flows (2008) and future flows (2020)
Table 28 - Arrival sequencing results for Schiphol Airport, EHAM, current flows (2008) and future flow s (2020)

Episode 3
D5.3.4-02 - Results of FTS on Multi-Airport TMA operations in the core area of Europe
Version : 1.00
Page 120 of 125
Issued by the Episode 3 consortium for the Episode 3 project co-funded by the European Commission and Episode 3 consortium.
Table 29 - Arrival sequencing results for Düsseldor f Airport, EDDL, current flows (2008) and future fl ows (2020)
Table 30 - Arrival sequencing results for Köln Airp ort, EDDK, current flows (2008) and future flows (2 020)

Episode 3
D5.3.4-02 - Results of FTS on Multi-Airport TMA operations in the core area of Europe
Version : 1.00
Page 121 of 125
Issued by the Episode 3 consortium for the Episode 3 project co-funded by the European Commission and Episode 3 consortium.
Table 31 - Arrival sequencing results for Brussels Airport, EBBR, current flows (2008) and future flow s (2020)
C.6 Specific results for Amsterdam Schiphol (EHAM)
Average flight times and Fuel consumption were measured for different scenarios under different operational conditions for Amsterdam Schiphol Airport (EHAM):
• Unconstrained ideal profiles • Actual operational conditions • Future departure planned operations (DCB)
Table 32 - Average flight times measured for Amster dam Schiphol Airport (EHAM)

Episode 3
D5.3.4-02 - Results of FTS on Multi-Airport TMA operations in the core area of Europe
Version : 1.00
Page 122 of 125
Issued by the Episode 3 consortium for the Episode 3 project co-funded by the European Commission and Episode 3 consortium.
Table 33 - Fuel consumption measured for Amsterdam Schiphol Airport (EHAM)
C.7 Specific results for Düsseldorf Airport (EDDL)
Average flight times and Fuel consumption were measured for different scenarios under different operational conditions for Düsseldorf Airport (EDDL):
• Unconstrained ideal profiles • Actual operational conditions • Future departure planned operations (DCB)
Table 34 - Average flight times measured for Düssel dorf Airport (EDDL)
Table 35 - Fuel consumption measured for Düsseldorf Airport (EDDL)
C.8 Specific results for Köln Airport (EDDK)
Average flight times and Fuel consumption were measured for different scenarios under different operational conditions for Köln Airport (EDDK):
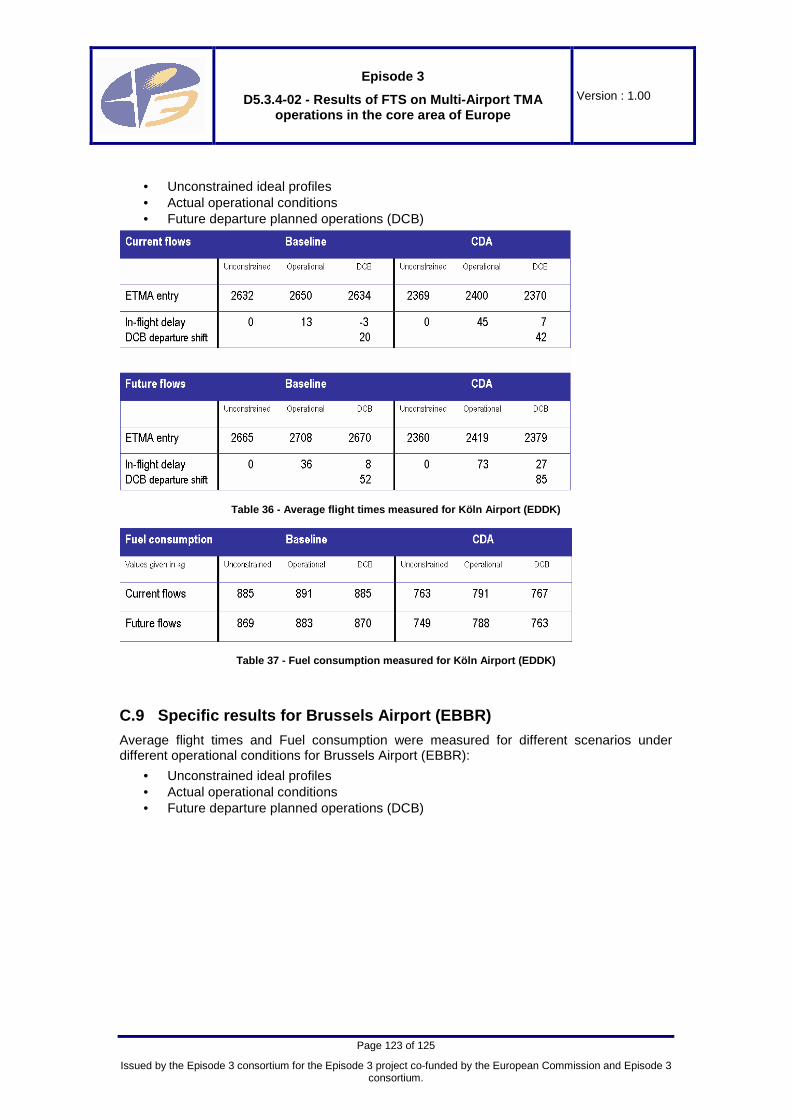
Episode 3
D5.3.4-02 - Results of FTS on Multi-Airport TMA operations in the core area of Europe
Version : 1.00
Page 123 of 125
Issued by the Episode 3 consortium for the Episode 3 project co-funded by the European Commission and Episode 3 consortium.
• Unconstrained ideal profiles • Actual operational conditions • Future departure planned operations (DCB)
Table 36 - Average flight times measured for Köln A irport (EDDK)
Table 37 - Fuel consumption measured for Köln Airpo rt (EDDK)
C.9 Specific results for Brussels Airport (EBBR)
Average flight times and Fuel consumption were measured for different scenarios under different operational conditions for Brussels Airport (EBBR):
• Unconstrained ideal profiles • Actual operational conditions • Future departure planned operations (DCB)

Episode 3
D5.3.4-02 - Results of FTS on Multi-Airport TMA operations in the core area of Europe
Version : 1.00
Page 124 of 125
Issued by the Episode 3 consortium for the Episode 3 project co-funded by the European Commission and Episode 3 consortium.
Table 38 - Average flight times measured for Brusse ls Airport (EBBR)
Table 39 - Fuel consumption measured for Brussels A irport (EBBR)

Episode 3
D5.3.4-02 - Results of FTS on Multi-Airport TMA operations in the core area of Europe
Version : 1.00
Page 125 of 125
Issued by the Episode 3 consortium for the Episode 3 project co-funded by the European Commission and Episode 3 consortium.
END OF DOCUMENT