epi data brief - welcome to nyc.gov | city of new york data brief sources: nyc dohmh bureau of vital...
TRANSCRIPT

Suicides in New York City, 2000 to 2014 Suicide rates in New York City (NYC) declined in the 1990s, but have steadily increased in the last decade. While crude homicide rates in NYC declined 41.7% between 2005 and 2014, crude suicide rates rose 11.7%, exceeding the rate of homicides.1 In 2014, 565 suicides were reported in NYC. This report describes trends in suicides, and examines demographic characteristics of persons who commit suicide and methods of suicide.
New York City suicide rates are rising • The rate of suicide in NYC increased from 5.5 in
2000 to 6.3 per 100,000 people in 2014, with an average annual increase of 2.3% per year between 2008 and 2014. This mirrors the increase nationwide (10.4 in 2000, and 13.0 in 2014), however, rates in NYC remain about half of the national rate.2
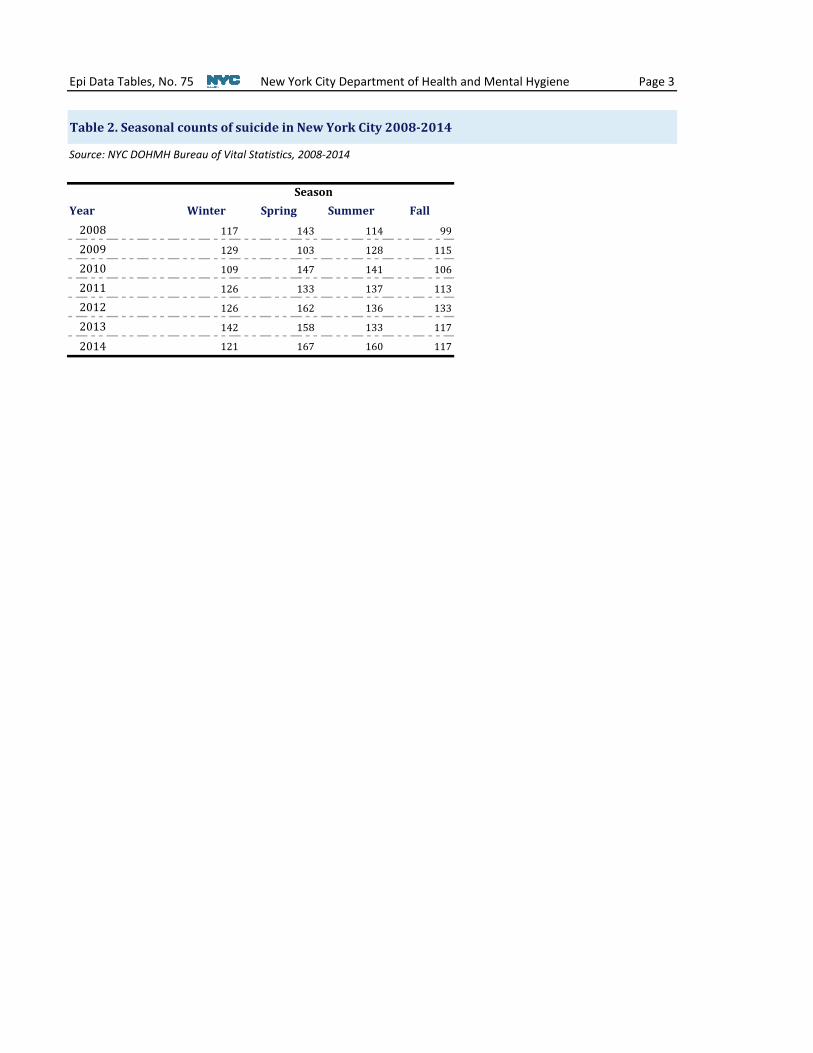
• Between 2008 and 2014, suicides in NYC have generally peaked in the spring (April, May, June), consistent with national seasonal patterns.3
• Males continue to represent the majority of suicides, with 393 suicides by NYC males in 2014, compared with 172 suicides by females.
• Since 2000, rates among females have increased 56%, with an average annual increase of 1.7% per year between 2000 and 2014. Rates among NYC males have remained steady. Nationally, rates among both males and females have steadily increased.2
• In NYC, suicide rates remained highest and continued to increase among White males from 2000 to 2014 (11.7 vs. 13.4 per 100,000 males). Rates also increased among White females (from 3.2 in 2000 to 5.3 per 100,000 females in 2014), and Asian/Pacific Islanders overall (3.3 in 2000 to 6.1 per 100,000 in 2014).
New York City Department of Health and Mental Hygiene September 2016, No. 75
Epi Data Brief
Sources: NYC DOHMH Bureau of Vital Statistics, 2000-2014; Curtin SC, Warner M, Hedegaard H. Increase in suicide in the United States, 1999–2014. NCHS data brief, no 241. Hyattsville, MD: National Center for Health Statistics. 2016
0.0
5.0
10.0
15.0
20.0
25.0
Rate
per
100
,000
peo
ple
US Male
US Overall NYC Male
NYC Overall US Female NYC Female
Suicide rate, by sex, New York City and US, 2000-2014
0.0
2.0
4.0
6.0
8.0
10.0
2000 2014
Rate
per
100
,000
peo
ple
Asian/Pacific Islander Black Hispanic/Latino WhiteAsian/Pacific Islander, Black, and White races exclude Hispanic/Latino ethnicity. Source: NYC DOHMH Bureau of Vital Statistics, 2000-2014
Suicide rate by race/ethnicity, New York City, 2000 and 2014
Definitions: Suicide is defined as death caused by self-directed injurious behavior with an intent to die. Race/ethnicity: White, Black, and Asian/Pacific Islander race categories exclude Hispanic/ Latino ethnicity. United Hospital Fund (UHF) nighborhood: UHF classifies New York City into 42 neighborhoods, comprised of contiguous zip codes. Neighborhood poverty: Based on ZIP code and defined as percentage of residents with incomes below 100% of the federal poverty level (FPL), per American Community Survey 2009-2013, in four groups: low (<10% FPL), medium (10 %-< 20% FPL), high (20 %-< 30% FPL), and very high (≥30% FPL).

Epi Data Brief, No. 75 Page 2
• Suicide rates among women remained the highest for ages 45 to 64, consistent with national data.2 The rate among this group increased, from 4.0 to 6.0 per 100,000 women from 2000 to 2014.
• Historically, NYC men ages 65 and over have had the highest suicide rate, but in 2014 this was surpassed by men ages 45-64, which increased to 13.9 from 12.7 per 100,000 men in 2000.
• Rates among NYC men ages 18 to 24 decreased, from 12.6 to 8.6 per 100,000 men from 2000 to 2014.
• Although based on small numbers, suicides increased among NYC girls ages, 5 to 17, from two in 2000 to eight in 2014. Hispanic/Latina girls completed zero suicides in 2000, and three suicides in 2014. Suicides among boys ages 5 to 17 remained steady, from eight in 2000 to six in 2014.+
• Men and women ages 85 and over accounted for a small number of suicides in NYC. However, suicides increased among both groups, from four to ten among men between 2000 and 2014, and from three to eight among women.+
Hanging, strangulation and suffocation suicides are on the rise • The two leading methods of suicide
among all New Yorkers in 2014 were hanging, strangulation, and suffocation, and jumping from a high place.
• Suicides due to hangings, strangulations, and suffocations increased in number (from 130 to 234), making up an increasing proportion of total suicides (from 29% in 2000 to 41% in 2014). This increase was seen among both males and females in NYC and nationwide.2
• In 2014, hanging, strangulation, and suffocation suicides represented the majority of suicides among NYC girls and boys, ages 5 to 17.+
• In 2014, hanging, strangulation and suffocation suicides represented nearly 50% of suicides among Asian/Pacific Islander and Hispanic/Latino New Yorkers.
• Jumping from a high place represented the most prevalent method (39%) of suicide completion among NYC females in 2000 but has since decreased (22% in 2014). In 2014, the proportion of suicides attributable to jumping from a high place among both females and males in NYC was about eight times the proportion nationwide (females: 22% in NYC, 2.8% nationwide; males: 18% in NYC, 2.2% nationwide).2
• The proportion of suicides due to firearms decreased in NYC between 2000 and 2014 (15% to 10%), consistent with a national decline. Firearms were less prevalent as a method of suicide in NYC, in contrast to the US overall2 where suicide due to firearms represented half of all suicides in 2014.
0 100 200 300 400
Males in 2014
Males in 2000
Females in 2014
Females in 2000
Count FirearmJumping from a high placeJumping or lying before moving objectOtherPoisoningHangings, strangulations, and suffocations
Other methods include: drowning and submersion; explosive material; smoke, fire, and flames; steam, hot vapors and hot objects; sharp object; blunt object; crashing of motor vehicle, other specified means, unspecified means, sequelae of intentional self-harm. Source: NYC DOHMH Bureau of Vital Statistics, 2000-2014
Suicides by method, New York City, 2000 and 2014
0.0
2.0
4.0
6.0
8.0
10.0
12.0
14.0
5-17 18-24 25-44 45-64 65+
Rate
per
100
,000
peo
ple
Age Group Males in 2000 Males in 2014 Females in 2000 Females in 2014
+ Interpret rates with caution due to the small number of events. Source: NYC DOHMH Bureau of Vital Statistics, 2000-2014
Rate of suicides by age and sex, New York City, 2000 and 2014
+ + + +
+ +
+Interpret rates with caution due to the small number of events.
New York City Department of Health and Mental Hygiene September 2016

Epi Data Brief, No. 75 Page 3
Authored by: Angeline Protacio, Christina Norman Acknowledgements: Gary Belkin, Myla Harrison, Catherine Stayton, Mary Huynh, Marivel Davila, Kinjia Hinterland, Andrew Powell, Yiwei Gu Suggested citation: Protacio A, Norman C. Suicides in New York City, 2000-2014. Department of Health and Mental Hygiene: Epi Data Brief (75); September 2016.
MORE New York City Health Data and Publications at nyc.gov/health/data Visit EpiQuery – the Health Department’s online, interactive health data system at nyc.gov/health/EpiQuery
The rate of suicide increased in Manhattan and Queens in 2014 • Within the five boroughs of NYC, suicide rates in Manhattan and Queens
increased from 2000 to 2014 (in Manhattan, from 5.7 to 7.6 per 100,000; in Queens, from 4.3 to 5.7 per 100,000). In Manhattan and Queens, rates increased for both sexes, and among Asian/Pacific Islanders and Whites. Overall rates in other boroughs remained stable.
• In 2012 to 2014, neighborhoods where 10-20% of residents had an income below the Federal Poverty Level (FPL) had the highest rate of suicide, with 7.8 per 100,000 people. Neighborhoods where less than 10% of residents had an income below the FPL had the lowest rate of suicide, with 3.8 per 100,000 people.
Count of suicides and area based poverty level by United Hospital Fund neighborhood, New York City, 2012-2014
The United Hospital Fund classifies NYC into 42 neighborhoods, comprised of contiguous ZIP codes. Neighborhood poverty level (based on ZIP code) defined as percent of residents with incomes below 100% of the Federal Poverty Level, per American Community Survey 2009-2013, in four groups: low/wealthiest (<10%), medium (10 %-< 20%), high (20 %-< 30%), and very high/poorest (>=30%). Sources: NYC DOHMH Bureau of Vital Statistics, 2012-2014; American Community Survey, 2009-2013
Data Sources: NYC DOHMH Bureau of Vital Statistics 2000-2014: Mortality data on cause of death are classified using ICD10 codes. Suicides are coded U03, X60-X84, and Y87.0. Method of suicide is categorized using the following codes: firearm (X72-X74), hanging, strangulation, and suffocation (X70), poisoning (X60-X69), jumping from a high place (X80), jumping or lying before moving object (X81), and other methods (X71, X75-X79, X82-X84, Y87, U03). NYC Department of Health and Mental Hygiene Population Estimates modified from US Census Bureau intercensal population estimates 2000-2014, updated October 2015, were used for denominators in rate calculations. Note: All non age-specific rates are age-adjusted, and include the entire population in the denominator. Age-specific rates include only the relevant ages.
References: 1Li W, Huynh M, Lee E, Lasner-Frater L, Castro A, Kelley D, Kennedy J, Maduro G, Sebek K, Sun Y, Van Wye G. Summary of Vital Statistics, 2014. New York, NY: New York City Department of Health and Mental Hygiene, Office of Vital Statistics, 2016. 2Curtin SC, Warner M, Hedegaard H. Increase in suicide in the United States, 1999-2014. NCHS data brief, no 241. Hyattsville, MD: National Center for Health Statistics. 2016. 3Holiday Suicides: Fact or Myth?; Centers for Disease Control and Prevention, National Center for Injury Prevention and Control, Division of Violence Prevention http://www.cdc.gov/violenceprevention/suicide/holiday.html accessed August 19, 2016.
New York City Department of Health and Mental Hygiene September 2016

Table 1.
Table 2.
Table 3.
Table 4.
Table 5.
Table 6.
Table 7.
Suicide counts and rates in New York City 2000-2014
Epi Data Tables New York City Department of Health and Mental Hygiene September 2016, No. 75
Suicides in New York City, 2000 to 2014Data Tables
Data Sources
NYC DOHMH Bureau of Vital Statistics 2000-2014: Mortality data on cause of death are classified using ICD10 codes. Suicide deaths are coded U03, X60-X84, and Y87.0. Method of suicide is categorized using the following codes: firearm (X72-X74), hanging, strangulation, and suffocation (X70), poisoning (X60-X69), jumping from a high place (X80), jumping or lying before moving object (X81), and other methods (X71, X75-X79, X82-X84, Y87).NYC Department of Health and Mental Hygiene Population Estimates, modified from US Census Bureau intercensal population estimates 2000-2014, updated October 2015, were used for denominators in rate calculations.American Community Survey 2009-2013: Neighborhood poverty is based on ZIP code and is defined as the percentage of residents with incomes below 100% of the Federal Poverty Level, per American Community Survey 2009-2013, in four groups: low/wealthiest (<10%), medium (10 %-< 20%), high (20 %-< 30%), and very high/poorest (>=30%).
Seasonal counts of suicide in New York City 2008-2014
Suicide counts and percentages by method in New York City, 2000 and 2014
Suicide counts and rates by race in New York City, 2000 and 2014
Suicide counts and rates by age category in New York City, 2000 and 2014
Suicide counts and rates by borough in New York City, 2000 and 2014
Suicide counts by United Hospital Fund neighborhood in New York City, 2012-2014

Epi Data Tables, No. 75 New York City Department of Health and Mental Hygiene Page 2
Table 1. Suicide counts and rates in New York City 2000-2014
Source: NYC DOHMH Bureau of Vital Statistics, 2000-2014; NYC Department of Health and Mental Hygiene Population Estimates, August 2014.
YearCount of suicides(Total)
Count of suicides
(Females)
Count of suicides(Males)
Crude rate (Total)
Crude rate (Females)
Crude rate (Males)
Age-adjusted
rate (Total)
Age-adjusted
rate (Females)
Age-adjusted
rate (Males)
2000 448 99 349 5.6 2.3 9.2 5.5 2.3 9.42001 462 120 342 5.7 2.8 8.9 5.6 2.7 9.12002 495 129 366 6.1 3.0 9.5 6.0 2.9 9.52003 483 136 347 6.0 3.2 9.0 5.9 3.0 9.32004 493 122 371 6.1 2.9 9.7 5.9 2.7 9.72005 481 123 358 6.0 2.9 9.4 5.8 2.8 9.32006 459 115 344 5.7 2.7 9.0 5.5 2.6 9.02007 477 133 344 5.9 3.1 9.0 5.7 2.9 8.92008 473 125 348 5.8 2.9 9.0 5.6 2.8 8.92009 475 115 360 5.8 2.7 9.3 5.5 2.5 9.02010 503 129 374 6.1 3.0 9.5 5.8 2.8 9.22011 509 128 381 6.1 2.9 9.7 5.8 2.8 9.42012 557 163 391 6.7 3.7 9.8 6.3 3.5 9.62013 550 146 404 6.5 3.3 10.0 6.2 3.1 9.82014 565 172 393 6.7 3.9 9.7 6.3 3.6 9.4
Epi Data Tables, No. 75 New York City Department of Health and Mental Hygiene Page 3
Table 2. Seasonal counts of suicide in New York City 2008-2014
Source: NYC DOHMH Bureau of Vital Statistics, 2008-2014
Year Winter Spring Summer Fall2008 117 143 114 99
2009 129 103 128 115
2010 109 147 141 106
2011 126 133 137 113
2012 126 162 136 133
2013 142 158 133 117
2014 121 167 160 117
Season

Epi Data Tables, No. 75 New York City Department of Health and Mental Hygiene Page 4
Table 3. Suicide counts and percentages by method in New York City, 2000 and 2014
Source: NYC DOHMH Bureau of Vital Statistics, 2000 and 2014
Count of total
suicides
Count of suicides
(Females)
Count of suicides(Males)
Percent of total suicides
Percent of total
suicides(Females)
Percent of total
suicides(Males)
Count of total
suicides
Count of suicides
(Females)
Count of suicides(Males)
Percent of total
suicides
Percent of total
suicides(Females)
Percent of total
suicides(Males)
Hanging, Strangulation,
Suffocation130 24 106 29.0% 24.2% 30.4%
Hanging, Strangulation,
Suffocation234 73 161 41.4% 42.4% 41.0%
Jumping from a high place 119 39 80 26.6% 39.4% 22.9% Jumping from a
high place 107 37 70 18.9% 21.5% 17.8%
Poisoning 65 24 41 14.5% 24.2% 11.7% Poisoning 83 41 42 14.7% 23.8% 10.7%Firearm 69 4 65 15.4% 4.0% 18.6% Firearm 55 4 51 9.7% 2.3% 13.0%
Other 37 5 32 8.3% 5.1% 9.2% Other 54 10 44 9.6% 5.8% 11.2%Jumping before
moving object 28 3 25 6.3% 3.0% 7.2% Jumping before moving object 32 7 25 5.7% 4.1% 6.4%
20142000
Method Method

Epi Data Tables, No. 75 New York City Department of Health and Mental Hygiene Page 5
Table 4. Suicide counts and rates by race in New York City, 2000 and 2014
Race Count of suicides Crude rate
Age-adjusted
rate
Count of suicides Crude rate
Age-adjusted
rateAsian/Pacific-Islander
Overall 28 3.4 3.3 78 6.5 6.1Female 8 1.9 1.7* 28 4.5 4.2Male 20 4.8 5.1 50 8.7 8.3
Non-Hispanic BlackOverall 86 4.2 4.3 84 4.4 4.3Female 15 1.3 1.3* 22 2.1 2Male 71 7.9 8.2 62 7.2 7.2
HispanicOverall 86 3.9 4.5 98 4 4Female 17 1.5 1.6 29 2.3 2.2Male 69 6.6 8.4 69 5.8 6
Non-Hispanic WhiteOverall 235 8.2 7.3 289 10.5 9.2Female 57 3.8 3.2 85 6 5.3Male 178 12.9 11.7 204 15.2 13.4
20142000
*Gray-shaded cells: Interpret with caution. The rate's Relative Standard Error (a measure of precision) is between 25% and 50%, making the rate potentially unreliable.
Source: NYC DOHMH Bureau of Vital Statistics, 2000 and 2014; NYC Department of Health and Mental Hygiene Population Estimates, August 2014.

Epi Data Tables, No. 75 New York City Department of Health and Mental Hygiene Page 6
Table 5. Suicide counts and rates by age category in New York City, 2000 and 2014
Age Category Count of suicides
Crude rate
Count of suicides Crude rate
Ages 5-17Overall 10 0.5 14 0.8Female ^ ^ 8 0.9Male 8 0.8 6 0.7
Ages 18-24Overall 59 7.3 48 5.8Female 9 2.2 13 3.1Male 50 12.6 35 8.6
Ages 25-44Overall 173 6.6 211 7.9Female 34 2.5 56 4Male 139 10.9 155 11.9
Ages 45-64Overall 136 8 202 9.7Female 37 4 66 6Male 99 12.7 136 13.9
Ages 65+Overall 70 7.4 90 8.2Female 17 2.9 29 4.4Male 53 14.7 61 13.7
Source: NYC DOHMH Bureau of Vital Statistics, 2000 and 2014; NYC Department of Health and Mental Hygiene Population Estimates, August 2014.
2000 2014
*Gray-shaded cells: Interpret with caution. The rate's Relative Standard Error (a measure of precision) is between 25% and 50%, making the rate potentially unreliable.^Rates with a relative standard error (a measure of percision) >50% are unreliable and counts and rates have been suppressed.

Epi Data Tables, No. 75 New York City Department of Health and Mental Hygiene Page 7
Table 6. Suicide counts and rates by borough in New York City, 2000 and 2014
Borough Count of suicides
Crude rate
Age-adjusted
rate
Count of suicides Crude rate Age-adjusted
rate
Bronx
Overall 59 4.4 4.7 66 4.6 4.5
Female 11 1.5 1.6* 18 2.4 2.3
Male 48 7.7 8.6 48 7.1 7.3
Brooklyn
Overall 112 4.5 4.6 125 4.8 4.6Female 22 1.7 1.7 36 2.6 2.5Male 90 7.8 8.3 89 7.2 7.2
Manhattan
Overall 95 6.2 5.7 138 8.4 7.6Female 31 3.8 3.4 53 6.1 5.6Male 64 8.8 8.4 85 11 9.8
QueensOverall 98 4.4 4.3 141 6.1 5.7Female 22 1.9 1.8 36 3 2.8Male 76 7.1 7 105 9.3 8.9
Staten IslandOverall 25 5.6 5.6 29 6.1 5.7Female ^ ^ ^ 12 4.9 4.3*Male 21 9.8 9.6 17 7.4 7.1
^Rates with a relative standard error (a measure of percision) >50% are unreliable and counts and rates have been suppressed.
2000 2014
Source: NYC DOHMH Bureau of Vital Statistics, 2000 and 2014; NYC Department of Health and Mental Hygiene Population Estimates, August 2014.
*Gray-shaded cells: Interpret with caution. The rate's Relative Standard Error (a measure of precision) is between 25% and 50%, making the rate potentially unreliable.

Epi Data Tables, No. 75 New York City Department of Health and Mental Hygiene Page 8
Table 7. Suicide counts by United Hospital Fund neighborhood in New York City, 2012-2014
Source: NYC DOHMH Bureau of Vital Statistics, 2012-2014 +
Borough United Hospital Fund neighborhood number
United Hospital Fund neighborhood name Count
Bronx101 Kingsbridge - Riverdale 23102 Northeast Bronx 26103 Fordham - Bronx Park 37104 Pelham - Throgs Neck 51105 Crotona - Tremont 27106 High Bridge - Morrisania 38107 Hunts Point - Mott Haven 16
Brooklyn201 Greenpoint 19202 Downtown - Heights - Slope 36203 Bedford Stuyvesant - Crown Heights 35204 East New York 16205 Sunset Park 18206 Borough Park 49207 East Flatbush - Flatbush 32208 Canarsie - Flatlands 23209 Bensonhurst - Bay Ridge 36210 Coney Island - Sheepshead Bay 57211 Williamsburg - Bushwick 40
Manhattan301 Washington Heights - Inwood 66302 Central Harlem - Morningside Heights 22303 East Harlem 22304 Upper West Side 66305 Upper East Side 67306 Chelsea - Clinton 57307 Gramercy Park - Murray Hill 29308 Greenwich Village - Soho 12309 Union Square, Lower East Side 52310 Lower Manhattan 11
Queens401 Long Island City - Astoria 36402 West Queens 83403 Flushing - Clearview 63404 Bayside - Littleneck 16405 Ridgewood - Forest Hills 73406 Fresh Meadows 14407 Southwest Queens 56408 Jamaica 37409 Southeast Queens 19410 Rockaway 21
Staten Island 501 Port Richmond 14502 Stapleton - St. George 17503 Willowbrook 20504 South Beach - Tottenville 40
The United Hospital Fund classifies NYC into 42 neighborhoods, comprised of contiguous ZIP codes.
http://www1.nyc.gov/assets/doh/downloads/pdf/ah/zipcodetable.pdf
+Data from multiple years were collapsed to reduce statistic instability due to small samples.
*Gray-shaded cells: Interpret with caution. The Relative Standard Error (a measure of precision) is between 25% and 50%, making the count potentially statistically unstable.