nyc dohmh community health survey atlas york city department of health and mental hygiene ... upper...
TRANSCRIPT
New York City
Community Health Survey Atlas
2010 0

1
This page is intentionally left blank

GIS Center, Bureau of Epidemiology Services New York City Department of Health and Mental Hygiene
42-09 28th Street | Long Island City, NY 11101
Suggested citation: Buchholz N., Resnick S., Konty K. The New York City Community Health Survey Atlas, 2010. The New York City Department of Health and Mental Hygiene, 2012. Acknowledgements: Gretchen Culp, Donna Eisenhower, Carolyn Greene, Tiffany Harris, Susan Kansagra, Christa Myers, Jennifer Norton, & Carolyn Olson.

Table of Contents
Introduction & Context 4-9 New York City Community Health Survey 4 Interpreting the Maps 5 New York City Boroughs 6 Neighborhood Index: United Health Hospital Fund (UHF) 7 Neighborhood Index: Zip Codes per UHF 8 Race/Ethnicity & Poverty 9
General Physical & Mental Health 10 Self-Reported Health Status 10 History of Depression 10 Mental Health Counseling or Treatment 10 Counseling & History of Depression 10
Weight, Exercise, & Nutrition 11-14 Exercise 11 Stair Use 11 Walked/Cycled for Transportation 11 Rode Bicycle in the Past Year 11
Obesity 12 Childhood Obesity 12 Sugar-Sweetened Beverage (SSB) Consumption 12 SSBs Consumption & Obesity 12
Fruit & Vegetable Consumption 13 Distance to Fresh Fruits & Vegetables 13 Add Salt at Table 13 Self-Reported Healthy Diet 13
Spotlight on Sugar Sweetened Beverage Consumption 14
Access to Health Care 16 No Health Insurance 16 Flu Vaccination 16 Cholesterol Screening & No Insurance 16 Cervical Cancer Screening & No Insurance 16
Cigarette Smoking & Alcohol 17-18 Smoking Status 17 Non-Smokers with Smoke-Free Home Policy 17 Binge Drinking 17 Smoking Status & Binge Drinking 17
Spotlight on Smoking Trends 18
Asthma 19 Asthma Ever 19 Asthma Emergency Department Visits 19 Asthma & Smoking Status 19 Asthma ED Visits & No Insurance 19
Chronic Conditions 15 High Blood Pressure Ever 15 Diabetes Ever 15 Cholesterol Screening 15 High Cholesterol Ever 15
HIV Testing & Sexual Behavior 20 HIV Testing 20 Condom Use Last Sex 20 Men Who Had Sex with Men 20 Women Who Had Sex with Women 20 Cancer Screening 21 Colon Cancer Screening (Timely Colonoscopy) 21 Cervical Cancer Screening (Timely Pap Test) 21 Breast Cancer Screening (Timely Mammography) 21 Cervical & Breast Cancer Screening 21
Appendix: CHS Questions 22-23
3

borhoods in NYC, each defined by adjoining zip codes. To increase statistical power after the survey was conducted, several neighborhoods were combined, resulting in the 34 neighborhoods shown in this report.
The total analytic sample in 2010 was 8,665 interviews, with a landline response rate of 37% and a cooperation rate of 87%. The cellular response rate was 46%, with a cooperation rate of 96% (all rates are AAPOR third definition).*
In order to appropriately analyze CHS data, a weight is applied to each record. The weight is calculated from the inverse probability of selection by a post-stratification procedure that ensures the sample matches population control totals within UHFs by age, gender, and race. Starting in 2009, responses were also weighted to account for the distribution of the adult population comprising three telephone usage categories (landline only, landline and cell, cell only) using data from the 2008 New York City Housing and Vacancy Survey.
For more information and survey questionnaires: http://www.nyc.gov/html/doh/html/survey/survey.shtml
New York City Community Health Survey Background
The New York City Community Health Survey (CHS) is a telephone survey conducted annually by the NYC Department of Health and Mental Hygiene (DOHMH), Division of Epidemiology, Bureau of Epidemiology Services. The CHS provides robust data on the health of New Yorkers, including both neighborhood and citywide estimates on a broad range of chronic diseases and behavioral risk factors.
The CHS has approximately 125 questions, covering a range of health topics: general health status and mental health, health care access, cardiovascular health, diabetes, asthma, immunizations, nutrition and physical activity, smoking, HIV, sexual behavior, alcohol consumption, cancer screening and other health topics. A core group of demographic and health variables are included every year to facilitate weighting and comparisons among different groups of New Yorkers over time.
Methods The CHS is modeled after the National Behavioral Risk Factor
Surveillance System (BRFSS), conducted by the Centers for Disease Control and Prevention. The CHS is a cross-sectional survey that samples adults ages 18 and older from all five boroughs of New York City: the Bronx, Brooklyn, Manhattan, Staten Island, and Queens. A computer-assisted telephone interviewing (CATI) system is used to collect survey data, and the interviews are conducted in a variety of languages. All data collected are self-report. CHS has included adults with landline phones since 2002 and, from 2009, has included adults who can be reached only by cellphone.
The CHS 2010 used a non-overlapping, dual-frame sample design. The first sampling frame consisted of landline residential telephone numbers, the second frame consisted of telephone numbers from cellular exchanges covering New York City. The design is non-overlapping because in the cellular frame, adults living in the households with landline telephones were screened out. Landline interviews were also stratified using the United Hospital Fund’s (UHF) neighborhood definitions. There are 42 UHF neigh-
* The American Association for Public Opinion Research. 2009. Standard definitions: Final Dispositions of Case Codes and Outcome Rates for Surveys. 6th edition. Lenexa, Kansas: AAPOR.
Introduction
Neighborhood Definition: What is a UHF?
UHF stands for United Hospital Fund In New York City, there are 42 UHF neighborhoods, each made up of adjoining
zip codes (see pages 6-7 for maps and a list of UHFs and their zip codes)
34 neighborhoods are shown in this report (several neighborhoods were combined to increase statistical power)
Introduction & Context 4

Community Health Survey Data Display The data for each indicator on the maps in the 2010 Community Health Survey Atlas is divided into quartiles (the total frequency of the sample is divided into four equal proportions.). All maps include age-adjusted percentages standardized to the Year 2000 U.S. Standard Population, except for Census maps on page 9. Darker color gradients and larger circle size represent higher percentages for a given variable. Hatching patterns represent unreliable estimates and should be interpreted with caution. Estimates are considered unreliable if the Relative Standard Error (a measure of estimate precision) is greater than 30%, or the sample size is too small. Areas where no estimate would be calculated or that are not covered by a UHF neighborhood (e.g., Central Park) are identified as white areas and outlined in light gray. The maps are designed to allow readers to copy any given map and paste it into another document.
Data Sources
All of the maps in this atlas display data from the 2010 Community Health Survey, except for the Childhood Obesity map (page 11), which displays NYC FITNESSGRAM (school year 2010-11) data. The DOHMH and the Department of Education use NYC FITNESSGRAM to measure public school children’s weight and height, as well as their fitness. Data is limited to grades K-8, ages 5-14, NYC school districts 1-32. Observations with missing gender or date of birth, or with biologically implausible height, weight or BMI values were not included in these estimates. Data are weighted to be representative of the NYC public school population for 2010-11. For more information on the NYC FITNESSGRAM data visit: http://schools.nyc.gov/Academics/FitnessandHealth/NycFitnessgram/NYCFITNESSGRAM.htm
Maps containing 2010 data not included in the Atlas can be produced using the EpiQuery site: www.nyc.gov/health/epiquery
Interpreting the Maps
Introduction & Context 5
Lower Higher Percentages
Unreliable data (interpret with caution)
LaGuardia & JFK Airports, Central Park
(Not covered by a UHF neighborhood)
Source: NYC Community Health Survey, 2010 Bureau of Epidemiology services, NYC DOHMH

Brooklyn Total Population (2010): 2,504,700
Median household income (2006-2010): $43,567 42.8% Non-Hispanic White | 34.3% Non-Hispanic Black
10.5% Asian | 19.8% Hispanic
Staten Island Total Population (2010): 468,730 Median household income (2006-2010): $71,084 72.9% Non-Hispanic White | 10.6% Non-Hispanic Black 7.5% Asian | 17.3% Hispanic
Manhattan Total Population (2010): 1,585,873
Median household income (2006-2010) : $64,971 57.4% Non-Hispanic White | 15.6% Non-Hispanic Black
11.3% Asian | 25.4% Hispanic
Queens Total Population (2010): 2,230,722 Median household income (2006-2010): $55,291 39.7% Non-Hispanic White | 19.1% Non-Hispanic Black 22.9% Asian | 27.5% Hispanic
New York City Boroughs
Bronx Total Population (2010): 1,385,108 Median household income (2006-2010) : $34,264 27.9% Non-Hispanic White | 36.5% Non-Hispanic Black 3.6% Asian | 53.3% Hispanic
Source: U.S. Census Bureau, 2010 Census. Public Law 94-171 Redistricting Files. Population Division.
New York City Department of City Planning (March 2011) ACS 2006-2011.
Introduction & Context 6

UHF Code UHF Neighborhood Borough 101 Kingsbridge - Riverdale Bronx 102 Northeast Bronx Bronx 103 Fordham - Bronx Park Bronx 104 Pelhem - Throgs Neck Bronx
105106107 South Bronx Bronx 201 Greenpoint Brooklyn 202 Downtown - Heights - Slope Brooklyn 203 Bedford Stuyvesant Brooklyn 204 East New York Brooklyn 205 Sunset Park Brooklyn 206 Borough Park Brooklyn 207 East Flatbush - Flatbush Brooklyn 208 Canarsie - Flatlands Brooklyn 209 Bensonhurst - Bay Ridge Brooklyn 210 Coney Island - Sheepshead Bay Brooklyn 211 Williamsburg - Bushwick Brooklyn 301 Washington Heights - Inwood Manhattan 302 Central Harlem - Morningside Manhattan 303 East Harlem Manhattan 304 Upper West Side Manhattan
305307 Upper East Side-Gramercy Manhattan 306308 Chelsea-Village Manhattan 309310 Union Square, Lower
Manhattan Manhattan
401 Long Island City - Astoria Queens 402 West Queens Queens 403 Flushing - Clearview Queens 405 Ridgewood - Forest Hills Queens 407 Southwest Queens Queens 408 Jamaica Queens 409 Southeast Queens Queens 410 Rockaway Queens
404406 Bayside-Meadows Queens 501502 Northern SI Staten Island 503504 Southern SI Staten Island
Neighborhood Index: United Health Hospital Fund (UHF)
Introduction & Context 7

UHF Code UHF Neighborhood Zip Codes Borough 101 Kingsbridge - Riverdale 10463, 10471 Bronx 102 Northeast Bronx 10466, 10469, 10470,10475 Bronx 103 Fordham - Bronx Park 10458, 10467, 10468 Bronx 104 Pelhem - Throgs Neck 10461, 10462, 10464, 10465, 10472, 10473 Bronx
105106107 South Bronx 10451, 10452, 10453,10454, 10455, 10456, 10457, 10459, 10460, 10474 Bronx 201 Greenpoint 11211, 11222 Brooklyn 202 Downtown - Heights - Slope 11201, 11205, 11215, 11217, 11231 Brooklyn 203 Bedford Stuyvesant 11212, 11213, 11216, 11233, 11238 Brooklyn 204 East New York 11207, 11208 Brooklyn 205 Sunset Park 11220, 11232 Brooklyn 206 Borough Park 11204, 11218, 11219, 11230 Brooklyn 207 East Flatbush - Flatbush 11203,11210, 11225, 11226, Brooklyn 208 Canarsie - Flatlands 11234, 11236, 11239 Brooklyn 209 Bensonhurst - Bay Ridge 11209, 11214, 11228 Brooklyn 210 Coney Island - Sheepshead Bay 11223, 11224, 11229, 11235 Brooklyn 211 Williamsburg - Bushwick 11206, 11221, 11237 Brooklyn 301 Washington Heights - Inwood 10031, 10032, 10033, 10034, 10040 Manhattan 302 Central Harlem - Morningside 10026, 10027, 10030, 10037, 10039 Manhattan 303 East Harlem 10029, 10035 Manhattan 304 Upper West Side 10023, 10024, 10025 Manhattan
305307 Upper East Side-Gramercy 10010, 10016, 10017, 10021, 10022, 10028, 10044, 10065, 10075, 10128 Manhattan 306308 Chelsea-Village 10001, 10011, 10012, 10013, 10014, 10018, 10019, 10020, 10036 Manhattan 309310 Union Square, Lower Manhattan 10002, 10003, 10004, 10005, 10006, 10007, 10009, 10038, 10280, 10282 Manhattan
401 Long Island City - Astoria 11101, 11102, 11103, 11104, 11105, 11106, 11109 Queens 402 West Queens 11368, 11369, 11370, 11372, 11373, 11377, 11378 Queens 403 Flushing - Clearview 11354, 11355, 11356, 11357, 11358, 11359, 11360 Queens 405 Ridgewood - Forest Hills 11374, 11375, 11379, 11385 Queens 407 Southwest Queens 11414, 11415, 11416, 11417, 11418, 11419, 11420, 11421 Queens 408 Jamaica 11412, 11423, 11430, 11432, 11433, 11434, 11435, 11436 Queens 409 Southeast Queens 11001, 11004, 11005, 11040, 11411, 11413, 11422, 11426, 11427, 11428, 11429 Queens 410 Rockaway 11691, 11692, 11693, 11694, 11695, 11697 Queens
404406 Bayside-Meadows 11361, 11362, 11363, 11364, 11365, 11366, 11367 Queens 501502 Northern SI 10301,10302, 10303, 10304, 10305, 10310 Staten Island 503504 Southern SI 10306, 10307, 10308, 10309, 10312, 10314 Staten Island
Neighborhood Index: Zip Codes for each UHF Neighborhood
Introduction & Context 8

Introduction & Context: Race/Ethnicity & Poverty
Source: U.S. Census Bureau, 2010 Census. Population Division. New York City Department of City Planning (2010)
9
Source: U.S. Census Bureau, 2010 Census. Population Division. New York City Department of City Planning (2010)
Source: U.S. Census Bureau, 2010 Census. Population Division. New York City Department of City Planning (2010)
Source: U.S. Census Bureau, 2000 Census. Population Division. New York City Department of City Planning (2000)

General Physical & Mental Health 10
Source: NYC Community Health Survey, 2010 Bureau of Epidemiology Services, NYC DOHMH
Source: NYC Community Health Survey, 2010 Bureau of Epidemiology Services, NYC DOHMH
Source: NYC Community Health Survey, 2010 Bureau of Epidemiology Services, NYC DOHMH
Source: NYC Community Health Survey, 2010 Bureau of Epidemiology Services, NYC DOHMH

Weight, Exercise & Nutrition 11
Source: NYC Community Health Survey, 2010 Bureau of Epidemiology Services, NYC DOHMH
Source: NYC Community Health Survey, 2010 Bureau of Epidemiology Services, NYC DOHMH
Source: NYC Community Health Survey, 2010 Bureau of Epidemiology Services, NYC DOHMH
Source: NYC Community Health Survey, 2010 Bureau of Epidemiology Services, NYC DOHMH

Weight, Exercise & Nutrition 12
*FITNESSGRAM data, Grades: K-8, Ages 5-15, 2010-2011 school year NYC Department of Education & NYC Department of Health and Mental Hygiene,
Bureau of Epidemiology Services
Source: NYC Community Health Survey, 2010 Bureau of Epidemiology Services, NYC DOHMH
Source: NYC Community Health Survey, 2010 Bureau of Epidemiology Services, NYC DOHMH
Source: NYC Community Health Survey, 2010 Bureau of Epidemiology Services, NYC DOHMH
* Body Mass Index (BMI) was calculated based on percent of adults' self-reported weight and height. A BMI between 25.0 and 29.9 is classified as overweight, and a BMI of 30 or greater is classified as obese.
* Children are classified as obese if they have a BMI percentile >=95% and/or a BMI >=25. Age and gender specific BMI percentiles were calculated based on year 2000 CDC growth charts (http://www.cdc.gov/growthcharts/clinical_charts.htm) from height and weight.

Weight, Exercise & Nutrition 13
Source: NYC Community Health Survey, 2010 Bureau of Epidemiology Services, NYC DOHMH
Source: NYC Community Health Survey, 2010 Bureau of Epidemiology Services, NYC DOHMH
Source: NYC Community Health Survey, 2010 Bureau of Epidemiology Services, NYC DOHMH
Source: NYC Community Health Survey, 2010 Bureau of Epidemiology Services, NYC DOHMH

Sugar-Sweetened Beverage Consumption: 2008-2010
• Sugary drinks are associated with weight gain, diabetes, and risk factors for cardiovascular disease
• Consuming an average of at least one SSB per day among adults ages 18 and older in New York City decreased from 32.6% in 2008 to 30.3% in 2010. However, almost one third of New Yorkers still consumed at least one SSB per day in 2010
• In 2010, the prevalence of at least daily consumption of SSBs was highest among Bronx residents (42.1%) and lowest among Manhattan residents (20.4%)
Source: Epi Data Brief: Consumption of Sugar Sweetened Beverages (SSBs) in New York City. May 2011. http://www.nyc.gov/html/doh/downloads/pdf/epi/databrief4.pdf
http:/
/www
.nyc.g
ov/htm
l/doh
/htm
l/cdp
/cdp_
pan_
pop.s
html
DOHMH campaign, begun in 2009, to encourage consumers to choose beverages with less sugar
Weight, Exercise & Nutrition: Spotlight on Sugar-Sweetened Beverage Consumption 14
2008 2009 2010
Percent Consuming One or More SSBs a Day

Chronic Conditions 15
Source: NYC Community Health Survey, 2010 Bureau of Epidemiology Services, NYC DOHMH
Source: NYC Community Health Survey, 2010 Bureau of Epidemiology Services, NYC DOHMH
Source: NYC Community Health Survey, 2010 Bureau of Epidemiology Services, NYC DOHMH
Source: NYC Community Health Survey, 2010 Bureau of Epidemiology Services, NYC DOHMH

Access to Healthcare 16
Source: NYC Community Health Survey, 2010 Bureau of Epidemiology Services, NYC DOHMH
Source: NYC Community Health Survey, 2010 Bureau of Epidemiology Services, NYC DOHMH
Source: NYC Community Health Survey, 2010 Bureau of Epidemiology Services, NYC DOHMH
Source: NYC Community Health Survey, 2010 Bureau of Epidemiology Services, NYC DOHMH

Cigarette Smoking & Alcohol 17
Source: NYC Community Health Survey, 2010 Bureau of Epidemiology Services, NYC DOHMH
Source: NYC Community Health Survey, 2010 Bureau of Epidemiology Services, NYC DOHMH
Source: NYC Community Health Survey, 2010 Bureau of Epidemiology Services, NYC DOHMH
Source: NYC Community Health Survey, 2010 Bureau of Epidemiology Services, NYC DOHMH

Smoking Trends: 2002-2010
Cigarette Smoking & Alcohol: Spotlight on Smoking Trends 18
Source: Epi Data Brief: Trends in Cigarette Use among Adults in New York City, 2002-2010. November 2011. http://www.nyc.gov/html/doh/downloads/pdf/epi/databrief12.pdf
• Smoking is a leading cause of premature preventable death in the United States (US) and New York City (NYC), killing more than 7,000 New Yorkers aged 35 and older annually. It is estimated that about one-third of NYC smokers will die prematurely from a smoking-related illness
• From 2002-2010, the NYC adult smoking prevalence has declined 35%, from 22% to 14%. There are now about 850,000 smokers in NYC, representing 450,000 fewer smokers than 2002, a decrease that could prevent up to 149,000 deaths in the future
• Since 2002, declines in smoking prevalence have been greatest in Staten Island (50% decline) compared with all other boroughs (Bronx: 36% decline, Brooklyn: 29% decline, Manhattan: 39% decline, Queens: 32% decline)
2002 2004 2006
2008 2010
Percent of Adults Who Smoked

Asthma 19
Source: NYC Community Health Survey, 2010 Bureau of Epidemiology Services, NYC DOHMH
Source: NYC Community Health Survey, 2010 Bureau of Epidemiology Services, NYC DOHMH
Source: NYC Community Health Survey, 2010 Bureau of Epidemiology Services, NYC DOHMH
Source: NYC Community Health Survey, 2010 Bureau of Epidemiology Services, NYC DOHMH
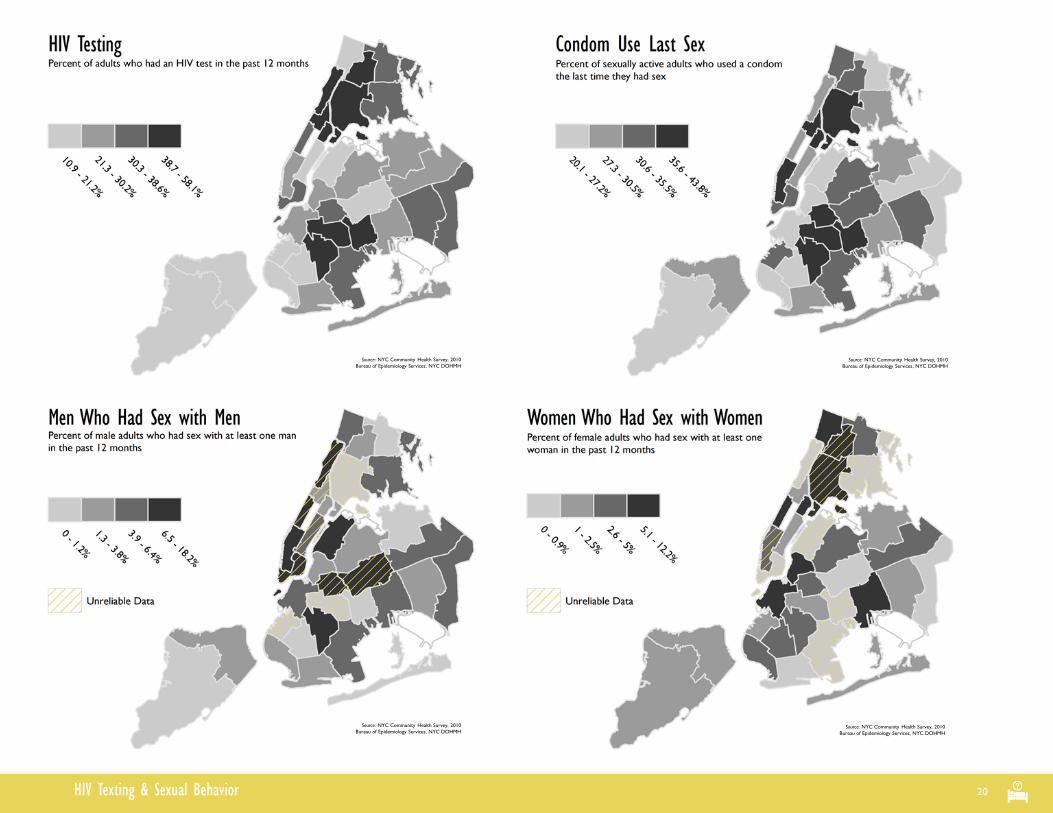
HIV Texting & Sexual Behavior
20
Source: NYC Community Health Survey, 2010 Bureau of Epidemiology Services, NYC DOHMH
Source: NYC Community Health Survey, 2010 Bureau of Epidemiology Services, NYC DOHMH
Source: NYC Community Health Survey, 2010 Bureau of Epidemiology Services, NYC DOHMH
Source: NYC Community Health Survey, 2010 Bureau of Epidemiology Services, NYC DOHMH

Cancer Screening
21
Source: NYC Community Health Survey, 2010 Bureau of Epidemiology Services, NYC DOHMH
Source: NYC Community Health Survey, 2010 Bureau of Epidemiology Services, NYC DOHMH
Source: NYC Community Health Survey, 2010 Bureau of Epidemiology Services, NYC DOHMH
Source: NYC Community Health Survey, 2010 Bureau of Epidemiology Services, NYC DOHMH

Respondents were given multiple answer options over the phone in the 2010 Community Health Survey; maps only display one possible choice option. Listed below are the questions asked in the 2010 CHS, with the answer choice options in parenthesis. Text in italics represents the data displayed in the Atlas maps. EXAMPLE Add Salt at Table: How often do you add salt to your food at the table? (Always, Most of the Time, Rarely, Never ) Percent of adults who always/most of the time add salt to the food
APPENDIX: Community Health Survey Questions
APPENDIX: Community Health Survey Questions
Stair Use How many total floors of stairs do you walk up on an average weekday at home and at work combined? (0 floors per weekday, 1-2 floors per weekday, 3-5 floors per weekday, 6 floors or more per weekday) Responses who walked up at least one floor
Any Sugar-Sweetened Beverage Consumption (1) How often do you drink sugar sweetened soda? Do NOT include diet soda or seltzer. (__ per day, __ per week, __month) (2) How often do you drink other sweetened drinks like sweetened iced tea, sports drinks, fruit punch or other fruit-flavored drinks? Do NOT include diet soda, sugar free drinks, or 100% juice. (__ per day, __ per week, __month) Percent of adults who reported any sugar-sweetened beverage consumption per day
Distance to Fresh Fruits/Vegetables If you were to walk from your home to purchase fresh fruits and vegetables, how long would it take you to get there? ( 5 minutes or less, more than 5 minutes but less than 10 minutes, 10 minutes or more) Percent of adults who reported 10 minutes or longer
Add Salt at Table How often do you add salt to your food at the table? (Always, Most of the Time, Rarely, Never) Percent of adults who always/most of the time add salt to the food
Self-Reported Healthy Diet In general, how healthy is your overall diet? ( Excellent, Very Good, Good, Fair, Poor) Percent of adults who reported an excellent diet
Walked/Bicycled for Transportation During the past 30 days, have you walked or bicycled more than 10 blocks as part of getting to and from work, school, public transportation or to do errands? (Yes, No) Percent of adults reporting Yes
Rode Bicycle in Past Year In the past 12 months, how often have you ridden a bicycle in one of the five boroughs of New York City? (several times a month, at least once a month, a few times a year, never) Percent of adults reporting never or physically unable ACCESS TO HEALTH CARE Health Insurance Do you have any kind of health insurance coverage, including private health insurance, prepaid plans such as H-M-Os, or government plans such as Medicare or Medicaid? (Yes, No) Percent of adults reporting No
Flu Vaccination During the past 12 months, have you had a flu shot in your arm or a flu vaccine that was sprayed in your nose? (Yes, No) Percent of adults reporting Yes
GENERAL PHYSICAL & MENTAL HEALTH Self-Reported Health Status Would you say that in general your health is Excellent, Very Good, Good, Fair or Poor? Percent of adults reporting Fair or Poor General Health History of Depression Have you ever been told by a doctor, nurse or other health professional that you have depression? (Yes, No) Percent of adults reporting Yes
Mental Health Counseling or Treatment In the last 12 months, have you received any counseling or taken a prescription medication for a mental health problem? (Yes, No) Percent of adults reporting Yes WEIGHT, EXERCISE, & NUTRITION Obesity (1) About how tall are you without shoes? (Height in feet/inches or meters/centimeters, Refused/Don’t Know) (2) About how much do you weigh without shoes? (Weight in pounds or kilograms, Refused/Don’t Know) *Body Mass Index (BMI) was calculated based on percent of adults' self-reported weight and height. A BMI between 25.0 and 29.9 is classified as overweight, and a BMI of 30 or greater is classified as obese. Percent of adults who are Obese
Physical Activity During the past 30 days, other than your regular job, did you participate in any physical activities or exercises such as running, calisthenics, golf, gardening, or walking for exercise? (Yes, No, ) Percent of adults reporting Yes
Map Question
Answer choices
Response displayed on map
22

APPENDIX: Community Health Survey Questions
HIV TESTING & SEXUAL BEHAVIOR HIV Testing Have you had an HIV test in the last 12 months? (Yes, No) Percent of adults reporting Yes
Condom Use Last Sex The last time you had sex, did you use a condom? (Yes, No) Percent of adults reporting Yes
ASTHMA Asthma Ever Have you ever been told by a doctor, nurse or other health professional that you had asthma? (Yes, No) Percent of adults reporting Yes
CANCER SCREENING Colon Cancer Screening When was your most recent colonoscopy performed? (Less than 1 year ago, 1 year ago but less than 5 years ago, 5 years ago but less than 10 years ago, 10 or more years ago) * Timely colon cancer screening is defined as having had a colonoscopy in the past ten years; results restricted to adults aged 50 and older Percent of adults reporting having had a colonoscopy in the past ten years
Cervical Cancer Screening (1) A Pap smear is a test for cancer of the cervix. Have you ever had a Pap smear? (Yes, No) Percent of adults reporting Yes (2) How long has it been since your last pap smear? (Less than 12 months ago, 1 year ago but less than 2 years ago, 2 years ago but less than 3 years ago, 3 years ago but less than 5 years ago, 5 or more years ago) *Timely cervical cancer screening is defined as having had a Pap test in the past three years; results restricted to women Percent of adults reporting having had a Pap test in the past three years
Breast Cancer Screening (1) A mammogram is an x-ray of each breast to look for breast cancer. Have you ever had a mammogram? (Yes, No) Percent of adults reporting Yes (2) How long has it been since your last mammogram? (Less than 12 months ago, 1 year ago but less than 2 years ago, 2 years ago but less than 3 years ago, 3 years ago but less than 5 years ago, 5 or more years ago) * Timely breast cancer screening is defined as having had a mammography in the past two years; results restricted to women aged 40 and older Percent of adults reporting having had a mammography in the past two years
CHRONIC CONDITIONS High Blood Pressure Ever Have you ever been told by a doctor, nurse or other health professional that you have hypertension, also called high blood pressure? (Yes, No) Percent of adults reporting Yes
Current Blood Pressure Medication Are you currently taking medication for your high blood pressure? (Yes, No) Percent of adults reporting Yes
Diabetes Ever Have you ever been told by a doctor, nurse or other health professional that you have diabetes? (Yes, No) Percent of adults reporting Yes
Cholesterol Screening About how long has it been since you last had your cholesterol checked? (Less than 12 months ago, 1 year ago but less than 2 years ago, 2 years ago but less than 3 years ago, 3 years ago but less than 5 years ago, 5 or more years ago) * Timely cholesterol screening is defined as having a blood cholesterol test in the past 5 years. Percent of adults reporting having had their cholesterol checked within the past 5 years
High Cholesterol Ever Have you ever been told by a doctor, nurse or other health professional that your blood cholesterol is high? (Yes, No) Percent of adults reporting Yes
Current Cholesterol Medication Are you currently taking medication to lower your high cholesterol? (Yes, No) Percent of adults reporting Yes CIGARETTE SMOKING & ALCOHOL Smoking Status Do you now smoke cigarettes every day, some days, or not at all? (every day, some days, not at all) * Smoking status is defined as being a current or former smoker or having smoked less than 100 cigarettes ever (never smoker). Percent of adults who are current smokers
Non-Smokers with Smoke-Free Home Policy Which statement best describes the rules about smoking inside your home? (smoking is not allowed anywhere inside your home, smoking is allowed in some places or at some times, smoking is allowed anywhere inside the home, there are no rules about smoking inside the home) * Smoke-free homes are those where smoking is not allowed anywhere inside. Percent of adults reporting being both non-smokers and not allowing smoking in their home
23
APPENDIX: Community Health Survey Questions
