enrolment summary - key facts, history and projections
DESCRIPTION
ENROLMENT SUMMARY - Key Facts, History and Projections. Presentation to the Partnership Table May 14, 2007. Enrolment – DATA & FORECASTING NOTES. Ministry of Education collects enrolment data from school boards. - PowerPoint PPT PresentationTRANSCRIPT

Page 1May 2007
ENROLMENT SUMMARY -
Key Facts, History and Projections
Presentation to the Partnership Table May 14, 2007
Page 2May 2007
Enrolment – DATA & FORECASTING NOTES
Ministry of Education collects enrolment data from school boards. ADE (average daily enrolment) used for funding purposes is collected through the
financial reporting cycle. Detailed ADE information includes full-time equivalent counts for various grade
groupings – JK/SK, Grades 1 to 3, Grades 4 to 8, Secondary. ADE is also collected for each individual school. Other enrolment data collected by the ministry includes: headcount enrolment by
individual grades and schools (elementary and secondary); elementary class size reports.
As part of the financial/fiscal planning cycle, school boards submit enrolment projections.
For the 2007-08 planning cycle, school boards submitted a two-year enrolment projection.
Ministry develops internal enrolment projections for its multi-year plan.
School-aged demographic trends and student retention rates are key inputs used to construct ministry's long-term projections.
Internal/Ministry projections supplement the short-term board projections.

Page 3May 2007
Enrolment HISTORY – TOTAL
TOTAL (Elementary + Secondary) Enrolment
1,875
1,900
1,925
1,950
1,975
2,000
1998-99 1999-00 2000-01 2001-02 2002-03 2003-04 2004-05 2005-06 2006-07
ADE (000s)

Page 4May 2007
Enrolment HISTORY – TOTAL
TOTAL (Elem + Sec) Enrolment History
# of School Boards
Declining
Growing
1999-00 37 35
2000-01 34 38
2001-02 36 36
2002-03 41 31
2003-04 59 13
2004-05 39 33
2005-06 43 29
2006-07 54 18
Page 5May 2007
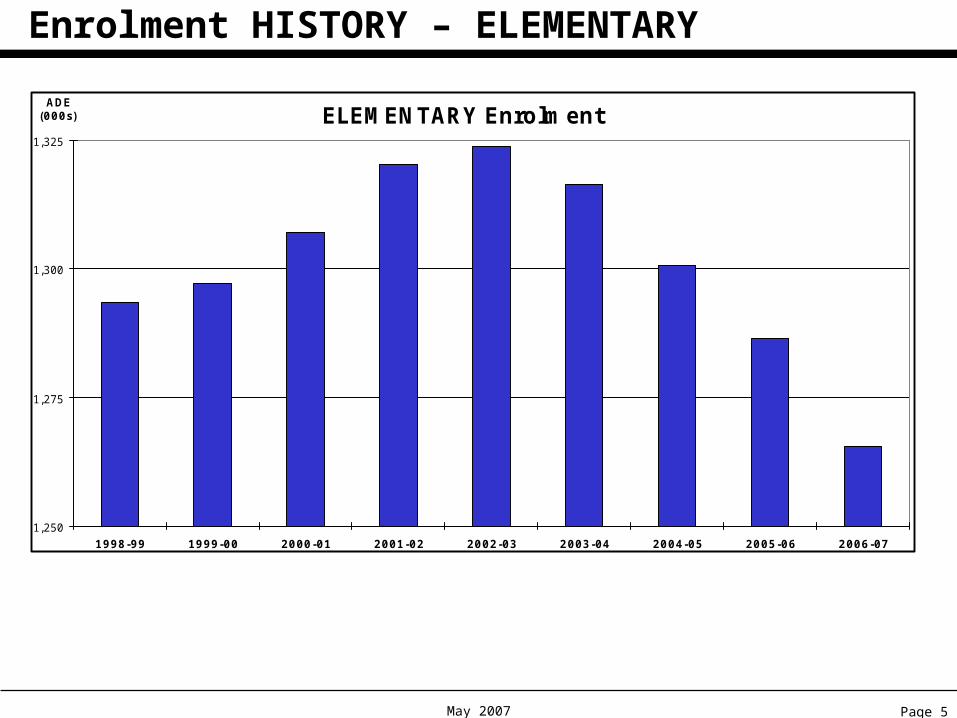
Enrolment HISTORY – ELEMENTARY
ELEMENTARY Enrolment
1,250
1,275
1,300
1,325
1998-99 1999-00 2000-01 2001-02 2002-03 2003-04 2004-05 2005-06 2006-07
ADE (000s)

Page 6May 2007
Enrolment HISTORY – ELEMENTARY
ELEMENTARY Enrolment History
# of School Boards
Declining
Growing
1999-00 43 29
2000-01 37 35
2001-02 42 30
2002-03 42 30
2003-04 52 20
2004-05 59 13
2005-06 56 16
2006-07 63 9
Page 7May 2007
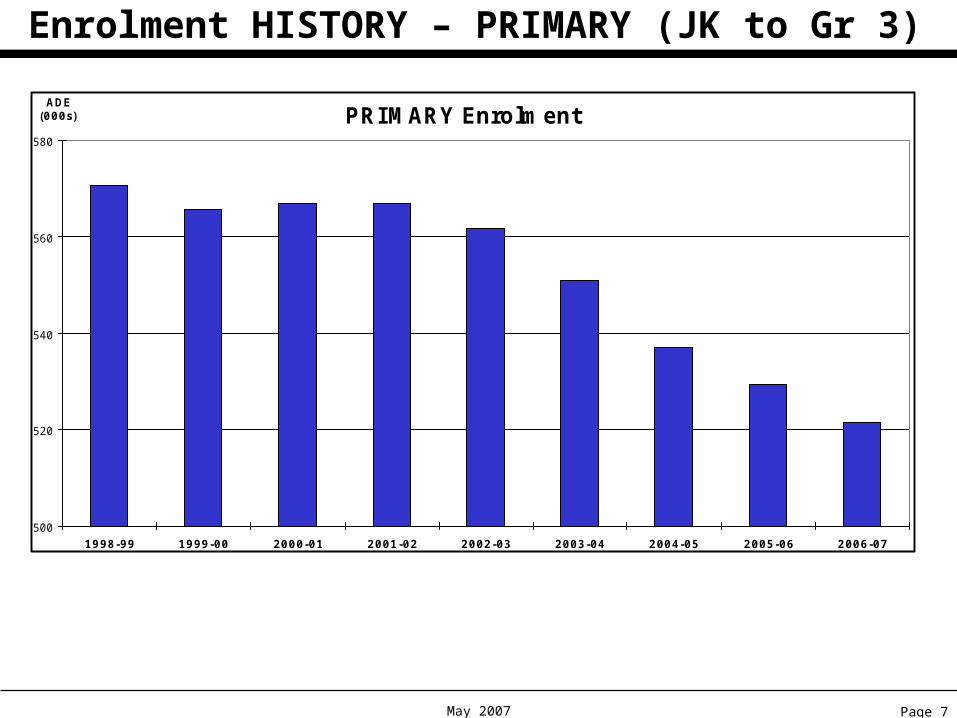
Enrolment HISTORY – PRIMARY (JK to Gr 3)
PRIMARY Enrolment
500
520
540
560
580
1998-99 1999-00 2000-01 2001-02 2002-03 2003-04 2004-05 2005-06 2006-07
ADE (000s)
Page 8May 2007
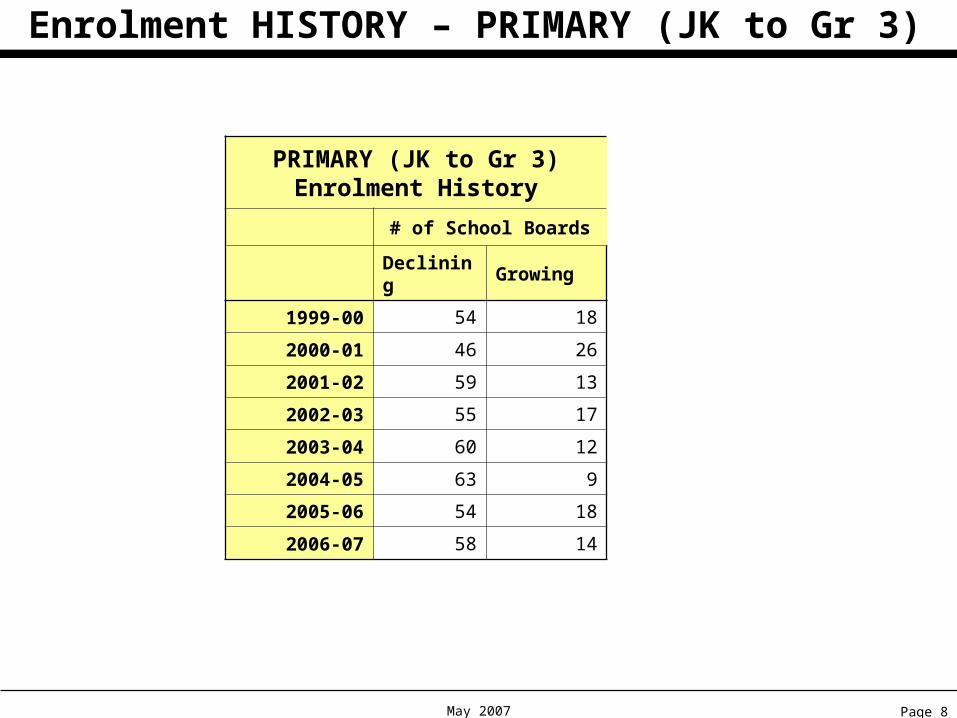
Enrolment HISTORY – PRIMARY (JK to Gr 3)
PRIMARY (JK to Gr 3) Enrolment History
# of School Boards
Declining
Growing
1999-00 54 18
2000-01 46 26
2001-02 59 13
2002-03 55 17
2003-04 60 12
2004-05 63 9
2005-06 54 18
2006-07 58 14
Page 9May 2007
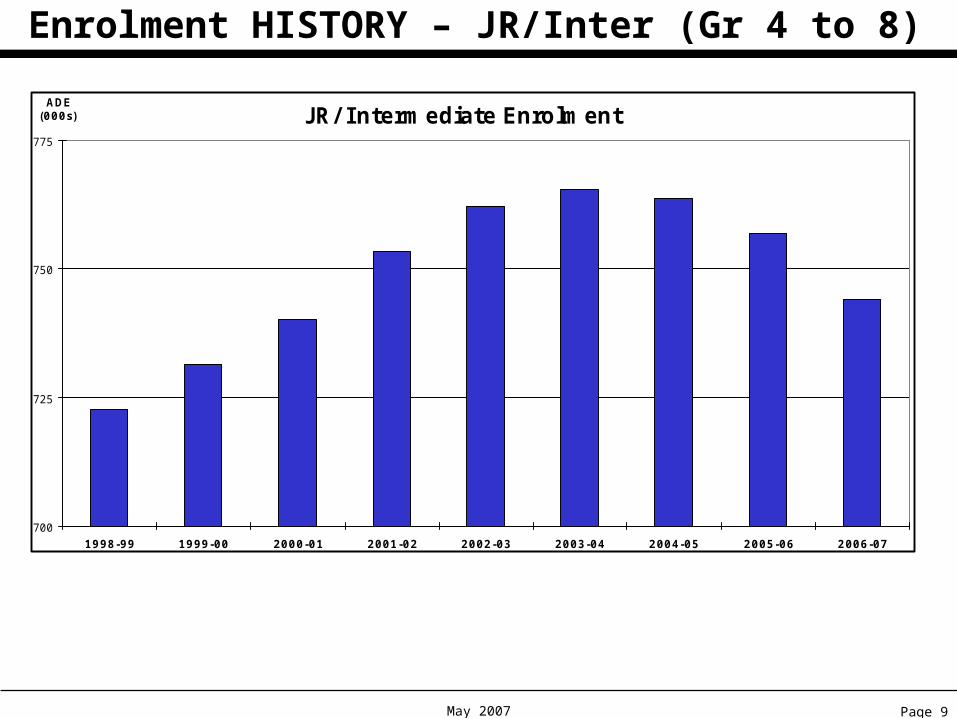
Enrolment HISTORY – JR/Inter (Gr 4 to 8)
JR/ Intermediate Enrolment
700
725
750
775
1998-99 1999-00 2000-01 2001-02 2002-03 2003-04 2004-05 2005-06 2006-07
ADE (000s)

Page 10May 2007
Enrolment HISTORY – JR/Inter (Gr 4 to 8)
JUNIOUR/INTERMEDIATE (Gr 4 to 8) Enrolment
History# of School Boards
Declining
Growing
1999-00 31 41
2000-01 32 40
2001-02 26 46
2002-03 27 45
2003-04 37 35
2004-05 49 23
2005-06 55 17
2006-07 62 10

Page 11May 2007
Enrolment HISTORY – SECONDARY
SECONDARY Enrolment
620
640
660
680
700
1998-99 1999-00 2000-01 2001-02 2002-03 2003-04 2004-05 2005-06 2006-07
ADE (000s)
Page 12May 2007
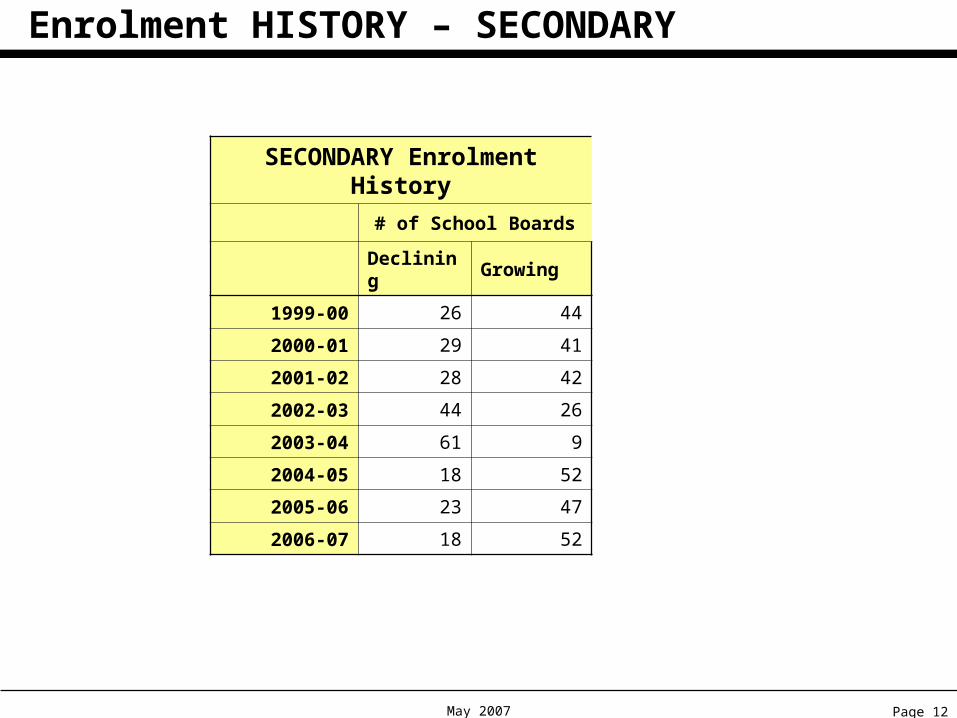
Enrolment HISTORY – SECONDARY
SECONDARY Enrolment History
# of School Boards
Declining
Growing
1999-00 26 44
2000-01 29 41
2001-02 28 42
2002-03 44 26
2003-04 61 9
2004-05 18 52
2005-06 23 47
2006-07 18 52

Page 13May 2007
Enrolment HISTORY – 2005-06 Cohorts
2005-06 headcount enrolmentby individual grades (cohorts)
90
110
130
150
170
190
210
JK SK Grade 1 Grade 2 Grade 3 Grade 4 Grade 5 Grade 6 Grade 7 Grade 8 Grade 9 Grade 10 Grade 11 Grade 12(includes5th yr)
ADE (000s)
Page 14May 2007
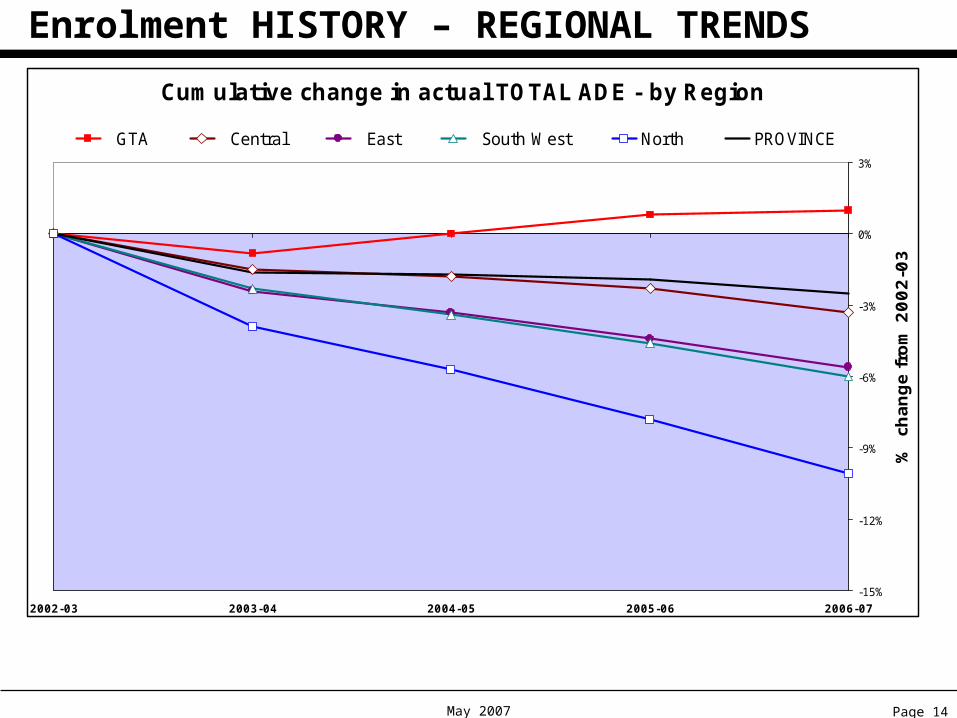
Enrolment HISTORY – REGIONAL TRENDS
Cumulative change in actual TOTAL ADE - by Region
-15%
-12%
-9%
-6%
-3%
0%
3%
2002-03 2003-04 2004-05 2005-06 2006-07
% c
hange f
rom
2002-0
3
GTA Central East South West North PROVINCE

Page 15May 2007
Enrolment HISTORY – Board Size
School Board Size Distribution in 2006-07(based on Total ADE)
34
13
9
4 4
8
0
6
12
18
24
30
36
0 to 12,000 12 to 24,000 24 to 36,000 36 to 48,000 48 to 60,000 60,000 and up
# of Boards
School Board Size Distribution in 1998-99(based on Total ADE)
27
21
85
3
8
0
6
12
18
24
30
36
0 to 12,000 12 to 24,000 24 to 36,000 36 to 48,000 48 to 60,000 60,000 and up
# of Boards

Page 16May 2007
Enrolment PROJECTIONS – TOTAL
Total Enrolment - History and Projections
1,875
1,900
1,925
1,950
1,975
2,000
1998-99 1999-00 2000-01 2001-02 2002-03 2003-04 2004-05 2005-06 2006-07 2007-08Proj
2008-09Proj
2009-10Proj
2010-11Proj
ADE (000s)

Page 17May 2007
Enrolment PROJECTIONS – ELEMENTARY
Elementary Enrolment - History and Projections
1,200
1,220
1,240
1,260
1,280
1,300
1,320
1,340
1998-99 1999-00 2000-01 2001-02 2002-03 2003-04 2004-05 2005-06 2006-07 2007-08Proj
2008-09Proj
2009-10Proj
2010-11Proj
ADE (000s)
`

Page 18May 2007
Enrolment PROJECTIONS – SECONDARY
Secondary Enrolment - History and Projections
600
620
640
660
680
700
1998-99 1999-00 2000-01 2001-02 2002-03 2003-04 2004-05 2005-06 2006-07 2007-08Proj
2008-09Proj
2009-10Proj
2010-11Proj
ADE (000s)

Page 19May 2007
Enrolment PROJECTIONS – REGIONAL TRENDS
Cumulative change in PROJECTED TOTAL ADE - by Region
-15%
-13%
-11%
-9%
-7%
-5%
-3%
-1%
1%
3%
2006-07 2007-08 2008-09 2009-10 2010-11
% c
hange (
pro
ject
ed)
from
2006-0
7
GTA Central East South West North Province

Page 20May 2007
Enrolment and Demographics - PROJECTIONS
Total Enrolment vs School-aged population - History and Projections
1,875
1,900
1,925
1,950
1,975
2,000
1998-99
1999-00
2000-01
2001-02
2002-03
2003-04
2004-05
2005-06
2006-07
2007-08 Proj
2008-09 Proj
2009-10 Proj
2010-11 Proj
2011-12 Proj
2012-13 Proj
2013-14 Proj
2014-15 Proj
ADE (000s)
2000
2100
2200
2300
2400
2500
Population (000s)TOTAL ADE 5-19 Yr Demo
Page 21May 2007
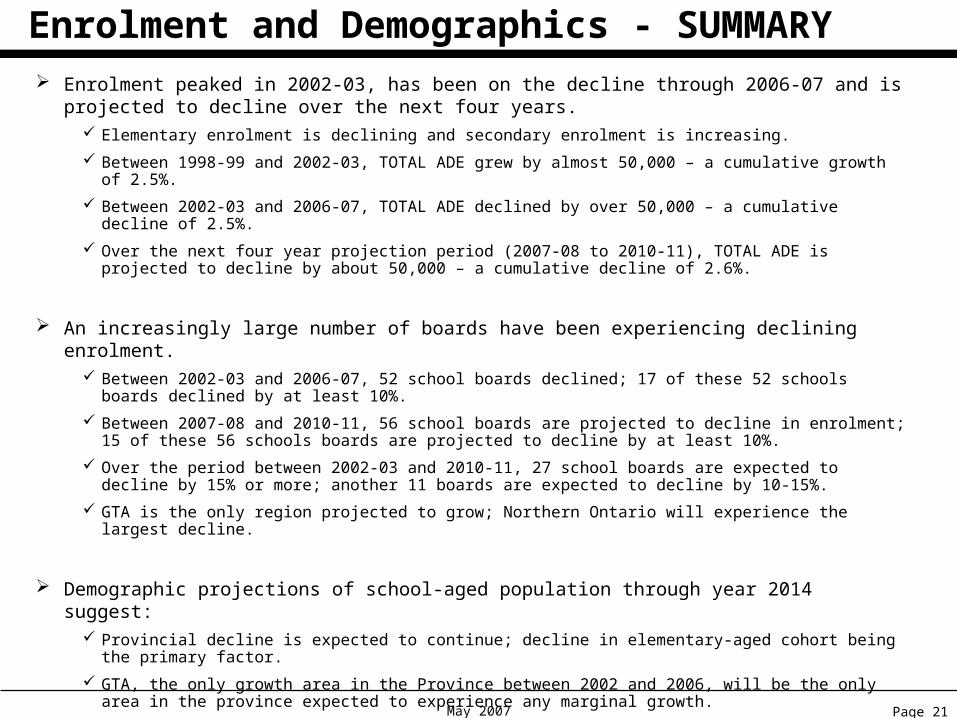
Enrolment and Demographics - SUMMARY Enrolment peaked in 2002-03, has been on the decline through 2006-07 and is projected
to decline over the next four years. Elementary enrolment is declining and secondary enrolment is increasing.
Between 1998-99 and 2002-03, TOTAL ADE grew by almost 50,000 – a cumulative growth of 2.5%.
Between 2002-03 and 2006-07, TOTAL ADE declined by over 50,000 – a cumulative decline of 2.5%.
Over the next four year projection period (2007-08 to 2010-11), TOTAL ADE is projected to decline by about 50,000 – a cumulative decline of 2.6%.
An increasingly large number of boards have been experiencing declining enrolment. Between 2002-03 and 2006-07, 52 school boards declined; 17 of these 52 schools boards declined
by at least 10%.
Between 2007-08 and 2010-11, 56 school boards are projected to decline in enrolment; 15 of these 56 schools boards are projected to decline by at least 10%.
Over the period between 2002-03 and 2010-11, 27 school boards are expected to decline by 15% or more; another 11 boards are expected to decline by 10-15%.
GTA is the only region projected to grow; Northern Ontario will experience the largest decline.
Demographic projections of school-aged population through year 2014 suggest: Provincial decline is expected to continue; decline in elementary-aged cohort being the primary
factor.
GTA, the only growth area in the Province between 2002 and 2006, will be the only area in the province expected to experience any marginal growth.
Northern Ontario will continue to experience the largest decline.
Central, East and South Western Ontario regions are expected to experience declines larger than their current decline.
New demographic projections, based on 2006 Census will be available in fall 2008.

Page 22May 2007
Discussion Questions
What planning do we need to undertake to deal with the projected enrolment changes?
What changes in policy or funding are required?
What changes in school board planning processes are required?
What is working and effective for boards with declining enrolment?