statistics enrolment projections 2006 redistribution of new south wales the statistics in this...
TRANSCRIPT

REDISTRIBUTION STATISTICS
Enrolment Projections
2006 REDISTRIBUTION OF NEW SOUTH WALES
The statistics in this volume are provided by the Australian Electoral Commission (AEC). They have been prepared for the information of persons and organisations interested in the 2006 redistribution of electoral boundaries for 49 House of Representatives Electoral Divisions in New South Wales.
The tables in this volume show the electoral enrolment figures as at 2 December 2005 and the projected enrolment figures at 31 May 2010 (the projection time for equality of enrolments for the purposes of Section 63A of the Commonwealth Electoral Act 1918). The figures are given at the following levels: • Census Collection District (CCD) • Statistical Local Area (SLA) • Electoral Division • State
Following a recommendation by the Joint Standing Committee on Electoral Matters (JSCEM) that the AEC and the Australian Bureau of Statistics (ABS) work together on enrolment projections, the ABS has supplied enrolment projections to the AEC using AEC enrolment data as the base. The ABS used a cohort-component method to project the enrolment of each CCD to 31 May 2010.
Divisional Returning Officers (DROs) were asked to examine the ABS projections in the light of their local knowledge and experience, and to substitute their own projections where appropriate. DROs made use of information supplied by relevant local authority planning and statistical groups, as well as their own resources in undertaking this task. The Australian Electoral Officer and State Manager for New South Wales also reviewed the projections, along with any changes made by DROs, to ensure a consistent approach.
Statistics are given at the CCD level, as this level is the smallest commonly used geographic building block. The CCD figures are aggregated to show the totals for SLAs, which are comprised of a number of CCDs. Being somewhat larger than CCDs, SLAs may be more manageable for those who are interested in less detailed analysis. In most cases, the SLA is equivalent to the Local Government Area (LGA). Totals for each Division and the State are also given.
The type of SLA is denoted by a suffix. This is described in detail in the ABS publication Australian Standard Geographical Classification (ASGC), 2005. Briefly, the SLA types are:
(A) Area (B) Borough (C) City (CGC) Community Government Council (DC) District Council (M) Municipality
i

(RC) Rural City (S) Shire (T) Town
The statistics shown are broken down according to Electoral Division. Where a CCD or SLA crosses Divisional boundaries, the CCD or SLA concerned will be listed in each Division in which electors are enrolled. Only those electors resident in that Division are included in the figures for such CCDs or SLAs.
Where a 2001 CCD crosses, or has been split to align with a 2004 SLA boundary, only those electors resident in that SLA are included in the figures for the SLA. In some cases, there may be multiple listings for a CCD in a particular SLA. This will occur where there are multiple parts of a CCD in that SLA. To calculate the total number of electors shown in a split CCD or SLA, the component parts of the CCD or SLA from each relevant Division must be added together.
Two sets of enrolment statistics are shown. Figures are provided for 2 December 2005, which is the enrolment at close of business on the day the Australian Electoral Commission directed the commencement of the redistribution, and are the figures used for the Electoral Commissioner’s determination of the enrolment quota under Section 65 of the Commonwealth Electoral Act 1918. The Table on page iv sets out the enrolment quota information to apply for this redistribution. Projected enrolment at 31 May 2010 is also given.
A Growth (%) is also given. This is the estimated growth rate for the period December 2005 to May 2010. The growth rate shown for each CCD is calculated by subtracting the actual enrolment from the projected enrolment, then dividing by the actual enrolment. The result is expressed as a percentage.
The first 2 pages of this volume shows total numbers of CCDs or part CCDs1, and the total enrolments and growth rates for each existing Electoral Division in New South Wales, as well as a total for the State. The subsequent pages show, for each existing Electoral Division, the name of each SLA in the Division, the identifier number of each CCD or part CCD in the Division, the two sets of enrolment figures and the growth rates applicable to each CCD, part CCD and SLA, with totals for the Division.
Maps of existing Electoral Division boundaries are available from the Australian Electoral Officer and State Manager for New South Wales, 4th Floor, Roden Cutler House, 24 Campbell Street Haymarket 2000, (Telephone 02 9375 6321). Maps of census collection districts may be obtained from the Australian Bureau of Statistics. DATA – CSV FILE A CSV file NSW_CCD.csv is included as a separate link on the AEC website. This file includes enrolment and projected enrolment for each CCD or part CCD. The file is sorted by electoral division and contains the following information: Division Name;SLA Name;CCD Number;Actual Enrolment;Projected Enrolment
1 CCDs listed in this volume and used for the 2006 Redistribution of New South Wales are those used at the 2001 Census of Population and Housing and have been split where necessary to align to 2004 SLA Boundaries.
ii

If technical difficulties are experienced in accessing this data, please telephone the Federal Redistribution Secretariat in Canberra (02) 62714468 or e-mail: [email protected]. Access to a personal computer with the software program, Electoral Boundary Mapping System (EBMS), which runs within the commercial software program MapInfo, will be made available for interested persons, at the office of the Redistribution Committee for New South Wales. Bookings will be required for half-day sessions and can be made by telephoning (02) 9375 6321 during business hours (9.00 am to 5.00 pm). Some knowledge of the systems will be assumed and only a brief introduction can be offered. Access to this system will be available during the periods allowed for suggestions, comments on suggestions, objections and comments on objections.
iii

Redistribution 2006 – New South Wales
Quota Information
In accordance with Section 65 of the Commonwealth Electoral Act 1918, the Electoral Commissioner has determined the quota of electors for the purpose of the redistribution of New South Wales to be 87,931 which has been calculated as follows:
Number of Members of the House of Representatives 49 to which New South Wales is entitled Number of electors enrolled in New South Wales at the 4,308,595 end of the day on which the redistribution commenced (2 December 2005) Quota for the State 87,931 Permissible maximum number of electors in a Division 96,724 (quota + 10%) Permissible minimum number of electors in a Division 79,138 (quota – 10%)
For the purposes of Section 66(3) of the Commonwealth Electoral Act 1918, the following figures will apply:
Number of Members of the House of Representatives 49 to which New South Wales is entitled Estimated total number of electors enrolled in New South Wales 4,581,939 at the Projection time (31 May 2010) Average divisional enrolment at the Projection time 93,508 Maximum number of electors in a division at the 96,780 Projection time (103.5%) Minimum number of electors in a division at the 90,236 Projection time (96.5%)
iv

The New South Wales Small Area Population Projections (ABS) This report outlines the method used for producing population and enrolment projections for all Census Collection Districts (CDs) in New South Wales, spanning from June 2004 to May 2010. Projection Method The main technique employed for the projections was the cohort-component method, widely accepted as the best way of producing age/sex population projections. It involved applying annual fertility and mortality rates and internal migration and overseas migration by age and sex to the base population to produce a projected population, which then became the base for projecting the next year. This cycle was repeated until the projection horizon was reached. A four-tiered approach was taken in projecting resident population aged 18 years and over for all Statistical Local Areas (SLAs) and CDs in the New South Wales.
1. The New South Wales population was projected by age and sex. 2. Sydney/Balance of NSW populations were projected by age and sex (constrained to
1). 3. The population of all New South Wales SLAs was projected by age and sex
(constrained to 2). 4. The SLA projections were split into CDs.
Finally, the projections were grouped into persons aged 18 years and over, and aligned with enrolment data to produce projected enrolments. 1. State/Territory Projections The base population for the New South Wales cohort-component projections was revised age/sex Estimated Resident Population (ERP) as at 30 June 2004. Assumptions for the projections were based on both short and long-term trends for each component of population change. These fertility, mortality, overseas migration and interstate migration assumptions were from Series B (the medium scenario) in the latest Population Projections, Australia, 2004-2101 (ABS Cat. No. 3222.0). All States and Territories were in fact independently projected, then constrained to sum to the Australian-level projection. 2. Capital City/Balance of State Projections As per the State/Territory level, the capital city and balance of state projections were taken from Series B in the Population Projections publication. A revised 30 June 2004 ERP base was used, with assumptions reflecting historically observed region-specific patterns of fertility, mortality, overseas migration and internal migration. The New South Wales projections acted as control totals. 3. SLA Projections The base population for the SLA cohort-component projections was revised 30 June 2004 SLA age/sex ERP. The fertility, mortality and migration assumptions were based on SLA-specific levels observed during the past decade, constrained to the assumed capital city/balance of state levels and trends. The net migration assumptions also included some adjustments to prevent excessive deviation from State Government population projections for Local Government Areas. SLA age/sex migration profiles were derived from 2001 Census data on
v

place of usual residence one year ago. The ABS regularly collects demographic information down to the SLA level, which means that SLA projections (in contrast to smaller areas) are firmly based on series of known data. At each yearly cycle in this process, the resulting SLA projections were constrained to sum to the capital city/balance of state projections, helping to produce more reliable SLA figures. SLAs with ERP under 500 persons were generally held constant for the projection duration, as assumptions for the accompanying tiny age/sex cells are too unreliable. 4. CD Projections CD projections were formed using extrapolations from 2001-2004 CD ERP constrained to the SLA projections. CD ERP is derived using 2001 Census CD-to-SLA usual residence population proportions updated for post-censal growth using CD building approvals. This approach allows for sub-SLA differential growth while retaining consistency with the SLA projections. The final process adjusts the CD projections for persons aged 18 and over to reflect projected enrolments as at 31 May 2010 using the November 2005 relationship between each CD's enrolments and its ERP. The lack of demographic data collected regularly at CD level makes it necessary to use such a conversion method as outlined above. While the process is quite complex, it should be reiterated that the basic concept of splitting SLAs to CD level cannot be expected to give projections as reliable as those for SLAs. However, as the end product will be aggregates of large numbers of CDs there is a high likelihood that any random errors or inconsistencies will be statistically offset in the aggregation process. Boundaries CD boundaries are from the Australian Standard Geographical Classification (ASGC), 2001 Edition (ABS Cat. 1216.0), corresponding to those used for the 2001 Census. SLA boundaries are from a subsequent ASGC version, the 2004 Edition. Disclaimer It is important to recognise that the projection results given in this report essentially reflect the assumptions made about future fertility, mortality and migration trends. While these assumptions are formulated on the basis of an objective assessment of historical demographic trends and their likely future dynamics, there can be no certainty that they will be realised. ABS takes responsibility for the method employed, however in accordance with ABS policy regarding small area population projections, the assumptions used are the final responsibility of the client, and the projections are not official ABS population statistics. The projections may be referred to as "...projections prepared by the ABS according to assumptions reflecting prevailing trends agreed to by the Australian Electoral Commission...". No liability will be accepted by the ABS for any damages arising from decisions or actions based upon this population projection consultancy service.
vi

Projection methods for the New South Wales, Capital City/Balance of State, Statistical Local Areas (SLAs) and Census Collection Districts (CDs) - more details The four-tiered approach outlined in Appendix I has been further disaggregated in this accompanying paper. Apart from the births formulae all equations apply to both sexes, so sex has not been denoted. "State" and "state-level" may refer to either State or Territory. Step 1 - State/Territory/Australia Projections This involved projecting the New South Wales population by age and sex, 2004 - 2010. The cohort component method used can be summarised in the formulae below:
x -> age max -> highest age projected (100+ for state; 85+ for sub-state) t -> base year P -> population F -> fertility rate f -> females B -> births Q -> death probability OM -> net overseas migration IM -> net interstate (or internal) migration NM -> net migration (SLA projections only)
In Step 1 the following refer to interstate migration; Step 2 they refer to internal migration; Step 3 they refer to overseas + inter-SLA migration.
DEP -> departures ARR -> arrivals DEPRATE -> per capita departure rate (donor state or capital city-balance or SLA) ARRRATE -> per capita arrival rate (receiving states)
For ages 0 to maximum age - 1: (i) Px+1(t+1) = Px(t) * [1-Qx(t)] + (0.5 * OMx(t)) * (1-(0.5 * Qx(t))) + (0.5 * OMx+1(t)) * (1-(0.5 * Qx+1(t))) (ii) Pmax(t+1) = Pmax(t) * [1-Qmax(t)] + Pmax-1(t) * [1-Qmax-1(t)] + OMmax(t) * (1-(0.5 * Qmax(t))) + (0.5 * OMmax-1(t)) * (1-(0.5 * Qmax-1(t)))
vii

Births were then calculated: 49 49
(iii) B(t) = 0.5*[ Σ (Fx(t)*Pf,x(t))+ Σ (Fx(t+1)*Pf,x(t+1))] x=15 x=15 After constraining to projected Australian-level births, these were then used to calculate age 0 in the projected year: (iv) P0(t+1)= B(t)*(1-Qb(t)) + (0.5*OM0(t)) * (1-(0.5*Q0(t))) Interstate migration was calculated by applying departure rates to the New South Wales population and arrival rates to the population of the remaining States and Territories (to obtain numbers departing other States to reside in the New South Wales). These rates were derived from 1991, 1996 and 2001 Census data and were held constant for the duration of the projection. (v) DEPx(t+1) = Px(t+1) * DEPRATEx (vi) ARRx(t+1) = Px(t+1)
Non-NSW * ARRRATEx The resulting total arrivals and departures were then scaled to a predetermined total net interstate migration assumption. Finally, the arrivals and departures by age and sex were scaled to the new arrival and departure totals, then combined to give net age/sex interstate migration. (vii) IMx(t+1) = ARRx(t+1) - DEPx(t+1) Then add the interstate migration: (viii) Px(t+1) = Px(t+1) + IMx(t+1) To achieve coherent interstate migration figures, projections are concurrently run for all States, Territories and Australia. After constraining of State age/sex population sum to the Australian-level (method described in Step 2), year t+1 then became the base for projecting the next year and the cycle was repeated until the final projection year was reached. Step 2 - Sydney / Balance of NSW Projections This employs the cohort component method to project Sydney Statistical Division and the Balance of NSW. The formulae in Step 1 generally apply to these projections, except that the upper age is 85+, fertility rates are by 5yr age of mother and migration arrival levels are used instead of rates. For ages 0 to maximum age - 1: (ix) Px+1(t+1) = Px(t) * [1-Qx(t)] +
viii

(0.5 * OMx(t)) * (1-(0.5 * Qx(t))) + (0.5 * OMx+1(t)) * (1-(0.5 * Qx+1(t))) (x) Pmax(t+1) = Pmax(t) * [1-Qmax(t)] + Pmax-1(t) * [1-Qmax-1(t)] + OMmax(t) * (1-(0.5 * Qmax(t))) + (0.5 * OMmax-1(t)) * (1-(0.5 * Qmax-1(t))) Births were then calculated: 45-49 45-49
(xi) B(t) = 0.5*[ Σ (Fx(t)*Pf,x(t))+ Σ (Fx(t+1)*Pf,x(t+1))] x=15-19 x=15-19 After constraining to projected State-level births, these were then used to calculate age 0 in the projected year: (xii) P0(t+1)= B(t)*(1-Qb(t)) + (0.5*OM0(t)) * (1-(0.5*Q0(t))) Capital city-balance of state migration departures were calculated by applying 2001 Census-derived departure rates to the population: (xiii) DEPx(t+1) = Px(t+1) * DEPRATEx Total capital city-balance of state arrivals were then derived using the pre-set net migration assumptions: x=max
(xiv) ARR(t+1) = NM(t+1) - Σ DEPx(t+1) x=0 (xv) The assumed age-specific arrival levels were derived from 2001 Census data.
Together with departures from (xiii) these were simultaneously constrained (via IPF - see xvii - xix) to:
(a) Capital city-balance of state arrival and departure totals (b) State age-specific net migration Then the arrivals and departures were applied to the population projected so far: (xvi) Px(t+1) = Px(t+1) + ARRx(t+1) - DEPx(t+1) Year t+1 then became the base for projecting the next year and the cycle was repeated until the final projection year was reached. However, before Px(t+1) became the new base, the projected capital city-balance of state were constrained to sum to the State projection. This
ix

involved a final 2-way iterative proportional fitting (IPF) process; the year is t+1:
CC-Bal -> Capital City or Balance of State region NSW -> New South Wales a -> first region z -> last region r -> region number
Scale the regional (capital city-balance of state) totals to the State total: r=z
(xvii) PCC-Bal = PCC-Bal * (PNSW / Σ PrCC-Bal)
r=a For each region scale ages to sum to the new region total: x=max
(xviii) PxCC-Bal = Px
CC-Bal * (PCC-Bal / Σ PxrCC-Bal)
x=0
For each age, scale both regions to sum to the State total: r=z
(xix) PxCC-Bal = Px
CC-Bal * (PxNSW / Σ Pxr
CC-Bal) r=a Stages (xviii) and (xix) were then iterated several times before the resulting matrix was rounded. Step 3 - Statistical Local Area Projections This used the cohort component method to project all New South Wales SLAs. The formulae in Step 1 generally apply to the SLA projections, except that the upper age is 85+, fertility rates are by 5yr age of mother, migration arrival rates are not used and Net Migration (overseas + inter-SLA) was used instead of overseas and inter-SLA separately. This slightly simpler approach to migration was warranted as the overseas component is negligible in most SLAs in comparison with inter-SLA migration. Furthermore as an annual historical time-series only exists at the SLA level for net migration, any overseas/inter-SLA split can only be approximated using past Census data. For ages 0 to maximum age - 1: (xx) Px+1(t+1) = Px(t) * [1-Qx(t)] (xxi) Pmax(t+1) = Pmax(t) * [1-Qmax(t)] +
x

Pmax-1(t) * [1-Qmax-1(t)] Births were then calculated: 45-49 45-49
(xxii) B(t) = 0.5*(Σ[Fx(t)*Pf,x(t)] + Σ[Fx(t+1) * Pf,x(t+1)]) x=15-19 x=15-19 After constraining to projected capital city/balance of state births, these were then used to calculate age 0 in the projected year: (xxiii) P0(t+1) = B(t) * (1-Qb(t)) SLA migration departures were calculated by applying 2001 Census-derived departure rates to the population: (xxiv) DEPx(t+1) = Px(t+1) * DEPRATEx Total SLA arrivals were then derived using the pre-set net migration assumptions: x=max
(xxv) ARR(t+1) = NM(t+1) - Σ DEPx(t+1) x=0 (xxvi) The assumed age-specific arrival levels were derived from 2001 Census data.
Together with departures from (xxiv) these were simultaneously constrained (via IPF - see xvii - xix) to:
(a) SLA arrival and departure totals (from the previous 2 steps) (b) capital city/balance of state age-specific net internal migration Then the arrivals and departures were applied to the population projected so far: (xxvii) Px(t+1) = Px(t+1) + ARRx(t+1) - DEPx(t+1) After constraining the SLA age/sex populations to sum to the capital city/balance of state projections using iterative proportional fitting (method described in Step 2), year t+1 then became the base for projecting the next year and the cycle was repeated until the projection horizon was reached. Step 4 - Census Collection District Projections This involved splitting the completed SLA population projections into Census Collection Districts. (xxviii) Each CD's ERP aged 18 and over was extrapolated linearly to May 2010, based
on June 2001 - June 2004 data. (xxix) Results were then aligned so they summed to the SLA projections. Two
approaches were used for this: (a) If extrapolated CDs sum to less than projected SLAs (or both projection
& extrapolation falling) then scale all CDs in the SLA prorata.
xi

(b) If the extrapolation was growing faster than the projection, scale down only the growth CDs according to their share of the growing CDs.
This dual approach improved the results for CDs in SLAs where there was widely divergent CD growth. Note: CD ERP uses building approval data by dwelling-type to incorporate differential growth of CDs when disaggregating post-censal SLA ERP. This affects total CD growth rather than targeting age/sex population change. By constraining to SLA ERP it indirectly 'ages' individual cohorts but resulting CD ERP will tend to reflect the 2001 Census age/sex profiles more than would actually be the case in subsequent years. Sometimes more recent building approvals by CD becomes available that has not been included in CD ERP. For CDs showing many new approvals but their extrapolation/projection was not showing growth, extra growth was phased in over the following 3 financial years (to allow for occupancy lags).
xii

Conversion of Australian Bureau of Statistics (ABS) Population Projections to Enrolment Projections The Australian Bureau of Statistics (ABS) have calculated projections of the population of Australian residents aged 18 years and over for each Census Collection District (CD) starting with a base at 30 June 2004 annually through to 30 June 2010. To allow baseline comparison with latest electoral roll counts, interpolation was used to derive 15 November 2005 population. The 31 May 2010 population projections were also calculated by interpolating between 30 June figures. For most CDs it was assumed that the proportional relationship between electoral enrolments and resident population aged 18+ will continue. Accordingly, the population projections were converted to enrolment projections as follows:
P2005 = ABS projection of residents aged 18+ at 15 November 2005 P2010 = ABS projection of residents aged 18+ at 31 May 2010 E2005 = Enrolled persons at 15 November 2005 E2010 = Projected enrolled persons at 31 May 2010 E2010 = (E2005 / P2005) * P2010
For example, a Census Collection District's figures may be:
P2005 = 471 P2010 = 498 E2005 = 411 E2010 = (411 / 471) * 498 = 435
Some CDs with very high growth have low enrolment population ratios due to lags in occupancy and/or change in enrolment address. These ratios were adjusted upwards as the lags work out over time, adjusting to the degree necessary to maintain the overall State enrolment ratio. In a minority of CDs where enrolments were greater than the baseline population projection, it was assumed that electoral enrolments will grow by the same amount as the population of Australian residents aged 18+, ie:
E2010 = E2005 + (P2010 - P2005)
For example, a Census Collection District's figures may be:
P2005 = 146 P2010 = 228 E2005 = 150 E2010 = 150 + (228-146) = 232
Thereafter the Australian Electoral Commission may amend the enrolment projections for certain CDs based on specific local knowledge of the area.
xiii

New South Wales
Redistribution Statistics 2006
Enrolment Projections by Division
Division
No of CCDs
Enrolment 2/12/2005
Estimate 31/5/2010
Growth (%)
1
Banks 189 82423 85843 4.15 Barton 219 84704 89637 5.82 Bennelong 221 85444 87031 1.86 Berowra 185 86586 91187 5.31 Blaxland 184 82590 86325 4.52 Bradfield 198 89386 92606 3.60 Calare 274 86893 92670 6.65 Charlton 198 85353 91285 6.95 Chifley 201 84136 90186 7.19 Cook 204 81538 85341 4.66 Cowper 224 85065 92563 8.81 Cunningham 211 81705 85187 4.26 Dobell 222 85394 93634 9.65 Eden-Monaro 322 92397 100916 9.22 Farrer 306 84668 88740 4.81 Fowler 192 83287 87591 5.17 Gilmore 258 87267 96055 10.07 Grayndler 275 85297 85707 0.48 Greenway 203 90988 101316 11.35 Gwydir 399 81268 82525 1.55 Hughes 187 86313 90099 4.39 Hume 277 89537 97176 8.53 Hunter 234 88608 97165 9.66 Kingsford Smith 250 84902 87377 2.92 Lindsay 186 82163 85873 4.52 Lowe 226 87038 95444 9.66 Lyne 244 92056 100250 8.90 Macarthur 174 84516 97034 14.81 Mackellar 209 87348 89642 2.63 Macquarie 232 86535 90284 4.33 Mitchell 171 96276 108464 12.66 Newcastle 266 89252 95023 6.47 New England 332 85394 88259 3.36 North Sydney 279 88458 91844 3.83 Page 269 84071 87616 4.22 Parkes 329 80410 82811 2.99 Parramatta 229 87077 91133 4.66 Paterson 246 87873 97311 10.74 Prospect 183 88117 93083 5.64 Reid 200 78811 85458 8.43 Richmond 217 86218 95809 11.12 Riverina 293 87423 92196 5.46 Robertson 230 84875 89324 5.24

New South Wales
Redistribution Statistics 2006
Enrolment Projections by Division
Division
No of CCDs
Enrolment 2/12/2005
Estimate 31/5/2010
Growth (%)
2
Shortland 214 87001 91051 4.66 Sydney 356 96189 107587 11.85 Throsby 195 87268 92851 6.40 Warringah 258 84489 87595 3.68 Watson 209 81288 83329 2.51 Wentworth 290 83273 83296 0.03 Werriwa 187 89427 101210 13.18
New South Wales 11857 4308595 4581939 6.34

New South Wales Redistribution Statistics 2006
Enrolment Projections Banks
Actual Enrolment Estimate Growth SLA Name CCD Number 2/12/2005 31/5/2010 (%)
3
Bankstown (C) 1-34-18-04 466 474 1.72 Bankstown (C) 1-34-18-05 440 442 0.45 Bankstown (C) 1-34-18-06 533 550 3.19 Bankstown (C) 1-34-18-07 353 361 2.27 Bankstown (C) 1-34-18-08 685 695 1.46 Bankstown (C) 1-34-18-09 616 656 6.49 Bankstown (C) 1-34-18-10 563 579 2.84 Bankstown (C) 1-34-18-11 444 453 2.03 Bankstown (C) 1-34-18-12 440 452 2.73 Bankstown (C) 1-34-18-13 580 600 3.45 Bankstown (C) 1-34-21-01 408 431 5.64 Bankstown (C) 1-34-21-02 713 749 5.05 Bankstown (C) 1-34-21-03 305 326 6.89 Bankstown (C) 1-34-21-04 363 367 1.10 Bankstown (C) 1-34-21-05 564 587 4.08 Bankstown (C) 1-34-21-06 769 788 2.47 Bankstown (C) 1-34-21-07 547 573 4.75 Bankstown (C) 1-34-21-08 596 619 3.86 Bankstown (C) 1-34-21-11 376 411 9.31 Bankstown (C) 1-34-21-12 315 329 4.44 Bankstown (C) 1-34-22-01 502 511 1.79 Bankstown (C) 1-34-22-02 512 532 3.91 Bankstown (C) 1-34-22-03 401 406 1.25 Bankstown (C) 1-34-22-04 246 261 6.10 Bankstown (C) 1-34-22-05 362 446 23.20 Bankstown (C) 1-34-22-06 633 642 1.42 Bankstown (C) 1-34-22-07 493 509 3.25 Bankstown (C) 1-34-22-08 309 317 2.59 Bankstown (C) 1-34-22-09 444 459 3.38 Bankstown (C) 1-34-22-10 401 430 7.23 Bankstown (C) 1-34-22-11 510 519 1.76 Bankstown (C) 1-34-23-01 597 615 3.02 Bankstown (C) 1-34-23-02 430 454 5.58 Bankstown (C) 1-34-23-03 587 601 2.39 Bankstown (C) 1-34-23-04 269 296 10.04 Bankstown (C) 1-34-23-05 321 342 6.54 Bankstown (C) 1-34-23-06 472 487 3.18 Bankstown (C) 1-34-23-07 488 505 3.48 Bankstown (C) 1-34-23-08 323 339 4.95 Bankstown (C) 1-34-23-09 381 388 1.84 Bankstown (C) 1-34-23-10 783 822 4.98

New South Wales Redistribution Statistics 2006
Enrolment Projections Banks
Actual Enrolment Estimate Growth SLA Name CCD Number 2/12/2005 31/5/2010 (%)
4
Bankstown (C) 1-34-23-11 736 761 3.40 Bankstown (C) 1-34-24-01 426 451 5.87 Bankstown (C) 1-34-24-02 652 674 3.37 Bankstown (C) 1-34-24-03 753 853 13.28 Bankstown (C) 1-34-24-04 608 635 4.44 Bankstown (C) 1-34-24-05 325 349 7.38 Bankstown (C) 1-34-24-06 473 488 3.17 Bankstown (C) 1-34-24-07 540 549 1.67 Bankstown (C) 1-34-24-08 799 847 6.01 Bankstown (C) 1-34-24-09 474 490 3.38 Bankstown (C) 1-34-24-10 460 472 2.61 Bankstown (C) 1-34-24-11 327 325 -0.61 Bankstown (C) 1-34-25-01 507 607 19.72 Bankstown (C) 1-34-25-02 320 328 2.50 Bankstown (C) 1-34-25-03 487 507 4.11 Bankstown (C) 1-34-25-04 454 543 19.60 Bankstown (C) 1-34-25-05 426 439 3.05 Bankstown (C) 1-34-25-06 352 373 5.97 Bankstown (C) 1-34-25-07 540 570 5.56 Bankstown (C) 1-34-25-08 344 375 9.01 Bankstown (C) 1-34-25-09 403 427 5.96 Bankstown (C) 1-34-25-10 611 652 6.71 Bankstown (C) 1-34-25-11 310 332 7.10 Bankstown (C) 1-34-25-12 603 642 6.47 Bankstown (C) 1-34-26-01 379 387 2.11 Bankstown (C) 1-34-26-02 618 634 2.59 Bankstown (C) 1-34-26-03 293 297 1.37 Bankstown (C) 1-34-26-04 395 408 3.29 Bankstown (C) 1-34-26-05 322 339 5.28 Bankstown (C) 1-34-26-06 341 355 4.11 Bankstown (C) 1-34-26-07 678 708 4.42 Bankstown (C) 1-34-26-08 491 524 6.72 Bankstown (C) 1-34-26-09 448 473 5.58 Bankstown (C) 1-34-26-10 510 567 11.18 Bankstown (C) 1-34-26-11 352 353 0.28 Bankstown (C) 1-34-26-12 393 464 18.07 Bankstown (C) 77 36690 38521 4.99 Canterbury (C) 1-35-01-01 142 145 2.11 Canterbury (C) 1-35-01-02 214 210 -1.87 Canterbury (C) 1-35-01-03 339 340 0.29

New South Wales Redistribution Statistics 2006
Enrolment Projections Banks
Actual Enrolment Estimate Growth SLA Name CCD Number 2/12/2005 31/5/2010 (%)
5
Canterbury (C) 1-35-01-04 655 674 2.90 Canterbury (C) 1-35-01-05 519 541 4.24 Canterbury (C) 1-35-01-06 407 416 2.21 Canterbury (C) 1-35-01-07 480 498 3.75 Canterbury (C) 1-35-01-08 297 291 -2.02 Canterbury (C) 1-35-01-09 219 227 3.65 Canterbury (C) 1-35-01-10 208 213 2.40 Canterbury (C) 1-35-01-11 232 224 -3.45 Canterbury (C) 1-35-01-12 423 433 2.36 Canterbury (C) 1-35-01-13 268 277 3.36 Canterbury (C) 1-35-02-07 644 659 2.33 Canterbury (C) 1-35-02-08 390 388 -0.51 Canterbury (C) 1-35-02-09 541 549 1.48 Canterbury (C) 1-35-02-10 185 205 10.81 Canterbury (C) 1-35-02-11 688 702 2.03 Canterbury (C) 1-35-03-01 641 645 0.62 Canterbury (C) 1-35-03-02 539 537 -0.37 Canterbury (C) 1-35-03-03 374 395 5.61 Canterbury (C) 1-35-03-04 608 617 1.48 Canterbury (C) 1-35-03-05 441 454 2.95 Canterbury (C) 1-35-03-06 390 391 0.26 Canterbury (C) 1-35-03-07 416 415 -0.24 Canterbury (C) 1-35-03-08 375 380 1.33 Canterbury (C) 1-35-03-09 136 137 0.74 Canterbury (C) 1-35-03-10 464 468 0.86 Canterbury (C) 1-35-03-11 395 408 3.29 Canterbury (C) 29 11630 11839 1.80 Hurstville (C) 1-36-01-01 673 714 6.09 Hurstville (C) 1-36-01-02 522 534 2.30 Hurstville (C) 1-36-01-03 632 655 3.64 Hurstville (C) 1-36-01-04 556 582 4.68 Hurstville (C) 1-36-01-05 223 221 -0.90 Hurstville (C) 1-36-01-06 365 368 0.82 Hurstville (C) 1-36-01-07 666 687 3.15 Hurstville (C) 1-36-01-08 293 301 2.73 Hurstville (C) 1-36-01-09 362 389 7.46 Hurstville (C) 1-36-01-10 286 294 2.80 Hurstville (C) 1-36-02-01 493 503 2.03 Hurstville (C) 1-36-02-02 653 692 5.97 Hurstville (C) 1-36-02-03 659 723 9.71
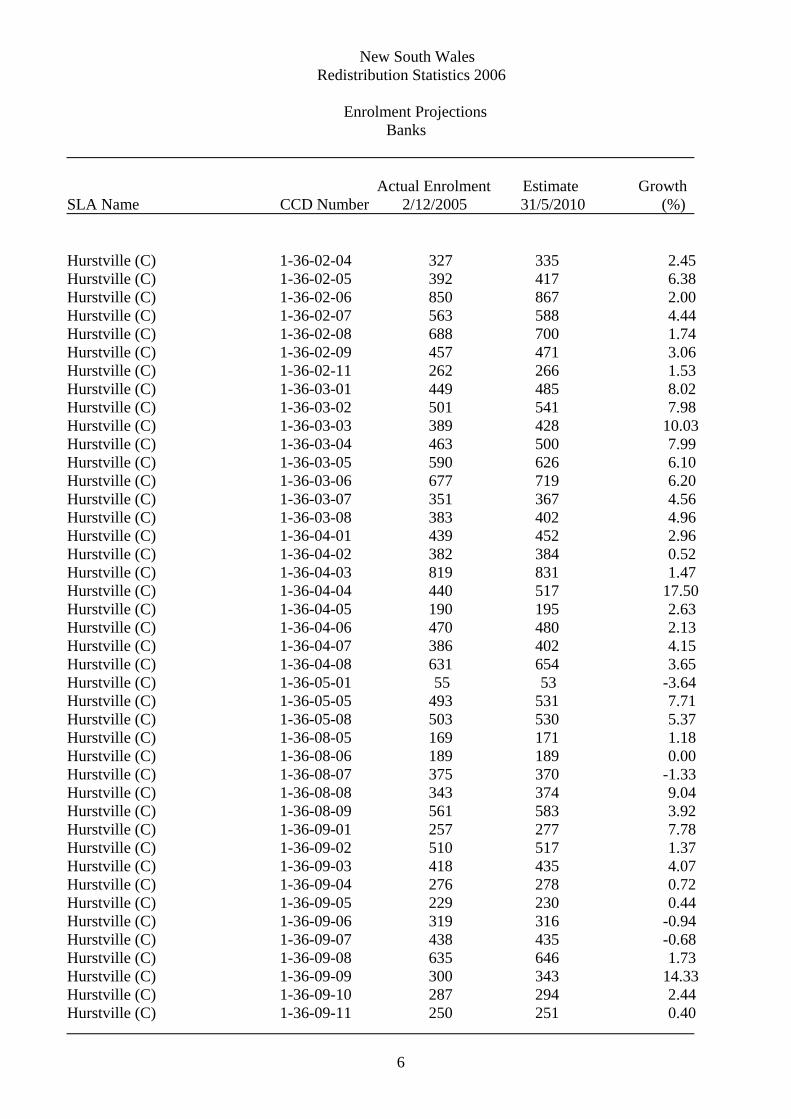
New South Wales Redistribution Statistics 2006
Enrolment Projections Banks
Actual Enrolment Estimate Growth SLA Name CCD Number 2/12/2005 31/5/2010 (%)
6
Hurstville (C) 1-36-02-04 327 335 2.45 Hurstville (C) 1-36-02-05 392 417 6.38 Hurstville (C) 1-36-02-06 850 867 2.00 Hurstville (C) 1-36-02-07 563 588 4.44 Hurstville (C) 1-36-02-08 688 700 1.74 Hurstville (C) 1-36-02-09 457 471 3.06 Hurstville (C) 1-36-02-11 262 266 1.53 Hurstville (C) 1-36-03-01 449 485 8.02 Hurstville (C) 1-36-03-02 501 541 7.98 Hurstville (C) 1-36-03-03 389 428 10.03 Hurstville (C) 1-36-03-04 463 500 7.99 Hurstville (C) 1-36-03-05 590 626 6.10 Hurstville (C) 1-36-03-06 677 719 6.20 Hurstville (C) 1-36-03-07 351 367 4.56 Hurstville (C) 1-36-03-08 383 402 4.96 Hurstville (C) 1-36-04-01 439 452 2.96 Hurstville (C) 1-36-04-02 382 384 0.52 Hurstville (C) 1-36-04-03 819 831 1.47 Hurstville (C) 1-36-04-04 440 517 17.50 Hurstville (C) 1-36-04-05 190 195 2.63 Hurstville (C) 1-36-04-06 470 480 2.13 Hurstville (C) 1-36-04-07 386 402 4.15 Hurstville (C) 1-36-04-08 631 654 3.65 Hurstville (C) 1-36-05-01 55 53 -3.64 Hurstville (C) 1-36-05-05 493 531 7.71 Hurstville (C) 1-36-05-08 503 530 5.37 Hurstville (C) 1-36-08-05 169 171 1.18 Hurstville (C) 1-36-08-06 189 189 0.00 Hurstville (C) 1-36-08-07 375 370 -1.33 Hurstville (C) 1-36-08-08 343 374 9.04 Hurstville (C) 1-36-08-09 561 583 3.92 Hurstville (C) 1-36-09-01 257 277 7.78 Hurstville (C) 1-36-09-02 510 517 1.37 Hurstville (C) 1-36-09-03 418 435 4.07 Hurstville (C) 1-36-09-04 276 278 0.72 Hurstville (C) 1-36-09-05 229 230 0.44 Hurstville (C) 1-36-09-06 319 316 -0.94 Hurstville (C) 1-36-09-07 438 435 -0.68 Hurstville (C) 1-36-09-08 635 646 1.73 Hurstville (C) 1-36-09-09 300 343 14.33 Hurstville (C) 1-36-09-10 287 294 2.44 Hurstville (C) 1-36-09-11 250 251 0.40

New South Wales Redistribution Statistics 2006
Enrolment Projections Banks
Actual Enrolment Estimate Growth SLA Name CCD Number 2/12/2005 31/5/2010 (%)
7
Hurstville (C) 1-36-09-12 176 191 8.52 Hurstville (C) 1-36-09-13 156 166 6.41 Hurstville (C) 1-36-10-01 397 408 2.77 Hurstville (C) 1-36-10-02 449 454 1.11 Hurstville (C) 1-36-10-03 398 423 6.28 Hurstville (C) 1-36-10-04 293 327 11.60 Hurstville (C) 1-36-10-05 406 423 4.19 Hurstville (C) 1-36-10-06 436 451 3.44 Hurstville (C) 1-36-10-07 390 402 3.08 Hurstville (C) 1-36-10-08 518 528 1.93 Hurstville (C) 1-36-10-09 618 671 8.58 Hurstville (C) 1-36-10-10 254 263 3.54 Hurstville (C) 1-36-10-11 234 238 1.71 Hurstville (C) 1-36-10-12 364 396 8.79 Hurstville (C) 1-36-11-02 586 590 0.68 Hurstville (C) 1-36-11-03 640 653 2.03 Hurstville (C) 1-36-11-04 578 579 0.17 Hurstville (C) 1-36-11-05 663 696 4.98 Hurstville (C) 1-36-11-06 699 704 0.72 Hurstville (C) 1-36-11-07 342 351 2.63 Hurstville (C) 1-36-11-08 320 324 1.25 Hurstville (C) 1-36-11-09 602 615 2.16 Hurstville (C) 1-36-11-10 495 517 4.44 Hurstville (C) 78 34103 35483 4.05 NSW Water areas 1-34-26-13 0 0 0.00 NSW Water areas 1-36-01-11 0 0 0.00 NSW Water areas 1-36-02-10 0 0 0.00 NSW Water areas 1-36-10-13 0 0 0.00 NSW Water areas 1-36-11-01 0 0 0.00 NSW Water areas 5 0 0 0.00 Banks 189 82423 85843 4.15
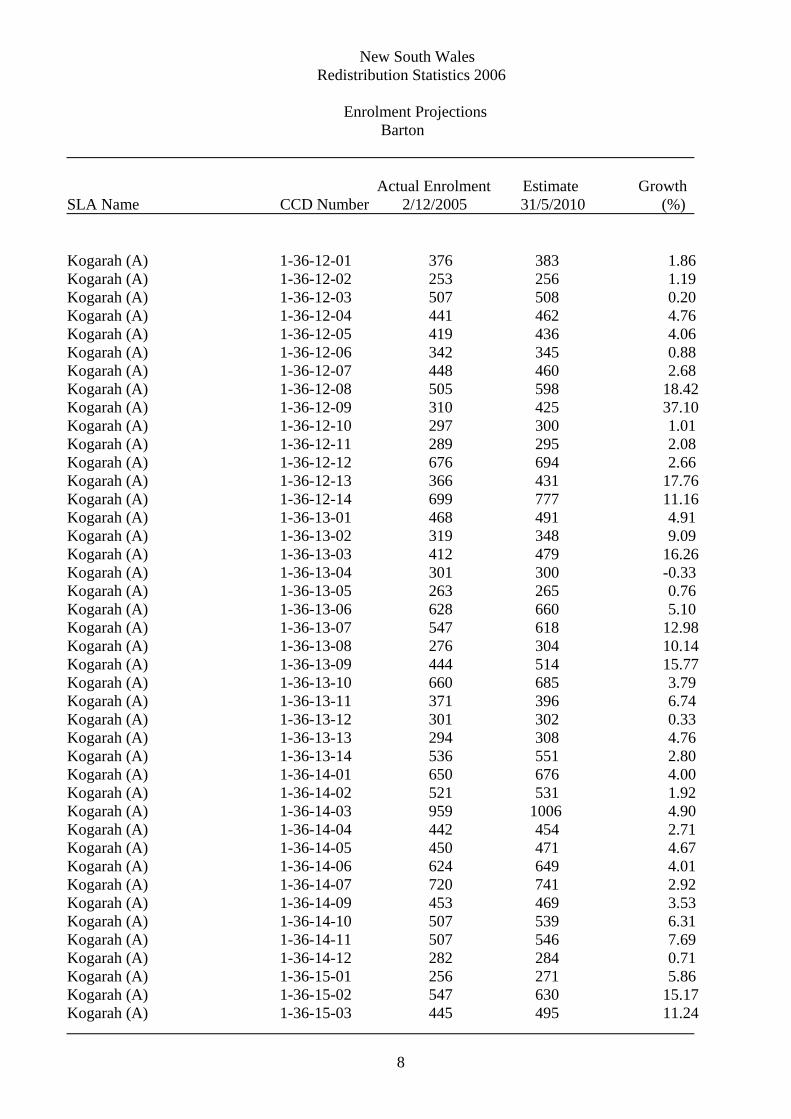
New South Wales Redistribution Statistics 2006
Enrolment Projections Barton
Actual Enrolment Estimate Growth SLA Name CCD Number 2/12/2005 31/5/2010 (%)
8
Kogarah (A) 1-36-12-01 376 383 1.86 Kogarah (A) 1-36-12-02 253 256 1.19 Kogarah (A) 1-36-12-03 507 508 0.20 Kogarah (A) 1-36-12-04 441 462 4.76 Kogarah (A) 1-36-12-05 419 436 4.06 Kogarah (A) 1-36-12-06 342 345 0.88 Kogarah (A) 1-36-12-07 448 460 2.68 Kogarah (A) 1-36-12-08 505 598 18.42 Kogarah (A) 1-36-12-09 310 425 37.10 Kogarah (A) 1-36-12-10 297 300 1.01 Kogarah (A) 1-36-12-11 289 295 2.08 Kogarah (A) 1-36-12-12 676 694 2.66 Kogarah (A) 1-36-12-13 366 431 17.76 Kogarah (A) 1-36-12-14 699 777 11.16 Kogarah (A) 1-36-13-01 468 491 4.91 Kogarah (A) 1-36-13-02 319 348 9.09 Kogarah (A) 1-36-13-03 412 479 16.26 Kogarah (A) 1-36-13-04 301 300 -0.33 Kogarah (A) 1-36-13-05 263 265 0.76 Kogarah (A) 1-36-13-06 628 660 5.10 Kogarah (A) 1-36-13-07 547 618 12.98 Kogarah (A) 1-36-13-08 276 304 10.14 Kogarah (A) 1-36-13-09 444 514 15.77 Kogarah (A) 1-36-13-10 660 685 3.79 Kogarah (A) 1-36-13-11 371 396 6.74 Kogarah (A) 1-36-13-12 301 302 0.33 Kogarah (A) 1-36-13-13 294 308 4.76 Kogarah (A) 1-36-13-14 536 551 2.80 Kogarah (A) 1-36-14-01 650 676 4.00 Kogarah (A) 1-36-14-02 521 531 1.92 Kogarah (A) 1-36-14-03 959 1006 4.90 Kogarah (A) 1-36-14-04 442 454 2.71 Kogarah (A) 1-36-14-05 450 471 4.67 Kogarah (A) 1-36-14-06 624 649 4.01 Kogarah (A) 1-36-14-07 720 741 2.92 Kogarah (A) 1-36-14-09 453 469 3.53 Kogarah (A) 1-36-14-10 507 539 6.31 Kogarah (A) 1-36-14-11 507 546 7.69 Kogarah (A) 1-36-14-12 282 284 0.71 Kogarah (A) 1-36-15-01 256 271 5.86 Kogarah (A) 1-36-15-02 547 630 15.17 Kogarah (A) 1-36-15-03 445 495 11.24

New South Wales Redistribution Statistics 2006
Enrolment Projections Barton
Actual Enrolment Estimate Growth SLA Name CCD Number 2/12/2005 31/5/2010 (%)
9
Kogarah (A) 1-36-15-04 409 425 3.91 Kogarah (A) 1-36-15-05 663 692 4.37 Kogarah (A) 1-36-15-06 236 251 6.36 Kogarah (A) 1-36-15-07 293 297 1.37 Kogarah (A) 1-36-15-08 475 540 13.68 Kogarah (A) 1-36-15-09 427 455 6.56 Kogarah (A) 1-36-15-10 554 579 4.51 Kogarah (A) 1-36-15-11 234 257 9.83 Kogarah (A) 1-36-15-12 201 207 2.99 Kogarah (A) 1-36-16-01 230 235 2.17 Kogarah (A) 1-36-16-02 405 421 3.95 Kogarah (A) 1-36-16-03 464 466 0.43 Kogarah (A) 1-36-16-04 581 610 4.99 Kogarah (A) 1-36-16-05 328 345 5.18 Kogarah (A) 1-36-16-06 469 474 1.07 Kogarah (A) 1-36-16-07 232 231 -0.43 Kogarah (A) 1-36-16-08 321 342 6.54 Kogarah (A) 1-36-16-09 394 418 6.09 Kogarah (A) 1-36-16-10 437 488 11.67 Kogarah (A) 1-36-16-11 439 452 2.96 Kogarah (A) 1-36-16-13 322 331 2.80 Kogarah (A) 1-36-17-01 299 315 5.35 Kogarah (A) 1-36-17-02 259 265 2.32 Kogarah (A) 1-36-17-03 312 318 1.92 Kogarah (A) 1-36-17-04 639 658 2.97 Kogarah (A) 1-36-17-05 429 446 3.96 Kogarah (A) 1-36-17-06 587 607 3.41 Kogarah (A) 1-36-17-07 454 463 1.98 Kogarah (A) 1-36-17-08 441 455 3.17 Kogarah (A) 1-36-17-09 247 260 5.26 Kogarah (A) 1-36-17-10 214 224 4.67 Kogarah (A) 1-36-17-11 386 393 1.81 Kogarah (A) 1-36-18-01 271 318 17.34 Kogarah (A) 1-36-18-02 315 372 18.10 Kogarah (A) 1-36-18-03 465 711 52.90 Kogarah (A) 1-36-18-04 341 383 12.32 Kogarah (A) 1-36-18-05 872 894 2.52 Kogarah (A) 1-36-18-06 162 173 6.79 Kogarah (A) 1-36-18-07 300 313 4.33 Kogarah (A) 1-36-18-08 233 259 11.16 Kogarah (A) 1-36-18-09 347 380 9.51

New South Wales Redistribution Statistics 2006
Enrolment Projections Barton
Actual Enrolment Estimate Growth SLA Name CCD Number 2/12/2005 31/5/2010 (%)
10
Kogarah (A) 83 34798 37076 6.55 NSW Water areas 1-36-13-15 0 0 0.00 NSW Water areas 1-36-14-08 0 0 0.00 NSW Water areas 1-36-16-12 0 0 0.00 NSW Water areas 1-36-32-01 0 0 0.00 NSW Water areas 4 0 0 0.00 Rockdale (C) 1-36-19-01 330 334 1.21 Rockdale (C) 1-36-19-02 386 391 1.30 Rockdale (C) 1-36-19-03 421 429 1.90 Rockdale (C) 1-36-19-04 339 333 -1.77 Rockdale (C) 1-36-19-05 334 357 6.89 Rockdale (C) 1-36-19-06 424 418 -1.42 Rockdale (C) 1-36-19-07 172 175 1.74 Rockdale (C) 1-36-19-08 296 302 2.03 Rockdale (C) 1-36-19-09 241 238 -1.24 Rockdale (C) 1-36-19-10 271 264 -2.58 Rockdale (C) 1-36-19-11 414 412 -0.48 Rockdale (C) 1-36-19-12 236 228 -3.39 Rockdale (C) 1-36-20-04 402 425 5.72 Rockdale (C) 1-36-20-05 568 582 2.46 Rockdale (C) 1-36-20-06 671 676 0.75 Rockdale (C) 1-36-20-07 542 561 3.51 Rockdale (C) 1-36-20-11 177 184 3.95 Rockdale (C) 1-36-20-12 252 248 -1.59 Rockdale (C) 1-36-22-06 499 505 1.20 Rockdale (C) 1-36-22-07 316 329 4.11 Rockdale (C) 1-36-22-08 345 354 2.61 Rockdale (C) 1-36-22-09 364 374 2.75 Rockdale (C) 1-36-22-10 308 311 0.97 Rockdale (C) 1-36-23-01 388 387 -0.26 Rockdale (C) 1-36-23-02 415 409 -1.45 Rockdale (C) 1-36-23-03 207 205 -0.97 Rockdale (C) 1-36-23-04 332 331 -0.30 Rockdale (C) 1-36-23-05 473 473 0.00 Rockdale (C) 1-36-23-06 542 551 1.66 Rockdale (C) 1-36-23-07 252 270 7.14 Rockdale (C) 1-36-23-08 164 162 -1.22 Rockdale (C) 1-36-23-09 416 420 0.96 Rockdale (C) 1-36-23-10 399 399 0.00

New South Wales Redistribution Statistics 2006
Enrolment Projections Barton
Actual Enrolment Estimate Growth SLA Name CCD Number 2/12/2005 31/5/2010 (%)
11
Rockdale (C) 1-36-23-11 326 336 3.07 Rockdale (C) 1-36-23-12 227 222 -2.20 Rockdale (C) 1-36-23-13 210 211 0.48 Rockdale (C) 1-36-24-01 177 174 -1.69 Rockdale (C) 1-36-24-02 382 408 6.81 Rockdale (C) 1-36-24-03 335 339 1.19 Rockdale (C) 1-36-24-04 433 432 -0.23 Rockdale (C) 1-36-24-05 640 643 0.47 Rockdale (C) 1-36-24-06 535 699 30.65 Rockdale (C) 1-36-24-07 358 385 7.54 Rockdale (C) 1-36-24-08 435 432 -0.69 Rockdale (C) 1-36-24-09 436 428 -1.83 Rockdale (C) 1-36-24-10 240 237 -1.25 Rockdale (C) 1-36-24-11 200 205 2.50 Rockdale (C) 1-36-24-12 374 365 -2.41 Rockdale (C) 1-36-25-01 632 940 48.73 Rockdale (C) 1-36-25-02 428 445 3.97 Rockdale (C) 1-36-25-03 382 380 -0.52 Rockdale (C) 1-36-25-04 602 979 62.62 Rockdale (C) 1-36-25-05 604 601 -0.50 Rockdale (C) 1-36-25-06 329 319 -3.04 Rockdale (C) 1-36-25-07 485 488 0.62 Rockdale (C) 1-36-25-08 567 566 -0.18 Rockdale (C) 1-36-25-09 377 393 4.24 Rockdale (C) 1-36-25-10 421 438 4.04 Rockdale (C) 1-36-25-11 567 558 -1.59 Rockdale (C) 1-36-26-01 334 739 121.26 Rockdale (C) 1-36-26-02 347 347 0.00 Rockdale (C) 1-36-26-03 612 620 1.31 Rockdale (C) 1-36-26-04 478 488 2.09 Rockdale (C) 1-36-26-05 525 527 0.38 Rockdale (C) 1-36-26-06 578 581 0.52 Rockdale (C) 1-36-26-07 450 450 0.00 Rockdale (C) 1-36-26-08 352 340 -3.41 Rockdale (C) 1-36-26-09 395 383 -3.04 Rockdale (C) 1-36-26-10 323 318 -1.55 Rockdale (C) 1-36-27-01 590 593 0.51 Rockdale (C) 1-36-27-02 382 528 38.22 Rockdale (C) 1-36-27-03 489 501 2.45 Rockdale (C) 1-36-27-04 502 530 5.58 Rockdale (C) 1-36-27-05 380 376 -1.05 Rockdale (C) 1-36-27-06 376 379 0.80
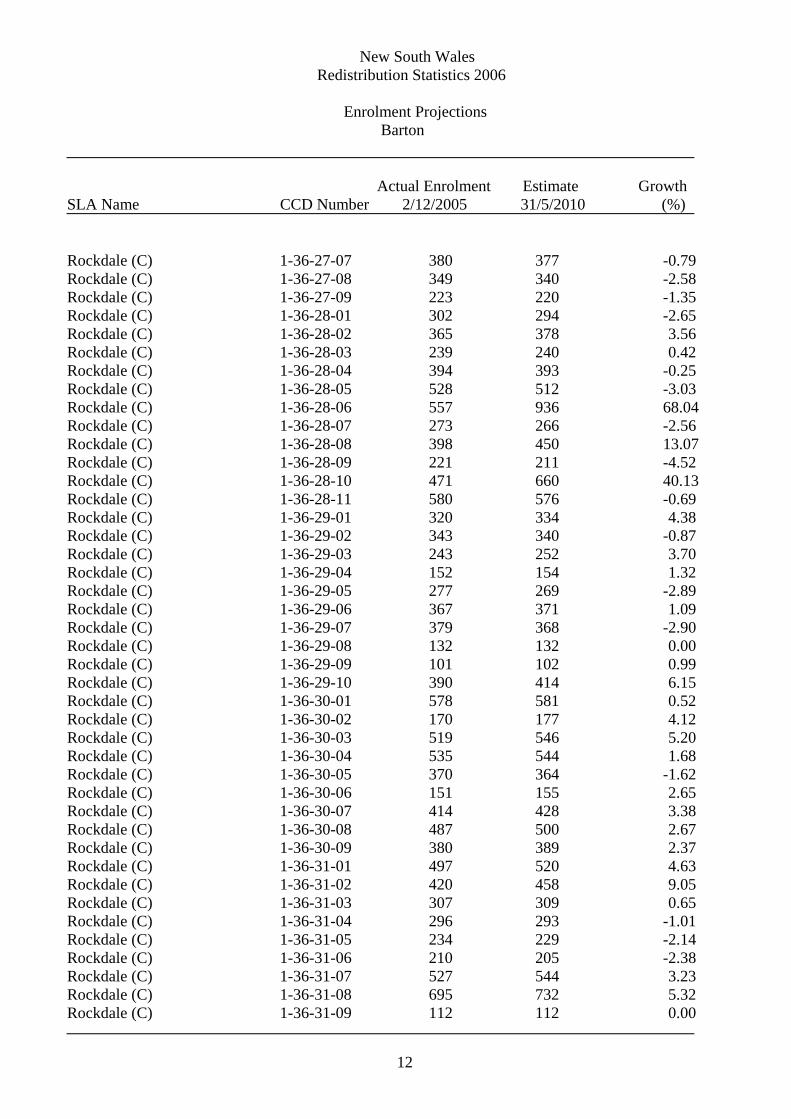
New South Wales Redistribution Statistics 2006
Enrolment Projections Barton
Actual Enrolment Estimate Growth SLA Name CCD Number 2/12/2005 31/5/2010 (%)
12
Rockdale (C) 1-36-27-07 380 377 -0.79 Rockdale (C) 1-36-27-08 349 340 -2.58 Rockdale (C) 1-36-27-09 223 220 -1.35 Rockdale (C) 1-36-28-01 302 294 -2.65 Rockdale (C) 1-36-28-02 365 378 3.56 Rockdale (C) 1-36-28-03 239 240 0.42 Rockdale (C) 1-36-28-04 394 393 -0.25 Rockdale (C) 1-36-28-05 528 512 -3.03 Rockdale (C) 1-36-28-06 557 936 68.04 Rockdale (C) 1-36-28-07 273 266 -2.56 Rockdale (C) 1-36-28-08 398 450 13.07 Rockdale (C) 1-36-28-09 221 211 -4.52 Rockdale (C) 1-36-28-10 471 660 40.13 Rockdale (C) 1-36-28-11 580 576 -0.69 Rockdale (C) 1-36-29-01 320 334 4.38 Rockdale (C) 1-36-29-02 343 340 -0.87 Rockdale (C) 1-36-29-03 243 252 3.70 Rockdale (C) 1-36-29-04 152 154 1.32 Rockdale (C) 1-36-29-05 277 269 -2.89 Rockdale (C) 1-36-29-06 367 371 1.09 Rockdale (C) 1-36-29-07 379 368 -2.90 Rockdale (C) 1-36-29-08 132 132 0.00 Rockdale (C) 1-36-29-09 101 102 0.99 Rockdale (C) 1-36-29-10 390 414 6.15 Rockdale (C) 1-36-30-01 578 581 0.52 Rockdale (C) 1-36-30-02 170 177 4.12 Rockdale (C) 1-36-30-03 519 546 5.20 Rockdale (C) 1-36-30-04 535 544 1.68 Rockdale (C) 1-36-30-05 370 364 -1.62 Rockdale (C) 1-36-30-06 151 155 2.65 Rockdale (C) 1-36-30-07 414 428 3.38 Rockdale (C) 1-36-30-08 487 500 2.67 Rockdale (C) 1-36-30-09 380 389 2.37 Rockdale (C) 1-36-31-01 497 520 4.63 Rockdale (C) 1-36-31-02 420 458 9.05 Rockdale (C) 1-36-31-03 307 309 0.65 Rockdale (C) 1-36-31-04 296 293 -1.01 Rockdale (C) 1-36-31-05 234 229 -2.14 Rockdale (C) 1-36-31-06 210 205 -2.38 Rockdale (C) 1-36-31-07 527 544 3.23 Rockdale (C) 1-36-31-08 695 732 5.32 Rockdale (C) 1-36-31-09 112 112 0.00

New South Wales Redistribution Statistics 2006
Enrolment Projections Barton
Actual Enrolment Estimate Growth SLA Name CCD Number 2/12/2005 31/5/2010 (%)
13
Rockdale (C) 1-36-31-10 219 219 0.00 Rockdale (C) 1-36-31-11 374 407 8.82 Rockdale (C) 1-36-31-12 267 260 -2.62 Rockdale (C) 1-36-32-02 329 334 1.52 Rockdale (C) 1-36-32-03 629 655 4.13 Rockdale (C) 1-36-32-04 450 458 1.78 Rockdale (C) 1-36-32-05 298 315 5.70 Rockdale (C) 1-36-32-06 834 875 4.92 Rockdale (C) 1-36-32-07 81 91 12.35 Rockdale (C) 1-36-32-08 333 341 2.40 Rockdale (C) 1-36-32-09 326 334 2.45 Rockdale (C) 1-36-32-10 171 197 15.20 Rockdale (C) 1-36-32-11 375 395 5.33 Rockdale (C) 1-36-32-12 405 424 4.69 Rockdale (C) 1-36-32-13 218 221 1.38 Rockdale (C) 132 49906 52561 5.32 Barton 219 84704 89637 5.82

New South Wales Redistribution Statistics 2006
Enrolment Projections Bennelong
Actual Enrolment Estimate Growth SLA Name CCD Number 2/12/2005 31/5/2010 (%)
14
Hornsby (A) 1-25-10-09 60 84 40.00 Hornsby (A) 1-25-11-01 275 271 -1.45 Hornsby (A) 1-25-11-02 390 386 -1.03 Hornsby (A) 1-25-11-03 619 602 -2.75 Hornsby (A) 1-25-11-04 838 859 2.51 Hornsby (A) 1-25-11-05 332 323 -2.71 Hornsby (A) 1-25-11-06 562 564 0.36 Hornsby (A) 1-25-11-07 646 646 0.00 Hornsby (A) 1-25-11-08 613 634 3.43 Hornsby (A) 1-25-11-09 619 622 0.48 Hornsby (A) 1-25-11-10 519 537 3.47 Hornsby (A) 1-25-11-11 381 375 -1.57 Hornsby (A) 1-25-12-01 594 593 -0.17 Hornsby (A) 1-25-12-02 375 385 2.67 Hornsby (A) 1-25-12-03 215 247 14.88 Hornsby (A) 1-25-12-04 380 392 3.16 Hornsby (A) 1-25-12-05 393 399 1.53 Hornsby (A) 1-25-12-06 327 317 -3.06 Hornsby (A) 1-25-12-07 427 438 2.58 Hornsby (A) 1-25-12-08 279 276 -1.08 Hornsby (A) 1-25-12-09 691 698 1.01 Hornsby (A) 1-25-12-10 588 590 0.34 Hornsby (A) 1-25-12-11 206 199 -3.40 Hornsby (A) 1-25-12-12 515 537 4.27 Hornsby (A) 1-25-12-13 187 181 -3.21 Hornsby (A) 1-25-13-05 178 191 7.30 Hornsby (A) 1-25-13-06 687 697 1.46 Hornsby (A) 1-25-13-07 415 415 0.00 Hornsby (A) 1-25-13-08 606 626 3.30 Hornsby (A) 1-25-13-09 365 380 4.11 Hornsby (A) 1-25-13-11 447 457 2.24 Hornsby (A) 1-25-13-15 361 370 2.49 Hornsby (A) 32 14090 14291 1.43 NSW Water areas 1-38-05-11 0 0 0.00 NSW Water areas 1-38-12-13 0 0 0.00 NSW Water areas 2 0 0 0.00 Parramatta (C) 1-33-09-01 729 800 9.74 Parramatta (C) 1-33-09-02 465 539 15.91

New South Wales Redistribution Statistics 2006
Enrolment Projections Bennelong
Actual Enrolment Estimate Growth SLA Name CCD Number 2/12/2005 31/5/2010 (%)
15
Parramatta (C) 1-33-09-06 421 430 2.14 Parramatta (C) 1-33-09-07 408 447 9.56 Parramatta (C) 1-33-09-08 161 165 2.48 Parramatta (C) 1-33-09-09 600 617 2.83 Parramatta (C) 1-33-09-10 431 438 1.62 Parramatta (C) 1-33-10-01 669 682 1.94 Parramatta (C) 1-33-10-02 321 318 -0.93 Parramatta (C) 1-33-10-03 358 361 0.84 Parramatta (C) 1-33-10-04 524 535 2.10 Parramatta (C) 1-33-10-05 303 290 -4.29 Parramatta (C) 1-33-10-06 271 258 -4.80 Parramatta (C) 1-33-10-07 293 278 -5.12 Parramatta (C) 1-33-10-08 282 290 2.84 Parramatta (C) 1-33-10-09 361 352 -2.49 Parramatta (C) 1-33-10-10 307 304 -0.98 Parramatta (C) 1-33-10-11 359 362 0.84 Parramatta (C) 1-33-10-12 400 393 -1.75 Parramatta (C) 1-33-10-13 253 259 2.37 Parramatta (C) 20 7916 8118 2.55 Ryde (C) 1-38-01-01 143 141 -1.40 Ryde (C) 1-38-01-02 88 84 -4.55 Ryde (C) 1-38-01-03 428 439 2.57 Ryde (C) 1-38-01-04 815 800 -1.84 Ryde (C) 1-38-01-05 225 220 -2.22 Ryde (C) 1-38-01-06 611 634 3.76 Ryde (C) 1-38-01-07 483 473 -2.07 Ryde (C) 1-38-01-08 528 516 -2.27 Ryde (C) 1-38-01-09 427 420 -1.64 Ryde (C) 1-38-01-10 251 242 -3.59 Ryde (C) 1-38-01-11 273 273 0.00 Ryde (C) 1-38-01-12 250 248 -0.80 Ryde (C) 1-38-01-13 334 323 -3.29 Ryde (C) 1-38-01-14 345 337 -2.32 Ryde (C) 1-38-01-15 266 255 -4.14 Ryde (C) 1-38-01-16 442 442 0.00 Ryde (C) 1-38-02-01 387 383 -1.03 Ryde (C) 1-38-02-02 399 410 2.76 Ryde (C) 1-38-02-03 104 105 0.96 Ryde (C) 1-38-02-04 510 503 -1.37 Ryde (C) 1-38-02-05 564 564 0.00

New South Wales Redistribution Statistics 2006
Enrolment Projections Bennelong
Actual Enrolment Estimate Growth SLA Name CCD Number 2/12/2005 31/5/2010 (%)
16
Ryde (C) 1-38-02-06 140 138 -1.43 Ryde (C) 1-38-02-07 291 290 -0.34 Ryde (C) 1-38-02-08 374 373 -0.27 Ryde (C) 1-38-02-09 212 214 0.94 Ryde (C) 1-38-02-10 141 143 1.42 Ryde (C) 1-38-02-11 244 245 0.41 Ryde (C) 1-38-02-12 259 278 7.34 Ryde (C) 1-38-02-13 349 346 -0.86 Ryde (C) 1-38-03-01 505 503 -0.40 Ryde (C) 1-38-03-02 584 593 1.54 Ryde (C) 1-38-03-03 356 367 3.09 Ryde (C) 1-38-03-04 159 158 -0.63 Ryde (C) 1-38-03-05 177 176 -0.56 Ryde (C) 1-38-03-06 507 518 2.17 Ryde (C) 1-38-03-07 345 351 1.74 Ryde (C) 1-38-03-08 317 330 4.10 Ryde (C) 1-38-03-09 325 322 -0.92 Ryde (C) 1-38-03-10 521 520 -0.19 Ryde (C) 1-38-03-11 236 241 2.12 Ryde (C) 1-38-03-12 182 189 3.85 Ryde (C) 1-38-03-13 284 274 -3.52 Ryde (C) 1-38-04-01 293 283 -3.41 Ryde (C) 1-38-04-02 368 375 1.90 Ryde (C) 1-38-04-03 253 254 0.40 Ryde (C) 1-38-04-04 265 273 3.02 Ryde (C) 1-38-04-05 185 187 1.08 Ryde (C) 1-38-04-06 382 378 -1.05 Ryde (C) 1-38-04-07 261 254 -2.68 Ryde (C) 1-38-04-08 252 271 7.54 Ryde (C) 1-38-04-09 429 437 1.86 Ryde (C) 1-38-04-10 266 262 -1.50 Ryde (C) 1-38-04-11 416 421 1.20 Ryde (C) 1-38-05-01 697 712 2.15 Ryde (C) 1-38-05-02 289 298 3.11 Ryde (C) 1-38-05-03 337 373 10.68 Ryde (C) 1-38-05-04 272 273 0.37 Ryde (C) 1-38-05-05 307 313 1.95 Ryde (C) 1-38-05-06 203 218 7.39 Ryde (C) 1-38-05-07 271 268 -1.11 Ryde (C) 1-38-05-08 310 303 -2.26 Ryde (C) 1-38-05-09 348 610 75.29 Ryde (C) 1-38-05-10 508 728 43.31

New South Wales Redistribution Statistics 2006
Enrolment Projections Bennelong
Actual Enrolment Estimate Growth SLA Name CCD Number 2/12/2005 31/5/2010 (%)
17
Ryde (C) 1-38-06-01 386 386 0.00 Ryde (C) 1-38-06-02 320 320 0.00 Ryde (C) 1-38-06-03 625 625 0.00 Ryde (C) 1-38-06-04 377 381 1.06 Ryde (C) 1-38-06-05 475 526 10.74 Ryde (C) 1-38-06-06 472 483 2.33 Ryde (C) 1-38-06-07 458 460 0.44 Ryde (C) 1-38-06-08 672 671 -0.15 Ryde (C) 1-38-06-09 593 608 2.53 Ryde (C) 1-38-06-10 340 370 8.82 Ryde (C) 1-38-07-01 547 573 4.75 Ryde (C) 1-38-07-02 413 409 -0.97 Ryde (C) 1-38-07-03 440 450 2.27 Ryde (C) 1-38-07-04 611 632 3.44 Ryde (C) 1-38-07-05 497 508 2.21 Ryde (C) 1-38-07-06 436 452 3.67 Ryde (C) 1-38-07-07 242 229 -5.37 Ryde (C) 1-38-07-08 425 436 2.59 Ryde (C) 1-38-07-09 241 249 3.32 Ryde (C) 1-38-07-10 202 202 0.00 Ryde (C) 1-38-07-11 598 611 2.17 Ryde (C) 1-38-07-12 205 203 -0.98 Ryde (C) 1-38-08-01 441 478 8.39 Ryde (C) 1-38-08-02 713 723 1.40 Ryde (C) 1-38-08-03 408 465 13.97 Ryde (C) 1-38-08-04 586 587 0.17 Ryde (C) 1-38-08-05 374 369 -1.34 Ryde (C) 1-38-08-06 287 290 1.05 Ryde (C) 1-38-08-07 426 446 4.69 Ryde (C) 1-38-08-08 444 448 0.90 Ryde (C) 1-38-08-09 507 501 -1.18 Ryde (C) 1-38-09-01 22 22 0.00 Ryde (C) 1-38-09-02 212 216 1.89 Ryde (C) 1-38-09-03 380 372 -2.11 Ryde (C) 1-38-09-04 154 152 -1.30 Ryde (C) 1-38-09-05 178 174 -2.25 Ryde (C) 1-38-09-06 153 148 -3.27 Ryde (C) 1-38-09-07 622 642 3.22 Ryde (C) 1-38-09-08 436 501 14.91 Ryde (C) 1-38-09-09 682 695 1.91 Ryde (C) 1-38-09-10 187 187 0.00 Ryde (C) 1-38-09-11 576 565 -1.91

New South Wales Redistribution Statistics 2006
Enrolment Projections Bennelong
Actual Enrolment Estimate Growth SLA Name CCD Number 2/12/2005 31/5/2010 (%)
18
Ryde (C) 1-38-10-01 441 464 5.22 Ryde (C) 1-38-10-02 524 557 6.30 Ryde (C) 1-38-10-03 310 314 1.29 Ryde (C) 1-38-10-04 438 439 0.23 Ryde (C) 1-38-10-05 308 308 0.00 Ryde (C) 1-38-10-06 742 738 -0.54 Ryde (C) 1-38-10-07 470 469 -0.21 Ryde (C) 1-38-10-08 394 388 -1.52 Ryde (C) 1-38-10-09 692 678 -2.02 Ryde (C) 1-38-10-10 588 589 0.17 Ryde (C) 1-38-10-11 402 404 0.50 Ryde (C) 1-38-11-01 513 510 -0.58 Ryde (C) 1-38-11-02 233 228 -2.15 Ryde (C) 1-38-11-03 422 428 1.42 Ryde (C) 1-38-11-04 391 408 4.35 Ryde (C) 1-38-11-05 614 615 0.16 Ryde (C) 1-38-11-06 364 365 0.27 Ryde (C) 1-38-11-07 651 659 1.23 Ryde (C) 1-38-11-08 441 463 4.99 Ryde (C) 1-38-11-09 193 191 -1.04 Ryde (C) 1-38-11-10 401 402 0.25 Ryde (C) 1-38-11-11 323 322 -0.31 Ryde (C) 1-38-11-12 614 611 -0.49 Ryde (C) 1-38-11-13 243 253 4.12 Ryde (C) 1-38-11-14 333 345 3.60 Ryde (C) 1-38-12-01 476 465 -2.31 Ryde (C) 1-38-12-02 243 236 -2.88 Ryde (C) 1-38-12-03 168 176 4.76 Ryde (C) 1-38-12-04 229 224 -2.18 Ryde (C) 1-38-12-05 602 604 0.33 Ryde (C) 1-38-12-06 431 436 1.16 Ryde (C) 1-38-12-07 443 448 1.13 Ryde (C) 1-38-12-08 539 545 1.11 Ryde (C) 1-38-12-09 585 587 0.34 Ryde (C) 1-38-12-10 156 149 -4.49 Ryde (C) 1-38-12-11 283 311 9.89 Ryde (C) 1-38-12-12 158 153 -3.16 Ryde (C) 1-38-13-01 670 701 4.63 Ryde (C) 1-38-13-02 371 384 3.50 Ryde (C) 1-38-13-03 300 300 0.00 Ryde (C) 1-38-13-04 573 585 2.09 Ryde (C) 1-38-13-05 438 437 -0.23

New South Wales Redistribution Statistics 2006
Enrolment Projections Bennelong
Actual Enrolment Estimate Growth SLA Name CCD Number 2/12/2005 31/5/2010 (%)
19
Ryde (C) 1-38-13-06 363 375 3.31 Ryde (C) 1-38-13-07 120 125 4.17 Ryde (C) 1-38-13-08 203 199 -1.97 Ryde (C) 1-38-13-09 298 293 -1.68 Ryde (C) 1-38-13-10 333 313 -6.01 Ryde (C) 1-38-13-11 370 388 4.86 Ryde (C) 1-38-13-12 185 180 -2.70 Ryde (C) 1-38-14-01 688 691 0.44 Ryde (C) 1-38-14-02 409 412 0.73 Ryde (C) 1-38-14-03 317 324 2.21 Ryde (C) 1-38-14-04 231 237 2.60 Ryde (C) 1-38-14-05 597 600 0.50 Ryde (C) 1-38-14-06 284 282 -0.70 Ryde (C) 1-38-14-07 265 257 -3.02 Ryde (C) 1-38-14-08 265 265 0.00 Ryde (C) 1-38-14-09 481 489 1.66 Ryde (C) 1-38-14-10 329 326 -0.91 Ryde (C) 1-38-14-11 410 420 2.44 Ryde (C) 1-38-14-12 374 368 -1.60 Ryde (C) 1-38-14-13 550 552 0.36 Ryde (C) 167 63438 64622 1.87 Bennelong 221 85444 87031 1.86

New South Wales Redistribution Statistics 2006
Enrolment Projections Berowra
Actual Enrolment Estimate Growth SLA Name CCD Number 2/12/2005 31/5/2010 (%)
20
Baulkham Hills (A) 1-26-01-01 324 336 3.70 Baulkham Hills (A) 1-26-01-02 191 206 7.85 Baulkham Hills (A) 1-26-01-03 137 148 8.03 Baulkham Hills (A) 1-26-01-04 263 262 -0.38 Baulkham Hills (A) 1-26-01-05 220 223 1.36 Baulkham Hills (A) 1-26-01-06 387 380 -1.81 Baulkham Hills (A) 1-26-01-07 417 424 1.68 Baulkham Hills (A) 1-26-01-08 108 107 -0.93 Baulkham Hills (A) 1-26-01-09 363 409 12.67 Baulkham Hills (A) 1-26-01-10 165 176 6.67 Baulkham Hills (A) 1-26-02-01 467 471 0.86 Baulkham Hills (A) 1-26-17-08 249 258 3.61 Baulkham Hills (A) 12 3291 3400 3.31 Hornsby (A) 1-25-01-01 162 181 11.73 Hornsby (A) 1-25-01-02 217 217 0.00 Hornsby (A) 1-25-01-03 347 351 1.15 Hornsby (A) 1-25-01-04 358 368 2.79 Hornsby (A) 1-25-01-05 316 333 5.38 Hornsby (A) 1-25-01-06 245 248 1.22 Hornsby (A) 1-25-01-07 247 253 2.43 Hornsby (A) 1-25-01-08 650 653 0.46 Hornsby (A) 1-25-01-09 571 581 1.75 Hornsby (A) 1-25-01-10 212 215 1.42 Hornsby (A) 1-25-01-11 268 273 1.87 Hornsby (A) 1-25-01-12 239 236 -1.26 Hornsby (A) 1-25-01-13 227 227 0.00 Hornsby (A) 1-25-01-14 90 91 1.11 Hornsby (A) 1-25-02-01 749 750 0.13 Hornsby (A) 1-25-02-02 181 196 8.29 Hornsby (A) 1-25-02-03 599 619 3.34 Hornsby (A) 1-25-02-04 34 40 17.65 Hornsby (A) 1-25-02-05 394 413 4.82 Hornsby (A) 1-25-02-06 602 646 7.31 Hornsby (A) 1-25-02-07 591 594 0.51 Hornsby (A) 1-25-02-08 476 492 3.36 Hornsby (A) 1-25-02-09 427 436 2.11 Hornsby (A) 1-25-02-11 510 520 1.96 Hornsby (A) 1-25-03-01 725 734 1.24 Hornsby (A) 1-25-03-02 574 583 1.57 Hornsby (A) 1-25-03-03 588 602 2.38

New South Wales Redistribution Statistics 2006
Enrolment Projections Berowra
Actual Enrolment Estimate Growth SLA Name CCD Number 2/12/2005 31/5/2010 (%)
21
Hornsby (A) 1-25-03-04 547 577 5.48 Hornsby (A) 1-25-03-05 585 705 20.51 Hornsby (A) 1-25-03-06 709 748 5.50 Hornsby (A) 1-25-03-07 505 503 -0.40 Hornsby (A) 1-25-03-08 455 473 3.96 Hornsby (A) 1-25-03-09 532 551 3.57 Hornsby (A) 1-25-03-10 344 351 2.03 Hornsby (A) 1-25-03-11 514 511 -0.58 Hornsby (A) 1-25-03-12 518 517 -0.19 Hornsby (A) 1-25-03-13 413 417 0.97 Hornsby (A) 1-25-04-01 590 598 1.36 Hornsby (A) 1-25-04-02 696 711 2.16 Hornsby (A) 1-25-04-03 366 363 -0.82 Hornsby (A) 1-25-04-04 616 623 1.14 Hornsby (A) 1-25-04-05 599 603 0.67 Hornsby (A) 1-25-04-06 406 413 1.72 Hornsby (A) 1-25-04-07 254 255 0.39 Hornsby (A) 1-25-04-08 237 240 1.27 Hornsby (A) 1-25-04-09 318 317 -0.31 Hornsby (A) 1-25-04-10 570 576 1.05 Hornsby (A) 1-25-05-01 643 751 16.80 Hornsby (A) 1-25-05-02 321 331 3.12 Hornsby (A) 1-25-05-03 318 323 1.57 Hornsby (A) 1-25-05-04 802 898 11.97 Hornsby (A) 1-25-05-07 516 521 0.97 Hornsby (A) 1-25-05-08 449 473 5.35 Hornsby (A) 1-25-05-09 822 825 0.36 Hornsby (A) 1-25-06-01 339 355 4.72 Hornsby (A) 1-25-06-02 360 370 2.78 Hornsby (A) 1-25-06-03 832 846 1.68 Hornsby (A) 1-25-06-04 621 620 -0.16 Hornsby (A) 1-25-06-05 476 491 3.15 Hornsby (A) 1-25-06-06 314 311 -0.96 Hornsby (A) 1-25-06-07 499 493 -1.20 Hornsby (A) 1-25-06-08 275 268 -2.55 Hornsby (A) 1-25-06-09 319 501 57.05 Hornsby (A) 1-25-06-10 460 468 1.74 Hornsby (A) 1-25-06-11 447 450 0.67 Hornsby (A) 1-25-06-12 261 257 -1.53 Hornsby (A) 1-25-07-01 794 1106 39.29 Hornsby (A) 1-25-07-02 846 1079 27.54 Hornsby (A) 1-25-07-03 744 748 0.54

New South Wales Redistribution Statistics 2006
Enrolment Projections Berowra
Actual Enrolment Estimate Growth SLA Name CCD Number 2/12/2005 31/5/2010 (%)
22
Hornsby (A) 1-25-07-04 470 474 0.85 Hornsby (A) 1-25-07-05 529 546 3.21 Hornsby (A) 1-25-07-06 544 600 10.29 Hornsby (A) 1-25-07-07 353 351 -0.57 Hornsby (A) 1-25-07-08 432 444 2.78 Hornsby (A) 1-25-07-09 726 730 0.55 Hornsby (A) 1-25-08-01 619 617 -0.32 Hornsby (A) 1-25-08-02 455 451 -0.88 Hornsby (A) 1-25-08-03 426 427 0.23 Hornsby (A) 1-25-08-04 487 492 1.03 Hornsby (A) 1-25-08-05 465 499 7.31 Hornsby (A) 1-25-08-06 349 356 2.01 Hornsby (A) 1-25-08-07 254 255 0.39 Hornsby (A) 1-25-08-08 930 934 0.43 Hornsby (A) 1-25-08-09 378 384 1.59 Hornsby (A) 1-25-08-10 525 522 -0.57 Hornsby (A) 1-25-08-11 645 654 1.40 Hornsby (A) 1-25-08-12 576 584 1.39 Hornsby (A) 1-25-08-13 369 387 4.88 Hornsby (A) 1-25-08-14 249 249 0.00 Hornsby (A) 1-25-09-01 734 736 0.27 Hornsby (A) 1-25-09-02 536 539 0.56 Hornsby (A) 1-25-09-03 833 849 1.92 Hornsby (A) 1-25-09-04 543 562 3.50 Hornsby (A) 1-25-09-05 464 487 4.96 Hornsby (A) 1-25-09-06 448 453 1.12 Hornsby (A) 1-25-09-07 421 432 2.61 Hornsby (A) 1-25-09-08 398 425 6.78 Hornsby (A) 1-25-09-09 500 529 5.80 Hornsby (A) 1-25-09-10 360 358 -0.56 Hornsby (A) 1-25-09-11 406 403 -0.74 Hornsby (A) 1-25-10-01 325 332 2.15 Hornsby (A) 1-25-10-02 664 665 0.15 Hornsby (A) 1-25-10-03 427 428 0.23 Hornsby (A) 1-25-10-04 657 677 3.04 Hornsby (A) 1-25-10-05 517 522 0.97 Hornsby (A) 1-25-10-06 586 592 1.02 Hornsby (A) 1-25-10-07 589 586 -0.51 Hornsby (A) 1-25-10-08 436 450 3.21 Hornsby (A) 1-25-10-09 507 703 38.66 Hornsby (A) 1-25-10-10 250 245 -2.00 Hornsby (A) 1-25-10-11 323 319 -1.24

New South Wales Redistribution Statistics 2006
Enrolment Projections Berowra
Actual Enrolment Estimate Growth SLA Name CCD Number 2/12/2005 31/5/2010 (%)
23
Hornsby (A) 1-25-10-12 738 767 3.93 Hornsby (A) 1-25-11-10 0 0 0.00 Hornsby (A) 1-25-13-01 458 474 3.49 Hornsby (A) 1-25-13-02 496 489 -1.41 Hornsby (A) 1-25-13-03 727 760 4.54 Hornsby (A) 1-25-13-04 608 628 3.29 Hornsby (A) 1-25-13-10 750 773 3.07 Hornsby (A) 1-25-13-12 214 217 1.40 Hornsby (A) 1-25-13-13 379 378 -0.26 Hornsby (A) 1-25-13-14 372 374 0.54 Hornsby (A) 1-25-14-01 806 816 1.24 Hornsby (A) 1-25-14-02 541 559 3.33 Hornsby (A) 1-25-14-03 343 354 3.21 Hornsby (A) 1-25-14-04 496 701 41.33 Hornsby (A) 1-25-14-05 479 495 3.34 Hornsby (A) 1-25-14-06 209 219 4.78 Hornsby (A) 1-25-14-07 663 662 -0.15 Hornsby (A) 1-25-14-08 615 634 3.09 Hornsby (A) 1-25-14-09 548 555 1.28 Hornsby (A) 1-25-14-10 701 747 6.56 Hornsby (A) 1-25-14-11 340 352 3.53 Hornsby (A) 1-25-14-12 488 491 0.61 Hornsby (A) 1-25-14-13 649 669 3.08 Hornsby (A) 1-25-15-01 379 394 3.96 Hornsby (A) 1-25-15-02 616 648 5.19 Hornsby (A) 1-25-15-03 1040 1494 43.65 Hornsby (A) 1-25-15-04 599 692 15.53 Hornsby (A) 1-25-15-05 214 351 64.02 Hornsby (A) 1-25-15-06 346 343 -0.87 Hornsby (A) 1-25-15-07 252 237 -5.95 Hornsby (A) 1-25-15-08 598 608 1.67 Hornsby (A) 1-25-15-09 322 316 -1.86 Hornsby (A) 1-25-15-10 249 248 -0.40 Hornsby (A) 1-25-15-11 711 703 -1.13 Hornsby (A) 1-25-15-12 112 312 178.57 Hornsby (A) 1-25-15-13 1027 1635 59.20 Hornsby (A) 1-25-16-01 422 433 2.61 Hornsby (A) 1-25-16-02 782 801 2.43 Hornsby (A) 1-25-16-03 395 421 6.58 Hornsby (A) 1-25-16-04 402 417 3.73 Hornsby (A) 1-25-16-05 250 260 4.00 Hornsby (A) 1-25-16-06 330 333 0.91
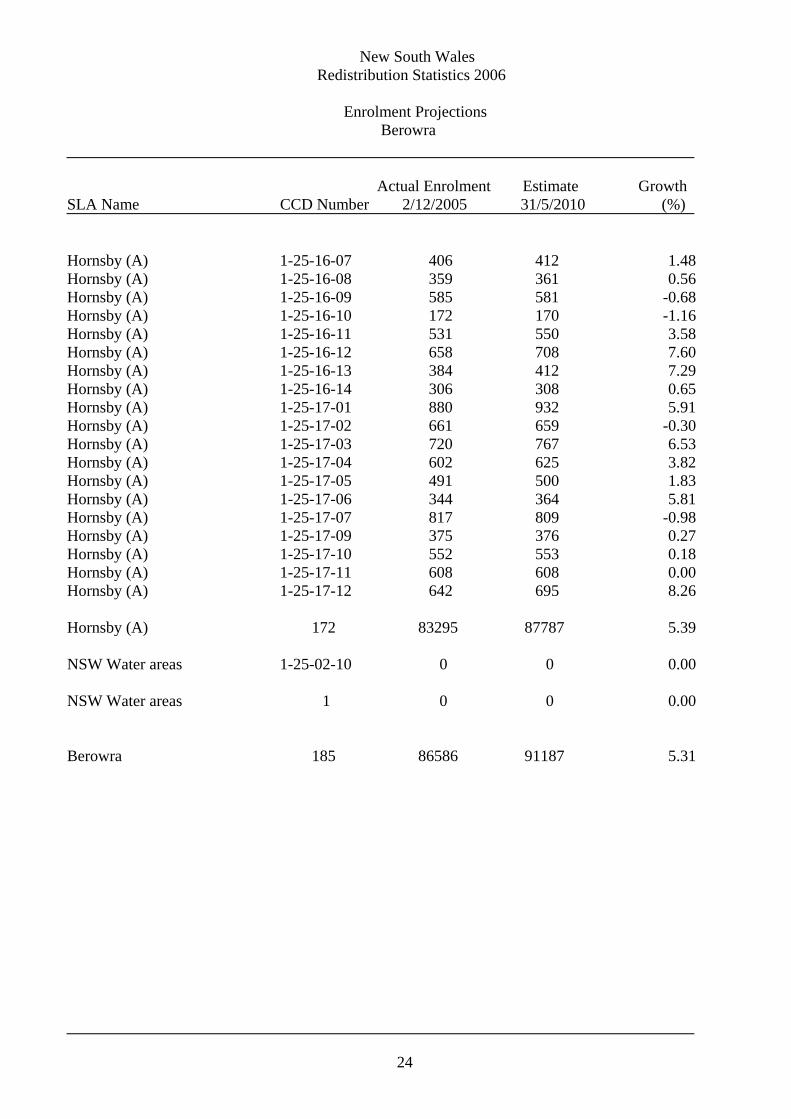
New South Wales Redistribution Statistics 2006
Enrolment Projections Berowra
Actual Enrolment Estimate Growth SLA Name CCD Number 2/12/2005 31/5/2010 (%)
24
Hornsby (A) 1-25-16-07 406 412 1.48 Hornsby (A) 1-25-16-08 359 361 0.56 Hornsby (A) 1-25-16-09 585 581 -0.68 Hornsby (A) 1-25-16-10 172 170 -1.16 Hornsby (A) 1-25-16-11 531 550 3.58 Hornsby (A) 1-25-16-12 658 708 7.60 Hornsby (A) 1-25-16-13 384 412 7.29 Hornsby (A) 1-25-16-14 306 308 0.65 Hornsby (A) 1-25-17-01 880 932 5.91 Hornsby (A) 1-25-17-02 661 659 -0.30 Hornsby (A) 1-25-17-03 720 767 6.53 Hornsby (A) 1-25-17-04 602 625 3.82 Hornsby (A) 1-25-17-05 491 500 1.83 Hornsby (A) 1-25-17-06 344 364 5.81 Hornsby (A) 1-25-17-07 817 809 -0.98 Hornsby (A) 1-25-17-09 375 376 0.27 Hornsby (A) 1-25-17-10 552 553 0.18 Hornsby (A) 1-25-17-11 608 608 0.00 Hornsby (A) 1-25-17-12 642 695 8.26 Hornsby (A) 172 83295 87787 5.39 NSW Water areas 1-25-02-10 0 0 0.00 NSW Water areas 1 0 0 0.00 Berowra 185 86586 91187 5.31

New South Wales Redistribution Statistics 2006
Enrolment Projections Blaxland
Actual Enrolment Estimate Growth SLA Name CCD Number 2/12/2005 31/5/2010 (%)
25
Bankstown (C) 1-34-08-01 589 603 2.38 Bankstown (C) 1-34-08-02 522 537 2.87 Bankstown (C) 1-34-08-03 332 342 3.01 Bankstown (C) 1-34-08-04 302 313 3.64 Bankstown (C) 1-34-08-05 427 428 0.23 Bankstown (C) 1-34-08-06 156 167 7.05 Bankstown (C) 1-34-08-07 364 364 0.00 Bankstown (C) 1-34-08-08 390 396 1.54 Bankstown (C) 1-34-08-09 510 510 0.00 Bankstown (C) 1-34-08-10 111 110 -0.90 Bankstown (C) 1-34-08-11 291 294 1.03 Bankstown (C) 1-34-09-01 325 335 3.08 Bankstown (C) 1-34-09-02 405 414 2.22 Bankstown (C) 1-34-09-03 655 685 4.58 Bankstown (C) 1-34-09-04 248 259 4.44 Bankstown (C) 1-34-09-05 520 568 9.23 Bankstown (C) 1-34-09-06 335 348 3.88 Bankstown (C) 1-34-09-07 353 368 4.25 Bankstown (C) 1-34-09-08 349 355 1.72 Bankstown (C) 1-34-09-09 475 517 8.84 Bankstown (C) 1-34-09-10 516 527 2.13 Bankstown (C) 1-34-09-11 131 138 5.34 Bankstown (C) 1-34-09-12 480 493 2.71 Bankstown (C) 1-34-09-13 415 428 3.13 Bankstown (C) 1-34-09-14 335 359 7.16 Bankstown (C) 1-34-10-01 350 368 5.14 Bankstown (C) 1-34-10-02 605 660 9.09 Bankstown (C) 1-34-10-03 462 483 4.55 Bankstown (C) 1-34-10-04 522 535 2.49 Bankstown (C) 1-34-10-05 418 420 0.48 Bankstown (C) 1-34-10-06 591 601 1.69 Bankstown (C) 1-34-10-07 658 663 0.76 Bankstown (C) 1-34-10-08 601 601 0.00 Bankstown (C) 1-34-10-09 492 503 2.24 Bankstown (C) 1-34-10-10 569 561 -1.41 Bankstown (C) 1-34-10-11 439 443 0.91 Bankstown (C) 1-34-10-12 511 514 0.59 Bankstown (C) 1-34-10-13 294 292 -0.68 Bankstown (C) 1-34-11-01 726 724 -0.28 Bankstown (C) 1-34-11-02 580 636 9.66 Bankstown (C) 1-34-11-03 700 744 6.29 Bankstown (C) 1-34-11-04 287 295 2.79

New South Wales Redistribution Statistics 2006
Enrolment Projections Blaxland
Actual Enrolment Estimate Growth SLA Name CCD Number 2/12/2005 31/5/2010 (%)
26
Bankstown (C) 1-34-11-05 509 531 4.32 Bankstown (C) 1-34-11-06 639 661 3.44 Bankstown (C) 1-34-11-07 283 291 2.83 Bankstown (C) 1-34-11-08 555 571 2.88 Bankstown (C) 1-34-11-09 266 277 4.14 Bankstown (C) 1-34-11-10 565 572 1.24 Bankstown (C) 1-34-12-01 430 443 3.02 Bankstown (C) 1-34-12-02 777 785 1.03 Bankstown (C) 1-34-12-03 561 566 0.89 Bankstown (C) 1-34-12-04 406 436 7.39 Bankstown (C) 1-34-12-05 649 667 2.77 Bankstown (C) 1-34-12-06 676 694 2.66 Bankstown (C) 1-34-12-07 345 359 4.06 Bankstown (C) 1-34-12-08 523 550 5.16 Bankstown (C) 1-34-12-09 611 623 1.96 Bankstown (C) 1-34-12-10 660 669 1.36 Bankstown (C) 1-34-12-11 401 410 2.24 Bankstown (C) 1-34-12-12 321 333 3.74 Bankstown (C) 1-34-12-13 260 259 -0.38 Bankstown (C) 1-34-13-01 425 492 15.76 Bankstown (C) 1-34-13-02 236 241 2.12 Bankstown (C) 1-34-13-03 350 363 3.71 Bankstown (C) 1-34-13-04 577 579 0.35 Bankstown (C) 1-34-13-05 682 768 12.61 Bankstown (C) 1-34-13-06 448 465 3.79 Bankstown (C) 1-34-13-07 342 361 5.56 Bankstown (C) 1-34-13-08 572 603 5.42 Bankstown (C) 1-34-13-09 474 487 2.74 Bankstown (C) 1-34-13-10 373 385 3.22 Bankstown (C) 1-34-13-11 260 270 3.85 Bankstown (C) 1-34-13-12 470 475 1.06 Bankstown (C) 1-34-13-13 616 633 2.76 Bankstown (C) 1-34-14-01 458 473 3.28 Bankstown (C) 1-34-14-02 551 564 2.36 Bankstown (C) 1-34-14-03 290 292 0.69 Bankstown (C) 1-34-14-04 275 285 3.64 Bankstown (C) 1-34-14-05 493 522 5.88 Bankstown (C) 1-34-14-06 749 785 4.81 Bankstown (C) 1-34-14-07 607 619 1.98 Bankstown (C) 1-34-14-08 596 627 5.20 Bankstown (C) 1-34-14-09 453 475 4.86 Bankstown (C) 1-34-14-10 563 576 2.31

New South Wales Redistribution Statistics 2006
Enrolment Projections Blaxland
Actual Enrolment Estimate Growth SLA Name CCD Number 2/12/2005 31/5/2010 (%)
27
Bankstown (C) 1-34-14-11 363 379 4.41 Bankstown (C) 1-34-14-12 690 719 4.20 Bankstown (C) 1-34-14-13 566 607 7.24 Bankstown (C) 1-34-15-01 708 736 3.95 Bankstown (C) 1-34-15-02 290 343 18.28 Bankstown (C) 1-34-15-03 586 589 0.51 Bankstown (C) 1-34-15-04 560 578 3.21 Bankstown (C) 1-34-15-05 711 737 3.66 Bankstown (C) 1-34-15-06 321 332 3.43 Bankstown (C) 1-34-15-07 597 617 3.35 Bankstown (C) 1-34-15-08 242 250 3.31 Bankstown (C) 1-34-15-09 518 546 5.41 Bankstown (C) 1-34-15-10 331 339 2.42 Bankstown (C) 1-34-15-11 358 361 0.84 Bankstown (C) 1-34-15-12 654 668 2.14 Bankstown (C) 1-34-15-13 400 406 1.50 Bankstown (C) 1-34-15-14 554 586 5.78 Bankstown (C) 1-34-16-01 719 782 8.76 Bankstown (C) 1-34-16-02 126 181 43.65 Bankstown (C) 1-34-16-03 440 447 1.59 Bankstown (C) 1-34-16-04 703 732 4.13 Bankstown (C) 1-34-16-05 681 939 37.89 Bankstown (C) 1-34-16-06 238 253 6.30 Bankstown (C) 1-34-16-07 241 238 -1.24 Bankstown (C) 1-34-16-08 396 404 2.02 Bankstown (C) 1-34-16-09 452 473 4.65 Bankstown (C) 1-34-16-10 311 332 6.75 Bankstown (C) 1-34-16-11 545 620 13.76 Bankstown (C) 1-34-16-12 249 248 -0.40 Bankstown (C) 1-34-16-13 575 616 7.13 Bankstown (C) 1-34-16-14 347 382 10.09 Bankstown (C) 1-34-16-15 466 521 11.80 Bankstown (C) 1-34-17-01 141 152 7.80 Bankstown (C) 1-34-17-02 588 614 4.42 Bankstown (C) 1-34-17-03 427 443 3.75 Bankstown (C) 1-34-17-04 284 301 5.99 Bankstown (C) 1-34-17-05 658 702 6.69 Bankstown (C) 1-34-17-06 551 581 5.44 Bankstown (C) 1-34-17-07 812 833 2.59 Bankstown (C) 1-34-17-08 587 621 5.79 Bankstown (C) 1-34-17-09 453 458 1.10 Bankstown (C) 1-34-17-10 473 481 1.69

New South Wales Redistribution Statistics 2006
Enrolment Projections Blaxland
Actual Enrolment Estimate Growth SLA Name CCD Number 2/12/2005 31/5/2010 (%)
28
Bankstown (C) 1-34-17-11 456 468 2.63 Bankstown (C) 1-34-17-12 582 585 0.52 Bankstown (C) 1-34-18-01 246 253 2.85 Bankstown (C) 1-34-18-02 501 527 5.19 Bankstown (C) 1-34-18-03 728 747 2.61 Bankstown (C) 1-34-19-01 589 618 4.92 Bankstown (C) 1-34-19-02 390 409 4.87 Bankstown (C) 1-34-19-03 437 449 2.75 Bankstown (C) 1-34-19-04 497 508 2.21 Bankstown (C) 1-34-19-05 446 464 4.04 Bankstown (C) 1-34-19-06 492 509 3.46 Bankstown (C) 1-34-19-07 330 338 2.42 Bankstown (C) 1-34-19-08 452 457 1.11 Bankstown (C) 1-34-19-09 722 780 8.03 Bankstown (C) 1-34-19-10 633 664 4.90 Bankstown (C) 1-34-20-01 714 749 4.90 Bankstown (C) 1-34-20-02 837 875 4.54 Bankstown (C) 1-34-20-03 504 537 6.55 Bankstown (C) 1-34-20-04 353 367 3.97 Bankstown (C) 1-34-20-05 223 224 0.45 Bankstown (C) 1-34-20-06 212 211 -0.47 Bankstown (C) 1-34-20-07 440 864 96.36 Bankstown (C) 1-34-20-08 628 675 7.48 Bankstown (C) 1-34-20-09 670 681 1.64 Bankstown (C) 1-34-20-10 588 686 16.67 Bankstown (C) 1-34-20-11 288 287 -0.35 Bankstown (C) 1-34-20-12 432 449 3.94 Bankstown (C) 1-34-20-13 370 368 -0.54 Bankstown (C) 1-34-21-09 336 347 3.27 Bankstown (C) 1-34-21-10 463 467 0.86 Bankstown (C) 1-34-21-13 264 281 6.44 Bankstown (C) 157 73373 76929 4.85 Canterbury (C) 1-35-02-01 359 361 0.56 Canterbury (C) 1-35-02-02 455 461 1.32 Canterbury (C) 1-35-02-03 491 497 1.22 Canterbury (C) 1-35-02-04 467 479 2.57 Canterbury (C) 1-35-02-05 410 436 6.34 Canterbury (C) 1-35-02-06 385 385 0.00 Canterbury (C) 1-35-02-12 276 282 2.17 Canterbury (C) 1-35-02-13 150 150 0.00

New South Wales Redistribution Statistics 2006
Enrolment Projections Blaxland
Actual Enrolment Estimate Growth SLA Name CCD Number 2/12/2005 31/5/2010 (%)
29
Canterbury (C) 1-35-05-01 623 621 -0.32 Canterbury (C) 1-35-05-02 250 250 0.00 Canterbury (C) 1-35-05-06 164 173 5.49 Canterbury (C) 1-35-05-07 243 238 -2.06 Canterbury (C) 1-35-05-08 277 281 1.44 Canterbury (C) 1-35-05-09 321 320 -0.31 Canterbury (C) 1-35-05-10 279 286 2.51 Canterbury (C) 1-35-05-11 286 286 0.00 Canterbury (C) 1-35-05-13 165 166 0.61 Canterbury (C) 1-35-05-15 250 254 1.60 Canterbury (C) 18 5851 5926 1.28 Strathfield (A) 1-41-07-03 359 360 0.28 Strathfield (A) 1-41-07-04 156 153 -1.92 Strathfield (A) 1-41-07-05 306 309 0.98 Strathfield (A) 1-41-07-06 704 716 1.70 Strathfield (A) 1-41-07-07 597 666 11.56 Strathfield (A) 1-41-07-08 223 217 -2.69 Strathfield (A) 1-41-07-09 353 354 0.28 Strathfield (A) 1-41-07-10 376 392 4.26 Strathfield (A) 1-41-07-11 292 303 3.77 Strathfield (A) 9 3366 3470 3.09 Blaxland 184 82590 86325 4.52

New South Wales Redistribution Statistics 2006
Enrolment Projections Bradfield
Actual Enrolment Estimate Growth SLA Name CCD Number 2/12/2005 31/5/2010 (%)
30
Ku-ring-gai (A) 1-37-01-01 952 1179 23.84 Ku-ring-gai (A) 1-37-01-02 776 777 0.13 Ku-ring-gai (A) 1-37-01-03 394 434 10.15 Ku-ring-gai (A) 1-37-01-04 822 872 6.08 Ku-ring-gai (A) 1-37-01-05 608 614 0.99 Ku-ring-gai (A) 1-37-01-06 383 394 2.87 Ku-ring-gai (A) 1-37-01-07 357 369 3.36 Ku-ring-gai (A) 1-37-01-08 437 475 8.70 Ku-ring-gai (A) 1-37-01-09 469 490 4.48 Ku-ring-gai (A) 1-37-01-10 0 0 0.00 Ku-ring-gai (A) 1-37-01-11 458 512 11.79 Ku-ring-gai (A) 1-37-01-12 447 442 -1.12 Ku-ring-gai (A) 1-37-01-13 280 284 1.43 Ku-ring-gai (A) 1-37-02-01 632 631 -0.16 Ku-ring-gai (A) 1-37-02-02 672 765 13.84 Ku-ring-gai (A) 1-37-02-03 431 425 -1.39 Ku-ring-gai (A) 1-37-02-04 658 686 4.26 Ku-ring-gai (A) 1-37-02-05 751 764 1.73 Ku-ring-gai (A) 1-37-02-06 566 563 -0.53 Ku-ring-gai (A) 1-37-02-07 482 484 0.41 Ku-ring-gai (A) 1-37-02-08 592 665 12.33 Ku-ring-gai (A) 1-37-02-09 319 329 3.13 Ku-ring-gai (A) 1-37-03-01 629 643 2.23 Ku-ring-gai (A) 1-37-03-02 413 428 3.63 Ku-ring-gai (A) 1-37-03-03 423 432 2.13 Ku-ring-gai (A) 1-37-03-04 370 366 -1.08 Ku-ring-gai (A) 1-37-03-05 374 410 9.63 Ku-ring-gai (A) 1-37-03-06 449 479 6.68 Ku-ring-gai (A) 1-37-03-07 649 655 0.92 Ku-ring-gai (A) 1-37-03-08 269 297 10.41 Ku-ring-gai (A) 1-37-03-09 557 622 11.67 Ku-ring-gai (A) 1-37-03-10 484 512 5.79 Ku-ring-gai (A) 1-37-04-01 334 337 0.90 Ku-ring-gai (A) 1-37-04-02 590 645 9.32 Ku-ring-gai (A) 1-37-04-03 495 504 1.82 Ku-ring-gai (A) 1-37-04-04 643 655 1.87 Ku-ring-gai (A) 1-37-04-05 297 292 -1.68 Ku-ring-gai (A) 1-37-04-06 339 342 0.88 Ku-ring-gai (A) 1-37-04-07 764 759 -0.65 Ku-ring-gai (A) 1-37-04-08 738 746 1.08 Ku-ring-gai (A) 1-37-04-09 316 319 0.95 Ku-ring-gai (A) 1-37-04-10 321 336 4.67

New South Wales Redistribution Statistics 2006
Enrolment Projections Bradfield
Actual Enrolment Estimate Growth SLA Name CCD Number 2/12/2005 31/5/2010 (%)
31
Ku-ring-gai (A) 1-37-04-11 333 332 -0.30 Ku-ring-gai (A) 1-37-05-01 391 438 12.02 Ku-ring-gai (A) 1-37-05-02 220 274 24.55 Ku-ring-gai (A) 1-37-05-03 765 834 9.02 Ku-ring-gai (A) 1-37-05-04 294 283 -3.74 Ku-ring-gai (A) 1-37-05-05 236 260 10.17 Ku-ring-gai (A) 1-37-05-06 633 621 -1.90 Ku-ring-gai (A) 1-37-05-07 482 497 3.11 Ku-ring-gai (A) 1-37-05-08 671 666 -0.75 Ku-ring-gai (A) 1-37-05-09 314 312 -0.64 Ku-ring-gai (A) 1-37-05-10 523 515 -1.53 Ku-ring-gai (A) 1-37-05-11 485 478 -1.44 Ku-ring-gai (A) 1-37-05-12 316 316 0.00 Ku-ring-gai (A) 1-37-06-01 638 735 15.20 Ku-ring-gai (A) 1-37-06-02 452 444 -1.77 Ku-ring-gai (A) 1-37-06-03 688 693 0.73 Ku-ring-gai (A) 1-37-06-04 544 539 -0.92 Ku-ring-gai (A) 1-37-06-05 222 221 -0.45 Ku-ring-gai (A) 1-37-06-06 693 702 1.30 Ku-ring-gai (A) 1-37-06-07 647 653 0.93 Ku-ring-gai (A) 1-37-06-08 523 535 2.29 Ku-ring-gai (A) 1-37-06-09 318 322 1.26 Ku-ring-gai (A) 1-37-06-10 299 307 2.68 Ku-ring-gai (A) 1-37-07-01 617 620 0.49 Ku-ring-gai (A) 1-37-07-02 339 340 0.29 Ku-ring-gai (A) 1-37-07-03 377 382 1.33 Ku-ring-gai (A) 1-37-07-04 304 305 0.33 Ku-ring-gai (A) 1-37-07-05 642 643 0.16 Ku-ring-gai (A) 1-37-07-06 540 555 2.78 Ku-ring-gai (A) 1-37-07-07 588 593 0.85 Ku-ring-gai (A) 1-37-07-08 413 412 -0.24 Ku-ring-gai (A) 1-37-07-09 299 305 2.01 Ku-ring-gai (A) 1-37-07-10 257 261 1.56 Ku-ring-gai (A) 1-37-08-01 646 655 1.39 Ku-ring-gai (A) 1-37-08-02 323 325 0.62 Ku-ring-gai (A) 1-37-08-03 442 474 7.24 Ku-ring-gai (A) 1-37-08-04 389 393 1.03 Ku-ring-gai (A) 1-37-08-05 468 478 2.14 Ku-ring-gai (A) 1-37-08-06 529 546 3.21 Ku-ring-gai (A) 1-37-08-07 556 573 3.06 Ku-ring-gai (A) 1-37-08-08 509 612 20.24 Ku-ring-gai (A) 1-37-08-09 184 183 -0.54

New South Wales Redistribution Statistics 2006
Enrolment Projections Bradfield
Actual Enrolment Estimate Growth SLA Name CCD Number 2/12/2005 31/5/2010 (%)
32
Ku-ring-gai (A) 1-37-08-10 447 450 0.67 Ku-ring-gai (A) 1-37-08-11 310 317 2.26 Ku-ring-gai (A) 1-37-08-12 380 401 5.53 Ku-ring-gai (A) 1-37-09-01 416 427 2.64 Ku-ring-gai (A) 1-37-09-02 165 194 17.58 Ku-ring-gai (A) 1-37-09-03 289 285 -1.38 Ku-ring-gai (A) 1-37-09-04 440 436 -0.91 Ku-ring-gai (A) 1-37-09-05 517 505 -2.32 Ku-ring-gai (A) 1-37-09-06 390 387 -0.77 Ku-ring-gai (A) 1-37-09-07 464 479 3.23 Ku-ring-gai (A) 1-37-09-08 446 445 -0.22 Ku-ring-gai (A) 1-37-09-09 604 605 0.17 Ku-ring-gai (A) 1-37-09-10 727 742 2.06 Ku-ring-gai (A) 1-37-10-01 981 994 1.33 Ku-ring-gai (A) 1-37-10-02 532 529 -0.56 Ku-ring-gai (A) 1-37-10-03 274 278 1.46 Ku-ring-gai (A) 1-37-10-04 855 911 6.55 Ku-ring-gai (A) 1-37-10-05 785 778 -0.89 Ku-ring-gai (A) 1-37-10-06 703 705 0.28 Ku-ring-gai (A) 1-37-10-07 391 400 2.30 Ku-ring-gai (A) 1-37-10-08 636 632 -0.63 Ku-ring-gai (A) 1-37-10-09 527 533 1.14 Ku-ring-gai (A) 1-37-11-01 593 617 4.05 Ku-ring-gai (A) 1-37-11-02 590 688 16.61 Ku-ring-gai (A) 1-37-11-03 605 607 0.33 Ku-ring-gai (A) 1-37-11-04 298 293 -1.68 Ku-ring-gai (A) 1-37-11-05 602 605 0.50 Ku-ring-gai (A) 1-37-11-06 406 407 0.25 Ku-ring-gai (A) 1-37-11-07 353 349 -1.13 Ku-ring-gai (A) 1-37-11-08 519 511 -1.54 Ku-ring-gai (A) 1-37-11-09 609 612 0.49 Ku-ring-gai (A) 1-37-11-10 367 361 -1.63 Ku-ring-gai (A) 1-37-11-11 638 640 0.31 Ku-ring-gai (A) 1-37-11-12 157 161 2.55 Ku-ring-gai (A) 1-37-11-13 161 161 0.00 Ku-ring-gai (A) 1-37-12-01 270 270 0.00 Ku-ring-gai (A) 1-37-12-02 238 237 -0.42 Ku-ring-gai (A) 1-37-12-03 283 279 -1.41 Ku-ring-gai (A) 1-37-12-04 225 227 0.89 Ku-ring-gai (A) 1-37-12-05 486 493 1.44 Ku-ring-gai (A) 1-37-12-06 438 445 1.60 Ku-ring-gai (A) 1-37-12-07 489 497 1.64

New South Wales Redistribution Statistics 2006
Enrolment Projections Bradfield
Actual Enrolment Estimate Growth SLA Name CCD Number 2/12/2005 31/5/2010 (%)
33
Ku-ring-gai (A) 1-37-12-08 310 313 0.97 Ku-ring-gai (A) 1-37-12-09 425 431 1.41 Ku-ring-gai (A) 1-37-12-10 507 512 0.99 Ku-ring-gai (A) 1-37-12-11 323 324 0.31 Ku-ring-gai (A) 1-37-12-12 191 196 2.62 Ku-ring-gai (A) 1-37-12-13 309 317 2.59 Ku-ring-gai (A) 1-37-13-01 270 282 4.44 Ku-ring-gai (A) 1-37-13-02 847 901 6.38 Ku-ring-gai (A) 1-37-13-03 461 462 0.22 Ku-ring-gai (A) 1-37-13-04 442 437 -1.13 Ku-ring-gai (A) 1-37-13-05 916 914 -0.22 Ku-ring-gai (A) 1-37-13-06 467 470 0.64 Ku-ring-gai (A) 1-37-13-07 563 570 1.24 Ku-ring-gai (A) 1-37-13-08 327 330 0.92 Ku-ring-gai (A) 1-37-13-09 395 389 -1.52 Ku-ring-gai (A) 1-37-13-10 466 466 0.00 Ku-ring-gai (A) 1-37-14-01 407 409 0.49 Ku-ring-gai (A) 1-37-14-02 291 301 3.44 Ku-ring-gai (A) 1-37-14-03 219 223 1.83 Ku-ring-gai (A) 1-37-14-04 648 643 -0.77 Ku-ring-gai (A) 1-37-14-05 439 441 0.46 Ku-ring-gai (A) 1-37-14-06 594 595 0.17 Ku-ring-gai (A) 1-37-14-07 260 256 -1.54 Ku-ring-gai (A) 1-37-14-08 470 472 0.43 Ku-ring-gai (A) 1-37-14-09 373 368 -1.34 Ku-ring-gai (A) 1-37-14-10 494 499 1.01 Ku-ring-gai (A) 152 71069 72979 2.69 Willoughby (C) 1-38-22-01 354 364 2.82 Willoughby (C) 1-38-22-02 314 320 1.91 Willoughby (C) 1-38-22-03 323 332 2.79 Willoughby (C) 1-38-22-04 405 412 1.73 Willoughby (C) 1-38-22-05 276 282 2.17 Willoughby (C) 1-38-22-06 912 932 2.19 Willoughby (C) 1-38-22-07 321 329 2.49 Willoughby (C) 1-38-22-08 514 530 3.11 Willoughby (C) 1-38-22-09 332 332 0.00 Willoughby (C) 1-38-22-10 415 428 3.13 Willoughby (C) 1-38-22-11 453 513 13.25 Willoughby (C) 1-38-22-12 326 334 2.45 Willoughby (C) 1-38-22-13 348 367 5.46

New South Wales Redistribution Statistics 2006
Enrolment Projections Bradfield
Actual Enrolment Estimate Growth SLA Name CCD Number 2/12/2005 31/5/2010 (%)
34
Willoughby (C) 1-38-22-14 607 624 2.80 Willoughby (C) 1-38-23-01 662 988 49.24 Willoughby (C) 1-38-23-02 552 563 1.99 Willoughby (C) 1-38-23-06 787 1301 65.31 Willoughby (C) 1-38-23-09 420 429 2.14 Willoughby (C) 1-38-24-01 285 287 0.70 Willoughby (C) 1-38-24-02 521 536 2.88 Willoughby (C) 1-38-24-03 303 312 2.97 Willoughby (C) 1-38-24-04 433 442 2.08 Willoughby (C) 1-38-24-05 400 401 0.25 Willoughby (C) 1-38-24-06 342 348 1.75 Willoughby (C) 1-38-24-07 342 354 3.51 Willoughby (C) 1-38-24-08 351 365 3.99 Willoughby (C) 1-38-24-09 328 339 3.35 Willoughby (C) 1-38-24-10 313 324 3.51 Willoughby (C) 1-38-24-11 352 359 1.99 Willoughby (C) 1-38-24-12 358 381 6.42 Willoughby (C) 1-38-24-13 276 277 0.36 Willoughby (C) 1-38-25-05 209 218 4.31 Willoughby (C) 1-38-25-06 677 688 1.62 Willoughby (C) 1-38-25-07 672 689 2.53 Willoughby (C) 1-38-25-08 526 539 2.47 Willoughby (C) 1-38-25-09 561 576 2.67 Willoughby (C) 1-38-26-02 148 154 4.05 Willoughby (C) 1-38-27-01 314 318 1.27 Willoughby (C) 1-38-27-02 441 452 2.49 Willoughby (C) 1-38-27-03 424 433 2.12 Willoughby (C) 1-38-27-04 307 308 0.33 Willoughby (C) 1-38-27-05 27 29 7.41 Willoughby (C) 1-38-27-12 162 167 3.09 Willoughby (C) 1-38-27-13 295 311 5.42 Willoughby (C) 1-38-27-14 283 289 2.12 Willoughby (C) 1-38-27-15 346 351 1.45 Willoughby (C) 46 18317 19627 7.15 Bradfield 198 89386 92606 3.60

New South Wales Redistribution Statistics 2006
Enrolment Projections Calare
Actual Enrolment Estimate Growth SLA Name CCD Number 2/12/2005 31/5/2010 (%)
35
Bathurst Regional (A) - Pt A 1-14-04-01 188 189 0.53 Bathurst Regional (A) - Pt A 1-14-04-02 151 163 7.95 Bathurst Regional (A) - Pt A 1-14-04-03 361 390 8.03 Bathurst Regional (A) - Pt A 1-14-04-04 184 203 10.33 Bathurst Regional (A) - Pt A 1-14-16-01 462 515 11.47 Bathurst Regional (A) - Pt A 1-14-16-02 266 363 36.47 Bathurst Regional (A) - Pt A 1-14-16-03 481 600 24.74 Bathurst Regional (A) - Pt A 1-14-16-04 328 352 7.32 Bathurst Regional (A) - Pt A 1-14-16-05 283 309 9.19 Bathurst Regional (A) - Pt A 1-14-16-06 790 841 6.46 Bathurst Regional (A) - Pt A 1-14-16-07 314 326 3.82 Bathurst Regional (A) - Pt A 1-14-16-08 460 483 5.00 Bathurst Regional (A) - Pt A 1-14-16-09 692 728 5.20 Bathurst Regional (A) - Pt A 1-14-16-10 588 921 56.63 Bathurst Regional (A) - Pt A 1-14-16-11 711 917 28.97 Bathurst Regional (A) - Pt A 1-14-16-12 371 377 1.62 Bathurst Regional (A) - Pt A 1-14-17-01 723 859 18.81 Bathurst Regional (A) - Pt A 1-14-17-02 385 387 0.52 Bathurst Regional (A) - Pt A 1-14-17-03 215 227 5.58 Bathurst Regional (A) - Pt A 1-14-17-04 455 468 2.86 Bathurst Regional (A) - Pt A 1-14-17-05 100 104 4.00 Bathurst Regional (A) - Pt A 1-14-17-06 159 160 0.63 Bathurst Regional (A) - Pt A 1-14-17-07 392 401 2.30 Bathurst Regional (A) - Pt A 1-14-17-08 193 194 0.52 Bathurst Regional (A) - Pt A 1-14-17-09 271 274 1.11 Bathurst Regional (A) - Pt A 1-14-17-10 328 349 6.40 Bathurst Regional (A) - Pt A 1-14-17-11 462 475 2.81 Bathurst Regional (A) - Pt A 1-14-17-12 272 284 4.41 Bathurst Regional (A) - Pt A 1-14-17-13 392 399 1.79 Bathurst Regional (A) - Pt A 1-14-18-01 208 218 4.81 Bathurst Regional (A) - Pt A 1-14-18-02 335 326 -2.69 Bathurst Regional (A) - Pt A 1-14-18-03 403 416 3.23 Bathurst Regional (A) - Pt A 1-14-18-04 279 281 0.72 Bathurst Regional (A) - Pt A 1-14-18-05 211 225 6.64 Bathurst Regional (A) - Pt A 1-14-18-06 465 475 2.15 Bathurst Regional (A) - Pt A 1-14-18-07 454 477 5.07 Bathurst Regional (A) - Pt A 1-14-18-08 184 182 -1.09 Bathurst Regional (A) - Pt A 1-14-18-09 229 224 -2.18 Bathurst Regional (A) - Pt A 1-14-18-10 210 214 1.90 Bathurst Regional (A) - Pt A 1-14-18-11 219 217 -0.91 Bathurst Regional (A) - Pt A 1-14-18-12 228 228 0.00 Bathurst Regional (A) - Pt A 1-14-18-13 319 320 0.31

New South Wales Redistribution Statistics 2006
Enrolment Projections Calare
Actual Enrolment Estimate Growth SLA Name CCD Number 2/12/2005 31/5/2010 (%)
36
Bathurst Regional (A) - Pt A 1-14-19-01 490 504 2.86 Bathurst Regional (A) - Pt A 1-14-19-02 506 515 1.78 Bathurst Regional (A) - Pt A 1-14-19-03 387 394 1.81 Bathurst Regional (A) - Pt A 1-14-19-04 187 188 0.53 Bathurst Regional (A) - Pt A 1-14-19-05 289 298 3.11 Bathurst Regional (A) - Pt A 1-14-19-06 475 479 0.84 Bathurst Regional (A) - Pt A 1-14-19-07 384 378 -1.56 Bathurst Regional (A) - Pt A 1-14-19-08 306 311 1.63 Bathurst Regional (A) - Pt A 1-14-19-09 483 505 4.55 Bathurst Regional (A) - Pt A 1-14-19-10 150 157 4.67 Bathurst Regional (A) - Pt A 1-14-19-11 1055 1343 27.30 Bathurst Regional (A) - Pt A 1-14-19-12 556 590 6.12 Bathurst Regional (A) - Pt A 1-14-19-13 674 701 4.01 Bathurst Regional (A) - Pt A 55 20663 22424 8.52 Bathurst Regional (A) - Pt B 1-14-15-01 126 127 0.79 North Bathurst Regional (A) - Pt B 1-14-15-02 455 470 3.30 North Bathurst Regional (A) - Pt B 1-14-15-03 144 148 2.78 North Bathurst Regional (A) - Pt B 1-14-15-04 155 167 7.74 North Bathurst Regional (A) - Pt B 1-14-15-05 191 199 4.19 North Bathurst Regional (A) - Pt B 1-14-15-06 297 294 -1.01 North Bathurst Regional (A) - Pt B 1-14-15-07 234 246 5.13 North Bathurst Regional (A) - Pt B 1-14-15-08 206 203 -1.46 North Bathurst Regional (A) - Pt B 1-14-15-09 104 107 2.88 North Bathurst Regional (A) - Pt B 1-14-15-10 139 133 -4.32 North Bathurst Regional (A) - Pt B 10 2051 2094 2.10 North Bathurst Regional (A) - Pt B 1-14-13-01 231 236 2.16 South
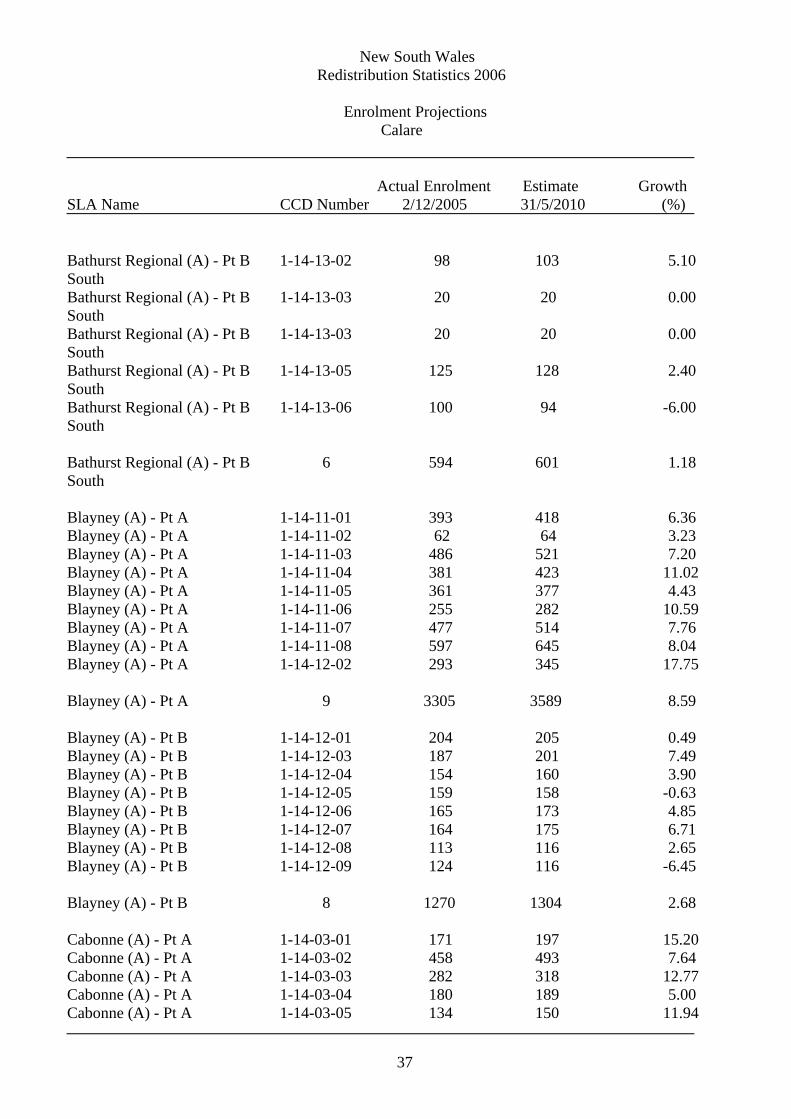
New South Wales Redistribution Statistics 2006
Enrolment Projections Calare
Actual Enrolment Estimate Growth SLA Name CCD Number 2/12/2005 31/5/2010 (%)
37
Bathurst Regional (A) - Pt B 1-14-13-02 98 103 5.10 South Bathurst Regional (A) - Pt B 1-14-13-03 20 20 0.00 South Bathurst Regional (A) - Pt B 1-14-13-03 20 20 0.00 South Bathurst Regional (A) - Pt B 1-14-13-05 125 128 2.40 South Bathurst Regional (A) - Pt B 1-14-13-06 100 94 -6.00 South Bathurst Regional (A) - Pt B 6 594 601 1.18 South Blayney (A) - Pt A 1-14-11-01 393 418 6.36 Blayney (A) - Pt A 1-14-11-02 62 64 3.23 Blayney (A) - Pt A 1-14-11-03 486 521 7.20 Blayney (A) - Pt A 1-14-11-04 381 423 11.02 Blayney (A) - Pt A 1-14-11-05 361 377 4.43 Blayney (A) - Pt A 1-14-11-06 255 282 10.59 Blayney (A) - Pt A 1-14-11-07 477 514 7.76 Blayney (A) - Pt A 1-14-11-08 597 645 8.04 Blayney (A) - Pt A 1-14-12-02 293 345 17.75 Blayney (A) - Pt A 9 3305 3589 8.59 Blayney (A) - Pt B 1-14-12-01 204 205 0.49 Blayney (A) - Pt B 1-14-12-03 187 201 7.49 Blayney (A) - Pt B 1-14-12-04 154 160 3.90 Blayney (A) - Pt B 1-14-12-05 159 158 -0.63 Blayney (A) - Pt B 1-14-12-06 165 173 4.85 Blayney (A) - Pt B 1-14-12-07 164 175 6.71 Blayney (A) - Pt B 1-14-12-08 113 116 2.65 Blayney (A) - Pt B 1-14-12-09 124 116 -6.45 Blayney (A) - Pt B 8 1270 1304 2.68 Cabonne (A) - Pt A 1-14-03-01 171 197 15.20 Cabonne (A) - Pt A 1-14-03-02 458 493 7.64 Cabonne (A) - Pt A 1-14-03-03 282 318 12.77 Cabonne (A) - Pt A 1-14-03-04 180 189 5.00 Cabonne (A) - Pt A 1-14-03-05 134 150 11.94

New South Wales Redistribution Statistics 2006
Enrolment Projections Calare
Actual Enrolment Estimate Growth SLA Name CCD Number 2/12/2005 31/5/2010 (%)
38
Cabonne (A) - Pt A 1-14-05-01 400 440 10.00 Cabonne (A) - Pt A 1-14-05-02 173 189 9.25 Cabonne (A) - Pt A 7 1798 1976 9.90 Cabonne (A) - Pt B 1-14-14-01 180 193 7.22 Cabonne (A) - Pt B 1-14-14-02 472 514 8.90 Cabonne (A) - Pt B 2 652 707 8.44 Cabonne (A) - Pt C 1-14-01-01 170 183 7.65 Cabonne (A) - Pt C 1-14-01-02 201 207 2.99 Cabonne (A) - Pt C 1-14-01-03 220 216 -1.82 Cabonne (A) - Pt C 1-14-01-04 153 161 5.23 Cabonne (A) - Pt C 1-14-01-05 199 210 5.53 Cabonne (A) - Pt C 1-14-01-06 220 231 5.00 Cabonne (A) - Pt C 1-14-01-07 189 199 5.29 Cabonne (A) - Pt C 1-14-01-08 294 302 2.72 Cabonne (A) - Pt C 1-14-01-09 396 408 3.03 Cabonne (A) - Pt C 1-14-01-10 535 583 8.97 Cabonne (A) - Pt C 1-14-01-11 306 310 1.31 Cabonne (A) - Pt C 1-14-02-01 344 354 2.91 Cabonne (A) - Pt C 1-14-02-02 291 294 1.03 Cabonne (A) - Pt C 1-14-02-03 331 345 4.23 Cabonne (A) - Pt C 1-14-02-04 201 210 4.48 Cabonne (A) - Pt C 1-14-02-05 70 78 11.43 Cabonne (A) - Pt C 1-14-02-06 137 133 -2.92 Cabonne (A) - Pt C 1-14-02-07 421 443 5.23 Cabonne (A) - Pt C 1-14-02-08 176 179 1.70 Cabonne (A) - Pt C 1-14-02-09 503 517 2.78 Cabonne (A) - Pt C 1-14-02-10 371 384 3.50 Cabonne (A) - Pt C 1-14-02-11 210 224 6.67 Cabonne (A) - Pt C 1-14-02-12 158 164 3.80 Cabonne (A) - Pt C 1-14-02-13 130 137 5.38 Cabonne (A) - Pt C 1-14-03-06 192 196 2.08 Cabonne (A) - Pt C 25 6418 6668 3.90 Cowra (A) 1-15-17-01 202 209 3.47 Cowra (A) 1-15-17-02 145 143 -1.38 Cowra (A) 1-15-17-03 267 310 16.10 Cowra (A) 1-15-17-04 194 208 7.22

New South Wales Redistribution Statistics 2006
Enrolment Projections Calare
Actual Enrolment Estimate Growth SLA Name CCD Number 2/12/2005 31/5/2010 (%)
39
Cowra (A) 1-15-17-05 247 259 4.86 Cowra (A) 1-15-17-06 328 361 10.06 Cowra (A) 1-15-17-07 215 234 8.84 Cowra (A) 1-15-17-08 191 195 2.09 Cowra (A) 1-15-17-09 365 381 4.38 Cowra (A) 1-15-17-10 274 310 13.14 Cowra (A) 1-15-17-11 503 590 17.30 Cowra (A) 1-15-17-12 48 51 6.25 Cowra (A) 1-15-18-01 407 465 14.25 Cowra (A) 1-15-18-02 748 805 7.62 Cowra (A) 1-15-18-03 403 414 2.73 Cowra (A) 1-15-18-04 466 483 3.65 Cowra (A) 1-15-18-05 224 230 2.68 Cowra (A) 1-15-18-06 362 367 1.38 Cowra (A) 1-15-18-07 434 439 1.15 Cowra (A) 1-15-18-08 430 454 5.58 Cowra (A) 1-15-18-09 224 230 2.68 Cowra (A) 1-15-18-10 204 214 4.90 Cowra (A) 1-15-18-11 348 364 4.60 Cowra (A) 1-15-18-12 583 603 3.43 Cowra (A) 1-15-18-13 399 408 2.26 Cowra (A) 1-15-18-14 355 364 2.54 Cowra (A) 1-15-18-15 385 401 4.16 Cowra (A) 27 8951 9492 6.04 Lithgow (C) 1-14-15-07 17 17 0.00 Lithgow (C) 1-14-21-01 303 318 4.95 Lithgow (C) 1-14-21-02 348 367 5.46 Lithgow (C) 1-14-21-03 393 406 3.31 Lithgow (C) 1-14-21-04 462 482 4.33 Lithgow (C) 1-14-21-05 497 533 7.24 Lithgow (C) 1-14-21-06 373 414 10.99 Lithgow (C) 1-14-21-07 191 213 11.52 Lithgow (C) 1-14-21-08 141 151 7.09 Lithgow (C) 1-14-21-09 286 316 10.49 Lithgow (C) 1-14-22-01 419 438 4.53 Lithgow (C) 1-14-22-02 337 404 19.88 Lithgow (C) 1-14-22-03 123 133 8.13 Lithgow (C) 1-14-22-04 130 133 2.31 Lithgow (C) 1-14-22-05 425 449 5.65 Lithgow (C) 1-14-22-06 173 180 4.05

New South Wales Redistribution Statistics 2006
Enrolment Projections Calare
Actual Enrolment Estimate Growth SLA Name CCD Number 2/12/2005 31/5/2010 (%)
40
Lithgow (C) 1-14-22-07 61 61 0.00 Lithgow (C) 1-14-22-08 478 501 4.81 Lithgow (C) 1-14-22-09 219 237 8.22 Lithgow (C) 1-14-22-10 109 113 3.67 Lithgow (C) 1-14-22-11 152 160 5.26 Lithgow (C) 1-14-22-12 162 165 1.85 Lithgow (C) 1-14-23-01 223 236 5.83 Lithgow (C) 1-14-23-02 330 348 5.45 Lithgow (C) 1-14-23-03 493 491 -0.41 Lithgow (C) 1-14-23-04 305 316 3.61 Lithgow (C) 1-14-23-05 273 276 1.10 Lithgow (C) 1-14-23-06 448 461 2.90 Lithgow (C) 1-14-23-07 518 533 2.90 Lithgow (C) 1-14-23-08 224 226 0.89 Lithgow (C) 1-14-23-09 292 292 0.00 Lithgow (C) 1-14-23-10 393 398 1.27 Lithgow (C) 1-14-23-11 290 299 3.10 Lithgow (C) 1-14-23-12 526 603 14.64 Lithgow (C) 1-14-23-13 284 290 2.11 Lithgow (C) 1-14-24-01 362 377 4.14 Lithgow (C) 1-14-24-02 401 465 15.96 Lithgow (C) 1-14-24-03 293 297 1.37 Lithgow (C) 1-14-24-04 274 275 0.36 Lithgow (C) 1-14-24-05 315 329 4.44 Lithgow (C) 1-14-24-06 297 298 0.34 Lithgow (C) 1-14-24-07 65 65 0.00 Lithgow (C) 1-14-24-08 245 270 10.20 Lithgow (C) 1-14-24-09 495 502 1.41 Lithgow (C) 1-14-24-10 260 268 3.08 Lithgow (C) 1-14-24-11 323 331 2.48 Lithgow (C) 46 13728 14437 5.16 Oberon (A) 1-14-13-03 75 75 0.00 Oberon (A) 1-14-13-04 98 98 0.00 Oberon (A) 1-14-13-05 14 14 0.00 Oberon (A) 1-14-20-01 524 587 12.02 Oberon (A) 1-14-20-02 246 261 6.10 Oberon (A) 1-14-20-03 396 410 3.54 Oberon (A) 1-14-20-04 536 546 1.87 Oberon (A) 1-14-20-05 201 211 4.98 Oberon (A) 1-14-20-06 226 253 11.95

New South Wales Redistribution Statistics 2006
Enrolment Projections Calare
Actual Enrolment Estimate Growth SLA Name CCD Number 2/12/2005 31/5/2010 (%)
41
Oberon (A) 1-14-20-07 130 137 5.38 Oberon (A) 1-14-20-08 80 83 3.75 Oberon (A) 1-14-20-09 64 67 4.69 Oberon (A) 1-14-20-10 493 552 11.97 Oberon (A) 1-14-20-11 333 377 13.21 Oberon (A) 14 3416 3671 7.46 Orange (C) 1-14-06-01 517 586 13.35 Orange (C) 1-14-06-02 482 523 8.51 Orange (C) 1-14-06-03 238 281 18.07 Orange (C) 1-14-06-04 228 241 5.70 Orange (C) 1-14-06-05 192 197 2.60 Orange (C) 1-14-06-06 327 351 7.34 Orange (C) 1-14-06-07 429 460 7.23 Orange (C) 1-14-06-08 281 302 7.47 Orange (C) 1-14-06-09 86 88 2.33 Orange (C) 1-14-06-10 299 325 8.70 Orange (C) 1-14-07-01 521 552 5.95 Orange (C) 1-14-07-02 614 728 18.57 Orange (C) 1-14-07-03 274 277 1.09 Orange (C) 1-14-07-04 326 343 5.21 Orange (C) 1-14-07-05 711 780 9.70 Orange (C) 1-14-07-06 360 369 2.50 Orange (C) 1-14-07-07 455 464 1.98 Orange (C) 1-14-07-08 543 558 2.76 Orange (C) 1-14-07-09 429 443 3.26 Orange (C) 1-14-07-10 329 337 2.43 Orange (C) 1-14-07-11 278 284 2.16 Orange (C) 1-14-07-12 321 336 4.67 Orange (C) 1-14-08-01 456 506 10.96 Orange (C) 1-14-08-02 338 346 2.37 Orange (C) 1-14-08-03 473 501 5.92 Orange (C) 1-14-08-04 542 553 2.03 Orange (C) 1-14-08-05 214 222 3.74 Orange (C) 1-14-08-06 362 369 1.93 Orange (C) 1-14-08-07 18 18 0.00 Orange (C) 1-14-08-08 249 257 3.21 Orange (C) 1-14-08-09 196 202 3.06 Orange (C) 1-14-08-10 352 366 3.98 Orange (C) 1-14-08-11 353 362 2.55 Orange (C) 1-14-08-12 635 715 12.60

New South Wales Redistribution Statistics 2006
Enrolment Projections Calare
Actual Enrolment Estimate Growth SLA Name CCD Number 2/12/2005 31/5/2010 (%)
42
Orange (C) 1-14-08-13 659 728 10.47 Orange (C) 1-14-08-14 487 508 4.31 Orange (C) 1-14-08-15 741 1153 55.60 Orange (C) 1-14-08-16 447 475 6.26 Orange (C) 1-14-09-01 194 191 -1.55 Orange (C) 1-14-09-02 240 239 -0.42 Orange (C) 1-14-09-03 334 346 3.59 Orange (C) 1-14-09-04 414 439 6.04 Orange (C) 1-14-09-05 455 462 1.54 Orange (C) 1-14-09-06 473 495 4.65 Orange (C) 1-14-09-07 348 357 2.59 Orange (C) 1-14-09-08 565 587 3.89 Orange (C) 1-14-09-09 19 19 0.00 Orange (C) 1-14-09-10 354 370 4.52 Orange (C) 1-14-09-11 184 192 4.35 Orange (C) 1-14-09-12 253 264 4.35 Orange (C) 1-14-09-13 428 449 4.91 Orange (C) 1-14-09-14 316 323 2.22 Orange (C) 1-14-10-01 302 311 2.98 Orange (C) 1-14-10-02 171 177 3.51 Orange (C) 1-14-10-03 320 330 3.12 Orange (C) 1-14-10-04 321 330 2.80 Orange (C) 1-14-10-05 280 288 2.86 Orange (C) 1-14-10-06 270 277 2.59 Orange (C) 1-14-10-07 588 612 4.08 Orange (C) 1-14-10-08 552 566 2.54 Orange (C) 1-14-10-09 370 377 1.89 Orange (C) 1-14-10-10 346 362 4.62 Orange (C) 1-14-10-11 293 303 3.41 Orange (C) 1-14-10-12 551 571 3.63 Orange (C) 1-14-10-13 344 364 5.81 Orange (C) 65 24047 25707 6.90 Calare 274 86893 92670 6.65

New South Wales Redistribution Statistics 2006
Enrolment Projections Charlton
Actual Enrolment Estimate Growth SLA Name CCD Number 2/12/2005 31/5/2010 (%)
43
Lake Macquarie (C) 1-12-01-01 483 492 1.86 Lake Macquarie (C) 1-12-01-02 607 620 2.14 Lake Macquarie (C) 1-12-01-03 543 543 0.00 Lake Macquarie (C) 1-12-01-04 570 572 0.35 Lake Macquarie (C) 1-12-01-05 688 702 2.03 Lake Macquarie (C) 1-12-01-06 294 294 0.00 Lake Macquarie (C) 1-12-01-07 459 478 4.14 Lake Macquarie (C) 1-12-01-08 598 604 1.00 Lake Macquarie (C) 1-12-01-09 543 550 1.29 Lake Macquarie (C) 1-12-01-10 441 459 4.08 Lake Macquarie (C) 1-12-01-11 208 203 -2.40 Lake Macquarie (C) 1-12-01-12 365 667 82.74 Lake Macquarie (C) 1-12-01-13 877 978 11.52 Lake Macquarie (C) 1-12-02-01 140 145 3.57 Lake Macquarie (C) 1-12-02-02 432 443 2.55 Lake Macquarie (C) 1-12-02-03 748 760 1.60 Lake Macquarie (C) 1-12-02-04 379 410 8.18 Lake Macquarie (C) 1-12-02-05 591 597 1.02 Lake Macquarie (C) 1-12-02-06 272 281 3.31 Lake Macquarie (C) 1-12-02-07 379 385 1.58 Lake Macquarie (C) 1-12-02-08 557 574 3.05 Lake Macquarie (C) 1-12-02-09 304 319 4.93 Lake Macquarie (C) 1-12-02-10 449 461 2.67 Lake Macquarie (C) 1-12-02-11 549 560 2.00 Lake Macquarie (C) 1-12-02-12 373 378 1.34 Lake Macquarie (C) 1-12-02-13 465 470 1.08 Lake Macquarie (C) 1-12-03-01 128 134 4.69 Lake Macquarie (C) 1-12-03-02 454 463 1.98 Lake Macquarie (C) 1-12-03-03 119 121 1.68 Lake Macquarie (C) 1-12-03-04 90 90 0.00 Lake Macquarie (C) 1-12-03-05 213 240 12.68 Lake Macquarie (C) 1-12-03-06 89 94 5.62 Lake Macquarie (C) 1-12-03-07 257 263 2.33 Lake Macquarie (C) 1-12-03-08 204 214 4.90 Lake Macquarie (C) 1-12-03-09 181 195 7.73 Lake Macquarie (C) 1-12-03-10 433 452 4.39 Lake Macquarie (C) 1-12-03-11 476 478 0.42 Lake Macquarie (C) 1-12-03-12 258 275 6.59 Lake Macquarie (C) 1-12-04-01 546 571 4.58 Lake Macquarie (C) 1-12-04-02 473 538 13.74 Lake Macquarie (C) 1-12-04-03 162 165 1.85 Lake Macquarie (C) 1-12-04-04 308 310 0.65

New South Wales Redistribution Statistics 2006
Enrolment Projections Charlton
Actual Enrolment Estimate Growth SLA Name CCD Number 2/12/2005 31/5/2010 (%)
44
Lake Macquarie (C) 1-12-04-05 426 455 6.81 Lake Macquarie (C) 1-12-04-06 386 404 4.66 Lake Macquarie (C) 1-12-04-07 653 676 3.52 Lake Macquarie (C) 1-12-04-08 404 427 5.69 Lake Macquarie (C) 1-12-04-09 633 689 8.85 Lake Macquarie (C) 1-12-04-10 511 595 16.44 Lake Macquarie (C) 1-12-04-11 431 454 5.34 Lake Macquarie (C) 1-12-04-12 294 307 4.42 Lake Macquarie (C) 1-12-04-13 550 602 9.45 Lake Macquarie (C) 1-12-05-01 685 758 10.66 Lake Macquarie (C) 1-12-05-02 265 275 3.77 Lake Macquarie (C) 1-12-05-03 620 883 42.42 Lake Macquarie (C) 1-12-05-04 512 537 4.88 Lake Macquarie (C) 1-12-05-05 611 692 13.26 Lake Macquarie (C) 1-12-05-06 596 632 6.04 Lake Macquarie (C) 1-12-05-07 453 700 54.53 Lake Macquarie (C) 1-12-05-08 527 562 6.64 Lake Macquarie (C) 1-12-05-09 279 341 22.22 Lake Macquarie (C) 1-12-05-10 563 622 10.48 Lake Macquarie (C) 1-12-05-11 191 205 7.33 Lake Macquarie (C) 1-12-05-12 386 420 8.81 Lake Macquarie (C) 1-12-05-13 390 436 11.79 Lake Macquarie (C) 1-12-05-14 17 18 5.88 Lake Macquarie (C) 1-12-05-15 828 900 8.70 Lake Macquarie (C) 1-12-05-16 191 196 2.62 Lake Macquarie (C) 1-12-05-17 384 390 1.56 Lake Macquarie (C) 1-12-06-01 344 364 5.81 Lake Macquarie (C) 1-12-06-02 311 334 7.40 Lake Macquarie (C) 1-12-06-03 542 574 5.90 Lake Macquarie (C) 1-12-06-04 521 563 8.06 Lake Macquarie (C) 1-12-06-05 314 338 7.64 Lake Macquarie (C) 1-12-06-06 415 445 7.23 Lake Macquarie (C) 1-12-06-07 514 714 38.91 Lake Macquarie (C) 1-12-06-09 466 508 9.01 Lake Macquarie (C) 1-12-06-10 537 587 9.31 Lake Macquarie (C) 1-12-06-11 607 785 29.32 Lake Macquarie (C) 1-12-06-12 473 524 10.78 Lake Macquarie (C) 1-12-06-13 205 210 2.44 Lake Macquarie (C) 1-12-07-01 674 726 7.72 Lake Macquarie (C) 1-12-07-02 625 659 5.44 Lake Macquarie (C) 1-12-07-03 414 431 4.11 Lake Macquarie (C) 1-12-07-04 534 568 6.37

New South Wales Redistribution Statistics 2006
Enrolment Projections Charlton
Actual Enrolment Estimate Growth SLA Name CCD Number 2/12/2005 31/5/2010 (%)
45
Lake Macquarie (C) 1-12-07-05 503 537 6.76 Lake Macquarie (C) 1-12-07-06 483 503 4.14 Lake Macquarie (C) 1-12-07-07 523 559 6.88 Lake Macquarie (C) 1-12-07-08 574 617 7.49 Lake Macquarie (C) 1-12-07-09 459 490 6.75 Lake Macquarie (C) 1-12-07-10 353 383 8.50 Lake Macquarie (C) 1-12-07-11 265 275 3.77 Lake Macquarie (C) 1-12-07-12 463 500 7.99 Lake Macquarie (C) 1-12-07-13 567 591 4.23 Lake Macquarie (C) 1-12-08-01 287 283 -1.39 Lake Macquarie (C) 1-12-08-02 203 213 4.93 Lake Macquarie (C) 1-12-08-03 247 249 0.81 Lake Macquarie (C) 1-12-08-04 415 443 6.75 Lake Macquarie (C) 1-12-08-05 569 619 8.79 Lake Macquarie (C) 1-12-08-06 406 427 5.17 Lake Macquarie (C) 1-12-08-07 471 488 3.61 Lake Macquarie (C) 1-12-08-08 591 653 10.49 Lake Macquarie (C) 1-12-08-09 275 302 9.82 Lake Macquarie (C) 1-12-08-10 476 532 11.76 Lake Macquarie (C) 1-12-08-11 268 271 1.12 Lake Macquarie (C) 1-12-09-01 417 429 2.88 Lake Macquarie (C) 1-12-09-02 369 405 9.76 Lake Macquarie (C) 1-12-09-03 495 543 9.70 Lake Macquarie (C) 1-12-09-04 342 350 2.34 Lake Macquarie (C) 1-12-09-05 401 429 6.98 Lake Macquarie (C) 1-12-09-06 452 473 4.65 Lake Macquarie (C) 1-12-09-07 411 417 1.46 Lake Macquarie (C) 1-12-09-08 500 524 4.80 Lake Macquarie (C) 1-12-09-09 518 532 2.70 Lake Macquarie (C) 1-12-09-10 442 519 17.42 Lake Macquarie (C) 1-12-09-11 200 199 -0.50 Lake Macquarie (C) 1-12-11-02 473 570 20.51 Lake Macquarie (C) 1-12-11-03 308 315 2.27 Lake Macquarie (C) 1-12-11-04 611 652 6.71 Lake Macquarie (C) 1-12-11-05 502 523 4.18 Lake Macquarie (C) 1-12-11-06 413 441 6.78 Lake Macquarie (C) 1-12-11-07 697 742 6.46 Lake Macquarie (C) 1-12-11-08 389 417 7.20 Lake Macquarie (C) 1-12-11-09 493 512 3.85 Lake Macquarie (C) 1-12-11-10 581 593 2.07 Lake Macquarie (C) 1-12-11-11 236 274 16.10 Lake Macquarie (C) 1-12-11-12 676 677 0.15

New South Wales Redistribution Statistics 2006
Enrolment Projections Charlton
Actual Enrolment Estimate Growth SLA Name CCD Number 2/12/2005 31/5/2010 (%)
46
Lake Macquarie (C) 1-12-12-01 541 543 0.37 Lake Macquarie (C) 1-12-12-02 420 443 5.48 Lake Macquarie (C) 1-12-12-03 529 559 5.67 Lake Macquarie (C) 1-12-12-04 380 403 6.05 Lake Macquarie (C) 1-12-12-05 239 251 5.02 Lake Macquarie (C) 1-12-12-06 133 136 2.26 Lake Macquarie (C) 1-12-12-07 202 225 11.39 Lake Macquarie (C) 1-12-12-08 372 379 1.88 Lake Macquarie (C) 1-12-12-09 358 369 3.07 Lake Macquarie (C) 1-12-12-10 321 335 4.36 Lake Macquarie (C) 1-12-12-11 510 519 1.76 Lake Macquarie (C) 1-12-12-12 509 652 28.09 Lake Macquarie (C) 1-12-12-13 656 672 2.44 Lake Macquarie (C) 1-12-12-14 571 578 1.23 Lake Macquarie (C) 1-12-12-15 247 257 4.05 Lake Macquarie (C) 1-12-13-01 332 345 3.92 Lake Macquarie (C) 1-12-13-02 685 721 5.26 Lake Macquarie (C) 1-12-13-03 257 256 -0.39 Lake Macquarie (C) 1-12-13-04 334 332 -0.60 Lake Macquarie (C) 1-12-13-05 405 428 5.68 Lake Macquarie (C) 1-12-13-06 388 397 2.32 Lake Macquarie (C) 1-12-13-07 433 446 3.00 Lake Macquarie (C) 1-12-13-08 605 600 -0.83 Lake Macquarie (C) 1-12-13-09 624 653 4.65 Lake Macquarie (C) 1-12-13-10 601 648 7.82 Lake Macquarie (C) 1-12-13-11 346 352 1.73 Lake Macquarie (C) 1-12-13-12 530 538 1.51 Lake Macquarie (C) 1-12-14-01 505 513 1.58 Lake Macquarie (C) 1-12-14-02 439 437 -0.46 Lake Macquarie (C) 1-12-14-03 547 570 4.20 Lake Macquarie (C) 1-12-14-04 749 766 2.27 Lake Macquarie (C) 1-12-14-05 175 183 4.57 Lake Macquarie (C) 1-12-14-06 364 371 1.92 Lake Macquarie (C) 1-12-14-07 467 483 3.43 Lake Macquarie (C) 1-12-14-08 800 947 18.38 Lake Macquarie (C) 1-12-14-09 528 534 1.14 Lake Macquarie (C) 1-12-14-10 765 928 21.31 Lake Macquarie (C) 1-12-14-11 392 394 0.51 Lake Macquarie (C) 1-12-14-12 415 422 1.69 Lake Macquarie (C) 1-12-15-01 158 160 1.27 Lake Macquarie (C) 1-12-15-05 202 345 70.79 Lake Macquarie (C) 1-12-15-06 549 562 2.37

New South Wales Redistribution Statistics 2006
Enrolment Projections Charlton
Actual Enrolment Estimate Growth SLA Name CCD Number 2/12/2005 31/5/2010 (%)
47
Lake Macquarie (C) 1-12-15-07 525 537 2.29 Lake Macquarie (C) 1-12-15-09 235 236 0.43 Lake Macquarie (C) 1-12-15-10 278 285 2.52 Lake Macquarie (C) 1-12-15-12 505 512 1.39 Lake Macquarie (C) 1-12-18-01 574 691 20.38 Lake Macquarie (C) 1-12-18-02 536 553 3.17 Lake Macquarie (C) 1-12-18-11 539 581 7.79 Lake Macquarie (C) 175 76086 81572 7.21 NSW Water areas 1-12-06-08 0 0 0.00 NSW Water areas 1 0 0 0.00 Newcastle (C) - Remainder 1-10-05-08 502 508 1.20 Newcastle (C) - Remainder 1-10-05-10 695 721 3.74 Newcastle (C) - Remainder 1-10-05-11 625 851 36.16 Newcastle (C) - Remainder 1-10-05-12 514 528 2.72 Newcastle (C) - Remainder 1-10-05-13 381 386 1.31 Newcastle (C) - Remainder 1-10-05-15 309 311 0.65 Newcastle (C) - Remainder 1-10-06-02 311 321 3.22 Newcastle (C) - Remainder 1-10-06-03 295 312 5.76 Newcastle (C) - Remainder 1-10-06-04 367 379 3.27 Newcastle (C) - Remainder 1-10-06-05 551 542 -1.63 Newcastle (C) - Remainder 1-10-06-06 547 568 3.84 Newcastle (C) - Remainder 1-10-06-07 361 361 0.00 Newcastle (C) - Remainder 1-10-06-08 681 690 1.32 Newcastle (C) - Remainder 1-10-06-09 488 494 1.23 Newcastle (C) - Remainder 1-10-06-10 649 661 1.85 Newcastle (C) - Remainder 1-10-06-11 389 394 1.29 Newcastle (C) - Remainder 1-10-06-12 396 406 2.53 Newcastle (C) - Remainder 1-10-06-13 369 376 1.90 Newcastle (C) - Remainder 1-10-06-14 478 522 9.21 Newcastle (C) - Remainder 1-10-21-01 64 78 21.88 Newcastle (C) - Remainder 1-10-22-01 295 304 3.05 Newcastle (C) - Remainder 1-10-22-16 0 0 0.00 Newcastle (C) - Remainder 22 9267 9713 4.81 Charlton 198 85353 91285 6.95

New South Wales Redistribution Statistics 2006
Enrolment Projections Chifley
Actual Enrolment Estimate Growth SLA Name CCD Number 2/12/2005 31/5/2010 (%)
48
Blacktown (C) - North 1-27-03-07 256 283 10.55 Blacktown (C) - North 1-27-03-11 231 249 7.79 Blacktown (C) - North 2 487 532 9.24 Blacktown (C) - South-East 1-27-14-01 341 350 2.64 Blacktown (C) - South-East 1-27-14-02 252 255 1.19 Blacktown (C) - South-East 1-27-14-03 229 227 -0.87 Blacktown (C) - South-East 1-27-14-04 610 614 0.66 Blacktown (C) - South-East 1-27-14-05 487 503 3.29 Blacktown (C) - South-East 1-27-14-06 400 412 3.00 Blacktown (C) - South-East 1-27-14-07 264 261 -1.14 Blacktown (C) - South-East 1-27-14-08 379 395 4.22 Blacktown (C) - South-East 1-27-14-09 488 511 4.71 Blacktown (C) - South-East 1-27-14-10 336 344 2.38 Blacktown (C) - South-East 1-27-14-11 397 406 2.27 Blacktown (C) - South-East 1-27-14-12 403 429 6.45 Blacktown (C) - South-East 1-27-14-13 655 668 1.98 Blacktown (C) - South-East 1-27-14-14 1162 1261 8.52 Blacktown (C) - South-East 1-27-14-15 556 564 1.44 Blacktown (C) - South-East 1-27-14-16 601 602 0.17 Blacktown (C) - South-East 1-27-14-17 455 536 17.80 Blacktown (C) - South-East 1-27-15-01 523 539 3.06 Blacktown (C) - South-East 1-27-15-02 286 287 0.35 Blacktown (C) - South-East 1-27-23-01 478 481 0.63 Blacktown (C) - South-East 1-27-23-02 346 351 1.45 Blacktown (C) - South-East 1-27-23-03 335 339 1.19 Blacktown (C) - South-East 1-27-23-04 318 326 2.52 Blacktown (C) - South-East 1-27-23-05 332 331 -0.30 Blacktown (C) - South-East 1-27-23-06 613 618 0.82 Blacktown (C) - South-East 1-27-23-07 300 306 2.00 Blacktown (C) - South-East 1-27-23-08 436 443 1.61 Blacktown (C) - South-East 1-27-23-09 408 408 0.00 Blacktown (C) - South-East 1-27-23-10 295 295 0.00 Blacktown (C) - South-East 1-27-23-11 645 661 2.48 Blacktown (C) - South-East 1-27-23-12 567 593 4.59 Blacktown (C) - South-East 1-27-23-13 653 667 2.14 Blacktown (C) - South-East 1-27-24-01 529 540 2.08 Blacktown (C) - South-East 1-27-24-02 399 408 2.26 Blacktown (C) - South-East 1-27-25-02 384 391 1.82 Blacktown (C) - South-East 1-27-25-08 612 624 1.96 Blacktown (C) - South-East 1-27-25-09 5 5 0.00
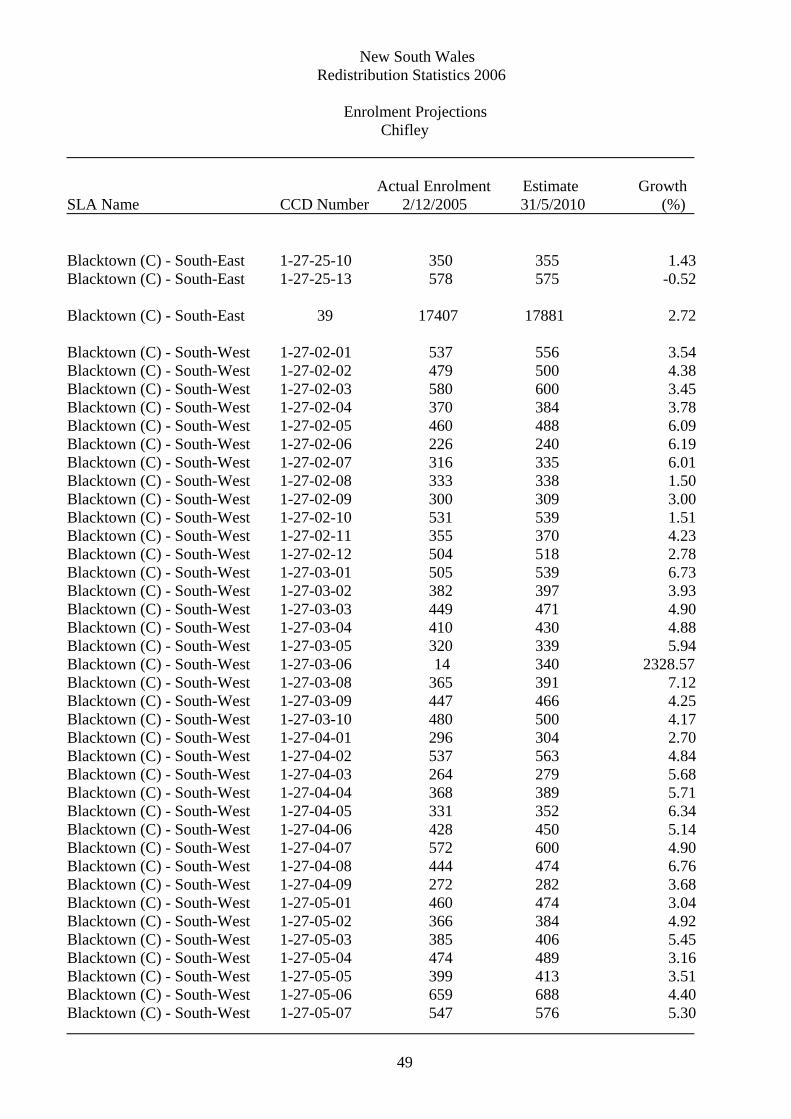
New South Wales Redistribution Statistics 2006
Enrolment Projections Chifley
Actual Enrolment Estimate Growth SLA Name CCD Number 2/12/2005 31/5/2010 (%)
49
Blacktown (C) - South-East 1-27-25-10 350 355 1.43 Blacktown (C) - South-East 1-27-25-13 578 575 -0.52 Blacktown (C) - South-East 39 17407 17881 2.72 Blacktown (C) - South-West 1-27-02-01 537 556 3.54 Blacktown (C) - South-West 1-27-02-02 479 500 4.38 Blacktown (C) - South-West 1-27-02-03 580 600 3.45 Blacktown (C) - South-West 1-27-02-04 370 384 3.78 Blacktown (C) - South-West 1-27-02-05 460 488 6.09 Blacktown (C) - South-West 1-27-02-06 226 240 6.19 Blacktown (C) - South-West 1-27-02-07 316 335 6.01 Blacktown (C) - South-West 1-27-02-08 333 338 1.50 Blacktown (C) - South-West 1-27-02-09 300 309 3.00 Blacktown (C) - South-West 1-27-02-10 531 539 1.51 Blacktown (C) - South-West 1-27-02-11 355 370 4.23 Blacktown (C) - South-West 1-27-02-12 504 518 2.78 Blacktown (C) - South-West 1-27-03-01 505 539 6.73 Blacktown (C) - South-West 1-27-03-02 382 397 3.93 Blacktown (C) - South-West 1-27-03-03 449 471 4.90 Blacktown (C) - South-West 1-27-03-04 410 430 4.88 Blacktown (C) - South-West 1-27-03-05 320 339 5.94 Blacktown (C) - South-West 1-27-03-06 14 340 2328.57 Blacktown (C) - South-West 1-27-03-08 365 391 7.12 Blacktown (C) - South-West 1-27-03-09 447 466 4.25 Blacktown (C) - South-West 1-27-03-10 480 500 4.17 Blacktown (C) - South-West 1-27-04-01 296 304 2.70 Blacktown (C) - South-West 1-27-04-02 537 563 4.84 Blacktown (C) - South-West 1-27-04-03 264 279 5.68 Blacktown (C) - South-West 1-27-04-04 368 389 5.71 Blacktown (C) - South-West 1-27-04-05 331 352 6.34 Blacktown (C) - South-West 1-27-04-06 428 450 5.14 Blacktown (C) - South-West 1-27-04-07 572 600 4.90 Blacktown (C) - South-West 1-27-04-08 444 474 6.76 Blacktown (C) - South-West 1-27-04-09 272 282 3.68 Blacktown (C) - South-West 1-27-05-01 460 474 3.04 Blacktown (C) - South-West 1-27-05-02 366 384 4.92 Blacktown (C) - South-West 1-27-05-03 385 406 5.45 Blacktown (C) - South-West 1-27-05-04 474 489 3.16 Blacktown (C) - South-West 1-27-05-05 399 413 3.51 Blacktown (C) - South-West 1-27-05-06 659 688 4.40 Blacktown (C) - South-West 1-27-05-07 547 576 5.30

New South Wales Redistribution Statistics 2006
Enrolment Projections Chifley
Actual Enrolment Estimate Growth SLA Name CCD Number 2/12/2005 31/5/2010 (%)
50
Blacktown (C) - South-West 1-27-05-08 452 479 5.97 Blacktown (C) - South-West 1-27-05-09 184 191 3.80 Blacktown (C) - South-West 1-27-05-10 338 349 3.25 Blacktown (C) - South-West 1-27-05-11 321 339 5.61 Blacktown (C) - South-West 1-27-06-01 281 295 4.98 Blacktown (C) - South-West 1-27-06-02 433 451 4.16 Blacktown (C) - South-West 1-27-06-03 378 401 6.08 Blacktown (C) - South-West 1-27-06-04 221 231 4.52 Blacktown (C) - South-West 1-27-06-05 357 369 3.36 Blacktown (C) - South-West 1-27-06-06 336 351 4.46 Blacktown (C) - South-West 1-27-06-07 339 348 2.65 Blacktown (C) - South-West 1-27-06-08 538 553 2.79 Blacktown (C) - South-West 1-27-06-09 369 385 4.34 Blacktown (C) - South-West 1-27-06-10 349 362 3.72 Blacktown (C) - South-West 1-27-07-01 392 403 2.81 Blacktown (C) - South-West 1-27-07-02 481 503 4.57 Blacktown (C) - South-West 1-27-07-03 553 581 5.06 Blacktown (C) - South-West 1-27-07-04 303 318 4.95 Blacktown (C) - South-West 1-27-07-05 266 271 1.88 Blacktown (C) - South-West 1-27-07-06 477 497 4.19 Blacktown (C) - South-West 1-27-07-07 153 155 1.31 Blacktown (C) - South-West 1-27-07-08 346 363 4.91 Blacktown (C) - South-West 1-27-07-09 349 352 0.86 Blacktown (C) - South-West 1-27-07-10 471 495 5.10 Blacktown (C) - South-West 1-27-08-01 511 530 3.72 Blacktown (C) - South-West 1-27-08-02 334 347 3.89 Blacktown (C) - South-West 1-27-08-03 365 610 67.12 Blacktown (C) - South-West 1-27-08-04 397 413 4.03 Blacktown (C) - South-West 1-27-08-05 403 420 4.22 Blacktown (C) - South-West 1-27-08-06 304 331 8.88 Blacktown (C) - South-West 1-27-08-07 322 353 9.63 Blacktown (C) - South-West 1-27-08-08 332 349 5.12 Blacktown (C) - South-West 1-27-08-09 432 461 6.71 Blacktown (C) - South-West 1-27-08-10 576 596 3.47 Blacktown (C) - South-West 1-27-08-11 806 882 9.43 Blacktown (C) - South-West 1-27-08-12 577 608 5.37 Blacktown (C) - South-West 1-27-09-01 479 702 46.56 Blacktown (C) - South-West 1-27-09-02 631 736 16.64 Blacktown (C) - South-West 1-27-09-03 552 579 4.89 Blacktown (C) - South-West 1-27-09-04 529 559 5.67 Blacktown (C) - South-West 1-27-09-05 517 531 2.71 Blacktown (C) - South-West 1-27-09-06 475 547 15.16

New South Wales Redistribution Statistics 2006
Enrolment Projections Chifley
Actual Enrolment Estimate Growth SLA Name CCD Number 2/12/2005 31/5/2010 (%)
51
Blacktown (C) - South-West 1-27-09-07 508 762 50.00 Blacktown (C) - South-West 1-27-09-08 502 552 9.96 Blacktown (C) - South-West 1-27-09-09 255 269 5.49 Blacktown (C) - South-West 1-27-09-10 480 507 5.62 Blacktown (C) - South-West 1-27-09-11 305 317 3.93 Blacktown (C) - South-West 1-27-09-12 640 764 19.38 Blacktown (C) - South-West 1-27-09-13 516 763 47.87 Blacktown (C) - South-West 1-27-09-14 457 505 10.50 Blacktown (C) - South-West 1-27-09-15 330 345 4.55 Blacktown (C) - South-West 1-27-09-16 349 373 6.88 Blacktown (C) - South-West 1-27-25-01 124 134 8.06 Blacktown (C) - South-West 1-27-25-03 524 539 2.86 Blacktown (C) - South-West 1-27-25-04 570 582 2.11 Blacktown (C) - South-West 1-27-25-05 570 594 4.21 Blacktown (C) - South-West 1-27-25-06 597 616 3.18 Blacktown (C) - South-West 1-27-25-07 425 495 16.47 Blacktown (C) - South-West 1-27-25-11 430 502 16.74 Blacktown (C) - South-West 1-27-25-12 24 23 -4.17 Blacktown (C) - South-West 1-27-25-12 25 25 0.00 Blacktown (C) - South-West 1-27-27-01 441 477 8.16 Blacktown (C) - South-West 1-27-27-02 435 455 4.60 Blacktown (C) - South-West 1-27-27-03 448 506 12.95 Blacktown (C) - South-West 1-27-27-04 420 424 0.95 Blacktown (C) - South-West 1-27-27-05 280 285 1.79 Blacktown (C) - South-West 1-27-27-06 455 475 4.40 Blacktown (C) - South-West 1-27-27-07 395 432 9.37 Blacktown (C) - South-West 1-27-27-08 282 309 9.57 Blacktown (C) - South-West 1-27-27-09 992 1526 53.83 Blacktown (C) - South-West 1-27-27-10 445 492 10.56 Blacktown (C) - South-West 1-27-27-11 259 364 40.54 Blacktown (C) - South-West 1-27-27-12 609 631 3.61 Blacktown (C) - South-West 1-27-30-01 412 478 16.02 Blacktown (C) - South-West 1-27-30-02 762 812 6.56 Blacktown (C) - South-West 1-27-30-03 337 354 5.04 Blacktown (C) - South-West 1-27-30-04 335 350 4.48 Blacktown (C) - South-West 1-27-30-05 604 631 4.47 Blacktown (C) - South-West 1-27-30-06 423 434 2.60 Blacktown (C) - South-West 1-27-30-07 733 759 3.55 Blacktown (C) - South-West 1-27-30-08 539 560 3.90 Blacktown (C) - South-West 1-27-30-09 479 500 4.38 Blacktown (C) - South-West 1-27-30-10 343 350 2.04 Blacktown (C) - South-West 1-27-30-11 365 371 1.64
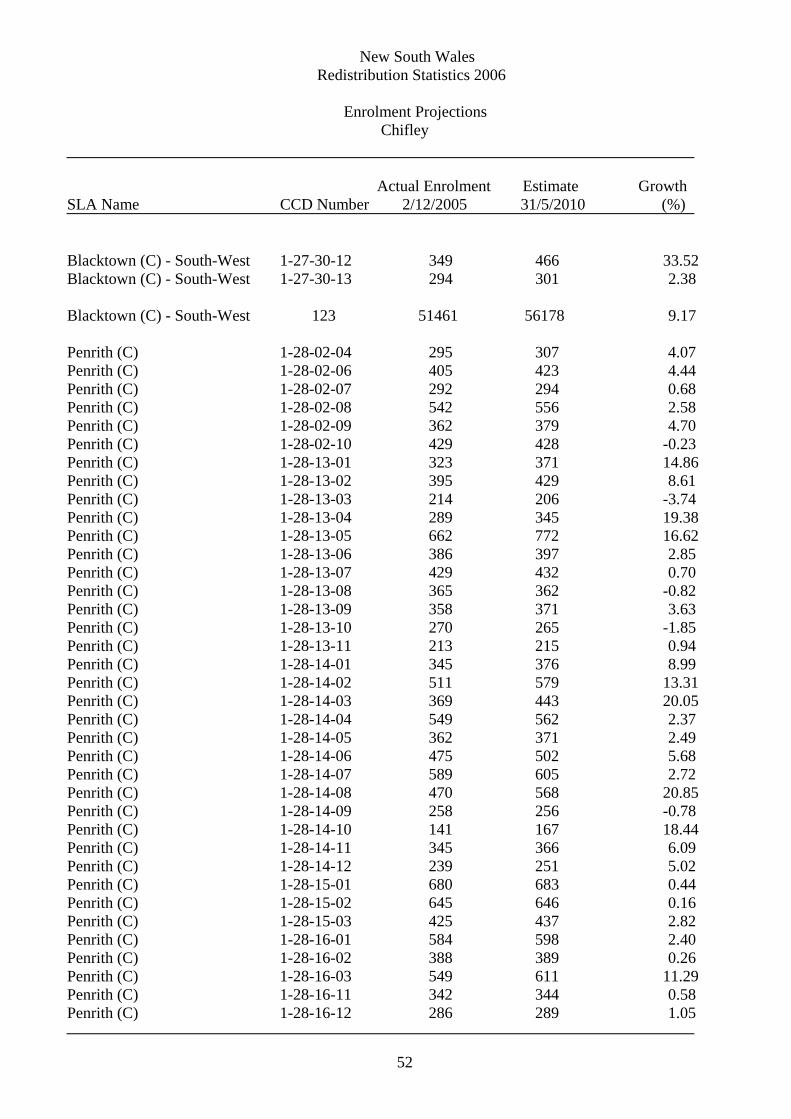
New South Wales Redistribution Statistics 2006
Enrolment Projections Chifley
Actual Enrolment Estimate Growth SLA Name CCD Number 2/12/2005 31/5/2010 (%)
52
Penrith (C) 1-28-15-02 645 646 0.16
Blacktown (C) - South-West 1-27-30-12 349 466 33.52 Blacktown (C) - South-West 1-27-30-13 294 301 2.38 Blacktown (C) - South-West 123 51461 56178 9.17 Penrith (C) 1-28-02-04 295 307 4.07 Penrith (C) 1-28-02-06 405 423 4.44 Penrith (C) 1-28-02-07 292 294 0.68 Penrith (C) 1-28-02-08 542 556 2.58 Penrith (C) 1-28-02-09 362 379 4.70 Penrith (C) 1-28-02-10 429 428 -0.23 Penrith (C) 1-28-13-01 323 371 14.86 Penrith (C) 1-28-13-02 395 429 8.61 Penrith (C) 1-28-13-03 214 206 -3.74 Penrith (C) 1-28-13-04 289 345 19.38 Penrith (C) 1-28-13-05 662 772 16.62 Penrith (C) 1-28-13-06 386 397 2.85 Penrith (C) 1-28-13-07 429 432 0.70 Penrith (C) 1-28-13-08 365 362 -0.82 Penrith (C) 1-28-13-09 358 371 3.63 Penrith (C) 1-28-13-10 270 265 -1.85 Penrith (C) 1-28-13-11 213 215 0.94 Penrith (C) 1-28-14-01 345 376 8.99 Penrith (C) 1-28-14-02 511 579 13.31 Penrith (C) 1-28-14-03 369 443 20.05 Penrith (C) 1-28-14-04 549 562 2.37 Penrith (C) 1-28-14-05 362 371 2.49 Penrith (C) 1-28-14-06 475 502 5.68 Penrith (C) 1-28-14-07 589 605 2.72 Penrith (C) 1-28-14-08 470 568 20.85 Penrith (C) 1-28-14-09 258 256 -0.78 Penrith (C) 1-28-14-10 141 167 18.44 Penrith (C) 1-28-14-11 345 366 6.09 Penrith (C) 1-28-14-12 239 251 5.02 Penrith (C) 1-28-15-01 680 683 0.44
Penrith (C) 1-28-15-03 425 437 2.82 Penrith (C) 1-28-16-01 584 598 2.40 Penrith (C) 1-28-16-02 388 389 0.26 Penrith (C) 1-28-16-03 549 611 11.29 Penrith (C) 1-28-16-11 342 344 0.58 Penrith (C) 1-28-16-12 286 289 1.05

New South Wales Redistribution Statistics 2006
Enrolment Projections Chifley
Actual Enrolment Estimate Growth SLA Name CCD Number 2/12/2005 31/5/2010 (%)
53
Penrith (C) 37 14781 15595 5.51 Chifley 201 84136 90186 7.19

New South Wales Redistribution Statistics 2006
Enrolment Projections Cook
Actual Enrolment Estimate Growth SLA Name CCD Number 2/12/2005 31/5/2010 (%)
54
NSW Water areas 1-31-15-09 0 0 0.00 NSW Water areas 1-31-15-12 0 0 0.00 NSW Water areas 1-31-15-13 0 0 0.00 NSW Water areas 1-31-23-13 1 1 0.00 NSW Water areas 1-31-26-11 0 0 0.00 NSW Water areas 5 1 1 0.00 Sutherland Shire (A) - East 1-31-10-01 353 351 -0.57 Sutherland Shire (A) - East 1-31-10-02 532 542 1.88 Sutherland Shire (A) - East 1-31-10-03 507 538 6.11 Sutherland Shire (A) - East 1-31-10-04 692 715 3.32 Sutherland Shire (A) - East 1-31-10-05 636 660 3.77 Sutherland Shire (A) - East 1-31-10-06 282 282 0.00 Sutherland Shire (A) - East 1-31-10-07 570 579 1.58 Sutherland Shire (A) - East 1-31-10-08 548 574 4.74 Sutherland Shire (A) - East 1-31-10-09 542 543 0.18 Sutherland Shire (A) - East 1-31-10-10 335 346 3.28 Sutherland Shire (A) - East 1-31-10-11 298 308 3.36 Sutherland Shire (A) - East 1-31-10-12 295 300 1.69 Sutherland Shire (A) - East 1-31-11-05 380 420 10.53 Sutherland Shire (A) - East 1-31-11-06 397 430 8.31 Sutherland Shire (A) - East 1-31-11-07 420 478 13.81 Sutherland Shire (A) - East 1-31-11-09 236 235 -0.42 Sutherland Shire (A) - East 1-31-11-10 246 305 23.98 Sutherland Shire (A) - East 1-31-11-11 295 355 20.34 Sutherland Shire (A) - East 1-31-12-02 528 537 1.70 Sutherland Shire (A) - East 1-31-12-03 529 554 4.73 Sutherland Shire (A) - East 1-31-12-04 571 585 2.45 Sutherland Shire (A) - East 1-31-12-05 578 594 2.77 Sutherland Shire (A) - East 1-31-12-06 277 273 -1.44 Sutherland Shire (A) - East 1-31-12-07 515 520 0.97 Sutherland Shire (A) - East 1-31-12-08 491 494 0.61 Sutherland Shire (A) - East 1-31-12-09 615 641 4.23 Sutherland Shire (A) - East 1-31-12-10 532 556 4.51 Sutherland Shire (A) - East 1-31-12-11 370 377 1.89 Sutherland Shire (A) - East 1-31-13-01 762 787 3.28 Sutherland Shire (A) - East 1-31-13-02 619 642 3.72 Sutherland Shire (A) - East 1-31-13-03 476 486 2.10 Sutherland Shire (A) - East 1-31-13-04 436 459 5.28 Sutherland Shire (A) - East 1-31-13-05 287 326 13.59 Sutherland Shire (A) - East 1-31-13-06 306 317 3.59

New South Wales Redistribution Statistics 2006
Enrolment Projections Cook
Actual Enrolment Estimate Growth SLA Name CCD Number 2/12/2005 31/5/2010 (%)
55
Sutherland Shire (A) - East 1-31-13-07 797 800 0.38 Sutherland Shire (A) - East 1-31-13-08 511 530 3.72 Sutherland Shire (A) - East 1-31-13-09 372 376 1.08 Sutherland Shire (A) - East 1-31-13-10 456 468 2.63 Sutherland Shire (A) - East 1-31-13-11 374 390 4.28 Sutherland Shire (A) - East 1-31-13-12 383 384 0.26 Sutherland Shire (A) - East 1-31-13-13 495 534 7.88 Sutherland Shire (A) - East 1-31-13-14 480 499 3.96 Sutherland Shire (A) - East 1-31-14-01 190 277 45.79 Sutherland Shire (A) - East 1-31-14-02 285 298 4.56 Sutherland Shire (A) - East 1-31-14-03 373 377 1.07 Sutherland Shire (A) - East 1-31-14-04 364 423 16.21 Sutherland Shire (A) - East 1-31-14-05 417 448 7.43 Sutherland Shire (A) - East 1-31-14-06 403 413 2.48 Sutherland Shire (A) - East 1-31-14-07 453 456 0.66 Sutherland Shire (A) - East 1-31-14-08 540 549 1.67 Sutherland Shire (A) - East 1-31-14-09 397 411 3.53 Sutherland Shire (A) - East 1-31-14-10 668 904 35.33 Sutherland Shire (A) - East 1-31-14-11 411 420 2.19 Sutherland Shire (A) - East 1-31-14-12 454 492 8.37 Sutherland Shire (A) - East 1-31-14-13 225 225 0.00 Sutherland Shire (A) - East 1-31-15-01 453 461 1.77 Sutherland Shire (A) - East 1-31-15-02 439 452 2.96 Sutherland Shire (A) - East 1-31-15-03 525 541 3.05 Sutherland Shire (A) - East 1-31-15-04 247 486 96.76 Sutherland Shire (A) - East 1-31-15-05 356 378 6.18 Sutherland Shire (A) - East 1-31-15-06 206 202 -1.94 Sutherland Shire (A) - East 1-31-15-07 654 690 5.50 Sutherland Shire (A) - East 1-31-15-08 574 592 3.14 Sutherland Shire (A) - East 1-31-15-10 6 5 -16.67 Sutherland Shire (A) - East 1-31-15-11 273 285 4.40 Sutherland Shire (A) - East 1-31-15-14 259 275 6.18 Sutherland Shire (A) - East 1-31-15-15 384 380 -1.04 Sutherland Shire (A) - East 1-31-16-01 380 385 1.32 Sutherland Shire (A) - East 1-31-16-02 588 599 1.87 Sutherland Shire (A) - East 1-31-16-03 483 488 1.04 Sutherland Shire (A) - East 1-31-16-04 416 427 2.64 Sutherland Shire (A) - East 1-31-16-05 288 290 0.69 Sutherland Shire (A) - East 1-31-16-06 351 343 -2.28 Sutherland Shire (A) - East 1-31-16-07 549 569 3.64 Sutherland Shire (A) - East 1-31-16-08 425 474 11.53 Sutherland Shire (A) - East 1-31-16-09 384 400 4.17

New South Wales Redistribution Statistics 2006
Enrolment Projections Cook
Actual Enrolment Estimate Growth SLA Name CCD Number 2/12/2005 31/5/2010 (%)
56
Sutherland Shire (A) - East 1-31-16-10 343 371 8.16 Sutherland Shire (A) - East 1-31-16-11 251 246 -1.99 Sutherland Shire (A) - East 1-31-16-12 325 327 0.62 Sutherland Shire (A) - East 1-31-16-13 357 365 2.24 Sutherland Shire (A) - East 1-31-16-14 221 230 4.07 Sutherland Shire (A) - East 1-31-17-01 528 535 1.33 Sutherland Shire (A) - East 1-31-17-02 442 476 7.69 Sutherland Shire (A) - East 1-31-17-03 536 578 7.84 Sutherland Shire (A) - East 1-31-17-04 428 453 5.84 Sutherland Shire (A) - East 1-31-17-05 644 656 1.86 Sutherland Shire (A) - East 1-31-17-06 622 634 1.93 Sutherland Shire (A) - East 1-31-17-07 503 501 -0.40 Sutherland Shire (A) - East 1-31-17-08 762 780 2.36 Sutherland Shire (A) - East 1-31-17-09 223 233 4.48 Sutherland Shire (A) - East 1-31-17-10 358 369 3.07 Sutherland Shire (A) - East 1-31-17-11 304 317 4.28 Sutherland Shire (A) - East 1-31-17-12 582 687 18.04 Sutherland Shire (A) - East 1-31-17-13 655 750 14.50 Sutherland Shire (A) - East 1-31-17-14 374 395 5.61 Sutherland Shire (A) - East 1-31-18-01 700 788 12.57 Sutherland Shire (A) - East 1-31-18-02 425 443 4.24 Sutherland Shire (A) - East 1-31-18-03 325 334 2.77 Sutherland Shire (A) - East 1-31-18-04 579 585 1.04 Sutherland Shire (A) - East 1-31-18-05 391 447 14.32 Sutherland Shire (A) - East 1-31-18-06 395 405 2.53 Sutherland Shire (A) - East 1-31-18-07 344 356 3.49 Sutherland Shire (A) - East 1-31-18-08 506 519 2.57 Sutherland Shire (A) - East 1-31-18-09 699 707 1.14 Sutherland Shire (A) - East 1-31-18-10 171 173 1.17 Sutherland Shire (A) - East 1-31-18-11 575 576 0.17 Sutherland Shire (A) - East 1-31-18-12 333 533 60.06 Sutherland Shire (A) - East 1-31-18-13 230 236 2.61 Sutherland Shire (A) - East 1-31-18-14 298 301 1.01 Sutherland Shire (A) - East 1-31-19-01 372 383 2.96 Sutherland Shire (A) - East 1-31-19-02 541 555 2.59 Sutherland Shire (A) - East 1-31-19-03 816 854 4.66 Sutherland Shire (A) - East 1-31-19-04 235 243 3.40 Sutherland Shire (A) - East 1-31-19-05 417 444 6.47 Sutherland Shire (A) - East 1-31-19-06 397 410 3.27 Sutherland Shire (A) - East 1-31-19-07 296 301 1.69 Sutherland Shire (A) - East 1-31-19-08 239 243 1.67 Sutherland Shire (A) - East 1-31-19-09 573 592 3.32

New South Wales Redistribution Statistics 2006
Enrolment Projections Cook
Actual Enrolment Estimate Growth SLA Name CCD Number 2/12/2005 31/5/2010 (%)
57
Sutherland Shire (A) - East 1-31-19-10 557 565 1.44 Sutherland Shire (A) - East 1-31-19-11 425 436 2.59 Sutherland Shire (A) - East 1-31-19-12 407 422 3.69 Sutherland Shire (A) - East 1-31-20-01 249 294 18.07 Sutherland Shire (A) - East 1-31-20-02 481 496 3.12 Sutherland Shire (A) - East 1-31-20-03 296 295 -0.34 Sutherland Shire (A) - East 1-31-20-04 475 551 16.00 Sutherland Shire (A) - East 1-31-20-05 461 505 9.54 Sutherland Shire (A) - East 1-31-20-06 216 216 0.00 Sutherland Shire (A) - East 1-31-20-07 195 199 2.05 Sutherland Shire (A) - East 1-31-20-08 200 215 7.50 Sutherland Shire (A) - East 1-31-20-09 252 254 0.79 Sutherland Shire (A) - East 1-31-20-10 398 405 1.76 Sutherland Shire (A) - East 1-31-20-11 203 212 4.43 Sutherland Shire (A) - East 1-31-20-12 193 209 8.29 Sutherland Shire (A) - East 1-31-20-13 267 287 7.49 Sutherland Shire (A) - East 1-31-20-14 179 185 3.35 Sutherland Shire (A) - East 1-31-21-01 316 331 4.75 Sutherland Shire (A) - East 1-31-21-02 228 227 -0.44 Sutherland Shire (A) - East 1-31-21-03 250 256 2.40 Sutherland Shire (A) - East 1-31-21-04 542 573 5.72 Sutherland Shire (A) - East 1-31-21-05 244 247 1.23 Sutherland Shire (A) - East 1-31-21-06 330 326 -1.21 Sutherland Shire (A) - East 1-31-21-07 326 333 2.15 Sutherland Shire (A) - East 1-31-21-08 262 275 4.96 Sutherland Shire (A) - East 1-31-21-09 328 357 8.84 Sutherland Shire (A) - East 1-31-21-10 198 205 3.54 Sutherland Shire (A) - East 1-31-21-11 176 180 2.27 Sutherland Shire (A) - East 1-31-22-01 323 335 3.72 Sutherland Shire (A) - East 1-31-22-02 243 243 0.00 Sutherland Shire (A) - East 1-31-22-03 293 309 5.46 Sutherland Shire (A) - East 1-31-22-04 341 341 0.00 Sutherland Shire (A) - East 1-31-22-05 565 585 3.54 Sutherland Shire (A) - East 1-31-22-06 334 337 0.90 Sutherland Shire (A) - East 1-31-22-07 220 234 6.36 Sutherland Shire (A) - East 1-31-22-08 641 651 1.56 Sutherland Shire (A) - East 1-31-22-09 566 604 6.71 Sutherland Shire (A) - East 1-31-22-10 184 189 2.72 Sutherland Shire (A) - East 1-31-22-11 287 289 0.70 Sutherland Shire (A) - East 1-31-23-07 9 9 0.00 Sutherland Shire (A) - East 1-31-23-08 392 425 8.42 Sutherland Shire (A) - East 1-31-23-09 272 277 1.84

New South Wales Redistribution Statistics 2006
Enrolment Projections Cook
Actual Enrolment Estimate Growth SLA Name CCD Number 2/12/2005 31/5/2010 (%)
58
Sutherland Shire (A) - East 1-31-23-10 369 385 4.34 Sutherland Shire (A) - East 1-31-23-11 413 417 0.97 Sutherland Shire (A) - East 1-31-23-12 344 347 0.87 Sutherland Shire (A) - East 1-31-26-01 633 734 15.96 Sutherland Shire (A) - East 1-31-26-02 432 448 3.70 Sutherland Shire (A) - East 1-31-26-03 273 272 -0.37 Sutherland Shire (A) - East 1-31-26-04 575 604 5.04 Sutherland Shire (A) - East 1-31-26-05 603 610 1.16 Sutherland Shire (A) - East 1-31-26-06 308 313 1.62 Sutherland Shire (A) - East 1-31-26-07 697 709 1.72 Sutherland Shire (A) - East 1-31-26-08 212 226 6.60 Sutherland Shire (A) - East 1-31-26-09 368 393 6.79 Sutherland Shire (A) - East 1-31-26-10 584 701 20.03 Sutherland Shire (A) - East 173 70194 73879 5.25 Sutherland Shire (A) - West 1-31-04-06 1 1 0.00 Sutherland Shire (A) - West 1-31-08-09 566 561 -0.88 Sutherland Shire (A) - West 1-31-08-10 462 458 -0.87 Sutherland Shire (A) - West 1-31-08-11 654 648 -0.92 Sutherland Shire (A) - West 1-31-08-12 332 330 -0.60 Sutherland Shire (A) - West 1-31-09-05 331 322 -2.72 Sutherland Shire (A) - West 1-31-09-06 427 432 1.17 Sutherland Shire (A) - West 1-31-09-07 568 575 1.23 Sutherland Shire (A) - West 1-31-09-08 439 435 -0.91 Sutherland Shire (A) - West 1-31-09-09 364 362 -0.55 Sutherland Shire (A) - West 1-31-09-12 498 517 3.82 Sutherland Shire (A) - West 1-31-09-14 264 267 1.14 Sutherland Shire (A) - West 1-31-11-01 458 466 1.75 Sutherland Shire (A) - West 1-31-11-02 559 574 2.68 Sutherland Shire (A) - West 1-31-11-03 570 599 5.09 Sutherland Shire (A) - West 1-31-11-04 273 267 -2.20 Sutherland Shire (A) - West 1-31-11-08 196 195 -0.51 Sutherland Shire (A) - West 1-31-12-01 676 683 1.04 Sutherland Shire (A) - West 1-31-23-01 518 535 3.28 Sutherland Shire (A) - West 1-31-23-02 624 632 1.28 Sutherland Shire (A) - West 1-31-23-03 261 261 0.00 Sutherland Shire (A) - West 1-31-23-04 605 626 3.47 Sutherland Shire (A) - West 1-31-23-05 663 666 0.45 Sutherland Shire (A) - West 1-31-23-06 383 392 2.35 Sutherland Shire (A) - West 1-31-23-14 395 405 2.53 Sutherland Shire (A) - West 1-31-23-15 256 252 -1.56

New South Wales Redistribution Statistics 2006
Enrolment Projections Cook
Actual Enrolment Estimate Growth SLA Name CCD Number 2/12/2005 31/5/2010 (%)
59
Sutherland Shire (A) - West 26 11343 11461 1.04 Cook 204 81538 85341 4.66

New South Wales Redistribution Statistics 2006
Enrolment Projections Cowper
Actual Enrolment Estimate Growth SLA Name CCD Number 2/12/2005 31/5/2010 (%)
60
Bellingen (A) 1-08-07-01 219 219 0.00 Bellingen (A) 1-08-07-02 341 355 4.11 Bellingen (A) 1-08-07-03 158 151 -4.43 Bellingen (A) 1-08-07-04 394 398 1.02 Bellingen (A) 1-08-07-05 304 309 1.64 Bellingen (A) 1-08-07-06 256 261 1.95 Bellingen (A) 1-08-07-07 228 241 5.70 Bellingen (A) 1-08-07-08 314 324 3.18 Bellingen (A) 1-08-07-09 352 358 1.70 Bellingen (A) 1-08-07-10 763 852 11.66 Bellingen (A) 1-08-07-11 714 730 2.24 Bellingen (A) 1-08-08-01 420 445 5.95 Bellingen (A) 1-08-08-02 415 459 10.60 Bellingen (A) 1-08-08-03 258 259 0.39 Bellingen (A) 1-08-08-04 700 751 7.29 Bellingen (A) 1-08-08-05 158 172 8.86 Bellingen (A) 1-08-08-06 456 468 2.63 Bellingen (A) 1-08-08-07 356 339 -4.78 Bellingen (A) 1-08-08-08 595 622 4.54 Bellingen (A) 1-08-08-09 653 716 9.65 Bellingen (A) 1-08-08-10 208 214 2.88 Bellingen (A) 1-08-08-11 394 404 2.54 Bellingen (A) 22 8656 9047 4.52 Clarence Valley (A) - Maclean 1-06-09-01 139 144 3.60 Clarence Valley (A) - Maclean 1-06-09-03 673 742 10.25 Clarence Valley (A) - Maclean 1-06-09-04 358 377 5.31 Clarence Valley (A) - Maclean 1-06-09-05 283 303 7.07 Clarence Valley (A) - Maclean 1-06-09-06 441 476 7.94 Clarence Valley (A) - Maclean 1-06-09-07 571 609 6.65 Clarence Valley (A) - Maclean 1-06-09-09 351 407 15.95 Clarence Valley (A) - Maclean 1-06-09-10 168 179 6.55 Clarence Valley (A) - Maclean 1-06-09-11 199 205 3.02 Clarence Valley (A) - Maclean 1-06-09-12 545 668 22.57 Clarence Valley (A) - Maclean 1-06-11-01 282 312 10.64 Clarence Valley (A) - Maclean 1-06-11-02 469 492 4.90 Clarence Valley (A) - Maclean 1-06-11-03 509 541 6.29 Clarence Valley (A) - Maclean 1-06-11-04 393 427 8.65 Clarence Valley (A) - Maclean 1-06-11-05 220 247 12.27 Clarence Valley (A) - Maclean 1-06-11-06 177 193 9.04 Clarence Valley (A) - Maclean 1-06-11-07 612 658 7.52

New South Wales Redistribution Statistics 2006
Enrolment Projections Cowper
Actual Enrolment Estimate Growth SLA Name CCD Number 2/12/2005 31/5/2010 (%)
61
Clarence Valley (A) - Maclean 1-06-11-08 451 525 16.41 Clarence Valley (A) - Maclean 1-06-11-09 151 183 21.19 Clarence Valley (A) - Maclean 1-06-11-10 483 512 6.00 Clarence Valley (A) - Maclean 1-06-11-11 479 527 10.02 Clarence Valley (A) - Maclean 1-06-11-12 751 856 13.98 Clarence Valley (A) - Maclean 22 8705 9583 10.09 Clarence Valley (A) - Ulmarra 1-06-08-01 308 315 2.27 Clarence Valley (A) - Ulmarra 1-06-08-02 325 329 1.23 Clarence Valley (A) - Ulmarra 1-06-08-03 338 344 1.78 Clarence Valley (A) - Ulmarra 1-06-08-04 243 251 3.29 Clarence Valley (A) - Ulmarra 1-06-08-05 172 203 18.02 Clarence Valley (A) - Ulmarra 1-06-08-06 390 444 13.85 Clarence Valley (A) - Ulmarra 1-06-08-08 159 172 8.18 Clarence Valley (A) - Ulmarra 1-06-08-09 547 621 13.53 Clarence Valley (A) - Ulmarra 1-06-08-10 106 113 6.60 Clarence Valley (A) - Ulmarra 1-06-08-11 382 426 11.52 Clarence Valley (A) - Ulmarra 1-06-08-12 184 193 4.89 Clarence Valley (A) - Ulmarra 1-06-08-14 175 185 5.71 Clarence Valley (A) - Ulmarra 12 3329 3596 8.02 Coffs Harbour (C) - Pt A 1-08-02-05 537 672 25.14 Coffs Harbour (C) - Pt A 1-08-02-06 406 408 0.49 Coffs Harbour (C) - Pt A 1-08-02-07 630 654 3.81 Coffs Harbour (C) - Pt A 1-08-02-08 349 348 -0.29 Coffs Harbour (C) - Pt A 1-08-02-12 324 467 44.14 Coffs Harbour (C) - Pt A 1-08-03-01 311 313 0.64 Coffs Harbour (C) - Pt A 1-08-03-02 272 267 -1.84 Coffs Harbour (C) - Pt A 1-08-03-03 397 400 0.76 Coffs Harbour (C) - Pt A 1-08-03-04 669 666 -0.45 Coffs Harbour (C) - Pt A 1-08-03-05 618 604 -2.27 Coffs Harbour (C) - Pt A 1-08-03-06 509 611 20.04 Coffs Harbour (C) - Pt A 1-08-03-07 649 675 4.01 Coffs Harbour (C) - Pt A 1-08-03-08 530 537 1.32 Coffs Harbour (C) - Pt A 1-08-03-09 321 326 1.56 Coffs Harbour (C) - Pt A 1-08-03-10 247 277 12.15 Coffs Harbour (C) - Pt A 1-08-03-11 784 913 16.45 Coffs Harbour (C) - Pt A 1-08-03-12 356 367 3.09 Coffs Harbour (C) - Pt A 1-08-04-01 231 250 8.23 Coffs Harbour (C) - Pt A 1-08-04-02 499 540 8.22

New South Wales Redistribution Statistics 2006
Enrolment Projections Cowper
Actual Enrolment Estimate Growth SLA Name CCD Number 2/12/2005 31/5/2010 (%)
62
Coffs Harbour (C) - Pt A 1-08-04-03 240 270 12.50 Coffs Harbour (C) - Pt A 1-08-04-04 237 254 7.17 Coffs Harbour (C) - Pt A 1-08-04-05 288 297 3.12 Coffs Harbour (C) - Pt A 1-08-04-06 171 164 -4.09 Coffs Harbour (C) - Pt A 1-08-04-07 98 108 10.20 Coffs Harbour (C) - Pt A 1-08-04-08 633 692 9.32 Coffs Harbour (C) - Pt A 1-08-04-09 225 233 3.56 Coffs Harbour (C) - Pt A 1-08-04-10 444 444 0.00 Coffs Harbour (C) - Pt A 1-08-04-11 259 272 5.02 Coffs Harbour (C) - Pt A 1-08-04-12 173 210 21.39 Coffs Harbour (C) - Pt A 1-08-04-13 462 503 8.87 Coffs Harbour (C) - Pt A 1-08-05-01 273 299 9.52 Coffs Harbour (C) - Pt A 1-08-05-02 421 434 3.09 Coffs Harbour (C) - Pt A 1-08-05-03 193 203 5.18 Coffs Harbour (C) - Pt A 1-08-05-04 515 515 0.00 Coffs Harbour (C) - Pt A 1-08-05-05 557 554 -0.54 Coffs Harbour (C) - Pt A 1-08-05-06 295 305 3.39 Coffs Harbour (C) - Pt A 1-08-05-07 228 250 9.65 Coffs Harbour (C) - Pt A 1-08-05-08 333 480 44.14 Coffs Harbour (C) - Pt A 1-08-05-09 461 464 0.65 Coffs Harbour (C) - Pt A 1-08-05-10 314 441 40.45 Coffs Harbour (C) - Pt A 1-08-05-12 289 298 3.11 Coffs Harbour (C) - Pt A 1-08-06-01 468 488 4.27 Coffs Harbour (C) - Pt A 1-08-06-02 460 465 1.09 Coffs Harbour (C) - Pt A 1-08-06-03 287 301 4.88 Coffs Harbour (C) - Pt A 1-08-06-04 535 549 2.62 Coffs Harbour (C) - Pt A 1-08-06-05 584 693 18.66 Coffs Harbour (C) - Pt A 1-08-06-06 407 420 3.19 Coffs Harbour (C) - Pt A 1-08-06-07 603 771 27.86 Coffs Harbour (C) - Pt A 1-08-06-08 422 443 4.98 Coffs Harbour (C) - Pt A 1-08-06-09 453 450 -0.66 Coffs Harbour (C) - Pt A 1-08-06-10 599 627 4.67 Coffs Harbour (C) - Pt A 1-08-06-11 772 809 4.79 Coffs Harbour (C) - Pt A 1-08-06-12 528 706 33.71 Coffs Harbour (C) - Pt A 1-08-06-13 574 735 28.05 Coffs Harbour (C) - Pt A 1-08-06-14 387 418 8.01 Coffs Harbour (C) - Pt A 1-08-16-01 806 848 5.21 Coffs Harbour (C) - Pt A 1-08-16-03 314 319 1.59 Coffs Harbour (C) - Pt A 1-08-16-04 585 758 29.57 Coffs Harbour (C) - Pt A 1-08-16-05 522 631 20.88 Coffs Harbour (C) - Pt A 1-08-16-06 398 479 20.35 Coffs Harbour (C) - Pt A 1-08-16-07 341 342 0.29

New South Wales Redistribution Statistics 2006
Enrolment Projections Cowper
Actual Enrolment Estimate Growth SLA Name CCD Number 2/12/2005 31/5/2010 (%)
63
Coffs Harbour (C) - Pt A 1-08-16-10 717 891 24.27 Coffs Harbour (C) - Pt A 1-08-16-11 527 623 18.22 Coffs Harbour (C) - Pt A 1-08-17-01 372 369 -0.81 Coffs Harbour (C) - Pt A 1-08-17-02 353 386 9.35 Coffs Harbour (C) - Pt A 1-08-17-03 601 644 7.15 Coffs Harbour (C) - Pt A 1-08-17-04 218 228 4.59 Coffs Harbour (C) - Pt A 1-08-17-05 374 433 15.78 Coffs Harbour (C) - Pt A 1-08-17-06 207 213 2.90 Coffs Harbour (C) - Pt A 1-08-17-07 332 338 1.81 Coffs Harbour (C) - Pt A 1-08-17-08 457 465 1.75 Coffs Harbour (C) - Pt A 1-08-17-09 307 332 8.14 Coffs Harbour (C) - Pt A 1-08-17-10 398 400 0.50 Coffs Harbour (C) - Pt A 1-08-17-11 277 440 58.84 Coffs Harbour (C) - Pt A 1-08-17-12 298 315 5.70 Coffs Harbour (C) - Pt A 1-08-17-13 840 1098 30.71 Coffs Harbour (C) - Pt A 1-08-17-14 593 727 22.60 Coffs Harbour (C) - Pt A 77 32664 36139 10.64 Coffs Harbour (C) - Pt B 1-06-08-07 206 212 2.91 Coffs Harbour (C) - Pt B 1-06-08-08 42 46 9.52 Coffs Harbour (C) - Pt B 1-06-08-10 244 261 6.97 Coffs Harbour (C) - Pt B 1-06-08-13 507 731 44.18 Coffs Harbour (C) - Pt B 1-08-01-01 452 459 1.55 Coffs Harbour (C) - Pt B 1-08-01-02 235 260 10.64 Coffs Harbour (C) - Pt B 1-08-01-03 774 811 4.78 Coffs Harbour (C) - Pt B 1-08-01-04 483 524 8.49 Coffs Harbour (C) - Pt B 1-08-01-05 282 290 2.84 Coffs Harbour (C) - Pt B 1-08-01-06 315 342 8.57 Coffs Harbour (C) - Pt B 1-08-01-07 666 744 11.71 Coffs Harbour (C) - Pt B 1-08-01-08 473 499 5.50 Coffs Harbour (C) - Pt B 1-08-01-09 541 607 12.20 Coffs Harbour (C) - Pt B 1-08-01-10 649 734 13.10 Coffs Harbour (C) - Pt B 1-08-01-11 439 464 5.69 Coffs Harbour (C) - Pt B 1-08-01-12 267 278 4.12 Coffs Harbour (C) - Pt B 1-08-01-13 305 331 8.52 Coffs Harbour (C) - Pt B 1-08-01-14 286 299 4.55 Coffs Harbour (C) - Pt B 1-08-02-01 234 247 5.56 Coffs Harbour (C) - Pt B 1-08-02-02 74 79 6.76 Coffs Harbour (C) - Pt B 1-08-02-03 237 242 2.11 Coffs Harbour (C) - Pt B 1-08-02-04 393 411 4.58 Coffs Harbour (C) - Pt B 1-08-02-09 435 470 8.05

New South Wales Redistribution Statistics 2006
Enrolment Projections Cowper
Actual Enrolment Estimate Growth SLA Name CCD Number 2/12/2005 31/5/2010 (%)
64
Coffs Harbour (C) - Pt B 1-08-02-10 424 467 10.14 Coffs Harbour (C) - Pt B 1-08-02-11 718 820 14.21 Coffs Harbour (C) - Pt B 1-08-02-13 384 445 15.89 Coffs Harbour (C) - Pt B 1-08-02-14 425 446 4.94 Coffs Harbour (C) - Pt B 1-08-16-02 640 667 4.22 Coffs Harbour (C) - Pt B 1-08-16-08 184 191 3.80 Coffs Harbour (C) - Pt B 1-08-16-09 407 426 4.67 Coffs Harbour (C) - Pt B 30 11721 12803 9.23 Kempsey (A) 1-08-12-01 246 248 0.81 Kempsey (A) 1-08-12-02 153 157 2.61 Kempsey (A) 1-08-12-06 279 279 0.00 Kempsey (A) 1-08-12-11 163 166 1.84 Kempsey (A) 1-08-12-13 276 290 5.07 Kempsey (A) 1-08-13-01 376 389 3.46 Kempsey (A) 1-08-13-03 317 329 3.79 Kempsey (A) 1-08-13-04 532 531 -0.19 Kempsey (A) 1-08-13-05 270 273 1.11 Kempsey (A) 1-08-13-06 439 443 0.91 Kempsey (A) 1-08-13-09 230 241 4.78 Kempsey (A) 1-08-18-01 216 223 3.24 Kempsey (A) 1-08-18-02 373 391 4.83 Kempsey (A) 1-08-18-03 181 194 7.18 Kempsey (A) 1-08-18-04 300 326 8.67 Kempsey (A) 1-08-18-05 303 306 0.99 Kempsey (A) 1-08-18-06 615 744 20.98 Kempsey (A) 1-08-18-07 65 93 43.08 Kempsey (A) 1-08-18-08 155 154 -0.65 Kempsey (A) 1-08-18-09 183 200 9.29 Kempsey (A) 1-08-18-10 161 169 4.97 Kempsey (A) 1-08-18-11 235 251 6.81 Kempsey (A) 1-08-18-12 497 628 26.36 Kempsey (A) 1-08-18-13 487 668 37.17 Kempsey (A) 1-08-18-14 184 211 14.67 Kempsey (A) 25 7236 7904 9.23 NSW Water areas 1-08-05-11 0 0 0.00 NSW Water areas 1 0 0 0.00

New South Wales Redistribution Statistics 2006
Enrolment Projections Cowper
Actual Enrolment Estimate Growth SLA Name CCD Number 2/12/2005 31/5/2010 (%)
65
Nambucca (A) 1-08-09-01 216 225 4.17 Nambucca (A) 1-08-09-02 448 449 0.22 Nambucca (A) 1-08-09-03 330 338 2.42 Nambucca (A) 1-08-09-04 428 446 4.21 Nambucca (A) 1-08-09-05 573 616 7.50 Nambucca (A) 1-08-09-06 729 821 12.62 Nambucca (A) 1-08-09-07 217 223 2.76 Nambucca (A) 1-08-09-08 312 318 1.92 Nambucca (A) 1-08-09-09 241 247 2.49 Nambucca (A) 1-08-09-10 272 323 18.75 Nambucca (A) 1-08-09-11 229 234 2.18 Nambucca (A) 1-08-09-12 445 467 4.94 Nambucca (A) 1-08-10-01 335 379 13.13 Nambucca (A) 1-08-10-02 362 376 3.87 Nambucca (A) 1-08-10-03 52 51 -1.92 Nambucca (A) 1-08-10-04 246 273 10.98 Nambucca (A) 1-08-10-05 240 250 4.17 Nambucca (A) 1-08-10-06 475 527 10.95 Nambucca (A) 1-08-10-07 406 421 3.69 Nambucca (A) 1-08-10-08 526 526 0.00 Nambucca (A) 1-08-10-09 474 493 4.01 Nambucca (A) 1-08-10-10 427 441 3.28 Nambucca (A) 1-08-10-11 403 439 8.93 Nambucca (A) 1-08-11-01 317 335 5.68 Nambucca (A) 1-08-11-02 341 344 0.88 Nambucca (A) 1-08-11-03 271 277 2.21 Nambucca (A) 1-08-11-04 310 319 2.90 Nambucca (A) 1-08-11-05 397 402 1.26 Nambucca (A) 1-08-11-06 261 277 6.13 Nambucca (A) 1-08-11-07 505 545 7.92 Nambucca (A) 1-08-11-08 428 432 0.93 Nambucca (A) 1-08-11-09 244 264 8.20 Nambucca (A) 1-08-11-10 396 417 5.30 Nambucca (A) 1-08-11-11 360 372 3.33 Nambucca (A) 1-08-11-12 538 624 15.99 Nambucca (A) 35 12754 13491 5.78 Cowper 224 85065 92563 8.81

New South Wales Redistribution Statistics 2006
Enrolment Projections Cunningham
Actual Enrolment Estimate Growth SLA Name CCD Number 2/12/2005 31/5/2010 (%)
66
NSW Water areas 1-19-12-12 1 1 0.00 NSW Water areas 1 1 1 0.00 Wollondilly (A) 1-20-13-06 12 14 16.67 Wollondilly (A) 1 12 14 16.67 Wollongong (C) 1-19-01-01 393 394 0.25 Wollongong (C) 1-19-01-02 350 356 1.71 Wollongong (C) 1-19-01-03 36 34 -5.56 Wollongong (C) 1-19-01-04 386 403 4.40 Wollongong (C) 1-19-01-05 410 427 4.15 Wollongong (C) 1-19-01-06 446 453 1.57 Wollongong (C) 1-19-01-07 331 337 1.81 Wollongong (C) 1-19-01-08 632 650 2.85 Wollongong (C) 1-19-01-09 456 451 -1.10 Wollongong (C) 1-19-01-10 241 242 0.41 Wollongong (C) 1-19-01-11 357 366 2.52 Wollongong (C) 1-19-01-12 542 559 3.14 Wollongong (C) 1-19-01-13 323 351 8.67 Wollongong (C) 1-19-02-01 147 149 1.36 Wollongong (C) 1-19-02-02 123 136 10.57 Wollongong (C) 1-19-02-03 261 259 -0.77 Wollongong (C) 1-19-02-04 340 349 2.65 Wollongong (C) 1-19-02-05 380 405 6.58 Wollongong (C) 1-19-02-06 314 341 8.60 Wollongong (C) 1-19-02-07 565 568 0.53 Wollongong (C) 1-19-02-08 685 723 5.55 Wollongong (C) 1-19-02-09 358 387 8.10 Wollongong (C) 1-19-02-10 484 482 -0.41 Wollongong (C) 1-19-02-11 289 293 1.38 Wollongong (C) 1-19-03-01 591 601 1.69 Wollongong (C) 1-19-03-02 330 321 -2.73 Wollongong (C) 1-19-03-03 469 498 6.18 Wollongong (C) 1-19-03-04 549 550 0.18 Wollongong (C) 1-19-03-05 402 407 1.24 Wollongong (C) 1-19-03-06 478 470 -1.67 Wollongong (C) 1-19-03-07 274 320 16.79 Wollongong (C) 1-19-03-08 335 325 -2.99 Wollongong (C) 1-19-03-09 658 672 2.13 Wollongong (C) 1-19-03-10 307 309 0.65

New South Wales Redistribution Statistics 2006
Enrolment Projections Cunningham
Actual Enrolment Estimate Growth SLA Name CCD Number 2/12/2005 31/5/2010 (%)
67
Wollongong (C) 1-19-03-11 373 428 14.75 Wollongong (C) 1-19-03-12 333 336 0.90 Wollongong (C) 1-19-04-01 386 397 2.85 Wollongong (C) 1-19-04-02 630 638 1.27 Wollongong (C) 1-19-04-03 381 390 2.36 Wollongong (C) 1-19-04-04 179 179 0.00 Wollongong (C) 1-19-04-05 234 236 0.85 Wollongong (C) 1-19-04-06 307 322 4.89 Wollongong (C) 1-19-04-07 504 501 -0.60 Wollongong (C) 1-19-04-08 440 441 0.23 Wollongong (C) 1-19-04-09 761 776 1.97 Wollongong (C) 1-19-04-10 331 335 1.21 Wollongong (C) 1-19-04-11 277 299 7.94 Wollongong (C) 1-19-04-12 292 300 2.74 Wollongong (C) 1-19-05-01 235 245 4.26 Wollongong (C) 1-19-05-02 417 469 12.47 Wollongong (C) 1-19-05-03 463 475 2.59 Wollongong (C) 1-19-05-04 661 696 5.30 Wollongong (C) 1-19-05-05 235 240 2.13 Wollongong (C) 1-19-05-06 466 461 -1.07 Wollongong (C) 1-19-05-07 1106 1592 43.94 Wollongong (C) 1-19-05-08 402 401 -0.25 Wollongong (C) 1-19-05-09 263 262 -0.38 Wollongong (C) 1-19-05-10 336 366 8.93 Wollongong (C) 1-19-05-11 451 454 0.67 Wollongong (C) 1-19-05-12 312 324 3.85 Wollongong (C) 1-19-05-13 189 190 0.53 Wollongong (C) 1-19-05-14 337 342 1.48 Wollongong (C) 1-19-06-01 360 346 -3.89 Wollongong (C) 1-19-06-02 546 545 -0.18 Wollongong (C) 1-19-06-03 300 303 1.00 Wollongong (C) 1-19-06-04 329 341 3.65 Wollongong (C) 1-19-06-05 347 355 2.31 Wollongong (C) 1-19-06-06 503 514 2.19 Wollongong (C) 1-19-06-07 363 374 3.03 Wollongong (C) 1-19-06-08 409 411 0.49 Wollongong (C) 1-19-06-09 349 359 2.87 Wollongong (C) 1-19-06-10 314 313 -0.32 Wollongong (C) 1-19-06-11 526 542 3.04 Wollongong (C) 1-19-06-12 391 395 1.02 Wollongong (C) 1-19-07-01 439 455 3.64 Wollongong (C) 1-19-07-02 639 644 0.78

New South Wales Redistribution Statistics 2006
Enrolment Projections Cunningham
Actual Enrolment Estimate Growth SLA Name CCD Number 2/12/2005 31/5/2010 (%)
68
Wollongong (C) 1-19-07-03 435 451 3.68 Wollongong (C) 1-19-07-04 565 578 2.30 Wollongong (C) 1-19-07-05 381 372 -2.36 Wollongong (C) 1-19-07-06 416 419 0.72 Wollongong (C) 1-19-07-07 276 274 -0.72 Wollongong (C) 1-19-07-08 607 680 12.03 Wollongong (C) 1-19-07-09 322 345 7.14 Wollongong (C) 1-19-07-10 396 395 -0.25 Wollongong (C) 1-19-07-11 330 326 -1.21 Wollongong (C) 1-19-07-12 509 507 -0.39 Wollongong (C) 1-19-07-13 447 465 4.03 Wollongong (C) 1-19-07-14 172 175 1.74 Wollongong (C) 1-19-08-01 381 378 -0.79 Wollongong (C) 1-19-08-02 541 535 -1.11 Wollongong (C) 1-19-08-03 105 100 -4.76 Wollongong (C) 1-19-08-04 510 541 6.08 Wollongong (C) 1-19-08-05 395 387 -2.03 Wollongong (C) 1-19-08-06 380 382 0.53 Wollongong (C) 1-19-08-07 483 505 4.55 Wollongong (C) 1-19-08-08 254 246 -3.15 Wollongong (C) 1-19-08-09 328 322 -1.83 Wollongong (C) 1-19-08-10 124 120 -3.23 Wollongong (C) 1-19-08-11 668 666 -0.30 Wollongong (C) 1-19-08-12 808 798 -1.24 Wollongong (C) 1-19-09-01 376 384 2.13 Wollongong (C) 1-19-09-02 426 430 0.94 Wollongong (C) 1-19-09-03 748 772 3.21 Wollongong (C) 1-19-09-04 580 587 1.21 Wollongong (C) 1-19-09-05 369 369 0.00 Wollongong (C) 1-19-09-06 231 230 -0.43 Wollongong (C) 1-19-09-07 310 331 6.77 Wollongong (C) 1-19-09-08 531 681 28.25 Wollongong (C) 1-19-09-09 370 386 4.32 Wollongong (C) 1-19-09-10 281 274 -2.49 Wollongong (C) 1-19-09-11 455 498 9.45 Wollongong (C) 1-19-09-12 228 227 -0.44 Wollongong (C) 1-19-10-01 499 491 -1.60 Wollongong (C) 1-19-10-02 585 570 -2.56 Wollongong (C) 1-19-10-03 473 564 19.24 Wollongong (C) 1-19-10-04 468 460 -1.71 Wollongong (C) 1-19-10-05 315 315 0.00 Wollongong (C) 1-19-10-06 222 221 -0.45

New South Wales Redistribution Statistics 2006
Enrolment Projections Cunningham
Actual Enrolment Estimate Growth SLA Name CCD Number 2/12/2005 31/5/2010 (%)
69
Wollongong (C) 1-19-10-07 502 491 -2.19 Wollongong (C) 1-19-10-08 306 293 -4.25 Wollongong (C) 1-19-10-09 123 131 6.50 Wollongong (C) 1-19-10-10 745 748 0.40 Wollongong (C) 1-19-10-11 254 252 -0.79 Wollongong (C) 1-19-10-12 686 699 1.90 Wollongong (C) 1-19-11-01 368 356 -3.26 Wollongong (C) 1-19-11-02 367 384 4.63 Wollongong (C) 1-19-11-03 444 460 3.60 Wollongong (C) 1-19-11-04 424 432 1.89 Wollongong (C) 1-19-11-05 229 245 6.99 Wollongong (C) 1-19-11-06 384 382 -0.52 Wollongong (C) 1-19-11-07 298 337 13.09 Wollongong (C) 1-19-11-08 276 315 14.13 Wollongong (C) 1-19-11-09 108 118 9.26 Wollongong (C) 1-19-11-10 320 336 5.00 Wollongong (C) 1-19-11-11 349 368 5.44 Wollongong (C) 1-19-11-12 145 145 0.00 Wollongong (C) 1-19-11-13 245 279 13.88 Wollongong (C) 1-19-11-14 227 236 3.96 Wollongong (C) 1-19-12-01 250 262 4.80 Wollongong (C) 1-19-12-02 367 516 40.60 Wollongong (C) 1-19-12-03 323 352 8.98 Wollongong (C) 1-19-12-04 414 615 48.55 Wollongong (C) 1-19-12-05 165 162 -1.82 Wollongong (C) 1-19-12-06 242 260 7.44 Wollongong (C) 1-19-12-07 331 316 -4.53 Wollongong (C) 1-19-12-08 334 459 37.43 Wollongong (C) 1-19-12-09 422 453 7.35 Wollongong (C) 1-19-12-10 224 229 2.23 Wollongong (C) 1-19-12-11 262 289 10.31 Wollongong (C) 1-19-12-13 196 217 10.71 Wollongong (C) 1-19-12-14 181 183 1.10 Wollongong (C) 1-19-13-01 512 525 2.54 Wollongong (C) 1-19-13-02 345 353 2.32 Wollongong (C) 1-19-13-03 405 405 0.00 Wollongong (C) 1-19-13-04 174 175 0.57 Wollongong (C) 1-19-13-05 117 124 5.98 Wollongong (C) 1-19-13-06 380 498 31.05 Wollongong (C) 1-19-13-07 329 317 -3.65 Wollongong (C) 1-19-13-08 257 256 -0.39 Wollongong (C) 1-19-13-09 211 425 101.42

New South Wales Redistribution Statistics 2006
Enrolment Projections Cunningham
Actual Enrolment Estimate Growth SLA Name CCD Number 2/12/2005 31/5/2010 (%)
70
Wollongong (C) 1-19-13-10 184 205 11.41 Wollongong (C) 1-19-13-11 237 271 14.35 Wollongong (C) 1-19-13-12 282 322 14.18 Wollongong (C) 1-19-13-13 325 353 8.62 Wollongong (C) 1-19-14-01 257 280 8.95 Wollongong (C) 1-19-14-02 366 393 7.38 Wollongong (C) 1-19-14-03 685 691 0.88 Wollongong (C) 1-19-14-04 213 205 -3.76 Wollongong (C) 1-19-14-05 791 776 -1.90 Wollongong (C) 1-19-14-06 536 545 1.68 Wollongong (C) 1-19-14-07 332 330 -0.60 Wollongong (C) 1-19-14-08 479 481 0.42 Wollongong (C) 1-19-14-09 465 471 1.29 Wollongong (C) 1-19-14-10 226 222 -1.77 Wollongong (C) 1-19-15-01 932 1008 8.15 Wollongong (C) 1-19-15-02 401 396 -1.25 Wollongong (C) 1-19-15-03 44 42 -4.55 Wollongong (C) 1-19-15-04 554 557 0.54 Wollongong (C) 1-19-15-05 674 680 0.89 Wollongong (C) 1-19-15-08 0 0 0.00 Wollongong (C) 1-19-15-09 667 679 1.80 Wollongong (C) 1-19-15-10 472 468 -0.85 Wollongong (C) 1-19-16-04 280 520 85.71 Wollongong (C) 1-19-16-05 329 327 -0.61 Wollongong (C) 1-19-16-06 232 228 -1.72 Wollongong (C) 1-19-16-07 457 446 -2.41 Wollongong (C) 1-19-16-08 303 305 0.66 Wollongong (C) 1-19-16-09 274 269 -1.82 Wollongong (C) 1-19-16-10 625 624 -0.16 Wollongong (C) 1-19-16-11 517 513 -0.77 Wollongong (C) 1-19-16-12 439 450 2.51 Wollongong (C) 1-19-16-13 393 395 0.51 Wollongong (C) 1-19-16-14 691 725 4.92 Wollongong (C) 1-19-17-07 0 0 0.00 Wollongong (C) 1-19-17-08 264 257 -2.65 Wollongong (C) 1-19-17-10 129 130 0.78 Wollongong (C) 1-19-17-11 690 764 10.72 Wollongong (C) 1-19-24-03 5 5 0.00 Wollongong (C) 1-19-31-01 515 517 0.39 Wollongong (C) 1-19-31-02 695 699 0.58 Wollongong (C) 1-19-31-03 664 649 -2.26 Wollongong (C) 1-19-31-04 358 356 -0.56
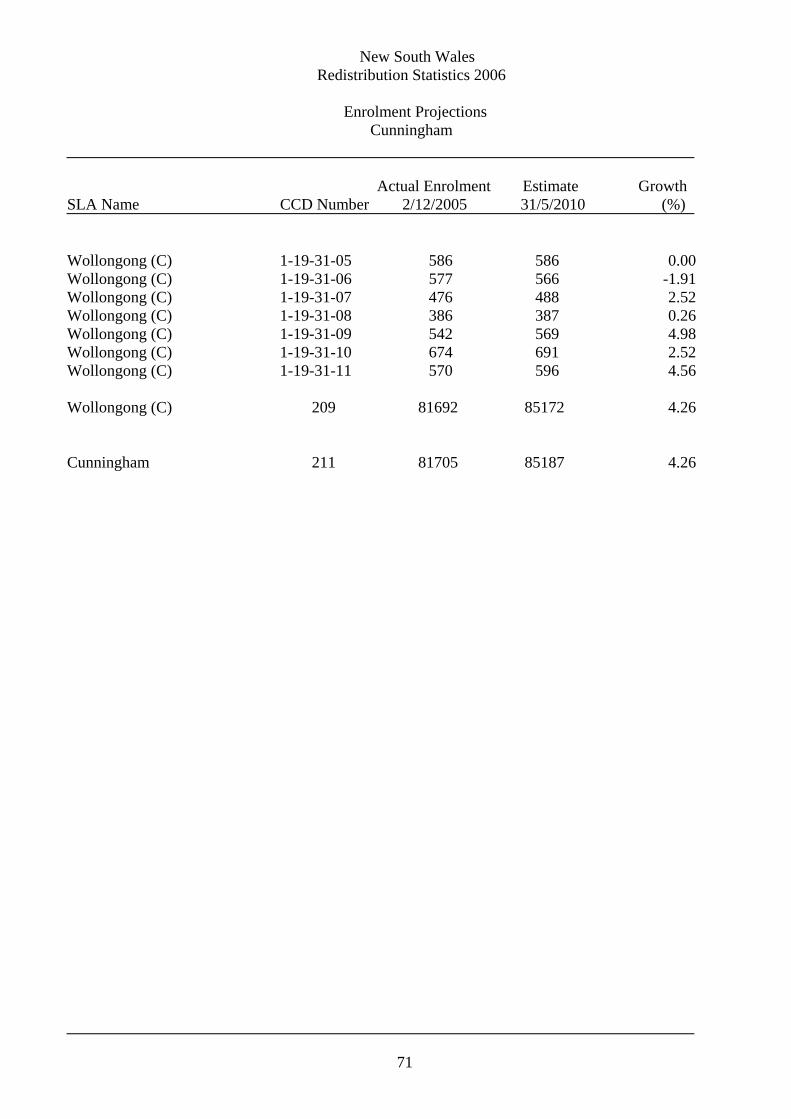
New South Wales Redistribution Statistics 2006
Enrolment Projections Cunningham
Actual Enrolment Estimate Growth SLA Name CCD Number 2/12/2005 31/5/2010 (%)
71
Wollongong (C) 1-19-31-05 586 586 0.00 Wollongong (C) 1-19-31-06 577 566 -1.91 Wollongong (C) 1-19-31-07 476 488 2.52 Wollongong (C) 1-19-31-08 386 387 0.26 Wollongong (C) 1-19-31-09 542 569 4.98 Wollongong (C) 1-19-31-10 674 691 2.52 Wollongong (C) 1-19-31-11 570 596 4.56 Wollongong (C) 209 81692 85172 4.26 Cunningham 211 81705 85187 4.26

New South Wales Redistribution Statistics 2006
Enrolment Projections Dobell
Actual Enrolment Estimate Growth SLA Name CCD Number 2/12/2005 31/5/2010 (%)
72
Gosford (C) 1-22-01-01 116 118 1.72 Gosford (C) 1-22-01-02 26 27 3.85 Gosford (C) 1-22-02-01 488 491 0.61 Gosford (C) 1-22-02-02 631 699 10.78 Gosford (C) 1-22-02-03 293 295 0.68 Gosford (C) 1-22-02-04 479 589 22.96 Gosford (C) 1-22-02-07 344 332 -3.49 Gosford (C) 1-22-02-10 574 594 3.48 Gosford (C) 1-22-02-11 289 276 -4.50 Gosford (C) 1-22-02-12 1069 1071 0.19 Gosford (C) 1-22-03-01 423 450 6.38 Gosford (C) 1-22-03-02 580 601 3.62 Gosford (C) 1-22-03-03 341 333 -2.35 Gosford (C) 1-22-03-04 282 282 0.00 Gosford (C) 1-22-03-05 326 325 -0.31 Gosford (C) 1-22-03-06 823 853 3.65 Gosford (C) 1-22-03-07 550 553 0.55 Gosford (C) 1-22-03-08 522 520 -0.38 Gosford (C) 1-22-03-09 236 230 -2.54 Gosford (C) 1-22-03-10 355 359 1.13 Gosford (C) 1-22-03-11 222 221 -0.45 Gosford (C) 1-22-03-12 579 577 -0.35 Gosford (C) 1-22-04-01 358 349 -2.51 Gosford (C) 1-22-04-02 349 348 -0.29 Gosford (C) 1-22-04-03 431 437 1.39 Gosford (C) 1-22-04-04 395 424 7.34 Gosford (C) 1-22-04-05 271 260 -4.06 Gosford (C) 1-22-04-06 307 313 1.95 Gosford (C) 1-22-04-09 270 276 2.22 Gosford (C) 1-22-04-10 310 315 1.61 Gosford (C) 1-22-04-12 320 320 0.00 Gosford (C) 1-22-07-01 126 134 6.35 Gosford (C) 1-22-08-01 363 372 2.48 Gosford (C) 1-22-08-02 320 321 0.31 Gosford (C) 1-22-08-03 419 412 -1.67 Gosford (C) 1-22-08-04 418 415 -0.72 Gosford (C) 1-22-08-05 366 397 8.47 Gosford (C) 1-22-08-06 400 423 5.75 Gosford (C) 1-22-08-07 335 338 0.90 Gosford (C) 1-22-08-08 324 323 -0.31 Gosford (C) 1-22-08-09 424 424 0.00 Gosford (C) 1-22-08-11 365 372 1.92

New South Wales Redistribution Statistics 2006
Enrolment Projections Dobell
Actual Enrolment Estimate Growth SLA Name CCD Number 2/12/2005 31/5/2010 (%)
73
Gosford (C) 1-22-08-12 326 347 6.44 Gosford (C) 1-22-08-13 328 332 1.22 Gosford (C) 1-22-08-14 253 254 0.40 Gosford (C) 1-22-09-01 322 340 5.59 Gosford (C) 1-22-09-02 450 471 4.67 Gosford (C) 1-22-09-03 332 327 -1.51 Gosford (C) 1-22-09-04 179 273 52.51 Gosford (C) 1-22-09-08 343 341 -0.58 Gosford (C) 1-22-09-09 317 332 4.73 Gosford (C) 1-22-09-10 421 419 -0.48 Gosford (C) 1-22-09-11 403 417 3.47 Gosford (C) 1-22-09-14 264 290 9.85 Gosford (C) 1-22-24-01 372 366 -1.61 Gosford (C) 1-22-24-03 767 812 5.87 Gosford (C) 1-22-24-04 303 301 -0.66 Gosford (C) 1-22-24-05 85 92 8.24 Gosford (C) 1-22-24-06 652 653 0.15 Gosford (C) 1-22-24-08 149 151 1.34 Gosford (C) 1-22-24-09 346 354 2.31 Gosford (C) 1-22-24-10 471 479 1.70 Gosford (C) 1-22-24-11 456 459 0.66 Gosford (C) 63 23958 24579 2.59 NSW Water areas 1-21-07-16 0 0 0.00 NSW Water areas 1-21-13-12 0 0 0.00 NSW Water areas 1-22-08-10 0 0 0.00 NSW Water areas 3 0 0 0.00 Wyong (A) 1-21-02-12 10 11 10.00 Wyong (A) 1-21-03-01 497 697 40.24 Wyong (A) 1-21-03-02 1699 3359 97.70 Wyong (A) 1-21-03-03 956 1368 43.10 Wyong (A) 1-21-03-04 519 540 4.05 Wyong (A) 1-21-03-05 1067 1215 13.87 Wyong (A) 1-21-03-06 219 217 -0.91 Wyong (A) 1-21-03-07 407 427 4.91 Wyong (A) 1-21-03-08 513 771 50.29 Wyong (A) 1-21-03-09 291 319 9.62 Wyong (A) 1-21-03-10 599 625 4.34 Wyong (A) 1-21-03-11 1080 1429 32.31

New South Wales Redistribution Statistics 2006
Enrolment Projections Dobell
Actual Enrolment Estimate Growth SLA Name CCD Number 2/12/2005 31/5/2010 (%)
74
Wyong (A) 1-21-03-12 713 906 27.07 Wyong (A) 1-21-03-13 352 357 1.42 Wyong (A) 1-21-03-14 277 287 3.61 Wyong (A) 1-21-03-15 377 417 10.61 Wyong (A) 1-21-07-15 0 513 513.00 Wyong (A) 1-21-08-03 305 314 2.95 Wyong (A) 1-21-08-04 457 461 0.88 Wyong (A) 1-21-08-05 189 212 12.17 Wyong (A) 1-21-09-01 522 548 4.98 Wyong (A) 1-21-09-02 319 327 2.51 Wyong (A) 1-21-09-03 190 196 3.16 Wyong (A) 1-21-09-04 400 418 4.50 Wyong (A) 1-21-09-05 417 433 3.84 Wyong (A) 1-21-09-06 762 799 4.86 Wyong (A) 1-21-09-07 410 423 3.17 Wyong (A) 1-21-09-08 336 348 3.57 Wyong (A) 1-21-09-09 299 293 -2.01 Wyong (A) 1-21-09-10 318 331 4.09 Wyong (A) 1-21-09-11 291 290 -0.34 Wyong (A) 1-21-09-12 486 508 4.53 Wyong (A) 1-21-09-13 526 571 8.56 Wyong (A) 1-21-09-14 255 265 3.92 Wyong (A) 1-21-09-15 161 166 3.11 Wyong (A) 1-21-10-01 253 271 7.11 Wyong (A) 1-21-10-02 211 222 5.21 Wyong (A) 1-21-10-03 514 559 8.75 Wyong (A) 1-21-10-04 415 424 2.17 Wyong (A) 1-21-10-05 530 956 80.38 Wyong (A) 1-21-10-06 535 573 7.10 Wyong (A) 1-21-10-07 671 1131 68.55 Wyong (A) 1-21-10-08 543 586 7.92 Wyong (A) 1-21-10-09 472 485 2.75 Wyong (A) 1-21-10-10 213 219 2.82 Wyong (A) 1-21-10-11 517 533 3.09 Wyong (A) 1-21-10-12 626 747 19.33 Wyong (A) 1-21-11-01 578 604 4.50 Wyong (A) 1-21-11-02 186 197 5.91 Wyong (A) 1-21-11-03 272 301 10.66 Wyong (A) 1-21-11-04 243 261 7.41 Wyong (A) 1-21-11-05 331 339 2.42 Wyong (A) 1-21-11-06 604 620 2.65 Wyong (A) 1-21-11-07 639 783 22.54

New South Wales Redistribution Statistics 2006
Enrolment Projections Dobell
Actual Enrolment Estimate Growth SLA Name CCD Number 2/12/2005 31/5/2010 (%)
75
Wyong (A) 1-21-11-08 429 436 1.63 Wyong (A) 1-21-11-09 552 575 4.17 Wyong (A) 1-21-11-10 439 449 2.28 Wyong (A) 1-21-11-11 272 276 1.47 Wyong (A) 1-21-11-12 290 309 6.55 Wyong (A) 1-21-11-13 42 42 0.00 Wyong (A) 1-21-12-01 515 527 2.33 Wyong (A) 1-21-12-02 487 489 0.41 Wyong (A) 1-21-12-03 327 334 2.14 Wyong (A) 1-21-12-04 402 417 3.73 Wyong (A) 1-21-12-05 366 373 1.91 Wyong (A) 1-21-12-06 520 544 4.62 Wyong (A) 1-21-12-07 462 471 1.95 Wyong (A) 1-21-12-08 479 488 1.88 Wyong (A) 1-21-12-09 538 554 2.97 Wyong (A) 1-21-12-10 294 289 -1.70 Wyong (A) 1-21-12-11 369 385 4.34 Wyong (A) 1-21-13-01 263 271 3.04 Wyong (A) 1-21-13-02 236 355 50.42 Wyong (A) 1-21-13-03 88 95 7.95 Wyong (A) 1-21-13-04 136 138 1.47 Wyong (A) 1-21-13-05 105 108 2.86 Wyong (A) 1-21-13-06 160 172 7.50 Wyong (A) 1-21-13-07 247 277 12.15 Wyong (A) 1-21-13-08 253 285 12.65 Wyong (A) 1-21-13-09 282 312 10.64 Wyong (A) 1-21-13-10 185 333 80.00 Wyong (A) 1-21-13-11 239 256 7.11 Wyong (A) 1-21-13-13 161 191 18.63 Wyong (A) 1-21-14-01 123 183 48.78 Wyong (A) 1-21-14-02 187 204 9.09 Wyong (A) 1-21-14-03 199 217 9.05 Wyong (A) 1-21-14-04 315 363 15.24 Wyong (A) 1-21-14-05 203 215 5.91 Wyong (A) 1-21-14-06 312 366 17.31 Wyong (A) 1-21-14-07 375 418 11.47 Wyong (A) 1-21-14-08 288 327 13.54 Wyong (A) 1-21-14-09 367 389 5.99 Wyong (A) 1-21-14-10 260 269 3.46 Wyong (A) 1-21-14-11 405 429 5.93 Wyong (A) 1-21-15-01 267 283 5.99 Wyong (A) 1-21-15-02 184 191 3.80

New South Wales Redistribution Statistics 2006
Enrolment Projections Dobell
Actual Enrolment Estimate Growth SLA Name CCD Number 2/12/2005 31/5/2010 (%)
76
Wyong (A) 1-21-15-03 343 380 10.79 Wyong (A) 1-21-15-04 273 292 6.96 Wyong (A) 1-21-15-05 575 591 2.78 Wyong (A) 1-21-15-06 514 534 3.89 Wyong (A) 1-21-15-07 142 195 37.32 Wyong (A) 1-21-15-08 249 264 6.02 Wyong (A) 1-21-15-09 353 364 3.12 Wyong (A) 1-21-15-10 188 211 12.23 Wyong (A) 1-21-15-11 160 165 3.12 Wyong (A) 1-21-16-01 459 472 2.83 Wyong (A) 1-21-16-02 419 428 2.15 Wyong (A) 1-21-16-03 487 494 1.44 Wyong (A) 1-21-16-04 304 310 1.97 Wyong (A) 1-21-16-05 230 226 -1.74 Wyong (A) 1-21-16-06 295 298 1.02 Wyong (A) 1-21-16-07 401 453 12.97 Wyong (A) 1-21-16-08 225 228 1.33 Wyong (A) 1-21-16-09 546 549 0.55 Wyong (A) 1-21-16-10 425 437 2.82 Wyong (A) 1-21-16-11 417 427 2.40 Wyong (A) 1-21-16-12 128 130 1.56 Wyong (A) 1-21-16-13 411 427 3.89 Wyong (A) 1-21-17-01 484 499 3.10 Wyong (A) 1-21-17-02 431 441 2.32 Wyong (A) 1-21-17-03 483 512 6.00 Wyong (A) 1-21-17-04 418 436 4.31 Wyong (A) 1-21-17-05 459 468 1.96 Wyong (A) 1-21-17-06 465 473 1.72 Wyong (A) 1-21-17-07 445 458 2.92 Wyong (A) 1-21-17-08 455 458 0.66 Wyong (A) 1-21-17-09 660 679 2.88 Wyong (A) 1-21-17-10 416 415 -0.24 Wyong (A) 1-21-18-01 290 284 -2.07 Wyong (A) 1-21-18-02 359 412 14.76 Wyong (A) 1-21-18-03 200 209 4.50 Wyong (A) 1-21-18-04 497 516 3.82 Wyong (A) 1-21-18-05 536 556 3.73 Wyong (A) 1-21-18-06 419 421 0.48 Wyong (A) 1-21-18-07 444 439 -1.13 Wyong (A) 1-21-18-08 363 367 1.10 Wyong (A) 1-21-18-09 322 353 9.63 Wyong (A) 1-21-18-10 431 440 2.09

New South Wales Redistribution Statistics 2006
Enrolment Projections Dobell
Actual Enrolment Estimate Growth SLA Name CCD Number 2/12/2005 31/5/2010 (%)
77
Wyong (A) 1-21-19-01 279 290 3.94 Wyong (A) 1-21-19-02 173 177 2.31 Wyong (A) 1-21-19-03 597 631 5.70 Wyong (A) 1-21-19-04 621 628 1.13 Wyong (A) 1-21-19-05 308 338 9.74 Wyong (A) 1-21-19-06 239 257 7.53 Wyong (A) 1-21-19-07 441 477 8.16 Wyong (A) 1-21-19-08 158 168 6.33 Wyong (A) 1-21-20-01 1117 1204 7.79 Wyong (A) 1-21-20-02 453 467 3.09 Wyong (A) 1-21-20-03 222 234 5.41 Wyong (A) 1-21-20-04 592 608 2.70 Wyong (A) 1-21-20-05 398 406 2.01 Wyong (A) 1-21-20-06 793 911 14.88 Wyong (A) 1-21-20-07 498 521 4.62 Wyong (A) 1-21-20-08 301 304 1.00 Wyong (A) 1-21-20-09 451 454 0.67 Wyong (A) 1-21-20-10 479 492 2.71 Wyong (A) 156 61436 69055 12.40 Dobell 222 85394 93634 9.65

New South Wales Redistribution Statistics 2006
Enrolment Projections Eden-Monaro
Actual Enrolment Estimate Growth SLA Name CCD Number 2/12/2005 31/5/2010 (%)
78
Bega Valley (A) 1-17-13-01 279 302 8.24 Bega Valley (A) 1-17-13-02 308 322 4.55 Bega Valley (A) 1-17-13-03 218 225 3.21 Bega Valley (A) 1-17-13-04 362 377 4.14 Bega Valley (A) 1-17-13-05 190 195 2.63 Bega Valley (A) 1-17-13-06 132 145 9.85 Bega Valley (A) 1-17-13-07 173 180 4.05 Bega Valley (A) 1-17-13-08 227 236 3.96 Bega Valley (A) 1-17-13-09 538 564 4.83 Bega Valley (A) 1-17-13-10 382 418 9.42 Bega Valley (A) 1-17-13-11 201 208 3.48 Bega Valley (A) 1-17-14-01 215 229 6.51 Bega Valley (A) 1-17-14-02 296 319 7.77 Bega Valley (A) 1-17-14-03 241 257 6.64 Bega Valley (A) 1-17-14-04 142 144 1.41 Bega Valley (A) 1-17-14-05 324 374 15.43 Bega Valley (A) 1-17-14-06 492 534 8.54 Bega Valley (A) 1-17-14-07 401 408 1.75 Bega Valley (A) 1-17-14-08 277 307 10.83 Bega Valley (A) 1-17-14-09 300 307 2.33 Bega Valley (A) 1-17-14-10 222 236 6.31 Bega Valley (A) 1-17-14-11 97 101 4.12 Bega Valley (A) 1-17-14-12 90 89 -1.11 Bega Valley (A) 1-17-14-13 134 133 -0.75 Bega Valley (A) 1-17-14-14 150 169 12.67 Bega Valley (A) 1-17-14-15 161 176 9.32 Bega Valley (A) 1-17-15-01 374 477 27.54 Bega Valley (A) 1-17-15-02 445 446 0.22 Bega Valley (A) 1-17-15-03 347 356 2.59 Bega Valley (A) 1-17-15-04 263 280 6.46 Bega Valley (A) 1-17-15-05 298 309 3.69 Bega Valley (A) 1-17-15-06 319 327 2.51 Bega Valley (A) 1-17-15-07 340 355 4.41 Bega Valley (A) 1-17-15-08 278 305 9.71 Bega Valley (A) 1-17-15-09 262 301 14.89 Bega Valley (A) 1-17-15-10 466 489 4.94 Bega Valley (A) 1-17-15-11 283 287 1.41 Bega Valley (A) 1-17-15-12 166 180 8.43 Bega Valley (A) 1-17-15-13 415 426 2.65 Bega Valley (A) 1-17-15-14 206 218 5.83 Bega Valley (A) 1-17-15-15 322 340 5.59 Bega Valley (A) 1-17-15-16 153 158 3.27

New South Wales Redistribution Statistics 2006
Enrolment Projections Eden-Monaro
Actual Enrolment Estimate Growth SLA Name CCD Number 2/12/2005 31/5/2010 (%)
79
Bega Valley (A) 1-17-16-01 453 501 10.60 Bega Valley (A) 1-17-16-02 478 538 12.55 Bega Valley (A) 1-17-16-03 503 580 15.31 Bega Valley (A) 1-17-16-04 183 189 3.28 Bega Valley (A) 1-17-16-05 218 226 3.67 Bega Valley (A) 1-17-16-06 221 241 9.05 Bega Valley (A) 1-17-16-07 407 440 8.11 Bega Valley (A) 1-17-16-08 545 640 17.43 Bega Valley (A) 1-17-16-09 431 496 15.08 Bega Valley (A) 1-17-16-10 233 256 9.87 Bega Valley (A) 1-17-16-11 376 412 9.57 Bega Valley (A) 1-17-16-12 383 441 15.14 Bega Valley (A) 1-17-16-13 631 916 45.17 Bega Valley (A) 1-17-17-01 63 69 9.52 Bega Valley (A) 1-17-17-02 147 155 5.44 Bega Valley (A) 1-17-17-03 105 107 1.90 Bega Valley (A) 1-17-17-04 113 118 4.42 Bega Valley (A) 1-17-17-05 69 78 13.04 Bega Valley (A) 1-17-17-06 311 338 8.68 Bega Valley (A) 1-17-17-07 290 299 3.10 Bega Valley (A) 1-17-17-08 336 347 3.27 Bega Valley (A) 1-17-17-09 119 135 13.45 Bega Valley (A) 1-17-17-10 295 304 3.05 Bega Valley (A) 1-17-17-11 353 392 11.05 Bega Valley (A) 1-17-17-12 193 195 1.04 Bega Valley (A) 1-17-17-13 43 44 2.33 Bega Valley (A) 1-17-19-01 187 207 10.70 Bega Valley (A) 1-17-19-02 522 540 3.45 Bega Valley (A) 1-17-19-03 71 81 14.08 Bega Valley (A) 1-17-19-04 356 391 9.83 Bega Valley (A) 1-17-19-05 138 138 0.00 Bega Valley (A) 1-17-19-06 106 115 8.49 Bega Valley (A) 1-17-19-07 409 433 5.87 Bega Valley (A) 1-17-19-08 384 401 4.43 Bega Valley (A) 1-17-19-09 294 318 8.16 Bega Valley (A) 1-17-19-10 314 312 -0.64 Bega Valley (A) 1-17-19-11 260 310 19.23 Bega Valley (A) 79 22029 23912 8.55 Bombala (A) 1-17-12-01 79 82 3.80 Bombala (A) 1-17-12-02 455 446 -1.98

New South Wales Redistribution Statistics 2006
Enrolment Projections Eden-Monaro
Actual Enrolment Estimate Growth SLA Name CCD Number 2/12/2005 31/5/2010 (%)
80
Bombala (A) 1-17-12-03 391 380 -2.81 Bombala (A) 1-17-12-04 216 212 -1.85 Bombala (A) 1-17-12-05 174 174 0.00 Bombala (A) 1-17-12-06 94 90 -4.26 Bombala (A) 1-17-12-07 73 73 0.00 Bombala (A) 1-17-12-08 109 104 -4.59 Bombala (A) 1-17-12-09 66 58 -12.12 Bombala (A) 1-17-12-10 217 210 -3.23 Bombala (A) 10 1874 1829 -2.40 Cooma-Monaro (A) - Pt A 1-17-06-02 187 185 -1.07 Cooma-Monaro (A) - Pt A 1 187 185 -1.07 Cooma-Monaro (A) - Pt B 1-17-08-01 98 100 2.04 Cooma-Monaro (A) - Pt B 1-17-08-02 560 575 2.68 Cooma-Monaro (A) - Pt B 1-17-08-03 352 372 5.68 Cooma-Monaro (A) - Pt B 1-17-08-04 127 130 2.36 Cooma-Monaro (A) - Pt B 1-17-08-05 284 290 2.11 Cooma-Monaro (A) - Pt B 1-17-08-06 101 98 -2.97 Cooma-Monaro (A) - Pt B 1-17-08-07 125 126 0.80 Cooma-Monaro (A) - Pt B 1-17-08-08 128 132 3.12 Cooma-Monaro (A) - Pt B 1-17-08-09 176 176 0.00 Cooma-Monaro (A) - Pt B 1-17-08-10 97 100 3.09 Cooma-Monaro (A) - Pt B 1-17-09-01 444 459 3.38 Cooma-Monaro (A) - Pt B 1-17-09-02 472 485 2.75 Cooma-Monaro (A) - Pt B 1-17-09-03 343 353 2.92 Cooma-Monaro (A) - Pt B 1-17-09-04 227 233 2.64 Cooma-Monaro (A) - Pt B 1-17-09-05 344 352 2.33 Cooma-Monaro (A) - Pt B 1-17-09-06 332 338 1.81 Cooma-Monaro (A) - Pt B 1-17-09-07 495 506 2.22 Cooma-Monaro (A) - Pt B 1-17-09-08 387 397 2.58 Cooma-Monaro (A) - Pt B 1-17-09-09 496 510 2.82 Cooma-Monaro (A) - Pt B 1-17-09-10 460 472 2.61 Cooma-Monaro (A) - Pt B 1-17-09-11 183 187 2.19 Cooma-Monaro (A) - Pt B 1-17-09-12 351 355 1.14 Cooma-Monaro (A) - Pt B 22 6582 6746 2.49 Eurobodalla (A) 1-18-17-01 495 587 18.59 Eurobodalla (A) 1-18-17-02 203 196 -3.45

New South Wales Redistribution Statistics 2006
Enrolment Projections Eden-Monaro
Actual Enrolment Estimate Growth SLA Name CCD Number 2/12/2005 31/5/2010 (%)
81
Eurobodalla (A) 1-18-17-03 536 733 36.75 Eurobodalla (A) 1-18-17-04 368 383 4.08 Eurobodalla (A) 1-18-17-05 298 310 4.03 Eurobodalla (A) 1-18-17-06 213 222 4.23 Eurobodalla (A) 1-18-17-07 259 294 13.51 Eurobodalla (A) 1-18-17-08 225 233 3.56 Eurobodalla (A) 1-18-17-09 218 226 3.67 Eurobodalla (A) 1-18-17-10 284 299 5.28 Eurobodalla (A) 1-18-17-11 363 386 6.34 Eurobodalla (A) 1-18-17-12 148 155 4.73 Eurobodalla (A) 1-18-18-01 296 317 7.09 Eurobodalla (A) 1-18-18-02 524 603 15.08 Eurobodalla (A) 1-18-18-03 71 74 4.23 Eurobodalla (A) 1-18-18-04 167 176 5.39 Eurobodalla (A) 1-18-18-05 173 170 -1.73 Eurobodalla (A) 1-18-18-06 470 501 6.60 Eurobodalla (A) 1-18-18-07 318 329 3.46 Eurobodalla (A) 1-18-18-08 246 258 4.88 Eurobodalla (A) 1-18-18-09 204 243 19.12 Eurobodalla (A) 1-18-18-10 312 332 6.41 Eurobodalla (A) 1-18-18-11 167 215 28.74 Eurobodalla (A) 1-18-19-01 347 375 8.07 Eurobodalla (A) 1-18-19-02 342 366 7.02 Eurobodalla (A) 1-18-19-03 158 171 8.23 Eurobodalla (A) 1-18-19-04 287 288 0.35 Eurobodalla (A) 1-18-19-05 287 301 4.88 Eurobodalla (A) 1-18-19-06 293 319 8.87 Eurobodalla (A) 1-18-19-07 247 262 6.07 Eurobodalla (A) 1-18-19-08 312 322 3.21 Eurobodalla (A) 1-18-20-01 301 325 7.97 Eurobodalla (A) 1-18-20-02 381 432 13.39 Eurobodalla (A) 1-18-20-03 244 243 -0.41 Eurobodalla (A) 1-18-20-04 520 552 6.15 Eurobodalla (A) 1-18-20-05 521 554 6.33 Eurobodalla (A) 1-18-20-06 153 147 -3.92 Eurobodalla (A) 1-18-20-07 367 426 16.08 Eurobodalla (A) 1-18-20-08 94 104 10.64 Eurobodalla (A) 1-18-20-09 473 550 16.28 Eurobodalla (A) 1-18-20-10 123 127 3.25 Eurobodalla (A) 1-18-20-11 141 150 6.38 Eurobodalla (A) 1-18-20-12 249 248 -0.40 Eurobodalla (A) 1-18-20-13 342 358 4.68

New South Wales Redistribution Statistics 2006
Enrolment Projections Eden-Monaro
Actual Enrolment Estimate Growth SLA Name CCD Number 2/12/2005 31/5/2010 (%)
82
Eurobodalla (A) 1-18-21-01 148 154 4.05 Eurobodalla (A) 1-18-21-02 364 386 6.04 Eurobodalla (A) 1-18-21-03 342 360 5.26 Eurobodalla (A) 1-18-21-04 280 307 9.64 Eurobodalla (A) 1-18-21-05 385 433 12.47 Eurobodalla (A) 1-18-21-06 111 118 6.31 Eurobodalla (A) 1-18-21-07 326 355 8.90 Eurobodalla (A) 1-18-21-08 116 126 8.62 Eurobodalla (A) 1-18-21-09 195 198 1.54 Eurobodalla (A) 1-18-21-10 354 393 11.02 Eurobodalla (A) 1-18-21-11 185 189 2.16 Eurobodalla (A) 1-18-21-12 416 428 2.88 Eurobodalla (A) 1-18-21-13 306 327 6.86 Eurobodalla (A) 1-18-21-14 361 410 13.57 Eurobodalla (A) 1-18-21-15 271 269 -0.74 Eurobodalla (A) 1-18-22-01 228 315 38.16 Eurobodalla (A) 1-18-22-02 470 501 6.60 Eurobodalla (A) 1-18-22-03 257 258 0.39 Eurobodalla (A) 1-18-22-04 296 291 -1.69 Eurobodalla (A) 1-18-22-05 509 589 15.72 Eurobodalla (A) 1-18-22-06 288 317 10.07 Eurobodalla (A) 1-18-22-07 204 206 0.98 Eurobodalla (A) 1-18-22-08 535 601 12.34 Eurobodalla (A) 1-18-22-09 206 213 3.40 Eurobodalla (A) 1-18-22-10 309 324 4.85 Eurobodalla (A) 1-18-22-11 93 94 1.08 Eurobodalla (A) 1-18-22-12 118 113 -4.24 Eurobodalla (A) 1-18-22-13 124 172 38.71 Eurobodalla (A) 1-18-22-14 300 349 16.33 Eurobodalla (A) 1-18-26-01 190 184 -3.16 Eurobodalla (A) 1-18-26-02 516 553 7.17 Eurobodalla (A) 1-18-26-03 146 187 28.08 Eurobodalla (A) 1-18-26-04 407 464 14.00 Eurobodalla (A) 1-18-26-05 359 417 16.16 Eurobodalla (A) 1-18-26-06 532 656 23.31 Eurobodalla (A) 1-18-26-07 426 562 31.92 Eurobodalla (A) 1-18-26-08 283 326 15.19 Eurobodalla (A) 1-18-26-09 473 506 6.98 Eurobodalla (A) 1-18-26-10 505 638 26.34 Eurobodalla (A) 1-18-26-11 440 465 5.68 Eurobodalla (A) 84 25114 27616 9.96

New South Wales Redistribution Statistics 2006
Enrolment Projections Eden-Monaro
Actual Enrolment Estimate Growth SLA Name CCD Number 2/12/2005 31/5/2010 (%)
83
Palerang (A) - Pt A 1-17-05-04 156 155 -0.64 Palerang (A) - Pt A 1-17-05-05 289 289 0.00 Palerang (A) - Pt A 1-17-05-06 490 484 -1.22 Palerang (A) - Pt A 1-17-05-07 216 241 11.57 Palerang (A) - Pt A 1-17-05-08 781 855 9.48 Palerang (A) - Pt A 1-17-05-09 291 291 0.00 Palerang (A) - Pt A 1-17-05-10 326 358 9.82 Palerang (A) - Pt A 1-17-05-11 172 178 3.49 Palerang (A) - Pt A 1-17-05-12 282 286 1.42 Palerang (A) - Pt A 1-17-05-14 404 438 8.42 Palerang (A) - Pt A 1-17-05-15 376 441 17.29 Palerang (A) - Pt A 1-17-06-01 321 339 5.61 Palerang (A) - Pt A 1-17-06-02 8 7 -12.50 Palerang (A) - Pt A 1-17-06-02 7 9 28.57 Palerang (A) - Pt A 1-17-06-02 8 7 -12.50 Palerang (A) - Pt A 1-17-06-03 79 93 17.72 Palerang (A) - Pt A 1-17-06-04 287 290 1.05 Palerang (A) - Pt A 1-17-06-05 211 211 0.00 Palerang (A) - Pt A 1-17-06-06 403 623 54.59 Palerang (A) - Pt A 1-17-06-08 208 203 -2.40 Palerang (A) - Pt A 1-17-06-09 6 8 33.33 Palerang (A) - Pt A 1-17-06-09 7 7 0.00 Palerang (A) - Pt A 1-17-06-10 154 149 -3.25 Palerang (A) - Pt A 1-17-06-11 369 381 3.25 Palerang (A) - Pt A 1-17-06-13 264 272 3.03 Palerang (A) - Pt A 25 6115 6615 8.18 Palerang (A) - Pt B 1-17-07-01 297 309 4.04 Palerang (A) - Pt B 1-17-07-02 429 459 6.99 Palerang (A) - Pt B 1-17-07-03 248 270 8.87 Palerang (A) - Pt B 1-17-07-04 375 401 6.93 Palerang (A) - Pt B 1-17-07-05 204 217 6.37 Palerang (A) - Pt B 1-17-07-06 91 98 7.69 Palerang (A) - Pt B 1-17-07-07 262 288 9.92 Palerang (A) - Pt B 1-17-07-08 152 165 8.55 Palerang (A) - Pt B 1-17-07-09 133 147 10.53 Palerang (A) - Pt B 9 2191 2354 7.44 Queanbeyan (C) 1-17-01-01 348 416 19.54

New South Wales Redistribution Statistics 2006
Enrolment Projections Eden-Monaro
Actual Enrolment Estimate Growth SLA Name CCD Number 2/12/2005 31/5/2010 (%)
84
Queanbeyan (C) 1-17-01-02 352 513 45.74 Queanbeyan (C) 1-17-01-03 107 122 14.02 Queanbeyan (C) 1-17-01-04 74 135 82.43 Queanbeyan (C) 1-17-01-05 236 249 5.51 Queanbeyan (C) 1-17-01-06 836 1184 41.63 Queanbeyan (C) 1-17-01-07 219 237 8.22 Queanbeyan (C) 1-17-01-08 304 322 5.92 Queanbeyan (C) 1-17-01-09 383 404 5.48 Queanbeyan (C) 1-17-01-10 240 257 7.08 Queanbeyan (C) 1-17-01-11 224 268 19.64 Queanbeyan (C) 1-17-01-12 170 181 6.47 Queanbeyan (C) 1-17-02-01 354 382 7.91 Queanbeyan (C) 1-17-02-02 466 494 6.01 Queanbeyan (C) 1-17-02-03 280 306 9.29 Queanbeyan (C) 1-17-02-04 242 254 4.96 Queanbeyan (C) 1-17-02-05 285 331 16.14 Queanbeyan (C) 1-17-02-06 361 394 9.14 Queanbeyan (C) 1-17-02-07 136 140 2.94 Queanbeyan (C) 1-17-02-08 479 511 6.68 Queanbeyan (C) 1-17-02-09 528 557 5.49 Queanbeyan (C) 1-17-02-10 341 359 5.28 Queanbeyan (C) 1-17-02-11 160 164 2.50 Queanbeyan (C) 1-17-02-12 320 331 3.44 Queanbeyan (C) 1-17-03-01 338 360 6.51 Queanbeyan (C) 1-17-03-02 435 467 7.36 Queanbeyan (C) 1-17-03-03 411 474 15.33 Queanbeyan (C) 1-17-03-04 269 287 6.69 Queanbeyan (C) 1-17-03-05 289 312 7.96 Queanbeyan (C) 1-17-03-06 307 322 4.89 Queanbeyan (C) 1-17-03-07 344 369 7.27 Queanbeyan (C) 1-17-03-08 346 367 6.07 Queanbeyan (C) 1-17-03-09 583 626 7.38 Queanbeyan (C) 1-17-03-10 540 573 6.11 Queanbeyan (C) 1-17-04-01 425 439 3.29 Queanbeyan (C) 1-17-04-02 197 207 5.08 Queanbeyan (C) 1-17-04-03 225 244 8.44 Queanbeyan (C) 1-17-04-04 368 391 6.25 Queanbeyan (C) 1-17-04-05 466 490 5.15 Queanbeyan (C) 1-17-04-06 564 613 8.69 Queanbeyan (C) 1-17-04-07 448 474 5.80 Queanbeyan (C) 1-17-04-08 400 422 5.50 Queanbeyan (C) 1-17-04-09 456 485 6.36

New South Wales Redistribution Statistics 2006
Enrolment Projections Eden-Monaro
Actual Enrolment Estimate Growth SLA Name CCD Number 2/12/2005 31/5/2010 (%)
85
Queanbeyan (C) 1-17-04-10 294 305 3.74 Queanbeyan (C) 1-17-04-11 707 755 6.79 Queanbeyan (C) 1-17-04-12 489 621 26.99 Queanbeyan (C) 1-17-06-06 107 165 54.21 Queanbeyan (C) 1-17-06-07 249 290 16.47 Queanbeyan (C) 1-17-06-09 441 495 12.24 Queanbeyan (C) 1-17-06-12 307 324 5.54 Queanbeyan (C) 1-17-20-01 1045 1136 8.71 Queanbeyan (C) 1-17-20-02 1058 1312 24.01 Queanbeyan (C) 1-17-20-03 313 332 6.07 Queanbeyan (C) 1-17-20-04 473 511 8.03 Queanbeyan (C) 1-17-20-05 547 628 14.81 Queanbeyan (C) 1-17-20-06 706 752 6.52 Queanbeyan (C) 1-17-20-07 1724 2377 37.88 Queanbeyan (C) 57 23316 26436 13.38 Snowy River (A) 1-17-10-01 400 430 7.50 Snowy River (A) 1-17-10-02 113 122 7.96 Snowy River (A) 1-17-10-03 177 188 6.21 Snowy River (A) 1-17-10-04 98 102 4.08 Snowy River (A) 1-17-10-05 165 169 2.42 Snowy River (A) 1-17-10-06 185 191 3.24 Snowy River (A) 1-17-10-07 216 245 13.43 Snowy River (A) 1-17-10-08 14 14 0.00 Snowy River (A) 1-17-10-09 52 55 5.77 Snowy River (A) 1-17-10-10 204 211 3.43 Snowy River (A) 1-17-10-11 84 104 23.81 Snowy River (A) 1-17-10-12 312 331 6.09 Snowy River (A) 1-17-11-01 127 128 0.79 Snowy River (A) 1-17-11-02 221 248 12.22 Snowy River (A) 1-17-11-03 347 386 11.24 Snowy River (A) 1-17-11-04 59 59 0.00 Snowy River (A) 1-17-11-05 165 168 1.82 Snowy River (A) 1-17-11-06 112 118 5.36 Snowy River (A) 1-17-11-07 411 430 4.62 Snowy River (A) 1-17-11-08 215 209 -2.79 Snowy River (A) 1-17-11-09 82 90 9.76 Snowy River (A) 1-17-11-10 26 25 -3.85 Snowy River (A) 1-17-18-01 112 113 0.89 Snowy River (A) 1-17-18-02 72 72 0.00 Snowy River (A) 1-17-18-03 23 23 0.00

New South Wales Redistribution Statistics 2006
Enrolment Projections Eden-Monaro
Actual Enrolment Estimate Growth SLA Name CCD Number 2/12/2005 31/5/2010 (%)
86
Snowy River (A) 1-17-18-04 23 23 0.00 Snowy River (A) 1-17-18-05 27 27 0.00 Snowy River (A) 1-17-18-06 78 74 -5.13 Snowy River (A) 28 4120 4355 5.70 Tumut Shire (A) 1-17-05-01 14 15 7.14 Tumut Shire (A) 1 14 15 7.14 Yass Valley (A) - Pt A 1-17-05-02 315 300 -4.76 Yass Valley (A) - Pt A 1-17-05-03 49 46 -6.12 Yass Valley (A) - Pt A 1-17-05-13 184 179 -2.72 Yass Valley (A) - Pt A 1-17-05-16 127 130 2.36 Yass Valley (A) - Pt A 4 675 655 -2.96 Yass Valley (A) - Pt B 1-17-05-01 90 100 11.11 Yass Valley (A) - Pt B 1-17-05-01 90 98 8.89 Yass Valley (A) - Pt B 2 180 198 10.00 Eden-Monaro 322 92397 100916 9.22

New South Wales Redistribution Statistics 2006
Enrolment Projections Farrer
Actual Enrolment Estimate Growth SLA Name CCD Number 2/12/2005 31/5/2010 (%)
87
Albury (C) 1-16-04-08 486 545 12.14 Albury (C) 1-16-04-11 338 400 18.34 Albury (C) 1-16-04-13 377 447 18.57 Albury (C) 1-16-04-14 185 196 5.95 Albury (C) 1-16-05-01 301 310 2.99 Albury (C) 1-16-05-02 517 559 8.12 Albury (C) 1-16-05-03 278 276 -0.72 Albury (C) 1-16-05-04 252 258 2.38 Albury (C) 1-16-05-05 434 452 4.15 Albury (C) 1-16-05-06 381 381 0.00 Albury (C) 1-16-05-07 459 472 2.83 Albury (C) 1-16-05-08 340 341 0.29 Albury (C) 1-16-05-09 106 104 -1.89 Albury (C) 1-16-05-10 175 173 -1.14 Albury (C) 1-16-06-01 49 54 10.20 Albury (C) 1-16-06-02 401 440 9.73 Albury (C) 1-16-06-03 676 707 4.59 Albury (C) 1-16-06-04 414 442 6.76 Albury (C) 1-16-06-05 288 294 2.08 Albury (C) 1-16-06-06 305 305 0.00 Albury (C) 1-16-06-07 424 439 3.54 Albury (C) 1-16-06-08 275 286 4.00 Albury (C) 1-16-06-09 358 410 14.53 Albury (C) 1-16-06-10 338 335 -0.89 Albury (C) 1-16-06-11 375 382 1.87 Albury (C) 1-16-07-01 265 268 1.13 Albury (C) 1-16-07-02 452 454 0.44 Albury (C) 1-16-07-03 393 391 -0.51 Albury (C) 1-16-07-04 363 368 1.38 Albury (C) 1-16-07-05 482 526 9.13 Albury (C) 1-16-07-06 579 631 8.98 Albury (C) 1-16-07-07 632 779 23.26 Albury (C) 1-16-07-08 279 275 -1.43 Albury (C) 1-16-07-09 267 270 1.12 Albury (C) 1-16-07-10 787 897 13.98 Albury (C) 1-16-07-11 550 722 31.27 Albury (C) 1-16-08-01 251 265 5.58 Albury (C) 1-16-08-02 427 439 2.81 Albury (C) 1-16-08-03 531 535 0.75 Albury (C) 1-16-08-04 367 378 3.00 Albury (C) 1-16-08-05 398 407 2.26 Albury (C) 1-16-08-06 844 1002 18.72

New South Wales Redistribution Statistics 2006
Enrolment Projections Farrer
Actual Enrolment Estimate Growth SLA Name CCD Number 2/12/2005 31/5/2010 (%)
88
Albury (C) 1-16-08-07 645 636 -1.40 Albury (C) 1-16-08-08 320 316 -1.25 Albury (C) 1-16-08-09 293 423 44.37 Albury (C) 1-16-08-10 254 248 -2.36 Albury (C) 1-16-08-11 279 307 10.04 Albury (C) 1-16-08-12 897 1074 19.73 Albury (C) 1-16-09-01 262 257 -1.91 Albury (C) 1-16-09-02 352 357 1.42 Albury (C) 1-16-09-03 231 233 0.87 Albury (C) 1-16-09-04 250 247 -1.20 Albury (C) 1-16-09-05 350 341 -2.57 Albury (C) 1-16-09-06 62 61 -1.61 Albury (C) 1-16-09-07 260 269 3.46 Albury (C) 1-16-09-08 220 237 7.73 Albury (C) 1-16-09-09 298 307 3.02 Albury (C) 1-16-09-10 317 327 3.15 Albury (C) 1-16-09-11 235 252 7.23 Albury (C) 1-16-09-12 236 242 2.54 Albury (C) 1-16-10-01 235 243 3.40 Albury (C) 1-16-10-02 268 266 -0.75 Albury (C) 1-16-10-03 382 389 1.83 Albury (C) 1-16-10-04 258 251 -2.71 Albury (C) 1-16-10-05 313 324 3.51 Albury (C) 1-16-10-06 360 356 -1.11 Albury (C) 1-16-10-07 335 466 39.10 Albury (C) 1-16-10-08 346 373 7.80 Albury (C) 1-16-10-09 244 265 8.61 Albury (C) 1-16-10-10 341 339 -0.59 Albury (C) 1-16-10-11 282 272 -3.55 Albury (C) 1-16-10-12 955 1244 30.26 Albury (C) 1-16-11-01 211 223 5.69 Albury (C) 1-16-11-02 346 351 1.45 Albury (C) 1-16-11-03 263 306 16.35 Albury (C) 1-16-11-04 186 219 17.74 Albury (C) 1-16-11-05 437 438 0.23 Albury (C) 1-16-11-06 385 378 -1.82 Albury (C) 1-16-11-07 449 465 3.56 Albury (C) 1-16-11-08 279 281 0.72 Albury (C) 1-16-11-09 320 337 5.31 Albury (C) 1-16-11-10 257 263 2.33 Albury (C) 1-16-11-11 200 195 -2.50 Albury (C) 1-16-11-12 216 216 0.00

New South Wales Redistribution Statistics 2006
Enrolment Projections Farrer
Actual Enrolment Estimate Growth SLA Name CCD Number 2/12/2005 31/5/2010 (%)
89
Albury (C) 1-16-11-13 421 441 4.75 Albury (C) 85 30449 32650 7.23 Balranald (A) 1-01-01-01 550 554 0.73 Balranald (A) 1-01-01-02 298 292 -2.01 Balranald (A) 1-01-01-03 71 72 1.41 Balranald (A) 1-01-01-04 59 59 0.00 Balranald (A) 1-01-01-05 46 43 -6.52 Balranald (A) 1-01-01-06 66 66 0.00 Balranald (A) 1-01-01-07 146 144 -1.37 Balranald (A) 1-01-01-08 266 273 2.63 Balranald (A) 1-01-01-09 70 71 1.43 Balranald (A) 1-01-01-10 65 63 -3.08 Balranald (A) 10 1637 1637 0.00 Berrigan (A) 1-01-10-01 128 121 -5.47 Berrigan (A) 1-01-10-02 253 261 3.16 Berrigan (A) 1-01-10-03 246 265 7.72 Berrigan (A) 1-01-10-04 311 316 1.61 Berrigan (A) 1-01-10-05 326 384 17.79 Berrigan (A) 1-01-10-06 120 119 -0.83 Berrigan (A) 1-01-10-07 155 154 -0.65 Berrigan (A) 1-01-10-08 287 292 1.74 Berrigan (A) 1-01-10-09 463 512 10.58 Berrigan (A) 1-01-10-10 364 401 10.16 Berrigan (A) 1-01-10-11 257 257 0.00 Berrigan (A) 1-01-11-01 117 113 -3.42 Berrigan (A) 1-01-11-02 408 433 6.13 Berrigan (A) 1-01-11-03 138 143 3.62 Berrigan (A) 1-01-11-04 315 306 -2.86 Berrigan (A) 1-01-11-05 316 324 2.53 Berrigan (A) 1-01-11-06 309 316 2.27 Berrigan (A) 1-01-11-07 301 309 2.66 Berrigan (A) 1-01-11-08 466 457 -1.93 Berrigan (A) 1-01-11-09 295 291 -1.36 Berrigan (A) 20 5575 5774 3.57 Conargo (A) 1-01-06-01 101 108 6.93 Conargo (A) 1-01-06-02 168 171 1.79
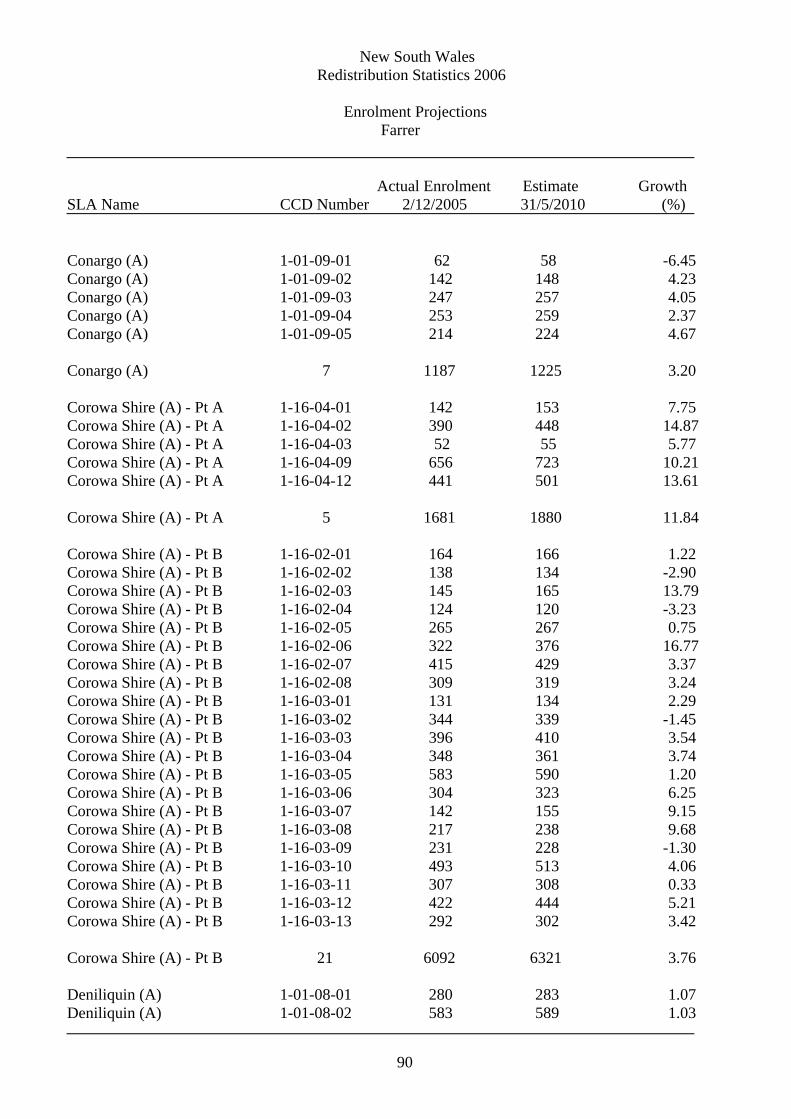
New South Wales Redistribution Statistics 2006
Enrolment Projections Farrer
Actual Enrolment Estimate Growth SLA Name CCD Number 2/12/2005 31/5/2010 (%)
90
Conargo (A) 1-01-09-01 62 58 -6.45 Conargo (A) 1-01-09-02 142 148 4.23 Conargo (A) 1-01-09-03 247 257 4.05 Conargo (A) 1-01-09-04 253 259 2.37 Conargo (A) 1-01-09-05 214 224 4.67 Conargo (A) 7 1187 1225 3.20 Corowa Shire (A) - Pt A 1-16-04-01 142 153 7.75 Corowa Shire (A) - Pt A 1-16-04-02 390 448 14.87 Corowa Shire (A) - Pt A 1-16-04-03 52 55 5.77 Corowa Shire (A) - Pt A 1-16-04-09 656 723 10.21 Corowa Shire (A) - Pt A 1-16-04-12 441 501 13.61 Corowa Shire (A) - Pt A 5 1681 1880 11.84 Corowa Shire (A) - Pt B 1-16-02-01 164 166 1.22 Corowa Shire (A) - Pt B 1-16-02-02 138 134 -2.90 Corowa Shire (A) - Pt B 1-16-02-03 145 165 13.79 Corowa Shire (A) - Pt B 1-16-02-04 124 120 -3.23 Corowa Shire (A) - Pt B 1-16-02-05 265 267 0.75 Corowa Shire (A) - Pt B 1-16-02-06 322 376 16.77 Corowa Shire (A) - Pt B 1-16-02-07 415 429 3.37 Corowa Shire (A) - Pt B 1-16-02-08 309 319 3.24 Corowa Shire (A) - Pt B 1-16-03-01 131 134 2.29 Corowa Shire (A) - Pt B 1-16-03-02 344 339 -1.45 Corowa Shire (A) - Pt B 1-16-03-03 396 410 3.54 Corowa Shire (A) - Pt B 1-16-03-04 348 361 3.74 Corowa Shire (A) - Pt B 1-16-03-05 583 590 1.20 Corowa Shire (A) - Pt B 1-16-03-06 304 323 6.25 Corowa Shire (A) - Pt B 1-16-03-07 142 155 9.15 Corowa Shire (A) - Pt B 1-16-03-08 217 238 9.68 Corowa Shire (A) - Pt B 1-16-03-09 231 228 -1.30 Corowa Shire (A) - Pt B 1-16-03-10 493 513 4.06 Corowa Shire (A) - Pt B 1-16-03-11 307 308 0.33 Corowa Shire (A) - Pt B 1-16-03-12 422 444 5.21 Corowa Shire (A) - Pt B 1-16-03-13 292 302 3.42 Corowa Shire (A) - Pt B 21 6092 6321 3.76 Deniliquin (A) 1-01-08-01 280 283 1.07 Deniliquin (A) 1-01-08-02 583 589 1.03

New South Wales Redistribution Statistics 2006
Enrolment Projections Farrer
Actual Enrolment Estimate Growth SLA Name CCD Number 2/12/2005 31/5/2010 (%)
91
Deniliquin (A) 1-01-08-03 390 398 2.05 Deniliquin (A) 1-01-08-04 237 239 0.84 Deniliquin (A) 1-01-08-05 431 438 1.62 Deniliquin (A) 1-01-08-06 380 383 0.79 Deniliquin (A) 1-01-08-07 373 387 3.75 Deniliquin (A) 1-01-23-01 429 431 0.47 Deniliquin (A) 1-01-23-02 421 425 0.95 Deniliquin (A) 1-01-23-03 580 579 -0.17 Deniliquin (A) 1-01-23-04 400 397 -0.75 Deniliquin (A) 1-01-23-05 428 424 -0.93 Deniliquin (A) 1-01-23-06 313 329 5.11 Deniliquin (A) 13 5245 5302 1.09 Greater Hume Shire (A) - Pt A 1-16-04-01 166 177 6.63 Greater Hume Shire (A) - Pt A 1-16-04-03 175 187 6.86 Greater Hume Shire (A) - Pt A 1-16-04-04 306 323 5.56 Greater Hume Shire (A) - Pt A 1-16-04-05 419 446 6.44 Greater Hume Shire (A) - Pt A 1-16-04-06 299 310 3.68 Greater Hume Shire (A) - Pt A 1-16-04-07 167 169 1.20 Greater Hume Shire (A) - Pt A 1-16-04-08 0 0 0.00 Greater Hume Shire (A) - Pt A 1-16-04-10 641 674 5.15 Greater Hume Shire (A) - Pt A 1-16-04-13 35 41 17.14 Greater Hume Shire (A) - Pt A 1-16-04-13 36 42 16.67 Greater Hume Shire (A) - Pt A 1-16-04-13 36 44 22.22 Greater Hume Shire (A) - Pt A 1-16-04-14 127 134 5.51 Greater Hume Shire (A) - Pt A 12 2407 2547 5.82 Greater Hume Shire (A) - Pt B 1-16-12-01 140 138 -1.43 Greater Hume Shire (A) - Pt B 1-16-12-02 225 218 -3.11 Greater Hume Shire (A) - Pt B 1-16-12-03 151 153 1.32 Greater Hume Shire (A) - Pt B 1-16-12-04 393 407 3.56 Greater Hume Shire (A) - Pt B 1-16-12-05 206 201 -2.43 Greater Hume Shire (A) - Pt B 1-16-12-06 307 318 3.58 Greater Hume Shire (A) - Pt B 1-16-12-07 149 151 1.34 Greater Hume Shire (A) - Pt B 1-16-12-08 121 120 -0.83 Greater Hume Shire (A) - Pt B 1-16-12-09 368 377 2.45 Greater Hume Shire (A) - Pt B 1-16-12-10 240 239 -0.42 Greater Hume Shire (A) - Pt B 1-16-12-11 430 447 3.95 Greater Hume Shire (A) - Pt B 1-16-23-01 77 76 -1.30 Greater Hume Shire (A) - Pt B 1-16-23-02 118 118 0.00

New South Wales Redistribution Statistics 2006
Enrolment Projections Farrer
Actual Enrolment Estimate Growth SLA Name CCD Number 2/12/2005 31/5/2010 (%)
92
Greater Hume Shire (A) - Pt B 1-16-23-03 152 156 2.63 Greater Hume Shire (A) - Pt B 1-16-23-04 330 343 3.94 Greater Hume Shire (A) - Pt B 1-16-23-05 310 306 -1.29 Greater Hume Shire (A) - Pt B 1-16-23-06 204 214 4.90 Greater Hume Shire (A) - Pt B 1-16-23-07 182 187 2.75 Greater Hume Shire (A) - Pt B 1-16-23-08 90 90 0.00 Greater Hume Shire (A) - Pt B 1-16-23-09 281 292 3.91 Greater Hume Shire (A) - Pt B 20 4474 4551 1.72 Jerilderie (A) 1-01-12-01 270 279 3.33 Jerilderie (A) 1-01-12-02 206 218 5.83 Jerilderie (A) 1-01-12-03 151 148 -1.99 Jerilderie (A) 1-01-12-04 291 309 6.19 Jerilderie (A) 1-01-12-05 270 283 4.81 Jerilderie (A) 5 1188 1237 4.12 Lockhart (A) 1-16-13-01 95 93 -2.11 Lockhart (A) 1-16-13-02 313 321 2.56 Lockhart (A) 1-16-13-03 127 128 0.79 Lockhart (A) 1-16-13-04 147 149 1.36 Lockhart (A) 1-16-13-05 128 140 9.38 Lockhart (A) 1-16-13-06 612 639 4.41 Lockhart (A) 1-16-13-07 153 153 0.00 Lockhart (A) 1-16-13-08 99 99 0.00 Lockhart (A) 1-16-13-09 187 183 -2.14 Lockhart (A) 1-16-13-10 129 130 0.78 Lockhart (A) 1-16-13-11 80 76 -5.00 Lockhart (A) 1-16-13-12 312 317 1.60 Lockhart (A) 12 2382 2428 1.93 Murray (A) 1-01-07-01 102 105 2.94 Murray (A) 1-01-07-02 76 75 -1.32 Murray (A) 1-01-07-03 100 108 8.00 Murray (A) 1-01-07-04 85 91 7.06 Murray (A) 1-01-07-05 102 103 0.98 Murray (A) 1-01-07-06 496 526 6.05 Murray (A) 1-01-07-07 221 232 4.98 Murray (A) 1-01-07-08 327 338 3.36 Murray (A) 1-01-07-09 754 950 25.99

New South Wales Redistribution Statistics 2006
Enrolment Projections Farrer
Actual Enrolment Estimate Growth SLA Name CCD Number 2/12/2005 31/5/2010 (%)
93
Murray (A) 1-01-07-10 120 116 -3.33 Murray (A) 1-01-07-11 110 111 0.91 Murray (A) 1-01-07-12 244 254 4.10 Murray (A) 1-01-07-13 319 333 4.39 Murray (A) 1-01-07-14 505 658 30.30 Murray (A) 1-01-07-15 123 123 0.00 Murray (A) 1-01-07-16 588 651 10.71 Murray (A) 16 4272 4774 11.75 Tumbarumba (A) 1-15-28-01 241 241 0.00 Tumbarumba (A) 1-15-28-02 189 192 1.59 Tumbarumba (A) 1-15-28-03 91 91 0.00 Tumbarumba (A) 1-15-29-01 256 256 0.00 Tumbarumba (A) 1-15-29-02 402 407 1.24 Tumbarumba (A) 1-15-29-03 406 411 1.23 Tumbarumba (A) 1-15-29-04 126 118 -6.35 Tumbarumba (A) 1-15-29-05 170 169 -0.59 Tumbarumba (A) 1-15-29-06 64 61 -4.69 Tumbarumba (A) 1-15-29-07 208 203 -2.40 Tumbarumba (A) 1-15-29-08 73 73 0.00 Tumbarumba (A) 1-15-29-09 115 116 0.87 Tumbarumba (A) 1-16-23-02 4 4 0.00 Tumbarumba (A) 1-16-23-08 6 6 0.00 Tumbarumba (A) 14 2351 2348 -0.13 Tumut Shire (A) 1-15-25-01 151 151 0.00 Tumut Shire (A) 1-15-25-02 581 593 2.07 Tumut Shire (A) 1-15-25-03 257 255 -0.78 Tumut Shire (A) 1-15-25-04 84 82 -2.38 Tumut Shire (A) 1-15-25-05 287 296 3.14 Tumut Shire (A) 1-15-25-06 102 104 1.96 Tumut Shire (A) 1-15-25-07 291 295 1.37 Tumut Shire (A) 1-15-25-08 238 240 0.84 Tumut Shire (A) 1-15-25-09 449 447 -0.45 Tumut Shire (A) 1-15-26-01 379 390 2.90 Tumut Shire (A) 1-15-26-02 222 231 4.05 Tumut Shire (A) 1-15-26-03 192 189 -1.56 Tumut Shire (A) 1-15-26-04 115 115 0.00 Tumut Shire (A) 1-15-26-05 84 81 -3.57 Tumut Shire (A) 1-15-26-06 54 54 0.00

New South Wales Redistribution Statistics 2006
Enrolment Projections Farrer
Actual Enrolment Estimate Growth SLA Name CCD Number 2/12/2005 31/5/2010 (%)
94
Tumut Shire (A) 1-15-27-01 414 426 2.90 Tumut Shire (A) 1-15-27-02 336 349 3.87 Tumut Shire (A) 1-15-27-03 334 334 0.00 Tumut Shire (A) 1-15-27-04 490 492 0.41 Tumut Shire (A) 1-15-27-05 311 316 1.61 Tumut Shire (A) 1-15-27-06 576 580 0.69 Tumut Shire (A) 1-15-27-07 592 593 0.17 Tumut Shire (A) 1-15-27-08 542 550 1.48 Tumut Shire (A) 1-15-27-09 289 300 3.81 Tumut Shire (A) 1-15-27-10 270 277 2.59 Tumut Shire (A) 25 7640 7740 1.31 Urana (A) 1-16-01-01 62 59 -4.84 Urana (A) 1-16-01-02 86 88 2.33 Urana (A) 1-16-01-03 69 71 2.90 Urana (A) 1-16-01-04 248 255 2.82 Urana (A) 1-16-01-05 68 62 -8.82 Urana (A) 1-16-01-06 170 170 0.00 Urana (A) 1-16-01-07 149 144 -3.36 Urana (A) 1-16-01-08 55 56 1.82 Urana (A) 8 907 905 -0.22 Wakool (A) 1-01-02-01 99 99 0.00 Wakool (A) 1-01-02-02 51 53 3.92 Wakool (A) 1-01-02-03 265 269 1.51 Wakool (A) 1-01-02-04 127 129 1.57 Wakool (A) 1-01-02-05 169 169 0.00 Wakool (A) 1-01-02-06 227 224 -1.32 Wakool (A) 1-01-02-07 263 265 0.76 Wakool (A) 1-01-02-08 153 150 -1.96 Wakool (A) 1-01-02-09 234 237 1.28 Wakool (A) 1-01-02-10 143 145 1.40 Wakool (A) 1-01-02-11 130 126 -3.08 Wakool (A) 1-01-02-12 214 217 1.40 Wakool (A) 1-01-02-13 337 351 4.15 Wakool (A) 1-01-02-14 482 511 6.02 Wakool (A) 1-01-02-15 124 124 0.00 Wakool (A) 15 3018 3069 1.69

New South Wales Redistribution Statistics 2006
Enrolment Projections Farrer
Actual Enrolment Estimate Growth SLA Name CCD Number 2/12/2005 31/5/2010 (%)
95
Wentworth (A) 1-02-07-01 427 453 6.09 Wentworth (A) 1-02-07-02 219 230 5.02 Wentworth (A) 1-02-07-03 45 45 0.00 Wentworth (A) 1-02-07-04 56 54 -3.57 Wentworth (A) 1-02-07-05 482 488 1.24 Wentworth (A) 1-02-07-06 281 286 1.78 Wentworth (A) 1-02-07-07 327 339 3.67 Wentworth (A) 1-02-07-08 134 133 -0.75 Wentworth (A) 1-02-07-09 192 184 -4.17 Wentworth (A) 1-02-07-10 249 249 0.00 Wentworth (A) 1-02-07-11 455 457 0.44 Wentworth (A) 1-02-07-12 86 87 1.16 Wentworth (A) 1-02-07-13 0 0 0.00 Wentworth (A) 1-02-08-01 371 410 10.51 Wentworth (A) 1-02-08-02 106 110 3.77 Wentworth (A) 1-02-08-03 138 136 -1.45 Wentworth (A) 1-02-08-04 412 500 21.36 Wentworth (A) 1-02-08-05 183 191 4.37 Wentworth (A) 18 4163 4352 4.54 Farrer 306 84668 88740 4.81

New South Wales Redistribution Statistics 2006
Enrolment Projections Fowler
Actual Enrolment Estimate Growth SLA Name CCD Number 2/12/2005 31/5/2010 (%)
96
Fairfield (C) 1-32-03-04 898 980 9.13 Fairfield (C) 1-32-03-05 819 822 0.37 Fairfield (C) 1-32-03-11 679 677 -0.29 Fairfield (C) 1-32-03-12 679 700 3.09 Fairfield (C) 1-32-03-13 851 876 2.94 Fairfield (C) 1-32-08-01 115 113 -1.74 Fairfield (C) 1-32-09-02 249 262 5.22 Fairfield (C) 1-32-09-03 487 505 3.70 Fairfield (C) 1-32-09-04 278 288 3.60 Fairfield (C) 1-32-09-05 431 446 3.48 Fairfield (C) 1-32-09-06 491 498 1.43 Fairfield (C) 1-32-09-07 200 208 4.00 Fairfield (C) 1-32-09-08 247 249 0.81 Fairfield (C) 1-32-09-09 338 338 0.00 Fairfield (C) 1-32-09-10 556 570 2.52 Fairfield (C) 1-32-09-11 322 320 -0.62 Fairfield (C) 1-32-10-01 260 266 2.31 Fairfield (C) 1-32-10-02 503 505 0.40 Fairfield (C) 1-32-10-03 349 363 4.01 Fairfield (C) 1-32-10-04 256 255 -0.39 Fairfield (C) 1-32-10-05 538 563 4.65 Fairfield (C) 1-32-10-06 547 544 -0.55 Fairfield (C) 1-32-10-07 506 523 3.36 Fairfield (C) 1-32-10-08 249 262 5.22 Fairfield (C) 1-32-10-09 229 229 0.00 Fairfield (C) 1-32-10-10 335 338 0.90 Fairfield (C) 1-32-10-11 356 358 0.56 Fairfield (C) 1-32-10-12 319 332 4.08 Fairfield (C) 1-32-11-01 656 675 2.90 Fairfield (C) 1-32-11-02 561 574 2.32 Fairfield (C) 1-32-11-03 540 549 1.67 Fairfield (C) 1-32-11-04 536 545 1.68 Fairfield (C) 1-32-11-05 363 371 2.20 Fairfield (C) 1-32-11-06 540 584 8.15 Fairfield (C) 1-32-11-07 419 429 2.39 Fairfield (C) 1-32-11-08 563 571 1.42 Fairfield (C) 1-32-11-09 514 532 3.50 Fairfield (C) 1-32-11-10 336 341 1.49 Fairfield (C) 1-32-11-11 325 333 2.46 Fairfield (C) 1-32-11-12 141 139 -1.42 Fairfield (C) 1-32-12-01 630 651 3.33 Fairfield (C) 1-32-12-02 436 459 5.28

New South Wales Redistribution Statistics 2006
Enrolment Projections Fowler
Actual Enrolment Estimate Growth SLA Name CCD Number 2/12/2005 31/5/2010 (%)
97
Fairfield (C) 1-32-12-03 467 500 7.07 Fairfield (C) 1-32-12-04 334 361 8.08 Fairfield (C) 1-32-12-05 409 412 0.73 Fairfield (C) 1-32-12-06 283 298 5.30 Fairfield (C) 1-32-12-07 594 633 6.57 Fairfield (C) 1-32-12-08 391 411 5.12 Fairfield (C) 1-32-12-09 638 691 8.31 Fairfield (C) 1-32-12-10 179 194 8.38 Fairfield (C) 1-32-12-11 473 500 5.71 Fairfield (C) 1-32-12-12 251 256 1.99 Fairfield (C) 1-32-12-13 80 79 -1.25 Fairfield (C) 1-32-12-14 426 455 6.81 Fairfield (C) 1-32-12-15 303 324 6.93 Fairfield (C) 1-32-13-01 521 522 0.19 Fairfield (C) 1-32-13-02 487 488 0.21 Fairfield (C) 1-32-13-03 428 435 1.64 Fairfield (C) 1-32-13-04 444 442 -0.45 Fairfield (C) 1-32-13-05 317 319 0.63 Fairfield (C) 1-32-13-06 410 421 2.68 Fairfield (C) 1-32-13-07 483 498 3.11 Fairfield (C) 1-32-13-08 297 301 1.35 Fairfield (C) 1-32-13-09 249 243 -2.41 Fairfield (C) 1-32-13-10 281 283 0.71 Fairfield (C) 1-32-13-11 469 466 -0.64 Fairfield (C) 1-32-14-01 332 352 6.02 Fairfield (C) 1-32-14-02 411 437 6.33 Fairfield (C) 1-32-14-03 624 638 2.24 Fairfield (C) 1-32-14-04 427 442 3.51 Fairfield (C) 1-32-14-05 575 584 1.57 Fairfield (C) 1-32-14-06 846 861 1.77 Fairfield (C) 1-32-14-07 745 766 2.82 Fairfield (C) 1-32-14-08 386 387 0.26 Fairfield (C) 1-32-14-09 313 313 0.00 Fairfield (C) 1-32-14-10 455 449 -1.32 Fairfield (C) 1-32-14-11 203 202 -0.49 Fairfield (C) 1-32-15-01 473 497 5.07 Fairfield (C) 1-32-15-02 607 613 0.99 Fairfield (C) 1-32-15-03 460 482 4.78 Fairfield (C) 1-32-15-04 543 569 4.79 Fairfield (C) 1-32-15-05 750 780 4.00 Fairfield (C) 1-32-15-06 563 561 -0.36 Fairfield (C) 1-32-15-07 448 451 0.67

New South Wales Redistribution Statistics 2006
Enrolment Projections Fowler
Actual Enrolment Estimate Growth SLA Name CCD Number 2/12/2005 31/5/2010 (%)
98
Fairfield (C) 1-32-15-08 527 524 -0.57 Fairfield (C) 1-32-15-09 407 438 7.62 Fairfield (C) 1-32-15-10 320 329 2.81 Fairfield (C) 1-32-15-11 371 398 7.28 Fairfield (C) 1-32-15-12 403 423 4.96 Fairfield (C) 1-32-15-13 313 325 3.83 Fairfield (C) 1-32-15-14 243 242 -0.41 Fairfield (C) 1-32-16-03 563 587 4.26 Fairfield (C) 1-32-16-04 767 770 0.39 Fairfield (C) 1-32-16-05 746 760 1.88 Fairfield (C) 1-32-16-06 905 932 2.98 Fairfield (C) 1-32-16-07 817 824 0.86 Fairfield (C) 1-32-16-08 343 349 1.75 Fairfield (C) 1-32-16-09 466 482 3.43 Fairfield (C) 1-32-16-10 537 553 2.98 Fairfield (C) 1-32-16-11 547 548 0.18 Fairfield (C) 1-32-17-01 398 405 1.76 Fairfield (C) 1-32-17-02 328 336 2.44 Fairfield (C) 1-32-17-03 570 580 1.75 Fairfield (C) 1-32-17-04 558 578 3.58 Fairfield (C) 1-32-17-05 322 334 3.73 Fairfield (C) 1-32-17-06 666 682 2.40 Fairfield (C) 1-32-17-07 568 581 2.29 Fairfield (C) 1-32-17-08 657 685 4.26 Fairfield (C) 1-32-17-09 471 483 2.55 Fairfield (C) 1-32-17-10 467 471 0.86 Fairfield (C) 1-32-17-11 420 445 5.95 Fairfield (C) 1-32-17-12 399 401 0.50 Fairfield (C) 1-32-17-13 404 420 3.96 Fairfield (C) 1-32-17-14 352 355 0.85 Fairfield (C) 1-32-18-01 769 788 2.47 Fairfield (C) 1-32-18-02 518 530 2.32 Fairfield (C) 1-32-18-03 516 520 0.78 Fairfield (C) 1-32-18-04 465 472 1.51 Fairfield (C) 1-32-18-05 710 745 4.93 Fairfield (C) 1-32-18-06 548 552 0.73 Fairfield (C) 1-32-18-07 572 578 1.05 Fairfield (C) 1-32-18-08 536 547 2.05 Fairfield (C) 1-32-18-09 810 826 1.98 Fairfield (C) 1-32-18-10 983 987 0.41 Fairfield (C) 1-32-18-11 361 368 1.94 Fairfield (C) 1-32-18-12 421 420 -0.24

New South Wales Redistribution Statistics 2006
Enrolment Projections Fowler
Actual Enrolment Estimate Growth SLA Name CCD Number 2/12/2005 31/5/2010 (%)
99
Fairfield (C) 1-32-18-13 606 640 5.61 Fairfield (C) 127 59692 61272 2.65 Liverpool (C) 1-29-02-08 404 440 8.91 Liverpool (C) 1-29-02-10 430 455 5.81 Liverpool (C) 1-29-03-01 510 547 7.25 Liverpool (C) 1-29-03-02 578 610 5.54 Liverpool (C) 1-29-03-03 412 437 6.07 Liverpool (C) 1-29-03-04 414 444 7.25 Liverpool (C) 1-29-03-09 453 490 8.17 Liverpool (C) 1-29-04-01 510 548 7.45 Liverpool (C) 1-29-04-02 379 406 7.12 Liverpool (C) 1-29-04-03 380 412 8.42 Liverpool (C) 1-29-04-04 395 425 7.59 Liverpool (C) 1-29-04-05 498 539 8.23 Liverpool (C) 1-29-04-06 456 503 10.31 Liverpool (C) 1-29-04-07 300 325 8.33 Liverpool (C) 1-29-04-08 520 556 6.92 Liverpool (C) 1-29-04-09 479 516 7.72 Liverpool (C) 1-29-04-10 434 463 6.68 Liverpool (C) 1-29-04-11 293 315 7.51 Liverpool (C) 1-29-05-01 301 320 6.31 Liverpool (C) 1-29-05-02 307 329 7.17 Liverpool (C) 1-29-05-03 401 435 8.48 Liverpool (C) 1-29-05-04 313 331 5.75 Liverpool (C) 1-29-06-01 479 512 6.89 Liverpool (C) 1-29-06-02 250 284 13.60 Liverpool (C) 1-29-06-03 383 427 11.49 Liverpool (C) 1-29-06-06 390 423 8.46 Liverpool (C) 1-29-06-07 495 534 7.88 Liverpool (C) 1-29-06-08 462 495 7.14 Liverpool (C) 1-29-06-09 388 429 10.57 Liverpool (C) 1-29-07-01 196 200 2.04 Liverpool (C) 1-29-07-02 202 283 40.10 Liverpool (C) 1-29-07-03 444 469 5.63 Liverpool (C) 1-29-07-04 292 304 4.11 Liverpool (C) 1-29-07-05 408 449 10.05 Liverpool (C) 1-29-07-06 166 436 162.65 Liverpool (C) 1-29-07-07 366 391 6.83 Liverpool (C) 1-29-07-08 143 157 9.79 Liverpool (C) 1-29-07-09 339 355 4.72

New South Wales Redistribution Statistics 2006
Enrolment Projections Fowler
Actual Enrolment Estimate Growth SLA Name CCD Number 2/12/2005 31/5/2010 (%)
100
Liverpool (C) 1-29-07-10 398 410 3.02 Liverpool (C) 1-29-07-11 316 326 3.16 Liverpool (C) 1-29-07-12 181 184 1.66 Liverpool (C) 1-29-07-13 151 156 3.31 Liverpool (C) 1-29-07-14 398 409 2.76 Liverpool (C) 1-29-08-01 323 343 6.19 Liverpool (C) 1-29-08-02 400 452 13.00 Liverpool (C) 1-29-08-03 579 622 7.43 Liverpool (C) 1-29-08-04 465 502 7.96 Liverpool (C) 1-29-08-05 572 618 8.04 Liverpool (C) 1-29-08-06 397 423 6.55 Liverpool (C) 1-29-08-07 313 331 5.75 Liverpool (C) 1-29-08-08 247 262 6.07 Liverpool (C) 1-29-08-09 398 427 7.29 Liverpool (C) 1-29-09-01 250 259 3.60 Liverpool (C) 1-29-09-02 252 265 5.16 Liverpool (C) 1-29-09-03 239 260 8.79 Liverpool (C) 1-29-09-04 337 718 113.06 Liverpool (C) 1-29-09-05 391 706 80.56 Liverpool (C) 1-29-09-06 364 383 5.22 Liverpool (C) 1-29-09-07 269 283 5.20 Liverpool (C) 1-29-09-08 276 294 6.52 Liverpool (C) 1-29-09-09 306 366 19.61 Liverpool (C) 1-29-09-10 102 107 4.90 Liverpool (C) 1-29-09-11 168 204 21.43 Liverpool (C) 1-29-12-04 621 690 11.11 Liverpool (C) 1-29-12-05 312 325 4.17 Liverpool (C) 65 23595 26319 11.54 Fowler 192 83287 87591 5.17

New South Wales Redistribution Statistics 2006
Enrolment Projections Gilmore
Actual Enrolment Estimate Growth SLA Name CCD Number 2/12/2005 31/5/2010 (%)
101
Kiama (A) 1-18-01-01 431 451 4.64 Kiama (A) 1-18-01-02 435 465 6.90 Kiama (A) 1-18-01-03 473 489 3.38 Kiama (A) 1-18-01-04 554 575 3.79 Kiama (A) 1-18-01-05 515 547 6.21 Kiama (A) 1-18-01-06 494 510 3.24 Kiama (A) 1-18-01-07 149 156 4.70 Kiama (A) 1-18-01-08 368 376 2.17 Kiama (A) 1-18-01-09 428 442 3.27 Kiama (A) 1-18-01-10 563 594 5.51 Kiama (A) 1-18-02-01 426 463 8.69 Kiama (A) 1-18-02-02 277 289 4.33 Kiama (A) 1-18-02-03 651 698 7.22 Kiama (A) 1-18-02-04 294 319 8.50 Kiama (A) 1-18-02-05 593 622 4.89 Kiama (A) 1-18-02-06 459 478 4.14 Kiama (A) 1-18-02-07 535 549 2.62 Kiama (A) 1-18-02-08 398 428 7.54 Kiama (A) 1-18-02-09 485 597 23.09 Kiama (A) 1-18-02-10 193 255 32.12 Kiama (A) 1-18-02-11 488 612 25.41 Kiama (A) 1-18-03-01 296 305 3.04 Kiama (A) 1-18-03-02 588 670 13.95 Kiama (A) 1-18-03-03 703 739 5.12 Kiama (A) 1-18-03-04 275 278 1.09 Kiama (A) 1-18-03-05 253 268 5.93 Kiama (A) 1-18-03-06 301 316 4.98 Kiama (A) 1-18-03-07 324 361 11.42 Kiama (A) 1-18-03-08 350 388 10.86 Kiama (A) 1-18-03-09 485 515 6.19 Kiama (A) 1-18-03-10 584 610 4.45 Kiama (A) 1-18-03-11 166 167 0.60 Kiama (A) 1-18-03-12 120 141 17.50 Kiama (A) 1-18-03-13 256 275 7.42 Kiama (A) 1-18-03-14 195 195 0.00 Kiama (A) 35 14105 15143 7.36 Shoalhaven (C) - Pt A 1-18-04-01 784 926 18.11 Shoalhaven (C) - Pt A 1-18-04-06 179 186 3.91 Shoalhaven (C) - Pt A 1-18-04-07 132 137 3.79 Shoalhaven (C) - Pt A 1-18-04-09 210 223 6.19

New South Wales Redistribution Statistics 2006
Enrolment Projections Gilmore
Actual Enrolment Estimate Growth SLA Name CCD Number 2/12/2005 31/5/2010 (%)
102
Shoalhaven (C) - Pt A 1-18-04-11 271 280 3.32 Shoalhaven (C) - Pt A 1-18-04-12 600 831 38.50 Shoalhaven (C) - Pt A 1-18-04-13 217 232 6.91 Shoalhaven (C) - Pt A 1-18-05-01 297 316 6.40 Shoalhaven (C) - Pt A 1-18-05-05 897 1066 18.84 Shoalhaven (C) - Pt A 1-18-05-07 555 575 3.60 Shoalhaven (C) - Pt A 1-18-05-09 479 492 2.71 Shoalhaven (C) - Pt A 1-18-05-10 280 282 0.71 Shoalhaven (C) - Pt A 1-18-05-12 521 534 2.50 Shoalhaven (C) - Pt A 1-18-06-01 320 333 4.06 Shoalhaven (C) - Pt A 1-18-06-02 441 446 1.13 Shoalhaven (C) - Pt A 1-18-06-03 212 218 2.83 Shoalhaven (C) - Pt A 1-18-06-04 422 432 2.37 Shoalhaven (C) - Pt A 1-18-06-05 475 494 4.00 Shoalhaven (C) - Pt A 1-18-06-06 349 378 8.31 Shoalhaven (C) - Pt A 1-18-06-07 399 400 0.25 Shoalhaven (C) - Pt A 1-18-06-08 365 393 7.67 Shoalhaven (C) - Pt A 1-18-06-09 324 355 9.57 Shoalhaven (C) - Pt A 1-18-06-10 353 372 5.38 Shoalhaven (C) - Pt A 1-18-06-11 453 553 22.08 Shoalhaven (C) - Pt A 1-18-06-12 321 318 -0.93 Shoalhaven (C) - Pt A 1-18-07-01 995 1576 58.39 Shoalhaven (C) - Pt A 1-18-07-02 488 536 9.84 Shoalhaven (C) - Pt A 1-18-07-03 413 418 1.21 Shoalhaven (C) - Pt A 1-18-07-04 146 144 -1.37 Shoalhaven (C) - Pt A 1-18-07-05 438 449 2.51 Shoalhaven (C) - Pt A 1-18-07-06 359 369 2.79 Shoalhaven (C) - Pt A 1-18-07-07 372 383 2.96 Shoalhaven (C) - Pt A 1-18-07-08 397 415 4.53 Shoalhaven (C) - Pt A 1-18-07-09 647 773 19.47 Shoalhaven (C) - Pt A 1-18-07-10 214 215 0.47 Shoalhaven (C) - Pt A 1-18-07-11 508 699 37.60 Shoalhaven (C) - Pt A 1-18-07-12 606 785 29.54 Shoalhaven (C) - Pt A 1-18-08-13 151 152 0.66 Shoalhaven (C) - Pt A 1-18-10-10 328 426 29.88 Shoalhaven (C) - Pt A 1-18-24-01 304 320 5.26 Shoalhaven (C) - Pt A 1-18-24-02 329 345 4.86 Shoalhaven (C) - Pt A 1-18-24-03 309 303 -1.94 Shoalhaven (C) - Pt A 1-18-24-04 430 443 3.02 Shoalhaven (C) - Pt A 1-18-24-05 356 356 0.00 Shoalhaven (C) - Pt A 1-18-24-06 368 379 2.99 Shoalhaven (C) - Pt A 1-18-24-07 548 723 31.93

New South Wales Redistribution Statistics 2006
Enrolment Projections Gilmore
Actual Enrolment Estimate Growth SLA Name CCD Number 2/12/2005 31/5/2010 (%)
103
Shoalhaven (C) - Pt A 1-18-24-08 307 318 3.58 Shoalhaven (C) - Pt A 1-18-24-09 452 465 2.88 Shoalhaven (C) - Pt A 1-18-24-10 255 266 4.31 Shoalhaven (C) - Pt A 1-18-24-11 755 801 6.09 Shoalhaven (C) - Pt A 1-18-24-12 270 307 13.70 Shoalhaven (C) - Pt A 51 20601 23138 12.31 Shoalhaven (C) - Pt B 1-18-04-02 291 333 14.43 Shoalhaven (C) - Pt B 1-18-04-03 244 259 6.15 Shoalhaven (C) - Pt B 1-18-04-04 227 269 18.50 Shoalhaven (C) - Pt B 1-18-04-05 295 318 7.80 Shoalhaven (C) - Pt B 1-18-04-08 286 363 26.92 Shoalhaven (C) - Pt B 1-18-04-10 431 471 9.28 Shoalhaven (C) - Pt B 1-18-05-02 310 312 0.65 Shoalhaven (C) - Pt B 1-18-05-03 469 469 0.00 Shoalhaven (C) - Pt B 1-18-05-04 227 242 6.61 Shoalhaven (C) - Pt B 1-18-05-06 426 465 9.15 Shoalhaven (C) - Pt B 1-18-05-08 325 345 6.15 Shoalhaven (C) - Pt B 1-18-05-11 172 193 12.21 Shoalhaven (C) - Pt B 1-18-08-01 231 226 -2.16 Shoalhaven (C) - Pt B 1-18-08-02 322 316 -1.86 Shoalhaven (C) - Pt B 1-18-08-03 463 461 -0.43 Shoalhaven (C) - Pt B 1-18-08-04 223 223 0.00 Shoalhaven (C) - Pt B 1-18-08-05 433 419 -3.23 Shoalhaven (C) - Pt B 1-18-08-06 275 278 1.09 Shoalhaven (C) - Pt B 1-18-08-07 195 202 3.59 Shoalhaven (C) - Pt B 1-18-08-08 511 546 6.85 Shoalhaven (C) - Pt B 1-18-08-09 704 793 12.64 Shoalhaven (C) - Pt B 1-18-08-10 215 212 -1.40 Shoalhaven (C) - Pt B 1-18-08-11 158 164 3.80 Shoalhaven (C) - Pt B 1-18-08-12 216 226 4.63 Shoalhaven (C) - Pt B 1-18-09-01 194 198 2.06 Shoalhaven (C) - Pt B 1-18-09-02 416 450 8.17 Shoalhaven (C) - Pt B 1-18-09-03 348 411 18.10 Shoalhaven (C) - Pt B 1-18-09-04 226 231 2.21 Shoalhaven (C) - Pt B 1-18-09-05 227 230 1.32 Shoalhaven (C) - Pt B 1-18-09-06 476 482 1.26 Shoalhaven (C) - Pt B 1-18-09-07 359 358 -0.28 Shoalhaven (C) - Pt B 1-18-09-08 380 377 -0.79 Shoalhaven (C) - Pt B 1-18-09-09 200 211 5.50 Shoalhaven (C) - Pt B 1-18-09-10 263 270 2.66

New South Wales Redistribution Statistics 2006
Enrolment Projections Gilmore
Actual Enrolment Estimate Growth SLA Name CCD Number 2/12/2005 31/5/2010 (%)
104
Shoalhaven (C) - Pt B 1-18-09-11 264 263 -0.38 Shoalhaven (C) - Pt B 1-18-09-12 286 294 2.80 Shoalhaven (C) - Pt B 1-18-10-01 499 516 3.41 Shoalhaven (C) - Pt B 1-18-10-02 402 468 16.42 Shoalhaven (C) - Pt B 1-18-10-03 307 349 13.68 Shoalhaven (C) - Pt B 1-18-10-04 233 272 16.74 Shoalhaven (C) - Pt B 1-18-10-05 175 189 8.00 Shoalhaven (C) - Pt B 1-18-10-06 119 124 4.20 Shoalhaven (C) - Pt B 1-18-10-07 106 120 13.21 Shoalhaven (C) - Pt B 1-18-10-08 88 103 17.05 Shoalhaven (C) - Pt B 1-18-10-09 173 203 17.34 Shoalhaven (C) - Pt B 1-18-10-11 562 721 28.29 Shoalhaven (C) - Pt B 1-18-10-12 346 362 4.62 Shoalhaven (C) - Pt B 1-18-11-01 298 314 5.37 Shoalhaven (C) - Pt B 1-18-11-02 167 187 11.98 Shoalhaven (C) - Pt B 1-18-11-03 161 166 3.11 Shoalhaven (C) - Pt B 1-18-11-04 194 227 17.01 Shoalhaven (C) - Pt B 1-18-11-05 223 247 10.76 Shoalhaven (C) - Pt B 1-18-11-06 247 264 6.88 Shoalhaven (C) - Pt B 1-18-11-07 265 308 16.23 Shoalhaven (C) - Pt B 1-18-11-08 188 189 0.53 Shoalhaven (C) - Pt B 1-18-11-09 369 401 8.67 Shoalhaven (C) - Pt B 1-18-11-10 253 269 6.32 Shoalhaven (C) - Pt B 1-18-11-11 236 269 13.98 Shoalhaven (C) - Pt B 1-18-12-01 399 435 9.02 Shoalhaven (C) - Pt B 1-18-12-02 290 323 11.38 Shoalhaven (C) - Pt B 1-18-12-03 319 338 5.96 Shoalhaven (C) - Pt B 1-18-12-04 347 364 4.90 Shoalhaven (C) - Pt B 1-18-12-05 594 734 23.57 Shoalhaven (C) - Pt B 1-18-12-06 460 476 3.48 Shoalhaven (C) - Pt B 1-18-12-07 258 268 3.88 Shoalhaven (C) - Pt B 1-18-12-08 208 232 11.54 Shoalhaven (C) - Pt B 1-18-12-09 198 208 5.05 Shoalhaven (C) - Pt B 1-18-12-10 486 556 14.40 Shoalhaven (C) - Pt B 1-18-12-11 319 348 9.09 Shoalhaven (C) - Pt B 1-18-12-12 232 244 5.17 Shoalhaven (C) - Pt B 1-18-12-13 255 277 8.63 Shoalhaven (C) - Pt B 1-18-13-01 328 361 10.06 Shoalhaven (C) - Pt B 1-18-13-02 189 204 7.94 Shoalhaven (C) - Pt B 1-18-13-03 218 229 5.05 Shoalhaven (C) - Pt B 1-18-13-04 311 301 -3.22 Shoalhaven (C) - Pt B 1-18-13-05 300 312 4.00

New South Wales Redistribution Statistics 2006
Enrolment Projections Gilmore
Actual Enrolment Estimate Growth SLA Name CCD Number 2/12/2005 31/5/2010 (%)
105
Shoalhaven (C) - Pt B 1-18-13-06 367 379 3.27 Shoalhaven (C) - Pt B 1-18-13-07 267 300 12.36 Shoalhaven (C) - Pt B 1-18-13-08 274 293 6.93 Shoalhaven (C) - Pt B 1-18-13-09 394 408 3.55 Shoalhaven (C) - Pt B 1-18-13-10 388 423 9.02 Shoalhaven (C) - Pt B 1-18-13-11 298 331 11.07 Shoalhaven (C) - Pt B 1-18-14-01 157 186 18.47 Shoalhaven (C) - Pt B 1-18-14-02 51 70 37.25 Shoalhaven (C) - Pt B 1-18-14-03 142 196 38.03 Shoalhaven (C) - Pt B 1-18-14-04 269 354 31.60 Shoalhaven (C) - Pt B 1-18-14-05 234 263 12.39 Shoalhaven (C) - Pt B 1-18-14-06 448 468 4.46 Shoalhaven (C) - Pt B 1-18-14-07 407 437 7.37 Shoalhaven (C) - Pt B 1-18-14-08 311 364 17.04 Shoalhaven (C) - Pt B 1-18-14-09 216 218 0.93 Shoalhaven (C) - Pt B 1-18-14-10 162 250 54.32 Shoalhaven (C) - Pt B 1-18-14-11 135 179 32.59 Shoalhaven (C) - Pt B 1-18-14-12 347 358 3.17 Shoalhaven (C) - Pt B 1-18-14-13 276 334 21.01 Shoalhaven (C) - Pt B 1-18-15-01 306 322 5.23 Shoalhaven (C) - Pt B 1-18-15-02 205 212 3.41 Shoalhaven (C) - Pt B 1-18-15-03 268 276 2.99 Shoalhaven (C) - Pt B 1-18-15-04 459 688 49.89 Shoalhaven (C) - Pt B 1-18-15-05 153 157 2.61 Shoalhaven (C) - Pt B 1-18-15-06 166 158 -4.82 Shoalhaven (C) - Pt B 1-18-15-07 223 236 5.83 Shoalhaven (C) - Pt B 1-18-15-08 198 193 -2.53 Shoalhaven (C) - Pt B 1-18-15-09 402 414 2.99 Shoalhaven (C) - Pt B 1-18-15-10 437 462 5.72 Shoalhaven (C) - Pt B 1-18-15-11 402 487 21.14 Shoalhaven (C) - Pt B 1-18-15-12 228 242 6.14 Shoalhaven (C) - Pt B 1-18-16-01 393 448 13.99 Shoalhaven (C) - Pt B 1-18-16-02 163 268 64.42 Shoalhaven (C) - Pt B 1-18-16-03 383 463 20.89 Shoalhaven (C) - Pt B 1-18-16-04 170 190 11.76 Shoalhaven (C) - Pt B 1-18-16-05 309 316 2.27 Shoalhaven (C) - Pt B 1-18-16-06 241 271 12.45 Shoalhaven (C) - Pt B 1-18-16-07 175 219 25.14 Shoalhaven (C) - Pt B 1-18-16-08 413 418 1.21 Shoalhaven (C) - Pt B 1-18-16-09 241 244 1.24 Shoalhaven (C) - Pt B 1-18-16-10 228 272 19.30 Shoalhaven (C) - Pt B 1-18-16-11 283 285 0.71

New South Wales Redistribution Statistics 2006
Enrolment Projections Gilmore
Actual Enrolment Estimate Growth SLA Name CCD Number 2/12/2005 31/5/2010 (%)
106
Shoalhaven (C) - Pt B 1-18-23-01 266 411 54.51 Shoalhaven (C) - Pt B 1-18-23-02 227 278 22.47 Shoalhaven (C) - Pt B 1-18-23-03 396 428 8.08 Shoalhaven (C) - Pt B 1-18-23-04 772 1056 36.79 Shoalhaven (C) - Pt B 1-18-23-05 359 376 4.74 Shoalhaven (C) - Pt B 1-18-23-06 428 457 6.78 Shoalhaven (C) - Pt B 1-18-23-07 339 374 10.32 Shoalhaven (C) - Pt B 1-18-23-08 131 154 17.56 Shoalhaven (C) - Pt B 1-18-23-09 247 269 8.91 Shoalhaven (C) - Pt B 1-18-23-10 480 499 3.96 Shoalhaven (C) - Pt B 1-18-23-11 306 324 5.88 Shoalhaven (C) - Pt B 1-18-23-12 273 296 8.42 Shoalhaven (C) - Pt B 1-18-25-01 590 602 2.03 Shoalhaven (C) - Pt B 1-18-25-02 263 314 19.39 Shoalhaven (C) - Pt B 1-18-25-03 343 335 -2.33 Shoalhaven (C) - Pt B 1-18-25-04 429 487 13.52 Shoalhaven (C) - Pt B 1-18-25-05 189 188 -0.53 Shoalhaven (C) - Pt B 1-18-25-06 429 452 5.36 Shoalhaven (C) - Pt B 1-18-25-07 366 364 -0.55 Shoalhaven (C) - Pt B 1-18-25-08 250 255 2.00 Shoalhaven (C) - Pt B 1-18-25-09 413 504 22.03 Shoalhaven (C) - Pt B 1-18-25-10 911 1234 35.46 Shoalhaven (C) - Pt B 140 42606 47067 10.47 Wingecarribee (A) 1-20-07-01 456 476 4.39 Wingecarribee (A) 1-20-07-02 319 324 1.57 Wingecarribee (A) 1-20-07-04 190 194 2.11 Wingecarribee (A) 1-20-07-05 158 173 9.49 Wingecarribee (A) 1-20-07-06 376 384 2.13 Wingecarribee (A) 1-20-07-07 409 423 3.42 Wingecarribee (A) 1-20-07-08 472 485 2.75 Wingecarribee (A) 1-20-07-09 354 376 6.21 Wingecarribee (A) 1-20-07-10 272 273 0.37 Wingecarribee (A) 1-20-07-11 335 338 0.90 Wingecarribee (A) 1-20-07-12 396 393 -0.76 Wingecarribee (A) 1-20-07-13 208 228 9.62 Wingecarribee (A) 1-20-07-14 318 326 2.52 Wingecarribee (A) 1-20-07-15 378 403 6.61 Wingecarribee (A) 1-20-08-01 377 457 21.22 Wingecarribee (A) 1-20-08-02 229 236 3.06 Wingecarribee (A) 1-20-08-03 238 250 5.04

New South Wales Redistribution Statistics 2006
Enrolment Projections Gilmore
Actual Enrolment Estimate Growth SLA Name CCD Number 2/12/2005 31/5/2010 (%)
107
Wingecarribee (A) 1-20-08-04 585 723 23.59 Wingecarribee (A) 1-20-08-05 358 370 3.35 Wingecarribee (A) 1-20-08-06 148 155 4.73 Wingecarribee (A) 1-20-08-07 278 289 3.96 Wingecarribee (A) 1-20-08-08 484 582 20.25 Wingecarribee (A) 1-20-08-09 320 318 -0.62 Wingecarribee (A) 1-20-08-10 384 412 7.29 Wingecarribee (A) 1-20-08-11 188 195 3.72 Wingecarribee (A) 1-20-08-12 320 386 20.62 Wingecarribee (A) 1-20-08-13 316 348 10.13 Wingecarribee (A) 1-20-08-14 187 201 7.49 Wingecarribee (A) 1-20-08-15 213 211 -0.94 Wingecarribee (A) 1-20-08-16 344 406 18.02 Wingecarribee (A) 1-20-08-17 175 191 9.14 Wingecarribee (A) 1-20-10-13 170 181 6.47 Wingecarribee (A) 32 9955 10707 7.55 Gilmore 258 87267 96055 10.07

New South Wales Redistribution Statistics 2006
Enrolment Projections Grayndler
Actual Enrolment Estimate Growth SLA Name CCD Number 2/12/2005 31/5/2010 (%)
108
Ashfield (A) 1-41-13-01 207 200 -3.38 Ashfield (A) 1-41-13-02 499 508 1.80 Ashfield (A) 1-41-13-03 179 184 2.79 Ashfield (A) 1-41-13-04 313 309 -1.28 Ashfield (A) 1-41-13-07 210 222 5.71 Ashfield (A) 1-41-13-10 136 139 2.21 Ashfield (A) 1-41-13-12 317 318 0.32 Ashfield (A) 1-41-14-01 344 519 50.87 Ashfield (A) 1-41-14-02 473 475 0.42 Ashfield (A) 1-41-14-03 150 154 2.67 Ashfield (A) 1-41-14-04 223 225 0.90 Ashfield (A) 1-41-14-05 332 334 0.60 Ashfield (A) 1-41-14-06 336 332 -1.19 Ashfield (A) 1-41-14-07 583 571 -2.06 Ashfield (A) 1-41-14-08 413 414 0.24 Ashfield (A) 1-41-14-09 296 295 -0.34 Ashfield (A) 1-41-14-10 192 192 0.00 Ashfield (A) 1-41-14-11 364 369 1.37 Ashfield (A) 1-41-14-12 240 242 0.83 Ashfield (A) 1-41-14-13 472 470 -0.42 Ashfield (A) 1-41-14-14 320 327 2.19 Ashfield (A) 1-41-14-15 100 96 -4.00 Ashfield (A) 1-41-15-03 287 281 -2.09 Ashfield (A) 1-41-15-04 168 165 -1.79 Ashfield (A) 1-41-15-05 327 321 -1.83 Ashfield (A) 1-41-15-06 257 252 -1.95 Ashfield (A) 1-41-15-07 122 122 0.00 Ashfield (A) 1-41-15-08 370 360 -2.70 Ashfield (A) 1-41-15-09 187 183 -2.14 Ashfield (A) 1-41-15-10 348 346 -0.57 Ashfield (A) 1-41-15-11 211 219 3.79 Ashfield (A) 1-41-15-13 333 325 -2.40 Ashfield (A) 1-41-15-14 308 300 -2.60 Ashfield (A) 1-41-15-16 303 297 -1.98 Ashfield (A) 1-41-16-01 170 167 -1.76 Ashfield (A) 1-41-16-02 328 332 1.22 Ashfield (A) 1-41-16-03 159 162 1.89 Ashfield (A) 1-41-16-04 154 153 -0.65 Ashfield (A) 1-41-16-05 371 366 -1.35 Ashfield (A) 1-41-16-06 88 101 14.77 Ashfield (A) 1-41-16-07 164 182 10.98 Ashfield (A) 1-41-16-08 208 200 -3.85
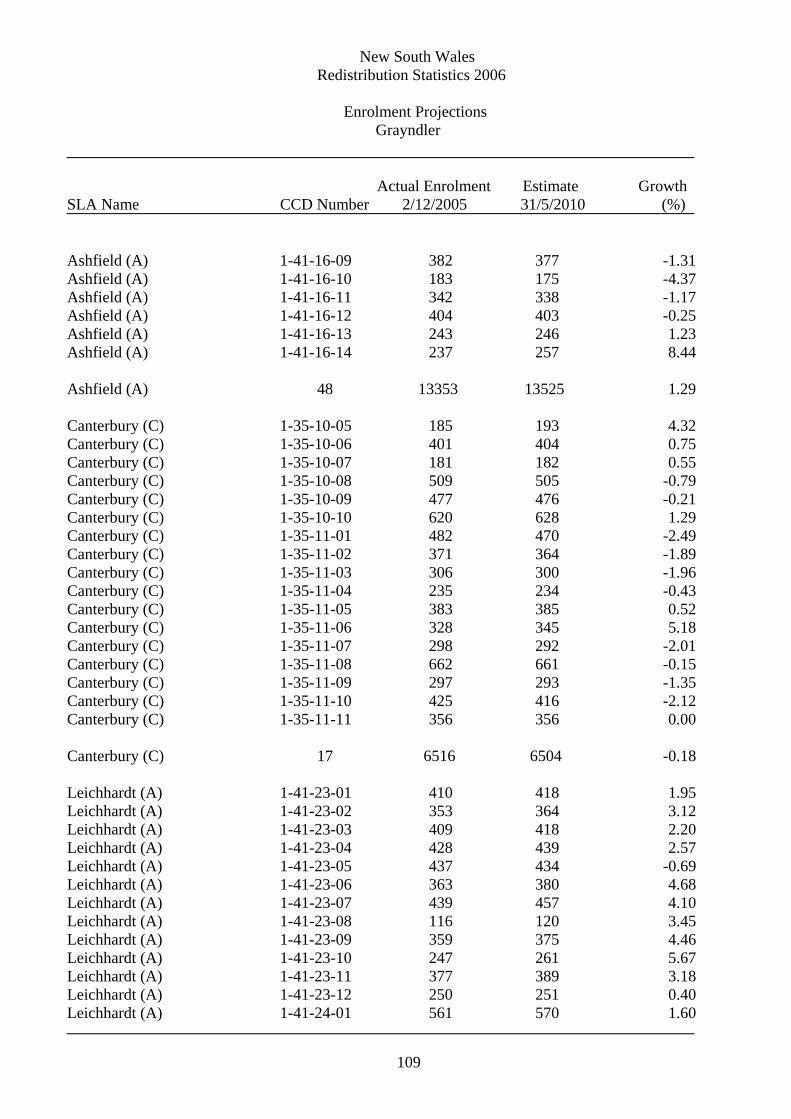
New South Wales Redistribution Statistics 2006
Enrolment Projections Grayndler
Actual Enrolment Estimate Growth SLA Name CCD Number 2/12/2005 31/5/2010 (%)
109
Ashfield (A) 1-41-16-09 382 377 -1.31 Ashfield (A) 1-41-16-10 183 175 -4.37 Ashfield (A) 1-41-16-11 342 338 -1.17 Ashfield (A) 1-41-16-12 404 403 -0.25 Ashfield (A) 1-41-16-13 243 246 1.23 Ashfield (A) 1-41-16-14 237 257 8.44 Ashfield (A) 48 13353 13525 1.29 Canterbury (C) 1-35-10-05 185 193 4.32 Canterbury (C) 1-35-10-06 401 404 0.75 Canterbury (C) 1-35-10-07 181 182 0.55 Canterbury (C) 1-35-10-08 509 505 -0.79 Canterbury (C) 1-35-10-09 477 476 -0.21 Canterbury (C) 1-35-10-10 620 628 1.29 Canterbury (C) 1-35-11-01 482 470 -2.49 Canterbury (C) 1-35-11-02 371 364 -1.89 Canterbury (C) 1-35-11-03 306 300 -1.96 Canterbury (C) 1-35-11-04 235 234 -0.43 Canterbury (C) 1-35-11-05 383 385 0.52 Canterbury (C) 1-35-11-06 328 345 5.18 Canterbury (C) 1-35-11-07 298 292 -2.01 Canterbury (C) 1-35-11-08 662 661 -0.15 Canterbury (C) 1-35-11-09 297 293 -1.35 Canterbury (C) 1-35-11-10 425 416 -2.12 Canterbury (C) 1-35-11-11 356 356 0.00 Canterbury (C) 17 6516 6504 -0.18 Leichhardt (A) 1-41-23-01 410 418 1.95 Leichhardt (A) 1-41-23-02 353 364 3.12 Leichhardt (A) 1-41-23-03 409 418 2.20 Leichhardt (A) 1-41-23-04 428 439 2.57 Leichhardt (A) 1-41-23-05 437 434 -0.69 Leichhardt (A) 1-41-23-06 363 380 4.68 Leichhardt (A) 1-41-23-07 439 457 4.10 Leichhardt (A) 1-41-23-08 116 120 3.45 Leichhardt (A) 1-41-23-09 359 375 4.46 Leichhardt (A) 1-41-23-10 247 261 5.67 Leichhardt (A) 1-41-23-11 377 389 3.18 Leichhardt (A) 1-41-23-12 250 251 0.40 Leichhardt (A) 1-41-24-01 561 570 1.60

New South Wales Redistribution Statistics 2006
Enrolment Projections Grayndler
Actual Enrolment Estimate Growth SLA Name CCD Number 2/12/2005 31/5/2010 (%)
110
Leichhardt (A) 1-41-24-02 353 360 1.98 Leichhardt (A) 1-41-24-03 253 265 4.74 Leichhardt (A) 1-41-24-04 162 163 0.62 Leichhardt (A) 1-41-24-05 247 251 1.62 Leichhardt (A) 1-41-24-06 338 348 2.96 Leichhardt (A) 1-41-24-07 359 371 3.34 Leichhardt (A) 1-41-24-08 332 342 3.01 Leichhardt (A) 1-41-24-09 413 429 3.87 Leichhardt (A) 1-41-24-10 284 315 10.92 Leichhardt (A) 1-41-24-11 400 410 2.50 Leichhardt (A) 1-41-24-13 62 61 -1.61 Leichhardt (A) 1-41-28-01 330 348 5.45 Leichhardt (A) 1-41-28-02 328 331 0.91 Leichhardt (A) 1-41-28-03 477 494 3.56 Leichhardt (A) 1-41-28-04 270 270 0.00 Leichhardt (A) 1-41-28-05 214 219 2.34 Leichhardt (A) 1-41-28-06 252 260 3.17 Leichhardt (A) 1-41-28-12 201 203 1.00 Leichhardt (A) 1-41-28-13 278 295 6.12 Leichhardt (A) 1-41-29-01 538 557 3.53 Leichhardt (A) 1-41-29-02 317 320 0.95 Leichhardt (A) 1-41-29-03 389 397 2.06 Leichhardt (A) 1-41-29-04 253 285 12.65 Leichhardt (A) 1-41-29-05 332 342 3.01 Leichhardt (A) 1-41-29-06 272 294 8.09 Leichhardt (A) 1-41-29-07 229 234 2.18 Leichhardt (A) 1-41-29-08 403 408 1.24 Leichhardt (A) 1-41-29-09 322 333 3.42 Leichhardt (A) 1-41-29-10 283 297 4.95 Leichhardt (A) 1-41-30-01 501 514 2.59 Leichhardt (A) 1-41-30-02 159 165 3.77 Leichhardt (A) 1-41-30-03 352 352 0.00 Leichhardt (A) 1-41-30-04 228 229 0.44 Leichhardt (A) 1-41-30-05 197 201 2.03 Leichhardt (A) 1-41-30-06 323 337 4.33 Leichhardt (A) 1-41-30-07 436 488 11.93 Leichhardt (A) 1-41-30-08 485 503 3.71 Leichhardt (A) 1-41-30-09 249 257 3.21 Leichhardt (A) 1-41-30-10 195 198 1.54 Leichhardt (A) 1-41-30-11 330 345 4.55 Leichhardt (A) 53 17095 17667 3.35

New South Wales Redistribution Statistics 2006
Enrolment Projections Grayndler
Actual Enrolment Estimate Growth SLA Name CCD Number 2/12/2005 31/5/2010 (%)
111
Marrickville (A) 1-42-01-01 300 285 -5.00 Marrickville (A) 1-42-01-02 279 266 -4.66 Marrickville (A) 1-42-01-03 221 212 -4.07 Marrickville (A) 1-42-01-04 229 218 -4.80 Marrickville (A) 1-42-01-05 221 226 2.26 Marrickville (A) 1-42-01-06 312 294 -5.77 Marrickville (A) 1-42-01-07 295 282 -4.41 Marrickville (A) 1-42-01-08 449 434 -3.34 Marrickville (A) 1-42-01-09 329 308 -6.38 Marrickville (A) 1-42-01-10 341 319 -6.45 Marrickville (A) 1-42-02-01 395 389 -1.52 Marrickville (A) 1-42-02-02 346 335 -3.18 Marrickville (A) 1-42-02-03 153 148 -3.27 Marrickville (A) 1-42-02-04 220 211 -4.09 Marrickville (A) 1-42-02-05 310 305 -1.61 Marrickville (A) 1-42-02-06 193 188 -2.59 Marrickville (A) 1-42-02-07 220 212 -3.64 Marrickville (A) 1-42-02-08 493 498 1.01 Marrickville (A) 1-42-02-09 228 213 -6.58 Marrickville (A) 1-42-02-10 336 320 -4.76 Marrickville (A) 1-42-02-11 317 302 -4.73 Marrickville (A) 1-42-02-12 227 221 -2.64 Marrickville (A) 1-42-02-13 233 224 -3.86 Marrickville (A) 1-42-02-14 226 217 -3.98 Marrickville (A) 1-42-03-01 275 259 -5.82 Marrickville (A) 1-42-03-02 655 639 -2.44 Marrickville (A) 1-42-03-03 202 193 -4.46 Marrickville (A) 1-42-03-04 516 496 -3.88 Marrickville (A) 1-42-03-05 161 154 -4.35 Marrickville (A) 1-42-03-06 175 176 0.57 Marrickville (A) 1-42-03-07 380 380 0.00 Marrickville (A) 1-42-03-08 277 274 -1.08 Marrickville (A) 1-42-03-09 524 508 -3.05 Marrickville (A) 1-42-03-10 279 270 -3.23 Marrickville (A) 1-42-03-11 354 337 -4.80 Marrickville (A) 1-42-03-12 254 244 -3.94 Marrickville (A) 1-42-03-13 389 391 0.51 Marrickville (A) 1-42-04-01 390 402 3.08 Marrickville (A) 1-42-04-02 453 440 -2.87 Marrickville (A) 1-42-04-03 369 353 -4.34 Marrickville (A) 1-42-04-04 331 313 -5.44

New South Wales Redistribution Statistics 2006
Enrolment Projections Grayndler
Actual Enrolment Estimate Growth SLA Name CCD Number 2/12/2005 31/5/2010 (%)
112
Marrickville (A) 1-42-04-05 479 479 0.00 Marrickville (A) 1-42-04-06 489 486 -0.61 Marrickville (A) 1-42-04-07 331 342 3.32 Marrickville (A) 1-42-04-08 168 182 8.33 Marrickville (A) 1-42-04-09 90 86 -4.44 Marrickville (A) 1-42-04-10 115 111 -3.48 Marrickville (A) 1-42-04-11 93 90 -3.23 Marrickville (A) 1-42-04-12 389 373 -4.11 Marrickville (A) 1-42-04-13 387 361 -6.72 Marrickville (A) 1-42-05-01 198 193 -2.53 Marrickville (A) 1-42-05-02 124 118 -4.84 Marrickville (A) 1-42-05-03 218 213 -2.29 Marrickville (A) 1-42-05-04 398 384 -3.52 Marrickville (A) 1-42-05-05 314 310 -1.27 Marrickville (A) 1-42-05-06 273 257 -5.86 Marrickville (A) 1-42-05-07 501 507 1.20 Marrickville (A) 1-42-05-08 331 340 2.72 Marrickville (A) 1-42-05-09 366 355 -3.01 Marrickville (A) 1-42-05-10 380 373 -1.84 Marrickville (A) 1-42-05-11 320 314 -1.88 Marrickville (A) 1-42-06-01 608 588 -3.29 Marrickville (A) 1-42-06-02 265 256 -3.40 Marrickville (A) 1-42-06-03 285 306 7.37 Marrickville (A) 1-42-06-04 350 336 -4.00 Marrickville (A) 1-42-06-05 393 384 -2.29 Marrickville (A) 1-42-06-06 492 468 -4.88 Marrickville (A) 1-42-06-07 423 413 -2.36 Marrickville (A) 1-42-06-08 283 276 -2.47 Marrickville (A) 1-42-06-09 263 254 -3.42 Marrickville (A) 1-42-06-10 276 273 -1.09 Marrickville (A) 1-42-07-01 433 422 -2.54 Marrickville (A) 1-42-07-02 346 333 -3.76 Marrickville (A) 1-42-07-03 224 215 -4.02 Marrickville (A) 1-42-07-04 350 384 9.71 Marrickville (A) 1-42-07-05 489 465 -4.91 Marrickville (A) 1-42-07-06 429 631 47.09 Marrickville (A) 1-42-07-07 174 170 -2.30 Marrickville (A) 1-42-07-08 240 231 -3.75 Marrickville (A) 1-42-07-09 479 460 -3.97 Marrickville (A) 1-42-07-10 171 168 -1.75 Marrickville (A) 1-42-08-01 281 298 6.05 Marrickville (A) 1-42-08-02 126 124 -1.59

New South Wales Redistribution Statistics 2006
Enrolment Projections Grayndler
Actual Enrolment Estimate Growth SLA Name CCD Number 2/12/2005 31/5/2010 (%)
113
Marrickville (A) 1-42-08-03 162 157 -3.09 Marrickville (A) 1-42-08-04 522 492 -5.75 Marrickville (A) 1-42-08-05 459 453 -1.31 Marrickville (A) 1-42-08-06 334 316 -5.39 Marrickville (A) 1-42-08-07 297 284 -4.38 Marrickville (A) 1-42-08-08 204 229 12.25 Marrickville (A) 1-42-08-09 121 117 -3.31 Marrickville (A) 1-42-08-10 249 269 8.03 Marrickville (A) 1-42-09-01 198 190 -4.04 Marrickville (A) 1-42-09-02 345 330 -4.35 Marrickville (A) 1-42-09-03 394 375 -4.82 Marrickville (A) 1-42-09-04 446 472 5.83 Marrickville (A) 1-42-09-05 729 739 1.37 Marrickville (A) 1-42-09-06 296 283 -4.39 Marrickville (A) 1-42-09-07 343 323 -5.83 Marrickville (A) 1-42-09-08 383 365 -4.70 Marrickville (A) 1-42-09-09 292 281 -3.77 Marrickville (A) 1-42-09-10 510 585 14.71 Marrickville (A) 1-42-10-01 504 494 -1.98 Marrickville (A) 1-42-10-02 435 455 4.60 Marrickville (A) 1-42-10-03 428 402 -6.07 Marrickville (A) 1-42-10-04 232 215 -7.33 Marrickville (A) 1-42-10-05 300 285 -5.00 Marrickville (A) 1-42-10-06 256 247 -3.52 Marrickville (A) 1-42-10-07 231 215 -6.93 Marrickville (A) 1-42-10-08 129 123 -4.65 Marrickville (A) 1-42-10-09 206 204 -0.97 Marrickville (A) 1-42-11-01 455 443 -2.64 Marrickville (A) 1-42-11-02 107 110 2.80 Marrickville (A) 1-42-11-03 180 173 -3.89 Marrickville (A) 1-42-11-04 389 374 -3.86 Marrickville (A) 1-42-11-05 407 377 -7.37 Marrickville (A) 1-42-11-06 247 275 11.34 Marrickville (A) 1-42-11-07 265 283 6.79 Marrickville (A) 1-42-11-08 173 168 -2.89 Marrickville (A) 1-42-11-09 171 161 -5.85 Marrickville (A) 1-42-11-10 339 318 -6.19 Marrickville (A) 1-42-11-11 315 316 0.32 Marrickville (A) 1-42-11-12 242 230 -4.96 Marrickville (A) 1-42-12-01 181 171 -5.52 Marrickville (A) 1-42-12-02 391 372 -4.86 Marrickville (A) 1-42-12-03 143 143 0.00

New South Wales Redistribution Statistics 2006
Enrolment Projections Grayndler
Actual Enrolment Estimate Growth SLA Name CCD Number 2/12/2005 31/5/2010 (%)
114
Marrickville (A) 1-42-12-04 341 327 -4.11 Marrickville (A) 1-42-12-05 513 510 -0.58 Marrickville (A) 1-42-12-06 430 407 -5.35 Marrickville (A) 1-42-12-07 338 372 10.06 Marrickville (A) 1-42-12-08 258 261 1.16 Marrickville (A) 1-42-12-09 433 423 -2.31 Marrickville (A) 1-42-12-10 266 257 -3.38 Marrickville (A) 1-42-12-11 213 207 -2.82 Marrickville (A) 1-42-13-01 397 624 57.18 Marrickville (A) 1-42-13-02 417 398 -4.56 Marrickville (A) 1-42-13-03 314 317 0.96 Marrickville (A) 1-42-13-04 220 210 -4.55 Marrickville (A) 1-42-13-05 134 137 2.24 Marrickville (A) 1-42-13-06 135 130 -3.70 Marrickville (A) 1-42-13-07 283 271 -4.24 Marrickville (A) 1-42-13-08 277 266 -3.97 Marrickville (A) 1-42-13-09 161 155 -3.73 Marrickville (A) 1-42-13-10 226 250 10.62 Marrickville (A) 1-42-13-11 278 459 65.11 Marrickville (A) 1-42-13-12 394 402 2.03 Marrickville (A) 1-42-14-01 223 241 8.07 Marrickville (A) 1-42-14-02 371 352 -5.12 Marrickville (A) 1-42-14-03 98 96 -2.04 Marrickville (A) 1-42-14-04 185 179 -3.24 Marrickville (A) 1-42-14-05 434 431 -0.69 Marrickville (A) 1-42-14-06 218 211 -3.21 Marrickville (A) 1-42-14-07 172 166 -3.49 Marrickville (A) 1-42-14-08 357 345 -3.36 Marrickville (A) 1-42-14-09 466 459 -1.50 Marrickville (A) 1-42-14-10 223 215 -3.59 Marrickville (A) 1-42-14-11 339 326 -3.83 Marrickville (A) 156 48325 48003 -0.67 Sydney (C) - Central 1-41-30-07 8 8 0.00 Sydney (C) - Central 1 8 8 0.00 Grayndler 275 85297 85707 0.48
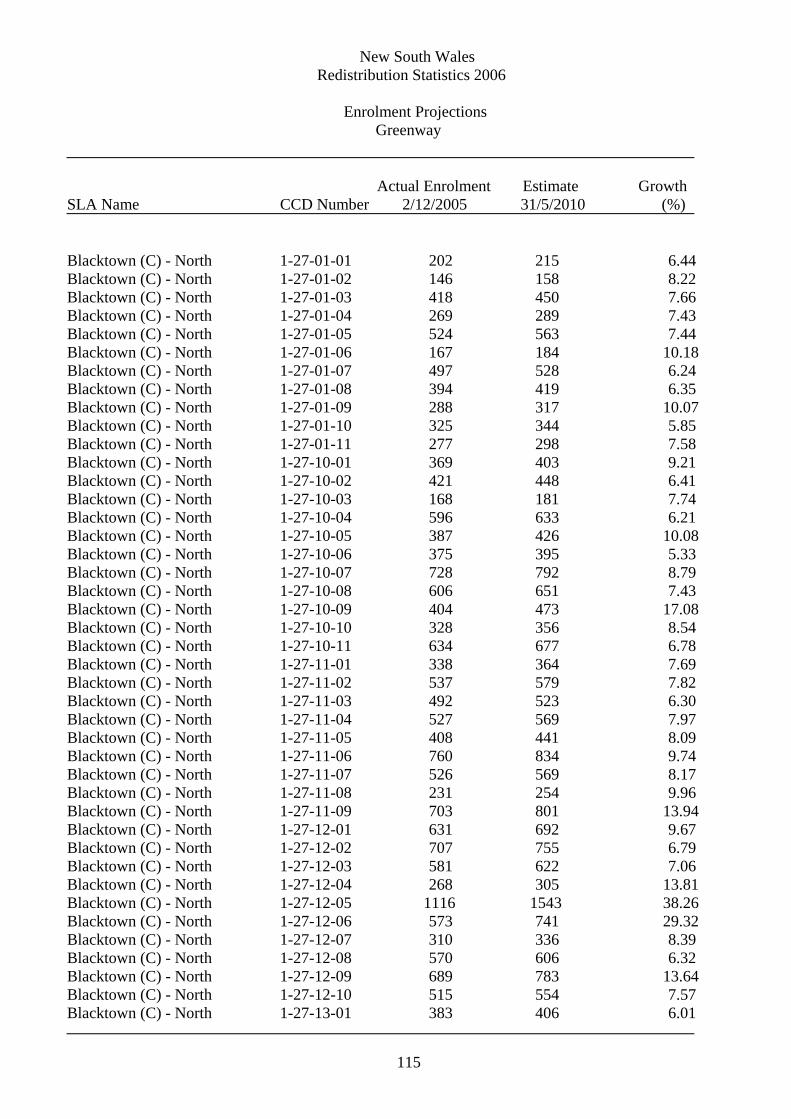
New South Wales Redistribution Statistics 2006
Enrolment Projections Greenway
Actual Enrolment Estimate Growth SLA Name CCD Number 2/12/2005 31/5/2010 (%)
115
Blacktown (C) - North 1-27-01-01 202 215 6.44 Blacktown (C) - North 1-27-01-02 146 158 8.22 Blacktown (C) - North 1-27-01-03 418 450 7.66 Blacktown (C) - North 1-27-01-04 269 289 7.43 Blacktown (C) - North 1-27-01-05 524 563 7.44 Blacktown (C) - North 1-27-01-06 167 184 10.18 Blacktown (C) - North 1-27-01-07 497 528 6.24 Blacktown (C) - North 1-27-01-08 394 419 6.35 Blacktown (C) - North 1-27-01-09 288 317 10.07 Blacktown (C) - North 1-27-01-10 325 344 5.85 Blacktown (C) - North 1-27-01-11 277 298 7.58 Blacktown (C) - North 1-27-10-01 369 403 9.21 Blacktown (C) - North 1-27-10-02 421 448 6.41 Blacktown (C) - North 1-27-10-03 168 181 7.74 Blacktown (C) - North 1-27-10-04 596 633 6.21 Blacktown (C) - North 1-27-10-05 387 426 10.08 Blacktown (C) - North 1-27-10-06 375 395 5.33 Blacktown (C) - North 1-27-10-07 728 792 8.79 Blacktown (C) - North 1-27-10-08 606 651 7.43 Blacktown (C) - North 1-27-10-09 404 473 17.08 Blacktown (C) - North 1-27-10-10 328 356 8.54 Blacktown (C) - North 1-27-10-11 634 677 6.78 Blacktown (C) - North 1-27-11-01 338 364 7.69 Blacktown (C) - North 1-27-11-02 537 579 7.82 Blacktown (C) - North 1-27-11-03 492 523 6.30 Blacktown (C) - North 1-27-11-04 527 569 7.97 Blacktown (C) - North 1-27-11-05 408 441 8.09 Blacktown (C) - North 1-27-11-06 760 834 9.74 Blacktown (C) - North 1-27-11-07 526 569 8.17 Blacktown (C) - North 1-27-11-08 231 254 9.96 Blacktown (C) - North 1-27-11-09 703 801 13.94 Blacktown (C) - North 1-27-12-01 631 692 9.67 Blacktown (C) - North 1-27-12-02 707 755 6.79 Blacktown (C) - North 1-27-12-03 581 622 7.06 Blacktown (C) - North 1-27-12-04 268 305 13.81 Blacktown (C) - North 1-27-12-05 1116 1543 38.26 Blacktown (C) - North 1-27-12-06 573 741 29.32 Blacktown (C) - North 1-27-12-07 310 336 8.39 Blacktown (C) - North 1-27-12-08 570 606 6.32 Blacktown (C) - North 1-27-12-09 689 783 13.64 Blacktown (C) - North 1-27-12-10 515 554 7.57 Blacktown (C) - North 1-27-13-01 383 406 6.01

New South Wales Redistribution Statistics 2006
Enrolment Projections Greenway
Actual Enrolment Estimate Growth SLA Name CCD Number 2/12/2005 31/5/2010 (%)
116
Blacktown (C) - North 1-27-18-03 812 860 5.91
Blacktown (C) - North 1-27-13-02 691 740 7.09 Blacktown (C) - North 1-27-13-03 320 351 9.69 Blacktown (C) - North 1-27-13-04 382 409 7.07 Blacktown (C) - North 1-27-13-05 477 526 10.27 Blacktown (C) - North 1-27-13-06 380 409 7.63 Blacktown (C) - North 1-27-13-07 594 632 6.40 Blacktown (C) - North 1-27-13-08 467 508 8.78 Blacktown (C) - North 1-27-13-09 519 669 28.90 Blacktown (C) - North 1-27-13-10 520 558 7.31 Blacktown (C) - North 1-27-13-11 563 599 6.39 Blacktown (C) - North 1-27-13-12 420 444 5.71 Blacktown (C) - North 1-27-13-13 555 591 6.49 Blacktown (C) - North 1-27-16-01 513 557 8.58 Blacktown (C) - North 1-27-17-01 588 629 6.97 Blacktown (C) - North 1-27-17-02 351 372 5.98 Blacktown (C) - North 1-27-17-03 373 397 6.43 Blacktown (C) - North 1-27-17-10 398 424 6.53 Blacktown (C) - North 1-27-17-11 608 646 6.25 Blacktown (C) - North 1-27-17-12 403 434 7.69 Blacktown (C) - North 1-27-17-13 416 438 5.29 Blacktown (C) - North 1-27-17-14 398 423 6.28 Blacktown (C) - North 1-27-18-01 406 432 6.40 Blacktown (C) - North 1-27-18-02 702 745 6.13
Blacktown (C) - North 1-27-18-04 578 616 6.57 Blacktown (C) - North 1-27-18-10 374 395 5.61 Blacktown (C) - North 1-27-18-11 902 1234 36.81 Blacktown (C) - North 1-27-18-12 275 302 9.82 Blacktown (C) - North 1-27-18-13 615 875 42.28 Blacktown (C) - North 1-27-18-14 615 673 9.43 Blacktown (C) - North 1-27-28-01 83 90 8.43 Blacktown (C) - North 1-27-28-02 240 274 14.17 Blacktown (C) - North 1-27-28-03 353 398 12.75 Blacktown (C) - North 1-27-28-04 310 344 10.97 Blacktown (C) - North 1-27-28-05 256 278 8.59 Blacktown (C) - North 1-27-28-06 483 552 14.29 Blacktown (C) - North 1-27-28-07 211 227 7.58 Blacktown (C) - North 1-27-28-08 1195 1939 62.26 Blacktown (C) - North 1-27-28-09 400 440 10.00 Blacktown (C) - North 1-27-28-10 329 353 7.29 Blacktown (C) - North 1-27-28-11 284 306 7.75 Blacktown (C) - North 1-27-28-12 1533 2947 92.24

New South Wales Redistribution Statistics 2006
Enrolment Projections Greenway
Actual Enrolment Estimate Growth SLA Name CCD Number 2/12/2005 31/5/2010 (%)
117
Blacktown (C) - North 1-27-29-01 1069 1224 14.50 Blacktown (C) - North 1-27-29-02 757 822 8.59 Blacktown (C) - North 1-27-29-03 544 652 19.85 Blacktown (C) - North 1-27-29-04 567 604 6.53 Blacktown (C) - North 1-27-29-05 365 514 40.82 Blacktown (C) - North 1-27-29-06 502 532 5.98 Blacktown (C) - North 1-27-29-07 1351 1738 28.65 Blacktown (C) - North 1-27-29-08 417 447 7.19 Blacktown (C) - North 1-27-29-09 349 370 6.02 Blacktown (C) - North 1-27-29-10 206 518 151.46 Blacktown (C) - North 1-27-29-11 674 786 16.62 Blacktown (C) - North 1-27-29-12 458 514 12.23 Blacktown (C) - North 1-27-29-13 417 492 17.99 Blacktown (C) - North 1-27-29-14 861 1450 68.41 Blacktown (C) - North 1-27-29-15 315 336 6.67 Blacktown (C) - North 1-27-29-16 551 600 8.89 Blacktown (C) - North 1-27-29-17 520 567 9.04 Blacktown (C) - North 1-27-29-18 1006 1073 6.66 Blacktown (C) - North 102 51209 59752 16.68 Blacktown (C) - South-East 1-27-15-03 297 300 1.01 Blacktown (C) - South-East 1-27-15-04 659 787 19.42 Blacktown (C) - South-East 1-27-15-05 332 343 3.31 Blacktown (C) - South-East 1-27-15-06 95 135 42.11 Blacktown (C) - South-East 1-27-15-07 290 325 12.07 Blacktown (C) - South-East 1-27-15-08 431 444 3.02 Blacktown (C) - South-East 1-27-15-09 470 490 4.26 Blacktown (C) - South-East 1-27-15-10 289 309 6.92 Blacktown (C) - South-East 1-27-16-02 505 884 75.05 Blacktown (C) - South-East 1-27-16-03 524 553 5.53 Blacktown (C) - South-East 1-27-16-04 161 164 1.86 Blacktown (C) - South-East 1-27-16-05 551 570 3.45 Blacktown (C) - South-East 1-27-16-06 345 360 4.35 Blacktown (C) - South-East 1-27-16-07 397 416 4.79 Blacktown (C) - South-East 1-27-16-08 383 417 8.88 Blacktown (C) - South-East 1-27-16-09 320 341 6.56 Blacktown (C) - South-East 1-27-16-10 153 157 2.61 Blacktown (C) - South-East 1-27-16-11 258 266 3.10 Blacktown (C) - South-East 1-27-16-12 337 344 2.08 Blacktown (C) - South-East 1-27-17-04 354 359 1.41 Blacktown (C) - South-East 1-27-17-05 492 514 4.47

New South Wales Redistribution Statistics 2006
Enrolment Projections Greenway
Actual Enrolment Estimate Growth SLA Name CCD Number 2/12/2005 31/5/2010 (%)
118
Blacktown (C) - South-East 1-27-17-06 349 357 2.29 Blacktown (C) - South-East 1-27-17-07 294 305 3.74 Blacktown (C) - South-East 1-27-17-08 227 226 -0.44 Blacktown (C) - South-East 1-27-17-09 425 428 0.71 Blacktown (C) - South-East 1-27-18-05 292 297 1.71 Blacktown (C) - South-East 1-27-18-06 285 285 0.00 Blacktown (C) - South-East 1-27-18-07 270 274 1.48 Blacktown (C) - South-East 1-27-18-08 438 450 2.74 Blacktown (C) - South-East 1-27-18-09 352 356 1.14 Blacktown (C) - South-East 1-27-19-01 263 265 0.76 Blacktown (C) - South-East 1-27-19-02 178 183 2.81 Blacktown (C) - South-East 1-27-19-03 491 494 0.61 Blacktown (C) - South-East 1-27-19-04 536 550 2.61 Blacktown (C) - South-East 1-27-19-05 375 383 2.13 Blacktown (C) - South-East 1-27-19-06 600 599 -0.17 Blacktown (C) - South-East 1-27-19-07 418 423 1.20 Blacktown (C) - South-East 1-27-19-08 406 431 6.16 Blacktown (C) - South-East 1-27-19-09 582 604 3.78 Blacktown (C) - South-East 1-27-20-01 346 480 38.73 Blacktown (C) - South-East 1-27-20-02 361 362 0.28 Blacktown (C) - South-East 1-27-20-03 101 103 1.98 Blacktown (C) - South-East 1-27-20-04 400 406 1.50 Blacktown (C) - South-East 1-27-20-05 365 387 6.03 Blacktown (C) - South-East 1-27-20-06 195 197 1.03 Blacktown (C) - South-East 1-27-20-07 193 206 6.74 Blacktown (C) - South-East 1-27-20-08 473 484 2.33 Blacktown (C) - South-East 1-27-20-09 491 491 0.00 Blacktown (C) - South-East 1-27-20-10 382 382 0.00 Blacktown (C) - South-East 1-27-20-11 424 418 -1.42 Blacktown (C) - South-East 1-27-20-12 361 358 -0.83 Blacktown (C) - South-East 1-27-20-13 242 347 43.39 Blacktown (C) - South-East 1-27-20-14 377 381 1.06 Blacktown (C) - South-East 1-27-20-15 200 206 3.00 Blacktown (C) - South-East 1-27-21-01 383 375 -2.09 Blacktown (C) - South-East 1-27-21-02 320 321 0.31 Blacktown (C) - South-East 1-27-21-03 458 493 7.64 Blacktown (C) - South-East 1-27-21-04 503 510 1.39 Blacktown (C) - South-East 1-27-21-05 438 469 7.08 Blacktown (C) - South-East 1-27-21-06 673 723 7.43 Blacktown (C) - South-East 1-27-21-07 643 639 -0.62 Blacktown (C) - South-East 1-27-21-08 338 347 2.66 Blacktown (C) - South-East 1-27-21-09 345 354 2.61

New South Wales Redistribution Statistics 2006
Enrolment Projections Greenway
Actual Enrolment Estimate Growth SLA Name CCD Number 2/12/2005 31/5/2010 (%)
119
Blacktown (C) - South-East 1-27-21-10 369 363 -1.63 Blacktown (C) - South-East 1-27-21-11 267 275 3.00 Blacktown (C) - South-East 1-27-21-12 325 361 11.08 Blacktown (C) - South-East 1-27-22-01 624 630 0.96 Blacktown (C) - South-East 1-27-22-02 375 377 0.53 Blacktown (C) - South-East 1-27-22-03 539 552 2.41 Blacktown (C) - South-East 1-27-22-04 329 340 3.34 Blacktown (C) - South-East 1-27-22-05 571 578 1.23 Blacktown (C) - South-East 1-27-22-06 363 370 1.93 Blacktown (C) - South-East 1-27-22-07 504 515 2.18 Blacktown (C) - South-East 1-27-22-08 388 390 0.52 Blacktown (C) - South-East 1-27-22-09 312 309 -0.96 Blacktown (C) - South-East 1-27-22-10 598 590 -1.34 Blacktown (C) - South-East 1-27-22-11 432 433 0.23 Blacktown (C) - South-East 1-27-22-12 367 369 0.54 Blacktown (C) - South-East 1-27-22-13 151 148 -1.99 Blacktown (C) - South-East 1-27-24-03 261 261 0.00 Blacktown (C) - South-East 1-27-24-04 379 383 1.06 Blacktown (C) - South-East 1-27-24-05 529 534 0.95 Blacktown (C) - South-East 1-27-24-06 417 415 -0.48 Blacktown (C) - South-East 1-27-24-07 549 559 1.82 Blacktown (C) - South-East 1-27-24-08 304 308 1.32 Blacktown (C) - South-East 1-27-24-09 576 587 1.91 Blacktown (C) - South-East 1-27-24-10 389 398 2.31 Blacktown (C) - South-East 1-27-24-11 809 867 7.17 Blacktown (C) - South-East 1-27-24-12 419 421 0.48 Blacktown (C) - South-East 1-27-24-13 717 858 19.67 Blacktown (C) - South-East 1-27-25-09 6 6 0.00 Blacktown (C) - South-East 1-27-25-09 6 6 0.00 Blacktown (C) - South-East 1-27-26-01 505 508 0.59 Blacktown (C) - South-East 1-27-26-02 393 391 -0.51 Blacktown (C) - South-East 1-27-26-03 645 658 2.02 Blacktown (C) - South-East 1-27-26-04 388 388 0.00 Blacktown (C) - South-East 1-27-26-05 693 693 0.00 Blacktown (C) - South-East 1-27-26-06 551 570 3.45 Blacktown (C) - South-East 1-27-26-07 542 545 0.55 Blacktown (C) - South-East 1-27-26-08 330 368 11.52 Blacktown (C) - South-East 1-27-26-09 421 413 -1.90 Blacktown (C) - South-East 101 39779 41564 4.49

New South Wales Redistribution Statistics 2006
Enrolment Projections Greenway
Actual Enrolment Estimate Growth SLA Name CCD Number 2/12/2005 31/5/2010 (%)
120
Greenway 203 90988 101316 11.35

New South Wales Redistribution Statistics 2006
Enrolment Projections Gwydir
Actual Enrolment Estimate Growth SLA Name CCD Number 2/12/2005 31/5/2010 (%)
121
Bourke (A) 1-02-13-01 52 53 1.92 Bourke (A) 1-02-13-02 103 113 9.71 Bourke (A) 1-02-13-03 105 107 1.90 Bourke (A) 1-02-13-04 76 84 10.53 Bourke (A) 1-02-13-05 12 13 8.33 Bourke (A) 1-02-13-06 63 61 -3.17 Bourke (A) 1-02-14-01 21 22 4.76 Bourke (A) 1-02-14-02 17 16 -5.88 Bourke (A) 1-02-14-03 82 92 12.20 Bourke (A) 1-02-14-04 25 28 12.00 Bourke (A) 1-02-14-05 92 95 3.26 Bourke (A) 1-02-14-06 259 260 0.39 Bourke (A) 1-02-14-07 242 258 6.61 Bourke (A) 1-02-14-08 254 269 5.91 Bourke (A) 1-02-14-09 264 267 1.14 Bourke (A) 1-02-14-10 252 259 2.78 Bourke (A) 16 1919 1997 4.06 Brewarrina (A) 1-02-15-01 98 100 2.04 Brewarrina (A) 1-02-15-02 35 34 -2.86 Brewarrina (A) 1-02-15-03 59 61 3.39 Brewarrina (A) 1-02-15-04 115 120 4.35 Brewarrina (A) 1-02-16-01 53 52 -1.89 Brewarrina (A) 1-02-16-02 338 355 5.03 Brewarrina (A) 1-02-16-03 37 36 -2.70 Brewarrina (A) 1-02-16-04 37 37 0.00 Brewarrina (A) 1-02-16-05 59 62 5.08 Brewarrina (A) 1-02-16-06 178 193 8.43 Brewarrina (A) 10 1009 1050 4.06 Coonamble (A) 1-04-04-01 126 124 -1.59 Coonamble (A) 1-04-04-02 133 130 -2.26 Coonamble (A) 1-04-04-03 86 84 -2.33 Coonamble (A) 1-04-04-04 504 520 3.17 Coonamble (A) 1-04-04-05 307 317 3.26 Coonamble (A) 1-04-04-06 360 374 3.89 Coonamble (A) 1-04-04-07 421 431 2.38 Coonamble (A) 1-04-05-01 170 162 -4.71 Coonamble (A) 1-04-05-02 181 178 -1.66 Coonamble (A) 1-04-05-03 245 246 0.41 Coonamble (A) 1-04-05-04 87 90 3.45

New South Wales Redistribution Statistics 2006
Enrolment Projections Gwydir
Actual Enrolment Estimate Growth SLA Name CCD Number 2/12/2005 31/5/2010 (%)
122
Coonamble (A) 1-04-05-05 106 102 -3.77 Coonamble (A) 1-04-05-06 79 79 0.00 Coonamble (A) 13 2805 2837 1.14 Gilgandra (A) 1-03-16-01 134 131 -2.24 Gilgandra (A) 1-03-16-02 149 144 -3.36 Gilgandra (A) 1-03-16-03 296 304 2.70 Gilgandra (A) 1-03-16-04 198 195 -1.52 Gilgandra (A) 1-03-16-05 128 125 -2.34 Gilgandra (A) 1-03-16-06 126 128 1.59 Gilgandra (A) 1-03-16-07 114 118 3.51 Gilgandra (A) 1-03-16-08 133 129 -3.01 Gilgandra (A) 1-03-16-09 284 293 3.17 Gilgandra (A) 1-03-16-10 326 334 2.45 Gilgandra (A) 1-03-16-11 344 338 -1.74 Gilgandra (A) 1-03-16-12 528 532 0.76 Gilgandra (A) 1-03-16-13 102 101 -0.98 Gilgandra (A) 1-03-16-14 0 0 0.00 Gilgandra (A) 1-03-16-15 214 209 -2.34 Gilgandra (A) 15 3076 3081 0.16 Gunnedah (A) 1-04-23-01 82 80 -2.44 Gunnedah (A) 1-04-23-02 166 166 0.00 Gunnedah (A) 1-04-23-03 74 73 -1.35 Gunnedah (A) 1-04-23-04 238 238 0.00 Gunnedah (A) 1-04-23-05 104 104 0.00 Gunnedah (A) 1-04-23-06 108 101 -6.48 Gunnedah (A) 1-04-23-07 338 344 1.78 Gunnedah (A) 1-04-23-08 365 367 0.55 Gunnedah (A) 1-04-23-09 119 117 -1.68 Gunnedah (A) 1-04-24-01 70 66 -5.71 Gunnedah (A) 1-04-24-02 211 209 -0.95 Gunnedah (A) 1-04-24-03 249 249 0.00 Gunnedah (A) 1-04-24-04 159 151 -5.03 Gunnedah (A) 1-04-24-05 173 173 0.00 Gunnedah (A) 1-04-24-06 65 65 0.00 Gunnedah (A) 1-04-24-07 53 53 0.00 Gunnedah (A) 1-04-24-08 214 218 1.87 Gunnedah (A) 1-04-25-01 209 199 -4.78 Gunnedah (A) 1-04-25-02 147 150 2.04 Gunnedah (A) 1-04-25-03 197 205 4.06

New South Wales Redistribution Statistics 2006
Enrolment Projections Gwydir
Actual Enrolment Estimate Growth SLA Name CCD Number 2/12/2005 31/5/2010 (%)
123
Gunnedah (A) 1-04-25-04 433 432 -0.23 Gunnedah (A) 1-04-25-05 360 364 1.11 Gunnedah (A) 1-04-25-06 285 281 -1.40 Gunnedah (A) 1-04-25-07 283 285 0.71 Gunnedah (A) 1-04-25-08 498 503 1.00 Gunnedah (A) 1-04-25-09 527 524 -0.57 Gunnedah (A) 1-04-25-10 326 328 0.61 Gunnedah (A) 1-04-25-11 293 296 1.02 Gunnedah (A) 1-04-25-12 329 350 6.38 Gunnedah (A) 1-04-26-01 147 153 4.08 Gunnedah (A) 1-04-26-02 447 459 2.68 Gunnedah (A) 1-04-26-03 306 307 0.33 Gunnedah (A) 1-04-26-04 257 266 3.50 Gunnedah (A) 1-04-26-05 238 239 0.42 Gunnedah (A) 34 8070 8115 0.56 Gwydir (A) - Yallaroi 1-04-19-01 72 73 1.39 Gwydir (A) - Yallaroi 1-04-19-02 144 145 0.69 Gwydir (A) - Yallaroi 1-04-19-03 73 75 2.74 Gwydir (A) - Yallaroi 1-04-19-04 114 112 -1.75 Gwydir (A) - Yallaroi 1-04-19-05 138 138 0.00 Gwydir (A) - Yallaroi 1-04-19-06 549 540 -1.64 Gwydir (A) - Yallaroi 1-04-19-07 136 130 -4.41 Gwydir (A) - Yallaroi 1-04-19-08 130 127 -2.31 Gwydir (A) - Yallaroi 1-04-19-09 74 69 -6.76 Gwydir (A) - Yallaroi 1-04-19-10 99 91 -8.08 Gwydir (A) - Yallaroi 1-04-19-11 78 75 -3.85 Gwydir (A) - Yallaroi 1-04-19-12 100 103 3.00 Gwydir (A) - Yallaroi 1-04-19-13 118 117 -0.85 Gwydir (A) - Yallaroi 1-04-19-14 333 323 -3.00 Gwydir (A) - Yallaroi 14 2158 2118 -1.85 Lithgow (C) 1-14-25-05 96 91 -5.21 Lithgow (C) 1-14-25-06 62 63 1.61 Lithgow (C) 2 158 154 -2.53 Liverpool Plains (A) - Pt A 1-04-17-01 127 118 -7.09 Liverpool Plains (A) - Pt A 1-04-17-02 368 368 0.00 Liverpool Plains (A) - Pt A 1-04-17-03 533 536 0.56 Liverpool Plains (A) - Pt A 1-04-17-04 275 277 0.73

New South Wales Redistribution Statistics 2006
Enrolment Projections Gwydir
Actual Enrolment Estimate Growth SLA Name CCD Number 2/12/2005 31/5/2010 (%)
124
Liverpool Plains (A) - Pt A 1-04-17-05 343 338 -1.46 Liverpool Plains (A) - Pt A 1-04-17-06 201 206 2.49 Liverpool Plains (A) - Pt A 1-04-23-05 7 7 0.00 Liverpool Plains (A) - Pt A 1-04-23-05 7 8 14.29 Liverpool Plains (A) - Pt A 1-04-23-10 78 76 -2.56 Liverpool Plains (A) - Pt A 1-04-27-01 166 167 0.60 Liverpool Plains (A) - Pt A 1-04-27-02 161 164 1.86 Liverpool Plains (A) - Pt A 1-04-27-03 126 119 -5.56 Liverpool Plains (A) - Pt A 1-04-27-04 215 204 -5.12 Liverpool Plains (A) - Pt A 1-04-27-05 242 247 2.07 Liverpool Plains (A) - Pt A 1-04-27-06 209 200 -4.31 Liverpool Plains (A) - Pt A 1-04-27-07 150 153 2.00 Liverpool Plains (A) - Pt A 1-04-27-08 124 116 -6.45 Liverpool Plains (A) - Pt A 1-04-27-09 101 106 4.95 Liverpool Plains (A) - Pt A 1-04-27-10 51 48 -5.88 Liverpool Plains (A) - Pt A 19 3484 3458 -0.75 Liverpool Plains (A) - Pt B 1-13-01-01 116 114 -1.72 Liverpool Plains (A) - Pt B 1-13-01-02 204 204 0.00 Liverpool Plains (A) - Pt B 1-13-01-04 136 134 -1.47 Liverpool Plains (A) - Pt B 1-13-01-05 83 87 4.82 Liverpool Plains (A) - Pt B 4 539 539 0.00 Mid-Western Regional (A) - Pt 1-03-24-01 169 178 5.33 A Mid-Western Regional (A) - Pt 1-03-24-02 125 128 2.40 A Mid-Western Regional (A) - Pt 1-03-24-03 338 410 21.30 A Mid-Western Regional (A) - Pt 1-03-24-04 347 365 5.19 A Mid-Western Regional (A) - Pt 1-03-24-05 167 174 4.19 A Mid-Western Regional (A) - Pt 1-03-24-06 205 206 0.49 A Mid-Western Regional (A) - Pt 1-03-24-07 147 152 3.40 A Mid-Western Regional (A) - Pt 1-03-24-08 355 368 3.66 A Mid-Western Regional (A) - Pt 1-03-24-09 199 202 1.51 A

New South Wales Redistribution Statistics 2006
Enrolment Projections Gwydir
Actual Enrolment Estimate Growth SLA Name CCD Number 2/12/2005 31/5/2010 (%)
125
Mid-Western Regional (A) - Pt 1-03-25-01 479 504 5.22 A Mid-Western Regional (A) - Pt 1-03-25-02 413 421 1.94 A Mid-Western Regional (A) - Pt 1-03-25-03 187 191 2.14 A Mid-Western Regional (A) - Pt 1-03-25-04 403 409 1.49 A Mid-Western Regional (A) - Pt 1-03-25-05 290 293 1.03 A Mid-Western Regional (A) - Pt 1-03-25-06 255 254 -0.39 A Mid-Western Regional (A) - Pt 1-03-25-07 528 583 10.42 A Mid-Western Regional (A) - Pt 1-03-25-08 256 284 10.94 A Mid-Western Regional (A) - Pt 1-03-25-09 251 267 6.37 A Mid-Western Regional (A) - Pt 1-03-25-10 297 307 3.37 A Mid-Western Regional (A) - Pt 1-03-25-11 531 562 5.84 A Mid-Western Regional (A) - Pt 1-03-25-12 351 356 1.42 A Mid-Western Regional (A) - Pt 1-03-25-13 310 335 8.06 A Mid-Western Regional (A) - Pt 1-03-25-14 384 410 6.77 A Mid-Western Regional (A) - Pt 1-03-25-15 249 267 7.23 A Mid-Western Regional (A) - Pt 1-03-25-16 297 303 2.02 A Mid-Western Regional (A) - Pt 1-03-26-01 241 259 7.47 A Mid-Western Regional (A) - Pt 1-03-26-02 114 118 3.51 A Mid-Western Regional (A) - Pt 1-03-26-03 120 133 10.83 A Mid-Western Regional (A) - Pt 1-03-26-04 237 245 3.38 A Mid-Western Regional (A) - Pt 1-03-26-05 224 236 5.36 A Mid-Western Regional (A) - Pt 1-03-26-06 148 171 15.54

New South Wales Redistribution Statistics 2006
Enrolment Projections Gwydir
Actual Enrolment Estimate Growth SLA Name CCD Number 2/12/2005 31/5/2010 (%)
126
A Mid-Western Regional (A) - Pt 1-03-26-07 209 216 3.35 A Mid-Western Regional (A) - Pt 1-03-26-08 338 360 6.51 A Mid-Western Regional (A) - Pt 1-03-26-09 199 203 2.01 A Mid-Western Regional (A) - Pt 1-03-28-01 210 221 5.24 A Mid-Western Regional (A) - Pt 1-03-28-02 345 352 2.03 A Mid-Western Regional (A) - Pt 1-03-28-03 391 416 6.39 A Mid-Western Regional (A) - Pt 1-03-28-04 291 297 2.06 A Mid-Western Regional (A) - Pt 1-03-28-05 262 272 3.82 A Mid-Western Regional (A) - Pt 1-03-28-06 143 145 1.40 A Mid-Western Regional (A) - Pt 1-03-28-07 254 258 1.57 A Mid-Western Regional (A) - Pt 1-03-28-08 257 258 0.39 A Mid-Western Regional (A) - Pt 1-03-28-09 351 358 1.99 A Mid-Western Regional (A) - Pt 1-13-02-03 4 3 -25.00 A Mid-Western Regional (A) - Pt 1-13-02-03 3 4 33.33 A Mid-Western Regional (A) - Pt 1-13-02-08 74 78 5.41 A Mid-Western Regional (A) - Pt 1-13-02-09 20 21 5.00 A Mid-Western Regional (A) - Pt 47 11968 12553 4.89 A Mid-Western Regional (A) - Pt 1-14-25-01 190 197 3.68 B Mid-Western Regional (A) - Pt 1-14-25-02 146 141 -3.42 B Mid-Western Regional (A) - Pt 1-14-25-03 85 82 -3.53 B

New South Wales Redistribution Statistics 2006
Enrolment Projections Gwydir
Actual Enrolment Estimate Growth SLA Name CCD Number 2/12/2005 31/5/2010 (%)
127
Mid-Western Regional (A) - Pt 1-14-25-04 508 516 1.57 B Mid-Western Regional (A) - Pt 1-14-25-05 30 29 -3.33 B Mid-Western Regional (A) - Pt 1-14-25-06 91 95 4.40 B Mid-Western Regional (A) - Pt 1-14-25-07 263 259 -1.52 B Mid-Western Regional (A) - Pt 1-14-25-08 191 208 8.90 B Mid-Western Regional (A) - Pt 1-14-25-09 126 121 -3.97 B Mid-Western Regional (A) - Pt 1-14-25-10 167 165 -1.20 B Mid-Western Regional (A) - Pt 1-14-25-11 66 56 -15.15 B Mid-Western Regional (A) - Pt 1-14-25-12 453 448 -1.10 B Mid-Western Regional (A) - Pt 1-14-25-13 222 222 0.00 B Mid-Western Regional (A) - Pt 13 2538 2539 0.04 B Moree Plains (A) 1-04-14-01 72 69 -4.17 Moree Plains (A) 1-04-14-02 115 115 0.00 Moree Plains (A) 1-04-14-03 273 295 8.06 Moree Plains (A) 1-04-14-04 64 65 1.56 Moree Plains (A) 1-04-14-05 135 144 6.67 Moree Plains (A) 1-04-14-06 202 198 -1.98 Moree Plains (A) 1-04-14-07 69 69 0.00 Moree Plains (A) 1-04-14-08 318 325 2.20 Moree Plains (A) 1-04-14-09 51 51 0.00 Moree Plains (A) 1-04-15-01 93 91 -2.15 Moree Plains (A) 1-04-15-02 168 175 4.17 Moree Plains (A) 1-04-15-03 87 87 0.00 Moree Plains (A) 1-04-15-04 67 67 0.00 Moree Plains (A) 1-04-15-05 188 205 9.04 Moree Plains (A) 1-04-15-06 83 83 0.00 Moree Plains (A) 1-04-15-07 51 50 -1.96 Moree Plains (A) 1-04-15-08 79 78 -1.27 Moree Plains (A) 1-04-15-09 237 255 7.59 Moree Plains (A) 1-04-16-01 133 133 0.00
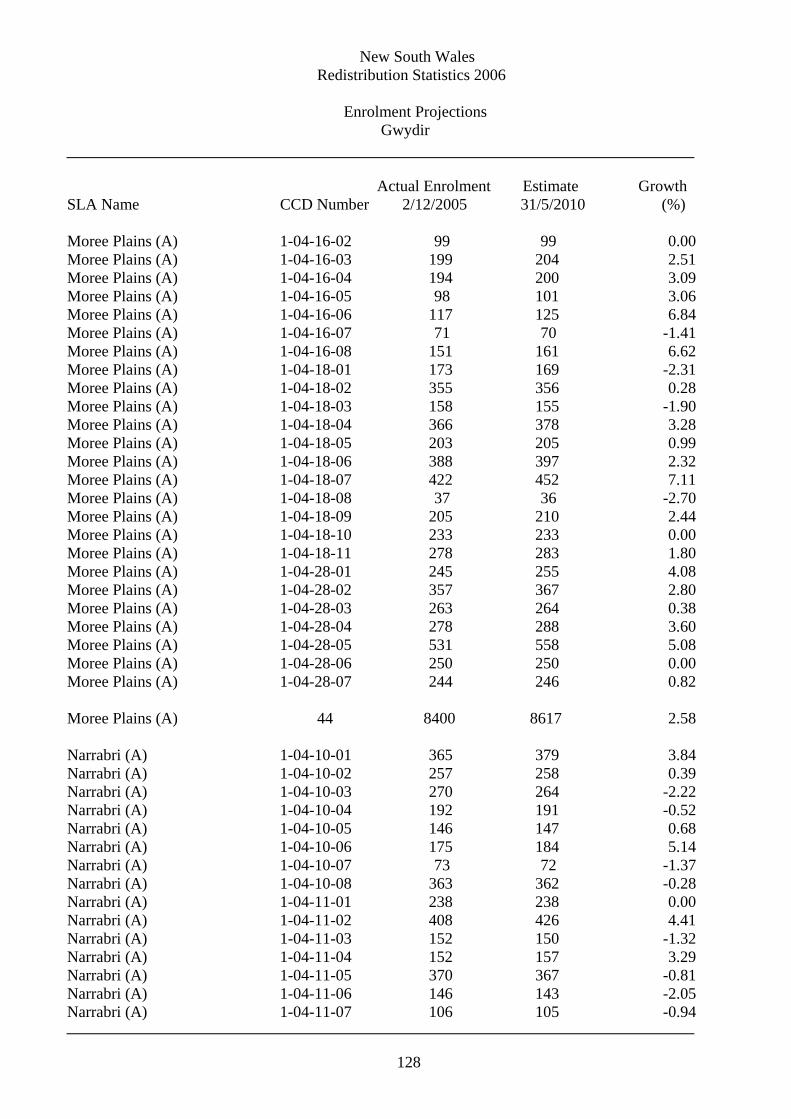
New South Wales Redistribution Statistics 2006
Enrolment Projections Gwydir
Actual Enrolment Estimate Growth SLA Name CCD Number 2/12/2005 31/5/2010 (%)
128
Moree Plains (A) 1-04-16-02 99 99 0.00 Moree Plains (A) 1-04-16-03 199 204 2.51 Moree Plains (A) 1-04-16-04 194 200 3.09 Moree Plains (A) 1-04-16-05 98 101 3.06 Moree Plains (A) 1-04-16-06 117 125 6.84 Moree Plains (A) 1-04-16-07 71 70 -1.41 Moree Plains (A) 1-04-16-08 151 161 6.62 Moree Plains (A) 1-04-18-01 173 169 -2.31 Moree Plains (A) 1-04-18-02 355 356 0.28 Moree Plains (A) 1-04-18-03 158 155 -1.90 Moree Plains (A) 1-04-18-04 366 378 3.28 Moree Plains (A) 1-04-18-05 203 205 0.99 Moree Plains (A) 1-04-18-06 388 397 2.32 Moree Plains (A) 1-04-18-07 422 452 7.11 Moree Plains (A) 1-04-18-08 37 36 -2.70 Moree Plains (A) 1-04-18-09 205 210 2.44 Moree Plains (A) 1-04-18-10 233 233 0.00 Moree Plains (A) 1-04-18-11 278 283 1.80 Moree Plains (A) 1-04-28-01 245 255 4.08 Moree Plains (A) 1-04-28-02 357 367 2.80 Moree Plains (A) 1-04-28-03 263 264 0.38 Moree Plains (A) 1-04-28-04 278 288 3.60 Moree Plains (A) 1-04-28-05 531 558 5.08 Moree Plains (A) 1-04-28-06 250 250 0.00 Moree Plains (A) 1-04-28-07 244 246 0.82 Moree Plains (A) 44 8400 8617 2.58 Narrabri (A) 1-04-10-01 365 379 3.84 Narrabri (A) 1-04-10-02 257 258 0.39 Narrabri (A) 1-04-10-03 270 264 -2.22 Narrabri (A) 1-04-10-04 192 191 -0.52 Narrabri (A) 1-04-10-05 146 147 0.68 Narrabri (A) 1-04-10-06 175 184 5.14 Narrabri (A) 1-04-10-07 73 72 -1.37 Narrabri (A) 1-04-10-08 363 362 -0.28 Narrabri (A) 1-04-11-01 238 238 0.00 Narrabri (A) 1-04-11-02 408 426 4.41 Narrabri (A) 1-04-11-03 152 150 -1.32 Narrabri (A) 1-04-11-04 152 157 3.29 Narrabri (A) 1-04-11-05 370 367 -0.81 Narrabri (A) 1-04-11-06 146 143 -2.05 Narrabri (A) 1-04-11-07 106 105 -0.94

New South Wales Redistribution Statistics 2006
Enrolment Projections Gwydir
Actual Enrolment Estimate Growth SLA Name CCD Number 2/12/2005 31/5/2010 (%)
129
Narrabri (A) 1-04-11-08 278 287 3.24 Narrabri (A) 1-04-11-09 291 300 3.09 Narrabri (A) 1-04-12-01 361 361 0.00 Narrabri (A) 1-04-12-02 292 298 2.05 Narrabri (A) 1-04-12-03 185 186 0.54 Narrabri (A) 1-04-12-04 315 315 0.00 Narrabri (A) 1-04-12-05 395 395 0.00 Narrabri (A) 1-04-12-06 300 304 1.33 Narrabri (A) 1-04-12-07 326 331 1.53 Narrabri (A) 1-04-12-08 234 222 -5.13 Narrabri (A) 1-04-12-09 483 480 -0.62 Narrabri (A) 1-04-12-10 359 353 -1.67 Narrabri (A) 1-04-12-11 406 427 5.17 Narrabri (A) 1-04-12-12 326 329 0.92 Narrabri (A) 1-04-13-01 89 88 -1.12 Narrabri (A) 1-04-13-02 91 92 1.10 Narrabri (A) 1-04-13-03 97 96 -1.03 Narrabri (A) 1-04-13-04 109 107 -1.83 Narrabri (A) 1-04-13-05 155 157 1.29 Narrabri (A) 1-04-13-06 107 104 -2.80 Narrabri (A) 1-04-13-07 159 163 2.52 Narrabri (A) 1-04-13-08 144 147 2.08 Narrabri (A) 37 8915 8985 0.79 Upper Hunter Shire (A) 1-13-01-03 327 330 0.92 Upper Hunter Shire (A) 1-13-01-05 143 150 4.90 Upper Hunter Shire (A) 1-13-01-06 293 290 -1.02 Upper Hunter Shire (A) 1-13-01-07 150 159 6.00 Upper Hunter Shire (A) 1-13-01-08 71 73 2.82 Upper Hunter Shire (A) 1-13-02-01 349 359 2.87 Upper Hunter Shire (A) 1-13-02-02 50 54 8.00 Upper Hunter Shire (A) 1-13-02-03 85 83 -2.35 Upper Hunter Shire (A) 1-13-02-04 160 164 2.50 Upper Hunter Shire (A) 1-13-02-05 204 227 11.27 Upper Hunter Shire (A) 1-13-02-06 316 313 -0.95 Upper Hunter Shire (A) 1-13-02-07 232 228 -1.72 Upper Hunter Shire (A) 1-13-02-08 2 2 0.00 Upper Hunter Shire (A) 1-13-02-09 70 72 2.86 Upper Hunter Shire (A) 1-13-03-01 166 167 0.60 Upper Hunter Shire (A) 1-13-03-02 193 196 1.55 Upper Hunter Shire (A) 1-13-03-03 510 524 2.75 Upper Hunter Shire (A) 1-13-03-04 498 519 4.22

New South Wales Redistribution Statistics 2006
Enrolment Projections Gwydir
Actual Enrolment Estimate Growth SLA Name CCD Number 2/12/2005 31/5/2010 (%)
130
Upper Hunter Shire (A) 1-13-03-05 246 252 2.44 Upper Hunter Shire (A) 1-13-03-06 376 379 0.80 Upper Hunter Shire (A) 1-13-03-07 462 500 8.23 Upper Hunter Shire (A) 1-13-03-08 403 409 1.49 Upper Hunter Shire (A) 1-13-03-09 289 310 7.27 Upper Hunter Shire (A) 1-13-03-10 111 112 0.90 Upper Hunter Shire (A) 1-13-03-11 439 446 1.59 Upper Hunter Shire (A) 1-13-03-12 100 98 -2.00 Upper Hunter Shire (A) 1-13-03-13 319 344 7.84 Upper Hunter Shire (A) 1-13-04-01 190 198 4.21 Upper Hunter Shire (A) 1-13-04-02 280 277 -1.07 Upper Hunter Shire (A) 1-13-04-03 61 61 0.00 Upper Hunter Shire (A) 1-13-04-04 572 584 2.10 Upper Hunter Shire (A) 1-13-04-05 191 194 1.57 Upper Hunter Shire (A) 1-13-04-06 162 169 4.32 Upper Hunter Shire (A) 1-13-04-07 239 255 6.69 Upper Hunter Shire (A) 1-13-04-08 617 647 4.86 Upper Hunter Shire (A) 1-13-04-09 163 177 8.59 Upper Hunter Shire (A) 36 9039 9322 3.13 Walgett (A) 1-04-01-01 44 47 6.82 Walgett (A) 1-04-01-02 88 80 -9.09 Walgett (A) 1-04-01-03 259 257 -0.77 Walgett (A) 1-04-01-04 161 156 -3.11 Walgett (A) 1-04-01-05 37 38 2.70 Walgett (A) 1-04-02-01 67 66 -1.49 Walgett (A) 1-04-02-02 259 239 -7.72 Walgett (A) 1-04-02-03 55 55 0.00 Walgett (A) 1-04-02-04 69 71 2.90 Walgett (A) 1-04-02-05 70 66 -5.71 Walgett (A) 1-04-02-06 375 363 -3.20 Walgett (A) 1-04-02-07 237 240 1.27 Walgett (A) 1-04-03-01 47 41 -12.77 Walgett (A) 1-04-03-02 82 79 -3.66 Walgett (A) 1-04-03-03 86 81 -5.81 Walgett (A) 1-04-03-04 125 131 4.80 Walgett (A) 1-04-03-05 43 42 -2.33 Walgett (A) 1-04-03-06 111 109 -1.80 Walgett (A) 1-04-03-07 133 130 -2.26 Walgett (A) 1-04-03-08 43 46 6.98 Walgett (A) 1-04-03-09 88 87 -1.14 Walgett (A) 1-04-29-01 258 229 -11.24

New South Wales Redistribution Statistics 2006
Enrolment Projections Gwydir
Actual Enrolment Estimate Growth SLA Name CCD Number 2/12/2005 31/5/2010 (%)
131
Walgett (A) 1-04-29-02 84 85 1.19 Walgett (A) 1-04-29-03 207 203 -1.93 Walgett (A) 1-04-29-04 82 79 -3.66 Walgett (A) 1-04-29-05 241 242 0.41 Walgett (A) 1-04-29-06 94 91 -3.19 Walgett (A) 1-04-29-07 133 125 -6.02 Walgett (A) 1-04-29-08 267 249 -6.74 Walgett (A) 1-04-29-09 173 175 1.16 Walgett (A) 30 4018 3902 -2.89 Warren (A) 1-03-14-02 81 77 -4.94 Warren (A) 1-03-14-03 73 73 0.00 Warren (A) 1-03-15-01 145 137 -5.52 Warren (A) 1-03-15-04 117 124 5.98 Warren (A) 1-03-15-05 87 88 1.15 Warren (A) 5 503 499 -0.80 Warrumbungle Shire (A) 1-04-06-01 114 108 -5.26 Warrumbungle Shire (A) 1-04-06-02 218 214 -1.83 Warrumbungle Shire (A) 1-04-06-03 170 172 1.18 Warrumbungle Shire (A) 1-04-06-04 91 90 -1.10 Warrumbungle Shire (A) 1-04-06-05 227 229 0.88 Warrumbungle Shire (A) 1-04-06-06 164 166 1.22 Warrumbungle Shire (A) 1-04-06-07 362 363 0.28 Warrumbungle Shire (A) 1-04-07-01 117 119 1.71 Warrumbungle Shire (A) 1-04-07-02 96 99 3.12 Warrumbungle Shire (A) 1-04-07-03 119 114 -4.20 Warrumbungle Shire (A) 1-04-07-04 213 209 -1.88 Warrumbungle Shire (A) 1-04-07-05 170 173 1.76 Warrumbungle Shire (A) 1-04-07-06 76 70 -7.89 Warrumbungle Shire (A) 1-04-07-07 128 135 5.47 Warrumbungle Shire (A) 1-04-07-08 312 315 0.96 Warrumbungle Shire (A) 1-04-08-01 232 230 -0.86 Warrumbungle Shire (A) 1-04-08-02 146 143 -2.05 Warrumbungle Shire (A) 1-04-08-03 376 385 2.39 Warrumbungle Shire (A) 1-04-08-04 309 313 1.29 Warrumbungle Shire (A) 1-04-08-05 484 475 -1.86 Warrumbungle Shire (A) 1-04-08-06 134 135 0.75 Warrumbungle Shire (A) 1-04-08-07 329 331 0.61 Warrumbungle Shire (A) 1-04-08-08 133 126 -5.26 Warrumbungle Shire (A) 1-04-08-09 184 181 -1.63

New South Wales Redistribution Statistics 2006
Enrolment Projections Gwydir
Actual Enrolment Estimate Growth SLA Name CCD Number 2/12/2005 31/5/2010 (%)
132
Warrumbungle Shire (A) 1-04-08-10 130 129 -0.77 Warrumbungle Shire (A) 1-04-08-11 258 260 0.78 Warrumbungle Shire (A) 1-04-09-01 129 129 0.00 Warrumbungle Shire (A) 1-04-09-02 452 455 0.66 Warrumbungle Shire (A) 1-04-09-03 63 61 -3.17 Warrumbungle Shire (A) 1-04-09-04 127 134 5.51 Warrumbungle Shire (A) 1-04-09-05 181 186 2.76 Warrumbungle Shire (A) 1-04-09-06 240 251 4.58 Warrumbungle Shire (A) 1-04-09-07 177 183 3.39 Warrumbungle Shire (A) 1-04-09-08 230 235 2.17 Warrumbungle Shire (A) 1-04-09-09 155 155 0.00 Warrumbungle Shire (A) 35 7046 7073 0.38 Wellington (A) 1-03-22-01 201 205 1.99 Wellington (A) 1-03-22-02 193 187 -3.11 Wellington (A) 1-03-22-03 176 175 -0.57 Wellington (A) 1-03-22-04 147 151 2.72 Wellington (A) 1-03-22-05 357 357 0.00 Wellington (A) 1-03-22-06 203 199 -1.97 Wellington (A) 1-03-22-07 228 223 -2.19 Wellington (A) 1-03-22-08 113 113 0.00 Wellington (A) 1-03-22-09 217 214 -1.38 Wellington (A) 1-03-22-10 114 109 -4.39 Wellington (A) 1-03-22-11 103 112 8.74 Wellington (A) 1-03-22-12 99 93 -6.06 Wellington (A) 1-03-22-13 146 137 -6.16 Wellington (A) 1-03-22-14 91 89 -2.20 Wellington (A) 1-03-22-15 112 120 7.14 Wellington (A) 1-03-23-01 408 419 2.70 Wellington (A) 1-03-23-02 499 507 1.60 Wellington (A) 1-03-23-03 357 359 0.56 Wellington (A) 1-03-23-04 263 261 -0.76 Wellington (A) 1-03-23-05 302 308 1.99 Wellington (A) 1-03-23-06 304 309 1.64 Wellington (A) 1-03-23-07 369 411 11.38 Wellington (A) 1-03-23-08 202 205 1.49 Wellington (A) 1-03-23-09 225 226 0.44 Wellington (A) 1-03-23-10 194 197 1.55 Wellington (A) 25 5623 5686 1.12

New South Wales Redistribution Statistics 2006
Enrolment Projections Gwydir
Actual Enrolment Estimate Growth SLA Name CCD Number 2/12/2005 31/5/2010 (%)
133
Gwydir 399 81268 82525 1.55

New South Wales Redistribution Statistics 2006
Enrolment Projections Hughes
Actual Enrolment Estimate Growth SLA Name CCD Number 2/12/2005 31/5/2010 (%)
134
Liverpool (C) 1-29-09-12 942 1040 10.40 Liverpool (C) 1-29-09-13 448 485 8.26 Liverpool (C) 1-29-10-01 481 513 6.65 Liverpool (C) 1-29-10-02 108 115 6.48 Liverpool (C) 1-29-10-03 664 702 5.72 Liverpool (C) 1-29-10-04 672 714 6.25 Liverpool (C) 1-29-10-05 704 759 7.81 Liverpool (C) 1-29-10-06 328 346 5.49 Liverpool (C) 1-29-10-07 485 509 4.95 Liverpool (C) 1-29-10-08 555 599 7.93 Liverpool (C) 1-29-10-09 429 444 3.50 Liverpool (C) 1-29-10-10 611 660 8.02 Liverpool (C) 1-29-10-11 603 644 6.80 Liverpool (C) 1-29-10-12 341 366 7.33 Liverpool (C) 1-29-10-13 465 491 5.59 Liverpool (C) 1-29-11-01 342 373 9.06 Liverpool (C) 1-29-11-02 446 472 5.83 Liverpool (C) 1-29-11-03 316 338 6.96 Liverpool (C) 1-29-11-04 604 658 8.94 Liverpool (C) 1-29-11-05 500 542 8.40 Liverpool (C) 1-29-11-06 311 333 7.07 Liverpool (C) 1-29-11-07 492 521 5.89 Liverpool (C) 1-29-11-08 434 487 12.21 Liverpool (C) 1-29-11-09 331 356 7.55 Liverpool (C) 1-29-11-10 295 329 11.53 Liverpool (C) 1-29-11-11 365 403 10.41 Liverpool (C) 1-29-11-12 398 432 8.54 Liverpool (C) 1-29-11-13 560 604 7.86 Liverpool (C) 1-29-11-14 522 561 7.47 Liverpool (C) 1-29-11-15 297 312 5.05 Liverpool (C) 1-29-12-01 473 506 6.98 Liverpool (C) 1-29-12-13 644 676 4.97 Liverpool (C) 1-29-12-14 334 351 5.09 Liverpool (C) 1-29-18-01 372 393 5.65 Liverpool (C) 1-29-18-02 420 450 7.14 Liverpool (C) 1-29-18-03 523 547 4.59 Liverpool (C) 1-29-18-04 377 398 5.57 Liverpool (C) 1-29-18-05 233 245 5.15 Liverpool (C) 1-29-18-06 193 208 7.77 Liverpool (C) 1-29-18-07 429 451 5.13 Liverpool (C) 1-29-18-08 4 4 0.00 Liverpool (C) 1-29-18-09 163 213 30.67 Liverpool (C) 1-29-18-10 578 612 5.88

New South Wales Redistribution Statistics 2006
Enrolment Projections Hughes
Actual Enrolment Estimate Growth SLA Name CCD Number 2/12/2005 31/5/2010 (%)
135
Liverpool (C) 1-29-18-11 434 471 8.53 Liverpool (C) 1-29-18-12 796 1072 34.67 Liverpool (C) 1-29-18-13 441 471 6.80 Liverpool (C) 46 20463 22176 8.37 NSW Water areas 1-31-01-04 0 0 0.00 NSW Water areas 1-31-08-13 0 0 0.00 NSW Water areas 2 0 0 0.00 Sutherland Shire (A) - West 1-31-01-01 579 649 12.09 Sutherland Shire (A) - West 1-31-01-02 461 467 1.30 Sutherland Shire (A) - West 1-31-01-03 853 882 3.40 Sutherland Shire (A) - West 1-31-01-05 449 463 3.12 Sutherland Shire (A) - West 1-31-01-06 630 650 3.17 Sutherland Shire (A) - West 1-31-01-07 534 543 1.69 Sutherland Shire (A) - West 1-31-01-08 956 971 1.57 Sutherland Shire (A) - West 1-31-01-09 720 718 -0.28 Sutherland Shire (A) - West 1-31-01-10 652 652 0.00 Sutherland Shire (A) - West 1-31-01-11 650 653 0.46 Sutherland Shire (A) - West 1-31-01-12 736 745 1.22 Sutherland Shire (A) - West 1-31-01-13 469 475 1.28 Sutherland Shire (A) - West 1-31-01-14 396 401 1.26 Sutherland Shire (A) - West 1-31-02-01 376 391 3.99 Sutherland Shire (A) - West 1-31-02-02 45 46 2.22 Sutherland Shire (A) - West 1-31-02-03 701 729 3.99 Sutherland Shire (A) - West 1-31-02-04 427 428 0.23 Sutherland Shire (A) - West 1-31-02-05 683 698 2.20 Sutherland Shire (A) - West 1-31-02-06 432 430 -0.46 Sutherland Shire (A) - West 1-31-02-07 651 668 2.61 Sutherland Shire (A) - West 1-31-02-08 338 348 2.96 Sutherland Shire (A) - West 1-31-02-09 587 591 0.68 Sutherland Shire (A) - West 1-31-02-10 335 362 8.06 Sutherland Shire (A) - West 1-31-02-11 490 499 1.84 Sutherland Shire (A) - West 1-31-02-12 520 527 1.35 Sutherland Shire (A) - West 1-31-03-01 509 510 0.20 Sutherland Shire (A) - West 1-31-03-02 282 276 -2.13 Sutherland Shire (A) - West 1-31-03-03 412 405 -1.70 Sutherland Shire (A) - West 1-31-03-04 566 586 3.53 Sutherland Shire (A) - West 1-31-03-05 534 536 0.37 Sutherland Shire (A) - West 1-31-03-06 684 690 0.88 Sutherland Shire (A) - West 1-31-03-07 517 530 2.51

New South Wales Redistribution Statistics 2006
Enrolment Projections Hughes
Actual Enrolment Estimate Growth SLA Name CCD Number 2/12/2005 31/5/2010 (%)
136
Sutherland Shire (A) - West 1-31-05-01 564 579 2.66
Sutherland Shire (A) - West 1-31-03-08 402 399 -0.75 Sutherland Shire (A) - West 1-31-03-09 482 490 1.66 Sutherland Shire (A) - West 1-31-03-10 477 483 1.26 Sutherland Shire (A) - West 1-31-03-11 400 430 7.50 Sutherland Shire (A) - West 1-31-03-12 371 374 0.81 Sutherland Shire (A) - West 1-31-04-01 110 215 95.45 Sutherland Shire (A) - West 1-31-04-02 613 692 12.89 Sutherland Shire (A) - West 1-31-04-03 344 498 44.77 Sutherland Shire (A) - West 1-31-04-04 372 439 18.01 Sutherland Shire (A) - West 1-31-04-05 578 686 18.69 Sutherland Shire (A) - West 1-31-04-06 10 10 0.00 Sutherland Shire (A) - West 1-31-04-07 362 351 -3.04 Sutherland Shire (A) - West 1-31-04-08 242 236 -2.48 Sutherland Shire (A) - West 1-31-04-09 711 734 3.23 Sutherland Shire (A) - West 1-31-04-10 423 424 0.24 Sutherland Shire (A) - West 1-31-04-11 578 613 6.06 Sutherland Shire (A) - West 1-31-04-12 270 263 -2.59 Sutherland Shire (A) - West 1-31-04-13 366 427 16.67 Sutherland Shire (A) - West 1-31-04-14 557 598 7.36
Sutherland Shire (A) - West 1-31-05-02 621 673 8.37 Sutherland Shire (A) - West 1-31-05-03 745 915 22.82 Sutherland Shire (A) - West 1-31-05-04 719 734 2.09 Sutherland Shire (A) - West 1-31-05-05 487 489 0.41 Sutherland Shire (A) - West 1-31-05-06 511 514 0.59 Sutherland Shire (A) - West 1-31-05-07 395 391 -1.01 Sutherland Shire (A) - West 1-31-05-08 470 465 -1.06 Sutherland Shire (A) - West 1-31-05-09 240 243 1.25 Sutherland Shire (A) - West 1-31-05-10 580 587 1.21 Sutherland Shire (A) - West 1-31-05-11 309 313 1.29 Sutherland Shire (A) - West 1-31-05-12 370 375 1.35 Sutherland Shire (A) - West 1-31-05-13 352 353 0.28 Sutherland Shire (A) - West 1-31-06-01 305 367 20.33 Sutherland Shire (A) - West 1-31-06-02 294 293 -0.34 Sutherland Shire (A) - West 1-31-06-03 700 699 -0.14 Sutherland Shire (A) - West 1-31-06-04 607 618 1.81 Sutherland Shire (A) - West 1-31-06-05 412 427 3.64 Sutherland Shire (A) - West 1-31-06-06 461 460 -0.22 Sutherland Shire (A) - West 1-31-06-07 523 571 9.18 Sutherland Shire (A) - West 1-31-06-08 578 579 0.17 Sutherland Shire (A) - West 1-31-06-09 364 362 -0.55 Sutherland Shire (A) - West 1-31-06-10 322 332 3.11 Sutherland Shire (A) - West 1-31-06-11 375 379 1.07

New South Wales Redistribution Statistics 2006
Enrolment Projections Hughes
Actual Enrolment Estimate Growth SLA Name CCD Number 2/12/2005 31/5/2010 (%)
137
Sutherland Shire (A) - West 1-31-06-12 280 281 0.36 Sutherland Shire (A) - West 1-31-06-13 317 313 -1.26 Sutherland Shire (A) - West 1-31-07-01 593 618 4.22 Sutherland Shire (A) - West 1-31-07-02 366 369 0.82 Sutherland Shire (A) - West 1-31-07-03 425 440 3.53 Sutherland Shire (A) - West 1-31-07-04 463 462 -0.22 Sutherland Shire (A) - West 1-31-07-05 434 432 -0.46 Sutherland Shire (A) - West 1-31-07-06 661 665 0.61 Sutherland Shire (A) - West 1-31-07-07 396 385 -2.78 Sutherland Shire (A) - West 1-31-07-08 582 605 3.95 Sutherland Shire (A) - West 1-31-07-09 246 244 -0.81 Sutherland Shire (A) - West 1-31-07-10 545 564 3.49 Sutherland Shire (A) - West 1-31-07-11 374 383 2.41 Sutherland Shire (A) - West 1-31-07-12 290 286 -1.38 Sutherland Shire (A) - West 1-31-07-13 338 342 1.18 Sutherland Shire (A) - West 1-31-08-01 487 497 2.05 Sutherland Shire (A) - West 1-31-08-02 371 370 -0.27 Sutherland Shire (A) - West 1-31-08-03 585 600 2.56 Sutherland Shire (A) - West 1-31-08-04 646 651 0.77 Sutherland Shire (A) - West 1-31-08-05 601 625 3.99 Sutherland Shire (A) - West 1-31-08-06 400 400 0.00 Sutherland Shire (A) - West 1-31-08-07 433 440 1.62 Sutherland Shire (A) - West 1-31-08-08 637 708 11.15 Sutherland Shire (A) - West 1-31-08-12 0 0 0.00 Sutherland Shire (A) - West 1-31-09-01 533 540 1.31 Sutherland Shire (A) - West 1-31-09-02 366 375 2.46 Sutherland Shire (A) - West 1-31-09-03 305 310 1.64 Sutherland Shire (A) - West 1-31-09-04 458 451 -1.53 Sutherland Shire (A) - West 1-31-09-09 0 0 0.00 Sutherland Shire (A) - West 1-31-09-10 372 382 2.69 Sutherland Shire (A) - West 1-31-09-11 575 584 1.57 Sutherland Shire (A) - West 1-31-09-13 310 309 -0.32 Sutherland Shire (A) - West 1-31-09-15 210 226 7.62 Sutherland Shire (A) - West 1-31-23-01 123 126 2.44 Sutherland Shire (A) - West 1-31-24-01 519 530 2.12 Sutherland Shire (A) - West 1-31-24-02 416 415 -0.24 Sutherland Shire (A) - West 1-31-24-03 32 32 0.00 Sutherland Shire (A) - West 1-31-24-04 575 579 0.70 Sutherland Shire (A) - West 1-31-24-05 562 564 0.36 Sutherland Shire (A) - West 1-31-24-06 217 224 3.23 Sutherland Shire (A) - West 1-31-24-07 678 753 11.06 Sutherland Shire (A) - West 1-31-24-08 632 639 1.11 Sutherland Shire (A) - West 1-31-24-09 623 625 0.32

New South Wales Redistribution Statistics 2006
Enrolment Projections Hughes
Actual Enrolment Estimate Growth SLA Name CCD Number 2/12/2005 31/5/2010 (%)
138
Sutherland Shire (A) - West 1-31-24-10 558 584 4.66 Sutherland Shire (A) - West 1-31-24-11 385 373 -3.12 Sutherland Shire (A) - West 1-31-24-12 574 582 1.39 Sutherland Shire (A) - West 1-31-24-13 599 593 -1.00 Sutherland Shire (A) - West 1-31-24-14 649 647 -0.31 Sutherland Shire (A) - West 1-31-24-15 930 986 6.02 Sutherland Shire (A) - West 1-31-24-16 446 494 10.76 Sutherland Shire (A) - West 1-31-24-17 512 536 4.69 Sutherland Shire (A) - West 1-31-24-18 452 460 1.77 Sutherland Shire (A) - West 1-31-24-19 652 656 0.61 Sutherland Shire (A) - West 1-31-25-01 490 523 6.73 Sutherland Shire (A) - West 1-31-25-02 276 277 0.36 Sutherland Shire (A) - West 1-31-25-03 718 719 0.14 Sutherland Shire (A) - West 1-31-25-04 470 510 8.51 Sutherland Shire (A) - West 1-31-25-05 656 651 -0.76 Sutherland Shire (A) - West 1-31-25-06 607 608 0.16 Sutherland Shire (A) - West 1-31-25-07 600 614 2.33 Sutherland Shire (A) - West 1-31-25-08 658 651 -1.06 Sutherland Shire (A) - West 1-31-25-09 165 165 0.00 Sutherland Shire (A) - West 1-31-25-10 706 713 0.99 Sutherland Shire (A) - West 1-31-25-11 625 638 2.08 Sutherland Shire (A) - West 139 65850 67923 3.15 Hughes 187 86313 90099 4.39

New South Wales Redistribution Statistics 2006
Enrolment Projections Hume
Actual Enrolment Estimate Growth SLA Name CCD Number 2/12/2005 31/5/2010 (%)
139
Boorowa (A) 1-15-16-01 105 106 0.95 Boorowa (A) 1-15-16-02 48 56 16.67 Boorowa (A) 1-15-16-03 176 182 3.41 Boorowa (A) 1-15-16-04 130 134 3.08 Boorowa (A) 1-15-16-05 125 134 7.20 Boorowa (A) 1-15-16-06 132 135 2.27 Boorowa (A) 1-15-16-07 320 342 6.88 Boorowa (A) 1-15-16-08 534 564 5.62 Boorowa (A) 1-15-16-09 89 85 -4.49 Boorowa (A) 1-15-16-10 124 135 8.87 Boorowa (A) 10 1783 1873 5.05 Goulburn Mulwaree (A) - 1-20-03-01 793 865 9.08 Goulburn Goulburn Mulwaree (A) - 1-20-03-02 45 52 15.56 Goulburn Goulburn Mulwaree (A) - 1-20-03-03 462 454 -1.73 Goulburn Goulburn Mulwaree (A) - 1-20-03-04 534 547 2.43 Goulburn Goulburn Mulwaree (A) - 1-20-03-05 540 551 2.04 Goulburn Goulburn Mulwaree (A) - 1-20-03-06 387 383 -1.03 Goulburn Goulburn Mulwaree (A) - 1-20-03-07 344 337 -2.03 Goulburn Goulburn Mulwaree (A) - 1-20-03-08 364 375 3.02 Goulburn Goulburn Mulwaree (A) - 1-20-03-09 166 164 -1.20 Goulburn Goulburn Mulwaree (A) - 1-20-03-10 286 293 2.45 Goulburn Goulburn Mulwaree (A) - 1-20-03-11 246 254 3.25 Goulburn Goulburn Mulwaree (A) - 1-20-03-12 330 324 -1.82 Goulburn Goulburn Mulwaree (A) - 1-20-03-13 602 698 15.95 Goulburn Goulburn Mulwaree (A) - 1-20-04-01 197 220 11.68 Goulburn Goulburn Mulwaree (A) - 1-20-04-02 184 183 -0.54

New South Wales Redistribution Statistics 2006
Enrolment Projections Hume
Actual Enrolment Estimate Growth SLA Name CCD Number 2/12/2005 31/5/2010 (%)
140
Goulburn Goulburn Mulwaree (A) - 1-20-04-03 386 402 4.15 Goulburn Goulburn Mulwaree (A) - 1-20-04-04 263 261 -0.76 Goulburn Goulburn Mulwaree (A) - 1-20-04-05 424 429 1.18 Goulburn Goulburn Mulwaree (A) - 1-20-04-06 172 182 5.81 Goulburn Goulburn Mulwaree (A) - 1-20-04-07 446 448 0.45 Goulburn Goulburn Mulwaree (A) - 1-20-04-08 413 416 0.73 Goulburn Goulburn Mulwaree (A) - 1-20-04-09 455 469 3.08 Goulburn Goulburn Mulwaree (A) - 1-20-04-10 386 385 -0.26 Goulburn Goulburn Mulwaree (A) - 1-20-04-11 321 318 -0.93 Goulburn Goulburn Mulwaree (A) - 1-20-04-12 252 242 -3.97 Goulburn Goulburn Mulwaree (A) - 1-20-04-13 355 465 30.99 Goulburn Goulburn Mulwaree (A) - 1-20-04-14 356 361 1.40 Goulburn Goulburn Mulwaree (A) - 1-20-05-01 347 358 3.17 Goulburn Goulburn Mulwaree (A) - 1-20-05-02 497 500 0.60 Goulburn Goulburn Mulwaree (A) - 1-20-05-03 408 413 1.23 Goulburn Goulburn Mulwaree (A) - 1-20-05-04 364 358 -1.65 Goulburn Goulburn Mulwaree (A) - 1-20-05-05 202 196 -2.97 Goulburn Goulburn Mulwaree (A) - 1-20-05-06 209 208 -0.48 Goulburn Goulburn Mulwaree (A) - 1-20-05-07 300 293 -2.33 Goulburn Goulburn Mulwaree (A) - 1-20-05-08 272 267 -1.84 Goulburn Goulburn Mulwaree (A) - 1-20-05-09 262 257 -1.91

New South Wales Redistribution Statistics 2006
Enrolment Projections Hume
Actual Enrolment Estimate Growth SLA Name CCD Number 2/12/2005 31/5/2010 (%)
141
Goulburn Goulburn Mulwaree (A) - 1-20-05-10 222 218 -1.80 Goulburn Goulburn Mulwaree (A) - 1-20-05-11 263 271 3.04 Goulburn Goulburn Mulwaree (A) - 1-20-05-12 215 218 1.40 Goulburn Goulburn Mulwaree (A) - 1-20-05-13 538 569 5.76 Goulburn Goulburn Mulwaree (A) - 40 13808 14204 2.87 Goulburn Goulburn Mulwaree (A) Bal 1-20-01-01 332 396 19.28 Goulburn Mulwaree (A) Bal 1-20-01-02 428 563 31.54 Goulburn Mulwaree (A) Bal 1-20-01-03 337 366 8.61 Goulburn Mulwaree (A) Bal 1-20-01-04 465 530 13.98 Goulburn Mulwaree (A) Bal 1-20-01-05 374 418 11.76 Goulburn Mulwaree (A) Bal 1-20-01-06 33 39 18.18 Goulburn Mulwaree (A) Bal 1-20-01-06 34 39 14.71 Goulburn Mulwaree (A) Bal 1-20-01-07 291 309 6.19 Goulburn Mulwaree (A) Bal 1-20-01-08 461 527 14.32 Goulburn Mulwaree (A) Bal 1-20-01-09 195 225 15.38 Goulburn Mulwaree (A) Bal 1-20-01-10 99 110 11.11 Goulburn Mulwaree (A) Bal 1-20-02-01 276 289 4.71 Goulburn Mulwaree (A) Bal 1-20-02-04 27 27 0.00 Goulburn Mulwaree (A) Bal 1-20-02-05 58 55 -5.17 Goulburn Mulwaree (A) Bal 1-20-02-06 238 322 35.29 Goulburn Mulwaree (A) Bal 1-20-02-07 343 358 4.37 Goulburn Mulwaree (A) Bal 1-20-02-08 157 173 10.19 Goulburn Mulwaree (A) Bal 17 4148 4746 14.42 Harden (A) 1-15-15-01 206 207 0.49 Harden (A) 1-15-15-02 279 281 0.72 Harden (A) 1-15-15-03 187 188 0.53 Harden (A) 1-15-15-04 246 254 3.25 Harden (A) 1-15-15-05 144 142 -1.39 Harden (A) 1-15-15-06 92 89 -3.26 Harden (A) 1-15-15-07 163 165 1.23 Harden (A) 1-15-15-08 97 93 -4.12 Harden (A) 1-15-15-09 76 76 0.00

New South Wales Redistribution Statistics 2006
Enrolment Projections Hume
Actual Enrolment Estimate Growth SLA Name CCD Number 2/12/2005 31/5/2010 (%)
142
Harden (A) 1-15-15-10 118 123 4.24 Harden (A) 1-15-15-11 333 326 -2.10 Harden (A) 1-15-15-12 454 475 4.63 Harden (A) 1-15-15-13 381 385 1.05 Harden (A) 13 2776 2804 1.01 Palerang (A) - Pt B 1-15-21-09 58 66 13.79 Palerang (A) - Pt B 1-20-01-06 83 95 14.46 Palerang (A) - Pt B 1-20-01-07 20 21 5.00 Palerang (A) - Pt B 1-20-01-07 20 21 5.00 Palerang (A) - Pt B 4 181 203 12.15 Upper Lachlan (A) 1-15-19-01 169 165 -2.37 Upper Lachlan (A) 1-15-19-02 75 84 12.00 Upper Lachlan (A) 1-15-19-03 136 135 -0.74 Upper Lachlan (A) 1-15-19-04 119 117 -1.68 Upper Lachlan (A) 1-15-19-05 155 178 14.84 Upper Lachlan (A) 1-15-19-06 126 144 14.29 Upper Lachlan (A) 1-15-19-07 106 119 12.26 Upper Lachlan (A) 1-15-19-08 74 75 1.35 Upper Lachlan (A) 1-15-20-01 134 131 -2.24 Upper Lachlan (A) 1-15-20-02 299 340 13.71 Upper Lachlan (A) 1-15-20-03 207 209 0.97 Upper Lachlan (A) 1-15-20-04 381 423 11.02 Upper Lachlan (A) 1-15-20-05 443 438 -1.13 Upper Lachlan (A) 1-15-20-06 460 456 -0.87 Upper Lachlan (A) 1-15-20-07 302 295 -2.32 Upper Lachlan (A) 1-15-20-08 109 122 11.93 Upper Lachlan (A) 1-15-21-01 156 157 0.64 Upper Lachlan (A) 1-15-21-02 74 73 -1.35 Upper Lachlan (A) 1-15-21-03 142 157 10.56 Upper Lachlan (A) 1-15-21-04 117 128 9.40 Upper Lachlan (A) 1-15-21-05 131 145 10.69 Upper Lachlan (A) 1-15-21-06 355 350 -1.41 Upper Lachlan (A) 1-15-21-07 131 130 -0.76 Upper Lachlan (A) 1-15-21-08 75 78 4.00 Upper Lachlan (A) 1-15-21-09 77 85 10.39 Upper Lachlan (A) 1-20-01-07 16 18 12.50 Upper Lachlan (A) 1-20-02-02 165 162 -1.82 Upper Lachlan (A) 1-20-02-03 203 224 10.34

New South Wales Redistribution Statistics 2006
Enrolment Projections Hume
Actual Enrolment Estimate Growth SLA Name CCD Number 2/12/2005 31/5/2010 (%)
143
Upper Lachlan (A) 1-20-02-04 189 189 0.00 Upper Lachlan (A) 1-20-02-05 97 93 -4.12 Upper Lachlan (A) 1-20-02-07 79 83 5.06 Upper Lachlan (A) 1-20-02-07 0 0 0.00 Upper Lachlan (A) 1-20-02-08 58 65 12.07 Upper Lachlan (A) 33 5360 5568 3.88 Wingecarribee (A) 1-20-06-01 385 409 6.23 Wingecarribee (A) 1-20-06-02 163 167 2.45 Wingecarribee (A) 1-20-06-03 343 372 8.45 Wingecarribee (A) 1-20-06-04 216 224 3.70 Wingecarribee (A) 1-20-06-05 302 315 4.30 Wingecarribee (A) 1-20-06-06 772 781 1.17 Wingecarribee (A) 1-20-06-07 597 647 8.38 Wingecarribee (A) 1-20-06-08 164 159 -3.05 Wingecarribee (A) 1-20-06-09 229 258 12.66 Wingecarribee (A) 1-20-06-10 651 662 1.69 Wingecarribee (A) 1-20-06-11 498 529 6.22 Wingecarribee (A) 1-20-06-12 605 648 7.11 Wingecarribee (A) 1-20-06-13 478 526 10.04 Wingecarribee (A) 1-20-06-14 109 115 5.50 Wingecarribee (A) 1-20-07-03 449 484 7.80 Wingecarribee (A) 1-20-07-05 0 0 0.00 Wingecarribee (A) 1-20-09-01 244 252 3.28 Wingecarribee (A) 1-20-09-02 240 245 2.08 Wingecarribee (A) 1-20-09-03 409 422 3.18 Wingecarribee (A) 1-20-09-04 317 327 3.15 Wingecarribee (A) 1-20-09-05 325 343 5.54 Wingecarribee (A) 1-20-09-06 312 324 3.85 Wingecarribee (A) 1-20-09-07 309 319 3.24 Wingecarribee (A) 1-20-09-08 213 220 3.29 Wingecarribee (A) 1-20-09-09 392 404 3.06 Wingecarribee (A) 1-20-10-01 530 562 6.04 Wingecarribee (A) 1-20-10-02 533 538 0.94 Wingecarribee (A) 1-20-10-03 413 416 0.73 Wingecarribee (A) 1-20-10-04 187 205 9.63 Wingecarribee (A) 1-20-10-05 344 347 0.87 Wingecarribee (A) 1-20-10-06 418 480 14.83 Wingecarribee (A) 1-20-10-07 352 361 2.56 Wingecarribee (A) 1-20-10-08 253 266 5.14 Wingecarribee (A) 1-20-10-09 310 311 0.32

New South Wales Redistribution Statistics 2006
Enrolment Projections Hume
Actual Enrolment Estimate Growth SLA Name CCD Number 2/12/2005 31/5/2010 (%)
144
Wingecarribee (A) 1-20-10-10 501 576 14.97 Wingecarribee (A) 1-20-10-11 411 424 3.16 Wingecarribee (A) 1-20-10-12 185 196 5.95 Wingecarribee (A) 1-20-10-14 659 746 13.20 Wingecarribee (A) 1-20-11-01 227 243 7.05 Wingecarribee (A) 1-20-11-02 410 408 -0.49 Wingecarribee (A) 1-20-11-03 456 522 14.47 Wingecarribee (A) 1-20-11-04 530 587 10.75 Wingecarribee (A) 1-20-11-05 486 500 2.88 Wingecarribee (A) 1-20-11-06 607 929 53.05 Wingecarribee (A) 1-20-11-07 508 526 3.54 Wingecarribee (A) 1-20-11-08 211 221 4.74 Wingecarribee (A) 1-20-11-09 157 160 1.91 Wingecarribee (A) 1-20-11-10 263 274 4.18 Wingecarribee (A) 1-20-11-11 264 268 1.52 Wingecarribee (A) 1-20-11-12 1222 1498 22.59 Wingecarribee (A) 50 19159 20716 8.13 Wollondilly (A) 1-20-12-01 393 415 5.60 Wollondilly (A) 1-20-12-02 397 410 3.27 Wollondilly (A) 1-20-12-03 865 927 7.17 Wollondilly (A) 1-20-12-04 200 229 14.50 Wollondilly (A) 1-20-12-05 669 801 19.73 Wollondilly (A) 1-20-12-06 538 647 20.26 Wollondilly (A) 1-20-12-07 542 575 6.09 Wollondilly (A) 1-20-12-08 623 708 13.64 Wollondilly (A) 1-20-12-09 447 477 6.71 Wollondilly (A) 1-20-12-10 383 421 9.92 Wollondilly (A) 1-20-12-11 132 138 4.55 Wollondilly (A) 1-20-13-01 845 1100 30.18 Wollondilly (A) 1-20-13-02 37 76 105.41 Wollondilly (A) 1-20-13-02 70 100 42.86 Wollondilly (A) 1-20-13-03 776 885 14.05 Wollondilly (A) 1-20-13-04 227 246 8.37 Wollondilly (A) 1-20-13-05 359 376 4.74 Wollondilly (A) 1-20-13-06 228 483 111.84 Wollondilly (A) 1-20-13-07 510 554 8.63 Wollondilly (A) 1-20-13-08 512 937 83.01 Wollondilly (A) 1-20-13-09 295 313 6.10 Wollondilly (A) 1-20-13-10 362 384 6.08 Wollondilly (A) 1-20-13-11 173 189 9.25

New South Wales Redistribution Statistics 2006
Enrolment Projections Hume
Actual Enrolment Estimate Growth SLA Name CCD Number 2/12/2005 31/5/2010 (%)
145
Wollondilly (A) 1-20-13-12 421 440 4.51 Wollondilly (A) 1-20-14-01 174 192 10.34 Wollondilly (A) 1-20-14-02 629 822 30.68 Wollondilly (A) 1-20-14-03 220 233 5.91 Wollondilly (A) 1-20-14-04 366 396 8.20 Wollondilly (A) 1-20-14-05 635 672 5.83 Wollondilly (A) 1-20-14-06 530 570 7.55 Wollondilly (A) 1-20-14-07 259 286 10.42 Wollondilly (A) 1-20-14-08 451 472 4.66 Wollondilly (A) 1-20-14-09 450 490 8.89 Wollondilly (A) 1-20-14-10 283 297 4.95 Wollondilly (A) 1-20-14-11 333 368 10.51 Wollondilly (A) 1-20-15-01 413 482 16.71 Wollondilly (A) 1-20-15-02 430 461 7.21 Wollondilly (A) 1-20-15-03 457 505 10.50 Wollondilly (A) 1-20-15-04 162 168 3.70 Wollondilly (A) 1-20-15-05 693 766 10.53 Wollondilly (A) 1-20-15-06 527 572 8.54 Wollondilly (A) 1-20-15-07 236 257 8.90 Wollondilly (A) 1-20-15-08 503 575 14.31 Wollondilly (A) 1-20-15-09 467 564 20.77 Wollondilly (A) 1-20-15-10 248 277 11.69 Wollondilly (A) 1-20-15-11 718 845 17.69 Wollondilly (A) 1-20-16-01 788 872 10.66 Wollondilly (A) 1-20-16-02 534 587 9.93 Wollondilly (A) 1-20-16-03 567 657 15.87 Wollondilly (A) 1-20-16-04 382 414 8.38 Wollondilly (A) 1-20-16-05 603 638 5.80 Wollondilly (A) 1-20-16-06 332 405 21.99 Wollondilly (A) 1-20-16-07 152 236 55.26 Wollondilly (A) 1-20-16-08 367 390 6.27 Wollondilly (A) 1-20-16-09 902 976 8.20 Wollondilly (A) 1-20-16-10 351 389 10.83 Wollondilly (A) 1-20-16-11 247 274 10.93 Wollondilly (A) 1-20-16-12 400 460 15.00 Wollondilly (A) 1-20-16-13 321 340 5.92 Wollondilly (A) 1-20-16-14 682 750 9.97 Wollondilly (A) 60 25816 29489 14.23 Yass Valley (A) - Pt B 1-15-21-08 178 185 3.93 Yass Valley (A) - Pt B 1-15-21-09 176 195 10.80
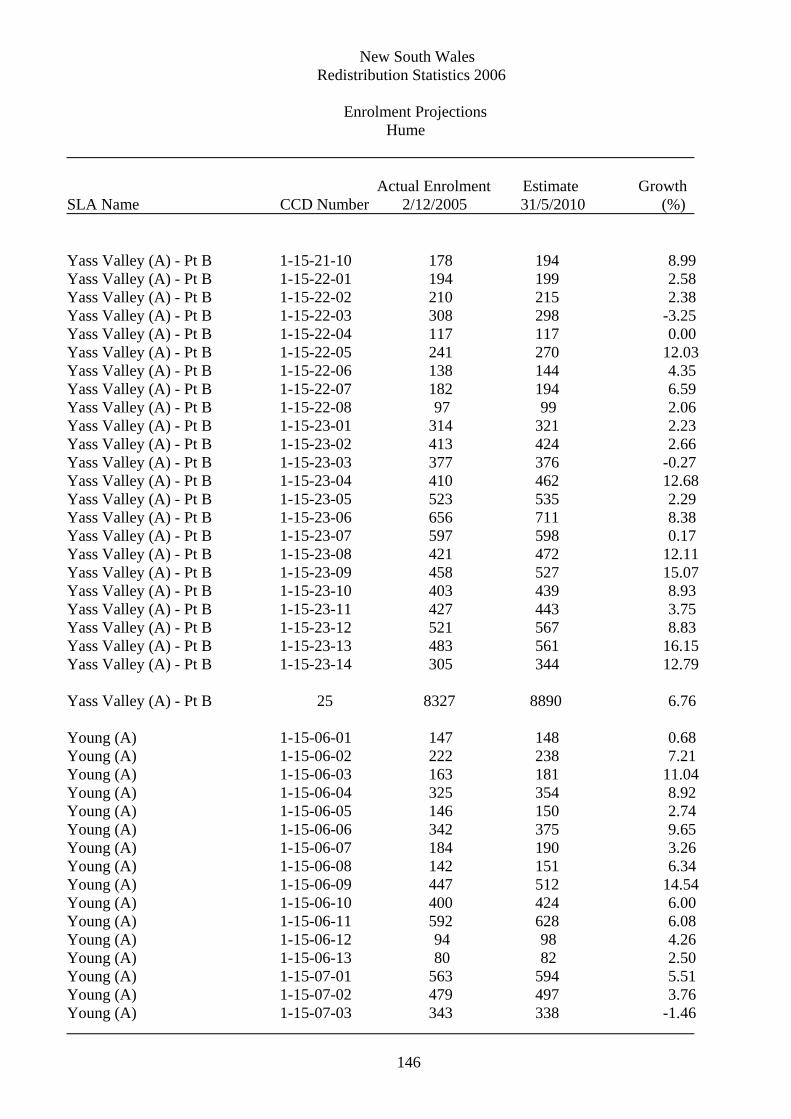
New South Wales Redistribution Statistics 2006
Enrolment Projections Hume
Actual Enrolment Estimate Growth SLA Name CCD Number 2/12/2005 31/5/2010 (%)
146
Yass Valley (A) - Pt B 1-15-21-10 178 194 8.99 Yass Valley (A) - Pt B 1-15-22-01 194 199 2.58 Yass Valley (A) - Pt B 1-15-22-02 210 215 2.38 Yass Valley (A) - Pt B 1-15-22-03 308 298 -3.25 Yass Valley (A) - Pt B 1-15-22-04 117 117 0.00 Yass Valley (A) - Pt B 1-15-22-05 241 270 12.03 Yass Valley (A) - Pt B 1-15-22-06 138 144 4.35 Yass Valley (A) - Pt B 1-15-22-07 182 194 6.59 Yass Valley (A) - Pt B 1-15-22-08 97 99 2.06 Yass Valley (A) - Pt B 1-15-23-01 314 321 2.23 Yass Valley (A) - Pt B 1-15-23-02 413 424 2.66 Yass Valley (A) - Pt B 1-15-23-03 377 376 -0.27 Yass Valley (A) - Pt B 1-15-23-04 410 462 12.68 Yass Valley (A) - Pt B 1-15-23-05 523 535 2.29 Yass Valley (A) - Pt B 1-15-23-06 656 711 8.38 Yass Valley (A) - Pt B 1-15-23-07 597 598 0.17 Yass Valley (A) - Pt B 1-15-23-08 421 472 12.11 Yass Valley (A) - Pt B 1-15-23-09 458 527 15.07 Yass Valley (A) - Pt B 1-15-23-10 403 439 8.93 Yass Valley (A) - Pt B 1-15-23-11 427 443 3.75 Yass Valley (A) - Pt B 1-15-23-12 521 567 8.83 Yass Valley (A) - Pt B 1-15-23-13 483 561 16.15 Yass Valley (A) - Pt B 1-15-23-14 305 344 12.79 Yass Valley (A) - Pt B 25 8327 8890 6.76 Young (A) 1-15-06-01 147 148 0.68 Young (A) 1-15-06-02 222 238 7.21 Young (A) 1-15-06-03 163 181 11.04 Young (A) 1-15-06-04 325 354 8.92 Young (A) 1-15-06-05 146 150 2.74 Young (A) 1-15-06-06 342 375 9.65 Young (A) 1-15-06-07 184 190 3.26 Young (A) 1-15-06-08 142 151 6.34 Young (A) 1-15-06-09 447 512 14.54 Young (A) 1-15-06-10 400 424 6.00 Young (A) 1-15-06-11 592 628 6.08 Young (A) 1-15-06-12 94 98 4.26 Young (A) 1-15-06-13 80 82 2.50 Young (A) 1-15-07-01 563 594 5.51 Young (A) 1-15-07-02 479 497 3.76 Young (A) 1-15-07-03 343 338 -1.46

New South Wales Redistribution Statistics 2006
Enrolment Projections Hume
Actual Enrolment Estimate Growth SLA Name CCD Number 2/12/2005 31/5/2010 (%)
147
Young (A) 1-15-07-04 131 128 -2.29 Young (A) 1-15-07-05 341 357 4.69 Young (A) 1-15-07-06 246 259 5.28 Young (A) 1-15-07-07 407 422 3.69 Young (A) 1-15-07-08 378 398 5.29 Young (A) 1-15-07-09 627 706 12.60 Young (A) 1-15-07-10 568 602 5.99 Young (A) 1-15-07-11 397 422 6.30 Young (A) 1-15-07-12 415 429 3.37 Young (A) 25 8179 8683 6.16 Hume 277 89537 97176 8.53

New South Wales Redistribution Statistics 2006
Enrolment Projections Hunter
Actual Enrolment Estimate Growth SLA Name CCD Number 2/12/2005 31/5/2010 (%)
148
Cessnock (C) 1-13-12-01 205 266 29.76 Cessnock (C) 1-13-12-02 369 402 8.94 Cessnock (C) 1-13-12-03 412 433 5.10 Cessnock (C) 1-13-12-04 172 199 15.70 Cessnock (C) 1-13-12-05 421 468 11.16 Cessnock (C) 1-13-12-06 532 578 8.65 Cessnock (C) 1-13-12-07 235 249 5.96 Cessnock (C) 1-13-12-08 349 370 6.02 Cessnock (C) 1-13-12-09 212 223 5.19 Cessnock (C) 1-13-12-10 285 291 2.11 Cessnock (C) 1-13-12-11 528 568 7.58 Cessnock (C) 1-13-12-12 301 339 12.62 Cessnock (C) 1-13-12-13 259 274 5.79 Cessnock (C) 1-13-13-01 339 353 4.13 Cessnock (C) 1-13-13-02 398 397 -0.25 Cessnock (C) 1-13-13-03 752 950 26.33 Cessnock (C) 1-13-13-04 295 296 0.34 Cessnock (C) 1-13-13-05 374 374 0.00 Cessnock (C) 1-13-13-06 455 473 3.96 Cessnock (C) 1-13-13-07 345 353 2.32 Cessnock (C) 1-13-13-08 599 613 2.34 Cessnock (C) 1-13-13-09 407 422 3.69 Cessnock (C) 1-13-13-10 283 298 5.30 Cessnock (C) 1-13-14-01 268 296 10.45 Cessnock (C) 1-13-14-02 331 348 5.14 Cessnock (C) 1-13-14-03 163 168 3.07 Cessnock (C) 1-13-14-04 468 482 2.99 Cessnock (C) 1-13-14-05 443 458 3.39 Cessnock (C) 1-13-14-06 413 425 2.91 Cessnock (C) 1-13-14-07 260 278 6.92 Cessnock (C) 1-13-14-08 481 486 1.04 Cessnock (C) 1-13-14-09 341 359 5.28 Cessnock (C) 1-13-14-10 457 474 3.72 Cessnock (C) 1-13-15-01 348 368 5.75 Cessnock (C) 1-13-15-02 141 158 12.06 Cessnock (C) 1-13-15-03 581 612 5.34 Cessnock (C) 1-13-15-04 506 535 5.73 Cessnock (C) 1-13-15-05 520 550 5.77 Cessnock (C) 1-13-15-06 318 327 2.83 Cessnock (C) 1-13-15-07 673 740 9.96 Cessnock (C) 1-13-15-08 613 633 3.26 Cessnock (C) 1-13-15-09 682 753 10.41 Cessnock (C) 1-13-16-01 322 336 4.35

New South Wales Redistribution Statistics 2006
Enrolment Projections Hunter
Actual Enrolment Estimate Growth SLA Name CCD Number 2/12/2005 31/5/2010 (%)
149
Cessnock (C) 1-13-16-02 692 741 7.08 Cessnock (C) 1-13-16-03 493 535 8.52 Cessnock (C) 1-13-16-04 450 481 6.89 Cessnock (C) 1-13-16-05 299 370 23.75 Cessnock (C) 1-13-16-06 337 367 8.90 Cessnock (C) 1-13-16-07 322 335 4.04 Cessnock (C) 1-13-16-08 175 181 3.43 Cessnock (C) 1-13-16-09 168 178 5.95 Cessnock (C) 1-13-16-10 294 292 -0.68 Cessnock (C) 1-13-16-11 162 177 9.26 Cessnock (C) 1-13-16-12 251 301 19.92 Cessnock (C) 1-13-16-13 331 339 2.42 Cessnock (C) 1-13-16-14 362 376 3.87 Cessnock (C) 1-13-16-15 204 278 36.27 Cessnock (C) 1-13-17-01 635 647 1.89 Cessnock (C) 1-13-17-02 612 743 21.41 Cessnock (C) 1-13-17-03 596 614 3.02 Cessnock (C) 1-13-17-04 302 312 3.31 Cessnock (C) 1-13-17-05 459 479 4.36 Cessnock (C) 1-13-17-06 495 504 1.82 Cessnock (C) 1-13-17-07 463 464 0.22 Cessnock (C) 1-13-17-08 267 278 4.12 Cessnock (C) 1-13-17-09 171 179 4.68 Cessnock (C) 1-13-17-10 214 226 5.61 Cessnock (C) 1-13-17-11 459 484 5.45 Cessnock (C) 1-13-18-01 95 100 5.26 Cessnock (C) 1-13-18-02 890 1001 12.47 Cessnock (C) 1-13-18-03 190 208 9.47 Cessnock (C) 1-13-18-04 228 233 2.19 Cessnock (C) 1-13-18-05 126 125 -0.79 Cessnock (C) 1-13-18-06 621 635 2.25 Cessnock (C) 1-13-18-07 556 566 1.80 Cessnock (C) 1-13-18-08 375 380 1.33 Cessnock (C) 1-13-18-09 374 379 1.34 Cessnock (C) 1-13-18-10 282 294 4.26 Cessnock (C) 1-13-18-11 529 534 0.95 Cessnock (C) 1-13-18-12 515 631 22.52 Cessnock (C) 1-13-18-13 549 568 3.46 Cessnock (C) 1-13-18-14 258 282 9.30 Cessnock (C) 1-13-18-15 292 301 3.08 Cessnock (C) 83 31949 34093 6.71

New South Wales Redistribution Statistics 2006
Enrolment Projections Hunter
Actual Enrolment Estimate Growth SLA Name CCD Number 2/12/2005 31/5/2010 (%)
150
Maitland (C) 1-11-04-01 477 486 1.89 Maitland (C) 1-11-04-02 395 404 2.28 Maitland (C) 1-11-04-03 386 413 6.99 Maitland (C) 1-11-04-04 326 345 5.83 Maitland (C) 1-11-04-05 192 552 187.50 Maitland (C) 1-11-04-06 333 360 8.11 Maitland (C) 1-11-04-07 404 435 7.67 Maitland (C) 1-11-04-08 191 791 314.14 Maitland (C) 1-11-04-09 141 141 0.00 Maitland (C) 1-11-04-10 213 219 2.82 Maitland (C) 1-11-04-11 107 113 5.61 Maitland (C) 1-11-05-01 490 519 5.92 Maitland (C) 1-11-05-02 446 473 6.05 Maitland (C) 1-11-05-03 267 274 2.62 Maitland (C) 1-11-05-04 412 422 2.43 Maitland (C) 1-11-05-05 480 501 4.38 Maitland (C) 1-11-05-06 332 343 3.31 Maitland (C) 1-11-05-07 249 254 2.01 Maitland (C) 1-11-05-08 573 653 13.96 Maitland (C) 1-11-05-09 548 761 38.87 Maitland (C) 1-11-05-10 1090 1437 31.83 Maitland (C) 1-11-05-11 1153 1652 43.28 Maitland (C) 1-11-06-01 412 445 8.01 Maitland (C) 1-11-06-02 196 204 4.08 Maitland (C) 1-11-06-03 215 216 0.47 Maitland (C) 1-11-06-04 434 442 1.84 Maitland (C) 1-11-06-05 239 250 4.60 Maitland (C) 1-11-06-06 310 319 2.90 Maitland (C) 1-11-06-07 569 592 4.04 Maitland (C) 1-11-06-08 384 405 5.47 Maitland (C) 1-11-06-09 475 487 2.53 Maitland (C) 1-11-07-01 853 1053 23.45 Maitland (C) 1-11-07-02 389 398 2.31 Maitland (C) 1-11-07-03 567 595 4.94 Maitland (C) 1-11-07-04 304 310 1.97 Maitland (C) 1-11-07-05 420 459 9.29 Maitland (C) 1-11-07-06 315 321 1.90 Maitland (C) 1-11-07-07 391 395 1.02 Maitland (C) 1-11-07-08 183 186 1.64 Maitland (C) 1-11-07-09 296 296 0.00 Maitland (C) 1-11-07-10 590 710 20.34 Maitland (C) 1-11-07-11 406 452 11.33 Maitland (C) 1-11-08-02 421 558 32.54

New South Wales Redistribution Statistics 2006
Enrolment Projections Hunter
Actual Enrolment Estimate Growth SLA Name CCD Number 2/12/2005 31/5/2010 (%)
151
Maitland (C) 1-11-08-03 410 429 4.63 Maitland (C) 1-11-08-04 393 416 5.85 Maitland (C) 1-11-08-05 300 308 2.67 Maitland (C) 1-11-08-06 554 580 4.69 Maitland (C) 1-11-08-07 448 467 4.24 Maitland (C) 1-11-08-08 286 288 0.70 Maitland (C) 1-11-08-10 452 462 2.21 Maitland (C) 1-11-08-11 646 750 16.10 Maitland (C) 1-11-08-12 415 424 2.17 Maitland (C) 1-11-08-13 310 309 -0.32 Maitland (C) 1-11-09-01 478 623 30.33 Maitland (C) 1-11-09-02 565 602 6.55 Maitland (C) 1-11-09-03 497 505 1.61 Maitland (C) 1-11-09-04 507 535 5.52 Maitland (C) 1-11-09-05 433 446 3.00 Maitland (C) 1-11-09-06 438 452 3.20 Maitland (C) 1-11-09-07 397 401 1.01 Maitland (C) 1-11-09-08 441 450 2.04 Maitland (C) 1-11-09-09 611 643 5.24 Maitland (C) 1-11-09-10 1395 1707 22.37 Maitland (C) 1-11-09-11 617 875 41.82 Maitland (C) 1-11-09-12 490 503 2.65 Maitland (C) 1-11-10-04 33 34 3.03 Maitland (C) 1-11-18-01 351 365 3.99 Maitland (C) 1-11-18-02 252 263 4.37 Maitland (C) 1-11-18-03 347 364 4.90 Maitland (C) 1-11-18-04 159 160 0.63 Maitland (C) 1-11-18-05 220 222 0.91 Maitland (C) 1-11-18-06 1037 1382 33.27 Maitland (C) 1-11-18-07 272 282 3.68 Maitland (C) 1-11-18-08 470 486 3.40 Maitland (C) 1-11-18-09 351 369 5.13 Maitland (C) 1-11-18-10 687 787 14.56 Maitland (C) 1-11-18-11 470 475 1.06 Maitland (C) 77 33306 38005 14.11 Muswellbrook (A) 1-13-05-01 122 129 5.74 Muswellbrook (A) 1-13-05-02 332 342 3.01 Muswellbrook (A) 1-13-05-03 349 371 6.30 Muswellbrook (A) 1-13-05-04 515 530 2.91 Muswellbrook (A) 1-13-05-05 404 429 6.19 Muswellbrook (A) 1-13-05-06 88 99 12.50

New South Wales Redistribution Statistics 2006
Enrolment Projections Hunter
Actual Enrolment Estimate Growth SLA Name CCD Number 2/12/2005 31/5/2010 (%)
152
Muswellbrook (A) 1-13-05-07 171 171 0.00 Muswellbrook (A) 1-13-05-08 181 180 -0.55 Muswellbrook (A) 1-13-06-01 246 257 4.47 Muswellbrook (A) 1-13-06-02 134 133 -0.75 Muswellbrook (A) 1-13-06-03 263 293 11.41 Muswellbrook (A) 1-13-06-04 199 207 4.02 Muswellbrook (A) 1-13-06-05 283 296 4.59 Muswellbrook (A) 1-13-06-06 391 393 0.51 Muswellbrook (A) 1-13-06-07 248 255 2.82 Muswellbrook (A) 1-13-06-08 179 177 -1.12 Muswellbrook (A) 1-13-06-09 507 515 1.58 Muswellbrook (A) 1-13-06-10 462 473 2.38 Muswellbrook (A) 1-13-06-11 381 391 2.62 Muswellbrook (A) 1-13-07-01 347 360 3.75 Muswellbrook (A) 1-13-07-02 325 339 4.31 Muswellbrook (A) 1-13-07-03 512 534 4.30 Muswellbrook (A) 1-13-07-04 308 315 2.27 Muswellbrook (A) 1-13-07-05 259 267 3.09 Muswellbrook (A) 1-13-07-06 389 391 0.51 Muswellbrook (A) 1-13-07-07 646 700 8.36 Muswellbrook (A) 1-13-07-08 424 446 5.19 Muswellbrook (A) 1-13-07-09 207 209 0.97 Muswellbrook (A) 1-13-07-10 275 284 3.27 Muswellbrook (A) 1-13-07-11 363 380 4.68 Muswellbrook (A) 30 9510 9866 3.74 Singleton (A) 1-13-08-01 138 140 1.45 Singleton (A) 1-13-08-02 433 460 6.24 Singleton (A) 1-13-08-03 117 126 7.69 Singleton (A) 1-13-08-04 16 17 6.25 Singleton (A) 1-13-08-05 379 425 12.14 Singleton (A) 1-13-08-06 441 475 7.71 Singleton (A) 1-13-08-07 168 190 13.10 Singleton (A) 1-13-08-08 671 781 16.39 Singleton (A) 1-13-08-09 405 440 8.64 Singleton (A) 1-13-08-10 230 251 9.13 Singleton (A) 1-13-08-11 224 256 14.29 Singleton (A) 1-13-08-12 151 207 37.09 Singleton (A) 1-13-08-13 517 607 17.41 Singleton (A) 1-13-09-01 287 307 6.97 Singleton (A) 1-13-09-02 134 155 15.67 Singleton (A) 1-13-09-03 105 111 5.71

New South Wales Redistribution Statistics 2006
Enrolment Projections Hunter
Actual Enrolment Estimate Growth SLA Name CCD Number 2/12/2005 31/5/2010 (%)
153
Singleton (A) 1-13-09-04 67 68 1.49 Singleton (A) 1-13-09-05 29 31 6.90 Singleton (A) 1-13-09-06 136 140 2.94 Singleton (A) 1-13-09-07 340 378 11.18 Singleton (A) 1-13-09-08 170 169 -0.59 Singleton (A) 1-13-09-09 208 226 8.65 Singleton (A) 1-13-10-01 811 904 11.47 Singleton (A) 1-13-10-02 422 443 4.98 Singleton (A) 1-13-10-03 372 499 34.14 Singleton (A) 1-13-10-04 444 474 6.76 Singleton (A) 1-13-10-05 587 610 3.92 Singleton (A) 1-13-10-06 345 363 5.22 Singleton (A) 1-13-10-07 318 353 11.01 Singleton (A) 1-13-10-08 72 79 9.72 Singleton (A) 1-13-10-09 368 379 2.99 Singleton (A) 1-13-10-10 685 908 32.55 Singleton (A) 1-13-11-01 389 414 6.43 Singleton (A) 1-13-11-02 211 224 6.16 Singleton (A) 1-13-11-03 210 218 3.81 Singleton (A) 1-13-11-04 322 321 -0.31 Singleton (A) 1-13-11-05 387 399 3.10 Singleton (A) 1-13-11-06 734 776 5.72 Singleton (A) 1-13-11-07 268 280 4.48 Singleton (A) 1-13-11-08 238 250 5.04 Singleton (A) 1-13-11-09 463 482 4.10 Singleton (A) 1-13-11-10 331 343 3.63 Singleton (A) 1-13-11-11 393 415 5.60 Singleton (A) 1-13-11-12 107 107 0.00 Singleton (A) 44 13843 15201 9.81 Hunter 234 88608 97165 9.66

New South Wales Redistribution Statistics 2006
Enrolment Projections Kingsford Smith
Actual Enrolment Estimate Growth SLA Name CCD Number 2/12/2005 31/5/2010 (%)
154
Botany Bay (C) 1-42-15-01 190 195 2.63 Botany Bay (C) 1-42-15-02 481 540 12.27 Botany Bay (C) 1-42-15-03 238 243 2.10 Botany Bay (C) 1-42-15-04 134 134 0.00 Botany Bay (C) 1-42-15-05 374 410 9.63 Botany Bay (C) 1-42-15-06 672 844 25.60 Botany Bay (C) 1-42-15-07 418 473 13.16 Botany Bay (C) 1-42-15-08 1056 1080 2.27 Botany Bay (C) 1-42-15-09 258 264 2.33 Botany Bay (C) 1-42-15-10 401 405 1.00 Botany Bay (C) 1-42-15-11 416 418 0.48 Botany Bay (C) 1-42-15-12 276 278 0.72 Botany Bay (C) 1-42-15-13 308 323 4.87 Botany Bay (C) 1-42-16-01 249 249 0.00 Botany Bay (C) 1-42-16-02 279 279 0.00 Botany Bay (C) 1-42-16-03 697 710 1.87 Botany Bay (C) 1-42-16-04 315 345 9.52 Botany Bay (C) 1-42-16-05 352 354 0.57 Botany Bay (C) 1-42-16-06 224 225 0.45 Botany Bay (C) 1-42-16-07 335 341 1.79 Botany Bay (C) 1-42-16-08 325 342 5.23 Botany Bay (C) 1-42-16-09 470 481 2.34 Botany Bay (C) 1-42-16-10 392 403 2.81 Botany Bay (C) 1-42-16-11 259 258 -0.39 Botany Bay (C) 1-42-16-12 491 504 2.65 Botany Bay (C) 1-42-16-13 357 359 0.56 Botany Bay (C) 1-42-16-14 158 155 -1.90 Botany Bay (C) 1-42-17-01 482 489 1.45 Botany Bay (C) 1-42-17-02 620 649 4.68 Botany Bay (C) 1-42-17-03 274 272 -0.73 Botany Bay (C) 1-42-17-04 347 354 2.02 Botany Bay (C) 1-42-17-05 171 173 1.17 Botany Bay (C) 1-42-17-06 289 290 0.35 Botany Bay (C) 1-42-17-07 364 375 3.02 Botany Bay (C) 1-42-17-08 236 242 2.54 Botany Bay (C) 1-42-17-09 295 300 1.69 Botany Bay (C) 1-42-17-10 495 502 1.41 Botany Bay (C) 1-42-17-11 324 325 0.31 Botany Bay (C) 1-42-18-01 276 277 0.36 Botany Bay (C) 1-42-18-02 278 286 2.88 Botany Bay (C) 1-42-18-03 718 732 1.95 Botany Bay (C) 1-42-18-04 528 524 -0.76

New South Wales Redistribution Statistics 2006
Enrolment Projections Kingsford Smith
Actual Enrolment Estimate Growth SLA Name CCD Number 2/12/2005 31/5/2010 (%)
155
Botany Bay (C) 1-42-19-10 265 265 0.00
Randwick (C) 1-43-02-05 360 365 1.39
Botany Bay (C) 1-42-18-05 347 348 0.29 Botany Bay (C) 1-42-18-06 565 573 1.42 Botany Bay (C) 1-42-18-07 449 458 2.00 Botany Bay (C) 1-42-18-08 290 297 2.41 Botany Bay (C) 1-42-18-09 429 426 -0.70 Botany Bay (C) 1-42-18-10 346 344 -0.58 Botany Bay (C) 1-42-18-11 392 391 -0.26 Botany Bay (C) 1-42-18-12 151 157 3.97 Botany Bay (C) 1-42-18-13 238 243 2.10 Botany Bay (C) 1-42-19-01 198 202 2.02 Botany Bay (C) 1-42-19-02 610 845 38.52 Botany Bay (C) 1-42-19-03 328 337 2.74 Botany Bay (C) 1-42-19-04 0 0 0.00 Botany Bay (C) 1-42-19-05 227 246 8.37 Botany Bay (C) 1-42-19-06 354 356 0.56 Botany Bay (C) 1-42-19-07 276 286 3.62 Botany Bay (C) 1-42-19-08 467 489 4.71 Botany Bay (C) 1-42-19-09 449 455 1.34
Botany Bay (C) 1-42-19-11 266 275 3.38 Botany Bay (C) 1-42-19-12 272 277 1.84 Botany Bay (C) 63 22741 23672 4.09 NSW Water areas 1-42-19-13 0 0 0.00 NSW Water areas 1-45-02-09 0 0 0.00 NSW Water areas 2 0 0 0.00 Randwick (C) 1-43-02-01 345 372 7.83 Randwick (C) 1-43-02-02 158 163 3.16 Randwick (C) 1-43-02-03 312 313 0.32 Randwick (C) 1-43-02-04 298 307 3.02
Randwick (C) 1-43-02-06 442 453 2.49 Randwick (C) 1-43-02-07 246 243 -1.22 Randwick (C) 1-43-02-08 371 364 -1.89 Randwick (C) 1-43-02-09 614 626 1.95 Randwick (C) 1-43-02-10 563 563 0.00 Randwick (C) 1-43-02-11 355 356 0.28 Randwick (C) 1-43-02-12 411 427 3.89 Randwick (C) 1-43-02-13 244 256 4.92

New South Wales Redistribution Statistics 2006
Enrolment Projections Kingsford Smith
Actual Enrolment Estimate Growth SLA Name CCD Number 2/12/2005 31/5/2010 (%)
156
Randwick (C) 1-43-03-01 612 623 1.80 Randwick (C) 1-43-03-02 588 577 -1.87 Randwick (C) 1-43-03-03 472 471 -0.21 Randwick (C) 1-43-03-04 362 377 4.14 Randwick (C) 1-43-03-05 205 209 1.95 Randwick (C) 1-43-03-06 342 384 12.28 Randwick (C) 1-43-03-07 211 215 1.90 Randwick (C) 1-43-03-08 462 466 0.87 Randwick (C) 1-43-03-09 97 99 2.06 Randwick (C) 1-43-03-10 87 86 -1.15 Randwick (C) 1-43-03-11 177 175 -1.13 Randwick (C) 1-43-03-12 204 204 0.00 Randwick (C) 1-43-04-05 217 214 -1.38 Randwick (C) 1-43-04-11 120 120 0.00 Randwick (C) 1-43-04-12 390 384 -1.54 Randwick (C) 1-43-05-08 96 100 4.17 Randwick (C) 1-43-05-09 211 212 0.47 Randwick (C) 1-43-05-10 90 150 66.67 Randwick (C) 1-43-05-12 366 366 0.00 Randwick (C) 1-43-05-13 274 275 0.36 Randwick (C) 1-43-06-04 331 332 0.30 Randwick (C) 1-43-06-08 500 496 -0.80 Randwick (C) 1-43-06-11 131 132 0.76 Randwick (C) 1-43-07-01 254 258 1.57 Randwick (C) 1-43-07-02 379 392 3.43 Randwick (C) 1-43-07-03 268 286 6.72 Randwick (C) 1-43-07-04 315 323 2.54 Randwick (C) 1-43-07-05 361 385 6.65 Randwick (C) 1-43-07-06 285 293 2.81 Randwick (C) 1-43-07-07 155 161 3.87 Randwick (C) 1-43-07-08 321 328 2.18 Randwick (C) 1-43-07-09 63 64 1.59 Randwick (C) 1-43-07-10 344 407 18.31 Randwick (C) 1-43-07-11 171 166 -2.92 Randwick (C) 1-43-07-12 340 352 3.53 Randwick (C) 1-43-08-01 213 211 -0.94 Randwick (C) 1-43-08-02 182 176 -3.30 Randwick (C) 1-43-08-03 514 537 4.47 Randwick (C) 1-43-08-04 362 374 3.31 Randwick (C) 1-43-08-05 213 218 2.35 Randwick (C) 1-43-08-06 295 298 1.02 Randwick (C) 1-43-08-07 159 162 1.89

New South Wales Redistribution Statistics 2006
Enrolment Projections Kingsford Smith
Actual Enrolment Estimate Growth SLA Name CCD Number 2/12/2005 31/5/2010 (%)
157
Randwick (C) 1-43-08-08 146 153 4.79 Randwick (C) 1-43-08-09 362 379 4.70 Randwick (C) 1-43-08-10 326 329 0.92 Randwick (C) 1-43-08-11 262 266 1.53 Randwick (C) 1-43-08-12 214 213 -0.47 Randwick (C) 1-43-09-01 301 298 -1.00 Randwick (C) 1-43-09-02 275 278 1.09 Randwick (C) 1-43-09-03 237 235 -0.84 Randwick (C) 1-43-09-04 272 296 8.82 Randwick (C) 1-43-09-05 369 389 5.42 Randwick (C) 1-43-09-06 200 202 1.00 Randwick (C) 1-43-09-07 136 137 0.74 Randwick (C) 1-43-09-08 213 217 1.88 Randwick (C) 1-43-09-09 199 198 -0.50 Randwick (C) 1-43-09-10 294 315 7.14 Randwick (C) 1-43-09-11 389 396 1.80 Randwick (C) 1-43-09-12 293 319 8.87 Randwick (C) 1-43-10-01 221 220 -0.45 Randwick (C) 1-43-10-02 141 146 3.55 Randwick (C) 1-43-10-03 189 187 -1.06 Randwick (C) 1-43-10-04 249 268 7.63 Randwick (C) 1-43-10-05 330 338 2.42 Randwick (C) 1-43-10-06 408 433 6.13 Randwick (C) 1-43-10-07 403 408 1.24 Randwick (C) 1-43-10-08 343 343 0.00 Randwick (C) 1-43-10-09 257 255 -0.78 Randwick (C) 1-43-10-10 303 308 1.65 Randwick (C) 1-43-10-11 287 286 -0.35 Randwick (C) 1-43-10-12 170 167 -1.76 Randwick (C) 1-43-11-01 497 493 -0.80 Randwick (C) 1-43-11-02 476 474 -0.42 Randwick (C) 1-43-11-03 341 344 0.88 Randwick (C) 1-43-11-04 258 263 1.94 Randwick (C) 1-43-11-05 350 348 -0.57 Randwick (C) 1-43-11-06 402 398 -1.00 Randwick (C) 1-43-11-07 321 319 -0.62 Randwick (C) 1-43-11-08 208 237 13.94 Randwick (C) 1-43-11-09 283 283 0.00 Randwick (C) 1-43-11-10 366 362 -1.09 Randwick (C) 1-43-11-11 244 243 -0.41 Randwick (C) 1-43-11-12 324 329 1.54 Randwick (C) 1-43-11-13 266 263 -1.13

New South Wales Redistribution Statistics 2006
Enrolment Projections Kingsford Smith
Actual Enrolment Estimate Growth SLA Name CCD Number 2/12/2005 31/5/2010 (%)
158
Randwick (C) 1-43-11-14 333 340 2.10 Randwick (C) 1-43-12-01 297 303 2.02 Randwick (C) 1-43-12-02 362 364 0.55 Randwick (C) 1-43-12-03 362 374 3.31 Randwick (C) 1-43-12-04 379 371 -2.11 Randwick (C) 1-43-12-05 420 419 -0.24 Randwick (C) 1-43-12-06 243 249 2.47 Randwick (C) 1-43-12-07 369 380 2.98 Randwick (C) 1-43-12-08 361 388 7.48 Randwick (C) 1-43-12-09 301 305 1.33 Randwick (C) 1-43-12-10 315 322 2.22 Randwick (C) 1-43-12-11 818 808 -1.22 Randwick (C) 1-43-13-01 489 488 -0.20 Randwick (C) 1-43-13-02 306 301 -1.63 Randwick (C) 1-43-13-03 423 425 0.47 Randwick (C) 1-43-13-04 315 318 0.95 Randwick (C) 1-43-13-05 485 500 3.09 Randwick (C) 1-43-13-06 544 555 2.02 Randwick (C) 1-43-13-07 211 213 0.95 Randwick (C) 1-43-13-08 380 429 12.89 Randwick (C) 1-43-13-09 335 345 2.99 Randwick (C) 1-43-13-10 284 290 2.11 Randwick (C) 1-43-13-11 350 358 2.29 Randwick (C) 1-43-13-12 322 337 4.66 Randwick (C) 1-43-14-01 335 339 1.19 Randwick (C) 1-43-14-02 280 291 3.93 Randwick (C) 1-43-14-03 421 423 0.48 Randwick (C) 1-43-14-04 345 349 1.16 Randwick (C) 1-43-14-05 579 624 7.77 Randwick (C) 1-43-14-06 340 365 7.35 Randwick (C) 1-43-14-07 219 216 -1.37 Randwick (C) 1-43-14-08 83 82 -1.20 Randwick (C) 1-43-14-09 430 425 -1.16 Randwick (C) 1-43-14-10 178 174 -2.25 Randwick (C) 1-43-14-11 203 203 0.00 Randwick (C) 1-43-14-12 448 447 -0.22 Randwick (C) 1-43-14-13 426 422 -0.94 Randwick (C) 1-43-15-01 251 247 -1.59 Randwick (C) 1-43-15-02 475 480 1.05 Randwick (C) 1-43-15-03 291 296 1.72 Randwick (C) 1-43-15-04 332 335 0.90 Randwick (C) 1-43-15-05 286 287 0.35

New South Wales Redistribution Statistics 2006
Enrolment Projections Kingsford Smith
Actual Enrolment Estimate Growth SLA Name CCD Number 2/12/2005 31/5/2010 (%)
159
Randwick (C) 1-43-15-06 444 435 -2.03 Randwick (C) 1-43-15-07 424 431 1.65 Randwick (C) 1-43-15-08 321 324 0.93 Randwick (C) 1-43-15-09 555 561 1.08 Randwick (C) 1-43-15-10 446 443 -0.67 Randwick (C) 1-43-15-11 504 711 41.07 Randwick (C) 1-43-15-12 417 417 0.00 Randwick (C) 1-43-15-13 224 222 -0.89 Randwick (C) 1-43-16-01 459 457 -0.44 Randwick (C) 1-43-16-02 394 436 10.66 Randwick (C) 1-43-16-03 373 366 -1.88 Randwick (C) 1-43-16-04 369 414 12.20 Randwick (C) 1-43-16-05 692 683 -1.30 Randwick (C) 1-43-16-06 263 268 1.90 Randwick (C) 1-43-16-07 406 417 2.71 Randwick (C) 1-43-16-08 359 353 -1.67 Randwick (C) 1-43-16-09 314 316 0.64 Randwick (C) 1-43-16-10 332 332 0.00 Randwick (C) 1-43-16-11 466 492 5.58 Randwick (C) 1-43-16-12 507 584 15.19 Randwick (C) 1-43-17-01 542 555 2.40 Randwick (C) 1-43-17-02 715 736 2.94 Randwick (C) 1-43-17-03 263 272 3.42 Randwick (C) 1-43-17-04 521 551 5.76 Randwick (C) 1-43-17-05 580 598 3.10 Randwick (C) 1-43-17-06 421 436 3.56 Randwick (C) 1-43-17-07 269 267 -0.74 Randwick (C) 1-43-17-08 145 148 2.07 Randwick (C) 1-43-17-09 669 677 1.20 Randwick (C) 1-43-17-10 274 275 0.36 Randwick (C) 1-43-17-11 176 181 2.84 Randwick (C) 1-43-17-12 532 579 8.83 Randwick (C) 1-43-18-01 428 428 0.00 Randwick (C) 1-43-18-02 528 537 1.70 Randwick (C) 1-43-18-03 360 364 1.11 Randwick (C) 1-43-18-04 628 648 3.18 Randwick (C) 1-43-18-05 61 59 -3.28 Randwick (C) 1-43-18-06 453 455 0.44 Randwick (C) 1-43-18-07 188 189 0.53 Randwick (C) 1-43-18-08 313 317 1.28 Randwick (C) 1-43-18-09 212 218 2.83 Randwick (C) 1-43-18-10 649 675 4.01

New South Wales Redistribution Statistics 2006
Enrolment Projections Kingsford Smith
Actual Enrolment Estimate Growth SLA Name CCD Number 2/12/2005 31/5/2010 (%)
160
Randwick (C) 1-43-18-11 459 470 2.40 Randwick (C) 1-43-18-12 454 458 0.88 Randwick (C) 1-43-18-13 543 562 3.50 Randwick (C) 184 62161 63705 2.48 Rockdale (C) 1-36-26-03 0 0 0.00 Rockdale (C) 1 0 0 0.00 Kingsford Smith 250 84902 87377 2.92

New South Wales Redistribution Statistics 2006
Enrolment Projections Lindsay
Actual Enrolment Estimate Growth SLA Name CCD Number 2/12/2005 31/5/2010 (%)
161
Blue Mountains (C) 1-23-13-01 436 442 1.38 Blue Mountains (C) 1-23-13-02 369 377 2.17 Blue Mountains (C) 1-23-13-03 473 481 1.69 Blue Mountains (C) 1-23-13-04 499 507 1.60 Blue Mountains (C) 1-23-13-05 681 683 0.29 Blue Mountains (C) 1-23-13-06 395 398 0.76 Blue Mountains (C) 1-23-13-07 365 369 1.10 Blue Mountains (C) 1-23-13-08 385 399 3.64 Blue Mountains (C) 1-23-13-09 284 285 0.35 Blue Mountains (C) 1-23-13-10 470 473 0.64 Blue Mountains (C) 1-23-13-11 241 235 -2.49 Blue Mountains (C) 1-23-13-12 356 355 -0.28 Blue Mountains (C) 1-23-13-13 335 337 0.60 Blue Mountains (C) 13 5289 5341 0.98 Penrith (C) 1-28-01-01 413 445 7.75 Penrith (C) 1-28-01-02 464 489 5.39 Penrith (C) 1-28-01-03 298 309 3.69 Penrith (C) 1-28-01-04 276 276 0.00 Penrith (C) 1-28-01-05 369 389 5.42 Penrith (C) 1-28-01-06 483 549 13.66 Penrith (C) 1-28-01-07 244 253 3.69 Penrith (C) 1-28-01-08 360 379 5.28 Penrith (C) 1-28-01-09 381 386 1.31 Penrith (C) 1-28-01-10 587 608 3.58 Penrith (C) 1-28-01-11 606 760 25.41 Penrith (C) 1-28-01-12 530 643 21.32 Penrith (C) 1-28-01-13 403 409 1.49 Penrith (C) 1-28-02-01 422 434 2.84 Penrith (C) 1-28-02-02 259 269 3.86 Penrith (C) 1-28-02-03 329 326 -0.91 Penrith (C) 1-28-02-05 329 338 2.74 Penrith (C) 1-28-02-11 342 410 19.88 Penrith (C) 1-28-02-12 419 451 7.64 Penrith (C) 1-28-02-13 262 266 1.53 Penrith (C) 1-28-02-14 0 0 0.00 Penrith (C) 1-28-03-01 310 314 1.29 Penrith (C) 1-28-03-02 441 454 2.95 Penrith (C) 1-28-03-03 401 409 2.00 Penrith (C) 1-28-03-04 640 679 6.09 Penrith (C) 1-28-03-05 425 434 2.12

New South Wales Redistribution Statistics 2006
Enrolment Projections Lindsay
Actual Enrolment Estimate Growth SLA Name CCD Number 2/12/2005 31/5/2010 (%)
162
Penrith (C) 1-28-03-06 418 435 4.07 Penrith (C) 1-28-03-07 363 372 2.48 Penrith (C) 1-28-03-08 359 371 3.34 Penrith (C) 1-28-03-09 373 376 0.80 Penrith (C) 1-28-03-10 630 661 4.92 Penrith (C) 1-28-03-11 404 400 -0.99 Penrith (C) 1-28-03-12 380 397 4.47 Penrith (C) 1-28-03-13 354 361 1.98 Penrith (C) 1-28-04-01 653 661 1.23 Penrith (C) 1-28-04-02 338 336 -0.59 Penrith (C) 1-28-04-03 413 420 1.69 Penrith (C) 1-28-04-04 527 545 3.42 Penrith (C) 1-28-04-05 412 426 3.40 Penrith (C) 1-28-04-06 440 457 3.86 Penrith (C) 1-28-04-07 633 653 3.16 Penrith (C) 1-28-04-08 706 762 7.93 Penrith (C) 1-28-04-09 312 350 12.18 Penrith (C) 1-28-04-10 436 434 -0.46 Penrith (C) 1-28-05-01 403 411 1.99 Penrith (C) 1-28-05-02 560 568 1.43 Penrith (C) 1-28-05-03 525 548 4.38 Penrith (C) 1-28-05-04 677 683 0.89 Penrith (C) 1-28-05-05 296 303 2.36 Penrith (C) 1-28-05-06 366 386 5.46 Penrith (C) 1-28-05-07 384 414 7.81 Penrith (C) 1-28-05-08 322 349 8.39 Penrith (C) 1-28-05-09 366 425 16.12 Penrith (C) 1-28-05-10 590 611 3.56 Penrith (C) 1-28-05-11 200 192 -4.00 Penrith (C) 1-28-06-01 290 293 1.03 Penrith (C) 1-28-06-02 408 459 12.50 Penrith (C) 1-28-06-03 316 305 -3.48 Penrith (C) 1-28-06-04 246 280 13.82 Penrith (C) 1-28-06-05 269 295 9.67 Penrith (C) 1-28-06-06 266 275 3.38 Penrith (C) 1-28-06-07 237 238 0.42 Penrith (C) 1-28-06-08 390 410 5.13 Penrith (C) 1-28-06-09 278 273 -1.80 Penrith (C) 1-28-06-10 246 301 22.36 Penrith (C) 1-28-06-11 306 319 4.25 Penrith (C) 1-28-06-12 284 307 8.10 Penrith (C) 1-28-07-01 317 343 8.20

New South Wales Redistribution Statistics 2006
Enrolment Projections Lindsay
Actual Enrolment Estimate Growth SLA Name CCD Number 2/12/2005 31/5/2010 (%)
163
Penrith (C) 1-28-07-02 530 533 0.57 Penrith (C) 1-28-07-03 534 545 2.06 Penrith (C) 1-28-07-04 484 504 4.13 Penrith (C) 1-28-07-05 274 264 -3.65 Penrith (C) 1-28-07-06 392 390 -0.51 Penrith (C) 1-28-07-07 636 634 -0.31 Penrith (C) 1-28-07-08 528 540 2.27 Penrith (C) 1-28-07-09 318 323 1.57 Penrith (C) 1-28-08-01 417 417 0.00 Penrith (C) 1-28-08-02 414 434 4.83 Penrith (C) 1-28-08-03 456 467 2.41 Penrith (C) 1-28-08-04 536 531 -0.93 Penrith (C) 1-28-08-05 268 265 -1.12 Penrith (C) 1-28-08-06 570 572 0.35 Penrith (C) 1-28-08-07 644 644 0.00 Penrith (C) 1-28-08-08 445 442 -0.67 Penrith (C) 1-28-08-09 322 334 3.73 Penrith (C) 1-28-08-10 430 436 1.40 Penrith (C) 1-28-09-01 353 345 -2.27 Penrith (C) 1-28-09-02 385 383 -0.52 Penrith (C) 1-28-09-03 449 450 0.22 Penrith (C) 1-28-09-04 355 351 -1.13 Penrith (C) 1-28-09-05 159 225 41.51 Penrith (C) 1-28-09-06 384 394 2.60 Penrith (C) 1-28-09-07 583 657 12.69 Penrith (C) 1-28-09-08 651 651 0.00 Penrith (C) 1-28-09-09 436 430 -1.38 Penrith (C) 1-28-09-10 324 400 23.46 Penrith (C) 1-28-09-11 189 183 -3.17 Penrith (C) 1-28-10-01 525 574 9.33 Penrith (C) 1-28-10-02 396 439 10.86 Penrith (C) 1-28-10-03 509 508 -0.20 Penrith (C) 1-28-10-04 523 546 4.40 Penrith (C) 1-28-10-05 641 641 0.00 Penrith (C) 1-28-10-06 572 605 5.77 Penrith (C) 1-28-10-07 301 303 0.66 Penrith (C) 1-28-10-08 200 203 1.50 Penrith (C) 1-28-10-09 549 580 5.65 Penrith (C) 1-28-11-01 707 717 1.41 Penrith (C) 1-28-11-02 402 405 0.75 Penrith (C) 1-28-11-03 317 318 0.32 Penrith (C) 1-28-11-04 647 659 1.85

New South Wales Redistribution Statistics 2006
Enrolment Projections Lindsay
Actual Enrolment Estimate Growth SLA Name CCD Number 2/12/2005 31/5/2010 (%)
164
Penrith (C) 1-28-11-07 378 376 -0.53
Penrith (C) 1-28-11-05 500 504 0.80 Penrith (C) 1-28-11-06 700 704 0.57
Penrith (C) 1-28-11-08 689 691 0.29 Penrith (C) 1-28-11-09 386 383 -0.78 Penrith (C) 1-28-11-10 413 410 -0.73 Penrith (C) 1-28-12-01 217 220 1.38 Penrith (C) 1-28-12-02 644 651 1.09 Penrith (C) 1-28-12-03 331 339 2.42 Penrith (C) 1-28-12-04 322 330 2.48 Penrith (C) 1-28-12-05 637 647 1.57 Penrith (C) 1-28-12-06 510 590 15.69 Penrith (C) 1-28-12-07 391 399 2.05 Penrith (C) 1-28-12-08 245 294 20.00 Penrith (C) 1-28-12-09 290 332 14.48 Penrith (C) 1-28-12-10 364 374 2.75 Penrith (C) 1-28-12-11 272 323 18.75 Penrith (C) 1-28-18-01 316 315 -0.32 Penrith (C) 1-28-18-02 425 430 1.18 Penrith (C) 1-28-18-03 329 330 0.30 Penrith (C) 1-28-18-04 645 668 3.57 Penrith (C) 1-28-18-05 633 652 3.00 Penrith (C) 1-28-18-06 566 559 -1.24 Penrith (C) 1-28-18-07 475 482 1.47 Penrith (C) 1-28-18-08 369 374 1.36 Penrith (C) 1-28-18-09 541 581 7.39 Penrith (C) 1-28-18-10 551 554 0.54 Penrith (C) 1-28-20-01 344 361 4.94 Penrith (C) 1-28-20-02 605 612 1.16 Penrith (C) 1-28-20-03 762 793 4.07 Penrith (C) 1-28-20-04 542 562 3.69 Penrith (C) 1-28-20-05 526 529 0.57 Penrith (C) 1-28-20-06 606 623 2.81 Penrith (C) 1-28-20-07 1047 1168 11.56 Penrith (C) 1-28-20-08 379 397 4.75 Penrith (C) 1-28-20-09 1209 1338 10.67 Penrith (C) 1-28-20-10 542 543 0.18 Penrith (C) 1-28-20-11 654 668 2.14 Penrith (C) 1-28-20-12 469 462 -1.49 Penrith (C) 1-28-20-13 841 845 0.48 Penrith (C) 1-28-20-14 328 354 7.93 Penrith (C) 1-28-21-01 605 609 0.66

New South Wales Redistribution Statistics 2006
Enrolment Projections Lindsay
Actual Enrolment Estimate Growth SLA Name CCD Number 2/12/2005 31/5/2010 (%)
165
Penrith (C) 1-28-21-02 473 473 0.00 Penrith (C) 1-28-21-03 382 377 -1.31 Penrith (C) 1-28-21-04 556 550 -1.08 Penrith (C) 1-28-21-05 336 342 1.79 Penrith (C) 1-28-21-06 391 400 2.30 Penrith (C) 1-28-21-07 337 349 3.56 Penrith (C) 1-28-21-08 423 428 1.18 Penrith (C) 1-28-21-09 366 375 2.46 Penrith (C) 1-28-21-10 366 375 2.46 Penrith (C) 1-28-22-01 534 544 1.87 Penrith (C) 1-28-22-02 457 486 6.35 Penrith (C) 1-28-22-03 692 703 1.59 Penrith (C) 1-28-22-04 395 407 3.04 Penrith (C) 1-28-22-05 303 326 7.59 Penrith (C) 1-28-22-06 311 355 14.15 Penrith (C) 1-28-22-07 561 593 5.70 Penrith (C) 1-28-22-08 359 373 3.90 Penrith (C) 1-28-22-09 217 223 2.76 Penrith (C) 1-28-22-10 407 434 6.63 Penrith (C) 1-28-22-11 1265 2001 58.18 Penrith (C) 1-28-22-12 704 716 1.70 Penrith (C) 173 76874 80532 4.76 Lindsay 186 82163 85873 4.52

New South Wales Redistribution Statistics 2006
Enrolment Projections Lowe
Actual Enrolment Estimate Growth SLA Name CCD Number 2/12/2005 31/5/2010 (%)
166
Ashfield (A) 1-41-12-01 513 510 -0.58 Ashfield (A) 1-41-12-02 335 328 -2.09 Ashfield (A) 1-41-12-03 297 294 -1.01 Ashfield (A) 1-41-12-04 314 325 3.50 Ashfield (A) 1-41-12-05 240 243 1.25 Ashfield (A) 1-41-12-06 329 340 3.34 Ashfield (A) 1-41-12-07 460 456 -0.87 Ashfield (A) 1-41-12-08 379 373 -1.58 Ashfield (A) 1-41-12-09 155 153 -1.29 Ashfield (A) 1-41-12-10 539 533 -1.11 Ashfield (A) 1-41-13-05 366 363 -0.82 Ashfield (A) 1-41-13-06 572 581 1.57 Ashfield (A) 1-41-13-07 215 234 8.84 Ashfield (A) 1-41-13-08 328 326 -0.61 Ashfield (A) 1-41-13-09 255 251 -1.57 Ashfield (A) 1-41-13-11 334 326 -2.40 Ashfield (A) 1-41-15-01 251 249 -0.80 Ashfield (A) 1-41-15-02 305 317 3.93 Ashfield (A) 1-41-15-12 158 150 -5.06 Ashfield (A) 1-41-15-15 94 97 3.19 Ashfield (A) 1-41-17-01 398 390 -2.01 Ashfield (A) 1-41-17-02 598 590 -1.34 Ashfield (A) 1-41-17-03 568 570 0.35 Ashfield (A) 1-41-17-04 624 645 3.37 Ashfield (A) 1-41-17-05 498 499 0.20 Ashfield (A) 1-41-17-06 508 507 -0.20 Ashfield (A) 1-41-17-07 229 219 -4.37 Ashfield (A) 1-41-17-08 436 436 0.00 Ashfield (A) 1-41-17-09 470 474 0.85 Ashfield (A) 1-41-17-10 320 317 -0.94 Ashfield (A) 30 11088 11096 0.07 Burwood (A) 1-41-08-01 478 483 1.05 Burwood (A) 1-41-08-02 146 147 0.68 Burwood (A) 1-41-08-03 374 381 1.87 Burwood (A) 1-41-08-04 306 314 2.61 Burwood (A) 1-41-08-05 448 449 0.22 Burwood (A) 1-41-08-06 522 527 0.96 Burwood (A) 1-41-08-07 518 549 5.98 Burwood (A) 1-41-08-08 203 206 1.48 Burwood (A) 1-41-08-10 571 578 1.23

New South Wales Redistribution Statistics 2006
Enrolment Projections Lowe
Actual Enrolment Estimate Growth SLA Name CCD Number 2/12/2005 31/5/2010 (%)
167
Burwood (A) 1-41-08-11 352 344 -2.27 Burwood (A) 1-41-08-12 274 272 -0.73 Burwood (A) 1-41-08-13 260 264 1.54 Burwood (A) 1-41-09-01 202 366 81.19 Burwood (A) 1-41-09-02 382 388 1.57 Burwood (A) 1-41-09-03 305 306 0.33 Burwood (A) 1-41-09-04 481 484 0.62 Burwood (A) 1-41-09-05 297 294 -1.01 Burwood (A) 1-41-09-06 339 330 -2.65 Burwood (A) 1-41-09-07 581 586 0.86 Burwood (A) 1-41-09-08 592 592 0.00 Burwood (A) 1-41-09-09 479 501 4.59 Burwood (A) 1-41-09-10 249 247 -0.80 Burwood (A) 1-41-09-11 549 549 0.00 Burwood (A) 1-41-09-12 408 407 -0.25 Burwood (A) 1-41-09-13 135 132 -2.22 Burwood (A) 1-41-10-01 358 528 47.49 Burwood (A) 1-41-10-02 425 431 1.41 Burwood (A) 1-41-10-03 521 569 9.21 Burwood (A) 1-41-10-04 182 182 0.00 Burwood (A) 1-41-10-05 465 476 2.37 Burwood (A) 1-41-10-06 88 94 6.82 Burwood (A) 1-41-10-07 233 233 0.00 Burwood (A) 1-41-10-08 388 387 -0.26 Burwood (A) 1-41-10-09 116 117 0.86 Burwood (A) 1-41-11-01 295 311 5.42 Burwood (A) 1-41-11-02 518 582 12.36 Burwood (A) 1-41-11-03 316 316 0.00 Burwood (A) 1-41-11-04 263 284 7.98 Burwood (A) 1-41-11-05 422 424 0.47 Burwood (A) 1-41-11-06 277 272 -1.81 Burwood (A) 1-41-11-07 300 569 89.67 Burwood (A) 1-41-11-08 132 152 15.15 Burwood (A) 1-41-11-09 393 449 14.25 Burwood (A) 1-41-11-10 265 268 1.13 Burwood (A) 1-41-11-11 763 860 12.71 Burwood (A) 1-41-11-12 520 517 -0.58 Burwood (A) 1-41-11-13 563 565 0.36 Burwood (A) 1-41-11-14 84 86 2.38 Burwood (A) 48 17338 18368 5.94

New South Wales Redistribution Statistics 2006
Enrolment Projections Lowe
Actual Enrolment Estimate Growth SLA Name CCD Number 2/12/2005 31/5/2010 (%)
168
Canada Bay (A) - Concord 1-41-01-01 632 2198 247.78 Canada Bay (A) - Concord 1-41-01-02 140 153 9.29 Canada Bay (A) - Concord 1-41-01-03 546 569 4.21 Canada Bay (A) - Concord 1-41-01-04 647 655 1.24 Canada Bay (A) - Concord 1-41-01-05 603 646 7.13 Canada Bay (A) - Concord 1-41-01-06 669 700 4.63 Canada Bay (A) - Concord 1-41-01-07 450 460 2.22 Canada Bay (A) - Concord 1-41-01-08 593 611 3.04 Canada Bay (A) - Concord 1-41-01-09 279 286 2.51 Canada Bay (A) - Concord 1-41-01-10 296 343 15.88 Canada Bay (A) - Concord 1-41-01-11 210 228 8.57 Canada Bay (A) - Concord 1-41-01-12 96 109 13.54 Canada Bay (A) - Concord 1-41-01-13 446 463 3.81 Canada Bay (A) - Concord 1-41-01-14 381 678 77.95 Canada Bay (A) - Concord 1-41-01-16 539 560 3.90 Canada Bay (A) - Concord 1-41-01-17 448 462 3.12 Canada Bay (A) - Concord 1-41-01-18 427 447 4.68 Canada Bay (A) - Concord 1-41-02-01 322 532 65.22 Canada Bay (A) - Concord 1-41-02-02 609 644 5.75 Canada Bay (A) - Concord 1-41-02-03 1317 1810 37.43 Canada Bay (A) - Concord 1-41-02-04 363 385 6.06 Canada Bay (A) - Concord 1-41-02-05 673 720 6.98 Canada Bay (A) - Concord 1-41-02-06 146 156 6.85 Canada Bay (A) - Concord 1-41-02-07 362 384 6.08 Canada Bay (A) - Concord 1-41-02-08 251 261 3.98 Canada Bay (A) - Concord 1-41-02-09 320 327 2.19 Canada Bay (A) - Concord 1-41-02-10 256 276 7.81 Canada Bay (A) - Concord 1-41-02-11 326 351 7.67 Canada Bay (A) - Concord 1-41-02-12 250 289 15.60 Canada Bay (A) - Concord 1-41-02-13 550 570 3.64 Canada Bay (A) - Concord 1-41-02-14 341 348 2.05 Canada Bay (A) - Concord 1-41-02-15 682 1471 115.69 Canada Bay (A) - Concord 1-41-03-01 584 614 5.14 Canada Bay (A) - Concord 1-41-03-02 526 566 7.60 Canada Bay (A) - Concord 1-41-03-03 417 439 5.28 Canada Bay (A) - Concord 1-41-03-04 354 374 5.65 Canada Bay (A) - Concord 1-41-03-05 194 215 10.82 Canada Bay (A) - Concord 1-41-03-06 431 443 2.78 Canada Bay (A) - Concord 1-41-03-07 529 557 5.29 Canada Bay (A) - Concord 1-41-03-08 335 352 5.07 Canada Bay (A) - Concord 1-41-03-09 536 549 2.43 Canada Bay (A) - Concord 1-41-03-10 340 348 2.35

New South Wales Redistribution Statistics 2006
Enrolment Projections Lowe
Actual Enrolment Estimate Growth SLA Name CCD Number 2/12/2005 31/5/2010 (%)
169
Canada Bay (A) - Concord 1-41-03-11 144 156 8.33 Canada Bay (A) - Concord 1-41-03-12 542 638 17.71 Canada Bay (A) - Concord 1-41-03-13 225 244 8.44 Canada Bay (A) - Concord 1-41-03-14 437 652 49.20 Canada Bay (A) - Concord 46 19764 24239 22.64 Canada Bay (A) - Drummoyne 1-41-18-01 234 229 -2.14 Canada Bay (A) - Drummoyne 1-41-18-02 314 317 0.96 Canada Bay (A) - Drummoyne 1-41-18-03 497 729 46.68 Canada Bay (A) - Drummoyne 1-41-18-04 272 280 2.94 Canada Bay (A) - Drummoyne 1-41-18-05 574 685 19.34 Canada Bay (A) - Drummoyne 1-41-18-06 533 548 2.81 Canada Bay (A) - Drummoyne 1-41-18-07 291 285 -2.06 Canada Bay (A) - Drummoyne 1-41-18-08 389 382 -1.80 Canada Bay (A) - Drummoyne 1-41-18-09 296 294 -0.68 Canada Bay (A) - Drummoyne 1-41-18-10 326 348 6.75 Canada Bay (A) - Drummoyne 1-41-18-11 572 677 18.36 Canada Bay (A) - Drummoyne 1-41-18-12 382 381 -0.26 Canada Bay (A) - Drummoyne 1-41-18-13 294 288 -2.04 Canada Bay (A) - Drummoyne 1-41-18-14 233 228 -2.15 Canada Bay (A) - Drummoyne 1-41-19-01 360 364 1.11 Canada Bay (A) - Drummoyne 1-41-19-02 247 256 3.64 Canada Bay (A) - Drummoyne 1-41-19-03 421 415 -1.43 Canada Bay (A) - Drummoyne 1-41-19-04 401 399 -0.50 Canada Bay (A) - Drummoyne 1-41-19-05 579 579 0.00 Canada Bay (A) - Drummoyne 1-41-19-06 252 248 -1.59 Canada Bay (A) - Drummoyne 1-41-19-07 234 236 0.85 Canada Bay (A) - Drummoyne 1-41-19-08 284 287 1.06 Canada Bay (A) - Drummoyne 1-41-19-09 428 462 7.94 Canada Bay (A) - Drummoyne 1-41-19-10 304 300 -1.32 Canada Bay (A) - Drummoyne 1-41-19-11 485 484 -0.21 Canada Bay (A) - Drummoyne 1-41-19-12 356 363 1.97 Canada Bay (A) - Drummoyne 1-41-19-13 250 257 2.80 Canada Bay (A) - Drummoyne 1-41-19-14 451 441 -2.22 Canada Bay (A) - Drummoyne 1-41-19-15 367 362 -1.36 Canada Bay (A) - Drummoyne 1-41-20-01 237 233 -1.69 Canada Bay (A) - Drummoyne 1-41-20-02 390 410 5.13 Canada Bay (A) - Drummoyne 1-41-20-03 431 431 0.00 Canada Bay (A) - Drummoyne 1-41-20-04 149 147 -1.34 Canada Bay (A) - Drummoyne 1-41-20-05 972 1472 51.44 Canada Bay (A) - Drummoyne 1-41-20-06 713 701 -1.68
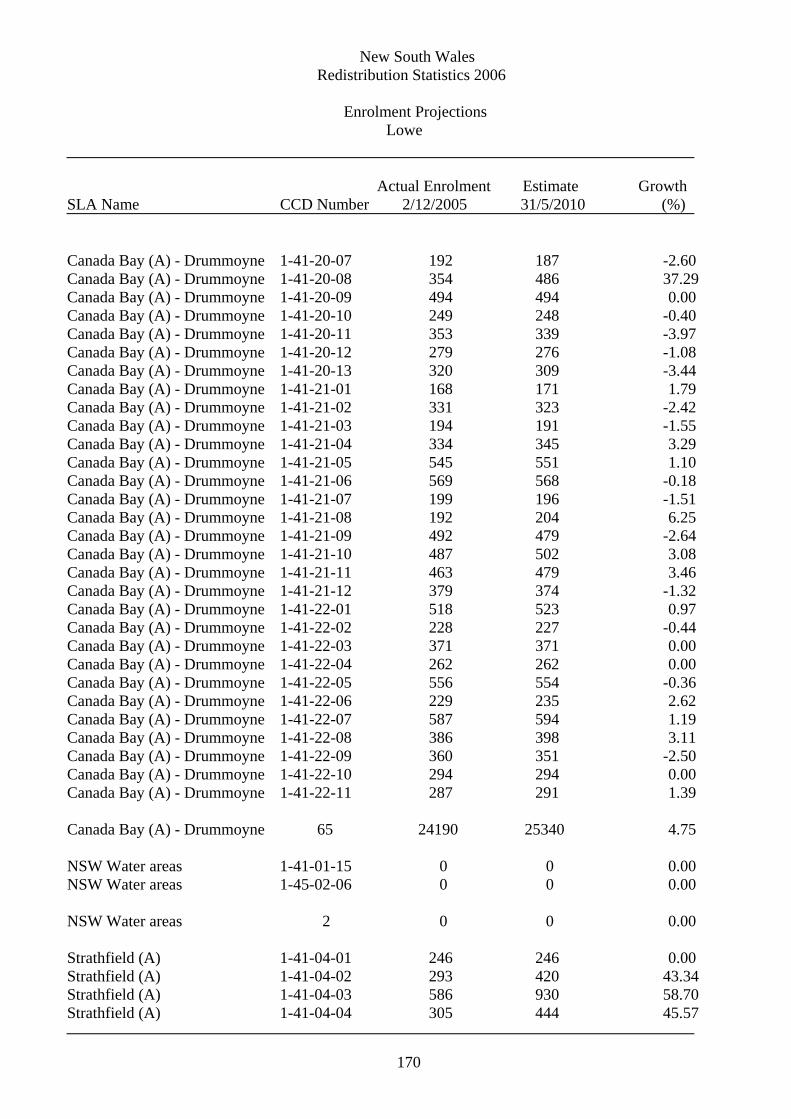
New South Wales Redistribution Statistics 2006
Enrolment Projections Lowe
Actual Enrolment Estimate Growth SLA Name CCD Number 2/12/2005 31/5/2010 (%)
170
Canada Bay (A) - Drummoyne 1-41-20-07 192 187 -2.60 Canada Bay (A) - Drummoyne 1-41-20-08 354 486 37.29 Canada Bay (A) - Drummoyne 1-41-20-09 494 494 0.00 Canada Bay (A) - Drummoyne 1-41-20-10 249 248 -0.40 Canada Bay (A) - Drummoyne 1-41-20-11 353 339 -3.97 Canada Bay (A) - Drummoyne 1-41-20-12 279 276 -1.08 Canada Bay (A) - Drummoyne 1-41-20-13 320 309 -3.44 Canada Bay (A) - Drummoyne 1-41-21-01 168 171 1.79 Canada Bay (A) - Drummoyne 1-41-21-02 331 323 -2.42 Canada Bay (A) - Drummoyne 1-41-21-03 194 191 -1.55 Canada Bay (A) - Drummoyne 1-41-21-04 334 345 3.29 Canada Bay (A) - Drummoyne 1-41-21-05 545 551 1.10 Canada Bay (A) - Drummoyne 1-41-21-06 569 568 -0.18 Canada Bay (A) - Drummoyne 1-41-21-07 199 196 -1.51 Canada Bay (A) - Drummoyne 1-41-21-08 192 204 6.25 Canada Bay (A) - Drummoyne 1-41-21-09 492 479 -2.64 Canada Bay (A) - Drummoyne 1-41-21-10 487 502 3.08 Canada Bay (A) - Drummoyne 1-41-21-11 463 479 3.46 Canada Bay (A) - Drummoyne 1-41-21-12 379 374 -1.32 Canada Bay (A) - Drummoyne 1-41-22-01 518 523 0.97 Canada Bay (A) - Drummoyne 1-41-22-02 228 227 -0.44 Canada Bay (A) - Drummoyne 1-41-22-03 371 371 0.00 Canada Bay (A) - Drummoyne 1-41-22-04 262 262 0.00 Canada Bay (A) - Drummoyne 1-41-22-05 556 554 -0.36 Canada Bay (A) - Drummoyne 1-41-22-06 229 235 2.62 Canada Bay (A) - Drummoyne 1-41-22-07 587 594 1.19 Canada Bay (A) - Drummoyne 1-41-22-08 386 398 3.11 Canada Bay (A) - Drummoyne 1-41-22-09 360 351 -2.50 Canada Bay (A) - Drummoyne 1-41-22-10 294 294 0.00 Canada Bay (A) - Drummoyne 1-41-22-11 287 291 1.39 Canada Bay (A) - Drummoyne 65 24190 25340 4.75 NSW Water areas 1-41-01-15 0 0 0.00 NSW Water areas 1-45-02-06 0 0 0.00 NSW Water areas 2 0 0 0.00 Strathfield (A) 1-41-04-01 246 246 0.00 Strathfield (A) 1-41-04-02 293 420 43.34 Strathfield (A) 1-41-04-03 586 930 58.70 Strathfield (A) 1-41-04-04 305 444 45.57

New South Wales Redistribution Statistics 2006
Enrolment Projections Lowe
Actual Enrolment Estimate Growth SLA Name CCD Number 2/12/2005 31/5/2010 (%)
171
Strathfield (A) 1-41-04-05 555 569 2.52 Strathfield (A) 1-41-04-06 433 664 53.35 Strathfield (A) 1-41-04-07 317 542 70.98 Strathfield (A) 1-41-04-08 279 335 20.07 Strathfield (A) 1-41-04-09 286 398 39.16 Strathfield (A) 1-41-04-10 432 465 7.64 Strathfield (A) 1-41-04-11 661 665 0.61 Strathfield (A) 1-41-05-01 368 374 1.63 Strathfield (A) 1-41-05-02 521 522 0.19 Strathfield (A) 1-41-05-03 469 634 35.18 Strathfield (A) 1-41-05-04 415 432 4.10 Strathfield (A) 1-41-05-05 346 342 -1.16 Strathfield (A) 1-41-05-06 737 756 2.58 Strathfield (A) 1-41-05-07 321 370 15.26 Strathfield (A) 1-41-05-08 357 368 3.08 Strathfield (A) 1-41-05-09 161 164 1.86 Strathfield (A) 1-41-05-10 283 284 0.35 Strathfield (A) 1-41-05-11 295 290 -1.69 Strathfield (A) 1-41-05-12 311 314 0.96 Strathfield (A) 1-41-06-01 427 458 7.26 Strathfield (A) 1-41-06-02 348 358 2.87 Strathfield (A) 1-41-06-03 274 283 3.28 Strathfield (A) 1-41-06-04 418 437 4.55 Strathfield (A) 1-41-06-05 691 721 4.34 Strathfield (A) 1-41-06-06 701 727 3.71 Strathfield (A) 1-41-06-07 372 374 0.54 Strathfield (A) 1-41-06-08 315 336 6.67 Strathfield (A) 1-41-06-09 699 717 2.58 Strathfield (A) 1-41-06-10 647 662 2.32 Strathfield (A) 1-41-07-01 444 460 3.60 Strathfield (A) 1-41-07-02 345 340 -1.45 Strathfield (A) 35 14658 16401 11.89 Lowe 226 87038 95444 9.66

New South Wales Redistribution Statistics 2006
Enrolment Projections Lyne
Actual Enrolment Estimate Growth SLA Name CCD Number 2/12/2005 31/5/2010 (%)
172
Greater Taree (C) 1-09-09-01 95 99 4.21 Greater Taree (C) 1-09-09-02 195 195 0.00 Greater Taree (C) 1-09-09-03 258 283 9.69 Greater Taree (C) 1-09-09-04 235 239 1.70 Greater Taree (C) 1-09-09-05 424 472 11.32 Greater Taree (C) 1-09-09-06 215 217 0.93 Greater Taree (C) 1-09-09-07 131 133 1.53 Greater Taree (C) 1-09-09-08 276 289 4.71 Greater Taree (C) 1-09-09-09 249 255 2.41 Greater Taree (C) 1-09-09-10 436 513 17.66 Greater Taree (C) 1-09-09-11 358 362 1.12 Greater Taree (C) 1-09-09-12 270 273 1.11 Greater Taree (C) 1-09-09-13 347 367 5.76 Greater Taree (C) 1-09-10-01 423 666 57.45 Greater Taree (C) 1-09-10-02 191 198 3.66 Greater Taree (C) 1-09-10-03 94 104 10.64 Greater Taree (C) 1-09-10-04 254 266 4.72 Greater Taree (C) 1-09-10-05 381 404 6.04 Greater Taree (C) 1-09-10-06 195 193 -1.03 Greater Taree (C) 1-09-10-07 226 233 3.10 Greater Taree (C) 1-09-10-08 288 305 5.90 Greater Taree (C) 1-09-10-09 298 319 7.05 Greater Taree (C) 1-09-10-10 539 698 29.50 Greater Taree (C) 1-09-10-11 179 173 -3.35 Greater Taree (C) 1-09-10-12 401 407 1.50 Greater Taree (C) 1-09-10-13 66 65 -1.52 Greater Taree (C) 1-09-11-01 591 600 1.52 Greater Taree (C) 1-09-11-02 534 560 4.87 Greater Taree (C) 1-09-11-03 646 662 2.48 Greater Taree (C) 1-09-11-04 571 603 5.60 Greater Taree (C) 1-09-11-05 307 324 5.54 Greater Taree (C) 1-09-11-06 382 389 1.83 Greater Taree (C) 1-09-11-07 426 431 1.17 Greater Taree (C) 1-09-11-08 218 215 -1.38 Greater Taree (C) 1-09-11-09 283 288 1.77 Greater Taree (C) 1-09-11-10 384 384 0.00 Greater Taree (C) 1-09-11-11 317 313 -1.26 Greater Taree (C) 1-09-11-12 368 389 5.71 Greater Taree (C) 1-09-12-01 346 342 -1.16 Greater Taree (C) 1-09-12-02 388 395 1.80 Greater Taree (C) 1-09-12-03 394 407 3.30 Greater Taree (C) 1-09-12-04 383 394 2.87

New South Wales Redistribution Statistics 2006
Enrolment Projections Lyne
Actual Enrolment Estimate Growth SLA Name CCD Number 2/12/2005 31/5/2010 (%)
173
Greater Taree (C) 1-09-12-05 299 300 0.33 Greater Taree (C) 1-09-12-06 307 311 1.30 Greater Taree (C) 1-09-12-07 346 346 0.00 Greater Taree (C) 1-09-12-08 365 383 4.93 Greater Taree (C) 1-09-12-09 193 205 6.22 Greater Taree (C) 1-09-12-10 472 483 2.33 Greater Taree (C) 1-09-12-11 526 556 5.70 Greater Taree (C) 1-09-12-12 226 235 3.98 Greater Taree (C) 1-09-12-13 257 301 17.12 Greater Taree (C) 1-09-13-01 425 433 1.88 Greater Taree (C) 1-09-13-02 519 537 3.47 Greater Taree (C) 1-09-13-03 381 397 4.20 Greater Taree (C) 1-09-13-04 713 709 -0.56 Greater Taree (C) 1-09-13-05 291 298 2.41 Greater Taree (C) 1-09-13-06 640 711 11.09 Greater Taree (C) 1-09-13-07 349 354 1.43 Greater Taree (C) 1-09-14-01 198 193 -2.53 Greater Taree (C) 1-09-14-02 193 197 2.07 Greater Taree (C) 1-09-14-03 306 332 8.50 Greater Taree (C) 1-09-14-04 232 239 3.02 Greater Taree (C) 1-09-14-05 371 446 20.22 Greater Taree (C) 1-09-14-06 515 658 27.77 Greater Taree (C) 1-09-14-07 722 818 13.30 Greater Taree (C) 1-09-14-08 373 406 8.85 Greater Taree (C) 1-09-14-09 644 833 29.35 Greater Taree (C) 1-09-14-10 617 659 6.81 Greater Taree (C) 1-09-14-11 298 342 14.77 Greater Taree (C) 1-09-15-01 80 77 -3.75 Greater Taree (C) 1-09-15-02 244 253 3.69 Greater Taree (C) 1-09-15-03 449 465 3.56 Greater Taree (C) 1-09-15-04 93 93 0.00 Greater Taree (C) 1-09-15-05 307 325 5.86 Greater Taree (C) 1-09-15-06 248 254 2.42 Greater Taree (C) 1-09-15-07 380 416 9.47 Greater Taree (C) 1-09-15-08 381 425 11.55 Greater Taree (C) 1-09-15-09 658 874 32.83 Greater Taree (C) 1-09-15-10 357 421 17.93 Greater Taree (C) 1-09-15-11 173 181 4.62 Greater Taree (C) 1-09-15-12 564 791 40.25 Greater Taree (C) 1-09-23-01 246 249 1.22 Greater Taree (C) 1-09-23-02 527 552 4.74 Greater Taree (C) 1-09-23-03 292 289 -1.03

New South Wales Redistribution Statistics 2006
Enrolment Projections Lyne
Actual Enrolment Estimate Growth SLA Name CCD Number 2/12/2005 31/5/2010 (%)
174
Greater Taree (C) 1-09-23-06 388 401 3.35
Greater Taree (C) 1-09-23-08 321 328 2.18
Greater Taree (C) 1-09-23-04 223 230 3.14 Greater Taree (C) 1-09-23-05 449 479 6.68
Greater Taree (C) 1-09-23-07 551 568 3.09
Greater Taree (C) 1-09-23-09 484 505 4.34 Greater Taree (C) 1-09-23-10 146 148 1.37 Greater Taree (C) 91 31901 34430 7.93 Hastings (A) - Pt A 1-09-01-08 461 486 5.42 Hastings (A) - Pt A 1-09-02-01 678 735 8.41 Hastings (A) - Pt A 1-09-02-02 433 457 5.54 Hastings (A) - Pt A 1-09-02-03 392 431 9.95 Hastings (A) - Pt A 1-09-02-04 358 369 3.07 Hastings (A) - Pt A 1-09-02-05 691 772 11.72 Hastings (A) - Pt A 1-09-02-06 322 328 1.86 Hastings (A) - Pt A 1-09-02-07 182 191 4.95 Hastings (A) - Pt A 1-09-02-08 308 314 1.95 Hastings (A) - Pt A 1-09-02-09 732 739 0.96 Hastings (A) - Pt A 1-09-02-10 283 473 67.14 Hastings (A) - Pt A 1-09-02-11 399 415 4.01 Hastings (A) - Pt A 1-09-02-12 307 328 6.84 Hastings (A) - Pt A 1-09-02-13 384 386 0.52 Hastings (A) - Pt A 1-09-03-01 87 88 1.15 Hastings (A) - Pt A 1-09-03-02 237 249 5.06 Hastings (A) - Pt A 1-09-03-03 159 166 4.40 Hastings (A) - Pt A 1-09-03-04 523 594 13.58 Hastings (A) - Pt A 1-09-03-05 387 440 13.70 Hastings (A) - Pt A 1-09-03-06 278 294 5.76 Hastings (A) - Pt A 1-09-03-07 228 250 9.65 Hastings (A) - Pt A 1-09-03-08 198 205 3.54 Hastings (A) - Pt A 1-09-03-09 218 230 5.50 Hastings (A) - Pt A 1-09-03-10 187 197 5.35 Hastings (A) - Pt A 1-09-03-11 221 236 6.79 Hastings (A) - Pt A 1-09-03-12 183 209 14.21 Hastings (A) - Pt A 1-09-03-13 193 229 18.65 Hastings (A) - Pt A 1-09-04-01 637 669 5.02 Hastings (A) - Pt A 1-09-04-02 317 333 5.05 Hastings (A) - Pt A 1-09-04-03 323 338 4.64 Hastings (A) - Pt A 1-09-04-04 283 337 19.08 Hastings (A) - Pt A 1-09-04-05 350 363 3.71

New South Wales Redistribution Statistics 2006
Enrolment Projections Lyne
Actual Enrolment Estimate Growth SLA Name CCD Number 2/12/2005 31/5/2010 (%)
175
Hastings (A) - Pt A 1-09-04-06 454 475 4.63 Hastings (A) - Pt A 1-09-04-07 447 465 4.03 Hastings (A) - Pt A 1-09-04-08 319 328 2.82 Hastings (A) - Pt A 1-09-04-09 369 380 2.98 Hastings (A) - Pt A 1-09-04-10 272 289 6.25 Hastings (A) - Pt A 1-09-04-11 271 281 3.69 Hastings (A) - Pt A 1-09-05-01 371 390 5.12 Hastings (A) - Pt A 1-09-05-02 753 1041 38.25 Hastings (A) - Pt A 1-09-05-03 750 784 4.53 Hastings (A) - Pt A 1-09-05-04 553 567 2.53 Hastings (A) - Pt A 1-09-05-05 384 394 2.60 Hastings (A) - Pt A 1-09-05-06 567 586 3.35 Hastings (A) - Pt A 1-09-05-07 627 654 4.31 Hastings (A) - Pt A 1-09-05-08 559 573 2.50 Hastings (A) - Pt A 1-09-05-09 292 300 2.74 Hastings (A) - Pt A 1-09-05-10 1096 1370 25.00 Hastings (A) - Pt A 1-09-05-11 298 314 5.37 Hastings (A) - Pt A 1-09-05-12 745 832 11.68 Hastings (A) - Pt A 1-09-06-10 203 356 75.37 Hastings (A) - Pt A 1-09-25-01 544 572 5.15 Hastings (A) - Pt A 1-09-25-02 1312 1758 33.99 Hastings (A) - Pt A 1-09-25-03 689 759 10.16 Hastings (A) - Pt A 1-09-25-04 915 938 2.51 Hastings (A) - Pt A 1-09-25-05 443 482 8.80 Hastings (A) - Pt A 1-09-25-06 781 841 7.68 Hastings (A) - Pt A 1-09-25-07 383 413 7.83 Hastings (A) - Pt A 1-09-25-08 417 472 13.19 Hastings (A) - Pt A 1-09-25-09 1440 1621 12.57 Hastings (A) - Pt A 1-09-25-10 337 355 5.34 Hastings (A) - Pt A 1-09-25-11 662 780 17.82 Hastings (A) - Pt A 62 28192 31221 10.74 Hastings (A) - Pt B 1-09-01-01 125 128 2.40 Hastings (A) - Pt B 1-09-01-02 200 207 3.50 Hastings (A) - Pt B 1-09-01-03 372 393 5.65 Hastings (A) - Pt B 1-09-01-04 131 138 5.34 Hastings (A) - Pt B 1-09-01-05 99 100 1.01 Hastings (A) - Pt B 1-09-01-06 350 363 3.71 Hastings (A) - Pt B 1-09-01-07 466 481 3.22 Hastings (A) - Pt B 1-09-01-09 302 316 4.64 Hastings (A) - Pt B 1-09-01-10 402 425 5.72

New South Wales Redistribution Statistics 2006
Enrolment Projections Lyne
Actual Enrolment Estimate Growth SLA Name CCD Number 2/12/2005 31/5/2010 (%)
176
Hastings (A) - Pt B 1-09-01-11 286 305 6.64 Hastings (A) - Pt B 1-09-06-01 401 482 20.20 Hastings (A) - Pt B 1-09-06-02 375 392 4.53 Hastings (A) - Pt B 1-09-06-03 421 447 6.18 Hastings (A) - Pt B 1-09-06-04 494 531 7.49 Hastings (A) - Pt B 1-09-06-05 569 620 8.96 Hastings (A) - Pt B 1-09-06-06 291 316 8.59 Hastings (A) - Pt B 1-09-06-07 482 513 6.43 Hastings (A) - Pt B 1-09-06-08 495 578 16.77 Hastings (A) - Pt B 1-09-06-09 289 321 11.07 Hastings (A) - Pt B 1-09-06-11 799 1118 39.92 Hastings (A) - Pt B 1-09-06-12 690 789 14.35 Hastings (A) - Pt B 1-09-07-01 365 388 6.30 Hastings (A) - Pt B 1-09-07-02 561 583 3.92 Hastings (A) - Pt B 1-09-07-03 918 1020 11.11 Hastings (A) - Pt B 1-09-07-04 391 430 9.97 Hastings (A) - Pt B 1-09-07-05 223 240 7.62 Hastings (A) - Pt B 1-09-07-06 315 327 3.81 Hastings (A) - Pt B 1-09-07-07 294 301 2.38 Hastings (A) - Pt B 1-09-07-08 394 410 4.06 Hastings (A) - Pt B 1-09-07-09 392 397 1.28 Hastings (A) - Pt B 1-09-07-10 314 347 10.51 Hastings (A) - Pt B 1-09-07-11 321 325 1.25 Hastings (A) - Pt B 1-09-07-12 463 526 13.61 Hastings (A) - Pt B 1-09-07-13 97 102 5.15 Hastings (A) - Pt B 1-09-07-14 389 514 32.13 Hastings (A) - Pt B 1-09-07-15 193 222 15.03 Hastings (A) - Pt B 1-09-07-16 500 564 12.80 Hastings (A) - Pt B 1-09-08-01 67 69 2.99 Hastings (A) - Pt B 1-09-08-02 289 301 4.15 Hastings (A) - Pt B 1-09-08-03 295 309 4.75 Hastings (A) - Pt B 1-09-08-04 104 109 4.81 Hastings (A) - Pt B 1-09-08-05 304 320 5.26 Hastings (A) - Pt B 1-09-08-06 506 554 9.49 Hastings (A) - Pt B 1-09-08-07 508 546 7.48 Hastings (A) - Pt B 1-09-08-08 78 85 8.97 Hastings (A) - Pt B 1-09-08-09 404 444 9.90 Hastings (A) - Pt B 1-09-08-10 231 237 2.60 Hastings (A) - Pt B 1-09-22-01 391 404 3.32 Hastings (A) - Pt B 1-09-22-02 311 326 4.82 Hastings (A) - Pt B 1-09-22-03 334 344 2.99 Hastings (A) - Pt B 1-09-22-04 356 394 10.67

New South Wales Redistribution Statistics 2006
Enrolment Projections Lyne
Actual Enrolment Estimate Growth SLA Name CCD Number 2/12/2005 31/5/2010 (%)
177
Hastings (A) - Pt B 1-09-22-05 258 326 26.36 Hastings (A) - Pt B 1-09-22-06 504 526 4.37 Hastings (A) - Pt B 1-09-22-07 422 443 4.98 Hastings (A) - Pt B 1-09-22-08 858 1052 22.61 Hastings (A) - Pt B 1-09-22-09 303 317 4.62 Hastings (A) - Pt B 56 20692 22765 10.02 Kempsey (A) 1-08-12-03 286 293 2.45 Kempsey (A) 1-08-12-04 94 93 -1.06 Kempsey (A) 1-08-12-05 290 296 2.07 Kempsey (A) 1-08-12-06 89 87 -2.25 Kempsey (A) 1-08-12-07 438 442 0.91 Kempsey (A) 1-08-12-08 444 472 6.31 Kempsey (A) 1-08-12-09 313 332 6.07 Kempsey (A) 1-08-12-10 523 587 12.24 Kempsey (A) 1-08-12-12 201 222 10.45 Kempsey (A) 1-08-13-02 646 709 9.75 Kempsey (A) 1-08-13-07 139 138 -0.72 Kempsey (A) 1-08-13-08 156 194 24.36 Kempsey (A) 1-08-14-01 394 406 3.05 Kempsey (A) 1-08-14-02 640 672 5.00 Kempsey (A) 1-08-14-03 306 307 0.33 Kempsey (A) 1-08-14-04 292 296 1.37 Kempsey (A) 1-08-14-05 352 353 0.28 Kempsey (A) 1-08-14-06 243 242 -0.41 Kempsey (A) 1-08-14-07 163 170 4.29 Kempsey (A) 1-08-14-08 351 353 0.57 Kempsey (A) 1-08-14-09 385 395 2.60 Kempsey (A) 1-08-14-10 382 378 -1.05 Kempsey (A) 1-08-14-11 411 427 3.89 Kempsey (A) 1-08-14-12 155 155 0.00 Kempsey (A) 1-08-15-01 377 409 8.49 Kempsey (A) 1-08-15-02 322 356 10.56 Kempsey (A) 1-08-15-03 338 340 0.59 Kempsey (A) 1-08-15-04 419 470 12.17 Kempsey (A) 1-08-15-05 380 420 10.53 Kempsey (A) 1-08-15-06 252 250 -0.79 Kempsey (A) 1-08-15-07 390 426 9.23 Kempsey (A) 1-08-15-08 244 271 11.07 Kempsey (A) 1-08-15-09 282 294 4.26 Kempsey (A) 1-08-15-10 304 303 -0.33

New South Wales Redistribution Statistics 2006
Enrolment Projections Lyne
Actual Enrolment Estimate Growth SLA Name CCD Number 2/12/2005 31/5/2010 (%)
178
Kempsey (A) 1-08-15-11 270 276 2.22 Kempsey (A) 35 11271 11834 5.00 Lyne 244 92056 100250 8.90

New South Wales Redistribution Statistics 2006
Enrolment Projections Macarthur
Actual Enrolment Estimate Growth SLA Name CCD Number 2/12/2005 31/5/2010 (%)
179
Camden (A) 1-29-14-01 578 630 9.00 Camden (A) 1-29-14-02 679 740 8.98 Camden (A) 1-29-14-03 586 633 8.02 Camden (A) 1-29-14-04 704 796 13.07 Camden (A) 1-29-14-05 329 356 8.21 Camden (A) 1-29-14-06 649 701 8.01 Camden (A) 1-29-14-07 446 476 6.73 Camden (A) 1-29-14-08 606 847 39.77 Camden (A) 1-29-14-09 566 620 9.54 Camden (A) 1-29-14-10 477 668 40.04 Camden (A) 1-29-15-01 409 450 10.02 Camden (A) 1-29-15-02 497 547 10.06 Camden (A) 1-29-15-03 438 482 10.05 Camden (A) 1-29-15-04 542 766 41.33 Camden (A) 1-29-15-05 564 663 17.55 Camden (A) 1-29-15-06 734 1003 36.65 Camden (A) 1-29-15-07 385 421 9.35 Camden (A) 1-29-15-08 302 782 158.94 Camden (A) 1-29-15-09 267 294 10.11 Camden (A) 1-29-15-10 779 900 15.53 Camden (A) 1-29-15-11 366 415 13.39 Camden (A) 1-29-15-12 807 889 10.16 Camden (A) 1-29-15-13 695 775 11.51 Camden (A) 1-29-15-14 439 475 8.20 Camden (A) 1-29-15-15 515 560 8.74 Camden (A) 1-29-15-16 696 966 38.79 Camden (A) 1-29-15-17 1505 2033 35.08 Camden (A) 1-29-15-18 634 754 18.93 Camden (A) 1-29-16-01 84 117 39.29 Camden (A) 1-29-16-02 291 366 25.77 Camden (A) 1-29-16-03 356 551 54.78 Camden (A) 1-29-16-04 538 625 16.17 Camden (A) 1-29-16-05 561 659 17.47 Camden (A) 1-29-16-06 638 729 14.26 Camden (A) 1-29-16-07 615 697 13.33 Camden (A) 1-29-16-08 595 683 14.79 Camden (A) 1-29-16-09 360 417 15.83 Camden (A) 1-29-16-10 318 371 16.67 Camden (A) 1-29-19-01 1341 2121 58.17 Camden (A) 1-29-19-02 722 795 10.11 Camden (A) 1-29-19-03 711 791 11.25 Camden (A) 1-29-19-04 809 909 12.36

New South Wales Redistribution Statistics 2006
Enrolment Projections Macarthur
Actual Enrolment Estimate Growth SLA Name CCD Number 2/12/2005 31/5/2010 (%)
180
Campbelltown (C) 1-30-03-07 503 535 6.36
Camden (A) 1-29-19-05 181 581 220.99 Camden (A) 1-29-19-06 907 1000 10.25 Camden (A) 1-29-19-07 406 477 17.49 Camden (A) 1-29-19-08 817 900 10.16 Camden (A) 1-29-19-09 1080 1242 15.00 Camden (A) 1-29-19-10 623 715 14.77 Camden (A) 1-29-19-11 893 987 10.53 Camden (A) 1-29-19-12 593 655 10.46 Camden (A) 1-29-19-13 780 852 9.23 Camden (A) 1-29-19-14 672 1142 69.94 Camden (A) 52 31085 38024 22.32 Campbelltown (C) 1-30-03-01 476 483 1.47 Campbelltown (C) 1-30-03-02 396 409 3.28 Campbelltown (C) 1-30-03-03 299 310 3.68 Campbelltown (C) 1-30-03-04 568 578 1.76 Campbelltown (C) 1-30-03-05 401 416 3.74 Campbelltown (C) 1-30-03-06 536 545 1.68
Campbelltown (C) 1-30-03-08 349 370 6.02 Campbelltown (C) 1-30-03-09 630 648 2.86 Campbelltown (C) 1-30-03-10 382 393 2.88 Campbelltown (C) 1-30-03-11 701 728 3.85 Campbelltown (C) 1-30-03-12 314 315 0.32 Campbelltown (C) 1-30-03-13 627 652 3.99 Campbelltown (C) 1-30-04-02 587 601 2.39 Campbelltown (C) 1-30-04-03 1564 1995 27.56 Campbelltown (C) 1-30-04-04 698 805 15.33 Campbelltown (C) 1-30-04-05 338 354 4.73 Campbelltown (C) 1-30-04-06 240 259 7.92 Campbelltown (C) 1-30-04-07 641 656 2.34 Campbelltown (C) 1-30-04-08 323 339 4.95 Campbelltown (C) 1-30-04-09 491 508 3.46 Campbelltown (C) 1-30-04-10 219 235 7.31 Campbelltown (C) 1-30-04-11 250 305 22.00 Campbelltown (C) 1-30-04-12 188 203 7.98 Campbelltown (C) 1-30-05-01 473 484 2.33 Campbelltown (C) 1-30-05-02 908 962 5.95 Campbelltown (C) 1-30-05-03 612 622 1.63 Campbelltown (C) 1-30-05-04 353 353 0.00 Campbelltown (C) 1-30-05-05 341 355 4.11

New South Wales Redistribution Statistics 2006
Enrolment Projections Macarthur
Actual Enrolment Estimate Growth SLA Name CCD Number 2/12/2005 31/5/2010 (%)
181
Campbelltown (C) 1-30-05-06 587 607 3.41 Campbelltown (C) 1-30-05-07 401 420 4.74 Campbelltown (C) 1-30-05-08 475 498 4.84 Campbelltown (C) 1-30-05-09 360 366 1.67 Campbelltown (C) 1-30-05-10 552 567 2.72 Campbelltown (C) 1-30-05-11 713 732 2.66 Campbelltown (C) 1-30-06-01 375 382 1.87 Campbelltown (C) 1-30-06-02 668 1336 100.00 Campbelltown (C) 1-30-06-03 363 372 2.48 Campbelltown (C) 1-30-06-04 377 387 2.65 Campbelltown (C) 1-30-06-05 456 467 2.41 Campbelltown (C) 1-30-06-06 434 469 8.06 Campbelltown (C) 1-30-06-07 621 632 1.77 Campbelltown (C) 1-30-06-08 544 592 8.82 Campbelltown (C) 1-30-06-09 193 1042 439.90 Campbelltown (C) 1-30-06-10 168 167 -0.60 Campbelltown (C) 1-30-06-11 468 484 3.42 Campbelltown (C) 1-30-06-12 456 466 2.19 Campbelltown (C) 1-30-06-13 365 374 2.47 Campbelltown (C) 1-30-06-14 698 704 0.86 Campbelltown (C) 1-30-06-15 632 705 11.55 Campbelltown (C) 1-30-07-01 509 809 58.94 Campbelltown (C) 1-30-07-02 74 218 194.59 Campbelltown (C) 1-30-07-03 368 385 4.62 Campbelltown (C) 1-30-07-04 353 353 0.00 Campbelltown (C) 1-30-07-05 256 257 0.39 Campbelltown (C) 1-30-07-06 531 563 6.03 Campbelltown (C) 1-30-07-07 543 562 3.50 Campbelltown (C) 1-30-07-08 264 302 14.39 Campbelltown (C) 1-30-07-09 362 364 0.55 Campbelltown (C) 1-30-07-10 554 571 3.07 Campbelltown (C) 1-30-08-01 308 317 2.92 Campbelltown (C) 1-30-08-02 451 469 3.99 Campbelltown (C) 1-30-08-03 409 409 0.00 Campbelltown (C) 1-30-08-04 442 475 7.47 Campbelltown (C) 1-30-08-05 486 539 10.91 Campbelltown (C) 1-30-08-06 308 312 1.30 Campbelltown (C) 1-30-08-07 163 523 220.86 Campbelltown (C) 1-30-08-08 441 455 3.17 Campbelltown (C) 1-30-08-09 221 222 0.45 Campbelltown (C) 1-30-08-10 234 237 1.28 Campbelltown (C) 1-30-09-01 375 583 55.47

New South Wales Redistribution Statistics 2006
Enrolment Projections Macarthur
Actual Enrolment Estimate Growth SLA Name CCD Number 2/12/2005 31/5/2010 (%)
182
Campbelltown (C) 1-30-09-02 460 473 2.83 Campbelltown (C) 1-30-09-03 544 552 1.47 Campbelltown (C) 1-30-09-04 188 194 3.19 Campbelltown (C) 1-30-09-05 357 359 0.56 Campbelltown (C) 1-30-09-06 444 453 2.03 Campbelltown (C) 1-30-09-07 352 357 1.42 Campbelltown (C) 1-30-09-08 528 552 4.55 Campbelltown (C) 1-30-10-01 659 660 0.15 Campbelltown (C) 1-30-10-02 449 460 2.45 Campbelltown (C) 1-30-10-03 416 426 2.40 Campbelltown (C) 1-30-10-04 424 460 8.49 Campbelltown (C) 1-30-10-05 358 362 1.12 Campbelltown (C) 1-30-10-06 576 595 3.30 Campbelltown (C) 1-30-10-07 604 611 1.16 Campbelltown (C) 1-30-10-08 482 496 2.90 Campbelltown (C) 1-30-10-09 455 465 2.20 Campbelltown (C) 1-30-10-10 333 343 3.00 Campbelltown (C) 1-30-11-08 488 496 1.64 Campbelltown (C) 1-30-17-01 586 736 25.60 Campbelltown (C) 1-30-17-02 291 441 51.55 Campbelltown (C) 1-30-17-03 309 325 5.18 Campbelltown (C) 1-30-17-04 301 317 5.32 Campbelltown (C) 1-30-17-05 392 418 6.63 Campbelltown (C) 1-30-17-06 290 308 6.21 Campbelltown (C) 1-30-17-07 554 565 1.99 Campbelltown (C) 1-30-17-08 623 650 4.33 Campbelltown (C) 1-30-17-09 316 330 4.43 Campbelltown (C) 1-30-17-10 221 216 -2.26 Campbelltown (C) 1-30-17-11 445 455 2.25 Campbelltown (C) 1-30-18-01 615 700 13.82 Campbelltown (C) 1-30-18-02 230 243 5.65 Campbelltown (C) 1-30-18-03 496 510 2.82 Campbelltown (C) 1-30-18-04 594 619 4.21 Campbelltown (C) 1-30-18-05 382 388 1.57 Campbelltown (C) 1-30-18-06 509 504 -0.98 Campbelltown (C) 1-30-18-07 482 489 1.45 Campbelltown (C) 1-30-18-08 696 708 1.72 Campbelltown (C) 1-30-18-09 502 612 21.91 Campbelltown (C) 1-30-18-10 201 199 -1.00 Campbelltown (C) 1-30-18-11 644 749 16.30 Campbelltown (C) 111 49762 54908 10.34

New South Wales Redistribution Statistics 2006
Enrolment Projections Macarthur
Actual Enrolment Estimate Growth SLA Name CCD Number 2/12/2005 31/5/2010 (%)
183
Liverpool (C) 1-29-01-01 138 140 1.45 Liverpool (C) 1-29-01-02 377 379 0.53 Liverpool (C) 1-29-01-03 173 175 1.16 Liverpool (C) 1-29-01-04 241 243 0.83 Liverpool (C) 1-29-01-05 242 244 0.83 Liverpool (C) 1-29-01-06 425 427 0.47 Liverpool (C) 1-29-01-08 639 641 0.31 Liverpool (C) 1-29-01-09 384 386 0.52 Liverpool (C) 1-29-01-11 195 197 1.03 Liverpool (C) 1-29-01-12 510 512 0.39 Liverpool (C) 10 3324 3344 0.60 Wollondilly (A) 1-20-13-02 345 758 119.71 Wollondilly (A) 1 345 758 119.71 Macarthur 174 84516 97034 14.81

New South Wales Redistribution Statistics 2006
Enrolment Projections Mackellar
Actual Enrolment Estimate Growth SLA Name CCD Number 2/12/2005 31/5/2010 (%)
184
NSW Water areas 1-24-01-08 31 31 0.00 NSW Water areas 1-24-09-01 0 0 0.00 NSW Water areas 2 31 31 0.00 Pittwater (A) 1-24-01-01 78 80 2.56 Pittwater (A) 1-24-01-02 309 312 0.97 Pittwater (A) 1-24-01-03 28 28 0.00 Pittwater (A) 1-24-01-04 239 245 2.51 Pittwater (A) 1-24-01-05 470 487 3.62 Pittwater (A) 1-24-01-06 275 276 0.36 Pittwater (A) 1-24-01-07 338 359 6.21 Pittwater (A) 1-24-01-09 408 407 -0.25 Pittwater (A) 1-24-01-10 112 110 -1.79 Pittwater (A) 1-24-01-11 108 109 0.93 Pittwater (A) 1-24-02-01 512 511 -0.20 Pittwater (A) 1-24-02-02 780 1146 46.92 Pittwater (A) 1-24-02-03 746 765 2.55 Pittwater (A) 1-24-02-04 583 612 4.97 Pittwater (A) 1-24-02-05 265 265 0.00 Pittwater (A) 1-24-02-06 401 405 1.00 Pittwater (A) 1-24-02-07 488 539 10.45 Pittwater (A) 1-24-02-08 186 186 0.00 Pittwater (A) 1-24-02-09 635 648 2.05 Pittwater (A) 1-24-02-10 675 689 2.07 Pittwater (A) 1-24-02-11 328 322 -1.83 Pittwater (A) 1-24-02-12 439 477 8.66 Pittwater (A) 1-24-02-13 302 301 -0.33 Pittwater (A) 1-24-03-01 185 208 12.43 Pittwater (A) 1-24-03-02 189 195 3.17 Pittwater (A) 1-24-03-03 203 206 1.48 Pittwater (A) 1-24-03-04 181 178 -1.66 Pittwater (A) 1-24-03-05 225 229 1.78 Pittwater (A) 1-24-03-06 476 496 4.20 Pittwater (A) 1-24-03-07 352 347 -1.42 Pittwater (A) 1-24-03-08 678 703 3.69 Pittwater (A) 1-24-03-09 429 457 6.53 Pittwater (A) 1-24-03-10 170 190 11.76 Pittwater (A) 1-24-03-11 337 349 3.56 Pittwater (A) 1-24-04-01 296 288 -2.70 Pittwater (A) 1-24-04-02 621 626 0.81 Pittwater (A) 1-24-04-03 494 502 1.62

New South Wales Redistribution Statistics 2006
Enrolment Projections Mackellar
Actual Enrolment Estimate Growth SLA Name CCD Number 2/12/2005 31/5/2010 (%)
185
Pittwater (A) 1-24-05-14 299 301 0.67
Pittwater (A) 1-24-04-04 662 674 1.81 Pittwater (A) 1-24-04-05 301 299 -0.66 Pittwater (A) 1-24-04-06 460 463 0.65 Pittwater (A) 1-24-04-07 448 462 3.12 Pittwater (A) 1-24-04-08 223 231 3.59 Pittwater (A) 1-24-04-09 328 331 0.91 Pittwater (A) 1-24-04-10 529 600 13.42 Pittwater (A) 1-24-04-11 470 506 7.66 Pittwater (A) 1-24-04-12 494 496 0.40 Pittwater (A) 1-24-04-13 404 402 -0.50 Pittwater (A) 1-24-04-14 397 407 2.52 Pittwater (A) 1-24-05-01 460 457 -0.65 Pittwater (A) 1-24-05-02 385 385 0.00 Pittwater (A) 1-24-05-03 334 344 2.99 Pittwater (A) 1-24-05-04 525 533 1.52 Pittwater (A) 1-24-05-05 250 258 3.20 Pittwater (A) 1-24-05-06 236 261 10.59 Pittwater (A) 1-24-05-07 197 195 -1.02 Pittwater (A) 1-24-05-08 417 424 1.68 Pittwater (A) 1-24-05-09 405 407 0.49 Pittwater (A) 1-24-05-10 679 669 -1.47 Pittwater (A) 1-24-05-11 341 345 1.17 Pittwater (A) 1-24-05-12 429 459 6.99 Pittwater (A) 1-24-05-13 320 325 1.56
Pittwater (A) 1-24-05-15 273 274 0.37 Pittwater (A) 1-24-06-01 254 248 -2.36 Pittwater (A) 1-24-06-02 454 474 4.41 Pittwater (A) 1-24-06-03 512 534 4.30 Pittwater (A) 1-24-06-04 281 303 7.83 Pittwater (A) 1-24-06-05 242 232 -4.13 Pittwater (A) 1-24-06-06 628 654 4.14 Pittwater (A) 1-24-06-07 571 668 16.99 Pittwater (A) 1-24-06-08 461 465 0.87 Pittwater (A) 1-24-06-09 473 476 0.63 Pittwater (A) 1-24-06-10 427 429 0.47 Pittwater (A) 1-24-06-11 458 454 -0.87 Pittwater (A) 1-24-06-12 335 347 3.58 Pittwater (A) 1-24-07-01 420 432 2.86 Pittwater (A) 1-24-07-02 412 407 -1.21 Pittwater (A) 1-24-07-03 233 225 -3.43 Pittwater (A) 1-24-07-04 228 230 0.88
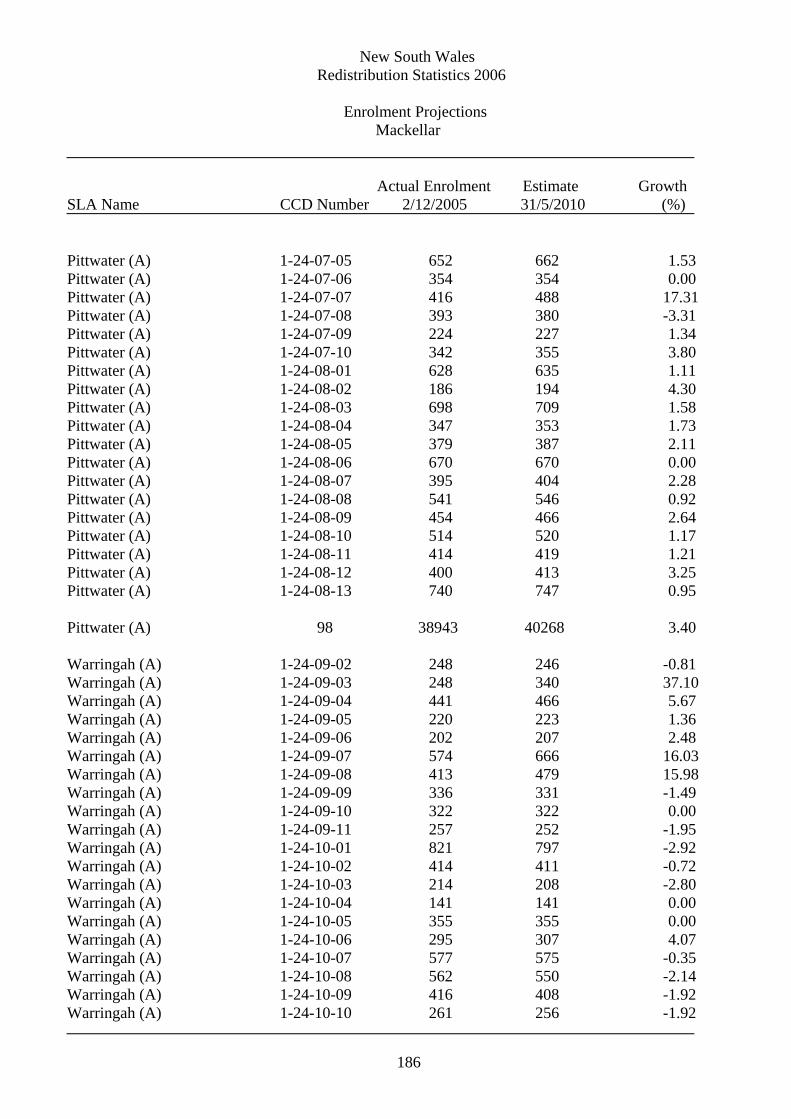
New South Wales Redistribution Statistics 2006
Enrolment Projections Mackellar
Actual Enrolment Estimate Growth SLA Name CCD Number 2/12/2005 31/5/2010 (%)
186
Pittwater (A) 1-24-07-05 652 662 1.53 Pittwater (A) 1-24-07-06 354 354 0.00 Pittwater (A) 1-24-07-07 416 488 17.31 Pittwater (A) 1-24-07-08 393 380 -3.31 Pittwater (A) 1-24-07-09 224 227 1.34 Pittwater (A) 1-24-07-10 342 355 3.80 Pittwater (A) 1-24-08-01 628 635 1.11 Pittwater (A) 1-24-08-02 186 194 4.30 Pittwater (A) 1-24-08-03 698 709 1.58 Pittwater (A) 1-24-08-04 347 353 1.73 Pittwater (A) 1-24-08-05 379 387 2.11 Pittwater (A) 1-24-08-06 670 670 0.00 Pittwater (A) 1-24-08-07 395 404 2.28 Pittwater (A) 1-24-08-08 541 546 0.92 Pittwater (A) 1-24-08-09 454 466 2.64 Pittwater (A) 1-24-08-10 514 520 1.17 Pittwater (A) 1-24-08-11 414 419 1.21 Pittwater (A) 1-24-08-12 400 413 3.25 Pittwater (A) 1-24-08-13 740 747 0.95 Pittwater (A) 98 38943 40268 3.40 Warringah (A) 1-24-09-02 248 246 -0.81 Warringah (A) 1-24-09-03 248 340 37.10 Warringah (A) 1-24-09-04 441 466 5.67 Warringah (A) 1-24-09-05 220 223 1.36 Warringah (A) 1-24-09-06 202 207 2.48 Warringah (A) 1-24-09-07 574 666 16.03 Warringah (A) 1-24-09-08 413 479 15.98 Warringah (A) 1-24-09-09 336 331 -1.49 Warringah (A) 1-24-09-10 322 322 0.00 Warringah (A) 1-24-09-11 257 252 -1.95 Warringah (A) 1-24-10-01 821 797 -2.92 Warringah (A) 1-24-10-02 414 411 -0.72 Warringah (A) 1-24-10-03 214 208 -2.80 Warringah (A) 1-24-10-04 141 141 0.00 Warringah (A) 1-24-10-05 355 355 0.00 Warringah (A) 1-24-10-06 295 307 4.07 Warringah (A) 1-24-10-07 577 575 -0.35 Warringah (A) 1-24-10-08 562 550 -2.14 Warringah (A) 1-24-10-09 416 408 -1.92 Warringah (A) 1-24-10-10 261 256 -1.92

New South Wales Redistribution Statistics 2006
Enrolment Projections Mackellar
Actual Enrolment Estimate Growth SLA Name CCD Number 2/12/2005 31/5/2010 (%)
187
Warringah (A) 1-24-10-11 286 295 3.15 Warringah (A) 1-24-10-12 344 334 -2.91 Warringah (A) 1-24-10-13 256 259 1.17 Warringah (A) 1-24-10-14 334 390 16.77 Warringah (A) 1-24-11-01 724 710 -1.93 Warringah (A) 1-24-11-02 428 423 -1.17 Warringah (A) 1-24-11-03 624 622 -0.32 Warringah (A) 1-24-11-04 632 630 -0.32 Warringah (A) 1-24-11-05 413 409 -0.97 Warringah (A) 1-24-11-06 643 634 -1.40 Warringah (A) 1-24-11-07 532 554 4.14 Warringah (A) 1-24-11-08 743 735 -1.08 Warringah (A) 1-24-11-09 618 625 1.13 Warringah (A) 1-24-11-10 524 520 -0.76 Warringah (A) 1-24-11-11 382 376 -1.57 Warringah (A) 1-24-11-12 248 250 0.81 Warringah (A) 1-24-11-13 331 327 -1.21 Warringah (A) 1-24-12-01 281 275 -2.14 Warringah (A) 1-24-12-02 423 432 2.13 Warringah (A) 1-24-12-03 572 564 -1.40 Warringah (A) 1-24-12-04 262 261 -0.38 Warringah (A) 1-24-12-05 752 738 -1.86 Warringah (A) 1-24-12-06 500 488 -2.40 Warringah (A) 1-24-12-07 737 1049 42.33 Warringah (A) 1-24-12-08 480 478 -0.42 Warringah (A) 1-24-12-09 721 699 -3.05 Warringah (A) 1-24-12-10 906 1074 18.54 Warringah (A) 1-24-12-11 384 377 -1.82 Warringah (A) 1-24-13-01 407 405 -0.49 Warringah (A) 1-24-13-02 463 453 -2.16 Warringah (A) 1-24-13-03 563 546 -3.02 Warringah (A) 1-24-13-04 369 363 -1.63 Warringah (A) 1-24-13-05 532 524 -1.50 Warringah (A) 1-24-13-09 434 430 -0.92 Warringah (A) 1-24-13-10 354 351 -0.85 Warringah (A) 1-24-15-05 652 646 -0.92 Warringah (A) 1-24-15-08 372 368 -1.08 Warringah (A) 1-24-15-09 318 316 -0.63 Warringah (A) 1-24-15-10 582 575 -1.20 Warringah (A) 1-24-15-11 828 887 7.13 Warringah (A) 1-24-17-01 61 61 0.00 Warringah (A) 1-24-17-02 653 640 -1.99

New South Wales Redistribution Statistics 2006
Enrolment Projections Mackellar
Actual Enrolment Estimate Growth SLA Name CCD Number 2/12/2005 31/5/2010 (%)
188
Warringah (A) 1-24-17-03 195 189 -3.08 Warringah (A) 1-24-17-04 143 158 10.49 Warringah (A) 1-24-17-05 329 332 0.91 Warringah (A) 1-24-17-06 381 381 0.00 Warringah (A) 1-24-17-07 781 769 -1.54 Warringah (A) 1-24-17-08 381 371 -2.62 Warringah (A) 1-24-17-09 417 415 -0.48 Warringah (A) 1-24-17-10 547 534 -2.38 Warringah (A) 1-24-17-11 421 413 -1.90 Warringah (A) 1-24-18-01 462 469 1.52 Warringah (A) 1-24-18-02 626 614 -1.92 Warringah (A) 1-24-18-03 246 242 -1.63 Warringah (A) 1-24-18-04 494 500 1.21 Warringah (A) 1-24-18-05 518 537 3.67 Warringah (A) 1-24-18-06 681 674 -1.03 Warringah (A) 1-24-18-07 637 620 -2.67 Warringah (A) 1-24-18-08 212 217 2.36 Warringah (A) 1-24-18-09 381 373 -2.10 Warringah (A) 1-24-18-10 458 456 -0.44 Warringah (A) 1-24-18-11 783 895 14.30 Warringah (A) 1-24-19-01 481 486 1.04 Warringah (A) 1-24-19-02 197 205 4.06 Warringah (A) 1-24-19-03 554 552 -0.36 Warringah (A) 1-24-19-04 643 707 9.95 Warringah (A) 1-24-19-05 425 590 38.82 Warringah (A) 1-24-19-06 230 270 17.39 Warringah (A) 1-24-19-07 296 292 -1.35 Warringah (A) 1-24-19-08 590 585 -0.85 Warringah (A) 1-24-19-09 237 231 -2.53 Warringah (A) 1-24-19-10 414 403 -2.66 Warringah (A) 1-24-20-01 256 257 0.39 Warringah (A) 1-24-20-02 264 260 -1.52 Warringah (A) 1-24-20-03 438 423 -3.42 Warringah (A) 1-24-20-04 379 376 -0.79 Warringah (A) 1-24-20-05 350 341 -2.57 Warringah (A) 1-24-20-06 715 707 -1.12 Warringah (A) 1-24-20-07 599 596 -0.50 Warringah (A) 1-24-20-10 525 583 11.05 Warringah (A) 1-24-21-02 525 510 -2.86 Warringah (A) 1-24-21-03 470 461 -1.91 Warringah (A) 1-24-21-04 258 256 -0.78 Warringah (A) 1-24-21-05 369 403 9.21

New South Wales Redistribution Statistics 2006
Enrolment Projections Mackellar
Actual Enrolment Estimate Growth SLA Name CCD Number 2/12/2005 31/5/2010 (%)
189
Warringah (A) 1-24-21-06 384 374 -2.60 Warringah (A) 1-24-22-05 258 262 1.55 Warringah (A) 1-24-22-06 458 455 -0.66 Warringah (A) 1-24-22-07 462 454 -1.73 Warringah (A) 1-24-22-08 519 512 -1.35 Warringah (A) 109 48374 49343 2.00 Mackellar 209 87348 89642 2.63

New South Wales Redistribution Statistics 2006
Enrolment Projections Macquarie
Actual Enrolment Estimate Growth SLA Name CCD Number 2/12/2005 31/5/2010 (%)
190
Blue Mountains (C) 1-23-08-01 371 401 8.09 Blue Mountains (C) 1-23-08-02 115 120 4.35 Blue Mountains (C) 1-23-08-03 275 284 3.27 Blue Mountains (C) 1-23-08-04 354 374 5.65 Blue Mountains (C) 1-23-08-05 176 189 7.39 Blue Mountains (C) 1-23-08-06 305 306 0.33 Blue Mountains (C) 1-23-08-07 238 265 11.34 Blue Mountains (C) 1-23-08-08 299 296 -1.00 Blue Mountains (C) 1-23-08-09 390 391 0.26 Blue Mountains (C) 1-23-08-10 188 198 5.32 Blue Mountains (C) 1-23-08-11 186 214 15.05 Blue Mountains (C) 1-23-09-01 151 158 4.64 Blue Mountains (C) 1-23-09-02 210 221 5.24 Blue Mountains (C) 1-23-09-03 415 423 1.93 Blue Mountains (C) 1-23-09-04 348 358 2.87 Blue Mountains (C) 1-23-09-05 809 815 0.74 Blue Mountains (C) 1-23-09-06 513 514 0.19 Blue Mountains (C) 1-23-09-07 184 184 0.00 Blue Mountains (C) 1-23-09-08 453 458 1.10 Blue Mountains (C) 1-23-09-09 656 663 1.07 Blue Mountains (C) 1-23-09-10 220 221 0.45 Blue Mountains (C) 1-23-09-11 271 280 3.32 Blue Mountains (C) 1-23-09-12 494 499 1.01 Blue Mountains (C) 1-23-09-13 732 774 5.74 Blue Mountains (C) 1-23-09-14 303 314 3.63 Blue Mountains (C) 1-23-10-01 479 524 9.39 Blue Mountains (C) 1-23-10-02 686 696 1.46 Blue Mountains (C) 1-23-10-03 577 599 3.81 Blue Mountains (C) 1-23-10-04 381 394 3.41 Blue Mountains (C) 1-23-10-05 637 647 1.57 Blue Mountains (C) 1-23-10-06 574 579 0.87 Blue Mountains (C) 1-23-10-07 646 663 2.63 Blue Mountains (C) 1-23-10-08 600 598 -0.33 Blue Mountains (C) 1-23-10-09 454 461 1.54 Blue Mountains (C) 1-23-10-10 353 355 0.57 Blue Mountains (C) 1-23-10-11 273 286 4.76 Blue Mountains (C) 1-23-10-12 580 692 19.31 Blue Mountains (C) 1-23-10-13 410 413 0.73 Blue Mountains (C) 1-23-10-14 258 285 10.47 Blue Mountains (C) 1-23-11-01 418 426 1.91 Blue Mountains (C) 1-23-11-02 415 428 3.13 Blue Mountains (C) 1-23-11-03 603 601 -0.33

New South Wales Redistribution Statistics 2006
Enrolment Projections Macquarie
Actual Enrolment Estimate Growth SLA Name CCD Number 2/12/2005 31/5/2010 (%)
191
Blue Mountains (C) 1-23-11-04 433 432 -0.23 Blue Mountains (C) 1-23-11-05 652 672 3.07 Blue Mountains (C) 1-23-11-06 360 372 3.33 Blue Mountains (C) 1-23-11-07 637 657 3.14 Blue Mountains (C) 1-23-11-08 448 461 2.90 Blue Mountains (C) 1-23-11-09 502 510 1.59 Blue Mountains (C) 1-23-11-10 189 188 -0.53 Blue Mountains (C) 1-23-11-11 329 319 -3.04 Blue Mountains (C) 1-23-11-12 595 599 0.67 Blue Mountains (C) 1-23-12-01 332 345 3.92 Blue Mountains (C) 1-23-12-02 386 388 0.52 Blue Mountains (C) 1-23-12-03 408 406 -0.49 Blue Mountains (C) 1-23-12-04 647 659 1.85 Blue Mountains (C) 1-23-12-05 534 531 -0.56 Blue Mountains (C) 1-23-12-06 378 389 2.91 Blue Mountains (C) 1-23-12-07 405 405 0.00 Blue Mountains (C) 1-23-12-08 601 599 -0.33 Blue Mountains (C) 1-23-12-09 456 458 0.44 Blue Mountains (C) 1-23-12-10 509 511 0.39 Blue Mountains (C) 1-23-12-11 395 405 2.53 Blue Mountains (C) 1-23-14-01 204 217 6.37 Blue Mountains (C) 1-23-14-02 307 311 1.30 Blue Mountains (C) 1-23-14-03 333 354 6.31 Blue Mountains (C) 1-23-14-04 396 406 2.53 Blue Mountains (C) 1-23-14-05 396 414 4.55 Blue Mountains (C) 1-23-14-06 90 90 0.00 Blue Mountains (C) 1-23-14-07 473 488 3.17 Blue Mountains (C) 1-23-14-08 342 349 2.05 Blue Mountains (C) 1-23-14-09 455 492 8.13 Blue Mountains (C) 1-23-14-10 72 69 -4.17 Blue Mountains (C) 1-23-14-11 204 204 0.00 Blue Mountains (C) 1-23-14-12 229 245 6.99 Blue Mountains (C) 1-23-14-13 262 279 6.49 Blue Mountains (C) 1-23-15-01 563 571 1.42 Blue Mountains (C) 1-23-15-02 352 365 3.69 Blue Mountains (C) 1-23-15-03 369 376 1.90 Blue Mountains (C) 1-23-15-04 402 405 0.75 Blue Mountains (C) 1-23-15-05 315 321 1.90 Blue Mountains (C) 1-23-15-06 457 465 1.75 Blue Mountains (C) 1-23-15-07 511 532 4.11 Blue Mountains (C) 1-23-15-08 524 529 0.95 Blue Mountains (C) 1-23-15-09 401 424 5.74

New South Wales Redistribution Statistics 2006
Enrolment Projections Macquarie
Actual Enrolment Estimate Growth SLA Name CCD Number 2/12/2005 31/5/2010 (%)
192
Blue Mountains (C) 1-23-18-14 241 250 3.73
Blue Mountains (C) 1-23-15-10 383 388 1.31 Blue Mountains (C) 1-23-15-11 332 338 1.81 Blue Mountains (C) 1-23-16-01 499 508 1.80 Blue Mountains (C) 1-23-16-02 370 390 5.41 Blue Mountains (C) 1-23-16-03 221 238 7.69 Blue Mountains (C) 1-23-16-04 466 470 0.86 Blue Mountains (C) 1-23-16-05 301 308 2.33 Blue Mountains (C) 1-23-16-06 302 303 0.33 Blue Mountains (C) 1-23-16-07 298 304 2.01 Blue Mountains (C) 1-23-16-08 198 201 1.52 Blue Mountains (C) 1-23-16-09 397 408 2.77 Blue Mountains (C) 1-23-16-10 332 333 0.30 Blue Mountains (C) 1-23-16-11 456 481 5.48 Blue Mountains (C) 1-23-16-12 418 433 3.59 Blue Mountains (C) 1-23-16-13 257 259 0.78 Blue Mountains (C) 1-23-16-14 337 353 4.75 Blue Mountains (C) 1-23-17-01 274 292 6.57 Blue Mountains (C) 1-23-17-02 437 448 2.52 Blue Mountains (C) 1-23-17-03 393 413 5.09 Blue Mountains (C) 1-23-17-04 382 391 2.36 Blue Mountains (C) 1-23-17-05 383 390 1.83 Blue Mountains (C) 1-23-17-06 444 493 11.04 Blue Mountains (C) 1-23-17-07 273 272 -0.37 Blue Mountains (C) 1-23-17-08 419 430 2.63 Blue Mountains (C) 1-23-17-09 278 286 2.88 Blue Mountains (C) 1-23-17-10 319 316 -0.94 Blue Mountains (C) 1-23-17-11 327 335 2.45 Blue Mountains (C) 1-23-17-12 260 269 3.46 Blue Mountains (C) 1-23-18-01 210 205 -2.38 Blue Mountains (C) 1-23-18-02 403 406 0.74 Blue Mountains (C) 1-23-18-03 164 168 2.44 Blue Mountains (C) 1-23-18-04 255 254 -0.39 Blue Mountains (C) 1-23-18-05 289 296 2.42 Blue Mountains (C) 1-23-18-06 204 213 4.41 Blue Mountains (C) 1-23-18-07 284 279 -1.76 Blue Mountains (C) 1-23-18-08 79 78 -1.27 Blue Mountains (C) 1-23-18-09 290 293 1.03 Blue Mountains (C) 1-23-18-10 254 252 -0.79 Blue Mountains (C) 1-23-18-11 333 332 -0.30 Blue Mountains (C) 1-23-18-12 177 178 0.56 Blue Mountains (C) 1-23-18-13 154 177 14.94

New South Wales Redistribution Statistics 2006
Enrolment Projections Macquarie
Actual Enrolment Estimate Growth SLA Name CCD Number 2/12/2005 31/5/2010 (%)
193
Blue Mountains (C) 126 46946 48210 2.69 Hawkesbury (C) 1-23-01-01 567 671 18.34 Hawkesbury (C) 1-23-01-02 272 292 7.35 Hawkesbury (C) 1-23-01-03 277 326 17.69 Hawkesbury (C) 1-23-01-04 105 104 -0.95 Hawkesbury (C) 1-23-01-05 332 360 8.43 Hawkesbury (C) 1-23-01-06 365 377 3.29 Hawkesbury (C) 1-23-01-07 224 261 16.52 Hawkesbury (C) 1-23-01-08 463 562 21.38 Hawkesbury (C) 1-23-01-09 358 392 9.50 Hawkesbury (C) 1-23-01-10 376 398 5.85 Hawkesbury (C) 1-23-01-11 379 411 8.44 Hawkesbury (C) 1-23-01-12 365 374 2.47 Hawkesbury (C) 1-23-01-13 243 261 7.41 Hawkesbury (C) 1-23-02-01 233 236 1.29 Hawkesbury (C) 1-23-02-02 411 441 7.30 Hawkesbury (C) 1-23-02-03 328 343 4.57 Hawkesbury (C) 1-23-02-04 509 515 1.18 Hawkesbury (C) 1-23-02-05 292 293 0.34 Hawkesbury (C) 1-23-02-06 392 432 10.20 Hawkesbury (C) 1-23-02-07 496 511 3.02 Hawkesbury (C) 1-23-02-08 556 573 3.06 Hawkesbury (C) 1-23-02-09 292 315 7.88 Hawkesbury (C) 1-23-02-10 216 211 -2.31 Hawkesbury (C) 1-23-02-11 106 105 -0.94 Hawkesbury (C) 1-23-02-12 369 389 5.42 Hawkesbury (C) 1-23-03-01 279 289 3.58 Hawkesbury (C) 1-23-03-02 471 480 1.91 Hawkesbury (C) 1-23-03-03 376 382 1.60 Hawkesbury (C) 1-23-03-04 465 488 4.95 Hawkesbury (C) 1-23-03-05 215 225 4.65 Hawkesbury (C) 1-23-03-06 183 184 0.55 Hawkesbury (C) 1-23-03-07 393 390 -0.76 Hawkesbury (C) 1-23-03-08 425 444 4.47 Hawkesbury (C) 1-23-03-09 444 464 4.50 Hawkesbury (C) 1-23-03-10 419 425 1.43 Hawkesbury (C) 1-23-03-11 429 442 3.03 Hawkesbury (C) 1-23-03-12 379 401 5.80 Hawkesbury (C) 1-23-03-13 306 307 0.33 Hawkesbury (C) 1-23-03-14 231 254 9.96

New South Wales Redistribution Statistics 2006
Enrolment Projections Macquarie
Actual Enrolment Estimate Growth SLA Name CCD Number 2/12/2005 31/5/2010 (%)
194
Hawkesbury (C) 1-23-04-01 605 606 0.17 Hawkesbury (C) 1-23-04-02 289 321 11.07 Hawkesbury (C) 1-23-04-03 208 212 1.92 Hawkesbury (C) 1-23-04-04 310 317 2.26 Hawkesbury (C) 1-23-04-05 490 524 6.94 Hawkesbury (C) 1-23-04-06 358 386 7.82 Hawkesbury (C) 1-23-04-07 120 123 2.50 Hawkesbury (C) 1-23-04-08 333 333 0.00 Hawkesbury (C) 1-23-04-09 262 259 -1.15 Hawkesbury (C) 1-23-04-10 605 636 5.12 Hawkesbury (C) 1-23-04-11 358 367 2.51 Hawkesbury (C) 1-23-05-01 446 508 13.90 Hawkesbury (C) 1-23-05-02 230 233 1.30 Hawkesbury (C) 1-23-05-03 479 505 5.43 Hawkesbury (C) 1-23-05-04 278 473 70.14 Hawkesbury (C) 1-23-05-05 268 278 3.73 Hawkesbury (C) 1-23-05-06 336 336 0.00 Hawkesbury (C) 1-23-05-07 319 331 3.76 Hawkesbury (C) 1-23-05-08 303 304 0.33 Hawkesbury (C) 1-23-05-09 180 191 6.11 Hawkesbury (C) 1-23-05-10 434 440 1.38 Hawkesbury (C) 1-23-05-11 206 236 14.56 Hawkesbury (C) 1-23-05-12 342 382 11.70 Hawkesbury (C) 1-23-06-01 345 359 4.06 Hawkesbury (C) 1-23-06-02 333 332 -0.30 Hawkesbury (C) 1-23-06-03 510 539 5.69 Hawkesbury (C) 1-23-06-04 481 502 4.37 Hawkesbury (C) 1-23-06-05 378 439 16.14 Hawkesbury (C) 1-23-06-06 478 481 0.63 Hawkesbury (C) 1-23-06-07 416 420 0.96 Hawkesbury (C) 1-23-06-08 492 488 -0.81 Hawkesbury (C) 1-23-06-09 594 677 13.97 Hawkesbury (C) 1-23-06-10 321 348 8.41 Hawkesbury (C) 1-23-06-11 374 383 2.41 Hawkesbury (C) 1-23-07-01 262 327 24.81 Hawkesbury (C) 1-23-07-02 336 337 0.30 Hawkesbury (C) 1-23-07-03 486 571 17.49 Hawkesbury (C) 1-23-07-04 318 356 11.95 Hawkesbury (C) 1-23-07-05 418 426 1.91 Hawkesbury (C) 1-23-07-06 439 474 7.97 Hawkesbury (C) 1-23-07-07 722 797 10.39 Hawkesbury (C) 1-23-07-08 546 616 12.82

New South Wales Redistribution Statistics 2006
Enrolment Projections Macquarie
Actual Enrolment Estimate Growth SLA Name CCD Number 2/12/2005 31/5/2010 (%)
195
Hawkesbury (C) 1-23-07-09 679 773 13.84 Hawkesbury (C) 1-23-19-01 352 349 -0.85 Hawkesbury (C) 1-23-19-02 495 555 12.12 Hawkesbury (C) 1-23-19-03 452 446 -1.33 Hawkesbury (C) 1-23-19-04 424 500 17.92 Hawkesbury (C) 1-23-19-05 497 501 0.80 Hawkesbury (C) 1-23-19-06 310 310 0.00 Hawkesbury (C) 1-23-19-07 329 334 1.52 Hawkesbury (C) 1-23-19-08 547 559 2.19 Hawkesbury (C) 1-23-19-09 542 543 0.18 Hawkesbury (C) 1-23-19-10 376 389 3.46 Hawkesbury (C) 1-23-19-11 327 350 7.03 Hawkesbury (C) 1-23-19-12 288 291 1.04 Hawkesbury (C) 1-23-19-13 404 411 1.73 Hawkesbury (C) 1-23-20-01 427 455 6.56 Hawkesbury (C) 1-23-20-02 192 210 9.38 Hawkesbury (C) 1-23-20-03 468 494 5.56 Hawkesbury (C) 1-23-20-04 596 651 9.23 Hawkesbury (C) 1-23-20-05 442 498 12.67 Hawkesbury (C) 1-23-20-06 145 158 8.97 Hawkesbury (C) 1-23-20-07 278 285 2.52 Hawkesbury (C) 1-23-20-08 404 407 0.74 Hawkesbury (C) 1-23-20-09 444 464 4.50 Hawkesbury (C) 1-23-20-10 429 451 5.13 Hawkesbury (C) 1-23-20-11 193 189 -2.07 Hawkesbury (C) 106 39589 42074 6.28 Macquarie 232 86535 90284 4.33

New South Wales Redistribution Statistics 2006
Enrolment Projections Mitchell
Actual Enrolment Estimate Growth SLA Name CCD Number 2/12/2005 31/5/2010 (%)
196
Baulkham Hills (A) 1-26-02-02 300 295 -1.67 Baulkham Hills (A) 1-26-02-03 330 327 -0.91 Baulkham Hills (A) 1-26-02-04 559 615 10.02 Baulkham Hills (A) 1-26-02-05 238 262 10.08 Baulkham Hills (A) 1-26-02-06 261 274 4.98 Baulkham Hills (A) 1-26-02-07 458 486 6.11 Baulkham Hills (A) 1-26-02-08 194 207 6.70 Baulkham Hills (A) 1-26-02-09 355 395 11.27 Baulkham Hills (A) 1-26-02-10 259 267 3.09 Baulkham Hills (A) 1-26-03-01 1357 2010 48.12 Baulkham Hills (A) 1-26-03-02 399 427 7.02 Baulkham Hills (A) 1-26-03-03 1048 1413 34.83 Baulkham Hills (A) 1-26-03-04 611 633 3.60 Baulkham Hills (A) 1-26-03-05 1733 2659 53.43 Baulkham Hills (A) 1-26-03-06 1157 1837 58.77 Baulkham Hills (A) 1-26-03-07 312 324 3.85 Baulkham Hills (A) 1-26-03-08 1195 1430 19.67 Baulkham Hills (A) 1-26-03-09 714 747 4.62 Baulkham Hills (A) 1-26-03-10 937 1338 42.80 Baulkham Hills (A) 1-26-03-11 736 987 34.10 Baulkham Hills (A) 1-26-03-12 1002 1621 61.78 Baulkham Hills (A) 1-26-03-13 191 192 0.52 Baulkham Hills (A) 1-26-03-14 416 411 -1.20 Baulkham Hills (A) 1-26-03-15 654 674 3.06 Baulkham Hills (A) 1-26-03-16 815 1095 34.36 Baulkham Hills (A) 1-26-03-17 658 879 33.59 Baulkham Hills (A) 1-26-03-18 1765 3061 73.43 Baulkham Hills (A) 1-26-03-19 681 707 3.82 Baulkham Hills (A) 1-26-03-20 531 686 29.19 Baulkham Hills (A) 1-26-03-21 673 777 15.45 Baulkham Hills (A) 1-26-03-22 879 1252 42.43 Baulkham Hills (A) 1-26-03-23 467 548 17.34 Baulkham Hills (A) 1-26-03-24 492 514 4.47 Baulkham Hills (A) 1-26-04-01 399 397 -0.50 Baulkham Hills (A) 1-26-04-02 543 607 11.79 Baulkham Hills (A) 1-26-04-03 697 698 0.14 Baulkham Hills (A) 1-26-04-04 604 599 -0.83 Baulkham Hills (A) 1-26-04-05 606 657 8.42 Baulkham Hills (A) 1-26-04-06 444 460 3.60 Baulkham Hills (A) 1-26-04-07 378 380 0.53 Baulkham Hills (A) 1-26-04-08 613 754 23.00 Baulkham Hills (A) 1-26-04-09 1932 3171 64.13

New South Wales Redistribution Statistics 2006
Enrolment Projections Mitchell
Actual Enrolment Estimate Growth SLA Name CCD Number 2/12/2005 31/5/2010 (%)
197
Baulkham Hills (A) 1-26-04-10 669 667 -0.30 Baulkham Hills (A) 1-26-05-01 516 511 -0.97 Baulkham Hills (A) 1-26-05-02 824 1037 25.85 Baulkham Hills (A) 1-26-05-03 655 656 0.15 Baulkham Hills (A) 1-26-05-04 682 691 1.32 Baulkham Hills (A) 1-26-05-05 710 714 0.56 Baulkham Hills (A) 1-26-05-06 778 770 -1.03 Baulkham Hills (A) 1-26-05-07 557 552 -0.90 Baulkham Hills (A) 1-26-05-08 804 804 0.00 Baulkham Hills (A) 1-26-05-09 461 460 -0.22 Baulkham Hills (A) 1-26-05-10 290 289 -0.34 Baulkham Hills (A) 1-26-05-11 765 786 2.75 Baulkham Hills (A) 1-26-05-12 624 926 48.40 Baulkham Hills (A) 1-26-05-13 656 674 2.74 Baulkham Hills (A) 1-26-06-01 495 526 6.26 Baulkham Hills (A) 1-26-06-02 564 557 -1.24 Baulkham Hills (A) 1-26-06-03 710 724 1.97 Baulkham Hills (A) 1-26-06-04 458 528 15.28 Baulkham Hills (A) 1-26-06-05 519 518 -0.19 Baulkham Hills (A) 1-26-06-06 621 624 0.48 Baulkham Hills (A) 1-26-06-07 602 602 0.00 Baulkham Hills (A) 1-26-06-08 199 201 1.01 Baulkham Hills (A) 1-26-06-09 470 467 -0.64 Baulkham Hills (A) 1-26-06-10 371 372 0.27 Baulkham Hills (A) 1-26-06-11 487 490 0.62 Baulkham Hills (A) 1-26-06-12 487 574 17.86 Baulkham Hills (A) 1-26-07-01 620 624 0.65 Baulkham Hills (A) 1-26-07-02 395 399 1.01 Baulkham Hills (A) 1-26-07-03 667 1112 66.72 Baulkham Hills (A) 1-26-07-04 512 598 16.80 Baulkham Hills (A) 1-26-07-05 718 779 8.50 Baulkham Hills (A) 1-26-07-06 482 477 -1.04 Baulkham Hills (A) 1-26-07-07 428 425 -0.70 Baulkham Hills (A) 1-26-07-08 674 675 0.15 Baulkham Hills (A) 1-26-07-09 514 513 -0.19 Baulkham Hills (A) 1-26-07-10 635 633 -0.31 Baulkham Hills (A) 1-26-08-01 282 318 12.77 Baulkham Hills (A) 1-26-08-02 574 576 0.35 Baulkham Hills (A) 1-26-08-03 353 354 0.28 Baulkham Hills (A) 1-26-08-04 525 526 0.19 Baulkham Hills (A) 1-26-08-05 572 1082 89.16 Baulkham Hills (A) 1-26-08-06 512 554 8.20

New South Wales Redistribution Statistics 2006
Enrolment Projections Mitchell
Actual Enrolment Estimate Growth SLA Name CCD Number 2/12/2005 31/5/2010 (%)
198
Baulkham Hills (A) 1-26-08-07 419 429 2.39 Baulkham Hills (A) 1-26-08-08 347 351 1.15 Baulkham Hills (A) 1-26-08-09 618 619 0.16 Baulkham Hills (A) 1-26-08-10 470 480 2.13 Baulkham Hills (A) 1-26-08-11 290 296 2.07 Baulkham Hills (A) 1-26-08-12 331 345 4.23 Baulkham Hills (A) 1-26-09-01 585 605 3.42 Baulkham Hills (A) 1-26-09-02 411 411 0.00 Baulkham Hills (A) 1-26-09-03 672 759 12.95 Baulkham Hills (A) 1-26-09-04 641 669 4.37 Baulkham Hills (A) 1-26-09-05 352 353 0.28 Baulkham Hills (A) 1-26-09-06 354 518 46.33 Baulkham Hills (A) 1-26-09-07 417 422 1.20 Baulkham Hills (A) 1-26-09-08 423 428 1.18 Baulkham Hills (A) 1-26-09-09 408 434 6.37 Baulkham Hills (A) 1-26-09-10 293 298 1.71 Baulkham Hills (A) 1-26-10-01 392 389 -0.77 Baulkham Hills (A) 1-26-10-02 752 746 -0.80 Baulkham Hills (A) 1-26-10-03 401 406 1.25 Baulkham Hills (A) 1-26-10-04 231 239 3.46 Baulkham Hills (A) 1-26-10-05 318 319 0.31 Baulkham Hills (A) 1-26-10-06 625 635 1.60 Baulkham Hills (A) 1-26-10-07 311 309 -0.64 Baulkham Hills (A) 1-26-10-08 478 480 0.42 Baulkham Hills (A) 1-26-10-09 811 826 1.85 Baulkham Hills (A) 1-26-10-10 771 774 0.39 Baulkham Hills (A) 1-26-11-01 257 304 18.29 Baulkham Hills (A) 1-26-11-02 620 658 6.13 Baulkham Hills (A) 1-26-11-03 394 394 0.00 Baulkham Hills (A) 1-26-11-04 392 393 0.26 Baulkham Hills (A) 1-26-11-05 433 446 3.00 Baulkham Hills (A) 1-26-11-06 571 610 6.83 Baulkham Hills (A) 1-26-11-07 443 447 0.90 Baulkham Hills (A) 1-26-11-08 379 386 1.85 Baulkham Hills (A) 1-26-11-09 557 556 -0.18 Baulkham Hills (A) 1-26-11-10 333 339 1.80 Baulkham Hills (A) 1-26-12-01 392 399 1.79 Baulkham Hills (A) 1-26-12-02 77 77 0.00 Baulkham Hills (A) 1-26-12-02 99 100 1.01 Baulkham Hills (A) 1-26-12-07 672 670 -0.30 Baulkham Hills (A) 1-26-13-01 188 190 1.06 Baulkham Hills (A) 1-26-14-01 715 775 8.39

New South Wales Redistribution Statistics 2006
Enrolment Projections Mitchell
Actual Enrolment Estimate Growth SLA Name CCD Number 2/12/2005 31/5/2010 (%)
199
Baulkham Hills (A) 1-26-14-02 718 732 1.95 Baulkham Hills (A) 1-26-14-03 534 527 -1.31 Baulkham Hills (A) 1-26-14-04 304 317 4.28 Baulkham Hills (A) 1-26-14-05 773 777 0.52 Baulkham Hills (A) 1-26-14-06 656 656 0.00 Baulkham Hills (A) 1-26-14-07 387 384 -0.78 Baulkham Hills (A) 1-26-14-08 256 281 9.77 Baulkham Hills (A) 1-26-14-09 865 880 1.73 Baulkham Hills (A) 1-26-14-10 865 995 15.03 Baulkham Hills (A) 1-26-14-11 337 342 1.48 Baulkham Hills (A) 1-26-14-12 363 367 1.10 Baulkham Hills (A) 1-26-14-13 563 567 0.71 Baulkham Hills (A) 1-26-15-01 673 730 8.47 Baulkham Hills (A) 1-26-15-02 573 653 13.96 Baulkham Hills (A) 1-26-15-03 564 679 20.39 Baulkham Hills (A) 1-26-15-04 536 527 -1.68 Baulkham Hills (A) 1-26-15-05 621 627 0.97 Baulkham Hills (A) 1-26-15-06 593 632 6.58 Baulkham Hills (A) 1-26-15-07 537 574 6.89 Baulkham Hills (A) 1-26-15-08 508 531 4.53 Baulkham Hills (A) 1-26-15-09 574 586 2.09 Baulkham Hills (A) 1-26-15-10 313 313 0.00 Baulkham Hills (A) 1-26-16-01 825 845 2.42 Baulkham Hills (A) 1-26-16-02 677 688 1.62 Baulkham Hills (A) 1-26-16-03 494 501 1.42 Baulkham Hills (A) 1-26-16-04 431 438 1.62 Baulkham Hills (A) 1-26-16-05 902 923 2.33 Baulkham Hills (A) 1-26-16-06 636 659 3.62 Baulkham Hills (A) 1-26-16-07 801 837 4.49 Baulkham Hills (A) 1-26-16-08 490 494 0.82 Baulkham Hills (A) 1-26-16-09 434 435 0.23 Baulkham Hills (A) 1-26-16-10 403 415 2.98 Baulkham Hills (A) 1-26-16-11 666 753 13.06 Baulkham Hills (A) 1-26-17-01 347 348 0.29 Baulkham Hills (A) 1-26-17-02 251 266 5.98 Baulkham Hills (A) 1-26-17-03 277 279 0.72 Baulkham Hills (A) 1-26-17-04 281 283 0.71 Baulkham Hills (A) 1-26-17-05 416 428 2.88 Baulkham Hills (A) 1-26-17-06 369 375 1.63 Baulkham Hills (A) 1-26-17-07 379 415 9.50 Baulkham Hills (A) 1-26-17-08 249 259 4.02

New South Wales Redistribution Statistics 2006
Enrolment Projections Mitchell
Actual Enrolment Estimate Growth SLA Name CCD Number 2/12/2005 31/5/2010 (%)
200
Baulkham Hills (A) 167 92114 104040 12.95 Hornsby (A) 1-25-05-05 299 300 0.33 Hornsby (A) 1-25-05-06 1079 1094 1.39 Hornsby (A) 1-25-05-10 739 738 -0.14 Hornsby (A) 1-25-17-08 2045 2292 12.08 Hornsby (A) 4 4162 4424 6.30 Mitchell 171 96276 108464 12.66

New South Wales Redistribution Statistics 2006
Enrolment Projections Newcastle
Actual Enrolment Estimate Growth SLA Name CCD Number 2/12/2005 31/5/2010 (%)
201
Lake Macquarie (C) 1-12-15-01 127 134 5.51 Lake Macquarie (C) 1-12-15-02 341 349 2.35 Lake Macquarie (C) 1-12-15-03 253 255 0.79 Lake Macquarie (C) 1-12-15-04 271 274 1.11 Lake Macquarie (C) 1-12-15-08 451 460 2.00 Lake Macquarie (C) 1-12-15-11 250 253 1.20 Lake Macquarie (C) 1-12-15-13 490 494 0.82 Lake Macquarie (C) 7 2183 2219 1.65 NSW Water areas 1-10-03-14 0 0 0.00 NSW Water areas 1-10-03-15 1 1 0.00 NSW Water areas 1-10-13-07 0 0 0.00 NSW Water areas 3 1 1 0.00 Newcastle (C) - Inner 1-10-17-01 248 382 54.03 Newcastle (C) - Inner 1-10-17-02 207 296 43.00 Newcastle (C) - Inner 1-10-17-03 328 503 53.35 Newcastle (C) - Inner 1-10-17-04 414 738 78.26 Newcastle (C) - Inner 1-10-17-05 230 491 113.48 Newcastle (C) - Inner 1-10-17-06 355 400 12.68 Newcastle (C) - Inner 1-10-17-07 226 253 11.95 Newcastle (C) - Inner 1-10-17-08 332 380 14.46 Newcastle (C) - Inner 1-10-17-09 242 291 20.25 Newcastle (C) - Inner 1-10-17-10 381 416 9.19 Newcastle (C) - Inner 1-10-17-11 389 650 67.10 Newcastle (C) - Inner 1-10-17-13 262 495 88.93 Newcastle (C) - Inner 12 3614 5295 46.51 Newcastle (C) - Remainder 1-10-01-01 479 483 0.84 Newcastle (C) - Remainder 1-10-01-02 448 482 7.59 Newcastle (C) - Remainder 1-10-01-03 447 455 1.79 Newcastle (C) - Remainder 1-10-01-04 436 448 2.75 Newcastle (C) - Remainder 1-10-01-05 374 379 1.34 Newcastle (C) - Remainder 1-10-01-06 244 253 3.69 Newcastle (C) - Remainder 1-10-01-07 385 395 2.60 Newcastle (C) - Remainder 1-10-02-01 624 743 19.07 Newcastle (C) - Remainder 1-10-02-02 27 27 0.00 Newcastle (C) - Remainder 1-10-02-09 281 299 6.41 Newcastle (C) - Remainder 1-10-02-10 463 498 7.56

New South Wales Redistribution Statistics 2006
Enrolment Projections Newcastle
Actual Enrolment Estimate Growth SLA Name CCD Number 2/12/2005 31/5/2010 (%)
202
Newcastle (C) - Remainder 1-10-02-11 971 1391 43.25 Newcastle (C) - Remainder 1-10-02-12 689 704 2.18 Newcastle (C) - Remainder 1-10-02-13 482 482 0.00 Newcastle (C) - Remainder 1-10-02-14 701 798 13.84 Newcastle (C) - Remainder 1-10-02-15 362 511 41.16 Newcastle (C) - Remainder 1-10-03-01 353 367 3.97 Newcastle (C) - Remainder 1-10-03-02 95 107 12.63 Newcastle (C) - Remainder 1-10-03-03 256 254 -0.78 Newcastle (C) - Remainder 1-10-03-04 437 437 0.00 Newcastle (C) - Remainder 1-10-03-05 354 359 1.41 Newcastle (C) - Remainder 1-10-03-06 322 334 3.73 Newcastle (C) - Remainder 1-10-03-07 352 357 1.42 Newcastle (C) - Remainder 1-10-03-08 934 989 5.89 Newcastle (C) - Remainder 1-10-03-09 528 531 0.57 Newcastle (C) - Remainder 1-10-03-10 520 520 0.00 Newcastle (C) - Remainder 1-10-03-11 327 339 3.67 Newcastle (C) - Remainder 1-10-03-12 214 217 1.40 Newcastle (C) - Remainder 1-10-03-13 4 4 0.00 Newcastle (C) - Remainder 1-10-03-16 329 325 -1.22 Newcastle (C) - Remainder 1-10-03-17 258 264 2.33 Newcastle (C) - Remainder 1-10-03-18 275 278 1.09 Newcastle (C) - Remainder 1-10-03-19 163 162 -0.61 Newcastle (C) - Remainder 1-10-04-01 434 441 1.61 Newcastle (C) - Remainder 1-10-04-02 316 312 -1.27 Newcastle (C) - Remainder 1-10-04-03 504 505 0.20 Newcastle (C) - Remainder 1-10-04-04 203 209 2.96 Newcastle (C) - Remainder 1-10-04-05 268 266 -0.75 Newcastle (C) - Remainder 1-10-04-06 388 400 3.09 Newcastle (C) - Remainder 1-10-04-07 444 447 0.68 Newcastle (C) - Remainder 1-10-04-08 415 419 0.96 Newcastle (C) - Remainder 1-10-04-09 326 356 9.20 Newcastle (C) - Remainder 1-10-04-10 622 619 -0.48 Newcastle (C) - Remainder 1-10-05-01 430 428 -0.47 Newcastle (C) - Remainder 1-10-05-02 431 438 1.62 Newcastle (C) - Remainder 1-10-05-03 757 1259 66.31 Newcastle (C) - Remainder 1-10-05-04 441 455 3.17 Newcastle (C) - Remainder 1-10-05-05 304 322 5.92 Newcastle (C) - Remainder 1-10-05-06 258 263 1.94 Newcastle (C) - Remainder 1-10-05-07 142 157 10.56 Newcastle (C) - Remainder 1-10-05-08 25 26 4.00 Newcastle (C) - Remainder 1-10-05-09 405 430 6.17 Newcastle (C) - Remainder 1-10-05-14 294 311 5.78

New South Wales Redistribution Statistics 2006
Enrolment Projections Newcastle
Actual Enrolment Estimate Growth SLA Name CCD Number 2/12/2005 31/5/2010 (%)
203
Newcastle (C) - Remainder 1-10-05-16 503 535 6.36 Newcastle (C) - Remainder 1-10-06-01 338 362 7.10 Newcastle (C) - Remainder 1-10-07-01 171 173 1.17 Newcastle (C) - Remainder 1-10-07-02 354 377 6.50 Newcastle (C) - Remainder 1-10-07-03 450 448 -0.44 Newcastle (C) - Remainder 1-10-07-04 736 779 5.84 Newcastle (C) - Remainder 1-10-07-05 301 313 3.99 Newcastle (C) - Remainder 1-10-07-06 197 222 12.69 Newcastle (C) - Remainder 1-10-07-07 262 265 1.15 Newcastle (C) - Remainder 1-10-07-08 370 390 5.41 Newcastle (C) - Remainder 1-10-07-09 443 457 3.16 Newcastle (C) - Remainder 1-10-07-10 324 326 0.62 Newcastle (C) - Remainder 1-10-07-11 232 250 7.76 Newcastle (C) - Remainder 1-10-07-12 285 289 1.40 Newcastle (C) - Remainder 1-10-07-13 206 207 0.49 Newcastle (C) - Remainder 1-10-07-14 251 254 1.20 Newcastle (C) - Remainder 1-10-08-01 433 432 -0.23 Newcastle (C) - Remainder 1-10-08-02 424 419 -1.18 Newcastle (C) - Remainder 1-10-08-03 191 188 -1.57 Newcastle (C) - Remainder 1-10-08-04 543 565 4.05 Newcastle (C) - Remainder 1-10-08-05 384 386 0.52 Newcastle (C) - Remainder 1-10-08-06 563 560 -0.53 Newcastle (C) - Remainder 1-10-08-07 385 435 12.99 Newcastle (C) - Remainder 1-10-08-08 220 214 -2.73 Newcastle (C) - Remainder 1-10-09-01 353 353 0.00 Newcastle (C) - Remainder 1-10-09-02 220 226 2.73 Newcastle (C) - Remainder 1-10-09-03 339 350 3.24 Newcastle (C) - Remainder 1-10-09-04 511 514 0.59 Newcastle (C) - Remainder 1-10-09-05 188 188 0.00 Newcastle (C) - Remainder 1-10-09-06 405 417 2.96 Newcastle (C) - Remainder 1-10-09-07 243 248 2.06 Newcastle (C) - Remainder 1-10-09-08 421 429 1.90 Newcastle (C) - Remainder 1-10-09-09 539 553 2.60 Newcastle (C) - Remainder 1-10-09-10 597 594 -0.50 Newcastle (C) - Remainder 1-10-09-11 297 297 0.00 Newcastle (C) - Remainder 1-10-09-12 236 240 1.69 Newcastle (C) - Remainder 1-10-10-01 266 276 3.76 Newcastle (C) - Remainder 1-10-10-02 443 439 -0.90 Newcastle (C) - Remainder 1-10-10-03 432 446 3.24 Newcastle (C) - Remainder 1-10-10-04 480 501 4.38 Newcastle (C) - Remainder 1-10-10-05 303 304 0.33 Newcastle (C) - Remainder 1-10-10-06 564 568 0.71

New South Wales Redistribution Statistics 2006
Enrolment Projections Newcastle
Actual Enrolment Estimate Growth SLA Name CCD Number 2/12/2005 31/5/2010 (%)
204
Newcastle (C) - Remainder 1-10-10-07 504 511 1.39 Newcastle (C) - Remainder 1-10-10-08 491 511 4.07 Newcastle (C) - Remainder 1-10-10-09 300 302 0.67 Newcastle (C) - Remainder 1-10-10-10 279 281 0.72 Newcastle (C) - Remainder 1-10-10-11 353 373 5.67 Newcastle (C) - Remainder 1-10-10-12 235 237 0.85 Newcastle (C) - Remainder 1-10-10-13 169 172 1.78 Newcastle (C) - Remainder 1-10-10-14 196 193 -1.53 Newcastle (C) - Remainder 1-10-10-15 210 215 2.38 Newcastle (C) - Remainder 1-10-11-01 208 211 1.44 Newcastle (C) - Remainder 1-10-11-02 382 380 -0.52 Newcastle (C) - Remainder 1-10-11-03 258 266 3.10 Newcastle (C) - Remainder 1-10-11-04 572 571 -0.17 Newcastle (C) - Remainder 1-10-11-05 289 302 4.50 Newcastle (C) - Remainder 1-10-11-06 414 417 0.72 Newcastle (C) - Remainder 1-10-11-07 251 255 1.59 Newcastle (C) - Remainder 1-10-11-08 218 219 0.46 Newcastle (C) - Remainder 1-10-11-09 150 152 1.33 Newcastle (C) - Remainder 1-10-11-10 147 148 0.68 Newcastle (C) - Remainder 1-10-12-01 323 340 5.26 Newcastle (C) - Remainder 1-10-12-02 316 330 4.43 Newcastle (C) - Remainder 1-10-12-03 373 372 -0.27 Newcastle (C) - Remainder 1-10-12-04 268 258 -3.73 Newcastle (C) - Remainder 1-10-12-05 321 345 7.48 Newcastle (C) - Remainder 1-10-12-06 228 238 4.39 Newcastle (C) - Remainder 1-10-12-07 226 234 3.54 Newcastle (C) - Remainder 1-10-12-08 361 377 4.43 Newcastle (C) - Remainder 1-10-12-09 340 345 1.47 Newcastle (C) - Remainder 1-10-12-10 372 375 0.81 Newcastle (C) - Remainder 1-10-12-11 350 357 2.00 Newcastle (C) - Remainder 1-10-12-12 434 445 2.53 Newcastle (C) - Remainder 1-10-13-01 314 319 1.59 Newcastle (C) - Remainder 1-10-13-02 173 173 0.00 Newcastle (C) - Remainder 1-10-13-03 137 150 9.49 Newcastle (C) - Remainder 1-10-13-04 398 409 2.76 Newcastle (C) - Remainder 1-10-13-05 201 207 2.99 Newcastle (C) - Remainder 1-10-13-06 241 240 -0.41 Newcastle (C) - Remainder 1-10-13-08 256 262 2.34 Newcastle (C) - Remainder 1-10-13-09 377 383 1.59 Newcastle (C) - Remainder 1-10-13-10 244 244 0.00 Newcastle (C) - Remainder 1-10-13-11 146 144 -1.37 Newcastle (C) - Remainder 1-10-13-12 102 102 0.00
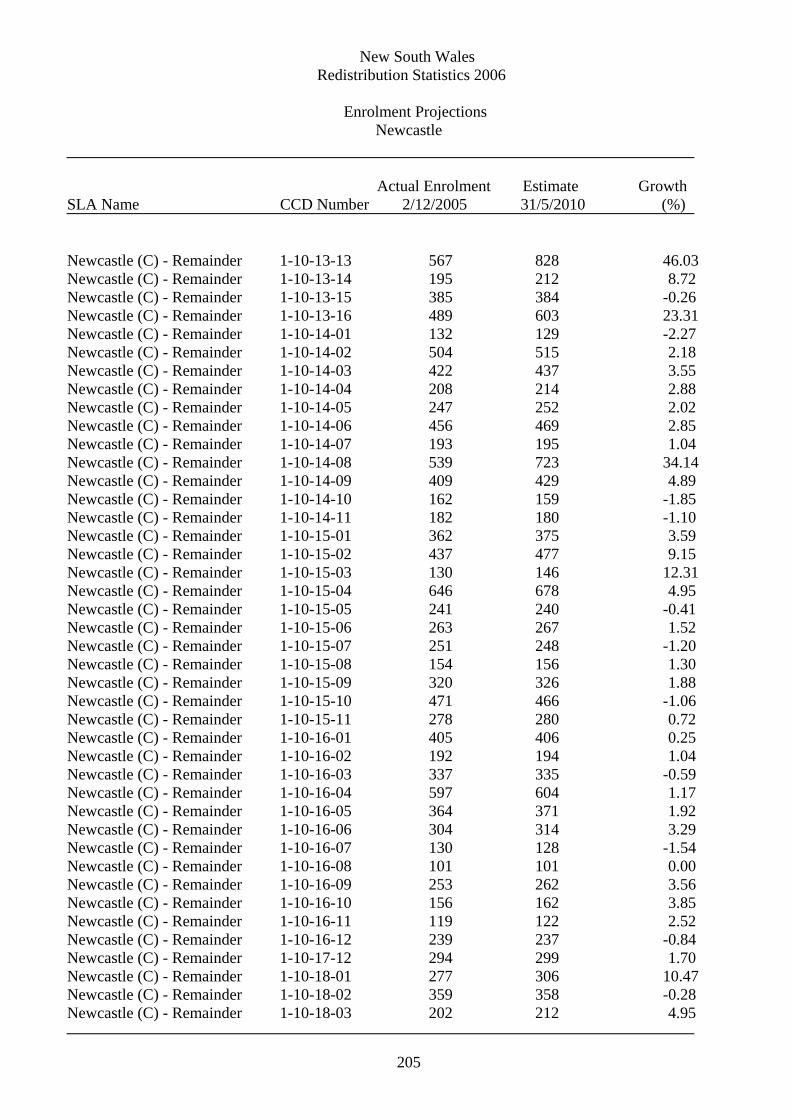
New South Wales Redistribution Statistics 2006
Enrolment Projections Newcastle
Actual Enrolment Estimate Growth SLA Name CCD Number 2/12/2005 31/5/2010 (%)
205
Newcastle (C) - Remainder 1-10-13-13 567 828 46.03 Newcastle (C) - Remainder 1-10-13-14 195 212 8.72 Newcastle (C) - Remainder 1-10-13-15 385 384 -0.26 Newcastle (C) - Remainder 1-10-13-16 489 603 23.31 Newcastle (C) - Remainder 1-10-14-01 132 129 -2.27 Newcastle (C) - Remainder 1-10-14-02 504 515 2.18 Newcastle (C) - Remainder 1-10-14-03 422 437 3.55 Newcastle (C) - Remainder 1-10-14-04 208 214 2.88 Newcastle (C) - Remainder 1-10-14-05 247 252 2.02 Newcastle (C) - Remainder 1-10-14-06 456 469 2.85 Newcastle (C) - Remainder 1-10-14-07 193 195 1.04 Newcastle (C) - Remainder 1-10-14-08 539 723 34.14 Newcastle (C) - Remainder 1-10-14-09 409 429 4.89 Newcastle (C) - Remainder 1-10-14-10 162 159 -1.85 Newcastle (C) - Remainder 1-10-14-11 182 180 -1.10 Newcastle (C) - Remainder 1-10-15-01 362 375 3.59 Newcastle (C) - Remainder 1-10-15-02 437 477 9.15 Newcastle (C) - Remainder 1-10-15-03 130 146 12.31 Newcastle (C) - Remainder 1-10-15-04 646 678 4.95 Newcastle (C) - Remainder 1-10-15-05 241 240 -0.41 Newcastle (C) - Remainder 1-10-15-06 263 267 1.52 Newcastle (C) - Remainder 1-10-15-07 251 248 -1.20 Newcastle (C) - Remainder 1-10-15-08 154 156 1.30 Newcastle (C) - Remainder 1-10-15-09 320 326 1.88 Newcastle (C) - Remainder 1-10-15-10 471 466 -1.06 Newcastle (C) - Remainder 1-10-15-11 278 280 0.72 Newcastle (C) - Remainder 1-10-16-01 405 406 0.25 Newcastle (C) - Remainder 1-10-16-02 192 194 1.04 Newcastle (C) - Remainder 1-10-16-03 337 335 -0.59 Newcastle (C) - Remainder 1-10-16-04 597 604 1.17 Newcastle (C) - Remainder 1-10-16-05 364 371 1.92 Newcastle (C) - Remainder 1-10-16-06 304 314 3.29 Newcastle (C) - Remainder 1-10-16-07 130 128 -1.54 Newcastle (C) - Remainder 1-10-16-08 101 101 0.00 Newcastle (C) - Remainder 1-10-16-09 253 262 3.56 Newcastle (C) - Remainder 1-10-16-10 156 162 3.85 Newcastle (C) - Remainder 1-10-16-11 119 122 2.52 Newcastle (C) - Remainder 1-10-16-12 239 237 -0.84 Newcastle (C) - Remainder 1-10-17-12 294 299 1.70 Newcastle (C) - Remainder 1-10-18-01 277 306 10.47 Newcastle (C) - Remainder 1-10-18-02 359 358 -0.28 Newcastle (C) - Remainder 1-10-18-03 202 212 4.95

New South Wales Redistribution Statistics 2006
Enrolment Projections Newcastle
Actual Enrolment Estimate Growth SLA Name CCD Number 2/12/2005 31/5/2010 (%)
206
Newcastle (C) - Remainder 1-10-18-04 284 295 3.87 Newcastle (C) - Remainder 1-10-18-05 176 190 7.95 Newcastle (C) - Remainder 1-10-18-06 372 381 2.42 Newcastle (C) - Remainder 1-10-18-07 320 335 4.69 Newcastle (C) - Remainder 1-10-18-08 181 198 9.39 Newcastle (C) - Remainder 1-10-18-09 297 312 5.05 Newcastle (C) - Remainder 1-10-18-10 117 125 6.84 Newcastle (C) - Remainder 1-10-19-01 447 480 7.38 Newcastle (C) - Remainder 1-10-19-02 525 551 4.95 Newcastle (C) - Remainder 1-10-19-03 447 468 4.70 Newcastle (C) - Remainder 1-10-19-04 355 373 5.07 Newcastle (C) - Remainder 1-10-19-05 276 264 -4.35 Newcastle (C) - Remainder 1-10-19-06 460 479 4.13 Newcastle (C) - Remainder 1-10-19-07 291 308 5.84 Newcastle (C) - Remainder 1-10-19-08 346 349 0.87 Newcastle (C) - Remainder 1-10-19-09 259 277 6.95 Newcastle (C) - Remainder 1-10-19-10 553 584 5.61 Newcastle (C) - Remainder 1-10-19-11 568 625 10.04 Newcastle (C) - Remainder 1-10-20-01 273 287 5.13 Newcastle (C) - Remainder 1-10-20-02 251 271 7.97 Newcastle (C) - Remainder 1-10-20-03 252 258 2.38 Newcastle (C) - Remainder 1-10-20-04 405 432 6.67 Newcastle (C) - Remainder 1-10-20-05 398 400 0.50 Newcastle (C) - Remainder 1-10-20-06 260 279 7.31 Newcastle (C) - Remainder 1-10-20-07 422 477 13.03 Newcastle (C) - Remainder 1-10-20-08 210 218 3.81 Newcastle (C) - Remainder 1-10-20-09 680 689 1.32 Newcastle (C) - Remainder 1-10-20-10 312 328 5.13 Newcastle (C) - Remainder 1-10-20-11 378 383 1.32 Newcastle (C) - Remainder 1-10-20-12 382 397 3.93 Newcastle (C) - Remainder 1-10-20-13 221 255 15.38 Newcastle (C) - Remainder 1-10-20-14 146 148 1.37 Newcastle (C) - Remainder 1-10-20-15 299 344 15.05 Newcastle (C) - Remainder 1-10-21-01 369 455 23.31 Newcastle (C) - Remainder 1-10-21-02 444 443 -0.23 Newcastle (C) - Remainder 1-10-21-03 343 354 3.21 Newcastle (C) - Remainder 1-10-21-04 156 153 -1.92 Newcastle (C) - Remainder 1-10-21-05 347 345 -0.58 Newcastle (C) - Remainder 1-10-21-06 351 350 -0.28 Newcastle (C) - Remainder 1-10-21-07 357 355 -0.56 Newcastle (C) - Remainder 1-10-21-08 420 475 13.10 Newcastle (C) - Remainder 1-10-21-09 294 303 3.06

New South Wales Redistribution Statistics 2006
Enrolment Projections Newcastle
Actual Enrolment Estimate Growth SLA Name CCD Number 2/12/2005 31/5/2010 (%)
207
Newcastle (C) - Remainder 1-10-21-10 390 392 0.51 Newcastle (C) - Remainder 1-10-21-11 589 588 -0.17 Newcastle (C) - Remainder 1-10-21-12 257 256 -0.39 Newcastle (C) - Remainder 1-10-21-13 549 557 1.46 Newcastle (C) - Remainder 1-10-21-14 549 552 0.55 Newcastle (C) - Remainder 1-10-21-15 580 591 1.90 Newcastle (C) - Remainder 1-10-22-01 26 27 3.85 Newcastle (C) - Remainder 1-10-22-01 24 25 4.17 Newcastle (C) - Remainder 1-10-22-02 259 264 1.93 Newcastle (C) - Remainder 1-10-22-03 458 459 0.22 Newcastle (C) - Remainder 1-10-22-04 432 440 1.85 Newcastle (C) - Remainder 1-10-22-05 449 460 2.45 Newcastle (C) - Remainder 1-10-22-06 481 498 3.53 Newcastle (C) - Remainder 1-10-22-07 175 189 8.00 Newcastle (C) - Remainder 1-10-22-08 380 407 7.11 Newcastle (C) - Remainder 1-10-22-09 227 236 3.96 Newcastle (C) - Remainder 1-10-22-10 258 258 0.00 Newcastle (C) - Remainder 1-10-22-11 404 409 1.24 Newcastle (C) - Remainder 1-10-22-12 240 248 3.33 Newcastle (C) - Remainder 1-10-22-13 460 467 1.52 Newcastle (C) - Remainder 1-10-22-14 386 393 1.81 Newcastle (C) - Remainder 1-10-22-15 130 134 3.08 Newcastle (C) - Remainder 1-10-22-16 464 457 -1.51 Newcastle (C) - Remainder 244 83454 87508 4.86 Newcastle 266 89252 95023 6.47

New South Wales Redistribution Statistics 2006
Enrolment Projections New England
Actual Enrolment Estimate Growth SLA Name CCD Number 2/12/2005 31/5/2010 (%)
208
Armidale Dumaresq (A) - City 1-05-18-01 363 364 0.28 Armidale Dumaresq (A) - City 1-05-18-02 466 470 0.86 Armidale Dumaresq (A) - City 1-05-18-03 320 329 2.81 Armidale Dumaresq (A) - City 1-05-18-04 179 181 1.12 Armidale Dumaresq (A) - City 1-05-18-05 366 366 0.00 Armidale Dumaresq (A) - City 1-05-18-06 422 427 1.18 Armidale Dumaresq (A) - City 1-05-18-07 421 431 2.38 Armidale Dumaresq (A) - City 1-05-18-08 269 267 -0.74 Armidale Dumaresq (A) - City 1-05-18-09 295 300 1.69 Armidale Dumaresq (A) - City 1-05-18-10 332 337 1.51 Armidale Dumaresq (A) - City 1-05-19-01 431 439 1.86 Armidale Dumaresq (A) - City 1-05-19-02 246 242 -1.63 Armidale Dumaresq (A) - City 1-05-19-03 274 272 -0.73 Armidale Dumaresq (A) - City 1-05-19-04 331 334 0.91 Armidale Dumaresq (A) - City 1-05-19-05 285 282 -1.05 Armidale Dumaresq (A) - City 1-05-19-06 203 200 -1.48 Armidale Dumaresq (A) - City 1-05-19-07 197 196 -0.51 Armidale Dumaresq (A) - City 1-05-19-08 328 336 2.44 Armidale Dumaresq (A) - City 1-05-19-09 507 518 2.17 Armidale Dumaresq (A) - City 1-05-19-10 520 526 1.15 Armidale Dumaresq (A) - City 1-05-19-11 366 372 1.64 Armidale Dumaresq (A) - City 1-05-19-12 231 239 3.46 Armidale Dumaresq (A) - City 1-05-20-01 478 490 2.51 Armidale Dumaresq (A) - City 1-05-20-02 419 418 -0.24 Armidale Dumaresq (A) - City 1-05-20-03 319 324 1.57 Armidale Dumaresq (A) - City 1-05-20-04 310 315 1.61 Armidale Dumaresq (A) - City 1-05-20-05 391 393 0.51 Armidale Dumaresq (A) - City 1-05-20-06 140 139 -0.71 Armidale Dumaresq (A) - City 1-05-20-07 329 326 -0.91 Armidale Dumaresq (A) - City 1-05-20-08 263 264 0.38 Armidale Dumaresq (A) - City 1-05-20-09 490 493 0.61 Armidale Dumaresq (A) - City 1-05-20-10 316 334 5.70 Armidale Dumaresq (A) - City 1-05-20-11 454 466 2.64 Armidale Dumaresq (A) - City 1-05-20-12 234 240 2.56 Armidale Dumaresq (A) - City 1-05-20-13 349 355 1.72 Armidale Dumaresq (A) - City 1-05-20-14 420 422 0.48 Armidale Dumaresq (A) - City 36 12264 12407 1.17 Armidale Dumaresq (A) Bal 1-05-17-01 78 79 1.28 Armidale Dumaresq (A) Bal 1-05-17-02 122 128 4.92 Armidale Dumaresq (A) Bal 1-05-17-03 268 278 3.73

New South Wales Redistribution Statistics 2006
Enrolment Projections New England
Actual Enrolment Estimate Growth SLA Name CCD Number 2/12/2005 31/5/2010 (%)
209
Armidale Dumaresq (A) Bal 1-05-17-04 356 354 -0.56 Armidale Dumaresq (A) Bal 1-05-17-05 259 260 0.39 Armidale Dumaresq (A) Bal 1-05-17-06 124 124 0.00 Armidale Dumaresq (A) Bal 1-05-17-07 486 493 1.44 Armidale Dumaresq (A) Bal 1-05-28-01 198 202 2.02 Armidale Dumaresq (A) Bal 1-05-28-02 258 262 1.55 Armidale Dumaresq (A) Bal 1-05-28-03 116 118 1.72 Armidale Dumaresq (A) Bal 1-05-28-04 102 103 0.98 Armidale Dumaresq (A) Bal 1-05-28-05 205 209 1.95 Armidale Dumaresq (A) Bal 1-05-28-06 122 123 0.82 Armidale Dumaresq (A) Bal 1-05-28-07 59 60 1.69 Armidale Dumaresq (A) Bal 14 2753 2793 1.45 Glen Innes Severn (A) - Glen 1-05-23-01 474 474 0.00 Innes Glen Innes Severn (A) - Glen 1-05-23-02 318 325 2.20 Innes Glen Innes Severn (A) - Glen 1-05-23-03 393 398 1.27 Innes Glen Innes Severn (A) - Glen 1-05-23-04 242 236 -2.48 Innes Glen Innes Severn (A) - Glen 1-05-23-05 159 165 3.77 Innes Glen Innes Severn (A) - Glen 1-05-23-06 212 214 0.94 Innes Glen Innes Severn (A) - Glen 1-05-23-07 453 485 7.06 Innes Glen Innes Severn (A) - Glen 1-05-23-08 239 243 1.67 Innes Glen Innes Severn (A) - Glen 1-05-23-09 428 441 3.04 Innes Glen Innes Severn (A) - Glen 1-05-23-10 351 350 -0.28 Innes Glen Innes Severn (A) - Glen 1-05-23-11 423 442 4.49 Innes Glen Innes Severn (A) - Glen 1-05-23-12 239 246 2.93 Innes Glen Innes Severn (A) - Glen 1-05-23-13 233 240 3.00 Innes Glen Innes Severn (A) - Glen 13 4164 4259 2.28

New South Wales Redistribution Statistics 2006
Enrolment Projections New England
Actual Enrolment Estimate Growth SLA Name CCD Number 2/12/2005 31/5/2010 (%)
210
Innes Glen Innes Severn (A) - Severn 1-05-21-01 203 211 3.94 Glen Innes Severn (A) - Severn 1-05-21-02 206 198 -3.88 Glen Innes Severn (A) - Severn 1-05-21-03 163 163 0.00 Glen Innes Severn (A) - Severn 1-05-21-04 130 139 6.92 Glen Innes Severn (A) - Severn 1-05-21-05 27 25 -7.41 Glen Innes Severn (A) - Severn 1-05-21-06 114 116 1.75 Glen Innes Severn (A) - Severn 1-05-22-01 128 126 -1.56 Glen Innes Severn (A) - Severn 1-05-22-02 68 67 -1.47 Glen Innes Severn (A) - Severn 1-05-22-03 155 160 3.23 Glen Innes Severn (A) - Severn 1-05-22-04 203 195 -3.94 Glen Innes Severn (A) - Severn 1-05-22-05 78 75 -3.85 Glen Innes Severn (A) - Severn 1-05-22-06 120 120 0.00 Glen Innes Severn (A) - Severn 1-05-22-07 256 257 0.39 Glen Innes Severn (A) - Severn 1-05-22-08 134 141 5.22 Glen Innes Severn (A) - Severn 14 1985 1993 0.40 Guyra (A) 1-05-05-01 126 130 3.17 Guyra (A) 1-05-05-02 142 149 4.93 Guyra (A) 1-05-05-03 342 351 2.63 Guyra (A) 1-05-05-04 128 138 7.81 Guyra (A) 1-05-05-05 165 157 -4.85 Guyra (A) 1-05-05-06 169 179 5.92 Guyra (A) 1-05-06-01 113 123 8.85 Guyra (A) 1-05-06-02 173 173 0.00 Guyra (A) 1-05-06-03 98 111 13.27 Guyra (A) 1-05-06-04 501 525 4.79 Guyra (A) 1-05-06-05 254 268 5.51 Guyra (A) 1-05-06-06 538 546 1.49 Guyra (A) 1-05-06-07 194 203 4.64 Guyra (A) 13 2943 3053 3.74 Gwydir (A) - Bingara 1-04-20-01 179 178 -0.56 Gwydir (A) - Bingara 1-04-20-02 235 233 -0.85 Gwydir (A) - Bingara 1-04-20-03 82 86 4.88 Gwydir (A) - Bingara 1-04-20-04 78 65 -16.67 Gwydir (A) - Bingara 1-04-20-05 138 143 3.62 Gwydir (A) - Bingara 1-04-20-06 108 106 -1.85 Gwydir (A) - Bingara 1-04-20-07 378 391 3.44

New South Wales Redistribution Statistics 2006
Enrolment Projections New England
Actual Enrolment Estimate Growth SLA Name CCD Number 2/12/2005 31/5/2010 (%)
211
Gwydir (A) - Bingara 1-04-20-08 311 301 -3.22 Gwydir (A) - Bingara 8 1509 1503 -0.40 Gwydir (A) Bal 1-04-21-01 46 47 2.17 Gwydir (A) Bal 1-04-21-02 96 93 -3.12 Gwydir (A) Bal 1-04-21-03 62 62 0.00 Gwydir (A) Bal 1-04-21-04 79 81 2.53 Gwydir (A) Bal 1-04-21-05 7 7 0.00 Gwydir (A) Bal 5 290 290 0.00 Inverell (A) - Pt A 1-05-01-01 74 73 -1.35 Inverell (A) - Pt A 1-05-01-02 67 67 0.00 Inverell (A) - Pt A 1-05-01-03 61 60 -1.64 Inverell (A) - Pt A 1-05-01-04 166 163 -1.81 Inverell (A) - Pt A 1-05-01-05 123 129 4.88 Inverell (A) - Pt A 1-05-01-06 72 68 -5.56 Inverell (A) - Pt A 1-05-01-07 51 55 7.84 Inverell (A) - Pt A 1-05-01-08 103 109 5.83 Inverell (A) - Pt A 1-05-01-09 349 366 4.87 Inverell (A) - Pt A 1-05-01-10 98 106 8.16 Inverell (A) - Pt A 1-05-02-01 100 97 -3.00 Inverell (A) - Pt A 1-05-02-02 187 197 5.35 Inverell (A) - Pt A 1-05-02-03 207 206 -0.48 Inverell (A) - Pt A 1-05-02-04 98 104 6.12 Inverell (A) - Pt A 1-05-02-05 510 561 10.00 Inverell (A) - Pt A 1-05-02-06 121 125 3.31 Inverell (A) - Pt A 1-05-02-07 324 338 4.32 Inverell (A) - Pt A 1-05-02-08 346 344 -0.58 Inverell (A) - Pt A 1-05-02-09 276 279 1.09 Inverell (A) - Pt A 19 3333 3447 3.42 Inverell (A) - Pt B 1-05-03-01 257 267 3.89 Inverell (A) - Pt B 1-05-03-02 104 107 2.88 Inverell (A) - Pt B 1-05-03-03 102 107 4.90 Inverell (A) - Pt B 1-05-03-04 72 76 5.56 Inverell (A) - Pt B 1-05-03-05 210 225 7.14 Inverell (A) - Pt B 1-05-03-06 478 526 10.04 Inverell (A) - Pt B 1-05-03-07 487 519 6.57 Inverell (A) - Pt B 1-05-03-08 253 265 4.74

New South Wales Redistribution Statistics 2006
Enrolment Projections New England
Actual Enrolment Estimate Growth SLA Name CCD Number 2/12/2005 31/5/2010 (%)
212
Inverell (A) - Pt B 1-05-04-01 190 201 5.79 Inverell (A) - Pt B 1-05-04-02 217 227 4.61 Inverell (A) - Pt B 1-05-04-03 386 400 3.63 Inverell (A) - Pt B 1-05-04-04 452 472 4.42 Inverell (A) - Pt B 1-05-04-05 296 319 7.77 Inverell (A) - Pt B 1-05-04-06 411 423 2.92 Inverell (A) - Pt B 1-05-04-07 287 303 5.57 Inverell (A) - Pt B 1-05-04-08 117 133 13.68 Inverell (A) - Pt B 1-05-04-09 404 425 5.20 Inverell (A) - Pt B 1-05-04-10 531 552 3.95 Inverell (A) - Pt B 1-05-04-11 492 516 4.88 Inverell (A) - Pt B 1-05-04-12 214 224 4.67 Inverell (A) - Pt B 1-05-04-13 192 191 -0.52 Inverell (A) - Pt B 1-05-04-14 277 287 3.61 Inverell (A) - Pt B 1-05-04-15 315 333 5.71 Inverell (A) - Pt B 1-05-04-16 497 533 7.24 Inverell (A) - Pt B 24 7241 7631 5.39 Liverpool Plains (A) - Pt A 1-05-09-05 1 1 0.00 Liverpool Plains (A) - Pt A 1-05-09-05 1 1 0.00 Liverpool Plains (A) - Pt A 1-05-09-08 67 67 0.00 Liverpool Plains (A) - Pt A 1-05-09-09 245 247 0.82 Liverpool Plains (A) - Pt A 1-05-09-10 411 415 0.97 Liverpool Plains (A) - Pt A 1-05-09-11 382 381 -0.26 Liverpool Plains (A) - Pt A 1-05-09-12 281 287 2.14 Liverpool Plains (A) - Pt A 1-05-09-13 36 37 2.78 Liverpool Plains (A) - Pt A 8 1424 1436 0.84 Tamworth Regional (A) - Pt A 1-05-08-01 412 443 7.52 Tamworth Regional (A) - Pt A 1-05-08-02 511 549 7.44 Tamworth Regional (A) - Pt A 1-05-08-03 237 256 8.02 Tamworth Regional (A) - Pt A 1-05-08-05 298 314 5.37 Tamworth Regional (A) - Pt A 1-05-08-07 501 562 12.18 Tamworth Regional (A) - Pt A 1-05-08-08 553 599 8.32 Tamworth Regional (A) - Pt A 1-05-08-09 298 313 5.03 Tamworth Regional (A) - Pt A 1-05-08-10 606 628 3.63 Tamworth Regional (A) - Pt A 1-05-09-02 245 245 0.00 Tamworth Regional (A) - Pt A 1-05-09-08 169 169 0.00 Tamworth Regional (A) - Pt A 1-05-10-01 142 149 4.93 Tamworth Regional (A) - Pt A 1-05-10-02 48 79 64.58

New South Wales Redistribution Statistics 2006
Enrolment Projections New England
Actual Enrolment Estimate Growth SLA Name CCD Number 2/12/2005 31/5/2010 (%)
213
Tamworth Regional (A) - Pt A 1-05-10-03 205 203 -0.98 Tamworth Regional (A) - Pt A 1-05-10-04 515 519 0.78 Tamworth Regional (A) - Pt A 1-05-10-05 403 426 5.71 Tamworth Regional (A) - Pt A 1-05-10-06 314 322 2.55 Tamworth Regional (A) - Pt A 1-05-10-07 252 263 4.37 Tamworth Regional (A) - Pt A 1-05-10-08 400 407 1.75 Tamworth Regional (A) - Pt A 1-05-10-09 458 463 1.09 Tamworth Regional (A) - Pt A 1-05-10-10 305 307 0.66 Tamworth Regional (A) - Pt A 1-05-10-11 496 498 0.40 Tamworth Regional (A) - Pt A 1-05-10-12 410 409 -0.24 Tamworth Regional (A) - Pt A 1-05-10-13 194 187 -3.61 Tamworth Regional (A) - Pt A 1-05-10-14 440 444 0.91 Tamworth Regional (A) - Pt A 1-05-10-15 395 432 9.37 Tamworth Regional (A) - Pt A 1-05-11-01 774 806 4.13 Tamworth Regional (A) - Pt A 1-05-11-02 461 468 1.52 Tamworth Regional (A) - Pt A 1-05-11-03 344 375 9.01 Tamworth Regional (A) - Pt A 1-05-11-04 371 381 2.70 Tamworth Regional (A) - Pt A 1-05-11-05 93 89 -4.30 Tamworth Regional (A) - Pt A 1-05-11-06 100 106 6.00 Tamworth Regional (A) - Pt A 1-05-11-07 635 757 19.21 Tamworth Regional (A) - Pt A 1-05-11-08 359 364 1.39 Tamworth Regional (A) - Pt A 1-05-11-09 416 430 3.37 Tamworth Regional (A) - Pt A 1-05-11-10 154 164 6.49 Tamworth Regional (A) - Pt A 1-05-11-11 236 256 8.47 Tamworth Regional (A) - Pt A 1-05-11-12 376 395 5.05 Tamworth Regional (A) - Pt A 1-05-11-13 382 401 4.97 Tamworth Regional (A) - Pt A 1-05-11-14 588 687 16.84 Tamworth Regional (A) - Pt A 1-05-11-15 224 225 0.45 Tamworth Regional (A) - Pt A 1-05-11-16 304 311 2.30 Tamworth Regional (A) - Pt A 1-05-11-17 276 276 0.00 Tamworth Regional (A) - Pt A 1-05-11-18 437 446 2.06 Tamworth Regional (A) - Pt A 1-05-12-01 266 271 1.88 Tamworth Regional (A) - Pt A 1-05-12-02 469 469 0.00 Tamworth Regional (A) - Pt A 1-05-12-03 346 344 -0.58 Tamworth Regional (A) - Pt A 1-05-12-04 483 479 -0.83 Tamworth Regional (A) - Pt A 1-05-12-05 508 506 -0.39 Tamworth Regional (A) - Pt A 1-05-12-06 561 607 8.20 Tamworth Regional (A) - Pt A 1-05-12-07 435 489 12.41 Tamworth Regional (A) - Pt A 1-05-12-08 512 514 0.39 Tamworth Regional (A) - Pt A 1-05-12-09 163 161 -1.23 Tamworth Regional (A) - Pt A 1-05-12-10 461 459 -0.43 Tamworth Regional (A) - Pt A 1-05-12-11 383 390 1.83

New South Wales Redistribution Statistics 2006
Enrolment Projections New England
Actual Enrolment Estimate Growth SLA Name CCD Number 2/12/2005 31/5/2010 (%)
214
Tamworth Regional (A) - Pt A 1-05-12-12 422 434 2.84 Tamworth Regional (A) - Pt A 1-05-12-13 665 736 10.68 Tamworth Regional (A) - Pt A 1-05-12-14 553 691 24.95 Tamworth Regional (A) - Pt A 1-05-12-15 663 850 28.21 Tamworth Regional (A) - Pt A 1-05-12-16 558 693 24.19 Tamworth Regional (A) - Pt A 1-05-13-01 257 277 7.78 Tamworth Regional (A) - Pt A 1-05-13-02 72 68 -5.56 Tamworth Regional (A) - Pt A 1-05-13-03 269 282 4.83 Tamworth Regional (A) - Pt A 1-05-13-04 609 677 11.17 Tamworth Regional (A) - Pt A 1-05-13-05 495 548 10.71 Tamworth Regional (A) - Pt A 1-05-13-06 324 323 -0.31 Tamworth Regional (A) - Pt A 1-05-13-07 324 328 1.23 Tamworth Regional (A) - Pt A 1-05-13-08 439 445 1.37 Tamworth Regional (A) - Pt A 1-05-13-09 269 268 -0.37 Tamworth Regional (A) - Pt A 1-05-13-10 100 103 3.00 Tamworth Regional (A) - Pt A 1-05-13-11 272 279 2.57 Tamworth Regional (A) - Pt A 1-05-13-12 669 707 5.68 Tamworth Regional (A) - Pt A 1-05-13-13 415 419 0.96 Tamworth Regional (A) - Pt A 1-05-13-14 204 202 -0.98 Tamworth Regional (A) - Pt A 1-05-13-15 396 441 11.36 Tamworth Regional (A) - Pt A 1-05-13-16 224 223 -0.45 Tamworth Regional (A) - Pt A 1-05-29-09 307 321 4.56 Tamworth Regional (A) - Pt A 76 28430 30127 5.97 Tamworth Regional (A) - Pt B 1-04-21-01 23 23 0.00 Tamworth Regional (A) - Pt B 1-04-21-03 84 85 1.19 Tamworth Regional (A) - Pt B 1-04-21-04 27 27 0.00 Tamworth Regional (A) - Pt B 1-04-21-04 27 27 0.00 Tamworth Regional (A) - Pt B 1-04-21-05 71 71 0.00 Tamworth Regional (A) - Pt B 1-04-21-06 135 139 2.96 Tamworth Regional (A) - Pt B 1-04-21-07 72 69 -4.17 Tamworth Regional (A) - Pt B 1-04-21-08 309 307 -0.65 Tamworth Regional (A) - Pt B 1-04-21-09 340 344 1.18 Tamworth Regional (A) - Pt B 1-04-21-10 237 246 3.80 Tamworth Regional (A) - Pt B 1-04-22-01 202 204 0.99 Tamworth Regional (A) - Pt B 1-04-22-02 184 180 -2.17 Tamworth Regional (A) - Pt B 1-04-22-03 393 402 2.29 Tamworth Regional (A) - Pt B 1-04-22-04 105 104 -0.95 Tamworth Regional (A) - Pt B 1-04-22-05 170 170 0.00 Tamworth Regional (A) - Pt B 1-04-22-06 245 237 -3.27 Tamworth Regional (A) - Pt B 1-04-22-07 212 213 0.47

New South Wales Redistribution Statistics 2006
Enrolment Projections New England
Actual Enrolment Estimate Growth SLA Name CCD Number 2/12/2005 31/5/2010 (%)
215
Tamworth Regional (A) - Pt B 1-04-22-08 420 408 -2.86 Tamworth Regional (A) - Pt B 1-04-22-09 163 162 -0.61 Tamworth Regional (A) - Pt B 1-04-22-10 195 192 -1.54 Tamworth Regional (A) - Pt B 1-05-08-04 176 169 -3.98 Tamworth Regional (A) - Pt B 1-05-08-06 229 227 -0.87 Tamworth Regional (A) - Pt B 1-05-09-01 264 255 -3.41 Tamworth Regional (A) - Pt B 1-05-09-03 63 67 6.35 Tamworth Regional (A) - Pt B 1-05-09-04 334 342 2.40 Tamworth Regional (A) - Pt B 1-05-09-05 401 409 2.00 Tamworth Regional (A) - Pt B 1-05-09-06 173 178 2.89 Tamworth Regional (A) - Pt B 1-05-09-07 439 442 0.68 Tamworth Regional (A) - Pt B 1-05-09-09 5 5 0.00 Tamworth Regional (A) - Pt B 1-05-09-14 165 165 0.00 Tamworth Regional (A) - Pt B 1-05-09-15 163 159 -2.45 Tamworth Regional (A) - Pt B 1-05-14-01 245 244 -0.41 Tamworth Regional (A) - Pt B 1-05-14-02 79 84 6.33 Tamworth Regional (A) - Pt B 1-05-14-03 317 314 -0.95 Tamworth Regional (A) - Pt B 1-05-14-04 215 212 -1.40 Tamworth Regional (A) - Pt B 1-05-14-05 148 145 -2.03 Tamworth Regional (A) - Pt B 1-05-29-01 88 86 -2.27 Tamworth Regional (A) - Pt B 1-05-29-02 92 95 3.26 Tamworth Regional (A) - Pt B 1-05-29-03 110 113 2.73 Tamworth Regional (A) - Pt B 1-05-29-04 148 151 2.03 Tamworth Regional (A) - Pt B 1-05-29-05 106 110 3.77 Tamworth Regional (A) - Pt B 1-05-29-06 313 320 2.24 Tamworth Regional (A) - Pt B 1-05-29-07 107 107 0.00 Tamworth Regional (A) - Pt B 1-05-29-08 168 169 0.60 Tamworth Regional (A) - Pt B 44 8162 8178 0.20 Tenterfield (A) 1-05-21-03 2 2 0.00 Tenterfield (A) 1-05-22-02 43 42 -2.33 Tenterfield (A) 1-05-24-01 118 118 0.00 Tenterfield (A) 1-05-24-02 86 91 5.81 Tenterfield (A) 1-05-24-03 91 96 5.49 Tenterfield (A) 1-05-24-04 181 185 2.21 Tenterfield (A) 1-05-24-05 160 168 5.00 Tenterfield (A) 1-05-24-06 126 132 4.76 Tenterfield (A) 1-05-25-01 108 103 -4.63 Tenterfield (A) 1-05-25-02 110 115 4.55 Tenterfield (A) 1-05-25-03 143 145 1.40 Tenterfield (A) 1-05-25-04 106 112 5.66

New South Wales Redistribution Statistics 2006
Enrolment Projections New England
Actual Enrolment Estimate Growth SLA Name CCD Number 2/12/2005 31/5/2010 (%)
216
Tenterfield (A) 1-05-25-05 114 118 3.51 Tenterfield (A) 1-05-25-06 115 125 8.70 Tenterfield (A) 1-05-25-07 139 144 3.60 Tenterfield (A) 1-05-25-08 50 55 10.00 Tenterfield (A) 1-05-25-09 178 175 -1.69 Tenterfield (A) 1-05-25-10 139 150 7.91 Tenterfield (A) 1-05-25-11 89 86 -3.37 Tenterfield (A) 1-05-25-12 153 158 3.27 Tenterfield (A) 1-05-26-01 164 171 4.27 Tenterfield (A) 1-05-26-02 267 271 1.50 Tenterfield (A) 1-05-26-03 363 372 2.48 Tenterfield (A) 1-05-26-04 334 350 4.79 Tenterfield (A) 1-05-26-05 222 226 1.80 Tenterfield (A) 1-05-26-06 582 597 2.58 Tenterfield (A) 1-05-26-07 304 311 2.30 Tenterfield (A) 27 4487 4618 2.92 Uralla (A) 1-05-07-01 97 100 3.09 Uralla (A) 1-05-07-02 225 229 1.78 Uralla (A) 1-05-07-03 78 80 2.56 Uralla (A) 1-05-07-04 99 101 2.02 Uralla (A) 1-05-07-05 115 112 -2.61 Uralla (A) 1-05-07-06 149 149 0.00 Uralla (A) 1-05-07-07 210 218 3.81 Uralla (A) 1-05-07-08 353 352 -0.28 Uralla (A) 1-05-07-09 114 120 5.26 Uralla (A) 1-05-07-10 429 437 1.86 Uralla (A) 1-05-27-01 222 230 3.60 Uralla (A) 1-05-27-02 136 144 5.88 Uralla (A) 1-05-27-03 323 333 3.10 Uralla (A) 1-05-27-04 220 232 5.45 Uralla (A) 1-05-27-05 167 167 0.00 Uralla (A) 1-05-27-06 446 463 3.81 Uralla (A) 1-05-27-07 321 328 2.18 Uralla (A) 1-05-27-08 373 387 3.75 Uralla (A) 18 4077 4182 2.58 Walcha (A) 1-05-15-01 149 149 0.00 Walcha (A) 1-05-15-02 119 122 2.52 Walcha (A) 1-05-15-03 94 94 0.00

New South Wales Redistribution Statistics 2006
Enrolment Projections New England
Actual Enrolment Estimate Growth SLA Name CCD Number 2/12/2005 31/5/2010 (%)
217
Walcha (A) 1-05-16-01 133 132 -0.75 Walcha (A) 1-05-16-02 203 196 -3.45 Walcha (A) 1-05-16-03 111 118 6.31 Walcha (A) 1-05-16-04 246 255 3.66 Walcha (A) 1-05-16-05 215 214 -0.47 Walcha (A) 1-05-16-06 98 103 5.10 Walcha (A) 1-05-16-07 273 270 -1.10 Walcha (A) 1-05-16-08 219 224 2.28 Walcha (A) 1-05-16-09 375 371 -1.07 Walcha (A) 1-05-16-10 97 94 -3.09 Walcha (A) 13 2332 2342 0.43 New England 332 85394 88259 3.36

New South Wales Redistribution Statistics 2006
Enrolment Projections North Sydney
Actual Enrolment Estimate Growth SLA Name CCD Number 2/12/2005 31/5/2010 (%)
218
Hunter's Hill (A) 1-38-15-01 528 567 7.39 Hunter's Hill (A) 1-38-15-02 572 591 3.32 Hunter's Hill (A) 1-38-15-03 486 492 1.23 Hunter's Hill (A) 1-38-15-04 314 318 1.27 Hunter's Hill (A) 1-38-15-05 203 207 1.97 Hunter's Hill (A) 1-38-15-06 462 466 0.87 Hunter's Hill (A) 1-38-15-07 231 346 49.78 Hunter's Hill (A) 1-38-15-08 270 275 1.85 Hunter's Hill (A) 1-38-15-09 230 238 3.48 Hunter's Hill (A) 1-38-15-10 320 334 4.38 Hunter's Hill (A) 1-38-15-11 231 235 1.73 Hunter's Hill (A) 1-38-16-01 299 319 6.69 Hunter's Hill (A) 1-38-16-02 276 287 3.99 Hunter's Hill (A) 1-38-16-03 353 353 0.00 Hunter's Hill (A) 1-38-16-04 421 431 2.38 Hunter's Hill (A) 1-38-16-05 278 284 2.16 Hunter's Hill (A) 1-38-16-06 402 409 1.74 Hunter's Hill (A) 1-38-16-07 439 458 4.33 Hunter's Hill (A) 1-38-16-08 638 651 2.04 Hunter's Hill (A) 1-38-16-09 435 445 2.30 Hunter's Hill (A) 1-38-16-10 288 302 4.86 Hunter's Hill (A) 1-38-16-11 567 580 2.29 Hunter's Hill (A) 1-38-16-12 487 501 2.87 Hunter's Hill (A) 1-38-16-13 136 141 3.68 Hunter's Hill (A) 24 8866 9230 4.11 Lane Cove (A) 1-38-17-01 263 269 2.28 Lane Cove (A) 1-38-17-02 373 382 2.41 Lane Cove (A) 1-38-17-03 754 776 2.92 Lane Cove (A) 1-38-17-04 553 562 1.63 Lane Cove (A) 1-38-17-05 426 438 2.82 Lane Cove (A) 1-38-17-06 360 361 0.28 Lane Cove (A) 1-38-17-07 692 705 1.88 Lane Cove (A) 1-38-17-08 310 323 4.19 Lane Cove (A) 1-38-17-09 371 384 3.50 Lane Cove (A) 1-38-17-10 480 494 2.92 Lane Cove (A) 1-38-17-11 319 327 2.51 Lane Cove (A) 1-38-18-01 251 254 1.20 Lane Cove (A) 1-38-18-02 519 529 1.93 Lane Cove (A) 1-38-18-03 137 143 4.38 Lane Cove (A) 1-38-18-04 175 177 1.14

New South Wales Redistribution Statistics 2006
Enrolment Projections North Sydney
Actual Enrolment Estimate Growth SLA Name CCD Number 2/12/2005 31/5/2010 (%)
219
Lane Cove (A) 1-38-21-07 454 462 1.76
Lane Cove (A) 1-38-18-05 313 321 2.56 Lane Cove (A) 1-38-18-06 599 639 6.68 Lane Cove (A) 1-38-18-07 132 132 0.00 Lane Cove (A) 1-38-18-08 507 525 3.55 Lane Cove (A) 1-38-18-09 429 434 1.17 Lane Cove (A) 1-38-18-10 467 477 2.14 Lane Cove (A) 1-38-18-11 358 358 0.00 Lane Cove (A) 1-38-19-01 278 286 2.88 Lane Cove (A) 1-38-19-02 354 360 1.69 Lane Cove (A) 1-38-19-03 177 184 3.95 Lane Cove (A) 1-38-19-04 371 371 0.00 Lane Cove (A) 1-38-19-05 463 478 3.24 Lane Cove (A) 1-38-19-06 382 390 2.09 Lane Cove (A) 1-38-19-07 184 196 6.52 Lane Cove (A) 1-38-19-08 654 688 5.20 Lane Cove (A) 1-38-19-09 351 360 2.56 Lane Cove (A) 1-38-19-10 209 218 4.31 Lane Cove (A) 1-38-20-01 433 444 2.54 Lane Cove (A) 1-38-20-02 119 119 0.00 Lane Cove (A) 1-38-20-03 289 299 3.46 Lane Cove (A) 1-38-20-04 228 251 10.09 Lane Cove (A) 1-38-20-05 460 468 1.74 Lane Cove (A) 1-38-20-06 384 391 1.82 Lane Cove (A) 1-38-20-07 208 207 -0.48 Lane Cove (A) 1-38-20-08 157 175 11.46 Lane Cove (A) 1-38-20-09 372 370 -0.54 Lane Cove (A) 1-38-20-10 441 446 1.13 Lane Cove (A) 1-38-20-11 178 184 3.37 Lane Cove (A) 1-38-20-12 364 363 -0.27 Lane Cove (A) 1-38-20-13 168 173 2.98 Lane Cove (A) 1-38-21-01 133 136 2.26 Lane Cove (A) 1-38-21-02 432 433 0.23 Lane Cove (A) 1-38-21-03 202 204 0.99 Lane Cove (A) 1-38-21-04 205 205 0.00 Lane Cove (A) 1-38-21-05 454 461 1.54 Lane Cove (A) 1-38-21-06 145 140 -3.45
Lane Cove (A) 1-38-21-08 312 316 1.28 Lane Cove (A) 1-38-21-09 214 224 4.67 Lane Cove (A) 1-38-21-10 424 432 1.89 Lane Cove (A) 1-38-21-11 353 350 -0.85 Lane Cove (A) 1-38-21-12 252 248 -1.59

New South Wales Redistribution Statistics 2006
Enrolment Projections North Sydney
Actual Enrolment Estimate Growth SLA Name CCD Number 2/12/2005 31/5/2010 (%)
220
NSW Water areas 1 0 0 0.00
Lane Cove (A) 1-38-21-13 266 266 0.00 Lane Cove (A) 1-38-21-14 259 262 1.16 Lane Cove (A) 1-38-21-15 111 113 1.80 Lane Cove (A) 1-38-21-16 170 171 0.59 Lane Cove (A) 61 20398 20854 2.24 NSW Water areas 1-39-01-05 0 0 0.00
North Sydney (A) 1-39-01-01 478 602 25.94 North Sydney (A) 1-39-01-02 374 415 10.96 North Sydney (A) 1-39-01-03 351 352 0.28 North Sydney (A) 1-39-01-04 369 364 -1.36 North Sydney (A) 1-39-01-06 247 241 -2.43 North Sydney (A) 1-39-01-07 397 400 0.76 North Sydney (A) 1-39-01-08 496 492 -0.81 North Sydney (A) 1-39-01-09 338 338 0.00 North Sydney (A) 1-39-01-10 288 301 4.51 North Sydney (A) 1-39-01-11 183 185 1.09 North Sydney (A) 1-39-01-12 307 341 11.07 North Sydney (A) 1-39-02-01 324 318 -1.85 North Sydney (A) 1-39-02-02 578 1425 146.54 North Sydney (A) 1-39-02-03 170 237 39.41 North Sydney (A) 1-39-02-04 235 231 -1.70 North Sydney (A) 1-39-02-05 124 128 3.23 North Sydney (A) 1-39-02-06 375 411 9.60 North Sydney (A) 1-39-02-07 485 546 12.58 North Sydney (A) 1-39-02-08 417 424 1.68 North Sydney (A) 1-39-02-09 240 237 -1.25 North Sydney (A) 1-39-02-10 515 558 8.35 North Sydney (A) 1-39-02-11 269 380 41.26 North Sydney (A) 1-39-02-12 207 218 5.31 North Sydney (A) 1-39-02-13 401 395 -1.50 North Sydney (A) 1-39-02-14 329 334 1.52 North Sydney (A) 1-39-03-01 228 229 0.44 North Sydney (A) 1-39-03-02 244 243 -0.41 North Sydney (A) 1-39-03-03 488 524 7.38 North Sydney (A) 1-39-03-04 340 339 -0.29 North Sydney (A) 1-39-03-05 430 426 -0.93 North Sydney (A) 1-39-03-06 238 260 9.24

New South Wales Redistribution Statistics 2006
Enrolment Projections North Sydney
Actual Enrolment Estimate Growth SLA Name CCD Number 2/12/2005 31/5/2010 (%)
221
North Sydney (A) 1-39-03-07 333 329 -1.20 North Sydney (A) 1-39-03-08 326 327 0.31 North Sydney (A) 1-39-03-09 499 510 2.20 North Sydney (A) 1-39-03-10 248 240 -3.23 North Sydney (A) 1-39-03-11 318 314 -1.26 North Sydney (A) 1-39-03-12 483 488 1.04 North Sydney (A) 1-39-03-13 258 257 -0.39 North Sydney (A) 1-39-04-01 295 291 -1.36 North Sydney (A) 1-39-04-02 308 301 -2.27 North Sydney (A) 1-39-04-03 222 222 0.00 North Sydney (A) 1-39-04-04 125 123 -1.60 North Sydney (A) 1-39-04-05 428 417 -2.57 North Sydney (A) 1-39-04-06 198 196 -1.01 North Sydney (A) 1-39-04-07 357 352 -1.40 North Sydney (A) 1-39-04-08 116 116 0.00 North Sydney (A) 1-39-04-09 359 362 0.84 North Sydney (A) 1-39-04-10 284 280 -1.41 North Sydney (A) 1-39-04-11 389 451 15.94 North Sydney (A) 1-39-04-12 105 108 2.86 North Sydney (A) 1-39-04-13 240 240 0.00 North Sydney (A) 1-39-05-01 265 257 -3.02 North Sydney (A) 1-39-05-02 130 135 3.85 North Sydney (A) 1-39-05-03 233 229 -1.72 North Sydney (A) 1-39-05-04 93 93 0.00 North Sydney (A) 1-39-05-05 119 121 1.68 North Sydney (A) 1-39-05-06 196 198 1.02 North Sydney (A) 1-39-05-07 380 398 4.74 North Sydney (A) 1-39-05-08 634 667 5.21 North Sydney (A) 1-39-05-09 266 269 1.13 North Sydney (A) 1-39-05-10 187 185 -1.07 North Sydney (A) 1-39-06-01 331 335 1.21 North Sydney (A) 1-39-06-02 149 152 2.01 North Sydney (A) 1-39-06-03 305 302 -0.98 North Sydney (A) 1-39-06-04 128 134 4.69 North Sydney (A) 1-39-06-05 236 250 5.93 North Sydney (A) 1-39-06-06 132 130 -1.52 North Sydney (A) 1-39-06-07 260 264 1.54 North Sydney (A) 1-39-06-08 260 265 1.92 North Sydney (A) 1-39-06-09 156 154 -1.28 North Sydney (A) 1-39-06-10 251 248 -1.20 North Sydney (A) 1-39-06-11 167 173 3.59 North Sydney (A) 1-39-06-12 238 232 -2.52

New South Wales Redistribution Statistics 2006
Enrolment Projections North Sydney
Actual Enrolment Estimate Growth SLA Name CCD Number 2/12/2005 31/5/2010 (%)
222
North Sydney (A) 1-39-07-01 224 227 1.34 North Sydney (A) 1-39-07-02 332 330 -0.60 North Sydney (A) 1-39-07-03 170 189 11.18 North Sydney (A) 1-39-07-04 268 275 2.61 North Sydney (A) 1-39-07-05 339 336 -0.88 North Sydney (A) 1-39-07-06 373 452 21.18 North Sydney (A) 1-39-07-07 298 292 -2.01 North Sydney (A) 1-39-07-08 160 171 6.88 North Sydney (A) 1-39-07-09 257 294 14.40 North Sydney (A) 1-39-07-10 122 122 0.00 North Sydney (A) 1-39-07-11 280 288 2.86 North Sydney (A) 1-39-07-12 83 93 12.05 North Sydney (A) 1-39-07-13 387 385 -0.52 North Sydney (A) 1-39-08-01 242 236 -2.48 North Sydney (A) 1-39-08-02 267 275 3.00 North Sydney (A) 1-39-08-03 239 236 -1.26 North Sydney (A) 1-39-08-04 182 179 -1.65 North Sydney (A) 1-39-08-05 203 199 -1.97 North Sydney (A) 1-39-08-06 222 223 0.45 North Sydney (A) 1-39-08-07 346 341 -1.45 North Sydney (A) 1-39-08-08 248 252 1.61 North Sydney (A) 1-39-08-09 172 179 4.07 North Sydney (A) 1-39-08-10 109 111 1.83 North Sydney (A) 1-39-08-11 202 197 -2.48 North Sydney (A) 1-39-08-12 246 245 -0.41 North Sydney (A) 1-39-08-13 208 200 -3.85 North Sydney (A) 1-39-08-14 159 153 -3.77 North Sydney (A) 1-39-09-01 310 313 0.97 North Sydney (A) 1-39-09-02 232 243 4.74 North Sydney (A) 1-39-09-03 181 170 -6.08 North Sydney (A) 1-39-09-04 271 276 1.85 North Sydney (A) 1-39-09-05 162 167 3.09 North Sydney (A) 1-39-09-06 283 286 1.06 North Sydney (A) 1-39-09-07 308 304 -1.30 North Sydney (A) 1-39-09-08 142 144 1.41 North Sydney (A) 1-39-09-09 265 260 -1.89 North Sydney (A) 1-39-09-10 214 216 0.93 North Sydney (A) 1-39-09-11 233 226 -3.00 North Sydney (A) 1-39-09-12 293 285 -2.73 North Sydney (A) 1-39-09-13 356 350 -1.69 North Sydney (A) 1-39-09-14 149 143 -4.03 North Sydney (A) 1-39-10-01 290 288 -0.69
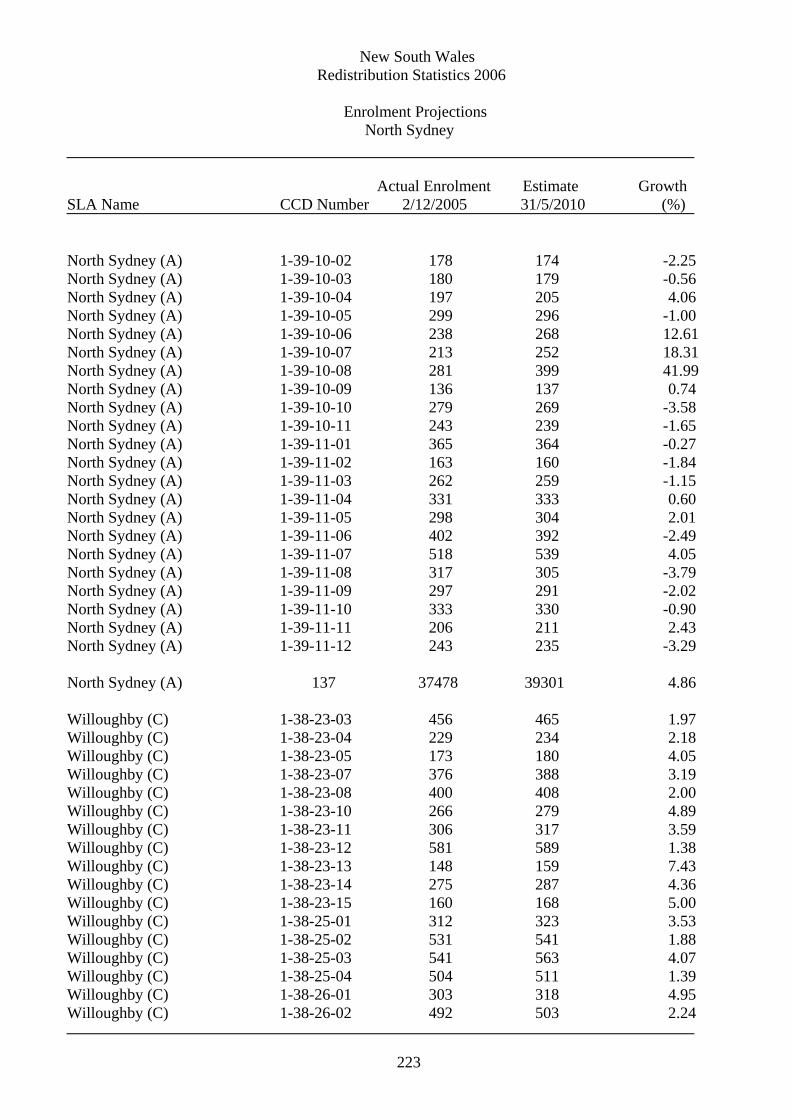
New South Wales Redistribution Statistics 2006
Enrolment Projections North Sydney
Actual Enrolment Estimate Growth SLA Name CCD Number 2/12/2005 31/5/2010 (%)
223
North Sydney (A) 1-39-10-02 178 174 -2.25 North Sydney (A) 1-39-10-03 180 179 -0.56 North Sydney (A) 1-39-10-04 197 205 4.06 North Sydney (A) 1-39-10-05 299 296 -1.00 North Sydney (A) 1-39-10-06 238 268 12.61 North Sydney (A) 1-39-10-07 213 252 18.31 North Sydney (A) 1-39-10-08 281 399 41.99 North Sydney (A) 1-39-10-09 136 137 0.74 North Sydney (A) 1-39-10-10 279 269 -3.58 North Sydney (A) 1-39-10-11 243 239 -1.65 North Sydney (A) 1-39-11-01 365 364 -0.27 North Sydney (A) 1-39-11-02 163 160 -1.84 North Sydney (A) 1-39-11-03 262 259 -1.15 North Sydney (A) 1-39-11-04 331 333 0.60 North Sydney (A) 1-39-11-05 298 304 2.01 North Sydney (A) 1-39-11-06 402 392 -2.49 North Sydney (A) 1-39-11-07 518 539 4.05 North Sydney (A) 1-39-11-08 317 305 -3.79 North Sydney (A) 1-39-11-09 297 291 -2.02 North Sydney (A) 1-39-11-10 333 330 -0.90 North Sydney (A) 1-39-11-11 206 211 2.43 North Sydney (A) 1-39-11-12 243 235 -3.29 North Sydney (A) 137 37478 39301 4.86 Willoughby (C) 1-38-23-03 456 465 1.97 Willoughby (C) 1-38-23-04 229 234 2.18 Willoughby (C) 1-38-23-05 173 180 4.05 Willoughby (C) 1-38-23-07 376 388 3.19 Willoughby (C) 1-38-23-08 400 408 2.00 Willoughby (C) 1-38-23-10 266 279 4.89 Willoughby (C) 1-38-23-11 306 317 3.59 Willoughby (C) 1-38-23-12 581 589 1.38 Willoughby (C) 1-38-23-13 148 159 7.43 Willoughby (C) 1-38-23-14 275 287 4.36 Willoughby (C) 1-38-23-15 160 168 5.00 Willoughby (C) 1-38-25-01 312 323 3.53 Willoughby (C) 1-38-25-02 531 541 1.88 Willoughby (C) 1-38-25-03 541 563 4.07 Willoughby (C) 1-38-25-04 504 511 1.39 Willoughby (C) 1-38-26-01 303 318 4.95 Willoughby (C) 1-38-26-02 492 503 2.24

New South Wales Redistribution Statistics 2006
Enrolment Projections North Sydney
Actual Enrolment Estimate Growth SLA Name CCD Number 2/12/2005 31/5/2010 (%)
224
Willoughby (C) 1-38-26-03 628 656 4.46 Willoughby (C) 1-38-26-04 282 285 1.06 Willoughby (C) 1-38-26-05 431 450 4.41 Willoughby (C) 1-38-26-06 287 292 1.74 Willoughby (C) 1-38-26-07 247 257 4.05 Willoughby (C) 1-38-26-08 314 327 4.14 Willoughby (C) 1-38-26-09 330 339 2.73 Willoughby (C) 1-38-26-10 268 297 10.82 Willoughby (C) 1-38-27-05 317 327 3.15 Willoughby (C) 1-38-27-06 541 564 4.25 Willoughby (C) 1-38-27-07 590 606 2.71 Willoughby (C) 1-38-27-08 616 630 2.27 Willoughby (C) 1-38-27-09 349 349 0.00 Willoughby (C) 1-38-27-10 292 298 2.05 Willoughby (C) 1-38-27-11 336 344 2.38 Willoughby (C) 1-38-28-01 411 431 4.87 Willoughby (C) 1-38-28-02 466 485 4.08 Willoughby (C) 1-38-28-03 548 562 2.55 Willoughby (C) 1-38-28-04 440 453 2.95 Willoughby (C) 1-38-28-05 465 473 1.72 Willoughby (C) 1-38-28-06 553 568 2.71 Willoughby (C) 1-38-28-07 382 405 6.02 Willoughby (C) 1-38-28-08 793 814 2.65 Willoughby (C) 1-38-28-09 551 569 3.27 Willoughby (C) 1-38-28-10 231 237 2.60 Willoughby (C) 1-38-28-11 327 345 5.50 Willoughby (C) 1-38-28-12 322 334 3.73 Willoughby (C) 1-38-28-13 430 439 2.09 Willoughby (C) 1-38-28-14 0 0 0.00 Willoughby (C) 1-38-29-01 379 384 1.32 Willoughby (C) 1-38-29-02 309 320 3.56 Willoughby (C) 1-38-29-03 311 317 1.93 Willoughby (C) 1-38-29-04 457 476 4.16 Willoughby (C) 1-38-29-05 236 294 24.58 Willoughby (C) 1-38-29-06 404 419 3.71 Willoughby (C) 1-38-29-07 473 493 4.23 Willoughby (C) 1-38-29-08 340 345 1.47 Willoughby (C) 1-38-29-09 333 338 1.50 Willoughby (C) 1-38-29-10 674 704 4.45 Willoughby (C) 56 21716 22459 3.42

New South Wales Redistribution Statistics 2006
Enrolment Projections North Sydney
Actual Enrolment Estimate Growth SLA Name CCD Number 2/12/2005 31/5/2010 (%)
225
North Sydney 279 88458 91844 3.83

New South Wales Redistribution Statistics 2006
Enrolment Projections Page
Actual Enrolment Estimate Growth SLA Name CCD Number 2/12/2005 31/5/2010 (%)
226
Ballina (A) 1-07-12-03 18 21 16.67 Ballina (A) 1-07-13-01 343 348 1.46 Ballina (A) 1-07-13-02 523 534 2.10 Ballina (A) 1-07-13-03 184 198 7.61 Ballina (A) 1-07-13-04 410 405 -1.22 Ballina (A) 1-07-13-05 303 308 1.65 Ballina (A) 1-07-13-06 556 577 3.78 Ballina (A) 1-07-13-07 572 562 -1.75 Ballina (A) 1-07-13-08 356 358 0.56 Ballina (A) 1-07-13-09 299 316 5.69 Ballina (A) 1-07-13-10 196 302 54.08 Ballina (A) 1-07-13-11 400 395 -1.25 Ballina (A) 1-07-13-12 380 375 -1.32 Ballina (A) 1-07-13-13 279 287 2.87 Ballina (A) 1-07-13-14 346 351 1.45 Ballina (A) 1-07-13-15 415 413 -0.48 Ballina (A) 1-07-13-16 428 437 2.10 Ballina (A) 1-07-14-01 832 938 12.74 Ballina (A) 1-07-14-02 238 246 3.36 Ballina (A) 1-07-14-03 354 390 10.17 Ballina (A) 1-07-14-04 352 390 10.80 Ballina (A) 1-07-14-05 424 444 4.72 Ballina (A) 1-07-14-06 241 255 5.81 Ballina (A) 1-07-14-07 173 181 4.62 Ballina (A) 1-07-14-08 442 455 2.94 Ballina (A) 1-07-14-09 307 329 7.17 Ballina (A) 1-07-14-10 566 569 0.53 Ballina (A) 1-07-14-11 585 642 9.74 Ballina (A) 1-07-14-12 563 580 3.02 Ballina (A) 1-07-14-13 337 354 5.04 Ballina (A) 1-07-14-14 262 279 6.49 Ballina (A) 1-07-14-15 320 322 0.62 Ballina (A) 1-07-15-01 60 61 1.67 Ballina (A) 1-07-15-08 417 426 2.16 Ballina (A) 1-07-15-09 444 484 9.01 Ballina (A) 1-07-15-10 384 398 3.65 Ballina (A) 1-07-15-11 386 443 14.77 Ballina (A) 1-07-15-12 252 254 0.79 Ballina (A) 1-07-15-15 260 259 -0.38 Ballina (A) 39 14207 14886 4.78

New South Wales Redistribution Statistics 2006
Enrolment Projections Page
Actual Enrolment Estimate Growth SLA Name CCD Number 2/12/2005 31/5/2010 (%)
227
Clarence Valley (A) - 1-06-04-02 110 110 0.00 Copmanhurst Clarence Valley (A) - 1-06-04-03 489 511 4.50 Copmanhurst Clarence Valley (A) - 1-06-04-04 122 117 -4.10 Copmanhurst Clarence Valley (A) - 1-06-04-05 115 119 3.48 Copmanhurst Clarence Valley (A) - 1-06-04-06 110 112 1.82 Copmanhurst Clarence Valley (A) - 1-06-04-07 204 227 11.27 Copmanhurst Clarence Valley (A) - 1-06-04-08 357 386 8.12 Copmanhurst Clarence Valley (A) - 1-06-04-09 270 306 13.33 Copmanhurst Clarence Valley (A) - 1-06-04-10 416 496 19.23 Copmanhurst Clarence Valley (A) - 1-06-04-11 165 177 7.27 Copmanhurst Clarence Valley (A) - 1-06-04-12 143 165 15.38 Copmanhurst Clarence Valley (A) - 1-06-04-13 291 294 1.03 Copmanhurst Clarence Valley (A) - 12 2792 3020 8.17 Copmanhurst Clarence Valley (A) - Grafton 1-06-06-01 346 374 8.09 Clarence Valley (A) - Grafton 1-06-06-02 613 625 1.96 Clarence Valley (A) - Grafton 1-06-06-03 439 437 -0.46 Clarence Valley (A) - Grafton 1-06-06-04 310 324 4.52 Clarence Valley (A) - Grafton 1-06-06-05 386 392 1.55 Clarence Valley (A) - Grafton 1-06-06-06 399 415 4.01 Clarence Valley (A) - Grafton 1-06-06-07 284 274 -3.52 Clarence Valley (A) - Grafton 1-06-06-08 350 359 2.57 Clarence Valley (A) - Grafton 1-06-06-09 347 349 0.58 Clarence Valley (A) - Grafton 1-06-06-10 314 307 -2.23 Clarence Valley (A) - Grafton 1-06-07-01 463 466 0.65 Clarence Valley (A) - Grafton 1-06-07-02 259 263 1.54 Clarence Valley (A) - Grafton 1-06-07-03 339 357 5.31 Clarence Valley (A) - Grafton 1-06-07-04 371 379 2.16

New South Wales Redistribution Statistics 2006
Enrolment Projections Page
Actual Enrolment Estimate Growth SLA Name CCD Number 2/12/2005 31/5/2010 (%)
228
Clarence Valley (A) - Maclean 1-06-10-09 385 403 4.68
Clarence Valley (A) - Grafton 1-06-07-05 291 292 0.34 Clarence Valley (A) - Grafton 1-06-07-06 351 393 11.97 Clarence Valley (A) - Grafton 1-06-07-07 256 250 -2.34 Clarence Valley (A) - Grafton 1-06-07-08 213 213 0.00 Clarence Valley (A) - Grafton 1-06-07-09 449 464 3.34 Clarence Valley (A) - Grafton 1-06-07-10 561 576 2.67 Clarence Valley (A) - Grafton 1-06-07-11 300 301 0.33 Clarence Valley (A) - Grafton 1-06-07-12 419 515 22.91 Clarence Valley (A) - Grafton 1-06-07-13 323 335 3.72 Clarence Valley (A) - Grafton 1-06-22-01 340 344 1.18 Clarence Valley (A) - Grafton 1-06-22-02 503 542 7.75 Clarence Valley (A) - Grafton 1-06-22-03 337 334 -0.89 Clarence Valley (A) - Grafton 1-06-22-04 452 459 1.55 Clarence Valley (A) - Grafton 1-06-22-05 280 288 2.86 Clarence Valley (A) - Grafton 1-06-22-06 446 451 1.12 Clarence Valley (A) - Grafton 1-06-22-07 315 312 -0.95 Clarence Valley (A) - Grafton 1-06-22-08 318 321 0.94 Clarence Valley (A) - Grafton 31 11374 11711 2.96 Clarence Valley (A) - Maclean 1-06-09-02 241 251 4.15 Clarence Valley (A) - Maclean 1-06-09-08 79 83 5.06 Clarence Valley (A) - Maclean 1-06-10-01 194 202 4.12 Clarence Valley (A) - Maclean 1-06-10-02 265 295 11.32 Clarence Valley (A) - Maclean 1-06-10-03 462 507 9.74 Clarence Valley (A) - Maclean 1-06-10-04 254 269 5.91 Clarence Valley (A) - Maclean 1-06-10-05 133 135 1.50 Clarence Valley (A) - Maclean 1-06-10-06 527 577 9.49 Clarence Valley (A) - Maclean 1-06-10-07 256 264 3.12 Clarence Valley (A) - Maclean 1-06-10-08 440 491 11.59
Clarence Valley (A) - Maclean 1-06-10-10 263 278 5.70 Clarence Valley (A) - Maclean 1-06-10-11 387 411 6.20 Clarence Valley (A) - Maclean 1-06-10-12 120 126 5.00 Clarence Valley (A) - Maclean 1-06-12-10 21 20 -4.76 Clarence Valley (A) - Maclean 1-06-12-11 3 2 -33.33 Clarence Valley (A) - Maclean 16 4030 4314 7.05 Clarence Valley (A) - Nymboida 1-06-05-01 328 338 3.05 Clarence Valley (A) - Nymboida 1-06-05-02 66 66 0.00 Clarence Valley (A) - Nymboida 1-06-05-03 305 321 5.25

New South Wales Redistribution Statistics 2006
Enrolment Projections Page
Actual Enrolment Estimate Growth SLA Name CCD Number 2/12/2005 31/5/2010 (%)
229
Clarence Valley (A) - Nymboida 1-06-05-04 158 162 2.53 Clarence Valley (A) - Nymboida 1-06-05-05 206 205 -0.49 Clarence Valley (A) - Nymboida 1-06-05-06 199 209 5.03 Clarence Valley (A) - Nymboida 1-06-05-07 345 382 10.72 Clarence Valley (A) - Nymboida 1-06-05-08 130 149 14.62 Clarence Valley (A) - Nymboida 1-06-05-09 90 94 4.44 Clarence Valley (A) - Nymboida 1-06-05-10 513 544 6.04 Clarence Valley (A) - Nymboida 1-06-05-11 68 70 2.94 Clarence Valley (A) - Nymboida 1-06-05-12 531 558 5.08 Clarence Valley (A) - Nymboida 12 2939 3098 5.41 Kyogle (A) 1-06-01-01 220 221 0.45 Kyogle (A) 1-06-01-02 156 158 1.28 Kyogle (A) 1-06-01-03 194 199 2.58 Kyogle (A) 1-06-01-04 118 119 0.85 Kyogle (A) 1-06-01-05 115 121 5.22 Kyogle (A) 1-06-01-06 282 304 7.80 Kyogle (A) 1-06-01-07 291 293 0.69 Kyogle (A) 1-06-01-08 65 63 -3.08 Kyogle (A) 1-06-02-01 339 362 6.78 Kyogle (A) 1-06-02-02 239 244 2.09 Kyogle (A) 1-06-02-03 269 271 0.74 Kyogle (A) 1-06-02-04 458 467 1.97 Kyogle (A) 1-06-02-05 411 437 6.33 Kyogle (A) 1-06-02-06 413 418 1.21 Kyogle (A) 1-06-02-07 257 261 1.56 Kyogle (A) 1-06-02-08 404 413 2.23 Kyogle (A) 1-06-02-09 505 523 3.56 Kyogle (A) 1-06-03-01 332 343 3.31 Kyogle (A) 1-06-03-02 108 114 5.56 Kyogle (A) 1-06-03-03 187 191 2.14 Kyogle (A) 1-06-03-04 87 84 -3.45 Kyogle (A) 1-06-03-05 219 224 2.28 Kyogle (A) 1-06-03-06 175 181 3.43 Kyogle (A) 1-06-03-07 121 125 3.31 Kyogle (A) 1-06-03-08 86 84 -2.33 Kyogle (A) 1-06-03-09 195 202 3.59 Kyogle (A) 26 6246 6422 2.82 Lismore (C) - Pt A 1-06-16-02 489 543 11.04

New South Wales Redistribution Statistics 2006
Enrolment Projections Page
Actual Enrolment Estimate Growth SLA Name CCD Number 2/12/2005 31/5/2010 (%)
230
Lismore (C) - Pt A 1-06-16-03 478 499 4.39 Lismore (C) - Pt A 1-06-16-04 177 184 3.95 Lismore (C) - Pt A 1-06-16-08 399 425 6.52 Lismore (C) - Pt A 1-06-16-10 363 391 7.71 Lismore (C) - Pt A 1-06-19-01 222 231 4.05 Lismore (C) - Pt A 1-06-19-02 433 445 2.77 Lismore (C) - Pt A 1-06-19-03 479 490 2.30 Lismore (C) - Pt A 1-06-19-04 427 424 -0.70 Lismore (C) - Pt A 1-06-19-05 295 304 3.05 Lismore (C) - Pt A 1-06-19-06 378 379 0.26 Lismore (C) - Pt A 1-06-19-07 304 306 0.66 Lismore (C) - Pt A 1-06-19-08 417 424 1.68 Lismore (C) - Pt A 1-06-19-09 170 169 -0.59 Lismore (C) - Pt A 1-06-19-10 367 381 3.81 Lismore (C) - Pt A 1-06-19-11 227 232 2.20 Lismore (C) - Pt A 1-06-19-12 277 281 1.44 Lismore (C) - Pt A 1-06-19-13 457 483 5.69 Lismore (C) - Pt A 1-06-20-01 308 318 3.25 Lismore (C) - Pt A 1-06-20-02 387 422 9.04 Lismore (C) - Pt A 1-06-20-03 193 201 4.15 Lismore (C) - Pt A 1-06-20-04 324 344 6.17 Lismore (C) - Pt A 1-06-20-05 442 453 2.49 Lismore (C) - Pt A 1-06-20-06 325 334 2.77 Lismore (C) - Pt A 1-06-20-07 414 432 4.35 Lismore (C) - Pt A 1-06-20-08 474 490 3.38 Lismore (C) - Pt A 1-06-20-09 325 348 7.08 Lismore (C) - Pt A 1-06-20-10 264 277 4.92 Lismore (C) - Pt A 1-06-21-01 95 93 -2.11 Lismore (C) - Pt A 1-06-21-02 429 433 0.93 Lismore (C) - Pt A 1-06-21-03 412 413 0.24 Lismore (C) - Pt A 1-06-21-04 350 354 1.14 Lismore (C) - Pt A 1-06-21-05 342 360 5.26 Lismore (C) - Pt A 1-06-21-06 327 361 10.40 Lismore (C) - Pt A 1-06-21-07 342 349 2.05 Lismore (C) - Pt A 1-06-21-08 660 708 7.27 Lismore (C) - Pt A 1-06-21-09 323 337 4.33 Lismore (C) - Pt A 1-06-21-10 305 314 2.95 Lismore (C) - Pt A 1-06-23-01 294 296 0.68 Lismore (C) - Pt A 1-06-23-02 390 384 -1.54 Lismore (C) - Pt A 1-06-23-03 463 508 9.72 Lismore (C) - Pt A 1-06-23-04 447 455 1.79 Lismore (C) - Pt A 1-06-23-05 293 298 1.71

New South Wales Redistribution Statistics 2006
Enrolment Projections Page
Actual Enrolment Estimate Growth SLA Name CCD Number 2/12/2005 31/5/2010 (%)
231
Lismore (C) - Pt A 1-06-23-06 251 254 1.20 Lismore (C) - Pt A 1-06-23-07 300 299 -0.33 Lismore (C) - Pt A 1-06-23-08 305 313 2.62 Lismore (C) - Pt A 1-06-23-09 267 282 5.62 Lismore (C) - Pt A 1-06-23-10 297 315 6.06 Lismore (C) - Pt A 1-06-24-01 573 686 19.72 Lismore (C) - Pt A 1-06-24-02 463 573 23.76 Lismore (C) - Pt A 1-06-24-03 669 717 7.17 Lismore (C) - Pt A 1-06-24-04 347 372 7.20 Lismore (C) - Pt A 1-06-24-05 285 293 2.81 Lismore (C) - Pt A 1-06-24-06 453 489 7.95 Lismore (C) - Pt A 1-06-24-07 221 250 13.12 Lismore (C) - Pt A 1-06-24-08 435 455 4.60 Lismore (C) - Pt A 56 20153 21171 5.05 Lismore (C) - Pt B 1-06-16-01 305 335 9.84 Lismore (C) - Pt B 1-06-16-05 277 289 4.33 Lismore (C) - Pt B 1-06-16-06 237 246 3.80 Lismore (C) - Pt B 1-06-16-07 81 81 0.00 Lismore (C) - Pt B 1-06-16-09 423 456 7.80 Lismore (C) - Pt B 1-06-16-11 346 367 6.07 Lismore (C) - Pt B 1-06-16-12 258 259 0.39 Lismore (C) - Pt B 1-06-17-01 294 311 5.78 Lismore (C) - Pt B 1-06-17-02 201 204 1.49 Lismore (C) - Pt B 1-06-17-03 188 197 4.79 Lismore (C) - Pt B 1-06-17-04 256 259 1.17 Lismore (C) - Pt B 1-06-17-05 324 333 2.78 Lismore (C) - Pt B 1-06-17-06 335 352 5.07 Lismore (C) - Pt B 1-06-17-07 604 621 2.81 Lismore (C) - Pt B 1-06-17-08 318 320 0.63 Lismore (C) - Pt B 1-06-17-09 148 150 1.35 Lismore (C) - Pt B 1-06-17-10 279 289 3.58 Lismore (C) - Pt B 1-06-18-01 317 324 2.21 Lismore (C) - Pt B 1-06-18-02 180 183 1.67 Lismore (C) - Pt B 1-06-18-03 288 295 2.43 Lismore (C) - Pt B 1-06-18-04 369 382 3.52 Lismore (C) - Pt B 1-06-18-05 227 246 8.37 Lismore (C) - Pt B 1-06-18-06 312 322 3.21 Lismore (C) - Pt B 1-06-18-07 227 238 4.85 Lismore (C) - Pt B 1-06-18-08 254 267 5.12 Lismore (C) - Pt B 1-06-18-09 318 338 6.29

New South Wales Redistribution Statistics 2006
Enrolment Projections Page
Actual Enrolment Estimate Growth SLA Name CCD Number 2/12/2005 31/5/2010 (%)
232
Lismore (C) - Pt B 1-06-18-10 325 348 7.08 Lismore (C) - Pt B 1-06-18-11 234 240 2.56 Lismore (C) - Pt B 1-06-18-12 269 288 7.06 Lismore (C) - Pt B 29 8194 8540 4.22 Richmond Valley (A) - Casino 1-06-14-01 152 149 -1.97 Richmond Valley (A) - Casino 1-06-14-02 186 190 2.15 Richmond Valley (A) - Casino 1-06-14-03 308 344 11.69 Richmond Valley (A) - Casino 1-06-14-04 399 405 1.50 Richmond Valley (A) - Casino 1-06-14-05 510 515 0.98 Richmond Valley (A) - Casino 1-06-14-06 360 361 0.28 Richmond Valley (A) - Casino 1-06-14-07 283 282 -0.35 Richmond Valley (A) - Casino 1-06-14-08 330 332 0.61 Richmond Valley (A) - Casino 1-06-14-09 276 275 -0.36 Richmond Valley (A) - Casino 1-06-14-10 315 306 -2.86 Richmond Valley (A) - Casino 1-06-14-11 270 262 -2.96 Richmond Valley (A) - Casino 1-06-15-01 211 218 3.32 Richmond Valley (A) - Casino 1-06-15-02 412 424 2.91 Richmond Valley (A) - Casino 1-06-15-03 276 268 -2.90 Richmond Valley (A) - Casino 1-06-15-04 103 103 0.00 Richmond Valley (A) - Casino 1-06-15-05 486 478 -1.65 Richmond Valley (A) - Casino 1-06-15-06 360 361 0.28 Richmond Valley (A) - Casino 1-06-15-07 309 301 -2.59 Richmond Valley (A) - Casino 1-06-15-08 245 242 -1.22 Richmond Valley (A) - Casino 1-06-15-09 191 190 -0.52 Richmond Valley (A) - Casino 1-06-15-10 264 265 0.38 Richmond Valley (A) - Casino 1-06-15-11 428 437 2.10 Richmond Valley (A) - Casino 1-06-15-12 310 308 -0.65 Richmond Valley (A) - Casino 23 6984 7016 0.46 Richmond Valley (A) Bal 1-06-04-01 97 109 12.37 Richmond Valley (A) Bal 1-06-04-06 0 0 0.00 Richmond Valley (A) Bal 1-06-12-01 307 322 4.89 Richmond Valley (A) Bal 1-06-12-02 414 426 2.90 Richmond Valley (A) Bal 1-06-12-03 350 371 6.00 Richmond Valley (A) Bal 1-06-12-04 338 357 5.62 Richmond Valley (A) Bal 1-06-12-05 561 597 6.42 Richmond Valley (A) Bal 1-06-12-06 256 273 6.64 Richmond Valley (A) Bal 1-06-12-07 336 343 2.08 Richmond Valley (A) Bal 1-06-12-08 349 370 6.02

New South Wales Redistribution Statistics 2006
Enrolment Projections Page
Actual Enrolment Estimate Growth SLA Name CCD Number 2/12/2005 31/5/2010 (%)
233
Richmond Valley (A) Bal 1-06-12-09 156 160 2.56 Richmond Valley (A) Bal 1-06-12-10 73 70 -4.11 Richmond Valley (A) Bal 1-06-12-11 203 197 -2.96 Richmond Valley (A) Bal 1-06-12-12 256 271 5.86 Richmond Valley (A) Bal 1-06-13-01 165 153 -7.27 Richmond Valley (A) Bal 1-06-13-02 358 387 8.10 Richmond Valley (A) Bal 1-06-13-03 409 423 3.42 Richmond Valley (A) Bal 1-06-13-04 451 457 1.33 Richmond Valley (A) Bal 1-06-13-05 413 449 8.72 Richmond Valley (A) Bal 1-06-13-06 405 421 3.95 Richmond Valley (A) Bal 1-06-13-07 80 81 1.25 Richmond Valley (A) Bal 1-06-13-08 56 57 1.79 Richmond Valley (A) Bal 1-06-13-09 434 431 -0.69 Richmond Valley (A) Bal 1-06-13-10 343 364 6.12 Richmond Valley (A) Bal 1-06-13-11 342 349 2.05 Richmond Valley (A) Bal 25 7152 7438 4.00 Page 269 84071 87616 4.22

New South Wales Redistribution Statistics 2006
Enrolment Projections Parkes
Actual Enrolment Estimate Growth SLA Name CCD Number 2/12/2005 31/5/2010 (%)
234
Bland (A) 1-15-01-01 67 69 2.99 Bland (A) 1-15-01-02 108 112 3.70 Bland (A) 1-15-01-03 74 70 -5.41 Bland (A) 1-15-01-04 251 240 -4.38 Bland (A) 1-15-01-05 127 129 1.57 Bland (A) 1-15-01-06 111 106 -4.50 Bland (A) 1-15-01-07 80 79 -1.25 Bland (A) 1-15-01-08 119 124 4.20 Bland (A) 1-15-01-09 75 76 1.33 Bland (A) 1-15-02-01 100 99 -1.00 Bland (A) 1-15-02-02 171 170 -0.58 Bland (A) 1-15-02-03 136 131 -3.68 Bland (A) 1-15-02-04 127 122 -3.94 Bland (A) 1-15-02-05 159 160 0.63 Bland (A) 1-15-02-06 96 95 -1.04 Bland (A) 1-15-03-01 78 76 -2.56 Bland (A) 1-15-03-02 88 94 6.82 Bland (A) 1-15-03-03 71 73 2.82 Bland (A) 1-15-03-04 360 384 6.67 Bland (A) 1-15-03-05 275 284 3.27 Bland (A) 1-15-03-06 355 372 4.79 Bland (A) 1-15-03-07 267 272 1.87 Bland (A) 1-15-03-08 321 338 5.30 Bland (A) 1-15-03-09 435 439 0.92 Bland (A) 1-15-03-10 234 224 -4.27 Bland (A) 25 4285 4338 1.24 Bogan (A) 1-03-01-01 95 91 -4.21 Bogan (A) 1-03-01-02 449 459 2.23 Bogan (A) 1-03-01-03 159 158 -0.63 Bogan (A) 1-03-01-04 104 105 0.96 Bogan (A) 1-03-01-05 87 92 5.75 Bogan (A) 1-03-01-06 98 98 0.00 Bogan (A) 1-03-01-07 65 68 4.62 Bogan (A) 1-03-01-08 210 215 2.38 Bogan (A) 1-03-01-09 242 248 2.48 Bogan (A) 1-03-01-10 437 442 1.14 Bogan (A) 10 1946 1976 1.54 Broken Hill (C) 1-02-03-01 111 110 -0.90

New South Wales Redistribution Statistics 2006
Enrolment Projections Parkes
Actual Enrolment Estimate Growth SLA Name CCD Number 2/12/2005 31/5/2010 (%)
235
Broken Hill (C) 1-02-03-02 275 268 -2.55 Broken Hill (C) 1-02-03-03 404 396 -1.98 Broken Hill (C) 1-02-03-04 412 407 -1.21 Broken Hill (C) 1-02-03-05 383 376 -1.83 Broken Hill (C) 1-02-03-06 389 381 -2.06 Broken Hill (C) 1-02-03-07 400 383 -4.25 Broken Hill (C) 1-02-03-08 300 288 -4.00 Broken Hill (C) 1-02-03-09 221 211 -4.52 Broken Hill (C) 1-02-03-10 256 258 0.78 Broken Hill (C) 1-02-03-11 397 399 0.50 Broken Hill (C) 1-02-03-12 267 256 -4.12 Broken Hill (C) 1-02-04-01 197 195 -1.02 Broken Hill (C) 1-02-04-02 417 404 -3.12 Broken Hill (C) 1-02-04-03 404 397 -1.73 Broken Hill (C) 1-02-04-04 346 346 0.00 Broken Hill (C) 1-02-04-05 359 349 -2.79 Broken Hill (C) 1-02-04-06 375 371 -1.07 Broken Hill (C) 1-02-04-07 267 260 -2.62 Broken Hill (C) 1-02-04-08 299 297 -0.67 Broken Hill (C) 1-02-04-09 48 47 -2.08 Broken Hill (C) 1-02-04-10 164 167 1.83 Broken Hill (C) 1-02-04-11 172 175 1.74 Broken Hill (C) 1-02-05-01 182 177 -2.75 Broken Hill (C) 1-02-05-02 245 243 -0.82 Broken Hill (C) 1-02-05-03 290 287 -1.03 Broken Hill (C) 1-02-05-04 231 225 -2.60 Broken Hill (C) 1-02-05-05 198 194 -2.02 Broken Hill (C) 1-02-05-06 192 196 2.08 Broken Hill (C) 1-02-05-07 296 290 -2.03 Broken Hill (C) 1-02-05-08 409 399 -2.44 Broken Hill (C) 1-02-05-09 300 286 -4.67 Broken Hill (C) 1-02-05-10 458 450 -1.75 Broken Hill (C) 1-02-05-11 339 331 -2.36 Broken Hill (C) 1-02-06-01 187 183 -2.14 Broken Hill (C) 1-02-06-02 299 297 -0.67 Broken Hill (C) 1-02-06-03 274 272 -0.73 Broken Hill (C) 1-02-06-04 252 249 -1.19 Broken Hill (C) 1-02-06-05 284 279 -1.76 Broken Hill (C) 1-02-06-06 383 379 -1.04 Broken Hill (C) 1-02-06-07 323 327 1.24 Broken Hill (C) 1-02-06-08 291 275 -5.50 Broken Hill (C) 1-02-06-09 358 353 -1.40

New South Wales Redistribution Statistics 2006
Enrolment Projections Parkes
Actual Enrolment Estimate Growth SLA Name CCD Number 2/12/2005 31/5/2010 (%)
236
Broken Hill (C) 1-02-06-10 244 242 -0.82 Broken Hill (C) 1-02-06-11 293 287 -2.05 Broken Hill (C) 1-02-06-12 433 433 0.00 Broken Hill (C) 1-02-06-13 278 273 -1.80 Broken Hill (C) 47 13902 13668 -1.68 Carrathool (A) 1-01-04-01 34 32 -5.88 Carrathool (A) 1-01-04-02 363 383 5.51 Carrathool (A) 1-01-04-03 121 114 -5.79 Carrathool (A) 1-01-04-04 84 84 0.00 Carrathool (A) 1-01-04-05 156 177 13.46 Carrathool (A) 1-01-04-06 335 360 7.46 Carrathool (A) 1-01-05-02 40 38 -5.00 Carrathool (A) 7 1133 1188 4.85 Central Darling (A) 1-02-09-01 0 0 0.00 Central Darling (A) 1-02-09-02 355 370 4.23 Central Darling (A) 1-02-09-03 12 12 0.00 Central Darling (A) 1-02-09-04 34 31 -8.82 Central Darling (A) 1-02-09-05 131 128 -2.29 Central Darling (A) 1-02-09-06 61 59 -3.28 Central Darling (A) 1-02-10-01 16 13 -18.75 Central Darling (A) 1-02-10-02 51 46 -9.80 Central Darling (A) 1-02-10-03 55 58 5.45 Central Darling (A) 1-02-10-04 97 100 3.09 Central Darling (A) 1-02-10-05 34 32 -5.88 Central Darling (A) 1-02-10-06 300 329 9.67 Central Darling (A) 1-02-10-07 12 11 -8.33 Central Darling (A) 1-02-10-08 34 31 -8.82 Central Darling (A) 1-02-10-09 42 38 -9.52 Central Darling (A) 15 1234 1258 1.94 Cobar (A) 1-02-11-01 50 49 -2.00 Cobar (A) 1-02-11-02 80 75 -6.25 Cobar (A) 1-02-11-03 75 75 0.00 Cobar (A) 1-02-11-04 63 59 -6.35 Cobar (A) 1-02-11-05 57 55 -3.51 Cobar (A) 1-02-11-06 68 64 -5.88 Cobar (A) 1-02-11-07 35 36 2.86

New South Wales Redistribution Statistics 2006
Enrolment Projections Parkes
Actual Enrolment Estimate Growth SLA Name CCD Number 2/12/2005 31/5/2010 (%)
237
Cobar (A) 1-02-11-08 89 93 4.49 Cobar (A) 1-02-12-01 368 375 1.90 Cobar (A) 1-02-12-02 74 73 -1.35 Cobar (A) 1-02-12-03 149 152 2.01 Cobar (A) 1-02-12-04 439 449 2.28 Cobar (A) 1-02-12-05 303 301 -0.66 Cobar (A) 1-02-12-06 375 376 0.27 Cobar (A) 1-02-12-07 250 247 -1.20 Cobar (A) 1-02-12-08 352 358 1.70 Cobar (A) 1-02-12-09 180 185 2.78 Cobar (A) 17 3007 3022 0.50 Dubbo (C) - Pt A 1-03-17-02 238 262 10.08 Dubbo (C) - Pt A 1-03-17-06 526 562 6.84 Dubbo (C) - Pt A 1-03-17-07 131 140 6.87 Dubbo (C) - Pt A 1-03-18-01 142 152 7.04 Dubbo (C) - Pt A 1-03-18-02 586 639 9.04 Dubbo (C) - Pt A 1-03-18-03 332 353 6.33 Dubbo (C) - Pt A 1-03-18-04 404 410 1.49 Dubbo (C) - Pt A 1-03-18-05 302 301 -0.33 Dubbo (C) - Pt A 1-03-18-06 214 218 1.87 Dubbo (C) - Pt A 1-03-18-07 432 455 5.32 Dubbo (C) - Pt A 1-03-18-08 485 534 10.10 Dubbo (C) - Pt A 1-03-18-09 165 172 4.24 Dubbo (C) - Pt A 1-03-18-10 224 231 3.12 Dubbo (C) - Pt A 1-03-18-11 481 497 3.33 Dubbo (C) - Pt A 1-03-18-12 425 426 0.24 Dubbo (C) - Pt A 1-03-18-13 757 1095 44.65 Dubbo (C) - Pt A 1-03-19-01 278 283 1.80 Dubbo (C) - Pt A 1-03-19-02 390 408 4.62 Dubbo (C) - Pt A 1-03-19-03 317 322 1.58 Dubbo (C) - Pt A 1-03-19-04 281 291 3.56 Dubbo (C) - Pt A 1-03-19-05 337 345 2.37 Dubbo (C) - Pt A 1-03-19-06 521 557 6.91 Dubbo (C) - Pt A 1-03-19-07 328 340 3.66 Dubbo (C) - Pt A 1-03-19-08 730 871 19.32 Dubbo (C) - Pt A 1-03-19-09 645 665 3.10 Dubbo (C) - Pt A 1-03-19-10 338 349 3.25 Dubbo (C) - Pt A 1-03-19-11 295 300 1.69 Dubbo (C) - Pt A 1-03-19-12 224 223 -0.45 Dubbo (C) - Pt A 1-03-20-01 105 114 8.57

New South Wales Redistribution Statistics 2006
Enrolment Projections Parkes
Actual Enrolment Estimate Growth SLA Name CCD Number 2/12/2005 31/5/2010 (%)
238
Dubbo (C) - Pt B 1-03-17-03 285 283 -0.70
Dubbo (C) - Pt B 1-03-17-05 150 148 -1.33
Dubbo (C) - Pt A 1-03-20-02 237 244 2.95 Dubbo (C) - Pt A 1-03-20-03 192 193 0.52 Dubbo (C) - Pt A 1-03-20-04 276 279 1.09 Dubbo (C) - Pt A 1-03-20-05 393 399 1.53 Dubbo (C) - Pt A 1-03-20-06 410 473 15.37 Dubbo (C) - Pt A 1-03-20-07 614 636 3.58 Dubbo (C) - Pt A 1-03-20-08 343 353 2.92 Dubbo (C) - Pt A 1-03-20-09 375 399 6.40 Dubbo (C) - Pt A 1-03-20-10 324 336 3.70 Dubbo (C) - Pt A 1-03-20-11 408 447 9.56 Dubbo (C) - Pt A 1-03-20-12 381 398 4.46 Dubbo (C) - Pt A 1-03-20-13 210 217 3.33 Dubbo (C) - Pt A 1-03-21-01 213 217 1.88 Dubbo (C) - Pt A 1-03-21-02 230 238 3.48 Dubbo (C) - Pt A 1-03-21-03 524 538 2.67 Dubbo (C) - Pt A 1-03-21-04 237 243 2.53 Dubbo (C) - Pt A 1-03-21-05 345 350 1.45 Dubbo (C) - Pt A 1-03-21-06 514 518 0.78 Dubbo (C) - Pt A 1-03-21-07 405 405 0.00 Dubbo (C) - Pt A 1-03-21-08 597 671 12.40 Dubbo (C) - Pt A 1-03-21-09 636 733 15.25 Dubbo (C) - Pt A 1-03-21-10 248 277 11.69 Dubbo (C) - Pt A 1-03-21-11 328 347 5.79 Dubbo (C) - Pt A 1-03-21-12 910 1104 21.32 Dubbo (C) - Pt A 1-03-21-13 474 493 4.01 Dubbo (C) - Pt A 1-03-27-01 548 674 22.99 Dubbo (C) - Pt A 1-03-27-03 277 284 2.53 Dubbo (C) - Pt A 1-03-27-05 683 792 15.96 Dubbo (C) - Pt A 57 21965 23773 8.23 Dubbo (C) - Pt B 1-03-17-01 302 286 -5.30
Dubbo (C) - Pt B 1-03-17-04 157 172 9.55
Dubbo (C) - Pt B 1-03-17-08 207 204 -1.45 Dubbo (C) - Pt B 1-03-27-02 142 143 0.70 Dubbo (C) - Pt B 1-03-27-04 249 281 12.85 Dubbo (C) - Pt B 1-03-27-06 308 323 4.87 Dubbo (C) - Pt B 1-03-27-07 351 338 -3.70 Dubbo (C) - Pt B 1-03-27-08 141 138 -2.13 Dubbo (C) - Pt B 1-03-27-09 119 115 -3.36

New South Wales Redistribution Statistics 2006
Enrolment Projections Parkes
Actual Enrolment Estimate Growth SLA Name CCD Number 2/12/2005 31/5/2010 (%)
239
Dubbo (C) - Pt B 11 2411 2431 0.83 Forbes (A) 1-03-06-01 58 56 -3.45 Forbes (A) 1-03-06-02 87 84 -3.45 Forbes (A) 1-03-06-03 248 244 -1.61 Forbes (A) 1-03-06-04 195 202 3.59 Forbes (A) 1-03-06-05 241 236 -2.07 Forbes (A) 1-03-06-06 84 86 2.38 Forbes (A) 1-03-06-07 297 299 0.67 Forbes (A) 1-03-06-08 123 127 3.25 Forbes (A) 1-03-06-09 103 108 4.85 Forbes (A) 1-03-06-10 198 202 2.02 Forbes (A) 1-03-06-11 111 116 4.50 Forbes (A) 1-03-07-01 594 617 3.87 Forbes (A) 1-03-07-02 591 612 3.55 Forbes (A) 1-03-07-03 359 379 5.57 Forbes (A) 1-03-07-04 176 173 -1.70 Forbes (A) 1-03-07-05 403 430 6.70 Forbes (A) 1-03-07-06 356 383 7.58 Forbes (A) 1-03-07-07 339 344 1.47 Forbes (A) 1-03-07-08 551 550 -0.18 Forbes (A) 1-03-07-09 433 442 2.08 Forbes (A) 1-03-07-10 330 341 3.33 Forbes (A) 1-03-07-11 266 280 5.26 Forbes (A) 1-03-07-12 391 401 2.56 Forbes (A) 23 6534 6712 2.72 Lachlan (A) 1-03-02-01 91 87 -4.40 Lachlan (A) 1-03-02-02 152 153 0.66 Lachlan (A) 1-03-02-03 237 239 0.84 Lachlan (A) 1-03-02-04 87 87 0.00 Lachlan (A) 1-03-02-05 95 89 -6.32 Lachlan (A) 1-03-02-06 82 84 2.44 Lachlan (A) 1-03-03-01 88 88 0.00 Lachlan (A) 1-03-03-02 189 188 -0.53 Lachlan (A) 1-03-03-03 96 97 1.04 Lachlan (A) 1-03-03-04 150 148 -1.33 Lachlan (A) 1-03-03-05 129 126 -2.33 Lachlan (A) 1-03-03-06 93 86 -7.53 Lachlan (A) 1-03-03-07 64 61 -4.69

New South Wales Redistribution Statistics 2006
Enrolment Projections Parkes
Actual Enrolment Estimate Growth SLA Name CCD Number 2/12/2005 31/5/2010 (%)
240
Lachlan (A) 1-03-03-08 70 72 2.86 Lachlan (A) 1-03-04-01 347 353 1.73 Lachlan (A) 1-03-04-02 416 423 1.68 Lachlan (A) 1-03-04-03 298 290 -2.68 Lachlan (A) 1-03-04-04 290 298 2.76 Lachlan (A) 1-03-04-05 242 242 0.00 Lachlan (A) 1-03-04-06 253 252 -0.40 Lachlan (A) 1-03-05-01 124 122 -1.61 Lachlan (A) 1-03-05-02 69 71 2.90 Lachlan (A) 1-03-05-03 465 467 0.43 Lachlan (A) 1-03-05-04 92 91 -1.09 Lachlan (A) 1-03-05-05 96 99 3.12 Lachlan (A) 1-03-05-06 105 104 -0.95 Lachlan (A) 1-03-05-07 309 318 2.91 Lachlan (A) 27 4729 4735 0.13 Narromine (A) 1-03-12-01 353 351 -0.57 Narromine (A) 1-03-12-02 475 493 3.79 Narromine (A) 1-03-12-03 311 319 2.57 Narromine (A) 1-03-12-04 252 267 5.95 Narromine (A) 1-03-12-05 330 338 2.42 Narromine (A) 1-03-12-06 223 232 4.04 Narromine (A) 1-03-12-07 283 291 2.83 Narromine (A) 1-03-12-08 191 187 -2.09 Narromine (A) 1-03-12-09 268 270 0.75 Narromine (A) 1-03-12-10 343 352 2.62 Narromine (A) 1-03-13-01 101 99 -1.98 Narromine (A) 1-03-13-02 220 221 0.45 Narromine (A) 1-03-13-03 341 356 4.40 Narromine (A) 1-03-13-04 280 285 1.79 Narromine (A) 1-03-13-05 118 121 2.54 Narromine (A) 1-03-13-06 152 157 3.29 Narromine (A) 1-03-13-07 212 222 4.72 Narromine (A) 1-03-13-08 78 76 -2.56 Narromine (A) 18 4531 4637 2.34 Parkes (A) 1-03-08-01 80 79 -1.25 Parkes (A) 1-03-08-02 90 89 -1.11 Parkes (A) 1-03-08-03 94 97 3.19 Parkes (A) 1-03-08-04 154 153 -0.65

New South Wales Redistribution Statistics 2006
Enrolment Projections Parkes
Actual Enrolment Estimate Growth SLA Name CCD Number 2/12/2005 31/5/2010 (%)
241
Parkes (A) 1-03-08-05 263 272 3.42 Parkes (A) 1-03-08-06 176 175 -0.57 Parkes (A) 1-03-08-07 346 367 6.07 Parkes (A) 1-03-08-08 174 175 0.57 Parkes (A) 1-03-08-09 245 248 1.22 Parkes (A) 1-03-09-01 335 331 -1.19 Parkes (A) 1-03-09-02 201 207 2.99 Parkes (A) 1-03-09-03 451 461 2.22 Parkes (A) 1-03-09-04 295 299 1.36 Parkes (A) 1-03-09-05 267 268 0.37 Parkes (A) 1-03-09-06 292 305 4.45 Parkes (A) 1-03-09-07 130 122 -6.15 Parkes (A) 1-03-09-08 279 286 2.51 Parkes (A) 1-03-09-09 327 344 5.20 Parkes (A) 1-03-09-10 555 586 5.59 Parkes (A) 1-03-09-11 420 446 6.19 Parkes (A) 1-03-10-01 287 283 -1.39 Parkes (A) 1-03-10-02 350 352 0.57 Parkes (A) 1-03-10-03 466 477 2.36 Parkes (A) 1-03-10-04 198 201 1.52 Parkes (A) 1-03-10-05 432 443 2.55 Parkes (A) 1-03-10-06 503 511 1.59 Parkes (A) 1-03-10-07 244 262 7.38 Parkes (A) 1-03-10-08 427 491 14.99 Parkes (A) 1-03-10-09 234 237 1.28 Parkes (A) 1-03-11-01 122 121 -0.82 Parkes (A) 1-03-11-02 292 293 0.34 Parkes (A) 1-03-11-03 163 164 0.61 Parkes (A) 1-03-11-04 82 80 -2.44 Parkes (A) 1-03-11-05 150 146 -2.67 Parkes (A) 1-03-11-06 75 74 -1.33 Parkes (A) 1-03-11-07 372 370 -0.54 Parkes (A) 1-03-11-08 218 219 0.46 Parkes (A) 1-03-11-09 92 89 -3.26 Parkes (A) 38 9881 10123 2.45 Unincorp. Far West 1-02-01-01 20 21 5.00 Unincorp. Far West 1-02-01-02 2 3 50.00 Unincorp. Far West 1-02-01-03 67 65 -2.99 Unincorp. Far West 1-02-01-04 19 18 -5.26 Unincorp. Far West 1-02-01-05 45 43 -4.44

New South Wales Redistribution Statistics 2006
Enrolment Projections Parkes
Actual Enrolment Estimate Growth SLA Name CCD Number 2/12/2005 31/5/2010 (%)
242
Unincorp. Far West 1-02-01-06 37 36 -2.70 Unincorp. Far West 1-02-01-07 45 38 -15.56 Unincorp. Far West 1-02-02-01 76 74 -2.63 Unincorp. Far West 1-02-02-02 57 59 3.51 Unincorp. Far West 1-02-02-03 74 72 -2.70 Unincorp. Far West 1-02-02-04 52 57 9.62 Unincorp. Far West 1-02-02-05 47 45 -4.26 Unincorp. Far West 12 541 531 -1.85 Warren (A) 1-03-14-01 133 135 1.50 Warren (A) 1-03-14-03 90 91 1.11 Warren (A) 1-03-14-04 115 113 -1.74 Warren (A) 1-03-14-05 116 117 0.86 Warren (A) 1-03-15-02 319 316 -0.94 Warren (A) 1-03-15-03 250 242 -3.20 Warren (A) 1-03-15-05 0 0 0.00 Warren (A) 1-03-15-06 155 152 -1.94 Warren (A) 1-03-15-07 389 409 5.14 Warren (A) 9 1567 1575 0.51 Weddin (A) 1-15-04-01 156 156 0.00 Weddin (A) 1-15-04-02 74 67 -9.46 Weddin (A) 1-15-04-03 154 164 6.49 Weddin (A) 1-15-04-04 171 185 8.19 Weddin (A) 1-15-04-05 150 155 3.33 Weddin (A) 1-15-04-06 69 71 2.90 Weddin (A) 1-15-04-07 176 193 9.66 Weddin (A) 1-15-04-08 148 158 6.76 Weddin (A) 1-15-04-09 130 131 0.77 Weddin (A) 1-15-05-01 182 200 9.89 Weddin (A) 1-15-05-02 345 340 -1.45 Weddin (A) 1-15-05-03 440 446 1.36 Weddin (A) 1-15-05-04 549 578 5.28 Weddin (A) 13 2744 2844 3.64 Parkes 329 80410 82811 2.99
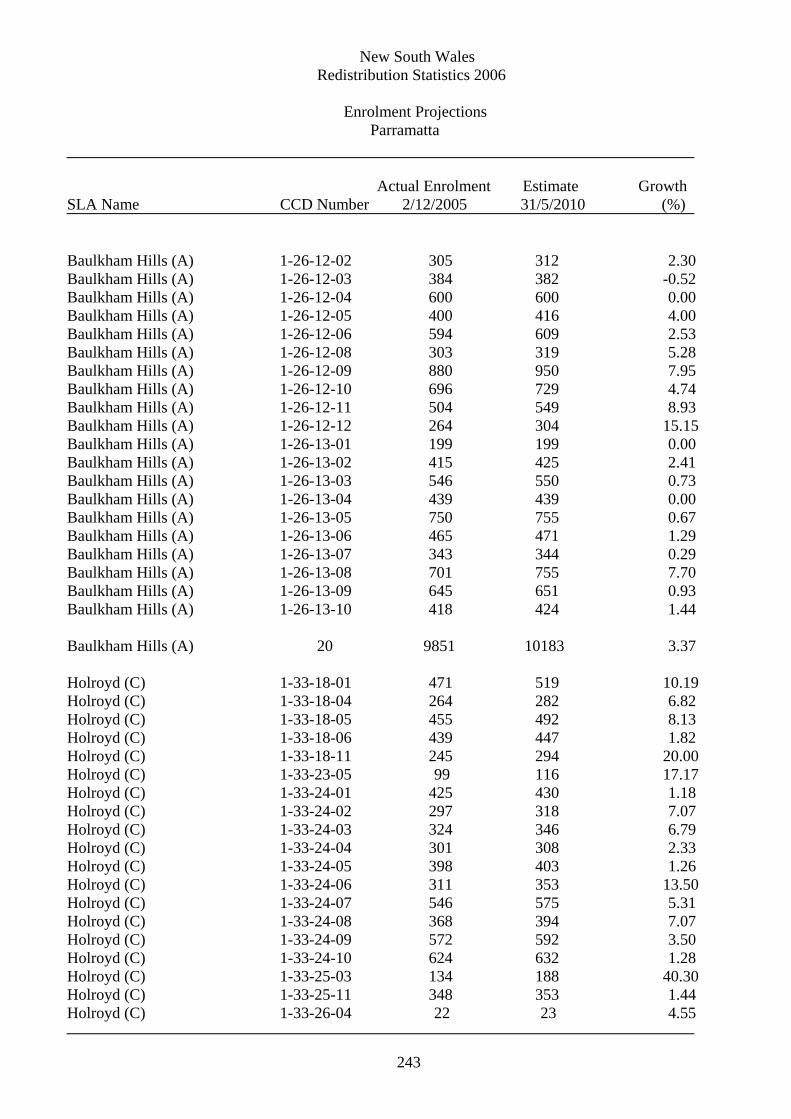
New South Wales Redistribution Statistics 2006
Enrolment Projections Parramatta
Actual Enrolment Estimate Growth SLA Name CCD Number 2/12/2005 31/5/2010 (%)
243
Baulkham Hills (A) 1-26-12-02 305 312 2.30 Baulkham Hills (A) 1-26-12-03 384 382 -0.52 Baulkham Hills (A) 1-26-12-04 600 600 0.00 Baulkham Hills (A) 1-26-12-05 400 416 4.00 Baulkham Hills (A) 1-26-12-06 594 609 2.53 Baulkham Hills (A) 1-26-12-08 303 319 5.28 Baulkham Hills (A) 1-26-12-09 880 950 7.95 Baulkham Hills (A) 1-26-12-10 696 729 4.74 Baulkham Hills (A) 1-26-12-11 504 549 8.93 Baulkham Hills (A) 1-26-12-12 264 304 15.15 Baulkham Hills (A) 1-26-13-01 199 199 0.00 Baulkham Hills (A) 1-26-13-02 415 425 2.41 Baulkham Hills (A) 1-26-13-03 546 550 0.73 Baulkham Hills (A) 1-26-13-04 439 439 0.00 Baulkham Hills (A) 1-26-13-05 750 755 0.67 Baulkham Hills (A) 1-26-13-06 465 471 1.29 Baulkham Hills (A) 1-26-13-07 343 344 0.29 Baulkham Hills (A) 1-26-13-08 701 755 7.70 Baulkham Hills (A) 1-26-13-09 645 651 0.93 Baulkham Hills (A) 1-26-13-10 418 424 1.44 Baulkham Hills (A) 20 9851 10183 3.37 Holroyd (C) 1-33-18-01 471 519 10.19 Holroyd (C) 1-33-18-04 264 282 6.82 Holroyd (C) 1-33-18-05 455 492 8.13 Holroyd (C) 1-33-18-06 439 447 1.82 Holroyd (C) 1-33-18-11 245 294 20.00 Holroyd (C) 1-33-23-05 99 116 17.17 Holroyd (C) 1-33-24-01 425 430 1.18 Holroyd (C) 1-33-24-02 297 318 7.07 Holroyd (C) 1-33-24-03 324 346 6.79 Holroyd (C) 1-33-24-04 301 308 2.33 Holroyd (C) 1-33-24-05 398 403 1.26 Holroyd (C) 1-33-24-06 311 353 13.50 Holroyd (C) 1-33-24-07 546 575 5.31 Holroyd (C) 1-33-24-08 368 394 7.07 Holroyd (C) 1-33-24-09 572 592 3.50 Holroyd (C) 1-33-24-10 624 632 1.28 Holroyd (C) 1-33-25-03 134 188 40.30 Holroyd (C) 1-33-25-11 348 353 1.44 Holroyd (C) 1-33-26-04 22 23 4.55

New South Wales Redistribution Statistics 2006
Enrolment Projections Parramatta
Actual Enrolment Estimate Growth SLA Name CCD Number 2/12/2005 31/5/2010 (%)
244
Holroyd (C) 1-33-31-05 497 562 13.08
Holroyd (C) 1-33-26-11 213 216 1.41 Holroyd (C) 1-33-27-01 421 498 18.29 Holroyd (C) 1-33-27-02 399 412 3.26 Holroyd (C) 1-33-27-03 624 636 1.92 Holroyd (C) 1-33-27-04 570 638 11.93 Holroyd (C) 1-33-27-05 518 543 4.83 Holroyd (C) 1-33-27-06 679 710 4.57 Holroyd (C) 1-33-27-07 362 369 1.93 Holroyd (C) 1-33-27-08 474 520 9.70 Holroyd (C) 1-33-27-09 326 349 7.06 Holroyd (C) 1-33-27-10 330 327 -0.91 Holroyd (C) 1-33-31-01 239 242 1.26 Holroyd (C) 1-33-31-02 472 473 0.21 Holroyd (C) 1-33-31-03 204 205 0.49 Holroyd (C) 1-33-31-04 469 488 4.05
Holroyd (C) 1-33-31-06 423 436 3.07 Holroyd (C) 1-33-31-07 469 565 20.47 Holroyd (C) 1-33-31-08 337 361 7.12 Holroyd (C) 1-33-31-09 358 384 7.26 Holroyd (C) 1-33-31-10 590 608 3.05 Holroyd (C) 40 15617 16607 6.34 NSW Water areas 1-33-11-11 0 0 0.00 NSW Water areas 1 0 0 0.00 Parramatta (C) 1-33-01-01 423 423 0.00 Parramatta (C) 1-33-01-02 464 454 -2.16 Parramatta (C) 1-33-01-03 316 321 1.58 Parramatta (C) 1-33-01-04 622 602 -3.22 Parramatta (C) 1-33-01-05 544 539 -0.92 Parramatta (C) 1-33-01-06 557 553 -0.72 Parramatta (C) 1-33-01-07 397 396 -0.25 Parramatta (C) 1-33-01-08 353 341 -3.40 Parramatta (C) 1-33-01-09 545 587 7.71 Parramatta (C) 1-33-01-10 459 458 -0.22 Parramatta (C) 1-33-01-11 516 502 -2.71 Parramatta (C) 1-33-01-12 272 271 -0.37 Parramatta (C) 1-33-01-13 264 300 13.64 Parramatta (C) 1-33-02-01 453 530 17.00

New South Wales Redistribution Statistics 2006
Enrolment Projections Parramatta
Actual Enrolment Estimate Growth SLA Name CCD Number 2/12/2005 31/5/2010 (%)
245
Parramatta (C) 1-33-02-02 512 505 -1.37 Parramatta (C) 1-33-02-03 460 450 -2.17 Parramatta (C) 1-33-02-04 395 395 0.00 Parramatta (C) 1-33-02-05 390 386 -1.03 Parramatta (C) 1-33-02-06 616 620 0.65 Parramatta (C) 1-33-02-07 353 358 1.42 Parramatta (C) 1-33-02-08 581 577 -0.69 Parramatta (C) 1-33-02-09 197 200 1.52 Parramatta (C) 1-33-02-10 338 334 -1.18 Parramatta (C) 1-33-02-11 407 417 2.46 Parramatta (C) 1-33-02-12 461 456 -1.08 Parramatta (C) 1-33-02-13 543 540 -0.55 Parramatta (C) 1-33-02-14 358 348 -2.79 Parramatta (C) 1-33-03-01 408 413 1.23 Parramatta (C) 1-33-03-02 245 258 5.31 Parramatta (C) 1-33-03-03 345 344 -0.29 Parramatta (C) 1-33-03-04 379 381 0.53 Parramatta (C) 1-33-03-05 490 480 -2.04 Parramatta (C) 1-33-03-06 623 618 -0.80 Parramatta (C) 1-33-03-07 276 284 2.90 Parramatta (C) 1-33-03-08 272 269 -1.10 Parramatta (C) 1-33-03-09 369 403 9.21 Parramatta (C) 1-33-03-10 227 227 0.00 Parramatta (C) 1-33-03-11 549 552 0.55 Parramatta (C) 1-33-03-12 294 289 -1.70 Parramatta (C) 1-33-03-13 411 416 1.22 Parramatta (C) 1-33-04-01 176 171 -2.84 Parramatta (C) 1-33-04-02 263 281 6.84 Parramatta (C) 1-33-04-03 306 309 0.98 Parramatta (C) 1-33-04-04 180 184 2.22 Parramatta (C) 1-33-04-05 417 439 5.28 Parramatta (C) 1-33-04-06 273 265 -2.93 Parramatta (C) 1-33-04-07 195 438 124.62 Parramatta (C) 1-33-04-08 343 507 47.81 Parramatta (C) 1-33-04-09 489 488 -0.20 Parramatta (C) 1-33-04-10 492 515 4.67 Parramatta (C) 1-33-04-11 320 312 -2.50 Parramatta (C) 1-33-04-12 230 226 -1.74 Parramatta (C) 1-33-05-01 290 318 9.66 Parramatta (C) 1-33-05-02 442 438 -0.90 Parramatta (C) 1-33-05-03 431 430 -0.23 Parramatta (C) 1-33-05-04 294 291 -1.02
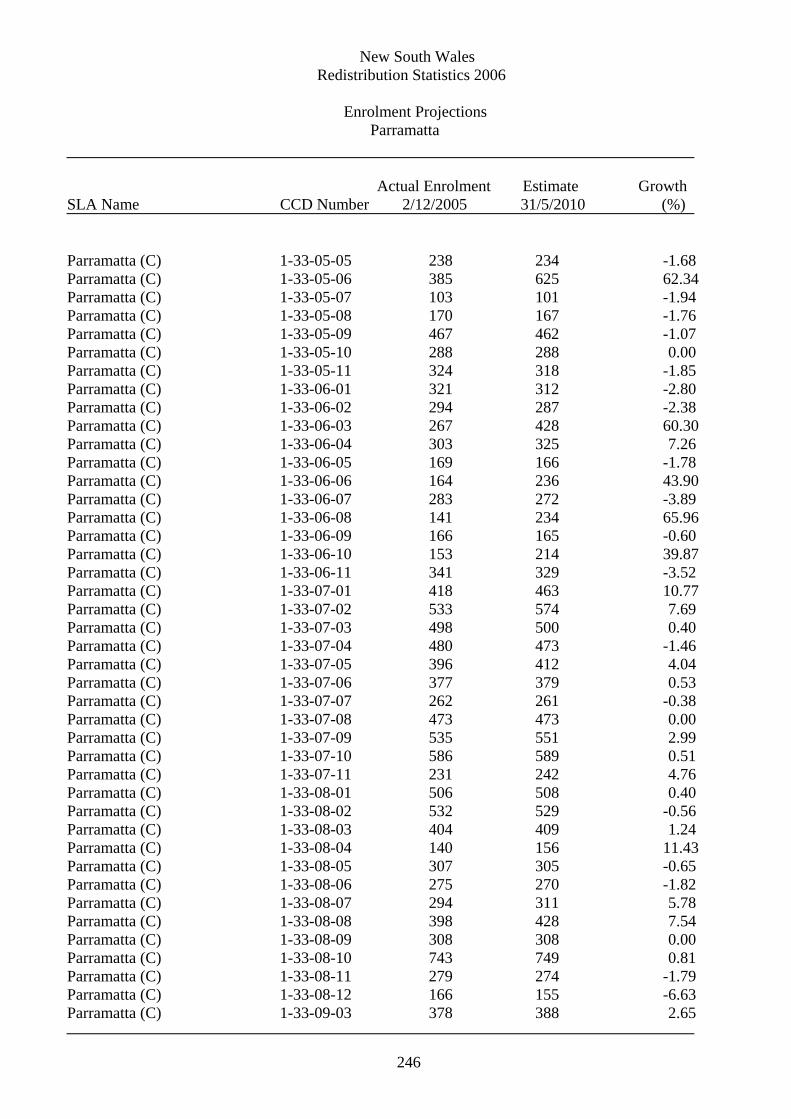
New South Wales Redistribution Statistics 2006
Enrolment Projections Parramatta
Actual Enrolment Estimate Growth SLA Name CCD Number 2/12/2005 31/5/2010 (%)
246
Parramatta (C) 1-33-05-05 238 234 -1.68 Parramatta (C) 1-33-05-06 385 625 62.34 Parramatta (C) 1-33-05-07 103 101 -1.94 Parramatta (C) 1-33-05-08 170 167 -1.76 Parramatta (C) 1-33-05-09 467 462 -1.07 Parramatta (C) 1-33-05-10 288 288 0.00 Parramatta (C) 1-33-05-11 324 318 -1.85 Parramatta (C) 1-33-06-01 321 312 -2.80 Parramatta (C) 1-33-06-02 294 287 -2.38 Parramatta (C) 1-33-06-03 267 428 60.30 Parramatta (C) 1-33-06-04 303 325 7.26 Parramatta (C) 1-33-06-05 169 166 -1.78 Parramatta (C) 1-33-06-06 164 236 43.90 Parramatta (C) 1-33-06-07 283 272 -3.89 Parramatta (C) 1-33-06-08 141 234 65.96 Parramatta (C) 1-33-06-09 166 165 -0.60 Parramatta (C) 1-33-06-10 153 214 39.87 Parramatta (C) 1-33-06-11 341 329 -3.52 Parramatta (C) 1-33-07-01 418 463 10.77 Parramatta (C) 1-33-07-02 533 574 7.69 Parramatta (C) 1-33-07-03 498 500 0.40 Parramatta (C) 1-33-07-04 480 473 -1.46 Parramatta (C) 1-33-07-05 396 412 4.04 Parramatta (C) 1-33-07-06 377 379 0.53 Parramatta (C) 1-33-07-07 262 261 -0.38 Parramatta (C) 1-33-07-08 473 473 0.00 Parramatta (C) 1-33-07-09 535 551 2.99 Parramatta (C) 1-33-07-10 586 589 0.51 Parramatta (C) 1-33-07-11 231 242 4.76 Parramatta (C) 1-33-08-01 506 508 0.40 Parramatta (C) 1-33-08-02 532 529 -0.56 Parramatta (C) 1-33-08-03 404 409 1.24 Parramatta (C) 1-33-08-04 140 156 11.43 Parramatta (C) 1-33-08-05 307 305 -0.65 Parramatta (C) 1-33-08-06 275 270 -1.82 Parramatta (C) 1-33-08-07 294 311 5.78 Parramatta (C) 1-33-08-08 398 428 7.54 Parramatta (C) 1-33-08-09 308 308 0.00 Parramatta (C) 1-33-08-10 743 749 0.81 Parramatta (C) 1-33-08-11 279 274 -1.79 Parramatta (C) 1-33-08-12 166 155 -6.63 Parramatta (C) 1-33-09-03 378 388 2.65

New South Wales Redistribution Statistics 2006
Enrolment Projections Parramatta
Actual Enrolment Estimate Growth SLA Name CCD Number 2/12/2005 31/5/2010 (%)
247
Parramatta (C) 1-33-09-04 478 478 0.00 Parramatta (C) 1-33-09-05 488 485 -0.61 Parramatta (C) 1-33-11-01 232 239 3.02 Parramatta (C) 1-33-11-02 299 305 2.01 Parramatta (C) 1-33-11-03 211 220 4.27 Parramatta (C) 1-33-11-04 140 140 0.00 Parramatta (C) 1-33-11-05 506 503 -0.59 Parramatta (C) 1-33-11-06 464 475 2.37 Parramatta (C) 1-33-11-07 588 599 1.87 Parramatta (C) 1-33-11-08 594 592 -0.34 Parramatta (C) 1-33-11-09 682 714 4.69 Parramatta (C) 1-33-11-10 311 298 -4.18 Parramatta (C) 1-33-11-12 211 213 0.95 Parramatta (C) 1-33-12-01 439 436 -0.68 Parramatta (C) 1-33-12-02 539 554 2.78 Parramatta (C) 1-33-12-03 584 634 8.56 Parramatta (C) 1-33-12-04 319 314 -1.57 Parramatta (C) 1-33-12-05 435 453 4.14 Parramatta (C) 1-33-12-06 451 446 -1.11 Parramatta (C) 1-33-12-07 279 271 -2.87 Parramatta (C) 1-33-12-08 291 287 -1.37 Parramatta (C) 1-33-12-09 480 470 -2.08 Parramatta (C) 1-33-12-10 249 242 -2.81 Parramatta (C) 1-33-12-11 229 236 3.06 Parramatta (C) 1-33-12-12 606 599 -1.16 Parramatta (C) 1-33-13-01 165 259 56.97 Parramatta (C) 1-33-13-02 308 300 -2.60 Parramatta (C) 1-33-13-03 278 279 0.36 Parramatta (C) 1-33-13-04 364 500 37.36 Parramatta (C) 1-33-13-05 315 308 -2.22 Parramatta (C) 1-33-13-06 343 338 -1.46 Parramatta (C) 1-33-13-07 301 322 6.98 Parramatta (C) 1-33-13-08 260 260 0.00 Parramatta (C) 1-33-13-09 243 254 4.53 Parramatta (C) 1-33-13-10 151 151 0.00 Parramatta (C) 1-33-13-11 299 294 -1.67 Parramatta (C) 1-33-13-12 199 211 6.03 Parramatta (C) 1-33-14-01 4 4 0.00 Parramatta (C) 1-33-14-03 51 50 -1.96 Parramatta (C) 1-33-28-01 314 317 0.96 Parramatta (C) 1-33-28-02 204 213 4.41 Parramatta (C) 1-33-28-03 234 230 -1.71

New South Wales Redistribution Statistics 2006
Enrolment Projections Parramatta
Actual Enrolment Estimate Growth SLA Name CCD Number 2/12/2005 31/5/2010 (%)
248
Parramatta (C) 1-33-28-04 481 472 -1.87 Parramatta (C) 1-33-28-05 485 491 1.24 Parramatta (C) 1-33-28-06 1052 1324 25.86 Parramatta (C) 1-33-28-07 447 499 11.63 Parramatta (C) 1-33-28-08 673 668 -0.74 Parramatta (C) 1-33-28-09 625 611 -2.24 Parramatta (C) 1-33-28-10 392 389 -0.77 Parramatta (C) 1-33-29-01 315 311 -1.27 Parramatta (C) 1-33-29-02 306 608 98.69 Parramatta (C) 1-33-29-03 281 272 -3.20 Parramatta (C) 1-33-29-04 126 278 120.63 Parramatta (C) 1-33-29-05 469 644 37.31 Parramatta (C) 1-33-29-06 292 277 -5.14 Parramatta (C) 1-33-29-07 483 509 5.38 Parramatta (C) 1-33-29-08 575 654 13.74 Parramatta (C) 1-33-29-09 398 463 16.33 Parramatta (C) 1-33-29-10 106 103 -2.83 Parramatta (C) 1-33-30-01 587 579 -1.36 Parramatta (C) 1-33-30-02 574 571 -0.52 Parramatta (C) 1-33-30-03 138 138 0.00 Parramatta (C) 1-33-30-04 539 534 -0.93 Parramatta (C) 1-33-30-05 223 224 0.45 Parramatta (C) 1-33-30-06 196 190 -3.06 Parramatta (C) 1-33-30-07 315 308 -2.22 Parramatta (C) 1-33-30-08 150 146 -2.67 Parramatta (C) 1-33-30-09 586 588 0.34 Parramatta (C) 1-33-30-10 390 386 -1.03 Parramatta (C) 1-33-30-11 346 334 -3.47 Parramatta (C) 168 61609 64343 4.44 Parramatta 229 87077 91133 4.66

New South Wales Redistribution Statistics 2006
Enrolment Projections Paterson
Actual Enrolment Estimate Growth SLA Name CCD Number 2/12/2005 31/5/2010 (%)
249
Dungog (A) 1-11-02-08 340 360 5.88
Dungog (A) 1-11-02-01 37 40 8.11 Dungog (A) 1-11-02-02 214 217 1.40 Dungog (A) 1-11-02-03 164 179 9.15 Dungog (A) 1-11-02-04 215 217 0.93 Dungog (A) 1-11-02-05 413 427 3.39 Dungog (A) 1-11-02-06 243 244 0.41 Dungog (A) 1-11-02-07 76 79 3.95
Dungog (A) 1-11-02-09 341 340 -0.29 Dungog (A) 1-11-02-10 324 372 14.81 Dungog (A) 1-11-02-11 541 562 3.88 Dungog (A) 1-11-03-01 147 151 2.72 Dungog (A) 1-11-03-02 208 215 3.37 Dungog (A) 1-11-03-03 154 154 0.00 Dungog (A) 1-11-03-04 211 209 -0.95 Dungog (A) 1-11-03-05 368 374 1.63 Dungog (A) 1-11-03-06 214 226 5.61 Dungog (A) 1-11-03-07 364 387 6.32 Dungog (A) 1-11-03-08 230 244 6.09 Dungog (A) 1-11-03-09 541 570 5.36 Dungog (A) 1-11-03-10 236 246 4.24 Dungog (A) 1-11-03-11 304 316 3.95 Dungog (A) 22 5885 6129 4.15 Gloucester (A) 1-11-01-01 263 270 2.66 Gloucester (A) 1-11-01-02 115 114 -0.87 Gloucester (A) 1-11-01-03 259 259 0.00 Gloucester (A) 1-11-01-04 111 116 4.50 Gloucester (A) 1-11-01-05 120 121 0.83 Gloucester (A) 1-11-01-06 341 350 2.64 Gloucester (A) 1-11-01-07 143 146 2.10 Gloucester (A) 1-11-01-08 67 69 2.99 Gloucester (A) 1-11-01-09 495 502 1.41 Gloucester (A) 1-11-01-10 416 428 2.88 Gloucester (A) 1-11-01-11 391 398 1.79 Gloucester (A) 1-11-01-12 540 527 -2.41 Gloucester (A) 1-11-01-13 130 130 0.00 Gloucester (A) 1-11-01-14 225 232 3.11 Gloucester (A) 14 3616 3662 1.27

New South Wales Redistribution Statistics 2006
Enrolment Projections Paterson
Actual Enrolment Estimate Growth SLA Name CCD Number 2/12/2005 31/5/2010 (%)
250
Great Lakes (A) 1-09-16-01 362 372 2.76 Great Lakes (A) 1-09-16-02 592 679 14.70 Great Lakes (A) 1-09-16-03 528 500 -5.30 Great Lakes (A) 1-09-16-04 244 242 -0.82 Great Lakes (A) 1-09-16-05 175 171 -2.29 Great Lakes (A) 1-09-16-06 289 298 3.11 Great Lakes (A) 1-09-16-07 219 238 8.68 Great Lakes (A) 1-09-16-08 299 328 9.70 Great Lakes (A) 1-09-16-09 648 803 23.92 Great Lakes (A) 1-09-16-10 550 545 -0.91 Great Lakes (A) 1-09-16-11 437 441 0.92 Great Lakes (A) 1-09-17-01 81 74 -8.64 Great Lakes (A) 1-09-17-02 167 176 5.39 Great Lakes (A) 1-09-17-03 100 150 50.00 Great Lakes (A) 1-09-17-04 291 273 -6.19 Great Lakes (A) 1-09-17-05 159 184 15.72 Great Lakes (A) 1-09-17-06 149 145 -2.68 Great Lakes (A) 1-09-17-07 311 301 -3.22 Great Lakes (A) 1-09-17-08 214 213 -0.47 Great Lakes (A) 1-09-17-09 176 209 18.75 Great Lakes (A) 1-09-17-10 232 221 -4.74 Great Lakes (A) 1-09-18-01 234 234 0.00 Great Lakes (A) 1-09-18-02 549 581 5.83 Great Lakes (A) 1-09-18-03 708 741 4.66 Great Lakes (A) 1-09-18-04 153 167 9.15 Great Lakes (A) 1-09-18-05 359 360 0.28 Great Lakes (A) 1-09-18-06 366 365 -0.27 Great Lakes (A) 1-09-18-07 156 148 -5.13 Great Lakes (A) 1-09-18-08 418 409 -2.15 Great Lakes (A) 1-09-18-09 329 330 0.30 Great Lakes (A) 1-09-18-10 231 235 1.73 Great Lakes (A) 1-09-18-11 360 357 -0.83 Great Lakes (A) 1-09-19-01 106 121 14.15 Great Lakes (A) 1-09-19-02 834 1252 50.12 Great Lakes (A) 1-09-19-03 104 127 22.12 Great Lakes (A) 1-09-19-04 470 465 -1.06 Great Lakes (A) 1-09-19-05 90 123 36.67 Great Lakes (A) 1-09-19-06 690 873 26.52 Great Lakes (A) 1-09-19-07 208 207 -0.48 Great Lakes (A) 1-09-19-08 139 201 44.60 Great Lakes (A) 1-09-19-09 141 194 37.59 Great Lakes (A) 1-09-19-10 367 358 -2.45

New South Wales Redistribution Statistics 2006
Enrolment Projections Paterson
Actual Enrolment Estimate Growth SLA Name CCD Number 2/12/2005 31/5/2010 (%)
251
Great Lakes (A) 1-09-19-11 297 308 3.70 Great Lakes (A) 1-09-20-01 194 196 1.03 Great Lakes (A) 1-09-20-02 182 191 4.95 Great Lakes (A) 1-09-20-03 98 99 1.02 Great Lakes (A) 1-09-20-04 487 509 4.52 Great Lakes (A) 1-09-20-05 261 269 3.07 Great Lakes (A) 1-09-20-06 273 284 4.03 Great Lakes (A) 1-09-20-07 177 173 -2.26 Great Lakes (A) 1-09-20-08 380 392 3.16 Great Lakes (A) 1-09-20-09 178 189 6.18 Great Lakes (A) 1-09-20-10 186 205 10.22 Great Lakes (A) 1-09-20-11 331 355 7.25 Great Lakes (A) 1-09-20-12 80 76 -5.00 Great Lakes (A) 1-09-20-13 157 176 12.10 Great Lakes (A) 1-09-20-14 169 177 4.73 Great Lakes (A) 1-09-24-01 28 27 -3.57 Great Lakes (A) 1-09-24-02 172 241 40.12 Great Lakes (A) 1-09-24-03 184 230 25.00 Great Lakes (A) 1-09-24-04 400 407 1.75 Great Lakes (A) 1-09-24-05 214 230 7.48 Great Lakes (A) 1-09-24-06 327 383 17.13 Great Lakes (A) 1-09-24-07 353 429 21.53 Great Lakes (A) 1-09-24-08 292 369 26.37 Great Lakes (A) 1-09-24-09 286 285 -0.35 Great Lakes (A) 1-09-24-10 277 305 10.11 Great Lakes (A) 1-09-24-11 115 140 21.74 Great Lakes (A) 1-09-24-12 112 123 9.82 Great Lakes (A) 1-09-26-01 1071 1457 36.04 Great Lakes (A) 1-09-26-02 1058 1368 29.30 Great Lakes (A) 1-09-26-03 334 324 -2.99 Great Lakes (A) 1-09-26-04 380 371 -2.37 Great Lakes (A) 1-09-26-05 337 340 0.89 Great Lakes (A) 1-09-26-06 493 489 -0.81 Great Lakes (A) 1-09-26-07 331 310 -6.34 Great Lakes (A) 1-09-26-08 653 697 6.74 Great Lakes (A) 1-09-26-09 315 310 -1.59 Great Lakes (A) 1-09-26-10 238 235 -1.26 Great Lakes (A) 79 24655 27080 9.84 Maitland (C) 1-11-04-04 0 0 0.00 Maitland (C) 1-11-08-01 330 338 2.42

New South Wales Redistribution Statistics 2006
Enrolment Projections Paterson
Actual Enrolment Estimate Growth SLA Name CCD Number 2/12/2005 31/5/2010 (%)
252
Maitland (C) 1-11-08-02 185 235 27.03 Maitland (C) 1-11-08-09 377 394 4.51 Maitland (C) 1-11-10-01 529 545 3.02 Maitland (C) 1-11-10-02 689 703 2.03 Maitland (C) 1-11-10-03 469 477 1.71 Maitland (C) 1-11-10-04 285 525 84.21 Maitland (C) 1-11-10-05 214 221 3.27 Maitland (C) 1-11-10-06 407 437 7.37 Maitland (C) 1-11-10-07 440 459 4.32 Maitland (C) 1-11-10-08 467 475 1.71 Maitland (C) 1-11-10-09 371 376 1.35 Maitland (C) 1-11-10-10 503 526 4.57 Maitland (C) 1-11-10-11 549 556 1.28 Maitland (C) 1-11-10-12 156 159 1.92 Maitland (C) 1-11-10-13 379 412 8.71 Maitland (C) 1-11-10-14 328 337 2.74 Maitland (C) 1-11-10-15 1584 2372 49.75 Maitland (C) 19 8262 9547 15.55 NSW Water areas 1-11-11-07 7 7 0.00 NSW Water areas 1 7 7 0.00 Port Stephens (A) 1-11-11-01 608 701 15.30 Port Stephens (A) 1-11-11-02 386 430 11.40 Port Stephens (A) 1-11-11-03 803 904 12.58 Port Stephens (A) 1-11-11-04 236 263 11.44 Port Stephens (A) 1-11-11-05 440 890 102.27 Port Stephens (A) 1-11-11-06 381 398 4.46 Port Stephens (A) 1-11-11-08 613 695 13.38 Port Stephens (A) 1-11-11-09 594 670 12.79 Port Stephens (A) 1-11-11-10 274 348 27.01 Port Stephens (A) 1-11-11-11 248 275 10.89 Port Stephens (A) 1-11-12-01 459 484 5.45 Port Stephens (A) 1-11-12-02 324 333 2.78 Port Stephens (A) 1-11-12-03 417 428 2.64 Port Stephens (A) 1-11-12-04 74 71 -4.05 Port Stephens (A) 1-11-12-05 265 272 2.64 Port Stephens (A) 1-11-12-06 318 314 -1.26 Port Stephens (A) 1-11-12-07 359 388 8.08 Port Stephens (A) 1-11-12-08 463 497 7.34

New South Wales Redistribution Statistics 2006
Enrolment Projections Paterson
Actual Enrolment Estimate Growth SLA Name CCD Number 2/12/2005 31/5/2010 (%)
253
Port Stephens (A) 1-11-12-09 335 343 2.39 Port Stephens (A) 1-11-12-10 507 527 3.94 Port Stephens (A) 1-11-12-11 1236 1494 20.87 Port Stephens (A) 1-11-12-12 263 273 3.80 Port Stephens (A) 1-11-12-13 379 393 3.69 Port Stephens (A) 1-11-13-01 570 583 2.28 Port Stephens (A) 1-11-13-02 472 558 18.22 Port Stephens (A) 1-11-13-03 382 381 -0.26 Port Stephens (A) 1-11-13-04 461 465 0.87 Port Stephens (A) 1-11-13-05 171 181 5.85 Port Stephens (A) 1-11-13-06 124 124 0.00 Port Stephens (A) 1-11-13-07 59 61 3.39 Port Stephens (A) 1-11-13-08 1019 1014 -0.49 Port Stephens (A) 1-11-13-09 350 344 -1.71 Port Stephens (A) 1-11-13-10 294 293 -0.34 Port Stephens (A) 1-11-13-11 213 219 2.82 Port Stephens (A) 1-11-13-12 369 391 5.96 Port Stephens (A) 1-11-13-13 439 457 4.10 Port Stephens (A) 1-11-14-01 485 501 3.30 Port Stephens (A) 1-11-14-02 55 62 12.73 Port Stephens (A) 1-11-14-03 934 1063 13.81 Port Stephens (A) 1-11-14-04 512 562 9.77 Port Stephens (A) 1-11-14-05 542 583 7.56 Port Stephens (A) 1-11-14-06 362 510 40.88 Port Stephens (A) 1-11-14-07 218 237 8.72 Port Stephens (A) 1-11-14-08 541 562 3.88 Port Stephens (A) 1-11-14-09 289 306 5.88 Port Stephens (A) 1-11-14-10 77 74 -3.90 Port Stephens (A) 1-11-14-11 111 122 9.91 Port Stephens (A) 1-11-14-12 270 297 10.00 Port Stephens (A) 1-11-14-13 158 167 5.70 Port Stephens (A) 1-11-14-14 583 617 5.83 Port Stephens (A) 1-11-14-15 482 539 11.83 Port Stephens (A) 1-11-15-01 383 408 6.53 Port Stephens (A) 1-11-15-02 445 454 2.02 Port Stephens (A) 1-11-15-03 235 242 2.98 Port Stephens (A) 1-11-15-04 283 303 7.07 Port Stephens (A) 1-11-15-05 604 680 12.58 Port Stephens (A) 1-11-15-06 560 594 6.07 Port Stephens (A) 1-11-15-07 503 543 7.95 Port Stephens (A) 1-11-15-08 336 342 1.79 Port Stephens (A) 1-11-15-09 483 517 7.04

New South Wales Redistribution Statistics 2006
Enrolment Projections Paterson
Actual Enrolment Estimate Growth SLA Name CCD Number 2/12/2005 31/5/2010 (%)
254
Port Stephens (A) 1-11-15-10 368 393 6.79 Port Stephens (A) 1-11-15-11 294 315 7.14 Port Stephens (A) 1-11-15-12 445 519 16.63 Port Stephens (A) 1-11-16-01 1376 1926 39.97 Port Stephens (A) 1-11-16-02 717 804 12.13 Port Stephens (A) 1-11-16-03 401 444 10.72 Port Stephens (A) 1-11-16-04 151 246 62.91 Port Stephens (A) 1-11-16-05 455 474 4.18 Port Stephens (A) 1-11-16-06 254 277 9.06 Port Stephens (A) 1-11-16-07 518 580 11.97 Port Stephens (A) 1-11-16-08 481 509 5.82 Port Stephens (A) 1-11-16-09 142 181 27.46 Port Stephens (A) 1-11-16-10 325 329 1.23 Port Stephens (A) 1-11-16-11 194 325 67.53 Port Stephens (A) 1-11-17-01 148 288 94.59 Port Stephens (A) 1-11-17-02 124 142 14.52 Port Stephens (A) 1-11-17-03 73 81 10.96 Port Stephens (A) 1-11-17-04 552 561 1.63 Port Stephens (A) 1-11-17-05 140 143 2.14 Port Stephens (A) 1-11-17-06 39 36 -7.69 Port Stephens (A) 1-11-17-07 400 407 1.75 Port Stephens (A) 1-11-17-08 82 95 15.85 Port Stephens (A) 1-11-17-09 333 344 3.30 Port Stephens (A) 1-11-17-10 134 156 16.42 Port Stephens (A) 1-11-17-11 181 184 1.66 Port Stephens (A) 1-11-19-01 670 1016 51.64 Port Stephens (A) 1-11-19-02 473 613 29.60 Port Stephens (A) 1-11-19-03 1174 1667 41.99 Port Stephens (A) 1-11-19-04 389 434 11.57 Port Stephens (A) 1-11-19-05 512 552 7.81 Port Stephens (A) 1-11-19-06 438 460 5.02 Port Stephens (A) 1-11-19-07 558 564 1.08 Port Stephens (A) 1-11-19-08 571 585 2.45 Port Stephens (A) 1-11-19-09 529 675 27.60 Port Stephens (A) 1-11-20-01 176 231 31.25 Port Stephens (A) 1-11-20-02 615 665 8.13 Port Stephens (A) 1-11-20-03 429 447 4.20 Port Stephens (A) 1-11-20-04 648 709 9.41 Port Stephens (A) 1-11-20-05 487 518 6.37 Port Stephens (A) 1-11-20-06 545 560 2.75 Port Stephens (A) 1-11-20-07 380 431 13.42 Port Stephens (A) 1-11-20-08 312 337 8.01

New South Wales Redistribution Statistics 2006
Enrolment Projections Paterson
Actual Enrolment Estimate Growth SLA Name CCD Number 2/12/2005 31/5/2010 (%)
255
Port Stephens (A) 1-11-20-09 298 354 18.79 Port Stephens (A) 103 41887 47324 12.98 Newcastle (C) - Remainder 1-10-02-02 608 601 -1.15 Newcastle (C) - Remainder 1-10-02-03 470 470 0.00 Newcastle (C) - Remainder 1-10-02-04 607 611 0.66 Newcastle (C) - Remainder 1-10-02-05 316 315 -0.32 Newcastle (C) - Remainder 1-10-02-06 868 877 1.04 Newcastle (C) - Remainder 1-10-02-07 377 371 -1.59 Newcastle (C) - Remainder 1-10-02-08 295 295 0.00 Newcastle (C) - Remainder 1-10-03-02 20 22 10.00 Newcastle (C) - Remainder 8 3561 3562 0.03 Paterson 246 87873 97311 10.74

New South Wales Redistribution Statistics 2006
Enrolment Projections Prospect
Actual Enrolment Estimate Growth SLA Name CCD Number 2/12/2005 31/5/2010 (%)
256
Fairfield (C) 1-32-01-10 663 655 -1.21
Blacktown (C) - South-East 1-27-25-09 28 28 0.00 Blacktown (C) - South-East 1 28 28 0.00 Blacktown (C) - South-West 1-27-25-12 2 2 0.00 Blacktown (C) - South-West 1 2 2 0.00 Fairfield (C) 1-32-01-01 816 830 1.72 Fairfield (C) 1-32-01-02 418 447 6.94 Fairfield (C) 1-32-01-03 447 453 1.34 Fairfield (C) 1-32-01-04 765 766 0.13 Fairfield (C) 1-32-01-05 668 672 0.60 Fairfield (C) 1-32-01-06 565 568 0.53 Fairfield (C) 1-32-01-07 372 642 72.58 Fairfield (C) 1-32-01-08 550 588 6.91 Fairfield (C) 1-32-01-09 514 554 7.78
Fairfield (C) 1-32-01-11 443 455 2.71 Fairfield (C) 1-32-02-01 565 573 1.42 Fairfield (C) 1-32-02-02 958 987 3.03 Fairfield (C) 1-32-02-03 572 582 1.75 Fairfield (C) 1-32-02-04 537 549 2.23 Fairfield (C) 1-32-02-05 689 695 0.87 Fairfield (C) 1-32-02-06 719 717 -0.28 Fairfield (C) 1-32-02-07 527 535 1.52 Fairfield (C) 1-32-02-08 512 527 2.93 Fairfield (C) 1-32-02-09 699 701 0.29 Fairfield (C) 1-32-02-10 435 436 0.23 Fairfield (C) 1-32-03-01 506 512 1.19 Fairfield (C) 1-32-03-02 554 565 1.99 Fairfield (C) 1-32-03-03 536 540 0.75 Fairfield (C) 1-32-03-06 533 535 0.38 Fairfield (C) 1-32-03-07 706 714 1.13 Fairfield (C) 1-32-03-08 953 962 0.94 Fairfield (C) 1-32-03-09 367 376 2.45 Fairfield (C) 1-32-03-10 692 706 2.02 Fairfield (C) 1-32-03-14 653 651 -0.31 Fairfield (C) 1-32-04-01 321 325 1.25 Fairfield (C) 1-32-04-02 336 332 -1.19 Fairfield (C) 1-32-04-03 377 385 2.12 Fairfield (C) 1-32-04-04 643 655 1.87

New South Wales Redistribution Statistics 2006
Enrolment Projections Prospect
Actual Enrolment Estimate Growth SLA Name CCD Number 2/12/2005 31/5/2010 (%)
257
Fairfield (C) 1-32-04-05 304 304 0.00 Fairfield (C) 1-32-04-06 987 1086 10.03 Fairfield (C) 1-32-04-07 641 652 1.72 Fairfield (C) 1-32-04-08 310 315 1.61 Fairfield (C) 1-32-04-09 631 644 2.06 Fairfield (C) 1-32-04-10 439 443 0.91 Fairfield (C) 1-32-04-11 430 423 -1.63 Fairfield (C) 1-32-04-12 381 383 0.52 Fairfield (C) 1-32-05-01 573 579 1.05 Fairfield (C) 1-32-05-02 578 595 2.94 Fairfield (C) 1-32-05-03 343 351 2.33 Fairfield (C) 1-32-05-04 517 533 3.09 Fairfield (C) 1-32-05-05 281 285 1.42 Fairfield (C) 1-32-05-06 391 394 0.77 Fairfield (C) 1-32-05-07 381 381 0.00 Fairfield (C) 1-32-05-08 446 456 2.24 Fairfield (C) 1-32-05-09 325 327 0.62 Fairfield (C) 1-32-05-10 362 354 -2.21 Fairfield (C) 1-32-05-11 289 293 1.38 Fairfield (C) 1-32-05-12 380 390 2.63 Fairfield (C) 1-32-06-01 602 616 2.33 Fairfield (C) 1-32-06-02 385 402 4.42 Fairfield (C) 1-32-06-03 417 445 6.71 Fairfield (C) 1-32-06-04 617 652 5.67 Fairfield (C) 1-32-06-05 380 381 0.26 Fairfield (C) 1-32-06-06 478 508 6.28 Fairfield (C) 1-32-06-07 240 257 7.08 Fairfield (C) 1-32-06-08 644 702 9.01 Fairfield (C) 1-32-06-09 478 552 15.48 Fairfield (C) 1-32-06-10 362 383 5.80 Fairfield (C) 1-32-06-11 206 237 15.05 Fairfield (C) 1-32-06-12 592 649 9.63 Fairfield (C) 1-32-07-01 565 578 2.30 Fairfield (C) 1-32-07-02 542 551 1.66 Fairfield (C) 1-32-07-03 409 422 3.18 Fairfield (C) 1-32-07-04 413 429 3.87 Fairfield (C) 1-32-07-05 436 460 5.50 Fairfield (C) 1-32-07-06 369 584 58.27 Fairfield (C) 1-32-07-07 286 487 70.28 Fairfield (C) 1-32-07-08 517 514 -0.58 Fairfield (C) 1-32-07-09 393 391 -0.51 Fairfield (C) 1-32-07-10 427 486 13.82

New South Wales Redistribution Statistics 2006
Enrolment Projections Prospect
Actual Enrolment Estimate Growth SLA Name CCD Number 2/12/2005 31/5/2010 (%)
258
Fairfield (C) 1-32-07-11 339 337 -0.59 Fairfield (C) 1-32-07-12 364 433 18.96 Fairfield (C) 1-32-07-13 225 265 17.78 Fairfield (C) 1-32-07-14 327 337 3.06 Fairfield (C) 1-32-07-15 247 245 -0.81 Fairfield (C) 1-32-08-01 93 138 48.39 Fairfield (C) 1-32-08-02 312 337 8.01 Fairfield (C) 1-32-08-03 313 311 -0.64 Fairfield (C) 1-32-08-04 323 316 -2.17 Fairfield (C) 1-32-08-05 410 422 2.93 Fairfield (C) 1-32-08-06 212 219 3.30 Fairfield (C) 1-32-08-07 339 370 9.14 Fairfield (C) 1-32-08-08 322 350 8.70 Fairfield (C) 1-32-08-09 393 400 1.78 Fairfield (C) 1-32-08-10 372 376 1.08 Fairfield (C) 1-32-08-11 431 436 1.16 Fairfield (C) 1-32-08-12 501 526 4.99 Fairfield (C) 1-32-08-13 307 316 2.93 Fairfield (C) 1-32-08-14 238 327 37.39 Fairfield (C) 1-32-08-15 573 607 5.93 Fairfield (C) 1-32-08-16 385 414 7.53 Fairfield (C) 1-32-16-01 498 510 2.41 Fairfield (C) 1-32-16-02 516 513 -0.58 Fairfield (C) 1-32-16-12 586 592 1.02 Fairfield (C) 1-32-16-13 750 759 1.20 Fairfield (C) 1-32-16-14 507 515 1.58 Fairfield (C) 1-32-19-01 551 557 1.09 Fairfield (C) 1-32-19-02 485 508 4.74 Fairfield (C) 1-32-19-03 431 424 -1.62 Fairfield (C) 1-32-19-04 583 586 0.51 Fairfield (C) 1-32-19-05 475 486 2.32 Fairfield (C) 1-32-19-06 354 356 0.56 Fairfield (C) 1-32-19-07 528 539 2.08 Fairfield (C) 1-32-19-08 583 590 1.20 Fairfield (C) 1-32-19-09 570 581 1.93 Fairfield (C) 1-32-19-10 444 474 6.76 Fairfield (C) 1-32-19-11 583 583 0.00 Fairfield (C) 1-32-19-12 575 573 -0.35 Fairfield (C) 1-32-19-13 531 538 1.32 Fairfield (C) 1-32-19-14 562 568 1.07 Fairfield (C) 116 55496 57798 4.15

New South Wales Redistribution Statistics 2006
Enrolment Projections Prospect
Actual Enrolment Estimate Growth SLA Name CCD Number 2/12/2005 31/5/2010 (%)
259
Holroyd (C) 1-33-22-01 473 486 2.75 Holroyd (C) 1-33-22-02 594 603 1.52 Holroyd (C) 1-33-22-03 647 704 8.81 Holroyd (C) 1-33-22-04 560 562 0.36 Holroyd (C) 1-33-22-06 568 636 11.97 Holroyd (C) 1-33-22-11 826 829 0.36 Holroyd (C) 1-33-25-01 641 663 3.43 Holroyd (C) 1-33-25-02 531 544 2.45 Holroyd (C) 1-33-25-03 156 213 36.54 Holroyd (C) 1-33-25-04 407 418 2.70 Holroyd (C) 1-33-25-05 674 707 4.90 Holroyd (C) 1-33-25-06 542 573 5.72 Holroyd (C) 1-33-25-07 437 468 7.09 Holroyd (C) 1-33-25-08 330 343 3.94 Holroyd (C) 1-33-25-09 652 678 3.99 Holroyd (C) 1-33-25-10 402 412 2.49 Holroyd (C) 1-33-26-01 367 376 2.45 Holroyd (C) 1-33-26-02 498 505 1.41 Holroyd (C) 1-33-26-03 689 708 2.76 Holroyd (C) 1-33-26-04 447 2247 402.68 Holroyd (C) 1-33-26-05 690 703 1.88 Holroyd (C) 1-33-26-06 722 733 1.52 Holroyd (C) 1-33-26-07 598 609 1.84 Holroyd (C) 1-33-26-08 369 373 1.08 Holroyd (C) 1-33-26-09 592 598 1.01 Holroyd (C) 1-33-26-10 476 477 0.21 Holroyd (C) 1-33-26-11 259 264 1.93 Holroyd (C) 1-33-26-12 443 452 2.03 Holroyd (C) 28 14590 16884 15.72 Penrith (C) 1-28-15-04 420 422 0.48 Penrith (C) 1-28-15-05 456 464 1.75 Penrith (C) 1-28-15-06 592 591 -0.17 Penrith (C) 1-28-15-07 409 417 1.96 Penrith (C) 1-28-15-08 497 495 -0.40 Penrith (C) 1-28-15-09 653 655 0.31 Penrith (C) 1-28-15-10 334 342 2.40 Penrith (C) 1-28-15-11 421 416 -1.19 Penrith (C) 1-28-16-04 481 489 1.66 Penrith (C) 1-28-16-05 361 364 0.83

New South Wales Redistribution Statistics 2006
Enrolment Projections Prospect
Actual Enrolment Estimate Growth SLA Name CCD Number 2/12/2005 31/5/2010 (%)
260
Penrith (C) 1-28-16-06 597 626 4.86 Penrith (C) 1-28-16-07 735 743 1.09 Penrith (C) 1-28-16-08 471 469 -0.42 Penrith (C) 1-28-16-09 403 412 2.23 Penrith (C) 1-28-16-10 499 614 23.05 Penrith (C) 1-28-17-01 451 452 0.22 Penrith (C) 1-28-17-02 477 491 2.94 Penrith (C) 1-28-17-03 526 531 0.95 Penrith (C) 1-28-17-04 476 478 0.42 Penrith (C) 1-28-17-05 513 515 0.39 Penrith (C) 1-28-17-06 460 468 1.74 Penrith (C) 1-28-17-07 375 365 -2.67 Penrith (C) 1-28-17-08 422 427 1.18 Penrith (C) 1-28-17-09 419 424 1.19 Penrith (C) 1-28-17-10 711 708 -0.42 Penrith (C) 1-28-17-11 239 245 2.51 Penrith (C) 1-28-17-12 501 501 0.00 Penrith (C) 1-28-19-01 604 673 11.42 Penrith (C) 1-28-19-02 501 550 9.78 Penrith (C) 1-28-19-03 542 548 1.11 Penrith (C) 1-28-19-04 594 600 1.01 Penrith (C) 1-28-19-05 638 652 2.19 Penrith (C) 1-28-19-06 451 466 3.33 Penrith (C) 1-28-19-07 439 436 -0.68 Penrith (C) 1-28-19-08 448 444 -0.89 Penrith (C) 1-28-19-09 881 874 -0.79 Penrith (C) 1-28-22-09 4 4 0.00 Penrith (C) 37 18001 18371 2.06 Prospect 183 88117 93083 5.64

New South Wales Redistribution Statistics 2006
Enrolment Projections Reid
Actual Enrolment Estimate Growth SLA Name CCD Number 2/12/2005 31/5/2010 (%)
261
Auburn (A) 1-34-01-01 214 219 2.34 Auburn (A) 1-34-01-02 1251 2037 62.83 Auburn (A) 1-34-01-03 357 380 6.44 Auburn (A) 1-34-01-04 610 681 11.64 Auburn (A) 1-34-01-05 20 20 0.00 Auburn (A) 1-34-01-06 161 168 4.35 Auburn (A) 1-34-01-07 274 277 1.09 Auburn (A) 1-34-01-08 555 594 7.03 Auburn (A) 1-34-01-09 432 642 48.61 Auburn (A) 1-34-01-10 424 450 6.13 Auburn (A) 1-34-01-11 208 315 51.44 Auburn (A) 1-34-01-12 222 226 1.80 Auburn (A) 1-34-01-14 174 183 5.17 Auburn (A) 1-34-01-15 523 712 36.14 Auburn (A) 1-34-01-16 379 391 3.17 Auburn (A) 1-34-02-01 391 607 55.24 Auburn (A) 1-34-02-02 453 472 4.19 Auburn (A) 1-34-02-03 724 802 10.77 Auburn (A) 1-34-02-04 419 451 7.64 Auburn (A) 1-34-02-05 478 515 7.74 Auburn (A) 1-34-02-06 485 530 9.28 Auburn (A) 1-34-02-07 324 344 6.17 Auburn (A) 1-34-02-08 583 614 5.32 Auburn (A) 1-34-02-09 329 338 2.74 Auburn (A) 1-34-02-10 263 280 6.46 Auburn (A) 1-34-02-11 289 319 10.38 Auburn (A) 1-34-03-01 373 387 3.75 Auburn (A) 1-34-03-02 308 324 5.19 Auburn (A) 1-34-03-03 529 538 1.70 Auburn (A) 1-34-03-04 426 463 8.69 Auburn (A) 1-34-03-05 455 489 7.47 Auburn (A) 1-34-03-06 343 356 3.79 Auburn (A) 1-34-03-07 661 795 20.27 Auburn (A) 1-34-03-08 330 344 4.24 Auburn (A) 1-34-03-09 424 443 4.48 Auburn (A) 1-34-04-01 388 668 72.16 Auburn (A) 1-34-04-02 315 379 20.32 Auburn (A) 1-34-04-03 378 404 6.88 Auburn (A) 1-34-04-04 540 590 9.26 Auburn (A) 1-34-04-05 685 730 6.57 Auburn (A) 1-34-04-06 198 204 3.03 Auburn (A) 1-34-04-07 318 326 2.52

New South Wales Redistribution Statistics 2006
Enrolment Projections Reid
Actual Enrolment Estimate Growth SLA Name CCD Number 2/12/2005 31/5/2010 (%)
262
Auburn (A) 1-34-04-08 323 376 16.41 Auburn (A) 1-34-04-09 433 459 6.00 Auburn (A) 1-34-04-10 693 746 7.65 Auburn (A) 1-34-05-01 306 323 5.56 Auburn (A) 1-34-05-02 216 223 3.24 Auburn (A) 1-34-05-03 548 571 4.20 Auburn (A) 1-34-05-04 250 266 6.40 Auburn (A) 1-34-05-05 629 675 7.31 Auburn (A) 1-34-05-06 306 321 4.90 Auburn (A) 1-34-05-07 387 418 8.01 Auburn (A) 1-34-05-08 515 537 4.27 Auburn (A) 1-34-05-09 298 312 4.70 Auburn (A) 1-34-05-10 412 446 8.25 Auburn (A) 1-34-05-11 282 302 7.09 Auburn (A) 1-34-05-12 295 343 16.27 Auburn (A) 1-34-05-13 435 465 6.90 Auburn (A) 1-34-06-01 402 417 3.73 Auburn (A) 1-34-06-02 537 569 5.96 Auburn (A) 1-34-06-03 637 686 7.69 Auburn (A) 1-34-06-04 439 465 5.92 Auburn (A) 1-34-06-05 546 577 5.68 Auburn (A) 1-34-06-06 392 417 6.38 Auburn (A) 1-34-06-07 488 522 6.97 Auburn (A) 1-34-06-08 610 647 6.07 Auburn (A) 1-34-06-09 523 572 9.37 Auburn (A) 1-34-06-10 463 493 6.48 Auburn (A) 1-34-06-11 228 245 7.46 Auburn (A) 1-34-07-01 474 499 5.27 Auburn (A) 1-34-07-02 469 499 6.40 Auburn (A) 1-34-07-03 391 411 5.12 Auburn (A) 1-34-07-04 529 547 3.40 Auburn (A) 1-34-07-05 522 559 7.09 Auburn (A) 1-34-07-06 265 284 7.17 Auburn (A) 1-34-07-07 345 362 4.93 Auburn (A) 1-34-07-08 416 439 5.53 Auburn (A) 1-34-07-09 630 671 6.51 Auburn (A) 1-34-07-10 485 507 4.54 Auburn (A) 1-34-07-11 201 211 4.98 Auburn (A) 80 33533 37389 11.50 Fairfield (C) 1-32-09-01 566 577 1.94
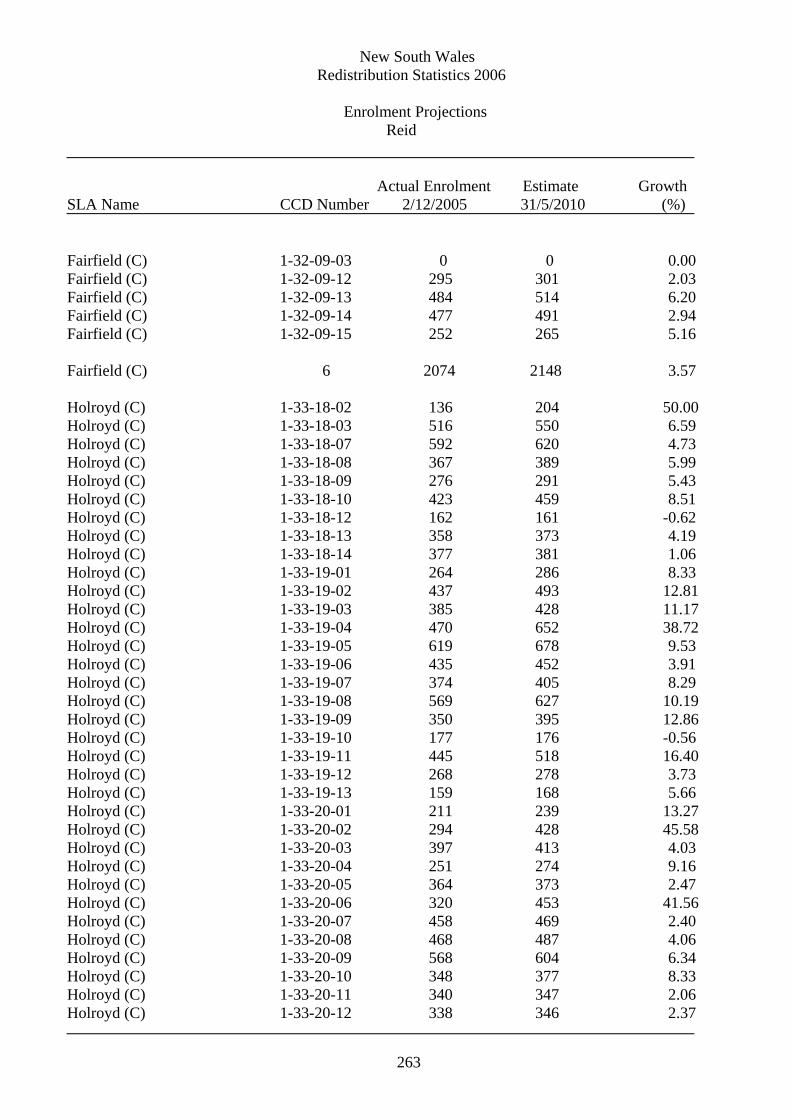
New South Wales Redistribution Statistics 2006
Enrolment Projections Reid
Actual Enrolment Estimate Growth SLA Name CCD Number 2/12/2005 31/5/2010 (%)
263
Holroyd (C) 1-33-19-11 445 518 16.40
Fairfield (C) 1-32-09-03 0 0 0.00 Fairfield (C) 1-32-09-12 295 301 2.03 Fairfield (C) 1-32-09-13 484 514 6.20 Fairfield (C) 1-32-09-14 477 491 2.94 Fairfield (C) 1-32-09-15 252 265 5.16 Fairfield (C) 6 2074 2148 3.57 Holroyd (C) 1-33-18-02 136 204 50.00 Holroyd (C) 1-33-18-03 516 550 6.59 Holroyd (C) 1-33-18-07 592 620 4.73 Holroyd (C) 1-33-18-08 367 389 5.99 Holroyd (C) 1-33-18-09 276 291 5.43 Holroyd (C) 1-33-18-10 423 459 8.51 Holroyd (C) 1-33-18-12 162 161 -0.62 Holroyd (C) 1-33-18-13 358 373 4.19 Holroyd (C) 1-33-18-14 377 381 1.06 Holroyd (C) 1-33-19-01 264 286 8.33 Holroyd (C) 1-33-19-02 437 493 12.81 Holroyd (C) 1-33-19-03 385 428 11.17 Holroyd (C) 1-33-19-04 470 652 38.72 Holroyd (C) 1-33-19-05 619 678 9.53 Holroyd (C) 1-33-19-06 435 452 3.91 Holroyd (C) 1-33-19-07 374 405 8.29 Holroyd (C) 1-33-19-08 569 627 10.19 Holroyd (C) 1-33-19-09 350 395 12.86 Holroyd (C) 1-33-19-10 177 176 -0.56
Holroyd (C) 1-33-19-12 268 278 3.73 Holroyd (C) 1-33-19-13 159 168 5.66 Holroyd (C) 1-33-20-01 211 239 13.27 Holroyd (C) 1-33-20-02 294 428 45.58 Holroyd (C) 1-33-20-03 397 413 4.03 Holroyd (C) 1-33-20-04 251 274 9.16 Holroyd (C) 1-33-20-05 364 373 2.47 Holroyd (C) 1-33-20-06 320 453 41.56 Holroyd (C) 1-33-20-07 458 469 2.40 Holroyd (C) 1-33-20-08 468 487 4.06 Holroyd (C) 1-33-20-09 568 604 6.34 Holroyd (C) 1-33-20-10 348 377 8.33 Holroyd (C) 1-33-20-11 340 347 2.06 Holroyd (C) 1-33-20-12 338 346 2.37

New South Wales Redistribution Statistics 2006
Enrolment Projections Reid
Actual Enrolment Estimate Growth SLA Name CCD Number 2/12/2005 31/5/2010 (%)
264
Holroyd (C) 1-33-21-01 609 642 5.42 Holroyd (C) 1-33-21-02 531 576 8.47 Holroyd (C) 1-33-21-03 272 290 6.62 Holroyd (C) 1-33-21-04 409 418 2.20 Holroyd (C) 1-33-21-05 350 362 3.43 Holroyd (C) 1-33-21-06 407 423 3.93 Holroyd (C) 1-33-21-07 326 349 7.06 Holroyd (C) 1-33-21-08 486 520 7.00 Holroyd (C) 1-33-21-09 456 483 5.92 Holroyd (C) 1-33-21-10 467 481 3.00 Holroyd (C) 1-33-21-11 332 376 13.25 Holroyd (C) 1-33-21-12 308 328 6.49 Holroyd (C) 1-33-22-05 401 405 1.00 Holroyd (C) 1-33-22-07 316 327 3.48 Holroyd (C) 1-33-22-08 333 348 4.50 Holroyd (C) 1-33-22-09 257 296 15.18 Holroyd (C) 1-33-22-10 317 346 9.15 Holroyd (C) 1-33-22-12 344 370 7.56 Holroyd (C) 1-33-22-13 522 534 2.30 Holroyd (C) 1-33-23-01 375 388 3.47 Holroyd (C) 1-33-23-02 291 324 11.34 Holroyd (C) 1-33-23-03 525 565 7.62 Holroyd (C) 1-33-23-04 503 531 5.57 Holroyd (C) 1-33-23-05 571 617 8.06 Holroyd (C) 1-33-23-06 450 528 17.33 Holroyd (C) 1-33-23-07 517 550 6.38 Holroyd (C) 1-33-23-08 262 266 1.53 Holroyd (C) 1-33-23-09 569 604 6.15 Holroyd (C) 1-33-23-10 391 400 2.30 Holroyd (C) 1-33-25-10 99 101 2.02 Holroyd (C) 64 24512 26542 8.28 NSW Water areas 1-34-01-13 0 0 0.00 NSW Water areas 1 0 0 0.00 Parramatta (C) 1-33-14-01 179 175 -2.23 Parramatta (C) 1-33-14-02 368 359 -2.45 Parramatta (C) 1-33-14-03 120 118 -1.67 Parramatta (C) 1-33-14-04 399 404 1.25 Parramatta (C) 1-33-14-05 218 226 3.67

New South Wales Redistribution Statistics 2006
Enrolment Projections Reid
Actual Enrolment Estimate Growth SLA Name CCD Number 2/12/2005 31/5/2010 (%)
265
Parramatta (C) 1-33-14-06 299 299 0.00 Parramatta (C) 1-33-14-07 188 188 0.00 Parramatta (C) 1-33-14-08 310 334 7.74 Parramatta (C) 1-33-14-09 237 238 0.42 Parramatta (C) 1-33-14-10 454 454 0.00 Parramatta (C) 1-33-14-11 363 370 1.93 Parramatta (C) 1-33-14-12 256 255 -0.39 Parramatta (C) 1-33-14-13 157 159 1.27 Parramatta (C) 1-33-14-14 528 554 4.92 Parramatta (C) 1-33-15-01 399 401 0.50 Parramatta (C) 1-33-15-02 505 510 0.99 Parramatta (C) 1-33-15-03 311 312 0.32 Parramatta (C) 1-33-15-04 443 471 6.32 Parramatta (C) 1-33-15-05 459 530 15.47 Parramatta (C) 1-33-15-06 267 267 0.00 Parramatta (C) 1-33-15-07 390 383 -1.79 Parramatta (C) 1-33-15-08 335 339 1.19 Parramatta (C) 1-33-15-09 315 320 1.59 Parramatta (C) 1-33-15-10 379 384 1.32 Parramatta (C) 1-33-15-11 691 707 2.32 Parramatta (C) 1-33-16-01 353 354 0.28 Parramatta (C) 1-33-16-02 633 720 13.74 Parramatta (C) 1-33-16-03 271 282 4.06 Parramatta (C) 1-33-16-04 461 501 8.68 Parramatta (C) 1-33-16-05 289 310 7.27 Parramatta (C) 1-33-16-06 313 311 -0.64 Parramatta (C) 1-33-16-07 630 702 11.43 Parramatta (C) 1-33-16-08 590 640 8.47 Parramatta (C) 1-33-16-09 318 320 0.63 Parramatta (C) 1-33-16-10 450 453 0.67 Parramatta (C) 1-33-16-11 281 316 12.46 Parramatta (C) 1-33-16-12 280 283 1.07 Parramatta (C) 1-33-16-13 280 275 -1.79 Parramatta (C) 1-33-17-01 371 380 2.43 Parramatta (C) 1-33-17-02 303 327 7.92 Parramatta (C) 1-33-17-03 360 364 1.11 Parramatta (C) 1-33-17-04 418 433 3.59 Parramatta (C) 1-33-17-05 598 597 -0.17 Parramatta (C) 1-33-17-06 499 537 7.62 Parramatta (C) 1-33-17-07 636 654 2.83 Parramatta (C) 1-33-17-08 489 494 1.02 Parramatta (C) 1-33-17-09 265 280 5.66

New South Wales Redistribution Statistics 2006
Enrolment Projections Reid
Actual Enrolment Estimate Growth SLA Name CCD Number 2/12/2005 31/5/2010 (%)
266
Parramatta (C) 1-33-17-10 474 483 1.90 Parramatta (C) 1-33-17-11 560 606 8.21 Parramatta (C) 49 18692 19379 3.68 Reid 200 78811 85458 8.43

New South Wales Redistribution Statistics 2006
Enrolment Projections Richmond
Actual Enrolment Estimate Growth SLA Name CCD Number 2/12/2005 31/5/2010 (%)
267
Ballina (A) 1-07-12-01 252 295 17.06 Ballina (A) 1-07-12-02 541 665 22.92 Ballina (A) 1-07-12-03 213 247 15.96 Ballina (A) 1-07-12-03 200 233 16.50 Ballina (A) 1-07-12-04 368 393 6.79 Ballina (A) 1-07-12-05 428 473 10.51 Ballina (A) 1-07-12-06 418 445 6.46 Ballina (A) 1-07-12-07 415 467 12.53 Ballina (A) 1-07-12-08 631 736 16.64 Ballina (A) 1-07-12-09 459 473 3.05 Ballina (A) 1-07-12-10 524 693 32.25 Ballina (A) 1-07-12-11 494 618 25.10 Ballina (A) 1-07-12-12 510 590 15.69 Ballina (A) 1-07-12-13 523 633 21.03 Ballina (A) 1-07-15-01 319 323 1.25 Ballina (A) 1-07-15-02 384 402 4.69 Ballina (A) 1-07-15-03 418 485 16.03 Ballina (A) 1-07-15-04 411 407 -0.97 Ballina (A) 1-07-15-05 332 338 1.81 Ballina (A) 1-07-15-06 541 534 -1.29 Ballina (A) 1-07-15-07 557 559 0.36 Ballina (A) 1-07-15-13 282 300 6.38 Ballina (A) 1-07-15-14 279 288 3.23 Ballina (A) 1-07-18-01 369 379 2.71 Ballina (A) 1-07-18-02 394 449 13.96 Ballina (A) 1-07-18-03 375 551 46.93 Ballina (A) 1-07-18-04 283 276 -2.47 Ballina (A) 1-07-18-05 396 416 5.05 Ballina (A) 1-07-18-06 398 481 20.85 Ballina (A) 1-07-18-07 375 387 3.20 Ballina (A) 1-07-18-08 490 535 9.18 Ballina (A) 1-07-18-09 542 546 0.74 Ballina (A) 32 13121 14617 11.40 Byron (A) 1-07-08-01 264 296 12.12 Byron (A) 1-07-08-02 709 755 6.49 Byron (A) 1-07-08-03 223 225 0.90 Byron (A) 1-07-08-04 345 365 5.80 Byron (A) 1-07-08-05 68 58 -14.71 Byron (A) 1-07-08-06 213 234 9.86 Byron (A) 1-07-08-07 486 535 10.08
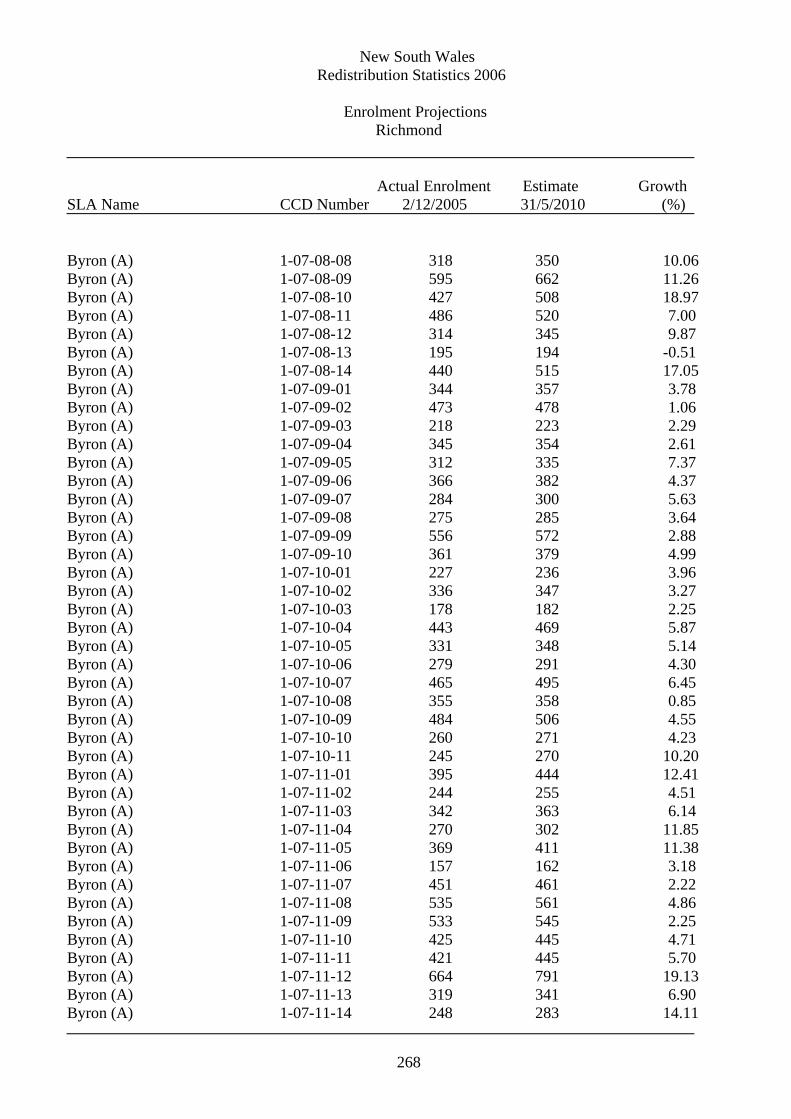
New South Wales Redistribution Statistics 2006
Enrolment Projections Richmond
Actual Enrolment Estimate Growth SLA Name CCD Number 2/12/2005 31/5/2010 (%)
268
Byron (A) 1-07-08-08 318 350 10.06 Byron (A) 1-07-08-09 595 662 11.26 Byron (A) 1-07-08-10 427 508 18.97 Byron (A) 1-07-08-11 486 520 7.00 Byron (A) 1-07-08-12 314 345 9.87 Byron (A) 1-07-08-13 195 194 -0.51 Byron (A) 1-07-08-14 440 515 17.05 Byron (A) 1-07-09-01 344 357 3.78 Byron (A) 1-07-09-02 473 478 1.06 Byron (A) 1-07-09-03 218 223 2.29 Byron (A) 1-07-09-04 345 354 2.61 Byron (A) 1-07-09-05 312 335 7.37 Byron (A) 1-07-09-06 366 382 4.37 Byron (A) 1-07-09-07 284 300 5.63 Byron (A) 1-07-09-08 275 285 3.64 Byron (A) 1-07-09-09 556 572 2.88 Byron (A) 1-07-09-10 361 379 4.99 Byron (A) 1-07-10-01 227 236 3.96 Byron (A) 1-07-10-02 336 347 3.27 Byron (A) 1-07-10-03 178 182 2.25 Byron (A) 1-07-10-04 443 469 5.87 Byron (A) 1-07-10-05 331 348 5.14 Byron (A) 1-07-10-06 279 291 4.30 Byron (A) 1-07-10-07 465 495 6.45 Byron (A) 1-07-10-08 355 358 0.85 Byron (A) 1-07-10-09 484 506 4.55 Byron (A) 1-07-10-10 260 271 4.23 Byron (A) 1-07-10-11 245 270 10.20 Byron (A) 1-07-11-01 395 444 12.41 Byron (A) 1-07-11-02 244 255 4.51 Byron (A) 1-07-11-03 342 363 6.14 Byron (A) 1-07-11-04 270 302 11.85 Byron (A) 1-07-11-05 369 411 11.38 Byron (A) 1-07-11-06 157 162 3.18 Byron (A) 1-07-11-07 451 461 2.22 Byron (A) 1-07-11-08 535 561 4.86 Byron (A) 1-07-11-09 533 545 2.25 Byron (A) 1-07-11-10 425 445 4.71 Byron (A) 1-07-11-11 421 445 5.70 Byron (A) 1-07-11-12 664 791 19.13 Byron (A) 1-07-11-13 319 341 6.90 Byron (A) 1-07-11-14 248 283 14.11

New South Wales Redistribution Statistics 2006
Enrolment Projections Richmond
Actual Enrolment Estimate Growth SLA Name CCD Number 2/12/2005 31/5/2010 (%)
269
Byron (A) 1-07-11-15 503 565 12.33 Byron (A) 1-07-11-16 407 416 2.21 Byron (A) 1-07-11-17 229 238 3.93 Byron (A) 1-07-11-18 486 595 22.43 Byron (A) 53 19218 20623 7.31 NSW Water areas 1-07-03-11 0 0 0.00 NSW Water areas 1-07-16-09 0 0 0.00 NSW Water areas 1-07-16-10 0 0 0.00 NSW Water areas 3 0 0 0.00 Tweed (A) - Pt A 1-07-01-01 189 213 12.70 Tweed (A) - Pt A 1-07-01-02 242 259 7.02 Tweed (A) - Pt A 1-07-01-03 300 364 21.33 Tweed (A) - Pt A 1-07-01-04 148 181 22.30 Tweed (A) - Pt A 1-07-01-05 293 294 0.34 Tweed (A) - Pt A 1-07-01-06 562 572 1.78 Tweed (A) - Pt A 1-07-01-07 499 537 7.62 Tweed (A) - Pt A 1-07-01-08 108 280 159.26 Tweed (A) - Pt A 1-07-01-09 283 345 21.91 Tweed (A) - Pt A 1-07-01-10 299 296 -1.00 Tweed (A) - Pt A 1-07-01-11 289 381 31.83 Tweed (A) - Pt A 1-07-01-12 416 416 0.00 Tweed (A) - Pt A 1-07-02-01 423 428 1.18 Tweed (A) - Pt A 1-07-02-02 482 597 23.86 Tweed (A) - Pt A 1-07-02-03 344 355 3.20 Tweed (A) - Pt A 1-07-02-04 1007 1083 7.55 Tweed (A) - Pt A 1-07-02-05 275 277 0.73 Tweed (A) - Pt A 1-07-02-06 287 293 2.09 Tweed (A) - Pt A 1-07-02-07 201 205 1.99 Tweed (A) - Pt A 1-07-02-08 602 602 0.00 Tweed (A) - Pt A 1-07-02-09 437 448 2.52 Tweed (A) - Pt A 1-07-02-10 334 338 1.20 Tweed (A) - Pt A 1-07-02-11 516 528 2.33 Tweed (A) - Pt A 1-07-02-12 371 380 2.43 Tweed (A) - Pt A 1-07-02-13 274 287 4.74 Tweed (A) - Pt A 1-07-03-01 648 884 36.42 Tweed (A) - Pt A 1-07-03-02 492 575 16.87 Tweed (A) - Pt A 1-07-03-03 316 339 7.28 Tweed (A) - Pt A 1-07-03-04 141 143 1.42

New South Wales Redistribution Statistics 2006
Enrolment Projections Richmond
Actual Enrolment Estimate Growth SLA Name CCD Number 2/12/2005 31/5/2010 (%)
270
Tweed (A) - Pt A 1-07-03-05 274 298 8.76 Tweed (A) - Pt A 1-07-03-06 305 318 4.26 Tweed (A) - Pt A 1-07-03-07 465 528 13.55 Tweed (A) - Pt A 1-07-03-08 382 393 2.88 Tweed (A) - Pt A 1-07-03-09 476 502 5.46 Tweed (A) - Pt A 1-07-03-10 225 230 2.22 Tweed (A) - Pt A 1-07-03-12 345 352 2.03 Tweed (A) - Pt A 1-07-03-13 371 382 2.96 Tweed (A) - Pt A 1-07-03-14 431 460 6.73 Tweed (A) - Pt A 1-07-03-15 322 342 6.21 Tweed (A) - Pt A 1-07-03-16 485 529 9.07 Tweed (A) - Pt A 1-07-04-01 372 397 6.72 Tweed (A) - Pt A 1-07-04-02 964 980 1.66 Tweed (A) - Pt A 1-07-04-03 245 275 12.24 Tweed (A) - Pt A 1-07-04-04 218 227 4.13 Tweed (A) - Pt A 1-07-04-05 401 430 7.23 Tweed (A) - Pt A 1-07-04-06 373 387 3.75 Tweed (A) - Pt A 1-07-04-07 399 406 1.75 Tweed (A) - Pt A 1-07-04-08 386 405 4.92 Tweed (A) - Pt A 1-07-04-09 243 380 56.38 Tweed (A) - Pt A 1-07-04-10 425 444 4.47 Tweed (A) - Pt A 1-07-04-11 420 431 2.62 Tweed (A) - Pt A 1-07-04-12 237 274 15.61 Tweed (A) - Pt A 1-07-04-13 671 672 0.15 Tweed (A) - Pt A 1-07-04-14 579 600 3.63 Tweed (A) - Pt A 1-07-16-01 373 400 7.24 Tweed (A) - Pt A 1-07-16-02 362 358 -1.10 Tweed (A) - Pt A 1-07-16-03 239 256 7.11 Tweed (A) - Pt A 1-07-16-04 275 296 7.64 Tweed (A) - Pt A 1-07-16-05 307 355 15.64 Tweed (A) - Pt A 1-07-16-06 1026 1041 1.46 Tweed (A) - Pt A 1-07-16-07 972 1093 12.45 Tweed (A) - Pt A 1-07-16-08 427 880 106.09 Tweed (A) - Pt A 1-07-16-11 428 432 0.93 Tweed (A) - Pt A 1-07-16-12 605 658 8.76 Tweed (A) - Pt A 1-07-16-13 1250 2008 60.64 Tweed (A) - Pt A 1-07-16-14 1142 1354 18.56 Tweed (A) - Pt A 1-07-16-15 726 1260 73.55 Tweed (A) - Pt A 1-07-16-16 548 577 5.29 Tweed (A) - Pt A 1-07-16-17 311 324 4.18 Tweed (A) - Pt A 1-07-19-01 510 511 0.20 Tweed (A) - Pt A 1-07-19-02 407 477 17.20

New South Wales Redistribution Statistics 2006
Enrolment Projections Richmond
Actual Enrolment Estimate Growth SLA Name CCD Number 2/12/2005 31/5/2010 (%)
271
Tweed (A) - Pt A 1-07-19-03 497 547 10.06 Tweed (A) - Pt A 1-07-19-04 636 677 6.45 Tweed (A) - Pt A 1-07-19-05 494 598 21.05 Tweed (A) - Pt A 1-07-19-06 487 572 17.45 Tweed (A) - Pt A 1-07-19-07 397 408 2.77 Tweed (A) - Pt A 1-07-19-08 527 541 2.66 Tweed (A) - Pt A 1-07-19-09 750 942 25.60 Tweed (A) - Pt A 1-07-19-10 482 502 4.15 Tweed (A) - Pt A 79 34970 39609 13.27 Tweed (A) - Pt B 1-07-05-01 511 537 5.09 Tweed (A) - Pt B 1-07-05-02 505 564 11.68 Tweed (A) - Pt B 1-07-05-03 246 250 1.63 Tweed (A) - Pt B 1-07-05-04 263 273 3.80 Tweed (A) - Pt B 1-07-05-05 248 259 4.44 Tweed (A) - Pt B 1-07-05-06 83 86 3.61 Tweed (A) - Pt B 1-07-05-07 307 334 8.79 Tweed (A) - Pt B 1-07-05-08 741 799 7.83 Tweed (A) - Pt B 1-07-05-09 249 263 5.62 Tweed (A) - Pt B 1-07-06-01 171 182 6.43 Tweed (A) - Pt B 1-07-06-02 245 257 4.90 Tweed (A) - Pt B 1-07-06-03 165 168 1.82 Tweed (A) - Pt B 1-07-06-04 220 228 3.64 Tweed (A) - Pt B 1-07-06-05 394 399 1.27 Tweed (A) - Pt B 1-07-06-06 407 416 2.21 Tweed (A) - Pt B 1-07-06-07 451 467 3.55 Tweed (A) - Pt B 1-07-06-08 459 471 2.61 Tweed (A) - Pt B 1-07-06-09 248 247 -0.40 Tweed (A) - Pt B 1-07-06-10 452 477 5.53 Tweed (A) - Pt B 1-07-06-11 309 318 2.91 Tweed (A) - Pt B 1-07-06-12 568 579 1.94 Tweed (A) - Pt B 1-07-06-13 949 1017 7.17 Tweed (A) - Pt B 1-07-06-14 250 256 2.40 Tweed (A) - Pt B 1-07-07-01 486 509 4.73 Tweed (A) - Pt B 1-07-07-02 624 755 20.99 Tweed (A) - Pt B 1-07-07-03 293 305 4.10 Tweed (A) - Pt B 1-07-07-04 267 300 12.36 Tweed (A) - Pt B 1-07-07-05 138 143 3.62 Tweed (A) - Pt B 1-07-07-06 459 479 4.36 Tweed (A) - Pt B 1-07-07-07 250 261 4.40 Tweed (A) - Pt B 1-07-07-08 148 151 2.03

New South Wales Redistribution Statistics 2006
Enrolment Projections Richmond
Actual Enrolment Estimate Growth SLA Name CCD Number 2/12/2005 31/5/2010 (%)
272
Tweed (A) - Pt B 1-07-07-09 554 610 10.11 Tweed (A) - Pt B 1-07-07-10 492 521 5.89 Tweed (A) - Pt B 1-07-07-11 173 181 4.62 Tweed (A) - Pt B 1-07-07-12 200 202 1.00 Tweed (A) - Pt B 1-07-17-01 255 266 4.31 Tweed (A) - Pt B 1-07-17-02 624 1021 63.62 Tweed (A) - Pt B 1-07-17-03 335 368 9.85 Tweed (A) - Pt B 1-07-17-04 558 653 17.03 Tweed (A) - Pt B 1-07-17-05 455 516 13.41 Tweed (A) - Pt B 1-07-17-06 274 304 10.95 Tweed (A) - Pt B 1-07-17-07 451 451 0.00 Tweed (A) - Pt B 1-07-17-08 500 645 29.00 Tweed (A) - Pt B 1-07-17-09 369 379 2.71 Tweed (A) - Pt B 1-07-17-10 422 450 6.64 Tweed (A) - Pt B 1-07-17-11 433 704 62.59 Tweed (A) - Pt B 1-07-17-12 347 368 6.05 Tweed (A) - Pt B 1-07-17-13 718 913 27.16 Tweed (A) - Pt B 1-07-17-14 286 295 3.15 Tweed (A) - Pt B 1-07-17-15 357 363 1.68 Tweed (A) - Pt B 50 18909 20960 10.85 Richmond 217 86218 95809 11.12

New South Wales Redistribution Statistics 2006
Enrolment Projections Riverina
Actual Enrolment Estimate Growth SLA Name CCD Number 2/12/2005 31/5/2010 (%)
273
Carrathool (A) 1-01-05-01 77 75 -2.60 Carrathool (A) 1-01-05-02 40 38 -5.00 Carrathool (A) 1-01-05-03 165 179 8.48 Carrathool (A) 1-01-05-04 182 188 3.30 Carrathool (A) 1-01-05-05 151 153 1.32 Carrathool (A) 1-01-05-06 156 156 0.00 Carrathool (A) 6 771 789 2.33 Coolamon (A) 1-15-10-01 283 290 2.47 Coolamon (A) 1-15-10-02 141 142 0.71 Coolamon (A) 1-15-10-03 75 71 -5.33 Coolamon (A) 1-15-10-04 141 144 2.13 Coolamon (A) 1-15-10-05 451 476 5.54 Coolamon (A) 1-15-10-06 111 125 12.61 Coolamon (A) 1-15-10-07 83 84 1.20 Coolamon (A) 1-15-10-08 132 131 -0.76 Coolamon (A) 1-15-10-09 234 258 10.26 Coolamon (A) 1-15-10-10 503 531 5.57 Coolamon (A) 1-15-10-11 488 509 4.30 Coolamon (A) 1-15-10-12 136 149 9.56 Coolamon (A) 1-15-10-13 111 111 0.00 Coolamon (A) 13 2889 3021 4.57 Cootamundra (A) 1-15-13-01 113 108 -4.42 Cootamundra (A) 1-15-13-02 322 337 4.66 Cootamundra (A) 1-15-13-03 182 177 -2.75 Cootamundra (A) 1-15-13-04 271 295 8.86 Cootamundra (A) 1-15-13-05 310 351 13.23 Cootamundra (A) 1-15-13-06 108 104 -3.70 Cootamundra (A) 1-15-14-01 374 381 1.87 Cootamundra (A) 1-15-14-02 372 411 10.48 Cootamundra (A) 1-15-14-03 390 388 -0.51 Cootamundra (A) 1-15-14-04 223 226 1.35 Cootamundra (A) 1-15-14-05 434 432 -0.46 Cootamundra (A) 1-15-14-06 325 328 0.92 Cootamundra (A) 1-15-14-07 491 504 2.65 Cootamundra (A) 1-15-14-08 166 169 1.81 Cootamundra (A) 1-15-14-09 383 380 -0.78 Cootamundra (A) 1-15-14-10 411 424 3.16 Cootamundra (A) 1-15-14-11 474 493 4.01

New South Wales Redistribution Statistics 2006
Enrolment Projections Riverina
Actual Enrolment Estimate Growth SLA Name CCD Number 2/12/2005 31/5/2010 (%)
274
Cootamundra (A) 1-15-14-12 183 187 2.19 Cootamundra (A) 18 5532 5695 2.95 Griffith (C) 1-01-14-01 474 524 10.55 Griffith (C) 1-01-14-02 323 366 13.31 Griffith (C) 1-01-14-03 169 178 5.33 Griffith (C) 1-01-14-04 151 159 5.30 Griffith (C) 1-01-14-05 316 320 1.27 Griffith (C) 1-01-14-06 335 355 5.97 Griffith (C) 1-01-14-07 199 215 8.04 Griffith (C) 1-01-14-08 213 224 5.16 Griffith (C) 1-01-14-09 167 173 3.59 Griffith (C) 1-01-14-10 77 81 5.19 Griffith (C) 1-01-14-11 412 440 6.80 Griffith (C) 1-01-15-01 269 290 7.81 Griffith (C) 1-01-15-02 840 1075 27.98 Griffith (C) 1-01-15-03 471 493 4.67 Griffith (C) 1-01-15-04 233 239 2.58 Griffith (C) 1-01-15-05 531 549 3.39 Griffith (C) 1-01-15-06 344 367 6.69 Griffith (C) 1-01-15-07 334 342 2.40 Griffith (C) 1-01-15-08 245 252 2.86 Griffith (C) 1-01-15-09 420 424 0.95 Griffith (C) 1-01-15-10 351 356 1.42 Griffith (C) 1-01-15-11 578 599 3.63 Griffith (C) 1-01-15-12 533 554 3.94 Griffith (C) 1-01-16-01 223 230 3.14 Griffith (C) 1-01-16-02 387 402 3.88 Griffith (C) 1-01-16-03 339 351 3.54 Griffith (C) 1-01-16-04 355 363 2.25 Griffith (C) 1-01-16-05 295 309 4.75 Griffith (C) 1-01-16-06 41 41 0.00 Griffith (C) 1-01-16-07 405 461 13.83 Griffith (C) 1-01-16-08 285 288 1.05 Griffith (C) 1-01-16-09 367 376 2.45 Griffith (C) 1-01-16-10 198 203 2.53 Griffith (C) 1-01-16-11 720 965 34.03 Griffith (C) 1-01-16-12 491 509 3.67 Griffith (C) 1-01-16-13 643 794 23.48 Griffith (C) 1-01-17-01 187 194 3.74 Griffith (C) 1-01-17-02 298 305 2.35

New South Wales Redistribution Statistics 2006
Enrolment Projections Riverina
Actual Enrolment Estimate Growth SLA Name CCD Number 2/12/2005 31/5/2010 (%)
275
Griffith (C) 1-01-17-03 162 163 0.62 Griffith (C) 1-01-17-04 249 250 0.40 Griffith (C) 1-01-17-05 491 530 7.94 Griffith (C) 1-01-17-06 387 412 6.46 Griffith (C) 1-01-17-07 209 215 2.87 Griffith (C) 1-01-17-08 238 243 2.10 Griffith (C) 44 14955 16179 8.18 Gundagai (A) 1-15-24-01 134 147 9.70 Gundagai (A) 1-15-24-02 168 174 3.57 Gundagai (A) 1-15-24-03 134 134 0.00 Gundagai (A) 1-15-24-04 104 106 1.92 Gundagai (A) 1-15-24-05 122 125 2.46 Gundagai (A) 1-15-24-06 281 301 7.12 Gundagai (A) 1-15-24-07 474 499 5.27 Gundagai (A) 1-15-24-08 345 356 3.19 Gundagai (A) 1-15-24-09 337 337 0.00 Gundagai (A) 1-15-24-10 120 121 0.83 Gundagai (A) 1-15-24-11 150 147 -2.00 Gundagai (A) 1-15-24-12 252 252 0.00 Gundagai (A) 12 2621 2699 2.98 Hay (A) 1-01-03-01 65 69 6.15 Hay (A) 1-01-03-02 121 123 1.65 Hay (A) 1-01-03-03 128 130 1.56 Hay (A) 1-01-03-04 117 109 -6.84 Hay (A) 1-01-03-05 67 67 0.00 Hay (A) 1-01-03-06 75 79 5.33 Hay (A) 1-01-03-07 343 344 0.29 Hay (A) 1-01-03-08 281 285 1.42 Hay (A) 1-01-03-09 318 326 2.52 Hay (A) 1-01-03-10 445 474 6.52 Hay (A) 1-01-03-11 352 349 -0.85 Hay (A) 11 2312 2355 1.86 Junee (A) 1-15-11-01 115 119 3.48 Junee (A) 1-15-11-02 111 105 -5.41 Junee (A) 1-15-11-03 135 140 3.70 Junee (A) 1-15-11-04 96 99 3.12

New South Wales Redistribution Statistics 2006
Enrolment Projections Riverina
Actual Enrolment Estimate Growth SLA Name CCD Number 2/12/2005 31/5/2010 (%)
276
Junee (A) 1-15-11-05 154 152 -1.30 Junee (A) 1-15-11-06 175 187 6.86 Junee (A) 1-15-11-07 225 222 -1.33 Junee (A) 1-15-12-01 533 559 4.88 Junee (A) 1-15-12-02 352 376 6.82 Junee (A) 1-15-12-03 439 449 2.28 Junee (A) 1-15-12-04 338 358 5.92 Junee (A) 1-15-12-05 457 479 4.81 Junee (A) 1-15-12-06 431 454 5.34 Junee (A) 13 3561 3699 3.88 Leeton (A) 1-01-18-01 236 268 13.56 Leeton (A) 1-01-18-02 377 393 4.24 Leeton (A) 1-01-18-03 354 369 4.24 Leeton (A) 1-01-18-04 337 334 -0.89 Leeton (A) 1-01-18-05 332 337 1.51 Leeton (A) 1-01-18-06 662 692 4.53 Leeton (A) 1-01-18-07 407 412 1.23 Leeton (A) 1-01-18-08 460 480 4.35 Leeton (A) 1-01-18-09 136 135 -0.74 Leeton (A) 1-01-18-10 422 441 4.50 Leeton (A) 1-01-18-11 443 451 1.81 Leeton (A) 1-01-18-12 368 412 11.96 Leeton (A) 1-01-19-01 68 70 2.94 Leeton (A) 1-01-19-02 243 250 2.88 Leeton (A) 1-01-19-03 177 180 1.69 Leeton (A) 1-01-19-04 220 236 7.27 Leeton (A) 1-01-19-05 319 324 1.57 Leeton (A) 1-01-19-06 362 381 5.25 Leeton (A) 1-01-19-07 143 148 3.50 Leeton (A) 1-01-19-08 126 137 8.73 Leeton (A) 1-01-19-09 102 103 0.98 Leeton (A) 1-01-19-10 273 285 4.40 Leeton (A) 1-01-19-11 147 159 8.16 Leeton (A) 1-01-19-12 455 530 16.48 Leeton (A) 1-01-19-13 102 109 6.86 Leeton (A) 25 7271 7636 5.02 Murrumbidgee (A) 1-01-13-01 46 48 4.35 Murrumbidgee (A) 1-01-13-02 130 126 -3.08

New South Wales Redistribution Statistics 2006
Enrolment Projections Riverina
Actual Enrolment Estimate Growth SLA Name CCD Number 2/12/2005 31/5/2010 (%)
277
Murrumbidgee (A) 1-01-13-03 443 465 4.97 Murrumbidgee (A) 1-01-13-04 199 206 3.52 Murrumbidgee (A) 1-01-13-05 616 665 7.95 Murrumbidgee (A) 1-01-13-06 115 123 6.96 Murrumbidgee (A) 6 1549 1633 5.42 NSW Water areas 1-16-21-10 0 0 0.00 NSW Water areas 1 0 0 0.00 Narrandera (A) 1-01-20-01 374 384 2.67 Narrandera (A) 1-01-20-02 244 246 0.82 Narrandera (A) 1-01-20-03 512 535 4.49 Narrandera (A) 1-01-20-04 339 336 -0.88 Narrandera (A) 1-01-20-05 477 477 0.00 Narrandera (A) 1-01-20-06 98 100 2.04 Narrandera (A) 1-01-20-07 278 303 8.99 Narrandera (A) 1-01-20-08 276 275 -0.36 Narrandera (A) 1-01-20-09 230 234 1.74 Narrandera (A) 1-01-21-01 159 160 0.63 Narrandera (A) 1-01-21-02 132 136 3.03 Narrandera (A) 1-01-21-03 92 94 2.17 Narrandera (A) 1-01-21-04 83 80 -3.61 Narrandera (A) 1-01-21-05 316 330 4.43 Narrandera (A) 1-01-21-06 237 251 5.91 Narrandera (A) 1-01-22-01 103 104 0.97 Narrandera (A) 1-01-22-02 264 260 -1.52 Narrandera (A) 1-01-22-03 98 91 -7.14 Narrandera (A) 1-01-22-04 73 68 -6.85 Narrandera (A) 19 4385 4464 1.80 Temora (A) 1-15-08-01 164 156 -4.88 Temora (A) 1-15-08-02 213 213 0.00 Temora (A) 1-15-08-03 171 166 -2.92 Temora (A) 1-15-08-04 140 153 9.29 Temora (A) 1-15-08-05 101 101 0.00 Temora (A) 1-15-08-06 96 97 1.04 Temora (A) 1-15-08-07 210 233 10.95 Temora (A) 1-15-08-08 164 181 10.37 Temora (A) 1-15-09-01 473 513 8.46

New South Wales Redistribution Statistics 2006
Enrolment Projections Riverina
Actual Enrolment Estimate Growth SLA Name CCD Number 2/12/2005 31/5/2010 (%)
278
Temora (A) 1-15-09-02 653 685 4.90 Temora (A) 1-15-09-03 501 514 2.59 Temora (A) 1-15-09-04 566 577 1.94 Temora (A) 1-15-09-05 376 390 3.72 Temora (A) 1-15-09-06 512 547 6.84 Temora (A) 14 4340 4526 4.29 Wagga Wagga (C) - Pt A 1-16-14-05 443 481 8.58 Wagga Wagga (C) - Pt A 1-16-14-08 114 123 7.89 Wagga Wagga (C) - Pt A 1-16-14-09 210 284 35.24 Wagga Wagga (C) - Pt A 1-16-14-10 622 723 16.24 Wagga Wagga (C) - Pt A 1-16-14-11 308 353 14.61 Wagga Wagga (C) - Pt A 1-16-14-12 42 43 2.38 Wagga Wagga (C) - Pt A 1-16-14-13 284 287 1.06 Wagga Wagga (C) - Pt A 1-16-15-01 142 137 -3.52 Wagga Wagga (C) - Pt A 1-16-15-02 376 378 0.53 Wagga Wagga (C) - Pt A 1-16-15-03 209 211 0.96 Wagga Wagga (C) - Pt A 1-16-15-04 165 161 -2.42 Wagga Wagga (C) - Pt A 1-16-15-05 152 156 2.63 Wagga Wagga (C) - Pt A 1-16-15-06 350 363 3.71 Wagga Wagga (C) - Pt A 1-16-15-07 168 169 0.60 Wagga Wagga (C) - Pt A 1-16-15-08 321 327 1.87 Wagga Wagga (C) - Pt A 1-16-15-09 432 440 1.85 Wagga Wagga (C) - Pt A 1-16-15-10 481 487 1.25 Wagga Wagga (C) - Pt A 1-16-15-11 131 126 -3.82 Wagga Wagga (C) - Pt A 1-16-15-12 209 206 -1.44 Wagga Wagga (C) - Pt A 1-16-16-01 343 497 44.90 Wagga Wagga (C) - Pt A 1-16-16-02 201 191 -4.98 Wagga Wagga (C) - Pt A 1-16-16-03 217 226 4.15 Wagga Wagga (C) - Pt A 1-16-16-04 439 431 -1.82 Wagga Wagga (C) - Pt A 1-16-16-05 459 456 -0.65 Wagga Wagga (C) - Pt A 1-16-16-06 338 339 0.30 Wagga Wagga (C) - Pt A 1-16-16-07 92 89 -3.26 Wagga Wagga (C) - Pt A 1-16-16-08 324 335 3.40 Wagga Wagga (C) - Pt A 1-16-16-09 440 454 3.18 Wagga Wagga (C) - Pt A 1-16-16-10 250 277 10.80 Wagga Wagga (C) - Pt A 1-16-16-11 374 458 22.46 Wagga Wagga (C) - Pt A 1-16-17-01 236 237 0.42 Wagga Wagga (C) - Pt A 1-16-17-02 522 523 0.19 Wagga Wagga (C) - Pt A 1-16-17-03 504 508 0.79 Wagga Wagga (C) - Pt A 1-16-17-04 362 360 -0.55

New South Wales Redistribution Statistics 2006
Enrolment Projections Riverina
Actual Enrolment Estimate Growth SLA Name CCD Number 2/12/2005 31/5/2010 (%)
279
Wagga Wagga (C) - Pt A 1-16-17-05 237 238 0.42 Wagga Wagga (C) - Pt A 1-16-17-06 249 248 -0.40 Wagga Wagga (C) - Pt A 1-16-17-07 267 278 4.12 Wagga Wagga (C) - Pt A 1-16-17-08 215 220 2.33 Wagga Wagga (C) - Pt A 1-16-17-09 233 238 2.15 Wagga Wagga (C) - Pt A 1-16-17-10 261 269 3.07 Wagga Wagga (C) - Pt A 1-16-17-11 545 549 0.73 Wagga Wagga (C) - Pt A 1-16-18-01 415 417 0.48 Wagga Wagga (C) - Pt A 1-16-18-02 240 237 -1.25 Wagga Wagga (C) - Pt A 1-16-18-03 401 407 1.50 Wagga Wagga (C) - Pt A 1-16-18-04 484 492 1.65 Wagga Wagga (C) - Pt A 1-16-18-05 297 300 1.01 Wagga Wagga (C) - Pt A 1-16-18-06 515 517 0.39 Wagga Wagga (C) - Pt A 1-16-18-07 380 393 3.42 Wagga Wagga (C) - Pt A 1-16-18-08 313 321 2.56 Wagga Wagga (C) - Pt A 1-16-18-09 423 431 1.89 Wagga Wagga (C) - Pt A 1-16-18-10 1126 1509 34.01 Wagga Wagga (C) - Pt A 1-16-18-11 353 385 9.07 Wagga Wagga (C) - Pt A 1-16-18-12 367 379 3.27 Wagga Wagga (C) - Pt A 1-16-19-01 150 149 -0.67 Wagga Wagga (C) - Pt A 1-16-19-02 366 371 1.37 Wagga Wagga (C) - Pt A 1-16-19-03 297 296 -0.34 Wagga Wagga (C) - Pt A 1-16-19-04 197 195 -1.02 Wagga Wagga (C) - Pt A 1-16-19-05 447 457 2.24 Wagga Wagga (C) - Pt A 1-16-19-06 258 262 1.55 Wagga Wagga (C) - Pt A 1-16-19-07 430 431 0.23 Wagga Wagga (C) - Pt A 1-16-19-08 430 435 1.16 Wagga Wagga (C) - Pt A 1-16-19-09 389 395 1.54 Wagga Wagga (C) - Pt A 1-16-19-10 795 824 3.65 Wagga Wagga (C) - Pt A 1-16-19-11 1138 1481 30.14 Wagga Wagga (C) - Pt A 1-16-19-12 408 410 0.49 Wagga Wagga (C) - Pt A 1-16-19-13 190 188 -1.05 Wagga Wagga (C) - Pt A 1-16-20-01 356 355 -0.28 Wagga Wagga (C) - Pt A 1-16-20-02 475 482 1.47 Wagga Wagga (C) - Pt A 1-16-20-03 290 291 0.34 Wagga Wagga (C) - Pt A 1-16-20-04 310 323 4.19 Wagga Wagga (C) - Pt A 1-16-20-05 545 611 12.11 Wagga Wagga (C) - Pt A 1-16-20-06 461 471 2.17 Wagga Wagga (C) - Pt A 1-16-20-07 200 204 2.00 Wagga Wagga (C) - Pt A 1-16-20-08 490 512 4.49 Wagga Wagga (C) - Pt A 1-16-20-09 476 480 0.84 Wagga Wagga (C) - Pt A 1-16-20-10 336 383 13.99

New South Wales Redistribution Statistics 2006
Enrolment Projections Riverina
Actual Enrolment Estimate Growth SLA Name CCD Number 2/12/2005 31/5/2010 (%)
280
Wagga Wagga (C) - Pt A 1-16-21-01 152 161 5.92 Wagga Wagga (C) - Pt A 1-16-21-02 84 80 -4.76 Wagga Wagga (C) - Pt A 1-16-21-03 351 352 0.28 Wagga Wagga (C) - Pt A 1-16-21-04 449 473 5.35 Wagga Wagga (C) - Pt A 1-16-21-05 526 515 -2.09 Wagga Wagga (C) - Pt A 1-16-21-06 394 396 0.51 Wagga Wagga (C) - Pt A 1-16-21-07 462 511 10.61 Wagga Wagga (C) - Pt A 1-16-21-08 292 294 0.68 Wagga Wagga (C) - Pt A 1-16-21-09 446 455 2.02 Wagga Wagga (C) - Pt A 1-16-21-11 287 281 -2.09 Wagga Wagga (C) - Pt A 1-16-21-12 452 537 18.81 Wagga Wagga (C) - Pt A 1-16-21-13 446 509 14.13 Wagga Wagga (C) - Pt A 1-16-21-14 338 339 0.30 Wagga Wagga (C) - Pt A 1-16-21-15 846 1087 28.49 Wagga Wagga (C) - Pt A 1-16-22-04 462 471 1.95 Wagga Wagga (C) - Pt A 1-16-22-05 181 174 -3.87 Wagga Wagga (C) - Pt A 1-16-22-12 125 126 0.80 Wagga Wagga (C) - Pt A 1-16-22-13 462 475 2.81 Wagga Wagga (C) - Pt A 1-16-22-15 311 351 12.86 Wagga Wagga (C) - Pt A 95 34081 36257 6.38 Wagga Wagga (C) - Pt B 1-16-14-01 153 156 1.96 Wagga Wagga (C) - Pt B 1-16-14-02 190 201 5.79 Wagga Wagga (C) - Pt B 1-16-14-03 260 264 1.54 Wagga Wagga (C) - Pt B 1-16-14-04 272 277 1.84 Wagga Wagga (C) - Pt B 1-16-14-06 323 339 4.95 Wagga Wagga (C) - Pt B 1-16-14-07 236 251 6.36 Wagga Wagga (C) - Pt B 1-16-22-01 239 250 4.60 Wagga Wagga (C) - Pt B 1-16-22-02 178 181 1.69 Wagga Wagga (C) - Pt B 1-16-22-03 235 244 3.83 Wagga Wagga (C) - Pt B 1-16-22-06 154 156 1.30 Wagga Wagga (C) - Pt B 1-16-22-07 118 121 2.54 Wagga Wagga (C) - Pt B 1-16-22-08 157 163 3.82 Wagga Wagga (C) - Pt B 1-16-22-09 142 150 5.63 Wagga Wagga (C) - Pt B 1-16-22-10 167 164 -1.80 Wagga Wagga (C) - Pt B 1-16-22-11 164 166 1.22 Wagga Wagga (C) - Pt B 1-16-22-14 168 160 -4.76 Wagga Wagga (C) - Pt B 16 3156 3243 2.76

New South Wales Redistribution Statistics 2006
Enrolment Projections Riverina
Actual Enrolment Estimate Growth SLA Name CCD Number 2/12/2005 31/5/2010 (%)
281
Riverina 293 87423 92196 5.46

New South Wales Redistribution Statistics 2006
Enrolment Projections Robertson
Actual Enrolment Estimate Growth SLA Name CCD Number 2/12/2005 31/5/2010 (%)
282
Gosford (C) 1-22-01-01 0 0 0.00 Gosford (C) 1-22-01-02 182 191 4.95 Gosford (C) 1-22-01-03 411 423 2.92 Gosford (C) 1-22-01-04 359 364 1.39 Gosford (C) 1-22-01-05 110 129 17.27 Gosford (C) 1-22-01-06 174 172 -1.15 Gosford (C) 1-22-01-07 134 138 2.99 Gosford (C) 1-22-01-08 236 277 17.37 Gosford (C) 1-22-01-09 261 258 -1.15 Gosford (C) 1-22-01-10 139 142 2.16 Gosford (C) 1-22-01-11 278 292 5.04 Gosford (C) 1-22-02-05 251 273 8.76 Gosford (C) 1-22-02-06 457 460 0.66 Gosford (C) 1-22-02-08 762 824 8.14 Gosford (C) 1-22-02-09 217 211 -2.76 Gosford (C) 1-22-02-12 4 4 0.00 Gosford (C) 1-22-04-07 303 289 -4.62 Gosford (C) 1-22-04-08 292 299 2.40 Gosford (C) 1-22-04-11 490 499 1.84 Gosford (C) 1-22-04-13 375 374 -0.27 Gosford (C) 1-22-05-01 379 393 3.69 Gosford (C) 1-22-05-02 143 141 -1.40 Gosford (C) 1-22-05-03 622 617 -0.80 Gosford (C) 1-22-05-04 333 352 5.71 Gosford (C) 1-22-05-05 413 437 5.81 Gosford (C) 1-22-05-06 359 384 6.96 Gosford (C) 1-22-05-07 388 579 49.23 Gosford (C) 1-22-05-08 371 703 89.49 Gosford (C) 1-22-05-09 374 431 15.24 Gosford (C) 1-22-05-10 641 742 15.76 Gosford (C) 1-22-05-11 284 318 11.97 Gosford (C) 1-22-06-01 357 356 -0.28 Gosford (C) 1-22-06-02 334 387 15.87 Gosford (C) 1-22-06-03 638 642 0.63 Gosford (C) 1-22-06-04 349 352 0.86 Gosford (C) 1-22-06-05 428 416 -2.80 Gosford (C) 1-22-06-06 530 635 19.81 Gosford (C) 1-22-06-07 563 601 6.75 Gosford (C) 1-22-06-08 376 425 13.03 Gosford (C) 1-22-06-09 231 256 10.82 Gosford (C) 1-22-06-10 299 395 32.11 Gosford (C) 1-22-06-11 339 346 2.06

New South Wales Redistribution Statistics 2006
Enrolment Projections Robertson
Actual Enrolment Estimate Growth SLA Name CCD Number 2/12/2005 31/5/2010 (%)
283
Gosford (C) 1-22-11-05 90 146 62.22
Gosford (C) 1-22-06-12 302 305 0.99 Gosford (C) 1-22-07-01 393 417 6.11 Gosford (C) 1-22-07-02 280 270 -3.57 Gosford (C) 1-22-07-03 717 711 -0.84 Gosford (C) 1-22-07-04 398 401 0.75 Gosford (C) 1-22-07-05 419 412 -1.67 Gosford (C) 1-22-07-06 685 1030 50.36 Gosford (C) 1-22-07-07 433 438 1.15 Gosford (C) 1-22-07-08 614 623 1.47 Gosford (C) 1-22-07-09 330 314 -4.85 Gosford (C) 1-22-07-10 767 750 -2.22 Gosford (C) 1-22-07-11 366 371 1.37 Gosford (C) 1-22-07-12 1083 1300 20.04 Gosford (C) 1-22-09-04 191 294 53.93 Gosford (C) 1-22-09-05 498 489 -1.81 Gosford (C) 1-22-09-06 370 387 4.59 Gosford (C) 1-22-09-07 224 236 5.36 Gosford (C) 1-22-09-12 367 389 5.99 Gosford (C) 1-22-09-13 210 202 -3.81 Gosford (C) 1-22-10-01 494 526 6.48 Gosford (C) 1-22-10-02 390 420 7.69 Gosford (C) 1-22-10-03 299 327 9.36 Gosford (C) 1-22-10-04 136 147 8.09 Gosford (C) 1-22-10-05 770 807 4.81 Gosford (C) 1-22-10-06 194 211 8.76 Gosford (C) 1-22-10-07 198 340 71.72 Gosford (C) 1-22-10-08 241 268 11.20 Gosford (C) 1-22-10-10 405 420 3.70 Gosford (C) 1-22-11-01 352 370 5.11 Gosford (C) 1-22-11-02 220 230 4.55 Gosford (C) 1-22-11-03 375 395 5.33 Gosford (C) 1-22-11-04 425 453 6.59
Gosford (C) 1-22-11-06 94 132 40.43 Gosford (C) 1-22-11-07 612 631 3.10 Gosford (C) 1-22-11-08 732 737 0.68 Gosford (C) 1-22-11-09 262 274 4.58 Gosford (C) 1-22-11-10 263 261 -0.76 Gosford (C) 1-22-12-01 395 406 2.78 Gosford (C) 1-22-12-02 380 389 2.37 Gosford (C) 1-22-12-03 317 332 4.73 Gosford (C) 1-22-12-04 392 420 7.14

New South Wales Redistribution Statistics 2006
Enrolment Projections Robertson
Actual Enrolment Estimate Growth SLA Name CCD Number 2/12/2005 31/5/2010 (%)
284
Gosford (C) 1-22-12-10 589 591 0.34
Gosford (C) 1-22-12-05 92 107 16.30 Gosford (C) 1-22-12-06 209 239 14.35 Gosford (C) 1-22-12-07 157 164 4.46 Gosford (C) 1-22-12-08 161 180 11.80 Gosford (C) 1-22-12-09 547 567 3.66
Gosford (C) 1-22-12-11 331 347 4.83 Gosford (C) 1-22-12-12 814 1047 28.62 Gosford (C) 1-22-12-13 145 169 16.55 Gosford (C) 1-22-12-14 149 181 21.48 Gosford (C) 1-22-13-02 493 488 -1.01 Gosford (C) 1-22-13-03 311 313 0.64 Gosford (C) 1-22-13-05 302 305 0.99 Gosford (C) 1-22-13-06 434 448 3.23 Gosford (C) 1-22-13-07 378 370 -2.12 Gosford (C) 1-22-13-08 280 307 9.64 Gosford (C) 1-22-13-09 455 475 4.40 Gosford (C) 1-22-14-01 901 902 0.11 Gosford (C) 1-22-14-02 446 449 0.67 Gosford (C) 1-22-14-03 453 446 -1.55 Gosford (C) 1-22-14-04 425 425 0.00 Gosford (C) 1-22-14-05 412 428 3.88 Gosford (C) 1-22-14-06 381 378 -0.79 Gosford (C) 1-22-14-07 571 574 0.53 Gosford (C) 1-22-14-08 629 662 5.25 Gosford (C) 1-22-14-09 470 472 0.43 Gosford (C) 1-22-14-10 262 253 -3.44 Gosford (C) 1-22-15-01 407 403 -0.98 Gosford (C) 1-22-15-02 380 380 0.00 Gosford (C) 1-22-15-03 513 572 11.50 Gosford (C) 1-22-15-04 460 496 7.83 Gosford (C) 1-22-15-05 285 293 2.81 Gosford (C) 1-22-15-06 430 433 0.70 Gosford (C) 1-22-15-07 351 350 -0.28 Gosford (C) 1-22-15-08 321 305 -4.98 Gosford (C) 1-22-15-09 453 457 0.88 Gosford (C) 1-22-16-01 279 323 15.77 Gosford (C) 1-22-16-02 313 302 -3.51 Gosford (C) 1-22-16-03 367 363 -1.09 Gosford (C) 1-22-16-04 277 294 6.14 Gosford (C) 1-22-16-05 299 288 -3.68 Gosford (C) 1-22-16-06 549 564 2.73

New South Wales Redistribution Statistics 2006
Enrolment Projections Robertson
Actual Enrolment Estimate Growth SLA Name CCD Number 2/12/2005 31/5/2010 (%)
285
Gosford (C) 1-22-16-07 507 509 0.39 Gosford (C) 1-22-16-08 382 382 0.00 Gosford (C) 1-22-16-09 343 335 -2.33 Gosford (C) 1-22-16-10 326 337 3.37 Gosford (C) 1-22-16-11 281 326 16.01 Gosford (C) 1-22-17-01 247 265 7.29 Gosford (C) 1-22-17-02 181 194 7.18 Gosford (C) 1-22-17-03 286 282 -1.40 Gosford (C) 1-22-17-04 484 518 7.02 Gosford (C) 1-22-17-05 342 358 4.68 Gosford (C) 1-22-17-06 356 372 4.49 Gosford (C) 1-22-17-07 340 365 7.35 Gosford (C) 1-22-17-08 343 355 3.50 Gosford (C) 1-22-17-09 216 219 1.39 Gosford (C) 1-22-17-10 368 368 0.00 Gosford (C) 1-22-17-11 337 330 -2.08 Gosford (C) 1-22-17-12 180 192 6.67 Gosford (C) 1-22-17-13 85 119 40.00 Gosford (C) 1-22-18-01 305 308 0.98 Gosford (C) 1-22-18-02 275 273 -0.73 Gosford (C) 1-22-18-03 390 405 3.85 Gosford (C) 1-22-18-04 264 279 5.68 Gosford (C) 1-22-18-05 302 313 3.64 Gosford (C) 1-22-18-06 207 230 11.11 Gosford (C) 1-22-18-07 348 355 2.01 Gosford (C) 1-22-18-08 266 270 1.50 Gosford (C) 1-22-18-09 198 213 7.58 Gosford (C) 1-22-18-10 401 434 8.23 Gosford (C) 1-22-18-11 262 270 3.05 Gosford (C) 1-22-19-01 581 570 -1.89 Gosford (C) 1-22-19-02 365 362 -0.82 Gosford (C) 1-22-19-03 458 447 -2.40 Gosford (C) 1-22-19-04 262 256 -2.29 Gosford (C) 1-22-19-05 420 418 -0.48 Gosford (C) 1-22-19-06 358 358 0.00 Gosford (C) 1-22-19-07 387 374 -3.36 Gosford (C) 1-22-19-08 395 392 -0.76 Gosford (C) 1-22-19-09 546 527 -3.48 Gosford (C) 1-22-19-10 319 315 -1.25 Gosford (C) 1-22-19-11 248 247 -0.40 Gosford (C) 1-22-19-12 373 379 1.61 Gosford (C) 1-22-19-13 243 240 -1.23

New South Wales Redistribution Statistics 2006
Enrolment Projections Robertson
Actual Enrolment Estimate Growth SLA Name CCD Number 2/12/2005 31/5/2010 (%)
286
Gosford (C) 1-22-19-14 392 404 3.06 Gosford (C) 1-22-20-01 432 446 3.24 Gosford (C) 1-22-20-02 309 313 1.29 Gosford (C) 1-22-20-03 444 441 -0.68 Gosford (C) 1-22-20-04 366 384 4.92 Gosford (C) 1-22-20-05 708 769 8.62 Gosford (C) 1-22-20-06 147 149 1.36 Gosford (C) 1-22-20-07 161 205 27.33 Gosford (C) 1-22-20-08 244 250 2.46 Gosford (C) 1-22-20-09 311 321 3.22 Gosford (C) 1-22-20-10 389 391 0.51 Gosford (C) 1-22-20-11 118 119 0.85 Gosford (C) 1-22-20-12 280 300 7.14 Gosford (C) 1-22-21-01 453 458 1.10 Gosford (C) 1-22-21-02 357 376 5.32 Gosford (C) 1-22-21-03 67 64 -4.48 Gosford (C) 1-22-21-04 480 537 11.88 Gosford (C) 1-22-21-05 277 290 4.69 Gosford (C) 1-22-21-06 53 60 13.21 Gosford (C) 1-22-21-07 176 191 8.52 Gosford (C) 1-22-21-08 472 472 0.00 Gosford (C) 1-22-21-09 424 410 -3.30 Gosford (C) 1-22-21-10 833 851 2.16 Gosford (C) 1-22-21-12 527 534 1.33 Gosford (C) 1-22-21-13 416 418 0.48 Gosford (C) 1-22-21-14 398 404 1.51 Gosford (C) 1-22-22-01 352 367 4.26 Gosford (C) 1-22-22-02 252 255 1.19 Gosford (C) 1-22-22-03 242 257 6.20 Gosford (C) 1-22-22-04 369 374 1.36 Gosford (C) 1-22-22-05 396 406 2.53 Gosford (C) 1-22-22-06 721 732 1.53 Gosford (C) 1-22-22-07 325 337 3.69 Gosford (C) 1-22-22-08 339 342 0.88 Gosford (C) 1-22-22-09 265 262 -1.13 Gosford (C) 1-22-22-10 507 498 -1.78 Gosford (C) 1-22-22-11 443 551 24.38 Gosford (C) 1-22-22-12 452 451 -0.22 Gosford (C) 1-22-22-13 395 421 6.58 Gosford (C) 1-22-23-01 285 288 1.05 Gosford (C) 1-22-23-02 123 117 -4.88 Gosford (C) 1-22-23-03 571 655 14.71

New South Wales Redistribution Statistics 2006
Enrolment Projections Robertson
Actual Enrolment Estimate Growth SLA Name CCD Number 2/12/2005 31/5/2010 (%)
287
Gosford (C) 1-22-23-04 384 387 0.78 Gosford (C) 1-22-23-05 389 389 0.00 Gosford (C) 1-22-23-06 1023 1215 18.77 Gosford (C) 1-22-23-07 392 406 3.57 Gosford (C) 1-22-23-08 1476 1542 4.47 Gosford (C) 1-22-23-09 729 700 -3.98 Gosford (C) 1-22-23-10 841 849 0.95 Gosford (C) 1-22-23-11 360 391 8.61 Gosford (C) 1-22-23-12 461 455 -1.30 Gosford (C) 1-22-23-13 671 683 1.79 Gosford (C) 1-22-23-14 199 198 -0.50 Gosford (C) 1-22-24-02 525 516 -1.71 Gosford (C) 1-22-24-05 202 209 3.47 Gosford (C) 1-22-24-07 450 451 0.22 Gosford (C) 1-22-24-08 375 384 2.40 Gosford (C) 225 84875 89324 5.24 NSW Water areas 1-22-10-09 0 0 0.00 NSW Water areas 1-22-13-01 0 0 0.00 NSW Water areas 1-22-13-04 0 0 0.00 NSW Water areas 1-22-14-11 0 0 0.00 NSW Water areas 1-22-21-11 0 0 0.00 NSW Water areas 5 0 0 0.00 Robertson 230 84875 89324 5.24

New South Wales Redistribution Statistics 2006
Enrolment Projections Shortland
Actual Enrolment Estimate Growth SLA Name CCD Number 2/12/2005 31/5/2010 (%)
288
Lake Macquarie (C) 1-12-10-01 661 685 3.63 Lake Macquarie (C) 1-12-10-02 553 574 3.80 Lake Macquarie (C) 1-12-10-03 886 913 3.05 Lake Macquarie (C) 1-12-10-04 593 608 2.53 Lake Macquarie (C) 1-12-10-05 487 506 3.90 Lake Macquarie (C) 1-12-10-06 581 611 5.16 Lake Macquarie (C) 1-12-10-07 573 586 2.27 Lake Macquarie (C) 1-12-10-08 649 673 3.70 Lake Macquarie (C) 1-12-10-09 327 325 -0.61 Lake Macquarie (C) 1-12-10-10 531 535 0.75 Lake Macquarie (C) 1-12-10-11 566 564 -0.35 Lake Macquarie (C) 1-12-10-12 551 554 0.54 Lake Macquarie (C) 1-12-10-13 225 223 -0.89 Lake Macquarie (C) 1-12-11-01 268 281 4.85 Lake Macquarie (C) 1-12-15-05 59 100 69.49 Lake Macquarie (C) 1-12-16-01 495 505 2.02 Lake Macquarie (C) 1-12-16-02 401 418 4.24 Lake Macquarie (C) 1-12-16-03 656 665 1.37 Lake Macquarie (C) 1-12-16-04 417 429 2.88 Lake Macquarie (C) 1-12-16-05 360 370 2.78 Lake Macquarie (C) 1-12-16-06 581 640 10.15 Lake Macquarie (C) 1-12-16-07 224 234 4.46 Lake Macquarie (C) 1-12-16-08 359 372 3.62 Lake Macquarie (C) 1-12-16-09 795 803 1.01 Lake Macquarie (C) 1-12-16-10 374 382 2.14 Lake Macquarie (C) 1-12-16-11 291 309 6.19 Lake Macquarie (C) 1-12-16-12 414 439 6.04 Lake Macquarie (C) 1-12-17-01 603 621 2.99 Lake Macquarie (C) 1-12-17-02 620 628 1.29 Lake Macquarie (C) 1-12-17-03 839 885 5.48 Lake Macquarie (C) 1-12-17-04 352 372 5.68 Lake Macquarie (C) 1-12-17-05 324 331 2.16 Lake Macquarie (C) 1-12-17-06 228 232 1.75 Lake Macquarie (C) 1-12-17-07 676 690 2.07 Lake Macquarie (C) 1-12-17-08 516 536 3.88 Lake Macquarie (C) 1-12-17-09 461 459 -0.43 Lake Macquarie (C) 1-12-17-10 306 325 6.21 Lake Macquarie (C) 1-12-17-11 465 469 0.86 Lake Macquarie (C) 1-12-18-03 537 550 2.42 Lake Macquarie (C) 1-12-18-04 566 574 1.41 Lake Macquarie (C) 1-12-18-05 417 431 3.36 Lake Macquarie (C) 1-12-18-06 470 481 2.34

New South Wales Redistribution Statistics 2006
Enrolment Projections Shortland
Actual Enrolment Estimate Growth SLA Name CCD Number 2/12/2005 31/5/2010 (%)
289
Lake Macquarie (C) 1-12-18-07 406 411 1.23 Lake Macquarie (C) 1-12-18-08 468 484 3.42 Lake Macquarie (C) 1-12-18-09 270 312 15.56 Lake Macquarie (C) 1-12-18-10 610 621 1.80 Lake Macquarie (C) 1-12-18-12 372 418 12.37 Lake Macquarie (C) 1-12-19-01 481 509 5.82 Lake Macquarie (C) 1-12-19-02 807 886 9.79 Lake Macquarie (C) 1-12-19-03 340 346 1.76 Lake Macquarie (C) 1-12-19-04 481 486 1.04 Lake Macquarie (C) 1-12-19-05 381 396 3.94 Lake Macquarie (C) 1-12-19-06 490 494 0.82 Lake Macquarie (C) 1-12-19-07 811 850 4.81 Lake Macquarie (C) 1-12-19-08 764 858 12.30 Lake Macquarie (C) 1-12-19-09 249 304 22.09 Lake Macquarie (C) 1-12-19-10 254 261 2.76 Lake Macquarie (C) 1-12-19-11 690 710 2.90 Lake Macquarie (C) 1-12-19-12 374 374 0.00 Lake Macquarie (C) 1-12-20-01 549 559 1.82 Lake Macquarie (C) 1-12-20-02 815 917 12.52 Lake Macquarie (C) 1-12-20-03 357 362 1.40 Lake Macquarie (C) 1-12-20-04 376 366 -2.66 Lake Macquarie (C) 1-12-20-05 643 664 3.27 Lake Macquarie (C) 1-12-20-06 769 796 3.51 Lake Macquarie (C) 1-12-20-07 662 692 4.53 Lake Macquarie (C) 1-12-20-08 610 611 0.16 Lake Macquarie (C) 1-12-20-09 619 623 0.65 Lake Macquarie (C) 1-12-20-10 389 387 -0.51 Lake Macquarie (C) 1-12-20-11 211 217 2.84 Lake Macquarie (C) 1-12-20-12 326 343 5.21 Lake Macquarie (C) 1-12-20-13 674 722 7.12 Lake Macquarie (C) 1-12-21-01 778 942 21.08 Lake Macquarie (C) 1-12-21-02 680 688 1.18 Lake Macquarie (C) 1-12-21-03 483 517 7.04 Lake Macquarie (C) 1-12-21-04 450 466 3.56 Lake Macquarie (C) 1-12-21-05 328 335 2.13 Lake Macquarie (C) 1-12-21-06 219 221 0.91 Lake Macquarie (C) 1-12-21-07 569 593 4.22 Lake Macquarie (C) 1-12-21-08 716 914 27.65 Lake Macquarie (C) 1-12-21-09 373 378 1.34 Lake Macquarie (C) 1-12-21-10 262 331 26.34 Lake Macquarie (C) 1-12-21-11 469 485 3.41 Lake Macquarie (C) 1-12-21-12 308 311 0.97

New South Wales Redistribution Statistics 2006
Enrolment Projections Shortland
Actual Enrolment Estimate Growth SLA Name CCD Number 2/12/2005 31/5/2010 (%)
290
Lake Macquarie (C) 1-12-21-13 223 228 2.24 Lake Macquarie (C) 1-12-21-14 362 520 43.65 Lake Macquarie (C) 1-12-22-01 473 466 -1.48 Lake Macquarie (C) 1-12-22-02 300 321 7.00 Lake Macquarie (C) 1-12-22-03 500 529 5.80 Lake Macquarie (C) 1-12-22-04 531 539 1.51 Lake Macquarie (C) 1-12-22-05 343 351 2.33 Lake Macquarie (C) 1-12-22-06 425 430 1.18 Lake Macquarie (C) 1-12-22-07 406 444 9.36 Lake Macquarie (C) 1-12-22-08 473 483 2.11 Lake Macquarie (C) 1-12-22-09 267 267 0.00 Lake Macquarie (C) 1-12-22-10 251 263 4.78 Lake Macquarie (C) 1-12-22-11 184 189 2.72 Lake Macquarie (C) 1-12-22-12 469 476 1.49 Lake Macquarie (C) 1-12-23-01 454 457 0.66 Lake Macquarie (C) 1-12-23-02 326 353 8.28 Lake Macquarie (C) 1-12-23-03 181 176 -2.76 Lake Macquarie (C) 1-12-23-04 364 367 0.82 Lake Macquarie (C) 1-12-23-05 529 535 1.13 Lake Macquarie (C) 1-12-23-06 467 508 8.78 Lake Macquarie (C) 1-12-23-07 316 328 3.80 Lake Macquarie (C) 1-12-23-08 680 687 1.03 Lake Macquarie (C) 1-12-23-09 593 624 5.23 Lake Macquarie (C) 1-12-24-01 136 143 5.15 Lake Macquarie (C) 1-12-24-02 265 277 4.53 Lake Macquarie (C) 1-12-24-03 374 383 2.41 Lake Macquarie (C) 1-12-24-04 484 496 2.48 Lake Macquarie (C) 1-12-24-05 441 477 8.16 Lake Macquarie (C) 1-12-24-06 347 382 10.09 Lake Macquarie (C) 1-12-24-07 461 478 3.69 Lake Macquarie (C) 1-12-24-08 274 282 2.92 Lake Macquarie (C) 1-12-24-09 50 78 56.00 Lake Macquarie (C) 1-12-24-11 450 464 3.11 Lake Macquarie (C) 1-12-24-12 419 432 3.10 Lake Macquarie (C) 1-12-24-13 368 406 10.33 Lake Macquarie (C) 119 54326 56887 4.71 NSW Water areas 1-12-06-08 0 0 0.00 NSW Water areas 1-12-24-10 0 0 0.00 NSW Water areas 1-21-02-11 0 0 0.00 NSW Water areas 1-21-07-16 0 0 0.00

New South Wales Redistribution Statistics 2006
Enrolment Projections Shortland
Actual Enrolment Estimate Growth SLA Name CCD Number 2/12/2005 31/5/2010 (%)
291
NSW Water areas 4 0 0 0.00 Wyong (A) 1-21-01-01 532 691 29.89 Wyong (A) 1-21-01-02 175 179 2.29 Wyong (A) 1-21-01-03 501 528 5.39 Wyong (A) 1-21-01-04 278 290 4.32 Wyong (A) 1-21-01-05 382 405 6.02 Wyong (A) 1-21-01-06 268 271 1.12 Wyong (A) 1-21-01-07 210 213 1.43 Wyong (A) 1-21-01-08 327 363 11.01 Wyong (A) 1-21-01-09 245 264 7.76 Wyong (A) 1-21-01-10 577 719 24.61 Wyong (A) 1-21-01-11 284 292 2.82 Wyong (A) 1-21-01-12 261 271 3.83 Wyong (A) 1-21-01-13 1063 1089 2.45 Wyong (A) 1-21-01-14 4 5 25.00 Wyong (A) 1-21-01-15 377 393 4.24 Wyong (A) 1-21-02-01 277 298 7.58 Wyong (A) 1-21-02-02 416 441 6.01 Wyong (A) 1-21-02-03 241 251 4.15 Wyong (A) 1-21-02-04 609 611 0.33 Wyong (A) 1-21-02-05 494 509 3.04 Wyong (A) 1-21-02-06 277 282 1.81 Wyong (A) 1-21-02-07 806 848 5.21 Wyong (A) 1-21-02-08 297 319 7.41 Wyong (A) 1-21-02-09 317 318 0.32 Wyong (A) 1-21-02-10 598 621 3.85 Wyong (A) 1-21-02-12 567 600 5.82 Wyong (A) 1-21-04-01 289 291 0.69 Wyong (A) 1-21-04-02 234 255 8.97 Wyong (A) 1-21-04-03 387 394 1.81 Wyong (A) 1-21-04-04 371 377 1.62 Wyong (A) 1-21-04-05 437 449 2.75 Wyong (A) 1-21-04-06 396 414 4.55 Wyong (A) 1-21-04-07 572 589 2.97 Wyong (A) 1-21-04-08 428 440 2.80 Wyong (A) 1-21-04-09 257 266 3.50 Wyong (A) 1-21-04-10 383 407 6.27 Wyong (A) 1-21-04-11 444 467 5.18 Wyong (A) 1-21-04-12 376 382 1.60 Wyong (A) 1-21-05-01 420 434 3.33

New South Wales Redistribution Statistics 2006
Enrolment Projections Shortland
Actual Enrolment Estimate Growth SLA Name CCD Number 2/12/2005 31/5/2010 (%)
292
Wyong (A) 1-21-05-02 545 559 2.57 Wyong (A) 1-21-05-03 301 334 10.96 Wyong (A) 1-21-05-04 269 289 7.43 Wyong (A) 1-21-05-05 162 165 1.85 Wyong (A) 1-21-05-06 642 654 1.87 Wyong (A) 1-21-05-07 346 345 -0.29 Wyong (A) 1-21-05-08 342 341 -0.29 Wyong (A) 1-21-05-09 494 518 4.86 Wyong (A) 1-21-05-10 616 640 3.90 Wyong (A) 1-21-05-11 276 279 1.09 Wyong (A) 1-21-06-01 720 748 3.89 Wyong (A) 1-21-06-02 346 355 2.60 Wyong (A) 1-21-06-03 371 380 2.43 Wyong (A) 1-21-06-04 304 318 4.61 Wyong (A) 1-21-06-05 259 270 4.25 Wyong (A) 1-21-06-06 247 247 0.00 Wyong (A) 1-21-06-07 337 343 1.78 Wyong (A) 1-21-06-08 296 309 4.39 Wyong (A) 1-21-06-09 197 201 2.03 Wyong (A) 1-21-06-10 204 215 5.39 Wyong (A) 1-21-06-11 324 333 2.78 Wyong (A) 1-21-06-12 423 432 2.13 Wyong (A) 1-21-07-01 203 204 0.49 Wyong (A) 1-21-07-02 381 410 7.61 Wyong (A) 1-21-07-03 317 341 7.57 Wyong (A) 1-21-07-04 385 406 5.45 Wyong (A) 1-21-07-05 246 265 7.72 Wyong (A) 1-21-07-06 248 253 2.02 Wyong (A) 1-21-07-07 133 148 11.28 Wyong (A) 1-21-07-08 788 807 2.41 Wyong (A) 1-21-07-09 188 196 4.26 Wyong (A) 1-21-07-10 310 324 4.52 Wyong (A) 1-21-07-11 345 379 9.86 Wyong (A) 1-21-07-12 476 492 3.36 Wyong (A) 1-21-07-13 266 276 3.76 Wyong (A) 1-21-07-14 319 338 5.96 Wyong (A) 1-21-07-15 0 0 0.00 Wyong (A) 1-21-07-17 346 361 4.34 Wyong (A) 1-21-08-01 237 239 0.84 Wyong (A) 1-21-08-02 434 445 2.53 Wyong (A) 1-21-08-06 354 376 6.21 Wyong (A) 1-21-08-07 270 272 0.74

New South Wales Redistribution Statistics 2006
Enrolment Projections Shortland
Actual Enrolment Estimate Growth SLA Name CCD Number 2/12/2005 31/5/2010 (%)
293
Wyong (A) 1-21-08-08 251 261 3.98 Wyong (A) 1-21-08-09 253 255 0.79 Wyong (A) 1-21-08-10 409 416 1.71 Wyong (A) 1-21-08-11 311 317 1.93 Wyong (A) 1-21-08-12 730 743 1.78 Wyong (A) 1-21-08-13 282 284 0.71 Wyong (A) 1-21-08-14 411 431 4.87 Wyong (A) 1-21-08-15 239 265 10.88 Wyong (A) 1-21-09-12 93 97 4.30 Wyong (A) 90 32623 34112 4.56 Newcastle (C) - Remainder 1-10-21-13 52 52 0.00 Newcastle (C) - Remainder 1 52 52 0.00 Shortland 214 87001 91051 4.66

New South Wales Redistribution Statistics 2006
Enrolment Projections Sydney
Actual Enrolment Estimate Growth SLA Name CCD Number 2/12/2005 31/5/2010 (%)
294
Leichhardt (A) 1-41-24-12 525 559 6.48 Leichhardt (A) 1-41-24-13 282 280 -0.71 Leichhardt (A) 1-41-24-14 160 163 1.88 Leichhardt (A) 1-41-25-01 298 305 2.35 Leichhardt (A) 1-41-25-02 402 432 7.46 Leichhardt (A) 1-41-25-03 213 223 4.69 Leichhardt (A) 1-41-25-04 868 1086 25.12 Leichhardt (A) 1-41-25-05 423 433 2.36 Leichhardt (A) 1-41-25-06 288 299 3.82 Leichhardt (A) 1-41-25-07 382 393 2.88 Leichhardt (A) 1-41-25-08 300 322 7.33 Leichhardt (A) 1-41-25-09 470 484 2.98 Leichhardt (A) 1-41-25-10 293 297 1.37 Leichhardt (A) 1-41-25-11 331 341 3.02 Leichhardt (A) 1-41-25-12 576 597 3.65 Leichhardt (A) 1-41-25-13 255 253 -0.78 Leichhardt (A) 1-41-26-01 376 385 2.39 Leichhardt (A) 1-41-26-02 386 398 3.11 Leichhardt (A) 1-41-26-03 310 327 5.48 Leichhardt (A) 1-41-26-04 489 499 2.04 Leichhardt (A) 1-41-26-05 399 414 3.76 Leichhardt (A) 1-41-26-06 254 268 5.51 Leichhardt (A) 1-41-26-07 410 419 2.20 Leichhardt (A) 1-41-26-08 397 412 3.78 Leichhardt (A) 1-41-26-09 626 632 0.96 Leichhardt (A) 1-41-26-10 0 0 0.00 Leichhardt (A) 1-41-26-11 227 236 3.96 Leichhardt (A) 1-41-26-12 271 275 1.48 Leichhardt (A) 1-41-27-01 229 232 1.31 Leichhardt (A) 1-41-27-02 394 394 0.00 Leichhardt (A) 1-41-27-03 463 485 4.75 Leichhardt (A) 1-41-27-04 501 510 1.80 Leichhardt (A) 1-41-27-05 434 438 0.92 Leichhardt (A) 1-41-27-06 687 694 1.02 Leichhardt (A) 1-41-27-07 299 307 2.68 Leichhardt (A) 1-41-27-08 182 188 3.30 Leichhardt (A) 1-41-27-09 345 375 8.70 Leichhardt (A) 1-41-27-10 251 260 3.59 Leichhardt (A) 1-41-27-11 161 167 3.73 Leichhardt (A) 1-41-27-12 439 448 2.05 Leichhardt (A) 1-41-28-05 85 87 2.35 Leichhardt (A) 1-41-28-07 340 346 1.76

New South Wales Redistribution Statistics 2006
Enrolment Projections Sydney
Actual Enrolment Estimate Growth SLA Name CCD Number 2/12/2005 31/5/2010 (%)
295
Leichhardt (A) 1-41-28-08 311 313 0.64 Leichhardt (A) 1-41-28-09 224 227 1.34 Leichhardt (A) 1-41-28-10 450 457 1.56 Leichhardt (A) 1-41-28-11 247 248 0.40 Leichhardt (A) 46 16253 16908 4.03 Lord Howe Island 1-09-21-01 274 276 0.73 Lord Howe Island 1 274 276 0.73 NSW Water areas 1-40-01-15 20 22 10.00 NSW Water areas 1-45-02-04 0 0 0.00 NSW Water areas 1-45-02-05 0 0 0.00 NSW Water areas 1-45-02-06 0 0 0.00 NSW Water areas 1-45-02-07 0 0 0.00 NSW Water areas 1-45-02-08 0 0 0.00 NSW Water areas 6 20 22 10.00 Sydney (C) - Central 1-40-01-05 444 446 0.45 Sydney (C) - Central 1-40-01-08 23 22 -4.35 Sydney (C) - Central 1-40-02-01 997 1168 17.15 Sydney (C) - Central 1-40-02-02 188 212 12.77 Sydney (C) - Central 1-40-02-03 134 141 5.22 Sydney (C) - Central 1-40-02-04 251 273 8.76 Sydney (C) - Central 1-40-02-05 136 303 122.79 Sydney (C) - Central 1-40-02-06 158 172 8.86 Sydney (C) - Central 1-40-02-07 174 183 5.17 Sydney (C) - Central 1-40-02-08 306 310 1.31 Sydney (C) - Central 1-40-02-09 162 166 2.47 Sydney (C) - Central 1-40-02-10 269 285 5.95 Sydney (C) - Central 1-40-02-11 607 923 52.06 Sydney (C) - Central 1-40-02-12 213 226 6.10 Sydney (C) - Central 1-40-02-13 529 665 25.71 Sydney (C) - Central 1-40-02-14 382 396 3.66 Sydney (C) - Central 1-40-02-15 406 436 7.39 Sydney (C) - Central 1-40-02-16 356 540 51.69 Sydney (C) - Central 1-40-03-01 876 1486 69.63 Sydney (C) - Central 1-40-03-02 158 171 8.23 Sydney (C) - Central 1-40-03-03 163 189 15.95 Sydney (C) - Central 1-40-03-04 317 355 11.99

New South Wales Redistribution Statistics 2006
Enrolment Projections Sydney
Actual Enrolment Estimate Growth SLA Name CCD Number 2/12/2005 31/5/2010 (%)
296
Sydney (C) - Central 1-40-03-05 276 287 3.99 Sydney (C) - Central 1-40-03-08 302 311 2.98 Sydney (C) - Central 1-40-03-09 168 174 3.57 Sydney (C) - Central 1-40-03-10 15 15 0.00 Sydney (C) - Central 1-40-03-11 387 734 89.66 Sydney (C) - Central 1-40-03-12 63 64 1.59 Sydney (C) - Central 1-40-03-13 258 258 0.00 Sydney (C) - Central 1-40-03-14 320 324 1.25 Sydney (C) - Central 1-40-03-15 124 124 0.00 Sydney (C) - Central 1-40-03-16 193 197 2.07 Sydney (C) - Central 1-40-03-17 294 301 2.38 Sydney (C) - Central 1-40-08-02 26 27 3.85 Sydney (C) - Central 1-40-08-03 52 55 5.77 Sydney (C) - Central 1-40-08-05 41 46 12.20 Sydney (C) - Central 1-40-11-01 79 84 6.33 Sydney (C) - Central 1-40-11-04 100 102 2.00 Sydney (C) - Central 1-40-11-15 100 100 0.00 Sydney (C) - Central 1-40-12-01 122 125 2.46 Sydney (C) - Central 1-40-12-16 128 128 0.00 Sydney (C) - Central 1-40-13-01 120 128 6.67 Sydney (C) - Central 1-40-13-02 186 196 5.38 Sydney (C) - Central 1-40-13-03 166 175 5.42 Sydney (C) - Central 1-40-13-04 94 96 2.13 Sydney (C) - Central 1-40-13-05 303 314 3.63 Sydney (C) - Central 1-40-13-06 176 187 6.25 Sydney (C) - Central 1-40-13-07 124 131 5.65 Sydney (C) - Central 1-40-13-08 242 247 2.07 Sydney (C) - Central 1-40-13-09 85 87 2.35 Sydney (C) - Central 1-40-13-10 271 278 2.58 Sydney (C) - Central 1-40-13-11 140 137 -2.14 Sydney (C) - Central 1-40-14-01 348 365 4.89 Sydney (C) - Central 1-40-14-02 392 415 5.87 Sydney (C) - Central 1-40-14-03 297 433 45.79 Sydney (C) - Central 1-40-14-04 182 182 0.00 Sydney (C) - Central 1-40-14-05 316 331 4.75 Sydney (C) - Central 1-40-14-06 198 201 1.52 Sydney (C) - Central 1-40-14-07 279 284 1.79 Sydney (C) - Central 1-40-14-08 198 208 5.05 Sydney (C) - Central 1-40-14-09 460 499 8.48 Sydney (C) - Central 1-40-14-10 13 14 7.69 Sydney (C) - Central 1-40-14-11 201 199 -1.00 Sydney (C) - Central 1-40-15-01 129 129 0.00

New South Wales Redistribution Statistics 2006
Enrolment Projections Sydney
Actual Enrolment Estimate Growth SLA Name CCD Number 2/12/2005 31/5/2010 (%)
297
Sydney (C) - Central 1-40-15-02 621 634 2.09 Sydney (C) - Central 1-40-15-03 113 118 4.42 Sydney (C) - Central 1-40-15-04 417 429 2.88 Sydney (C) - Central 1-40-15-05 111 112 0.90 Sydney (C) - Central 1-40-15-06 263 263 0.00 Sydney (C) - Central 1-40-15-07 154 156 1.30 Sydney (C) - Central 1-40-15-08 300 305 1.67 Sydney (C) - Central 1-40-15-09 168 165 -1.79 Sydney (C) - Central 1-40-16-01 225 227 0.89 Sydney (C) - Central 1-40-16-02 299 302 1.00 Sydney (C) - Central 1-40-16-03 79 80 1.27 Sydney (C) - Central 1-40-16-04 48 48 0.00 Sydney (C) - Central 1-40-16-05 33 36 9.09 Sydney (C) - Central 1-40-16-06 120 122 1.67 Sydney (C) - Central 1-40-16-07 121 124 2.48 Sydney (C) - Central 1-40-16-08 85 86 1.18 Sydney (C) - Central 1-40-16-09 109 109 0.00 Sydney (C) - Central 1-40-17-01 65 102 56.92 Sydney (C) - Central 1-40-17-02 161 167 3.73 Sydney (C) - Central 1-40-17-03 97 96 -1.03 Sydney (C) - Central 1-40-17-04 203 201 -0.99 Sydney (C) - Central 1-40-17-05 97 99 2.06 Sydney (C) - Central 1-40-17-06 276 321 16.30 Sydney (C) - Central 1-40-17-07 174 182 4.60 Sydney (C) - Central 1-40-17-08 33 36 9.09 Sydney (C) - Central 1-40-17-09 121 125 3.31 Sydney (C) - Central 1-40-18-01 243 252 3.70 Sydney (C) - Central 1-40-18-02 115 113 -1.74 Sydney (C) - Central 1-40-18-03 174 183 5.17 Sydney (C) - Central 1-40-18-04 73 81 10.96 Sydney (C) - Central 1-40-18-05 457 481 5.25 Sydney (C) - Central 1-40-18-06 361 371 2.77 Sydney (C) - Central 1-40-18-07 173 173 0.00 Sydney (C) - Central 1-40-18-08 191 204 6.81 Sydney (C) - Central 1-40-18-09 146 206 41.10 Sydney (C) - Central 1-40-18-10 268 279 4.10 Sydney (C) - Central 1-40-19-01 299 308 3.01 Sydney (C) - Central 1-40-19-02 172 174 1.16 Sydney (C) - Central 1-40-19-03 331 336 1.51 Sydney (C) - Central 1-40-19-04 231 238 3.03 Sydney (C) - Central 1-40-19-05 290 292 0.69 Sydney (C) - Central 1-40-19-06 186 187 0.54

New South Wales Redistribution Statistics 2006
Enrolment Projections Sydney
Actual Enrolment Estimate Growth SLA Name CCD Number 2/12/2005 31/5/2010 (%)
298
Sydney (C) - Central 1-40-19-07 440 440 0.00 Sydney (C) - Central 1-40-19-08 137 141 2.92 Sydney (C) - Central 1-40-19-09 163 164 0.61 Sydney (C) - Central 1-40-20-01 384 415 8.07 Sydney (C) - Central 1-40-20-02 364 375 3.02 Sydney (C) - Central 1-40-20-03 238 406 70.59 Sydney (C) - Central 1-40-20-04 413 509 23.24 Sydney (C) - Central 1-40-20-05 226 253 11.95 Sydney (C) - Central 1-40-20-06 276 285 3.26 Sydney (C) - Central 1-40-20-07 192 210 9.38 Sydney (C) - Central 1-40-20-08 321 585 82.24 Sydney (C) - Central 1-40-20-09 196 209 6.63 Sydney (C) - Central 1-40-20-10 148 150 1.35 Sydney (C) - Central 1-40-20-11 195 201 3.08 Sydney (C) - Central 1-40-20-12 175 474 170.86 Sydney (C) - Central 1-40-20-13 120 226 88.33 Sydney (C) - Central 1-40-20-14 84 80 -4.76 Sydney (C) - Central 1-40-20-15 192 198 3.12 Sydney (C) - Central 1-40-20-16 287 294 2.44 Sydney (C) - Central 1-40-20-17 101 101 0.00 Sydney (C) - Central 1-40-20-18 219 230 5.02 Sydney (C) - Central 1-40-20-19 182 202 10.99 Sydney (C) - Central 1-40-20-20 246 264 7.32 Sydney (C) - Central 1-40-20-21 59 63 6.78 Sydney (C) - Central 1-40-20-22 165 166 0.61 Sydney (C) - Central 1-41-31-01 388 430 10.82 Sydney (C) - Central 1-41-31-02 315 323 2.54 Sydney (C) - Central 1-41-31-03 161 159 -1.24 Sydney (C) - Central 1-41-31-04 403 411 1.99 Sydney (C) - Central 1-41-31-05 470 494 5.11 Sydney (C) - Central 1-41-31-06 378 387 2.38 Sydney (C) - Central 1-41-31-07 282 285 1.06 Sydney (C) - Central 1-41-31-08 384 398 3.65 Sydney (C) - Central 1-41-31-09 305 330 8.20 Sydney (C) - Central 1-41-31-10 225 228 1.33 Sydney (C) - Central 1-41-31-11 296 298 0.68 Sydney (C) - Central 1-41-32-01 261 278 6.51 Sydney (C) - Central 1-41-32-02 266 268 0.75 Sydney (C) - Central 1-41-32-03 252 252 0.00 Sydney (C) - Central 1-41-32-04 263 274 4.18 Sydney (C) - Central 1-41-32-05 202 207 2.48 Sydney (C) - Central 1-41-32-06 206 218 5.83

New South Wales Redistribution Statistics 2006
Enrolment Projections Sydney
Actual Enrolment Estimate Growth SLA Name CCD Number 2/12/2005 31/5/2010 (%)
299
Sydney (C) - Central 1-41-32-07 216 226 4.63 Sydney (C) - Central 1-41-32-08 258 263 1.94 Sydney (C) - Central 1-41-33-01 281 482 71.53 Sydney (C) - Central 1-41-33-02 280 284 1.43 Sydney (C) - Central 1-41-33-03 262 281 7.25 Sydney (C) - Central 1-41-33-04 343 359 4.66 Sydney (C) - Central 1-41-33-05 303 305 0.66 Sydney (C) - Central 1-41-33-06 336 345 2.68 Sydney (C) - Central 1-41-33-07 252 257 1.98 Sydney (C) - Central 1-41-33-08 241 244 1.24 Sydney (C) - Central 1-41-33-09 182 190 4.40 Sydney (C) - Central 1-41-33-10 257 261 1.56 Sydney (C) - Central 1-41-33-11 264 265 0.38 Sydney (C) - Central 161 37475 41926 11.88 Sydney (C) - Inner 1-40-01-01 343 424 23.62 Sydney (C) - Inner 1-40-01-02 415 440 6.02 Sydney (C) - Inner 1-40-01-03 244 288 18.03 Sydney (C) - Inner 1-40-01-04 84 187 122.62 Sydney (C) - Inner 1-40-01-06 118 122 3.39 Sydney (C) - Inner 1-40-01-07 297 301 1.35 Sydney (C) - Inner 1-40-01-09 292 338 15.75 Sydney (C) - Inner 1-40-01-10 28 30 7.14 Sydney (C) - Inner 1-40-01-11 207 211 1.93 Sydney (C) - Inner 1-40-01-12 301 427 41.86 Sydney (C) - Inner 1-40-01-13 277 329 18.77 Sydney (C) - Inner 1-40-01-14 58 61 5.17 Sydney (C) - Inner 1-40-01-16 136 166 22.06 Sydney (C) - Inner 1-40-01-17 230 380 65.22 Sydney (C) - Inner 1-40-01-18 128 127 -0.78 Sydney (C) - Inner 1-40-01-19 90 91 1.11 Sydney (C) - Inner 16 3248 3922 20.75 Sydney (C) - South 1-40-03-06 362 405 11.88 Sydney (C) - South 1-40-03-07 309 312 0.97 Sydney (C) - South 1-40-03-08 239 247 3.35 Sydney (C) - South 1-40-04-01 357 371 3.92 Sydney (C) - South 1-40-04-02 606 623 2.81 Sydney (C) - South 1-40-04-03 441 470 6.58 Sydney (C) - South 1-40-04-04 302 319 5.63

New South Wales Redistribution Statistics 2006
Enrolment Projections Sydney
Actual Enrolment Estimate Growth SLA Name CCD Number 2/12/2005 31/5/2010 (%)
300
Sydney (C) - South 1-40-04-05 264 272 3.03 Sydney (C) - South 1-40-04-06 512 536 4.69 Sydney (C) - South 1-40-04-07 476 522 9.66 Sydney (C) - South 1-40-04-08 484 507 4.75 Sydney (C) - South 1-40-04-09 202 203 0.50 Sydney (C) - South 1-40-05-01 359 383 6.69 Sydney (C) - South 1-40-05-02 176 181 2.84 Sydney (C) - South 1-40-05-03 241 241 0.00 Sydney (C) - South 1-40-05-04 309 317 2.59 Sydney (C) - South 1-40-05-05 180 190 5.56 Sydney (C) - South 1-40-05-06 344 371 7.85 Sydney (C) - South 1-40-05-07 199 214 7.54 Sydney (C) - South 1-40-05-08 506 534 5.53 Sydney (C) - South 1-40-05-09 611 694 13.58 Sydney (C) - South 1-40-05-10 365 379 3.84 Sydney (C) - South 1-40-05-11 185 192 3.78 Sydney (C) - South 1-40-06-01 451 474 5.10 Sydney (C) - South 1-40-06-02 587 609 3.75 Sydney (C) - South 1-40-06-03 468 477 1.92 Sydney (C) - South 1-40-06-04 292 304 4.11 Sydney (C) - South 1-40-06-05 614 915 49.02 Sydney (C) - South 1-40-06-06 517 565 9.28 Sydney (C) - South 1-40-06-07 742 1004 35.31 Sydney (C) - South 1-40-06-08 456 791 73.46 Sydney (C) - South 1-40-06-09 276 528 91.30 Sydney (C) - South 1-40-06-10 307 316 2.93 Sydney (C) - South 1-40-06-11 482 496 2.90 Sydney (C) - South 1-40-06-12 563 770 36.77 Sydney (C) - South 1-40-06-13 948 1199 26.48 Sydney (C) - South 1-40-06-14 441 452 2.49 Sydney (C) - South 1-40-06-15 358 378 5.59 Sydney (C) - South 1-40-07-01 280 281 0.36 Sydney (C) - South 1-40-07-02 137 140 2.19 Sydney (C) - South 1-40-07-03 84 84 0.00 Sydney (C) - South 1-40-07-04 409 429 4.89 Sydney (C) - South 1-40-07-05 301 320 6.31 Sydney (C) - South 1-40-07-06 578 1125 94.64 Sydney (C) - South 1-40-07-07 415 701 68.92 Sydney (C) - South 1-40-07-08 171 177 3.51 Sydney (C) - South 1-40-07-09 470 652 38.72 Sydney (C) - South 1-40-07-10 267 265 -0.75 Sydney (C) - South 1-40-07-11 273 269 -1.47

New South Wales Redistribution Statistics 2006
Enrolment Projections Sydney
Actual Enrolment Estimate Growth SLA Name CCD Number 2/12/2005 31/5/2010 (%)
301
Sydney (C) - South 1-40-07-12 0 0 0.00 Sydney (C) - South 1-40-07-13 192 200 4.17 Sydney (C) - South 1-40-07-14 249 248 -0.40 Sydney (C) - South 1-40-07-15 1374 2592 88.65 Sydney (C) - South 1-40-08-01 354 358 1.13 Sydney (C) - South 1-40-08-02 310 324 4.52 Sydney (C) - South 1-40-08-03 279 293 5.02 Sydney (C) - South 1-40-08-04 238 258 8.40 Sydney (C) - South 1-40-08-05 104 114 9.62 Sydney (C) - South 1-40-08-06 336 468 39.29 Sydney (C) - South 1-40-08-07 188 190 1.06 Sydney (C) - South 1-40-08-08 384 393 2.34 Sydney (C) - South 1-40-08-09 258 285 10.47 Sydney (C) - South 1-40-08-10 238 240 0.84 Sydney (C) - South 1-40-08-11 416 422 1.44 Sydney (C) - South 1-40-08-12 0 0 0.00 Sydney (C) - South 1-40-08-13 599 591 -1.34 Sydney (C) - South 1-40-08-14 478 489 2.30 Sydney (C) - South 1-40-08-15 253 252 -0.40 Sydney (C) - South 1-40-09-01 268 277 3.36 Sydney (C) - South 1-40-09-02 197 196 -0.51 Sydney (C) - South 1-40-09-03 90 88 -2.22 Sydney (C) - South 1-40-09-04 148 149 0.68 Sydney (C) - South 1-40-09-05 545 561 2.94 Sydney (C) - South 1-40-09-06 265 273 3.02 Sydney (C) - South 1-40-09-07 107 113 5.61 Sydney (C) - South 1-40-09-08 427 442 3.51 Sydney (C) - South 1-40-09-09 246 244 -0.81 Sydney (C) - South 1-40-09-10 205 204 -0.49 Sydney (C) - South 1-40-09-11 186 186 0.00 Sydney (C) - South 1-40-09-12 177 177 0.00 Sydney (C) - South 1-40-09-13 208 215 3.37 Sydney (C) - South 1-40-09-14 503 502 -0.20 Sydney (C) - South 1-40-09-15 96 101 5.21 Sydney (C) - South 1-40-10-01 312 317 1.60 Sydney (C) - South 1-40-10-02 244 260 6.56 Sydney (C) - South 1-40-10-03 232 287 23.71 Sydney (C) - South 1-40-10-04 259 267 3.09 Sydney (C) - South 1-40-10-05 239 247 3.35 Sydney (C) - South 1-40-10-06 182 184 1.10 Sydney (C) - South 1-40-10-07 76 79 3.95 Sydney (C) - South 1-40-10-08 274 285 4.01

New South Wales Redistribution Statistics 2006
Enrolment Projections Sydney
Actual Enrolment Estimate Growth SLA Name CCD Number 2/12/2005 31/5/2010 (%)
302
Sydney (C) - South 1-40-11-01 320 520 62.50
Sydney (C) - South 1-40-11-03 143 145 1.40
Sydney (C) - South 1-40-10-09 244 257 5.33 Sydney (C) - South 1-40-10-10 310 316 1.94 Sydney (C) - South 1-40-10-11 60 60 0.00 Sydney (C) - South 1-40-10-12 189 194 2.65
Sydney (C) - South 1-40-11-02 150 155 3.33
Sydney (C) - South 1-40-11-04 44 45 2.27 Sydney (C) - South 1-40-11-05 261 269 3.07 Sydney (C) - South 1-40-11-06 145 147 1.38 Sydney (C) - South 1-40-11-07 380 432 13.68 Sydney (C) - South 1-40-11-08 289 287 -0.69 Sydney (C) - South 1-40-11-09 172 174 1.16 Sydney (C) - South 1-40-11-10 221 222 0.45 Sydney (C) - South 1-40-11-11 376 399 6.12 Sydney (C) - South 1-40-11-12 201 209 3.98 Sydney (C) - South 1-40-11-13 181 183 1.10 Sydney (C) - South 1-40-11-14 369 377 2.17 Sydney (C) - South 1-40-11-15 51 51 0.00 Sydney (C) - South 1-40-12-01 300 321 7.00 Sydney (C) - South 1-40-12-02 317 547 72.56 Sydney (C) - South 1-40-12-03 333 358 7.51 Sydney (C) - South 1-40-12-04 289 289 0.00 Sydney (C) - South 1-40-12-05 224 229 2.23 Sydney (C) - South 1-40-12-06 265 269 1.51 Sydney (C) - South 1-40-12-07 206 204 -0.97 Sydney (C) - South 1-40-12-08 140 143 2.14 Sydney (C) - South 1-40-12-09 148 149 0.68 Sydney (C) - South 1-40-12-10 416 422 1.44 Sydney (C) - South 1-40-12-11 370 381 2.97 Sydney (C) - South 1-40-12-12 212 223 5.19 Sydney (C) - South 1-40-12-13 144 144 0.00 Sydney (C) - South 1-40-12-14 357 375 5.04 Sydney (C) - South 1-40-12-15 204 206 0.98 Sydney (C) - South 1-40-12-17 236 256 8.47 Sydney (C) - South 126 38919 44533 14.42 Sydney 356 96189 107587 11.85

New South Wales Redistribution Statistics 2006
Enrolment Projections Throsby
Actual Enrolment Estimate Growth SLA Name CCD Number 2/12/2005 31/5/2010 (%)
303
NSW Water areas 1-19-21-12 0 0 0.00 NSW Water areas 1-19-26-10 0 0 0.00 NSW Water areas 1-45-02-10 0 0 0.00 NSW Water areas 3 0 0 0.00 Shellharbour (C) 1-19-25-01 403 411 1.99 Shellharbour (C) 1-19-25-02 433 438 1.15 Shellharbour (C) 1-19-25-03 481 495 2.91 Shellharbour (C) 1-19-25-04 580 594 2.41 Shellharbour (C) 1-19-25-05 368 377 2.45 Shellharbour (C) 1-19-25-06 465 467 0.43 Shellharbour (C) 1-19-25-07 555 572 3.06 Shellharbour (C) 1-19-25-08 337 346 2.67 Shellharbour (C) 1-19-25-09 685 695 1.46 Shellharbour (C) 1-19-25-10 395 404 2.28 Shellharbour (C) 1-19-25-11 694 717 3.31 Shellharbour (C) 1-19-26-01 262 265 1.15 Shellharbour (C) 1-19-26-02 339 366 7.96 Shellharbour (C) 1-19-26-03 796 829 4.15 Shellharbour (C) 1-19-26-04 565 578 2.30 Shellharbour (C) 1-19-26-05 600 610 1.67 Shellharbour (C) 1-19-26-06 582 607 4.30 Shellharbour (C) 1-19-26-07 398 402 1.01 Shellharbour (C) 1-19-26-08 248 252 1.61 Shellharbour (C) 1-19-26-09 205 214 4.39 Shellharbour (C) 1-19-26-11 218 223 2.29 Shellharbour (C) 1-19-26-12 156 161 3.21 Shellharbour (C) 1-19-26-13 273 278 1.83 Shellharbour (C) 1-19-27-01 437 464 6.18 Shellharbour (C) 1-19-27-02 613 647 5.55 Shellharbour (C) 1-19-27-03 463 484 4.54 Shellharbour (C) 1-19-27-04 491 494 0.61 Shellharbour (C) 1-19-27-05 469 478 1.92 Shellharbour (C) 1-19-27-06 457 473 3.50 Shellharbour (C) 1-19-27-07 314 345 9.87 Shellharbour (C) 1-19-27-08 500 511 2.20 Shellharbour (C) 1-19-27-09 336 338 0.60 Shellharbour (C) 1-19-27-10 661 671 1.51 Shellharbour (C) 1-19-27-11 423 448 5.91 Shellharbour (C) 1-19-27-12 464 463 -0.22 Shellharbour (C) 1-19-28-01 813 1196 47.11

New South Wales Redistribution Statistics 2006
Enrolment Projections Throsby
Actual Enrolment Estimate Growth SLA Name CCD Number 2/12/2005 31/5/2010 (%)
304
Shellharbour (C) 1-19-28-02 496 510 2.82 Shellharbour (C) 1-19-28-03 640 801 25.16 Shellharbour (C) 1-19-28-04 394 398 1.02 Shellharbour (C) 1-19-28-05 578 626 8.30 Shellharbour (C) 1-19-28-06 1538 2391 55.46 Shellharbour (C) 1-19-28-07 758 799 5.41 Shellharbour (C) 1-19-28-08 403 410 1.74 Shellharbour (C) 1-19-28-09 232 237 2.16 Shellharbour (C) 1-19-28-10 167 188 12.57 Shellharbour (C) 1-19-28-11 841 953 13.32 Shellharbour (C) 1-19-28-12 978 1014 3.68 Shellharbour (C) 1-19-28-13 955 1253 31.20 Shellharbour (C) 1-19-29-01 440 475 7.95 Shellharbour (C) 1-19-29-02 398 424 6.53 Shellharbour (C) 1-19-29-03 386 395 2.33 Shellharbour (C) 1-19-29-04 473 504 6.55 Shellharbour (C) 1-19-29-05 326 336 3.07 Shellharbour (C) 1-19-29-06 373 391 4.83 Shellharbour (C) 1-19-29-07 489 509 4.09 Shellharbour (C) 1-19-29-08 538 588 9.29 Shellharbour (C) 1-19-29-09 461 476 3.25 Shellharbour (C) 1-19-29-10 299 319 6.69 Shellharbour (C) 1-19-29-11 286 306 6.99 Shellharbour (C) 1-19-29-12 363 385 6.06 Shellharbour (C) 1-19-30-01 173 182 5.20 Shellharbour (C) 1-19-30-02 150 160 6.67 Shellharbour (C) 1-19-30-03 722 975 35.04 Shellharbour (C) 1-19-30-04 379 393 3.69 Shellharbour (C) 1-19-30-05 611 633 3.60 Shellharbour (C) 1-19-30-06 576 605 5.03 Shellharbour (C) 1-19-30-07 562 575 2.31 Shellharbour (C) 1-19-30-08 382 390 2.09 Shellharbour (C) 1-19-30-09 577 598 3.64 Shellharbour (C) 1-19-30-10 774 809 4.52 Shellharbour (C) 1-19-32-01 280 285 1.79 Shellharbour (C) 1-19-32-02 381 394 3.41 Shellharbour (C) 1-19-32-03 807 1415 75.34 Shellharbour (C) 1-19-32-04 428 438 2.34 Shellharbour (C) 1-19-32-05 513 528 2.92 Shellharbour (C) 1-19-32-06 1633 1987 21.68 Shellharbour (C) 1-19-32-07 237 236 -0.42 Shellharbour (C) 1-19-32-08 384 400 4.17

New South Wales Redistribution Statistics 2006
Enrolment Projections Throsby
Actual Enrolment Estimate Growth SLA Name CCD Number 2/12/2005 31/5/2010 (%)
305
Shellharbour (C) 1-19-32-09 371 385 3.77 Shellharbour (C) 1-19-32-10 382 388 1.57 Shellharbour (C) 1-19-32-11 330 335 1.52 Shellharbour (C) 1-19-32-12 594 618 4.04 Shellharbour (C) 1-19-32-13 354 369 4.24 Shellharbour (C) 83 40891 45099 10.29 Wollongong (C) 1-19-15-03 12 11 -8.33 Wollongong (C) 1-19-15-06 313 320 2.24 Wollongong (C) 1-19-15-07 734 740 0.82 Wollongong (C) 1-19-15-08 203 202 -0.49 Wollongong (C) 1-19-16-01 579 580 0.17 Wollongong (C) 1-19-16-02 254 252 -0.79 Wollongong (C) 1-19-16-03 329 319 -3.04 Wollongong (C) 1-19-16-04 0 0 0.00 Wollongong (C) 1-19-16-09 0 0 0.00 Wollongong (C) 1-19-17-01 257 256 -0.39 Wollongong (C) 1-19-17-02 413 404 -2.18 Wollongong (C) 1-19-17-03 540 526 -2.59 Wollongong (C) 1-19-17-04 362 442 22.10 Wollongong (C) 1-19-17-05 410 404 -1.46 Wollongong (C) 1-19-17-06 951 974 2.42 Wollongong (C) 1-19-17-07 33 31 -6.06 Wollongong (C) 1-19-17-08 454 445 -1.98 Wollongong (C) 1-19-17-09 354 360 1.69 Wollongong (C) 1-19-17-10 249 254 2.01 Wollongong (C) 1-19-17-12 604 602 -0.33 Wollongong (C) 1-19-17-13 210 209 -0.48 Wollongong (C) 1-19-17-14 452 458 1.33 Wollongong (C) 1-19-18-01 649 640 -1.39 Wollongong (C) 1-19-18-02 408 405 -0.74 Wollongong (C) 1-19-18-03 429 422 -1.63 Wollongong (C) 1-19-18-04 353 347 -1.70 Wollongong (C) 1-19-18-05 194 195 0.52 Wollongong (C) 1-19-18-06 523 521 -0.38 Wollongong (C) 1-19-18-07 455 483 6.15 Wollongong (C) 1-19-18-08 366 360 -1.64 Wollongong (C) 1-19-18-09 378 372 -1.59 Wollongong (C) 1-19-18-10 531 537 1.13 Wollongong (C) 1-19-18-11 499 516 3.41 Wollongong (C) 1-19-19-01 332 316 -4.82

New South Wales Redistribution Statistics 2006
Enrolment Projections Throsby
Actual Enrolment Estimate Growth SLA Name CCD Number 2/12/2005 31/5/2010 (%)
306
Wollongong (C) 1-19-19-02 538 522 -2.97 Wollongong (C) 1-19-19-03 537 528 -1.68 Wollongong (C) 1-19-19-04 335 332 -0.90 Wollongong (C) 1-19-19-05 279 275 -1.43 Wollongong (C) 1-19-19-06 330 317 -3.94 Wollongong (C) 1-19-19-07 426 419 -1.64 Wollongong (C) 1-19-19-08 514 513 -0.19 Wollongong (C) 1-19-19-09 332 324 -2.41 Wollongong (C) 1-19-19-10 172 166 -3.49 Wollongong (C) 1-19-19-11 352 358 1.70 Wollongong (C) 1-19-19-12 167 171 2.40 Wollongong (C) 1-19-20-01 431 422 -2.09 Wollongong (C) 1-19-20-02 382 378 -1.05 Wollongong (C) 1-19-20-03 353 345 -2.27 Wollongong (C) 1-19-20-04 115 121 5.22 Wollongong (C) 1-19-20-05 165 163 -1.21 Wollongong (C) 1-19-20-06 287 284 -1.05 Wollongong (C) 1-19-20-07 249 249 0.00 Wollongong (C) 1-19-20-08 200 202 1.00 Wollongong (C) 1-19-20-09 549 563 2.55 Wollongong (C) 1-19-20-10 547 563 2.93 Wollongong (C) 1-19-20-11 552 545 -1.27 Wollongong (C) 1-19-20-12 600 578 -3.67 Wollongong (C) 1-19-20-13 352 352 0.00 Wollongong (C) 1-19-21-01 343 346 0.87 Wollongong (C) 1-19-21-02 559 563 0.72 Wollongong (C) 1-19-21-03 256 254 -0.78 Wollongong (C) 1-19-21-04 430 426 -0.93 Wollongong (C) 1-19-21-05 377 381 1.06 Wollongong (C) 1-19-21-06 526 536 1.90 Wollongong (C) 1-19-21-07 415 408 -1.69 Wollongong (C) 1-19-21-08 105 119 13.33 Wollongong (C) 1-19-21-09 623 618 -0.80 Wollongong (C) 1-19-21-10 542 535 -1.29 Wollongong (C) 1-19-21-11 283 275 -2.83 Wollongong (C) 1-19-21-13 251 235 -6.37 Wollongong (C) 1-19-22-01 887 1074 21.08 Wollongong (C) 1-19-22-02 238 236 -0.84 Wollongong (C) 1-19-22-03 397 393 -1.01 Wollongong (C) 1-19-22-04 277 273 -1.44 Wollongong (C) 1-19-22-05 663 652 -1.66 Wollongong (C) 1-19-22-06 883 910 3.06

New South Wales Redistribution Statistics 2006
Enrolment Projections Throsby
Actual Enrolment Estimate Growth SLA Name CCD Number 2/12/2005 31/5/2010 (%)
307
Wollongong (C) 1-19-24-11 1431 1658 15.86
Wollongong (C) 1-19-22-07 462 465 0.65 Wollongong (C) 1-19-22-08 405 400 -1.23 Wollongong (C) 1-19-22-09 531 534 0.56 Wollongong (C) 1-19-22-10 406 396 -2.46 Wollongong (C) 1-19-22-11 644 629 -2.33 Wollongong (C) 1-19-22-12 402 397 -1.24 Wollongong (C) 1-19-23-01 405 714 76.30 Wollongong (C) 1-19-23-02 734 716 -2.45 Wollongong (C) 1-19-23-03 393 394 0.25 Wollongong (C) 1-19-23-04 306 318 3.92 Wollongong (C) 1-19-23-05 235 234 -0.43 Wollongong (C) 1-19-23-06 371 394 6.20 Wollongong (C) 1-19-23-07 302 301 -0.33 Wollongong (C) 1-19-23-08 481 478 -0.62 Wollongong (C) 1-19-23-09 511 511 0.00 Wollongong (C) 1-19-23-10 432 429 -0.69 Wollongong (C) 1-19-23-11 224 225 0.45 Wollongong (C) 1-19-23-12 281 276 -1.78 Wollongong (C) 1-19-23-13 517 511 -1.16 Wollongong (C) 1-19-24-01 413 423 2.42 Wollongong (C) 1-19-24-02 372 374 0.54 Wollongong (C) 1-19-24-03 313 348 11.18 Wollongong (C) 1-19-24-04 426 424 -0.47 Wollongong (C) 1-19-24-05 522 763 46.17 Wollongong (C) 1-19-24-06 213 210 -1.41 Wollongong (C) 1-19-24-07 454 449 -1.10 Wollongong (C) 1-19-24-08 596 585 -1.85 Wollongong (C) 1-19-24-09 1731 2111 21.95 Wollongong (C) 1-19-24-10 1072 1103 2.89
Wollongong (C) 1-19-24-12 456 450 -1.32 Wollongong (C) 1-19-24-13 477 502 5.24 Wollongong (C) 1-19-24-14 210 203 -3.33 Wollongong (C) 109 46377 47752 2.96 Throsby 195 87268 92851 6.40

New South Wales Redistribution Statistics 2006
Enrolment Projections Warringah
Actual Enrolment Estimate Growth SLA Name CCD Number 2/12/2005 31/5/2010 (%)
308
Manly (A) 1-24-27-01 337 341 1.19 Manly (A) 1-24-27-02 558 559 0.18 Manly (A) 1-24-27-03 152 176 15.79 Manly (A) 1-24-27-04 285 276 -3.16 Manly (A) 1-24-27-05 503 513 1.99 Manly (A) 1-24-27-06 705 733 3.97 Manly (A) 1-24-27-07 386 389 0.78 Manly (A) 1-24-27-08 269 288 7.06 Manly (A) 1-24-27-09 281 280 -0.36 Manly (A) 1-24-27-10 492 529 7.52 Manly (A) 1-24-27-11 303 333 9.90 Manly (A) 1-24-28-01 419 411 -1.91 Manly (A) 1-24-28-02 601 599 -0.33 Manly (A) 1-24-28-03 256 265 3.52 Manly (A) 1-24-28-04 555 543 -2.16 Manly (A) 1-24-28-05 553 538 -2.71 Manly (A) 1-24-28-06 498 503 1.00 Manly (A) 1-24-28-07 242 241 -0.41 Manly (A) 1-24-28-08 356 352 -1.12 Manly (A) 1-24-28-09 560 549 -1.96 Manly (A) 1-24-28-10 354 356 0.56 Manly (A) 1-24-29-01 373 400 7.24 Manly (A) 1-24-29-02 399 398 -0.25 Manly (A) 1-24-29-03 202 193 -4.46 Manly (A) 1-24-29-04 296 309 4.39 Manly (A) 1-24-29-05 542 537 -0.92 Manly (A) 1-24-29-06 181 171 -5.52 Manly (A) 1-24-29-07 198 199 0.51 Manly (A) 1-24-29-08 167 163 -2.40 Manly (A) 1-24-29-09 154 154 0.00 Manly (A) 1-24-29-10 485 474 -2.27 Manly (A) 1-24-29-11 370 368 -0.54 Manly (A) 1-24-29-12 389 372 -4.37 Manly (A) 1-24-30-01 398 393 -1.26 Manly (A) 1-24-30-02 429 497 15.85 Manly (A) 1-24-30-03 319 310 -2.82 Manly (A) 1-24-30-04 424 422 -0.47 Manly (A) 1-24-30-05 132 148 12.12 Manly (A) 1-24-30-06 297 333 12.12 Manly (A) 1-24-30-07 341 339 -0.59 Manly (A) 1-24-30-08 213 229 7.51 Manly (A) 1-24-30-09 179 182 1.68

New South Wales Redistribution Statistics 2006
Enrolment Projections Warringah
Actual Enrolment Estimate Growth SLA Name CCD Number 2/12/2005 31/5/2010 (%)
309
Manly (A) 1-24-30-10 105 103 -1.90 Manly (A) 1-24-30-11 127 122 -3.94 Manly (A) 1-24-30-12 248 252 1.61 Manly (A) 1-24-31-01 306 300 -1.96 Manly (A) 1-24-31-02 479 467 -2.51 Manly (A) 1-24-31-03 134 135 0.75 Manly (A) 1-24-31-04 344 357 3.78 Manly (A) 1-24-31-05 159 157 -1.26 Manly (A) 1-24-31-06 374 365 -2.41 Manly (A) 1-24-31-07 367 362 -1.36 Manly (A) 1-24-31-08 283 281 -0.71 Manly (A) 1-24-31-09 326 326 0.00 Manly (A) 1-24-31-10 135 133 -1.48 Manly (A) 1-24-31-11 329 333 1.22 Manly (A) 1-24-31-12 233 245 5.15 Manly (A) 1-24-31-13 339 339 0.00 Manly (A) 1-24-32-01 187 208 11.23 Manly (A) 1-24-32-02 279 271 -2.87 Manly (A) 1-24-32-03 256 294 14.84 Manly (A) 1-24-32-04 115 117 1.74 Manly (A) 1-24-32-05 304 369 21.38 Manly (A) 1-24-32-06 224 341 52.23 Manly (A) 1-24-32-07 325 348 7.08 Manly (A) 1-24-32-08 293 284 -3.07 Manly (A) 1-24-32-09 240 239 -0.42 Manly (A) 1-24-32-10 104 166 59.62 Manly (A) 1-24-33-01 181 190 4.97 Manly (A) 1-24-33-02 222 219 -1.35 Manly (A) 1-24-33-03 281 271 -3.56 Manly (A) 1-24-33-04 321 346 7.79 Manly (A) 1-24-33-05 110 111 0.91 Manly (A) 1-24-33-06 247 270 9.31 Manly (A) 1-24-33-07 203 232 14.29 Manly (A) 1-24-33-08 211 206 -2.37 Manly (A) 1-24-33-09 169 170 0.59 Manly (A) 1-24-33-10 101 102 0.99 Manly (A) 1-24-33-11 199 198 -0.50 Manly (A) 1-24-33-12 172 170 -1.16 Manly (A) 80 24185 24764 2.39 Mosman (A) 1-39-12-01 238 233 -2.10

New South Wales Redistribution Statistics 2006
Enrolment Projections Warringah
Actual Enrolment Estimate Growth SLA Name CCD Number 2/12/2005 31/5/2010 (%)
310
Mosman (A) 1-39-12-02 199 200 0.50 Mosman (A) 1-39-12-03 372 363 -2.42 Mosman (A) 1-39-12-04 341 331 -2.93 Mosman (A) 1-39-12-05 249 256 2.81 Mosman (A) 1-39-12-06 260 332 27.69 Mosman (A) 1-39-12-07 358 405 13.13 Mosman (A) 1-39-12-08 196 205 4.59 Mosman (A) 1-39-12-09 522 540 3.45 Mosman (A) 1-39-12-10 478 487 1.88 Mosman (A) 1-39-12-11 396 481 21.46 Mosman (A) 1-39-13-01 429 443 3.26 Mosman (A) 1-39-13-02 334 335 0.30 Mosman (A) 1-39-13-03 301 299 -0.66 Mosman (A) 1-39-13-04 281 288 2.49 Mosman (A) 1-39-13-05 275 271 -1.45 Mosman (A) 1-39-13-06 373 473 26.81 Mosman (A) 1-39-13-07 272 297 9.19 Mosman (A) 1-39-13-08 368 376 2.17 Mosman (A) 1-39-13-09 469 473 0.85 Mosman (A) 1-39-13-10 221 222 0.45 Mosman (A) 1-39-14-01 243 261 7.41 Mosman (A) 1-39-14-02 368 366 -0.54 Mosman (A) 1-39-14-03 321 326 1.56 Mosman (A) 1-39-14-04 167 179 7.19 Mosman (A) 1-39-14-05 418 429 2.63 Mosman (A) 1-39-14-06 384 414 7.81 Mosman (A) 1-39-14-07 285 298 4.56 Mosman (A) 1-39-14-08 248 251 1.21 Mosman (A) 1-39-14-09 155 174 12.26 Mosman (A) 1-39-15-01 398 413 3.77 Mosman (A) 1-39-15-02 347 342 -1.44 Mosman (A) 1-39-15-03 319 328 2.82 Mosman (A) 1-39-15-04 241 244 1.24 Mosman (A) 1-39-15-05 117 118 0.85 Mosman (A) 1-39-15-06 378 378 0.00 Mosman (A) 1-39-15-07 217 226 4.15 Mosman (A) 1-39-15-08 148 185 25.00 Mosman (A) 1-39-15-09 318 317 -0.31 Mosman (A) 1-39-15-10 380 373 -1.84 Mosman (A) 1-39-16-01 277 285 2.89 Mosman (A) 1-39-16-02 161 162 0.62 Mosman (A) 1-39-16-03 362 367 1.38

New South Wales Redistribution Statistics 2006
Enrolment Projections Warringah
Actual Enrolment Estimate Growth SLA Name CCD Number 2/12/2005 31/5/2010 (%)
311
Mosman (A) 1-39-16-04 300 305 1.67 Mosman (A) 1-39-16-05 485 485 0.00 Mosman (A) 1-39-16-06 207 220 6.28 Mosman (A) 1-39-16-07 245 250 2.04 Mosman (A) 1-39-16-08 192 197 2.60 Mosman (A) 1-39-16-09 326 334 2.45 Mosman (A) 1-39-17-01 25 24 -4.00 Mosman (A) 1-39-17-02 251 248 -1.20 Mosman (A) 1-39-17-03 346 352 1.73 Mosman (A) 1-39-17-04 139 137 -1.44 Mosman (A) 1-39-17-05 267 269 0.75 Mosman (A) 1-39-17-06 223 223 0.00 Mosman (A) 1-39-17-07 382 387 1.31 Mosman (A) 1-39-17-08 190 185 -2.63 Mosman (A) 1-39-17-09 369 383 3.79 Mosman (A) 1-39-17-10 475 475 0.00 Mosman (A) 1-39-17-11 443 451 1.81 Mosman (A) 60 18049 18671 3.45 NSW Water areas 1-24-14-02 0 0 0.00 NSW Water areas 1-24-20-09 0 0 0.00 NSW Water areas 1-45-02-08 1 1 0.00 NSW Water areas 1-45-02-08 0 0 0.00 NSW Water areas 4 1 1 0.00 Warringah (A) 1-24-13-06 343 336 -2.04 Warringah (A) 1-24-13-07 247 259 4.86 Warringah (A) 1-24-13-08 442 433 -2.04 Warringah (A) 1-24-13-11 372 380 2.15 Warringah (A) 1-24-14-01 550 570 3.64 Warringah (A) 1-24-14-03 477 647 35.64 Warringah (A) 1-24-14-04 666 673 1.05 Warringah (A) 1-24-14-05 694 691 -0.43 Warringah (A) 1-24-14-06 488 490 0.41 Warringah (A) 1-24-14-07 629 637 1.27 Warringah (A) 1-24-14-08 567 568 0.18 Warringah (A) 1-24-14-09 295 292 -1.02 Warringah (A) 1-24-14-10 567 559 -1.41 Warringah (A) 1-24-15-01 612 656 7.19 Warringah (A) 1-24-15-02 420 418 -0.48

New South Wales Redistribution Statistics 2006
Enrolment Projections Warringah
Actual Enrolment Estimate Growth SLA Name CCD Number 2/12/2005 31/5/2010 (%)
312
Warringah (A) 1-24-16-12 445 453 1.80
Warringah (A) 1-24-15-03 690 688 -0.29 Warringah (A) 1-24-15-04 337 338 0.30 Warringah (A) 1-24-15-06 366 363 -0.82 Warringah (A) 1-24-15-07 406 408 0.49 Warringah (A) 1-24-15-12 536 534 -0.37 Warringah (A) 1-24-16-01 613 620 1.14 Warringah (A) 1-24-16-02 354 355 0.28 Warringah (A) 1-24-16-03 294 293 -0.34 Warringah (A) 1-24-16-04 426 418 -1.88 Warringah (A) 1-24-16-05 575 570 -0.87 Warringah (A) 1-24-16-06 633 628 -0.79 Warringah (A) 1-24-16-07 456 450 -1.32 Warringah (A) 1-24-16-08 697 703 0.86 Warringah (A) 1-24-16-09 316 345 9.18 Warringah (A) 1-24-16-10 548 870 58.76 Warringah (A) 1-24-16-11 432 426 -1.39
Warringah (A) 1-24-16-13 262 252 -3.82 Warringah (A) 1-24-16-14 627 618 -1.44 Warringah (A) 1-24-18-01 104 103 -0.96 Warringah (A) 1-24-20-08 246 239 -2.85 Warringah (A) 1-24-21-01 259 271 4.63 Warringah (A) 1-24-21-07 234 373 59.40 Warringah (A) 1-24-21-08 534 630 17.98 Warringah (A) 1-24-21-09 277 317 14.44 Warringah (A) 1-24-21-10 185 190 2.70 Warringah (A) 1-24-21-11 164 179 9.15 Warringah (A) 1-24-21-12 190 193 1.58 Warringah (A) 1-24-22-01 584 585 0.17 Warringah (A) 1-24-22-02 422 474 12.32 Warringah (A) 1-24-22-03 242 373 54.13 Warringah (A) 1-24-22-04 536 530 -1.12 Warringah (A) 1-24-22-07 63 62 -1.59 Warringah (A) 1-24-22-09 323 359 11.15 Warringah (A) 1-24-22-10 254 253 -0.39 Warringah (A) 1-24-22-11 169 166 -1.78 Warringah (A) 1-24-22-12 635 636 0.16 Warringah (A) 1-24-22-13 510 508 -0.39 Warringah (A) 1-24-22-14 598 916 53.18 Warringah (A) 1-24-22-15 110 122 10.91 Warringah (A) 1-24-23-01 564 565 0.18 Warringah (A) 1-24-23-02 163 184 12.88

New South Wales Redistribution Statistics 2006
Enrolment Projections Warringah
Actual Enrolment Estimate Growth SLA Name CCD Number 2/12/2005 31/5/2010 (%)
313
Warringah (A) 1-24-23-03 174 176 1.15 Warringah (A) 1-24-23-04 595 601 1.01 Warringah (A) 1-24-23-05 347 361 4.03 Warringah (A) 1-24-23-06 418 428 2.39 Warringah (A) 1-24-23-07 370 369 -0.27 Warringah (A) 1-24-23-08 305 294 -3.61 Warringah (A) 1-24-23-09 193 190 -1.55 Warringah (A) 1-24-23-10 229 238 3.93 Warringah (A) 1-24-23-11 393 408 3.82 Warringah (A) 1-24-23-12 179 187 4.47 Warringah (A) 1-24-23-13 84 120 42.86 Warringah (A) 1-24-23-14 179 174 -2.79 Warringah (A) 1-24-24-01 396 397 0.25 Warringah (A) 1-24-24-02 218 225 3.21 Warringah (A) 1-24-24-03 605 612 1.16 Warringah (A) 1-24-24-04 198 201 1.52 Warringah (A) 1-24-24-05 315 319 1.27 Warringah (A) 1-24-24-06 365 360 -1.37 Warringah (A) 1-24-24-07 185 200 8.11 Warringah (A) 1-24-24-08 333 344 3.30 Warringah (A) 1-24-24-09 310 305 -1.61 Warringah (A) 1-24-24-10 573 583 1.75 Warringah (A) 1-24-24-11 549 555 1.09 Warringah (A) 1-24-24-12 362 362 0.00 Warringah (A) 1-24-24-13 344 350 1.74 Warringah (A) 1-24-24-14 231 311 34.63 Warringah (A) 1-24-24-15 414 413 -0.24 Warringah (A) 1-24-25-01 352 358 1.70 Warringah (A) 1-24-25-02 405 416 2.72 Warringah (A) 1-24-25-03 313 306 -2.24 Warringah (A) 1-24-25-04 302 303 0.33 Warringah (A) 1-24-25-05 201 202 0.50 Warringah (A) 1-24-25-06 213 211 -0.94 Warringah (A) 1-24-25-07 324 329 1.54 Warringah (A) 1-24-25-08 176 174 -1.14 Warringah (A) 1-24-25-09 373 381 2.14 Warringah (A) 1-24-25-10 129 141 9.30 Warringah (A) 1-24-25-11 251 252 0.40 Warringah (A) 1-24-25-12 197 195 -1.02 Warringah (A) 1-24-25-13 426 442 3.76 Warringah (A) 1-24-25-14 351 427 21.65 Warringah (A) 1-24-26-01 459 458 -0.22

New South Wales Redistribution Statistics 2006
Enrolment Projections Warringah
Actual Enrolment Estimate Growth SLA Name CCD Number 2/12/2005 31/5/2010 (%)
314
Warringah (A) 1-24-26-02 491 489 -0.41 Warringah (A) 1-24-26-03 510 511 0.20 Warringah (A) 1-24-26-04 420 429 2.14 Warringah (A) 1-24-26-05 330 327 -0.91 Warringah (A) 1-24-26-06 503 554 10.14 Warringah (A) 1-24-26-07 388 388 0.00 Warringah (A) 1-24-26-08 289 290 0.35 Warringah (A) 1-24-26-09 281 326 16.01 Warringah (A) 1-24-26-10 363 368 1.38 Warringah (A) 1-24-26-11 312 338 8.33 Warringah (A) 1-24-26-12 521 513 -1.54 Warringah (A) 1-24-26-13 127 129 1.57 Warringah (A) 1-24-26-14 98 97 -1.02 Warringah (A) 1-24-26-15 272 279 2.57 Warringah (A) 1-24-26-16 265 274 3.40 Warringah (A) 114 42254 44159 4.51 Warringah 258 84489 87595 3.68
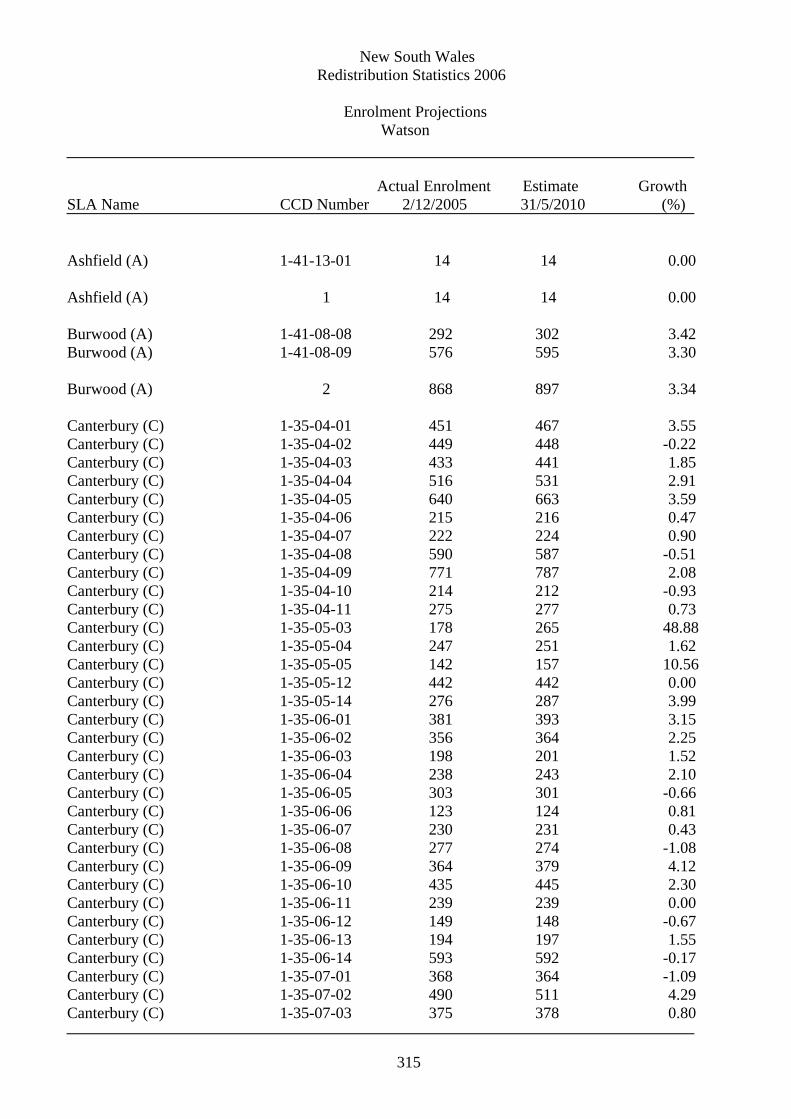
New South Wales Redistribution Statistics 2006
Enrolment Projections Watson
Actual Enrolment Estimate Growth SLA Name CCD Number 2/12/2005 31/5/2010 (%)
315
Ashfield (A) 1-41-13-01 14 14 0.00 Ashfield (A) 1 14 14 0.00 Burwood (A) 1-41-08-08 292 302 3.42 Burwood (A) 1-41-08-09 576 595 3.30 Burwood (A) 2 868 897 3.34 Canterbury (C) 1-35-04-01 451 467 3.55 Canterbury (C) 1-35-04-02 449 448 -0.22 Canterbury (C) 1-35-04-03 433 441 1.85 Canterbury (C) 1-35-04-04 516 531 2.91 Canterbury (C) 1-35-04-05 640 663 3.59 Canterbury (C) 1-35-04-06 215 216 0.47 Canterbury (C) 1-35-04-07 222 224 0.90 Canterbury (C) 1-35-04-08 590 587 -0.51 Canterbury (C) 1-35-04-09 771 787 2.08 Canterbury (C) 1-35-04-10 214 212 -0.93 Canterbury (C) 1-35-04-11 275 277 0.73 Canterbury (C) 1-35-05-03 178 265 48.88 Canterbury (C) 1-35-05-04 247 251 1.62 Canterbury (C) 1-35-05-05 142 157 10.56 Canterbury (C) 1-35-05-12 442 442 0.00 Canterbury (C) 1-35-05-14 276 287 3.99 Canterbury (C) 1-35-06-01 381 393 3.15 Canterbury (C) 1-35-06-02 356 364 2.25 Canterbury (C) 1-35-06-03 198 201 1.52 Canterbury (C) 1-35-06-04 238 243 2.10 Canterbury (C) 1-35-06-05 303 301 -0.66 Canterbury (C) 1-35-06-06 123 124 0.81 Canterbury (C) 1-35-06-07 230 231 0.43 Canterbury (C) 1-35-06-08 277 274 -1.08 Canterbury (C) 1-35-06-09 364 379 4.12 Canterbury (C) 1-35-06-10 435 445 2.30 Canterbury (C) 1-35-06-11 239 239 0.00 Canterbury (C) 1-35-06-12 149 148 -0.67 Canterbury (C) 1-35-06-13 194 197 1.55 Canterbury (C) 1-35-06-14 593 592 -0.17 Canterbury (C) 1-35-07-01 368 364 -1.09 Canterbury (C) 1-35-07-02 490 511 4.29 Canterbury (C) 1-35-07-03 375 378 0.80

New South Wales Redistribution Statistics 2006
Enrolment Projections Watson
Actual Enrolment Estimate Growth SLA Name CCD Number 2/12/2005 31/5/2010 (%)
316
Canterbury (C) 1-35-07-04 224 217 -3.12 Canterbury (C) 1-35-07-05 298 293 -1.68 Canterbury (C) 1-35-07-06 374 377 0.80 Canterbury (C) 1-35-07-07 417 419 0.48 Canterbury (C) 1-35-07-08 284 283 -0.35 Canterbury (C) 1-35-07-09 411 411 0.00 Canterbury (C) 1-35-07-10 181 182 0.55 Canterbury (C) 1-35-07-11 185 200 8.11 Canterbury (C) 1-35-07-12 465 468 0.65 Canterbury (C) 1-35-07-13 118 120 1.69 Canterbury (C) 1-35-07-14 425 422 -0.71 Canterbury (C) 1-35-07-15 266 269 1.13 Canterbury (C) 1-35-07-16 271 269 -0.74 Canterbury (C) 1-35-07-17 188 192 2.13 Canterbury (C) 1-35-08-01 254 254 0.00 Canterbury (C) 1-35-08-02 260 263 1.15 Canterbury (C) 1-35-08-03 306 304 -0.65 Canterbury (C) 1-35-08-04 508 506 -0.39 Canterbury (C) 1-35-08-05 358 363 1.40 Canterbury (C) 1-35-08-06 249 257 3.21 Canterbury (C) 1-35-08-07 301 307 1.99 Canterbury (C) 1-35-08-08 415 431 3.86 Canterbury (C) 1-35-08-09 192 199 3.65 Canterbury (C) 1-35-08-10 212 213 0.47 Canterbury (C) 1-35-08-11 205 207 0.98 Canterbury (C) 1-35-08-12 401 412 2.74 Canterbury (C) 1-35-08-13 373 382 2.41 Canterbury (C) 1-35-09-01 414 411 -0.72 Canterbury (C) 1-35-09-02 520 550 5.77 Canterbury (C) 1-35-09-03 548 535 -2.37 Canterbury (C) 1-35-09-04 398 406 2.01 Canterbury (C) 1-35-09-05 276 275 -0.36 Canterbury (C) 1-35-09-06 179 179 0.00 Canterbury (C) 1-35-09-07 381 383 0.52 Canterbury (C) 1-35-09-08 401 410 2.24 Canterbury (C) 1-35-09-09 240 240 0.00 Canterbury (C) 1-35-09-10 433 593 36.95 Canterbury (C) 1-35-09-11 499 514 3.01 Canterbury (C) 1-35-09-12 284 284 0.00 Canterbury (C) 1-35-09-13 374 395 5.61 Canterbury (C) 1-35-10-01 590 616 4.41 Canterbury (C) 1-35-10-02 328 340 3.66

New South Wales Redistribution Statistics 2006
Enrolment Projections Watson
Actual Enrolment Estimate Growth SLA Name CCD Number 2/12/2005 31/5/2010 (%)
317
Canterbury (C) 1-35-10-03 304 300 -1.32 Canterbury (C) 1-35-10-04 433 440 1.62 Canterbury (C) 1-35-10-05 338 350 3.55 Canterbury (C) 1-35-10-06 0 0 0.00 Canterbury (C) 1-35-10-11 486 484 -0.41 Canterbury (C) 1-35-12-01 711 711 0.00 Canterbury (C) 1-35-12-02 685 685 0.00 Canterbury (C) 1-35-12-03 629 635 0.95 Canterbury (C) 1-35-12-04 368 397 7.88 Canterbury (C) 1-35-12-05 415 428 3.13 Canterbury (C) 1-35-12-06 262 261 -0.38 Canterbury (C) 1-35-12-07 410 402 -1.95 Canterbury (C) 1-35-12-08 309 305 -1.29 Canterbury (C) 1-35-12-09 458 463 1.09 Canterbury (C) 1-35-13-01 317 315 -0.63 Canterbury (C) 1-35-13-02 228 227 -0.44 Canterbury (C) 1-35-13-03 728 726 -0.27 Canterbury (C) 1-35-13-04 549 561 2.19 Canterbury (C) 1-35-13-05 313 311 -0.64 Canterbury (C) 1-35-13-06 383 379 -1.04 Canterbury (C) 1-35-13-07 239 282 17.99 Canterbury (C) 1-35-13-08 367 363 -1.09 Canterbury (C) 1-35-13-09 437 482 10.30 Canterbury (C) 1-35-13-10 219 244 11.42 Canterbury (C) 1-35-13-11 356 359 0.84 Canterbury (C) 1-35-14-01 427 426 -0.23 Canterbury (C) 1-35-14-02 191 186 -2.62 Canterbury (C) 1-35-14-03 341 341 0.00 Canterbury (C) 1-35-14-04 454 471 3.74 Canterbury (C) 1-35-14-05 276 270 -2.17 Canterbury (C) 1-35-14-06 303 307 1.32 Canterbury (C) 1-35-14-07 487 480 -1.44 Canterbury (C) 1-35-14-08 424 425 0.24 Canterbury (C) 1-35-14-09 517 523 1.16 Canterbury (C) 1-35-14-10 239 245 2.51 Canterbury (C) 1-35-14-11 236 233 -1.27 Canterbury (C) 1-35-15-01 485 485 0.00 Canterbury (C) 1-35-15-02 360 370 2.78 Canterbury (C) 1-35-15-03 245 247 0.82 Canterbury (C) 1-35-15-04 612 613 0.16 Canterbury (C) 1-35-15-05 261 262 0.38 Canterbury (C) 1-35-15-06 605 593 -1.98

New South Wales Redistribution Statistics 2006
Enrolment Projections Watson
Actual Enrolment Estimate Growth SLA Name CCD Number 2/12/2005 31/5/2010 (%)
318
Canterbury (C) 1-35-15-07 324 325 0.31 Canterbury (C) 1-35-15-08 770 797 3.51 Canterbury (C) 1-35-15-09 465 464 -0.22 Canterbury (C) 1-35-15-10 316 381 20.57 Canterbury (C) 1-35-16-01 555 559 0.72 Canterbury (C) 1-35-16-02 385 389 1.04 Canterbury (C) 1-35-16-03 464 454 -2.16 Canterbury (C) 1-35-16-04 364 373 2.47 Canterbury (C) 1-35-16-05 648 652 0.62 Canterbury (C) 1-35-16-06 377 373 -1.06 Canterbury (C) 1-35-16-07 717 739 3.07 Canterbury (C) 1-35-16-08 629 629 0.00 Canterbury (C) 1-35-17-01 515 516 0.19 Canterbury (C) 1-35-17-02 319 320 0.31 Canterbury (C) 1-35-17-03 366 355 -3.01 Canterbury (C) 1-35-17-04 354 353 -0.28 Canterbury (C) 1-35-17-05 320 318 -0.62 Canterbury (C) 1-35-17-06 361 359 -0.55 Canterbury (C) 1-35-17-07 299 301 0.67 Canterbury (C) 1-35-17-08 474 465 -1.90 Canterbury (C) 1-35-17-09 463 460 -0.65 Canterbury (C) 1-35-17-10 321 326 1.56 Canterbury (C) 1-35-17-11 486 484 -0.41 Canterbury (C) 1-35-18-01 315 310 -1.59 Canterbury (C) 1-35-18-02 633 651 2.84 Canterbury (C) 1-35-18-03 624 636 1.92 Canterbury (C) 1-35-18-04 541 533 -1.48 Canterbury (C) 1-35-18-05 617 609 -1.30 Canterbury (C) 1-35-18-06 449 443 -1.34 Canterbury (C) 1-35-18-07 530 528 -0.38 Canterbury (C) 1-35-18-08 466 461 -1.07 Canterbury (C) 148 56254 57140 1.57 Hurstville (C) 1-36-05-01 251 252 0.40 Hurstville (C) 1-36-05-02 389 391 0.51 Hurstville (C) 1-36-05-03 273 275 0.73 Hurstville (C) 1-36-05-04 410 416 1.46 Hurstville (C) 1-36-05-06 415 428 3.13 Hurstville (C) 1-36-05-07 585 595 1.71 Hurstville (C) 1-36-06-01 857 863 0.70 Hurstville (C) 1-36-06-02 660 663 0.45

New South Wales Redistribution Statistics 2006
Enrolment Projections Watson
Actual Enrolment Estimate Growth SLA Name CCD Number 2/12/2005 31/5/2010 (%)
319
Hurstville (C) 1-36-08-04 414 431 4.11
Hurstville (C) 1-36-06-03 382 390 2.09 Hurstville (C) 1-36-06-04 460 495 7.61 Hurstville (C) 1-36-06-05 624 683 9.46 Hurstville (C) 1-36-06-06 426 433 1.64 Hurstville (C) 1-36-06-07 281 307 9.25 Hurstville (C) 1-36-06-08 350 358 2.29 Hurstville (C) 1-36-06-09 397 412 3.78 Hurstville (C) 1-36-06-10 254 265 4.33 Hurstville (C) 1-36-06-11 196 204 4.08 Hurstville (C) 1-36-07-01 586 630 7.51 Hurstville (C) 1-36-07-02 325 335 3.08 Hurstville (C) 1-36-07-03 319 343 7.52 Hurstville (C) 1-36-07-04 292 316 8.22 Hurstville (C) 1-36-07-05 550 571 3.82 Hurstville (C) 1-36-07-06 272 280 2.94 Hurstville (C) 1-36-07-07 589 611 3.74 Hurstville (C) 1-36-07-08 181 361 99.45 Hurstville (C) 1-36-07-09 547 553 1.10 Hurstville (C) 1-36-07-10 356 390 9.55 Hurstville (C) 1-36-07-11 467 460 -1.50 Hurstville (C) 1-36-08-01 445 463 4.04 Hurstville (C) 1-36-08-02 519 546 5.20 Hurstville (C) 1-36-08-03 407 432 6.14
Hurstville (C) 1-36-08-10 347 358 3.17 Hurstville (C) 1-36-08-11 323 341 5.57 Hurstville (C) 1-36-08-12 550 566 2.91 Hurstville (C) 1-36-08-13 391 621 58.82 Hurstville (C) 36 15090 16038 6.28 Rockdale (C) 1-36-20-01 394 401 1.78 Rockdale (C) 1-36-20-02 350 360 2.86 Rockdale (C) 1-36-20-03 582 603 3.61 Rockdale (C) 1-36-20-08 222 250 12.61 Rockdale (C) 1-36-20-09 509 521 2.36 Rockdale (C) 1-36-20-10 243 264 8.64 Rockdale (C) 1-36-20-11 394 409 3.81 Rockdale (C) 1-36-21-01 565 564 -0.18 Rockdale (C) 1-36-21-02 344 347 0.87 Rockdale (C) 1-36-21-03 386 386 0.00 Rockdale (C) 1-36-21-04 347 351 1.15

New South Wales Redistribution Statistics 2006
Enrolment Projections Watson
Actual Enrolment Estimate Growth SLA Name CCD Number 2/12/2005 31/5/2010 (%)
320
Rockdale (C) 1-36-21-05 428 423 -1.17 Rockdale (C) 1-36-21-06 616 615 -0.16 Rockdale (C) 1-36-21-07 417 429 2.88 Rockdale (C) 1-36-21-08 262 274 4.58 Rockdale (C) 1-36-21-09 260 268 3.08 Rockdale (C) 1-36-21-10 579 587 1.38 Rockdale (C) 1-36-22-01 587 585 -0.34 Rockdale (C) 1-36-22-02 568 572 0.70 Rockdale (C) 1-36-22-03 499 521 4.41 Rockdale (C) 1-36-22-04 229 225 -1.75 Rockdale (C) 1-36-22-05 281 285 1.42 Rockdale (C) 22 9062 9240 1.96 Watson 209 81288 83329 2.51

New South Wales Redistribution Statistics 2006
Enrolment Projections Wentworth
Actual Enrolment Estimate Growth SLA Name CCD Number 2/12/2005 31/5/2010 (%)
321
Randwick (C) 1-43-01-01 290 297 2.41 Randwick (C) 1-43-01-02 458 453 -1.09 Randwick (C) 1-43-01-03 480 473 -1.46 Randwick (C) 1-43-01-04 226 238 5.31 Randwick (C) 1-43-01-05 482 510 5.81 Randwick (C) 1-43-01-06 409 417 1.96 Randwick (C) 1-43-01-07 390 413 5.90 Randwick (C) 1-43-01-08 302 297 -1.66 Randwick (C) 1-43-01-09 295 292 -1.02 Randwick (C) 1-43-01-10 246 242 -1.63 Randwick (C) 1-43-01-11 276 275 -0.36 Randwick (C) 1-43-04-01 196 194 -1.02 Randwick (C) 1-43-04-02 281 322 14.59 Randwick (C) 1-43-04-03 260 260 0.00 Randwick (C) 1-43-04-04 436 456 4.59 Randwick (C) 1-43-04-06 268 267 -0.37 Randwick (C) 1-43-04-07 198 194 -2.02 Randwick (C) 1-43-04-08 220 221 0.45 Randwick (C) 1-43-04-09 164 162 -1.22 Randwick (C) 1-43-04-10 372 387 4.03 Randwick (C) 1-43-05-01 479 481 0.42 Randwick (C) 1-43-05-02 389 381 -2.06 Randwick (C) 1-43-05-03 284 275 -3.17 Randwick (C) 1-43-05-04 112 108 -3.57 Randwick (C) 1-43-05-05 326 336 3.07 Randwick (C) 1-43-05-06 241 240 -0.41 Randwick (C) 1-43-05-07 268 271 1.12 Randwick (C) 1-43-05-11 170 172 1.18 Randwick (C) 1-43-06-01 250 258 3.20 Randwick (C) 1-43-06-02 199 195 -2.01 Randwick (C) 1-43-06-03 306 300 -1.96 Randwick (C) 1-43-06-05 284 288 1.41 Randwick (C) 1-43-06-06 302 302 0.00 Randwick (C) 1-43-06-07 474 470 -0.84 Randwick (C) 1-43-06-09 214 217 1.40 Randwick (C) 1-43-06-10 317 320 0.95 Randwick (C) 1-43-06-12 329 338 2.74 Randwick (C) 1-43-06-13 329 327 -0.61 Randwick (C) 1-43-07-03 96 100 4.17 Randwick (C) 39 11618 11749 1.13

New South Wales Redistribution Statistics 2006
Enrolment Projections Wentworth
Actual Enrolment Estimate Growth SLA Name CCD Number 2/12/2005 31/5/2010 (%)
322
Waverley (A) 1-44-06-10 395 369 -6.58 Waverley (A) 1-44-06-11 42 40 -4.76 Waverley (A) 1-44-12-01 474 497 4.85 Waverley (A) 1-44-12-02 347 345 -0.58 Waverley (A) 1-44-12-03 179 186 3.91 Waverley (A) 1-44-12-04 274 268 -2.19 Waverley (A) 1-44-12-05 402 390 -2.99 Waverley (A) 1-44-12-06 395 397 0.51 Waverley (A) 1-44-12-07 406 404 -0.49 Waverley (A) 1-44-12-08 362 368 1.66 Waverley (A) 1-44-12-09 130 125 -3.85 Waverley (A) 1-44-13-01 440 445 1.14 Waverley (A) 1-44-13-02 302 309 2.32 Waverley (A) 1-44-13-03 357 347 -2.80 Waverley (A) 1-44-13-04 345 346 0.29 Waverley (A) 1-44-13-05 286 296 3.50 Waverley (A) 1-44-13-06 185 187 1.08 Waverley (A) 1-44-13-07 417 408 -2.16 Waverley (A) 1-44-13-08 261 255 -2.30 Waverley (A) 1-44-13-09 292 286 -2.05 Waverley (A) 1-44-13-10 222 229 3.15 Waverley (A) 1-44-14-01 423 424 0.24 Waverley (A) 1-44-14-02 483 477 -1.24 Waverley (A) 1-44-14-03 395 387 -2.03 Waverley (A) 1-44-14-04 357 367 2.80 Waverley (A) 1-44-14-05 190 191 0.53 Waverley (A) 1-44-14-06 285 281 -1.40 Waverley (A) 1-44-14-07 186 194 4.30 Waverley (A) 1-44-14-08 122 121 -0.82 Waverley (A) 1-44-14-09 84 86 2.38 Waverley (A) 1-44-14-10 513 513 0.00 Waverley (A) 1-44-14-11 299 295 -1.34 Waverley (A) 1-44-14-12 187 187 0.00 Waverley (A) 1-44-15-01 107 107 0.00 Waverley (A) 1-44-15-02 157 154 -1.91 Waverley (A) 1-44-15-03 274 273 -0.36 Waverley (A) 1-44-15-04 285 280 -1.75 Waverley (A) 1-44-15-05 256 251 -1.95 Waverley (A) 1-44-15-06 276 303 9.78 Waverley (A) 1-44-15-07 156 154 -1.28 Waverley (A) 1-44-15-08 209 207 -0.96 Waverley (A) 1-44-15-09 224 223 -0.45

New South Wales Redistribution Statistics 2006
Enrolment Projections Wentworth
Actual Enrolment Estimate Growth SLA Name CCD Number 2/12/2005 31/5/2010 (%)
323
Waverley (A) 1-44-15-10 358 356 -0.56 Waverley (A) 1-44-15-11 148 148 0.00 Waverley (A) 1-44-16-01 211 211 0.00 Waverley (A) 1-44-16-02 282 279 -1.06 Waverley (A) 1-44-16-03 195 193 -1.03 Waverley (A) 1-44-16-04 282 278 -1.42 Waverley (A) 1-44-16-05 204 205 0.49 Waverley (A) 1-44-16-06 272 265 -2.57 Waverley (A) 1-44-16-07 260 261 0.38 Waverley (A) 1-44-16-08 314 320 1.91 Waverley (A) 1-44-16-09 204 198 -2.94 Waverley (A) 1-44-16-10 117 117 0.00 Waverley (A) 1-44-16-11 175 173 -1.14 Waverley (A) 1-44-16-12 182 178 -2.20 Waverley (A) 1-44-17-01 254 245 -3.54 Waverley (A) 1-44-17-02 360 355 -1.39 Waverley (A) 1-44-17-03 235 234 -0.43 Waverley (A) 1-44-17-04 194 186 -4.12 Waverley (A) 1-44-17-05 103 100 -2.91 Waverley (A) 1-44-17-06 304 299 -1.64 Waverley (A) 1-44-17-07 307 294 -4.23 Waverley (A) 1-44-17-08 188 189 0.53 Waverley (A) 1-44-17-09 386 381 -1.30 Waverley (A) 1-44-17-10 226 244 7.96 Waverley (A) 1-44-17-11 253 247 -2.37 Waverley (A) 1-44-18-01 330 321 -2.73 Waverley (A) 1-44-18-02 248 247 -0.40 Waverley (A) 1-44-18-03 219 209 -4.57 Waverley (A) 1-44-18-04 269 267 -0.74 Waverley (A) 1-44-18-05 349 342 -2.01 Waverley (A) 1-44-18-06 243 240 -1.23 Waverley (A) 1-44-18-07 225 216 -4.00 Waverley (A) 1-44-18-08 161 156 -3.11 Waverley (A) 1-44-18-09 181 180 -0.55 Waverley (A) 1-44-18-10 406 392 -3.45 Waverley (A) 1-44-18-11 216 209 -3.24 Waverley (A) 1-44-19-01 371 383 3.23 Waverley (A) 1-44-19-02 359 351 -2.23 Waverley (A) 1-44-19-03 251 247 -1.59 Waverley (A) 1-44-19-04 184 186 1.09 Waverley (A) 1-44-19-05 218 212 -2.75 Waverley (A) 1-44-19-06 213 211 -0.94

New South Wales Redistribution Statistics 2006
Enrolment Projections Wentworth
Actual Enrolment Estimate Growth SLA Name CCD Number 2/12/2005 31/5/2010 (%)
324
Waverley (A) 1-44-19-07 482 472 -2.07 Waverley (A) 1-44-19-08 460 452 -1.74 Waverley (A) 1-44-19-09 109 108 -0.92 Waverley (A) 1-44-20-01 120 118 -1.67 Waverley (A) 1-44-20-02 517 506 -2.13 Waverley (A) 1-44-20-03 189 182 -3.70 Waverley (A) 1-44-20-04 314 309 -1.59 Waverley (A) 1-44-20-05 374 616 64.71 Waverley (A) 1-44-20-06 274 266 -2.92 Waverley (A) 1-44-20-07 466 455 -2.36 Waverley (A) 1-44-20-08 338 333 -1.48 Waverley (A) 1-44-20-09 392 390 -0.51 Waverley (A) 1-44-20-10 224 224 0.00 Waverley (A) 1-44-20-11 339 339 0.00 Waverley (A) 1-44-21-01 291 289 -0.69 Waverley (A) 1-44-21-02 154 155 0.65 Waverley (A) 1-44-21-03 344 341 -0.87 Waverley (A) 1-44-21-04 324 314 -3.09 Waverley (A) 1-44-21-05 198 196 -1.01 Waverley (A) 1-44-21-06 482 478 -0.83 Waverley (A) 1-44-21-07 139 135 -2.88 Waverley (A) 1-44-21-08 357 348 -2.52 Waverley (A) 1-44-21-09 247 239 -3.24 Waverley (A) 1-44-21-10 404 394 -2.48 Waverley (A) 1-44-21-11 210 204 -2.86 Waverley (A) 1-44-21-12 270 266 -1.48 Waverley (A) 1-44-22-01 167 171 2.40 Waverley (A) 1-44-22-02 236 237 0.42 Waverley (A) 1-44-22-03 342 345 0.88 Waverley (A) 1-44-22-04 272 292 7.35 Waverley (A) 1-44-22-05 258 257 -0.39 Waverley (A) 1-44-22-06 247 246 -0.40 Waverley (A) 1-44-22-07 201 197 -1.99 Waverley (A) 1-44-22-08 224 221 -1.34 Waverley (A) 1-44-22-09 267 258 -3.37 Waverley (A) 1-44-22-10 360 350 -2.78 Waverley (A) 1-44-22-11 272 265 -2.57 Waverley (A) 1-44-22-12 427 426 -0.23 Waverley (A) 1-44-23-01 375 365 -2.67 Waverley (A) 1-44-23-02 396 390 -1.52 Waverley (A) 1-44-23-03 336 328 -2.38 Waverley (A) 1-44-23-04 256 254 -0.78

New South Wales Redistribution Statistics 2006
Enrolment Projections Wentworth
Actual Enrolment Estimate Growth SLA Name CCD Number 2/12/2005 31/5/2010 (%)
325
Waverley (A) 1-44-23-05 452 444 -1.77 Waverley (A) 1-44-23-06 371 365 -1.62 Waverley (A) 1-44-23-07 201 203 1.00 Waverley (A) 1-44-23-08 312 318 1.92 Waverley (A) 1-44-23-09 303 296 -2.31 Waverley (A) 1-44-23-10 200 205 2.50 Waverley (A) 1-44-23-11 499 482 -3.41 Waverley (A) 1-44-23-12 205 200 -2.44 Waverley (A) 134 37635 37541 -0.25 Woollahra (A) 1-44-01-01 201 194 -3.48 Woollahra (A) 1-44-01-02 201 199 -1.00 Woollahra (A) 1-44-01-03 98 100 2.04 Woollahra (A) 1-44-01-04 249 246 -1.20 Woollahra (A) 1-44-01-05 317 309 -2.52 Woollahra (A) 1-44-01-06 136 140 2.94 Woollahra (A) 1-44-01-07 179 182 1.68 Woollahra (A) 1-44-01-08 337 353 4.75 Woollahra (A) 1-44-01-09 451 443 -1.77 Woollahra (A) 1-44-01-10 198 211 6.57 Woollahra (A) 1-44-02-01 266 258 -3.01 Woollahra (A) 1-44-02-02 575 558 -2.96 Woollahra (A) 1-44-02-03 281 278 -1.07 Woollahra (A) 1-44-02-04 252 250 -0.79 Woollahra (A) 1-44-02-05 163 160 -1.84 Woollahra (A) 1-44-02-06 123 120 -2.44 Woollahra (A) 1-44-02-07 293 283 -3.41 Woollahra (A) 1-44-02-08 182 177 -2.75 Woollahra (A) 1-44-02-09 180 174 -3.33 Woollahra (A) 1-44-03-01 279 268 -3.94 Woollahra (A) 1-44-03-02 168 166 -1.19 Woollahra (A) 1-44-03-03 342 332 -2.92 Woollahra (A) 1-44-03-04 386 374 -3.11 Woollahra (A) 1-44-03-05 364 353 -3.02 Woollahra (A) 1-44-03-06 303 298 -1.65 Woollahra (A) 1-44-03-07 160 156 -2.50 Woollahra (A) 1-44-03-08 276 290 5.07 Woollahra (A) 1-44-03-09 263 269 2.28 Woollahra (A) 1-44-03-10 222 229 3.15 Woollahra (A) 1-44-03-11 160 167 4.38 Woollahra (A) 1-44-04-01 378 377 -0.26

New South Wales Redistribution Statistics 2006
Enrolment Projections Wentworth
Actual Enrolment Estimate Growth SLA Name CCD Number 2/12/2005 31/5/2010 (%)
326
Woollahra (A) 1-44-04-02 296 297 0.34 Woollahra (A) 1-44-04-03 230 222 -3.48 Woollahra (A) 1-44-04-04 319 316 -0.94 Woollahra (A) 1-44-04-05 207 201 -2.90 Woollahra (A) 1-44-04-06 273 267 -2.20 Woollahra (A) 1-44-04-07 338 331 -2.07 Woollahra (A) 1-44-04-08 291 285 -2.06 Woollahra (A) 1-44-04-09 277 271 -2.17 Woollahra (A) 1-44-04-10 232 229 -1.29 Woollahra (A) 1-44-05-01 288 293 1.74 Woollahra (A) 1-44-05-02 140 137 -2.14 Woollahra (A) 1-44-05-03 417 414 -0.72 Woollahra (A) 1-44-05-04 233 236 1.29 Woollahra (A) 1-44-05-05 423 412 -2.60 Woollahra (A) 1-44-05-06 393 401 2.04 Woollahra (A) 1-44-05-07 360 384 6.67 Woollahra (A) 1-44-05-08 375 389 3.73 Woollahra (A) 1-44-05-09 228 231 1.32 Woollahra (A) 1-44-05-10 132 139 5.30 Woollahra (A) 1-44-06-01 317 310 -2.21 Woollahra (A) 1-44-06-02 172 172 0.00 Woollahra (A) 1-44-06-03 198 207 4.55 Woollahra (A) 1-44-06-04 233 238 2.15 Woollahra (A) 1-44-06-05 303 304 0.33 Woollahra (A) 1-44-06-06 267 261 -2.25 Woollahra (A) 1-44-06-07 206 201 -2.43 Woollahra (A) 1-44-06-08 310 312 0.65 Woollahra (A) 1-44-06-09 332 334 0.60 Woollahra (A) 1-44-06-12 187 186 -0.53 Woollahra (A) 1-44-07-01 233 240 3.00 Woollahra (A) 1-44-07-02 288 307 6.60 Woollahra (A) 1-44-07-03 292 293 0.34 Woollahra (A) 1-44-07-04 97 104 7.22 Woollahra (A) 1-44-07-05 201 199 -1.00 Woollahra (A) 1-44-07-06 194 197 1.55 Woollahra (A) 1-44-07-07 340 348 2.35 Woollahra (A) 1-44-07-08 211 206 -2.37 Woollahra (A) 1-44-07-09 456 448 -1.75 Woollahra (A) 1-44-07-10 476 472 -0.84 Woollahra (A) 1-44-07-11 310 305 -1.61 Woollahra (A) 1-44-07-12 216 230 6.48 Woollahra (A) 1-44-07-13 361 381 5.54

New South Wales Redistribution Statistics 2006
Enrolment Projections Wentworth
Actual Enrolment Estimate Growth SLA Name CCD Number 2/12/2005 31/5/2010 (%)
327
Woollahra (A) 1-44-08-08 253 250 -1.19
Woollahra (A) 1-44-08-01 301 309 2.66 Woollahra (A) 1-44-08-02 196 185 -5.61 Woollahra (A) 1-44-08-03 211 215 1.90 Woollahra (A) 1-44-08-04 266 257 -3.38 Woollahra (A) 1-44-08-05 448 455 1.56 Woollahra (A) 1-44-08-06 240 245 2.08 Woollahra (A) 1-44-08-07 181 173 -4.42
Woollahra (A) 1-44-08-09 378 369 -2.38 Woollahra (A) 1-44-08-10 205 198 -3.41 Woollahra (A) 1-44-08-11 623 628 0.80 Woollahra (A) 1-44-08-12 271 278 2.58 Woollahra (A) 1-44-08-13 200 199 -0.50 Woollahra (A) 1-44-09-01 124 122 -1.61 Woollahra (A) 1-44-09-02 283 283 0.00 Woollahra (A) 1-44-09-03 383 378 -1.31 Woollahra (A) 1-44-09-04 380 390 2.63 Woollahra (A) 1-44-09-05 440 442 0.45 Woollahra (A) 1-44-09-06 232 242 4.31 Woollahra (A) 1-44-09-07 338 328 -2.96 Woollahra (A) 1-44-09-08 455 452 -0.66 Woollahra (A) 1-44-09-09 223 206 -7.62 Woollahra (A) 1-44-09-10 374 370 -1.07 Woollahra (A) 1-44-10-01 293 294 0.34 Woollahra (A) 1-44-10-02 215 218 1.40 Woollahra (A) 1-44-10-03 507 515 1.58 Woollahra (A) 1-44-10-04 301 299 -0.66 Woollahra (A) 1-44-10-05 345 370 7.25 Woollahra (A) 1-44-10-06 350 344 -1.71 Woollahra (A) 1-44-10-07 488 465 -4.71 Woollahra (A) 1-44-10-08 543 533 -1.84 Woollahra (A) 1-44-10-09 291 307 5.50 Woollahra (A) 1-44-10-10 303 306 0.99 Woollahra (A) 1-44-11-01 241 235 -2.49 Woollahra (A) 1-44-11-02 255 261 2.35 Woollahra (A) 1-44-11-03 433 431 -0.46 Woollahra (A) 1-44-11-04 507 508 0.20 Woollahra (A) 1-44-11-05 339 342 0.88 Woollahra (A) 1-44-11-06 428 444 3.74 Woollahra (A) 1-44-11-07 336 343 2.08 Woollahra (A) 1-44-11-08 181 180 -0.55 Woollahra (A) 1-44-11-09 286 282 -1.40
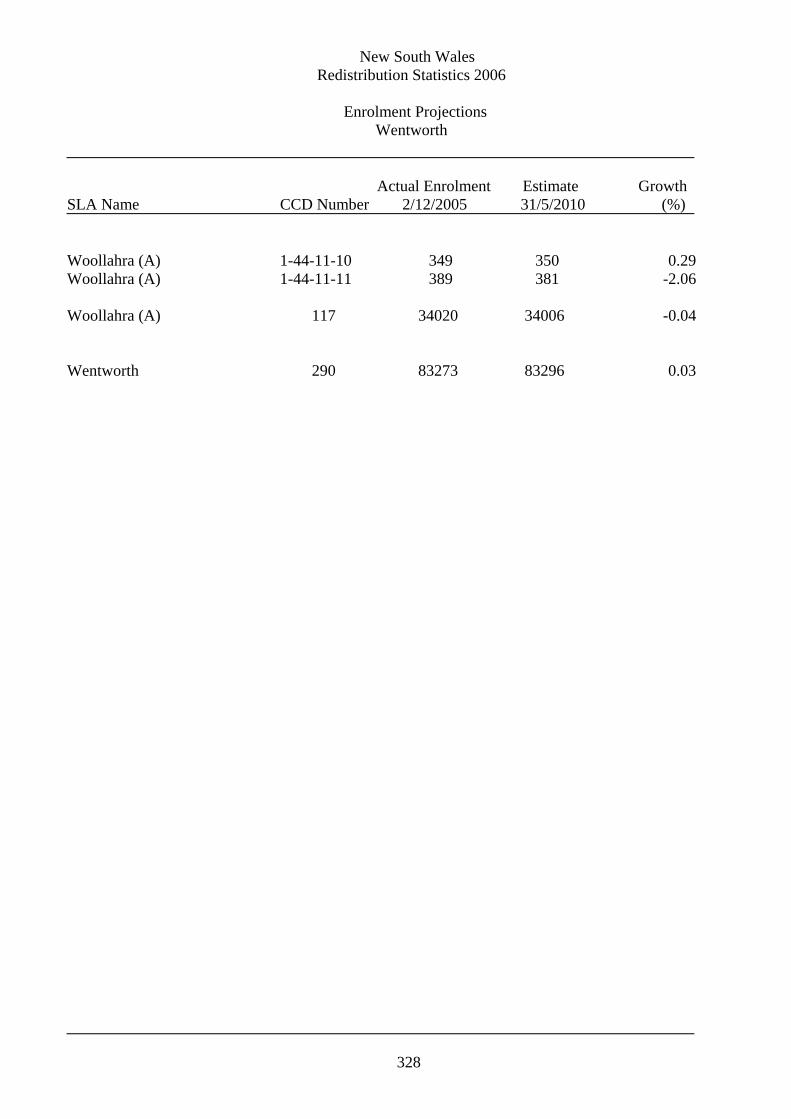
New South Wales Redistribution Statistics 2006
Enrolment Projections Wentworth
Actual Enrolment Estimate Growth SLA Name CCD Number 2/12/2005 31/5/2010 (%)
328
Woollahra (A) 1-44-11-10 349 350 0.29 Woollahra (A) 1-44-11-11 389 381 -2.06 Woollahra (A) 117 34020 34006 -0.04 Wentworth 290 83273 83296 0.03

New South Wales Redistribution Statistics 2006
Enrolment Projections Werriwa
Actual Enrolment Estimate Growth SLA Name CCD Number 2/12/2005 31/5/2010 (%)
329
Campbelltown (C) 1-30-01-01 100 102 2.00 Campbelltown (C) 1-30-01-02 488 493 1.02 Campbelltown (C) 1-30-01-03 391 403 3.07 Campbelltown (C) 1-30-01-04 416 424 1.92 Campbelltown (C) 1-30-01-05 527 537 1.90 Campbelltown (C) 1-30-01-06 610 628 2.95 Campbelltown (C) 1-30-01-07 725 749 3.31 Campbelltown (C) 1-30-01-08 455 461 1.32 Campbelltown (C) 1-30-01-09 705 741 5.11 Campbelltown (C) 1-30-01-10 361 375 3.88 Campbelltown (C) 1-30-01-11 484 493 1.86 Campbelltown (C) 1-30-01-12 404 418 3.47 Campbelltown (C) 1-30-01-13 359 365 1.67 Campbelltown (C) 1-30-01-14 317 322 1.58 Campbelltown (C) 1-30-02-01 499 520 4.21 Campbelltown (C) 1-30-02-02 474 751 58.44 Campbelltown (C) 1-30-02-03 729 764 4.80 Campbelltown (C) 1-30-02-04 479 493 2.92 Campbelltown (C) 1-30-02-05 339 351 3.54 Campbelltown (C) 1-30-02-06 355 366 3.10 Campbelltown (C) 1-30-02-07 417 437 4.80 Campbelltown (C) 1-30-02-08 354 375 5.93 Campbelltown (C) 1-30-02-09 548 559 2.01 Campbelltown (C) 1-30-02-10 484 501 3.51 Campbelltown (C) 1-30-04-01 451 467 3.55 Campbelltown (C) 1-30-09-09 329 342 3.95 Campbelltown (C) 1-30-09-10 336 346 2.98 Campbelltown (C) 1-30-11-01 324 356 9.88 Campbelltown (C) 1-30-11-02 486 535 10.08 Campbelltown (C) 1-30-11-03 453 503 11.04 Campbelltown (C) 1-30-11-04 443 470 6.09 Campbelltown (C) 1-30-11-05 366 383 4.64 Campbelltown (C) 1-30-11-06 528 559 5.87 Campbelltown (C) 1-30-11-07 283 312 10.25 Campbelltown (C) 1-30-11-08 33 34 3.03 Campbelltown (C) 1-30-11-09 445 474 6.52 Campbelltown (C) 1-30-11-10 406 413 1.72 Campbelltown (C) 1-30-11-11 238 262 10.08 Campbelltown (C) 1-30-11-12 296 308 4.05 Campbelltown (C) 1-30-12-01 19 169 789.47 Campbelltown (C) 1-30-12-02 220 224 1.82

New South Wales Redistribution Statistics 2006
Enrolment Projections Werriwa
Actual Enrolment Estimate Growth SLA Name CCD Number 2/12/2005 31/5/2010 (%)
330
Campbelltown (C) 1-30-12-03 526 562 6.84 Campbelltown (C) 1-30-12-04 568 647 13.91 Campbelltown (C) 1-30-12-05 347 378 8.93 Campbelltown (C) 1-30-12-06 468 492 5.13 Campbelltown (C) 1-30-12-07 423 436 3.07 Campbelltown (C) 1-30-12-08 435 478 9.89 Campbelltown (C) 1-30-12-09 564 579 2.66 Campbelltown (C) 1-30-12-10 305 314 2.95 Campbelltown (C) 1-30-12-11 618 635 2.75 Campbelltown (C) 1-30-12-12 411 428 4.14 Campbelltown (C) 1-30-13-01 518 850 64.09 Campbelltown (C) 1-30-13-02 403 945 134.49 Campbelltown (C) 1-30-13-03 420 456 8.57 Campbelltown (C) 1-30-13-04 293 291 -0.68 Campbelltown (C) 1-30-13-05 259 293 13.13 Campbelltown (C) 1-30-13-06 560 612 9.29 Campbelltown (C) 1-30-13-07 384 398 3.65 Campbelltown (C) 1-30-13-08 427 443 3.75 Campbelltown (C) 1-30-13-09 473 508 7.40 Campbelltown (C) 1-30-13-10 240 254 5.83 Campbelltown (C) 1-30-13-11 264 267 1.14 Campbelltown (C) 1-30-13-12 333 380 14.11 Campbelltown (C) 1-30-14-01 387 395 2.07 Campbelltown (C) 1-30-14-02 481 498 3.53 Campbelltown (C) 1-30-14-03 336 353 5.06 Campbelltown (C) 1-30-14-04 324 327 0.93 Campbelltown (C) 1-30-14-05 345 357 3.48 Campbelltown (C) 1-30-14-06 356 375 5.34 Campbelltown (C) 1-30-14-07 258 281 8.91 Campbelltown (C) 1-30-14-08 268 292 8.96 Campbelltown (C) 1-30-14-09 587 607 3.41 Campbelltown (C) 1-30-14-10 408 422 3.43 Campbelltown (C) 1-30-14-11 470 502 6.81 Campbelltown (C) 1-30-14-12 212 211 -0.47 Campbelltown (C) 1-30-15-01 298 317 6.38 Campbelltown (C) 1-30-15-02 230 240 4.35 Campbelltown (C) 1-30-15-03 322 329 2.17 Campbelltown (C) 1-30-15-04 227 241 6.17 Campbelltown (C) 1-30-15-05 593 601 1.35 Campbelltown (C) 1-30-15-06 519 536 3.28 Campbelltown (C) 1-30-15-07 625 660 5.60

New South Wales Redistribution Statistics 2006
Enrolment Projections Werriwa
Actual Enrolment Estimate Growth SLA Name CCD Number 2/12/2005 31/5/2010 (%)
331
Campbelltown (C) 1-30-15-08 250 259 3.60 Campbelltown (C) 1-30-15-09 312 329 5.45 Campbelltown (C) 1-30-15-10 229 231 0.87 Campbelltown (C) 1-30-15-11 393 410 4.33 Campbelltown (C) 1-30-16-01 377 404 7.16 Campbelltown (C) 1-30-16-02 247 350 41.70 Campbelltown (C) 1-30-16-03 319 330 3.45 Campbelltown (C) 1-30-16-04 373 386 3.49 Campbelltown (C) 1-30-16-05 487 511 4.93 Campbelltown (C) 1-30-16-06 274 279 1.82 Campbelltown (C) 1-30-16-07 649 678 4.47 Campbelltown (C) 1-30-16-08 474 484 2.11 Campbelltown (C) 1-30-16-09 421 438 4.04 Campbelltown (C) 1-30-16-10 395 414 4.81 Campbelltown (C) 1-30-16-11 351 371 5.70 Campbelltown (C) 1-30-16-12 508 521 2.56 Campbelltown (C) 98 39220 42370 8.03 Liverpool (C) 1-29-01-07 439 480 9.34 Liverpool (C) 1-29-01-10 541 585 8.13 Liverpool (C) 1-29-02-01 486 535 10.08 Liverpool (C) 1-29-02-02 436 477 9.40 Liverpool (C) 1-29-02-03 296 329 11.15 Liverpool (C) 1-29-02-04 1590 1936 21.76 Liverpool (C) 1-29-02-05 202 1327 556.93 Liverpool (C) 1-29-02-06 597 642 7.54 Liverpool (C) 1-29-02-07 828 970 17.15 Liverpool (C) 1-29-02-09 278 298 7.19 Liverpool (C) 1-29-02-11 1037 1301 25.46 Liverpool (C) 1-29-02-12 169 182 7.69 Liverpool (C) 1-29-02-13 215 239 11.16 Liverpool (C) 1-29-02-14 537 578 7.64 Liverpool (C) 1-29-02-15 714 797 11.62 Liverpool (C) 1-29-02-16 889 1414 59.06 Liverpool (C) 1-29-02-17 495 625 26.26 Liverpool (C) 1-29-02-18 546 675 23.63 Liverpool (C) 1-29-02-19 488 585 19.88 Liverpool (C) 1-29-02-20 496 537 8.27 Liverpool (C) 1-29-02-21 608 641 5.43 Liverpool (C) 1-29-02-22 710 812 14.37

New South Wales Redistribution Statistics 2006
Enrolment Projections Werriwa
Actual Enrolment Estimate Growth SLA Name CCD Number 2/12/2005 31/5/2010 (%)
332
Liverpool (C) 1-29-02-23 717 819 14.23 Liverpool (C) 1-29-02-24 374 413 10.43 Liverpool (C) 1-29-03-05 338 358 5.92 Liverpool (C) 1-29-03-06 408 441 8.09 Liverpool (C) 1-29-03-07 274 304 10.95 Liverpool (C) 1-29-03-08 244 259 6.15 Liverpool (C) 1-29-03-10 277 303 9.39 Liverpool (C) 1-29-03-11 258 281 8.91 Liverpool (C) 1-29-05-05 213 232 8.92 Liverpool (C) 1-29-05-06 441 476 7.94 Liverpool (C) 1-29-05-07 294 317 7.82 Liverpool (C) 1-29-05-08 448 494 10.27 Liverpool (C) 1-29-05-09 417 450 7.91 Liverpool (C) 1-29-05-10 1726 2080 20.51 Liverpool (C) 1-29-05-11 880 1273 44.66 Liverpool (C) 1-29-05-12 838 972 15.99 Liverpool (C) 1-29-06-04 453 487 7.51 Liverpool (C) 1-29-06-05 533 584 9.57 Liverpool (C) 1-29-12-02 268 283 5.60 Liverpool (C) 1-29-12-03 629 690 9.70 Liverpool (C) 1-29-12-06 270 310 14.81 Liverpool (C) 1-29-12-07 250 290 16.00 Liverpool (C) 1-29-12-08 498 557 11.85 Liverpool (C) 1-29-12-09 760 816 7.37 Liverpool (C) 1-29-12-10 605 646 6.78 Liverpool (C) 1-29-12-11 565 598 5.84 Liverpool (C) 1-29-12-12 358 385 7.54 Liverpool (C) 1-29-13-01 970 1131 16.60 Liverpool (C) 1-29-13-02 914 1010 10.50 Liverpool (C) 1-29-13-03 24 120 400.00 Liverpool (C) 1-29-13-04 551 665 20.69 Liverpool (C) 1-29-13-05 844 938 11.14 Liverpool (C) 1-29-13-06 838 933 11.34 Liverpool (C) 1-29-13-07 207 226 9.18 Liverpool (C) 1-29-13-08 674 715 6.08 Liverpool (C) 1-29-13-09 444 510 14.86 Liverpool (C) 1-29-13-10 921 1154 25.30 Liverpool (C) 1-29-13-11 486 623 28.19 Liverpool (C) 1-29-13-12 275 575 109.09 Liverpool (C) 1-29-13-13 508 551 8.46 Liverpool (C) 1-29-13-14 492 513 4.27

New South Wales Redistribution Statistics 2006
Enrolment Projections Werriwa
Actual Enrolment Estimate Growth SLA Name CCD Number 2/12/2005 31/5/2010 (%)
333
Liverpool (C) 1-29-13-15 401 555 38.40 Liverpool (C) 1-29-13-16 673 719 6.84 Liverpool (C) 1-29-13-17 620 706 13.87 Liverpool (C) 1-29-13-18 884 1095 23.87 Liverpool (C) 1-29-13-19 757 842 11.23 Liverpool (C) 1-29-13-20 413 436 5.57 Liverpool (C) 1-29-13-21 1018 1180 15.91 Liverpool (C) 1-29-13-22 510 562 10.20 Liverpool (C) 1-29-13-23 521 740 42.03 Liverpool (C) 1-29-13-24 883 960 8.72 Liverpool (C) 1-29-13-25 471 495 5.10 Liverpool (C) 1-29-17-01 477 511 7.13 Liverpool (C) 1-29-17-02 507 537 5.92 Liverpool (C) 1-29-17-03 592 641 8.28 Liverpool (C) 1-29-17-04 572 611 6.82 Liverpool (C) 1-29-17-05 469 515 9.81 Liverpool (C) 1-29-17-06 616 657 6.66 Liverpool (C) 1-29-17-07 729 780 7.00 Liverpool (C) 1-29-17-08 898 1160 29.18 Liverpool (C) 1-29-17-09 633 678 7.11 Liverpool (C) 1-29-17-10 661 705 6.66 Liverpool (C) 1-29-17-11 637 692 8.63 Liverpool (C) 1-29-17-12 455 480 5.49 Liverpool (C) 1-29-17-13 863 922 6.84 Liverpool (C) 1-29-17-14 440 452 2.73 Liverpool (C) 1-29-17-15 426 462 8.45 Liverpool (C) 89 50207 58840 17.19 Werriwa 187 89427 101210 13.18 New South Wales 11857 4308595 4581939 6.34