elasticities quantitative measurement. measuring the impact of price on quantity demanded a natural...
TRANSCRIPT

Elasticities
Quantitative Measurement

Measuring the Impact of Price on Quantity Demanded
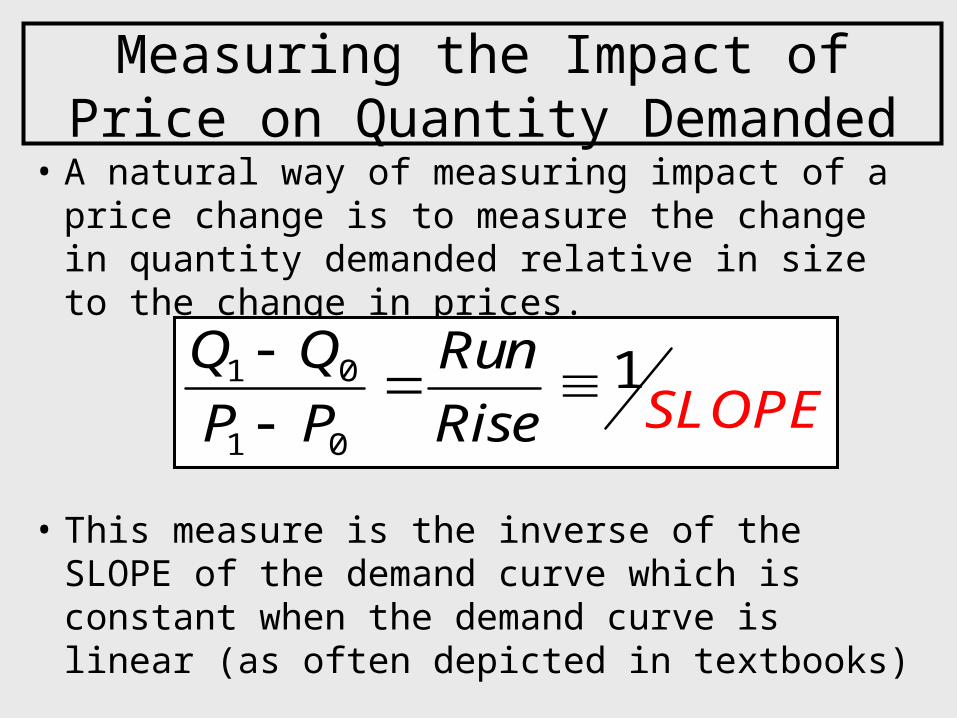
• A natural way of measuring impact of a price change is to measure the change in quantity demanded relative in size to the change in prices.
• This measure is the inverse of the SLOPE of the demand curve which is constant when the demand curve is linear (as often depicted in textbooks)
1 0
1 0
1Q Q Run
P P Rise SLOPE

Economists often prefer elasticity to slope in real world
• Economists typically do not measure the price impact using slope for 2 reasons.
1. Slope as a measure is not unit free, so price impacts are not comparable across types of goods or currency.
2. Empirical demand curves tend not to have constant slope or constant elasticity, but constant elasticity functions are a better approximation.

Elasticity: The % impact on quantity demanded of a 1% change in price
• Economists prefer to measure price impacts in terms of elasticity since it is unit free (everything is measured in percentages) and a better match for empirical demand schedules.
% %
%%
Change in Q Change n P
e
i
QP
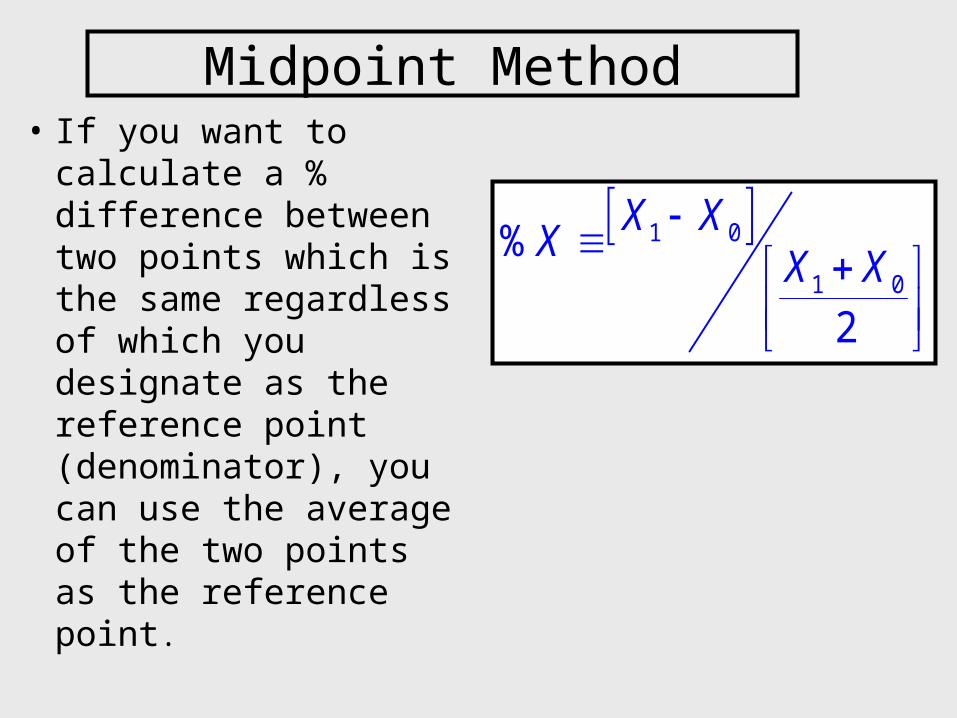
Midpoint Method• If you want to
calculate a % difference between two points which is the same regardless of which you designate as the reference point (denominator), you can use the average of the two points as the reference point.
1 0
1 0
%
2
X XX
X X

Slope and Elasticity of Oil DemandUS$/BBL BBL (Mil) 1/Slope ElasticityP Q %P %Q ΔQ÷ΔP %ΔQ÷%ΔP
40 31,312.80.118 -0.007 -259.273 -0.061
45 31088.60.105 -0.006 -6217.720 -0.061
50 30889.430.095 -0.006 -6177.887 -0.061
55 30710.370.087 -0.005 -6142.073 -0.061
60 30,547.80.080 -0.005 -6109.559 -0.061
65 30399.010.074 -0.005 -6079.801 -0.061
70 30261.90.069 -0.004 -6052.379 -0.061
75 30134.80.065 -0.004 -6026.961 -0.061
80 30,016.4

What determines price elasticity? Availability of Substitutes
• A price increase will lead to a shift away from the use of a product and toward other products.
• Elasticity will be stronger the more readily available are substitutes for a good.– Particular brand of goods may have more elastic
demand than broader category. Dairy Farm Milk may have better substitutes than Milk.
– Some necessity goods like medicines may have no good substitutes and be demand inelastic. Frivolous goods might easily be foregone.

Elasticities Extreme
Perfectly Inelastic Demand (Insulin)
Perfectly Elastic Demand (Clear Pepsi)
P
Q
D
D

Comparisons of Demand Price Elasticities
• Oil has very inelastic demand. – Estimate of
elasticity of demand for oil in the US is -.061
J.C.B. Cooper, OPEC Review, 2003)
Salt -.1
Coffee -.25
Tobacco -.45
Movies -.9
Housing -1.2
Restaurant Meals -2.3
Price Elasticities of Other Goods

A demand curve is classified as INELASTIC if the elasticity is between 0 and -1
A demand curve is classified as ELASTIC if the elasticity is less than -1
Unit elasticity (elasticity equal to -1) is the cutoff point

• The revenues generated by a firm along any point of the demand schedule are equal to the product of quantity demanded and price
R = P∙QD
• Raising prices has two counter-veiling effects:1. a direct positive impact on revenues because each
good sold generates more revenue.2. a negative indirect impact because fewer goods will
be sold. • Which is stronger?
Elasticity and Revenues

Effect of price change on revenues
• Changes in revenues are approximately %R ≈ %P+%Q
• Divide through by %P to get the total impact
% 1%DemandR eP
% % % %1
% % % %
R P Q Q
P P P P
0Demande

• If the price elasticity of demand is – exactly UNITY, a price rise has no effect on
total revenue– ELASTIC, a price rise will decrease revenues.– INELASTIC elastic, a price rise will increase
revenues.

Demand Curves
Elastic Unit Inelastic

Elasticity of Demand Short-term vs. Long-term
• It takes time to find substitutes for goods or to adjust consumption behavior in response to a change in prices.
• The long-run response to a price rise is larger than the short-run. Price elasticity of demand is more negative in the long run than in the short run.
.

Oil Demand much more elastic in long run than short-run
Price Elasticity of DemandShort-term Long-term
Germany -0.024 -0.274Japan -0.071 -0.357Korea -0.094 -0.178USA -0.061 -0.453
–(J.C.B. Cooper, OPEC Review, 2003)

Oil Demand Curves
0
10
20
30
40
50
60
70
80
20000 25000 30000 35000 40000 45000 50000
Q
P
Short-term Long-term
Supply Curves
Price Elasticity

Upward Sloping Supply Curves• The supply curve slopes up because some
factors are fixed and other factors have decreasing returns.
• The greater share of factors of production are flexible, the more elastic the supply curve will be.
1 0
1 0
1 0
2
1 0
2
%% 0
S S
S S
S Q Q
P P
Q Q
QP P P
Price Elasticity of Supply = eS

Elasticities: Supply
Perfectly Inelastic Supply
(Van Gogh Paintings)
Perfectly Elastic Supply (Foot Massage)
P
Q
S
S

Elasticity of Supply
• Elasticity of supply curve depends on the ability of production sector to ramp up supply without increasing the marginal cost of production.
• A good that is produced with readily available factors w/o a need for time consuming investment will have an elastic supply curve.

Price Elasticity of Supply
• Firms also find it easier to adjust production in the long-run than the short run. Long-run price elasticity of supply is typically greater than short-run
• OECD study suggests price elasticity of oil supply is .04 in short run and .35 in long run.

Oil Supply Curves
0
10
20
30
40
50
60
70
80
18000 23000 28000 33000 38000
Q
PShort-term Long-term

Elasticity and Equilibrium Price Changes

Changes in Equilibrium
• When events cause a supply or demand curve to shift, the equilibrium price will shift. But how much?
• Knowledge of elasticities can provide the answer to this question.

Equilibrium Change in Price
• A 1% shift out in the demand curve leads to a change in equilibrium price.
• A 1% shift out in the supply curve leads to a change in equilibrium price.
1%
S De e
1%
S De e

Examples
• Elasticity of demand for oil is eD = -.061 and elasticity of supply is eS = .04. World oil demand goes up by 1%. How much does the price change?
• Answer:1 1 1
1 % % % 9.90%.04 .061 .101S De e

Example 2
• What would happen to oil prices for Geo-Political reasons there were a shut-down of Iranian oil production and there was an inward shift in the oil supply curve of 4.9%?

A shift in the supply schedule(Spreadsheet)
Supply Supply' Demand30 29893.38 28428.61 31867.1135 30078.28 28604.44 31568.8640 30239.36 28757.63 31312.7745 30382.16 28893.44 31088.650 30510.48 29015.46 30889.4355 30627.02 29126.29 30710.3760 30733.8 29227.84 30547.865 30832.36 29321.57 30399.0170 30923.89 29408.62 30261.975 31009.35 29489.89 30134.880 31089.51 29566.12 30016.485 31164.99 29637.9 29905.690 31236.32 29705.74 29801.51
95 31303.95 29770.06 29703.39100 31368.24 29831.2 29610.59105 31429.56 29889.51 29522.57
A 4.9% shift in the supply schedule
At the new supply curve there is excess demand for oil.
• Excess demand will induce additional supply and cut back in demand.
What is the new equilibrium?
Demand Shifters
Income Elasticity/ Cross Price Elasticity

Income Elasticity
• We measure the effect of income on demand for a good as % effect on demand of a 1% increase in income.
• For normal goods, income elasticity is positive.
• For inferior goods income elasticity is negative.

Luxuries vs. Necessities
• There are two types of normal goods.
• Luxuries take up an increasing share of income as your income grows.– Luxuries are income elastic - the income elasticity of
luxuries is greater than 1.
• Necessities take up a declining share of income as your income grows. – Necessities are income inelastic – the income elasticity
of luxuries is less than 1.

Range of Income Elasticities
0 1
Inferior Goods
Normal Goods
Income Elastic (Luxury Goods)
Income Inelastic (Necessities)

Source: OECD study
• Assume a world income elasticity of .5 and an increase of world income equal to 10%. Demand shifts out by 5%.
• Would oil production increase by 5%?
Region Income Elasticity
China 0.7
OECD 0.4
ROW 0.6
Income Elasticity of Oil

Example
• What would the oil price change be in the long run, if world income went up permanently by 10% and no shift in supply curve?

Changes in Prices of Other Goods
• For any good there are two types of other goods which are relevant to its demand
1. Substitutes: Those other goods which can take the place of the good of interest (bacon vs. ham)
2. Complements: Those other goods whose use will enhance the value of the good of interest. (bacon and eggs)
What are substitutes and complements for oil

Substitutes vs. Complements• A good is defined as a “Substitute”
when a rise in its price leads to a shift out/up in the demand curve for the good of interest.
• A good is defined as a “Complement” when a rise in its price leads to a shift in/down in the demand curve for the good of interest.

Cross Price Elasticity• Cross price elasticity is the % effect on the
quantity demanded of a % change in another price.– Goods with positive cross-price elasticities are
called substitutes– Goods with negative cross price elasticities are
called complements
0
SubstitutesComplements

Learning Outcome
• Students should be able to:• Calculate an elasticity given two points on a supply or
demand curve.• Use demand elasticities to calculate price elasticity of
revenue.• Use elasticity estimates to calculate changes in equilibrium
prices from shifts in demand or supply curves.• Use cross-price elasticities or income elasticities to
calculate size of shifts in the demand curve caused by external events.