measuring the impact of the oil price collapse on the … the impact of the oil price collapse on...
TRANSCRIPT
Measuring the Impact of the Oil Price Collapse on the U.S. Shale Revolution
A Global to Regional Analysis
By:John Harpole
Presentation to:Vital for Colorado Board of Directors
Denver, CO
February 18, 2015

U.S. Crude Oil Imports

The U.S. has experienced a rapid increase in natural gas and oil production from shale and other tight resources
3
Sources: EIA derived from state administrative data collected by DrillingInfo Inc. Data are through April 2014 and represent EIA’s official tight oil & shale gas estimates, but are not survey data. State abbreviations indicate primary state(s).
IAEE International ConferenceJune 16, 2014 3
Source: U.S. oil and natural gas outlook, Adam Sieminski, EIA Administrator, Presentation to IAEE International Conference, June 16, 2014

Growing tight oil and offshore crude oil production drive U.S. output close to historical high
4
U.S. crude oil productionmillion barrels per day
Source: EIA, Annual Energy Outlook 2014 Reference case
Tight oil
Alaska
Other lower 48 onshore
Lower 48 offshore
ProjectionsHistory 2012
IAEE International Conference June 16, 2014
U.S. maximum production level of9.6 million barrels per day in 1970
4Source: U.S. oil and natural gas outlook, Adam Sieminski, EIA Administrator, Presentation to IAEE International Conference, June 16, 2014

5Source: My top ten energy charts of the year for 2014, Mark J. Perry, American Enterprise Institute, January 5, 2015

6Source: My top ten energy charts of the year for 2014, Mark J. Perry, American Enterprise Institute, January 5, 2015

7Source: My top ten energy charts of the year for 2014, Mark J. Perry, American Enterprise Institute, January 5, 2015
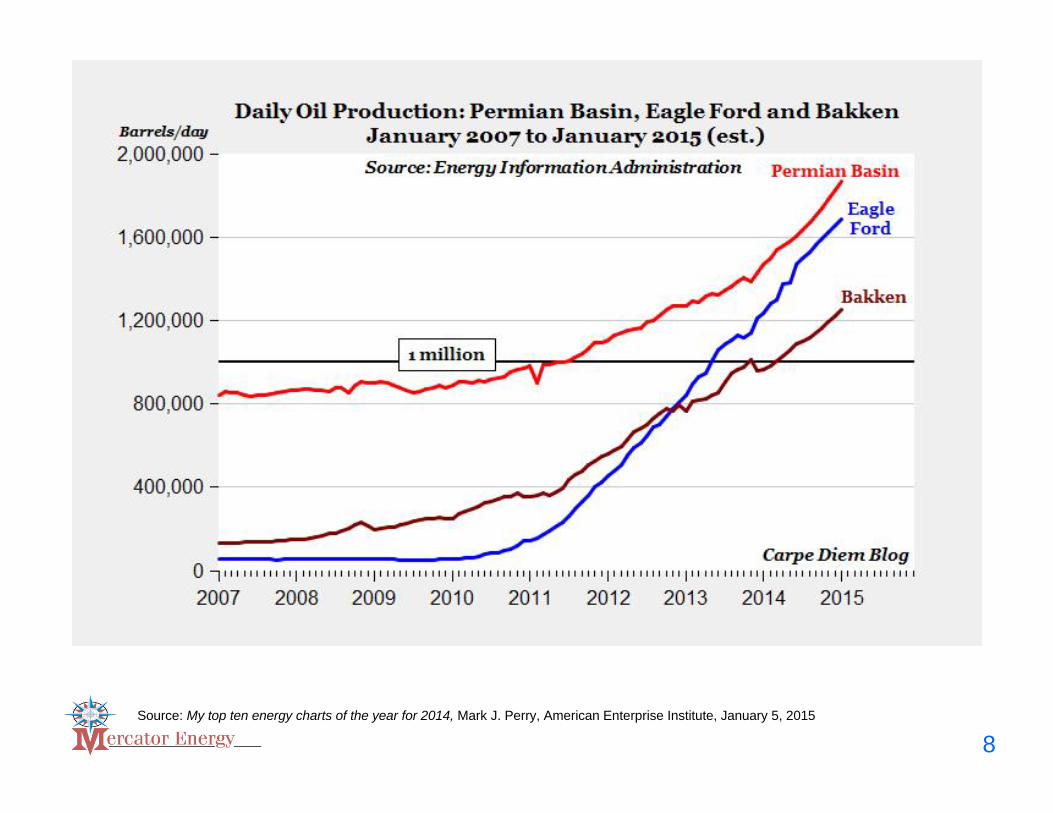
8Source: My top ten energy charts of the year for 2014, Mark J. Perry, American Enterprise Institute, January 5, 2015

9Source: My top ten energy charts of the year for 2014, Mark J. Perry, American Enterprise Institute, January 5, 2015

10Source: My top ten energy charts of the year for 2014, Mark J. Perry, American Enterprise Institute, January 5, 2015

11Source: Raymond James U.S. Research Energy Report, January 12, 2015
The House of Saud’s Motivation
The Production War is on!• On November 27, 2014 at an OPEC meeting in
Vienna, the Saudis said,
“Yakfee!”or
“Enough!”
• They resisted calls from OPEC members Iran, Iraq and Venezuela to reduce the production target of 30 million barrels per day.
12Source:

The U.S. Oil Story
• Saudi Arabia’s shot across the bow
• Are we victims of our own success?
13

OPEC’s Strategy?“In 2016, when OPEC completes this objective of cleaning up the American marginal market, the oil price will start growing again,” said Fedun, who’s made a fortune of more than $4 billion in the oil business, according to data compiled by Bloomberg. “The shale boom is on a par with the dot-com boom. The strong players will remain, the weak ones will vanish.”
- Leonid Fedun, VP and Board Member at OAO Lukoil (LKOD)
14
Source: OPEC Policy Ensures U.S. Shale Crash, Russian Tycoon Says, Asst Natl Dir Melony B. DeFord, Tea Party Command Center, November 28, 2014

Prince Alwaleed bin Talal
15Source: The Fabulous Life of Prince Alwaleed Bin Talal Alsaud, Forbes and Maria Bartiromo for USA Today, January 11, 2015
Saudi Crown Prince Abdullah bin Abdul Aziz
Saudi Foreign Minister Prince Saud al-Faisal (C)
Saudi billionaire Prince Alwaleed bin Talal
Saudi Prince: $100-a-barrel oil ‘never’ again

Oil at $65 Until Mid-2015: Kuwait Official
“The reason, according to Iranian Oil Minister, Bijan Namdar Zanganeh, was to keep prices low enough and long enough to threaten the U.S. shale oil industry and restore OPEC’s market share in America. Shale extraction requires expensive methods such as fracking and horizontal drilling, and many observers say it isn’t profitable if the price of oil drops below $65 per barrel.”
16Source: Real Money, The Street Ratings, By: Oilprice.com, December 11, 2014
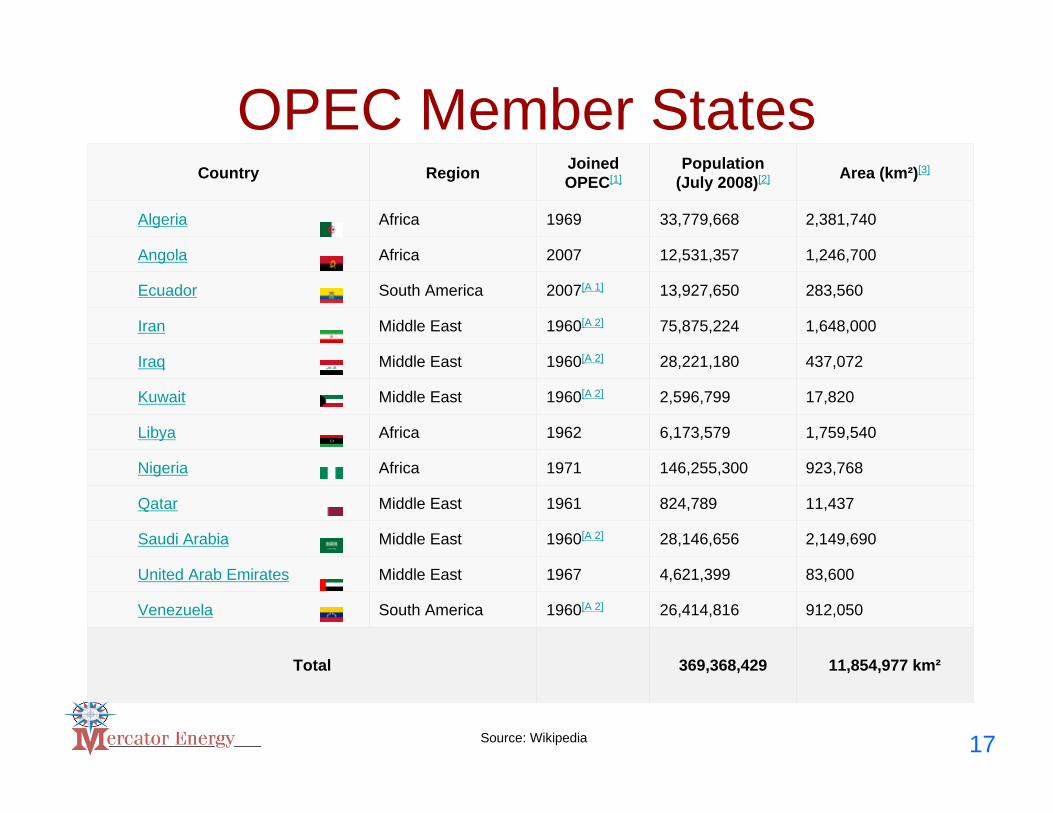
OPEC Member States
11,854,977 km²369,368,429Total
912,05026,414,8161960[A 2]South AmericaVenezuela
83,6004,621,3991967Middle EastUnited Arab Emirates
2,149,69028,146,6561960[A 2]Middle EastSaudi Arabia
11,437824,7891961Middle EastQatar
923,768146,255,3001971AfricaNigeria
1,759,5406,173,5791962AfricaLibya
17,8202,596,7991960[A 2]Middle EastKuwait
437,07228,221,1801960[A 2]Middle EastIraq
1,648,00075,875,2241960[A 2]Middle EastIran
283,56013,927,6502007[A 1]South AmericaEcuador
1,246,70012,531,3572007AfricaAngola
2,381,74033,779,6681969AfricaAlgeria
Area (km²)[3]Population(July 2008)[2]
Joined OPEC[1]RegionCountry
17Source: Wikipedia

18
It’s About Geopolitical Power & Market Share for the Saudis

$136Iran
$124Nigeria
$122Ecuador
$119Algeria
$117Venezuela
$116Iraq
$101Russia
$94Angola
$92Saudi Arabia
$90UAE
$59Kuwait
$58Qatar
$38-$77US producers
Oil price per barrel required to break even or balance budgetNation
19
Source: Reuters, The Saudi Arabian Oil Conspiracy and What it Might Mean for Your Portfolio, The Motley Fool, Adam Galas, January 18, 2015
Survival of fittest as oil tumbles below $65, Bloomberg News, December 1, 2014
A Game of Chicken?
According to data compiled by Bloomberg, “prices have dropped below the level needed by at least 9 OPEC member states to balance their budgets.”

20

Saudi Arabia to Erect a 600 Mile “Great Wall” to Fend off ISIS
21

22
Saudi Arabia Builds Giant Yemen Border Fence – 1,100 miles

Days Before Vienna
23

Fortress Saudi Arabia
24
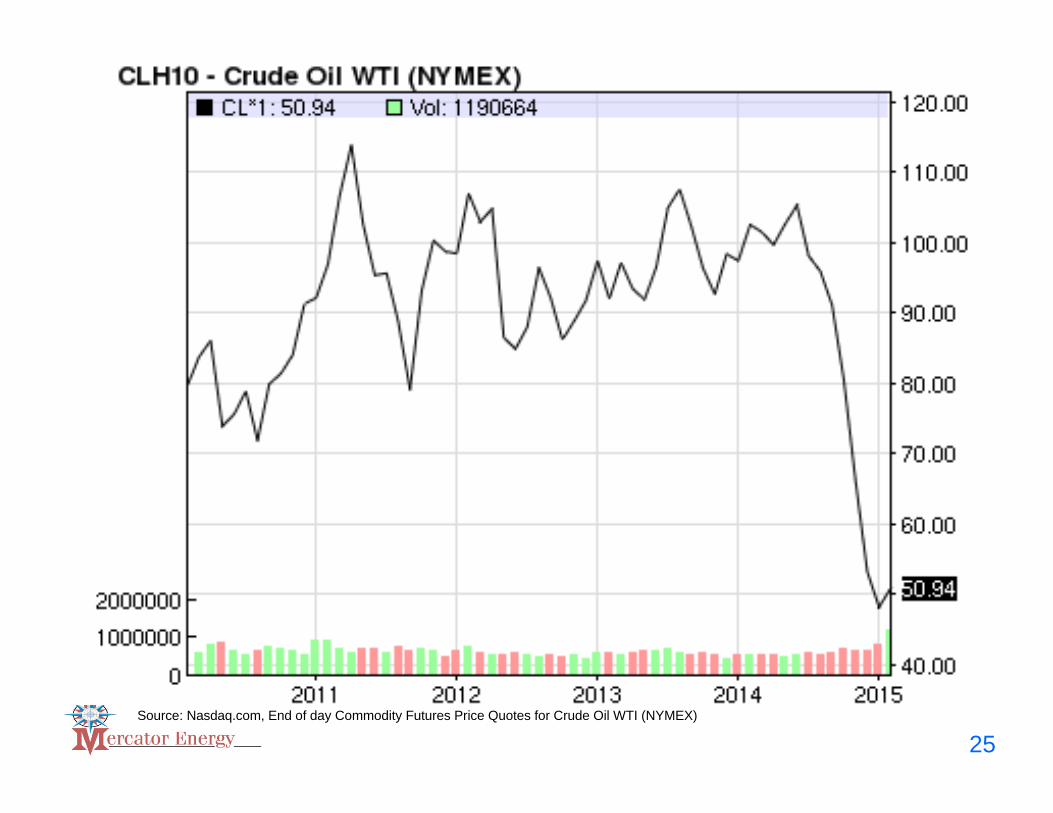
25Source: Nasdaq.com, End of day Commodity Futures Price Quotes for Crude Oil WTI (NYMEX)

26
Source: WTI Crude Oil Spot Price data by YCHarts, The Saudi Arabian Oil Conspiracy and What it Might Mean for Your Portfolio, The Motley Fool, Adam Galas, January 18, 2015

27Source: Oilprice.com, The Saudi Arabian Oil Conspiracy and What it Might Mean for Your Portfolio, The Motley Fool, Adam Galas, January 18, 2015
Survival of the Fittest?
Saudis have staying power; $750 billion in foreign country reserves

Iran Wary of Oil ‘Shock Therapy’ as OPEC Vies for Market
President of Iran Hassan Rouhani
28Source: Golnar Motevalli, Bloomberg, December 1, 2014
Iran relies on oil sales for 60% of its foreign revenue.

OPEC: Iran blames falling oil price on ‘political plot’
29
Source: Andrew Critchlow, Commodities Editor, Telegraph.co.uk/newsbysector
Iran Wary of Oil ‘Shock Therapy’ as OPEC Vies for Market, Golnar Motevalli, Bloomberg, December 1, 2014
Will their response be 1) war-like resistance or 2) the pursuit of a nuclear settlement?
Iran Oil Minister Bijan Namdar Zanganeh
“High prices are a disadvantage to OPEC’s market share,” he said. “If you want to increase your share, you have to reduce prices, but you can’t do it through ‘shock therapy’ over the course of three months if you want to change everything.”

Nicolas Maduro – waiting for a coup?
• Owes China $50 Billion• Has only $20 Billion in Reserves• 8-hour lines for food at grocery stores
30
Do you know his name? President of what country?

Gary Kasparov and PutinHow popular is Putin?
31

Repercussions for the U.S. Energy Story
32

33Source: Nasdaq.com, End of day Commodity Futures Price Quotes for Natural Gas (NYMEX)

North American Natural GasDemand Ranges by Selected Sector
Significant demand growth is possible in the LNG, transportation/HHP and power sectors through 2020 in Bcf per day.
10.0+Power
LNG Export
CNG/LNG Vehicles
Industrial (U.S. and Oil Sands)
Mexico Exports
Lower Demand Range
Middle Demand Range
Upper Demand Range
2.4
2.5
0.5
2.5
0.5
4.5
6.0
2.5
4.5
1.5
12.0+
5.0+
9.0
3.5
34Source: Encana Corporate Presentation, August 2013; Industrial Energy Consumers of America; BentekEnergy; Raymond James; Michael Smith, Chairman & CEO Freeport LNG, Industry Sources

U.S. and Canada: Natural Gas Production vs. Consumption
35

January 2015 World LNG Prices ($U.S./MMBtu)
36Source: Waterborne Energy, Inc. Data in $US/MMBtu

The LNG Delivery Chain
37
Source: King & Spalding Energy Newsletter, August 2014

38

The Japanese Crude Cocktail StoryThe Oil Derivative LNG Contract
• LNG prices in Pacific Basin (ie – Japan, South Korea, China) are closely tied to crude oil prices
• On a Btu equivalent– Crude oil at $100 per barrel translates to a JCC price
of $14.85 for LNG delivered to Asia (Japan, South Korea, China) (Rule of Thumb LNG Asia - 14.85% of Brent Crude)
• The oil price decline has eliminated the U.S. LNG export advantage
39
Is the U.S. LNG Price Arbitrage/Advantage Over?

• U.S. LNG prices delivered to Asia can’t compete at $50 oil = $7.42 per MMBtu
$4.00/MMBtu 3 year Henry Hub price forecast$1.00/MMBtu ppl cost of transport to LNG facility$2.00/MMBtu liquefaction cost$2.00/MMBtu shipping cost
$9.00 MMBtu Delivered cost to Asia
• U.S. needs $60-65 crude oil price to breakeven
40
Is the U.S. LNG Price Arbitrage/Advantage Over?


“First Four” LNG Projects Still Moving Forward• Sabine Pass LNG (Louisiana)
– Four 4.5 mtpa trains (currently under construction) will be able to liquefy a total of 2.2 Bcf/d
– Trains 1 & 2 expected to come online in late 2015 or early 2016– Trains 3 & 4 expected to come online 2016-17– Off-takers: BG Group, GAIL (India), Gas Natural Fenosa and
Korea Gas (together have agreed to take 16 mtpa)• Cameron LNG (Louisiana)
– Joint venture of Sempra Energy, GDF Suez, Mitsui & Co. and Mitsubishi Corp.
– Three 4 mtpa trains (currently under construction) will be able to liquefy 1.7 Bcf/d
– All trains are expected to be fully operational in 2019– Off-takers: GDF Suez, Mitsui and Mitsubishi
45
Source: Is That All There Is? Will an LNG Surplus and Cheap Oil Cap LNG Exports? Rusty Braziel, RBN Energy, January 26, 2015

“First Four” LNG Projects Still Moving Forward• Freeport LNG (Texas)
– Two 4.6 mtpa trains (currently under construction) will be able to liquefy 1.4 Bcf/d
– Trains 1 & 2 expected to be online in 2018– FID and construction start up on third train expected soon– Off-takers: Osaka Gas, Chuba Electric, BP Energy, Toshiba
Corp. and SK E&S LNG have committed to take all 3 trains’ total capacity
• Cove Point (Maryland)– One 5.75 mtpa train expected to liquefy up to 770 MMcf/d– Expected to be online late 2017 – Off-takers: Sumitomo Corp. and GAIL (India) have each
contracted for 2.3 mtpa of liquefaction capacity
46
Source: Is That All There Is? Will an LNG Surplus and Cheap Oil Cap LNG Exports? Rusty Braziel, RBN Energy, January 26, 2015

“First Four” Share Three Important Characteristics
1. They are being constructed at existing LNG import terminals with strong pipeline connections
• Reduces project costs2. They hold long-term sale and purchase
agreements (SPAs) for all or nearly all of their liquefaction and export capacity and the SPAsare take-or-pay
• Makes projects financeable3. They got in before the current energy market
upheaval forced LNG buyers, investments and lenders to re-examine FIDs
47
Source: Is That All There Is? Will an LNG Surplus and Cheap Oil Cap LNG Exports? Rusty Braziel, RBN Energy, January 26, 2015

48
Source: Low Tide, Can U.S. LNG Hold on?, NextEra Energy Newsletter, January 21, 2015

49
Source: Low Tide, Can U.S. LNG Hold on?, NextEra Energy Newsletter, January 21, 2015

Export License Volumes for Canadian LNG Projects
25.679.48238.33TOTALS0.290.112.62Woodfibre LNG1
3.901.4638.90WCC LNG1
0.320.122.88Triton LNG1
4.001.5035.70Stewart LNG
2.901.0629.60Prince Rupert LNG1
2.701.0024.50Pacific NorthWest LNG1
1.300.4713.25Oregon LNG3
3.201.1832.90LNG Canada1
1.280.479.36KM LNG1
2.600.9024.00Kitsault LNG
1.550.6315.63Jordan Cove LNG3
1.400.517.30Goldboro LNG2
0.230.081.69BC LNG1
3.001.1430.50Aurora LNG
Daily (Bcf)Annual (Tcf)Total (Tcf)Project
50
1Canadian gas export license granted 2Nova Scotia terminal site 3Oregon terminal site
Source: National Energy Board

What Basins are Competitive in This Price Environment?
51


53
Source: Shale economics challenged as prices plummet, Arjun Sreekumar, Platts Gas Daily Volume 32 / Issue 7 / Monday, January 12, 2015
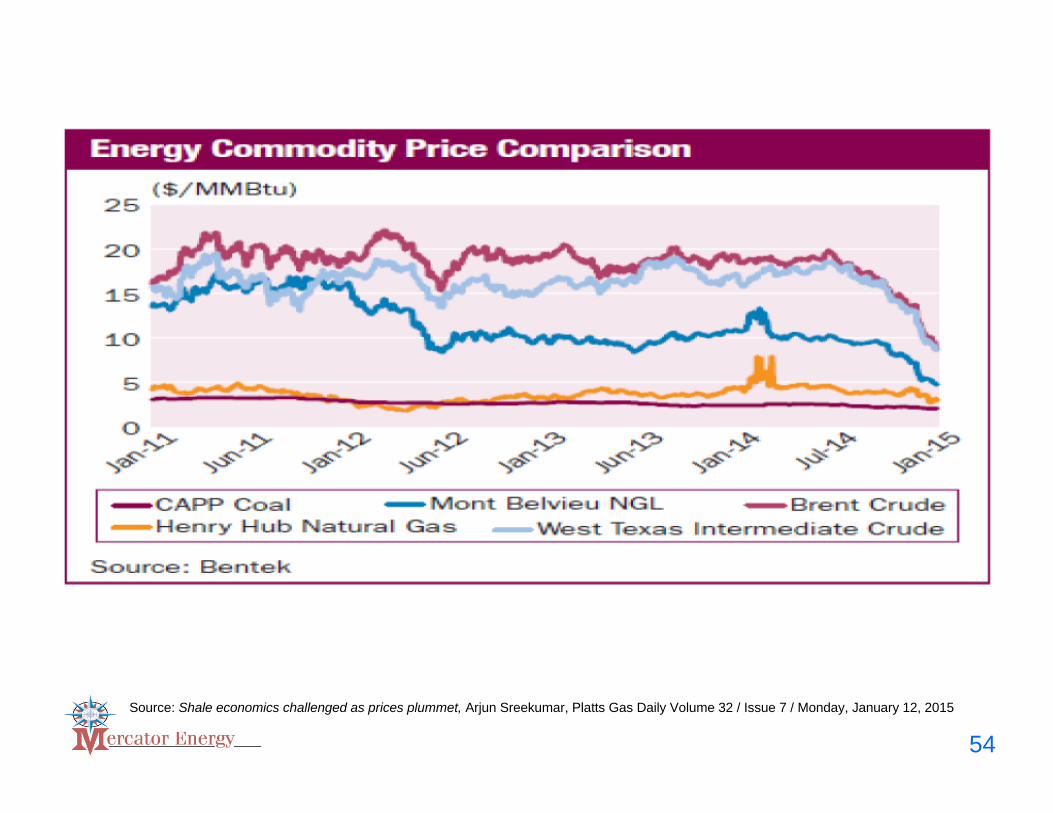
54
Source: Shale economics challenged as prices plummet, Arjun Sreekumar, Platts Gas Daily Volume 32 / Issue 7 / Monday, January 12, 2015

55
Source: Midstream Update & Primer, Tudor Pickering Holt & Co., November 2008

NGL Removal is Non-Discretionary
56
Source: Midstream Update & Primer, Tudor Pickering Holt & Co., November 2008

What Drives Midstream Economics?
57
Source: Midstream Update & Primer, Tudor Pickering Holt & Co., November 2008

58Source: Natural Gas Liquids – Supply Outlook 2008-2015

2014 Ethane Prices
59Source: 2014 Mont Belvieu NGL prices
$-
$0.0500
$0.1000
$0.1500
$0.2000
$0.2500
$0.3000
$0.3500
$0.4000
$0.4500
Jan-14Feb-14Mar-14Apr-14May-14Jun-14Jul-14Aug-14Sep-14Oct-14Nov-14Dec-14
$/G
allo
n
MT Belvieu C2

2014 Propane Prices
60
$-
$0.2000
$0.4000
$0.6000
$0.8000
$1.0000
$1.2000
$1.4000
$1.6000
Jan-14Feb-14Mar-14Apr-14May-14Jun-14Jul-14Aug-14Sep-14Oct-14Nov-14Dec-14
$/G
allo
n
MT Belvieu C3
Source: 2014 Mont Belvieu NGL prices

2014 Isobutane Prices
61Source: 2014 Mont Belvieu NGL prices
$-$0.2000$0.4000$0.6000$0.8000$1.0000$1.2000$1.4000$1.6000
Jan-14Feb-14Mar-14Apr-14May-14Jun-14Jul-14Aug-14Sep-14Oct-14Nov-14Dec-14
$/G
allo
n
MT Belvieu IC4

2014 Butane Prices
62Source: 2014 Mont Belvieu NGL prices
$-
$0.2000
$0.4000
$0.6000
$0.8000
$1.0000
$1.2000
$1.4000
$1.6000
Jan-14Feb-14Mar-14Apr-14May-14Jun-14Jul-14Aug-14Sep-14Oct-14Nov-14Dec-14
$/G
allo
n
MT Belvieu NC4

2014 Iso-pentane Prices
63Source: 2014 Mont Belvieu NGL prices
$-
$0.5000
$1.0000
$1.5000
$2.0000
$2.5000
Jan-14Feb-14Mar-14Apr-14May-14Jun-14Jul-14Aug-14Sep-14Oct-14Nov-14Dec-14
$/G
allo
n
MT Belvieu IC5

Economics Driven by Liquid Content
64Source: Kentucky Natural Gas & NGL Pricing, Mark Jergens, Midwest Energy Logistics

Will Plunging Oil Prices Kill This High-Yield Retirement Investment?
65Source: The Motley Fool, Adam Galas, December 11, 2014

Wyoming Crude Oil Pricing Comparison
$40.86$82.88Sweet (Other)
$42.86$85.88Southwest
$36.05$75.59Medium Sour
$34.80$74.34Heavy Sour
$30.00$69.50General Sour
$29.00$68.50Asphalt Sour
February 9, 2015(price per barrel)
August 1, 2014(price per barrel)
66
Source: Shell Energy Connect, Shell Trading (US) Company posted prices

Uinta Basin Black Wax
67Source: Chevron Crude Oil Marketing, Chevron Posting
*
* Daily price for January 16, 2015
$20.00
$30.00
$40.00
$50.00
$60.00
$70.00
$80.00
$90.00
$100.00
Jan-14Feb-14Mar-14Apr-14May-14Jun-14Jul-14Aug-14Sep-14Oct-14Nov-14Dec-14Jan-15
$/ba
rrel
Monthly Average $/Barrel

Uinta Basin Rig CountLost 1/3 of rigs in the last 2 months – average 28 to 20
68Source: Tudor Pickering Holt & Co.

The “Ferrari” Affect Substantially Reduces The Likelihood Of Price Spikes
6 Month Drilling Curtailment
5 months after drilling restarts, previous production level exceeded
One Rig In the Haynesville
Source: Ponderosa Advisors, LLCSource: Ponderosa Advisors LLC 69

Winners• Consumer growth; consumer
spending• U.S. nitrogen fertilizer industry• Steel producers• Refiners• Chemical producers• Aluminum smelters• Natural gas fired electric
generators• Promoters of an increase in
the Federal/State gasoline tax
• U.S. Energy Security• State and local governments in
oil & gas producing states• Oil & gas E&P’s• Oil & gas employment• Oil & gas service companies• LNG exporters• MLP’s• Retirement funds• Renewable energy sector –
cheap energy will destroy the “Green Revolution”
• Russia, Iran, Venezuela
70
Losers

Conclusions• Crude and NGL prices won’t recover for at least
2 years• U.S. crude, NGL & natural gas production won’t
decline as quickly as OPEC expects• U.S. producers will allocate capital to their
highest IRR projects• Low NGL prices create a problem for MLP’s• U.S. “short cycle” drilling (dependent on near
term quarter cash flow) will result in U.S. drillers feeling most of the pain
• The “recovery time” will exceed any hedge terms• The supply response will eventually materialize
but it will take longer than expected
71
Citations for ReportAll of the information utilized for this report is a compilation of information pulled from the following data sources:Energy Information Administration (EIA)Bentek Energy, Jack WeixelPonderosa Advisors LLCOffice of Energy ProjectsBloombergU.S. Department of EnergyRaymond James and Associates, Inc.WIkipediaLNG BlogPlatts Gas Daily Report, A McGraw Hill PublicationPlatts Inside FERC Gas Market Report, A McGraw Hill PublicationAmerican Enterprise InstituteOilprice.comRuetersLNG World NewsThe Motley FoolChevronEncana CorporationWaterborne Energy, Inc.King & SpaldingMidwest Energy Logistics, LLCNational Energy BoardNERA Economic ConsultingLNG Business ReviewColorado Interstate Gas, George WayneTea Party Command CenterTudor Pickering Holt & Co.
72

John HarpolePresident
Mercator Energy26 W. Dry Creek Circle, Suite 410
Littleton, CO [email protected]
(303) 825-1100 (work)(303) 478-3233 (cell)
Contact Information
73