effect of skewness on clear-water local scour at …
TRANSCRIPT
EFFECT OF SKEWNESS ON CLEAR-WATER LOCAL SCOUR AT COMPLEX BRIDGE
PIERS
YIFAN YANG(1), BRUCE W. MELVILLE(2), ASAAD Y. SHAMSELDIN(3) & HEIDE FRIEDRICH(4)
(1,2,3,4) PhD Student, Department of Civil and Environmental Engineering, University of Auckland, Auckland, New Zealand, e-mail:
[email protected]; [email protected]; [email protected]; [email protected]
ABSTRACT A laboratory study on clear-water local scour at a complex pier is performed to investigate effects of pier skewness and the pile-cap elevation on scour depth. The model has a 3:50 scale, and is representative of several bridge piers that failed in New Zealand in the past decades. The model pier consists of a wall-like rectangular column, a rectangular pile-cap and a 2×4 array of circular piles underneath. Tests are performed in a 45-m long, 1.54-m wide tilting recirculating flume and in a 16.5-m long, 2.4-m wide non-recirculating flume. Skewness varies from 0° to 45° in 15° increments, and the pile-cap elevation relative to bed level is also varied. All the tests are performed with 30 hours duration, and the measured scour depths are extrapolated to equilibrium using validated equations. Results show that, for complex piers aligned to the flow, the maximum equilibrium scour depth occurs when the top of the pile-cap is close to the undisturbed bed level; for skewed complex piers, the equilibrium scour depth increases significantly compared with aligned ones. The increase of scour depth is proportional to the skew angle 𝛼, and becomes less sensitive to 𝛼 when 𝛼 > 30°. For skewed complex piers, the column generates most of the scour depth, if it is inserted significantly into the flow. The sediment coarseness 𝐷𝑒/𝑑50 also varies with pier skewness, and is inversely proportional to the normalized scour depth when 𝐷𝑒/𝑑50 is larger than a specific value. This phenomenon is in accordance with the previous studies, and the equations of Lee and Sturm (2009) show the best agreement with the data of the present study. In addition, the location of the maximum scour depth varies with different configurations, implying a need to arrange countermeasures accordingly. Key Words: Complex pier; local scour; skewness; pile-cap elevation; sediment coarseness. 1 INTRODUCTION
Scour is one of the most common causes of damage to bridge piers, leading to numerous bridge failure cases around the world every year. One aspect of bridge scour that is deserving of more research is the scour at piers with complex geometry (namely complex piers), especially where significant flow skewness is possible. Normally, a complex pier consists of a wall-like column supporting the bridge superstructure, a pile-cap underpinning the column, and an underlying array of piles, called the pile group. Previous studies on scour at non-uniform piers addressed the situations for simple uniform piers founded on caissons or footings, include Jones et al. (1992), Melville and Raudkivi (1996),Parola et al. (1996), Lu et al. (2010) and Kothyari et al. (2012). Jones and Sheppard (2000) completed one of the first studies of scour at complex bridge piers; subsequent studies of scour at complex piers include Coleman (2005), Sheppard and Glasser (2009), Ataie-Ashtiani et al. (2010), Grimaldi and Cardoso (2010), Moreno et al. (2012; 2014; 2015; 2016a; 2016b); Ferraro et al. (2013) and Amini et al. (2014). However, the effect of pier skewness was not addressed in any of the studies mentioned above, this being a major shortcoming.
An idealized approach to deal with the structural complexity of a complex pier is to use the equivalent pier width, whereby a complex pier can be regarded as a cylindrical pier with a diameter equals to the equivalent width. This approach is inherent in the methods proposed by Coleman (2005) and Sheppard and Renna (2010).
The HEC-18 method (Arneson et al., 2012) uses the so-called superposition approach; however, overestimation is often reported. In the present study, a series of tests are performed with various pier skew angles and the pile-cap elevations, to investigate the variation of scour depth and the characteristic of the scour pattern. 2 EXPERIMENTAL SETUP 2.1 Facilities
Tests were conducted in a 1.54-m wide flume and a 2.4-m wide flume in the Fluid Mechanics Laboratory of the University of Auckland. The 1.54-m wide flume was 45-m long, 1.2-m deep and was a glass-sided recirculating flume having a maximum tilt of 1%. It was supported on two castellated beams which were
Proceedings of the 37th IAHR World Congress August 13 – 18, 2017, Kuala Lumpur, Malaysia
©2017, IAHR. Used with permission / ISSN 1562-6865 (Online) - ISSN 1063-7710 (Print) 413

centrally pivoted so that the slope of the flume can be adjusted by electrically driven screw-jack supports at either end of the flume. It had two pumps for recirculating the water and a pump for recirculating sediments, with a combined capacity of 1189-litre per second. The flume consisted of an inlet section, 35-m long channel, and an outlet section. A false floor 0.4-m in height was placed along the length of the channel section, with a 4-m long sediment recess box located 26-m downstream of the inlet section. Water entered the flume at the base of the inlet section and passed through a wave skimmer, which suppressed surface wave formation. The flume was filled from the laboratory reservoir via an inflow pipe located at the end of the outlet section of the flume and was drained by an outlet valve in the bottom of the outlet section. During experiments, the water levels in the flume were controlled by an overflow pipe in the outlet section of the flume.
The 2.4-m wide flume was 16.5-m long, 2.4-m wide, and 0.3-m deep. It was a non-recirculating flume supported by two universal-beams which pivoted about a central support. Screw jacks supported the beams at either end so that the flume slope was adjustable. The flume consisted of an inlet tank, flow straightener, 13-m long channel, sediment collection tank and an outlet tank. A 2.8-m long and 0.45-m deep sediment recess box was located 7-m downstream of the inlet tank. Water was supplied to the flume inlet from the laboratory constant head tank. Before entering the test section of the flume, the water passed through a baffle system at the bottom of the inlet tank, through a wire mesh screen to smooth the flow, and then through a flow straightener made of PVC pipes.The sediment recess boxes of both flumes were filled with uniform quartz sand with median particle diameter 𝑑50=0.84-mm and geometrical standard deviation𝜎𝑔=1.35.
2.2 Pier model and configuration
A complex pier model was used to perform tests in the two flumes. The model was made of solid wood, and was painted to avoid being damaged by water. The model consisted of a wall-like column, a pile-cap and pile group supporting the pile-cap, representing the piers of several failed bridges in the past several decades in New Zealand. These bridges include the Bull Road Bridge, the Blackmount Road Bridge, the Oreti River Road Bridge, and the Whakatane River Road Bridge (Melville and Coleman, 2000). The dimensions of the model are shown in Table 1, with a 3:50 geometric scale to prototype. Figure 1 illustrates the plan view, the front view and the 3-D view of the model.
Table 1. Dimensions of complex pier model.
Variable 𝒃𝒄 (m)
𝒍𝒄 (m)
𝒃𝒑𝒄 (m)
𝒍𝒑𝒄 (m)
𝑻 (m)
𝒇𝒄𝒍 (m)
𝒇𝒄𝒃 (m)
𝒃𝒑𝒈 (m)
𝑺𝒎 (m)
𝑺𝒏 (m)
Dimension 0.030 0.310 0.120 0.362 0.060 0.026 0.045 0.025 0.070 0.070
Figure 1. Scheme of the model used in the present study
To investigate the effects of pier skewness and the pile-cap elevation, tests with 4 skew angles (0°, 15°,
30°and 45°) and 9 pile-cap elevations were undertaken, as shown in Table 2. Tests with skewness angles of 0°, 15° and 30° were conducted in the 1.54-m flume, but to avoid
contraction effects, the tests for 45° skew angle were performed in the 2.4-m flume. According to Breusers and Raudkivi (1991) and Ballio et al. (2009), contraction scour is negligible for a pier diameter less than 1/8 of the flume width. Considering that bed degradation was not observed, it was appropriate to conclude that the contraction effect was absent. For both flumes, the wall effect was also negligible because 𝐵/𝑦0> 5 (Yalin, 1972), where B was the flume width. In previous studies, researchers tended to keep the relative flow depth 𝑦0/𝐷𝑒 not less than a specific value, e.g. 3, to diminish the effect of flow shallowness.
Proceedings of the 37th IAHR World Congress August 13 – 18, 2017, Kuala Lumpur, Malaysia
414 ©2017, IAHR. Used with permission / ISSN 1562-6865 (Online) - ISSN 1063-7710 (Print)

Table 2. Design of pile-cap elevations Position 𝑯𝒄 (mm) Description
A 310 Pile group only
B 250 The pile-cap is exposed to the flow C 120
D 60 The pile-cap is close to the bed E 30
F 0
G -60 The pile-cap is fully buried H -110
I -- Column only However, in the present study, increasing skewness to flow was inevitably accompanied by a stronger
shallowing effect, thereby complicating the mechanism of scour at complex piers. Thus, a strict control of flow shallowness was inappropriate in this study.The flow depth and flow velocity were controlled as 0.25-m and 0.354-m/s respectively, giving a flow intensity parameter, 𝑈/𝑈𝑐≈0.9, while 𝑈𝑐=0.394-m/s. Here 𝑈𝑐 was the critical mean approach flow velocity for sediment incipient motion and was calculated using equations in Melville and Coleman (2000).
2.3 Data measurement
Flow velocity were measured using a 3-receiver Vectrino+ side-looking acoustic Doppler velocimeter (ADV) made by Nortek, which had a sampling rate of 200-Hz. The sampling volume was cylindrical, having 6-mm diameter and an adjustable height varying from 1-mm to 7-mm. The output data from the velocimeter were filtered using WinADV software. The filter was set to remove spikes and data with low correlation.
A SeaTek multiple transducer array (MTA) was used to monitor the temporal evolution of scour at specific locations. The instrument was an ultrasonic ranging system, which can detect the distances from the sensors to reflective objects. The measuring accuracy of the system was approximately ± 1-mm. A detailed description of this device was given in Friedrich et al. (2005). Transducers were fixed in small holes drilled in the pile-cap to measure the instantaneous scour depth in front of each pile during the entire time span of the test with a time interval of 1 second.
As a supplementary method for measurement and calibration of the transducers data, scales printed on paper were wrapped around the pier components (e.g. pile group) and fastened using transparent tape so that the scales were visible. The scour depth at each component was read off the scales at the end of the tests for verification of the MTA data.
2.4 Experimental procedures
After the model was installed in the recess box, the bed surface was compacted and leveled using a metal beam fixed on a carriage moving on rails on the top edge of the side of the flumes. The recess box was filled with water gradually to avoid disturbing the leveled sediments. In the 1.54-m flume, before the tests began, the inflow pipe was opened to let the flume fill slowly to the desired depth. In the 2.4-m flume, the filling process started from the sediment collection tank downstream to submerge the recess box before opening the upstream valves to avoid any sediment bed disturbance during filling. At the early stage of the tests, before a steady flow condition had been reached, the bed surface was protected from uncontrolled scour by plastic plates. Then the plates were removed and the tests began; the transducers started collecting data at the same time. The flow depth was examined periodically by a point gauge for the tests in the 2.4-m flume, with an accuracy of ±0.5-mm, and using a scale on the outside of the flume for the tests in the 1.54-m flume. At the end of each test, after draining the flume, the scour depth at each pile was read using the scale.
If the pile-cap was not exposed entirely, or maximum scour depth did not occur at one of the piles (rather than in front of the pile-cap, for example), the point gauge was also used to measure the scour depth at locations of interest.
Tests lasted for 30 hours. Although equilibrium cannot be reached within 30 hours, there was a consensus that the time to reach 90% of the equilibrium scour depth was less than 20% of the time for complete equilibrium (Sheppard et al., 2011). Thus, 30 hours was sufficient to acquire relationships between scour depth and experimental parameters. However, more study to determine the reliability of the relations is still necessary in the future.
Proceedings of the 37th IAHR World Congress August 13 – 18, 2017, Kuala Lumpur, Malaysia
©2017, IAHR. Used with permission / ISSN 1562-6865 (Online) - ISSN 1063-7710 (Print) 415
3 RESULTS AND DISCUSSION 3.1 Data presentation Table 3 shows the results of the36 tests undertaken with duration of 30 hours. A number of variables are included: the position of the complex pier model with respect to the pile-cap elevation (Position A~I), the pile-cap elevation 𝐻𝑐, the pier skew angle 𝛼, the test duration 𝑡𝑑, the equivalent width of pier 𝐷𝑒, the sediment coarseness ratio 𝐷𝑒/𝑑50, the measured scour depth 𝑑𝑠𝑚, and the equilibrium scour depth 𝑑𝑠𝑚𝑒.
Table 3. Test results for varying pier skewness and the pile-cap elevation Position 𝑯𝒄
(mm) 𝜶 (°) 𝒕𝒅
(h) 𝑫𝒆
(mm) 𝑫𝒆/𝒅𝟓𝟎 𝒅𝒔𝒎
(mm) 𝒅𝒔𝒎𝒆 (mm)
A 310 0 30 47 56 98 118 310 15 30 68 81 114 142 310 30 30 72 85 119 149 310 45 30 56 67 110 134
B 250 0 30 47 56 110 132 250 15 30 68 81 135 168 250 30 30 72 85 137 172 250 45 30 56 67 133 163
C 120 0 30 58 70 111 136 120 15 30 78 93 137 173 120 30 30 88 105 160 205 120 45 30 84 100 184 234
D 60 0 30 68 81 117 146 60 15 30 107 128 140 183 60 30 30 132 157 177 237 60 45 30 132 157 188 251
E 30 0 30 75 89 131 165 30 15 30 126 150 154 205 30 30 30 158 189 186 254 30 45 30 163 194 213 292
F 0 0 30 82 98 84 107 0 15 30 147 175 168 227 0 30 30 187 222 209 291 0 45 30 198 236 214 300
G -60 0 30 97 115 60 78 -60 15 30 191 227 169 236 -60 30 30 249 296 243 350 -60 45 30 276 328 272 397
H -110 0 30 104 124 70 91 -110 15 30 228 271 140 199 -110 30 30 302 360 223 329 -110 45 30 342 408 280 420 I -- 0 30 37 44 70 82 -- 15 30 102 121 190 247 -- 30 30 156 186 286 390 -- 45 30 207 246 287 404
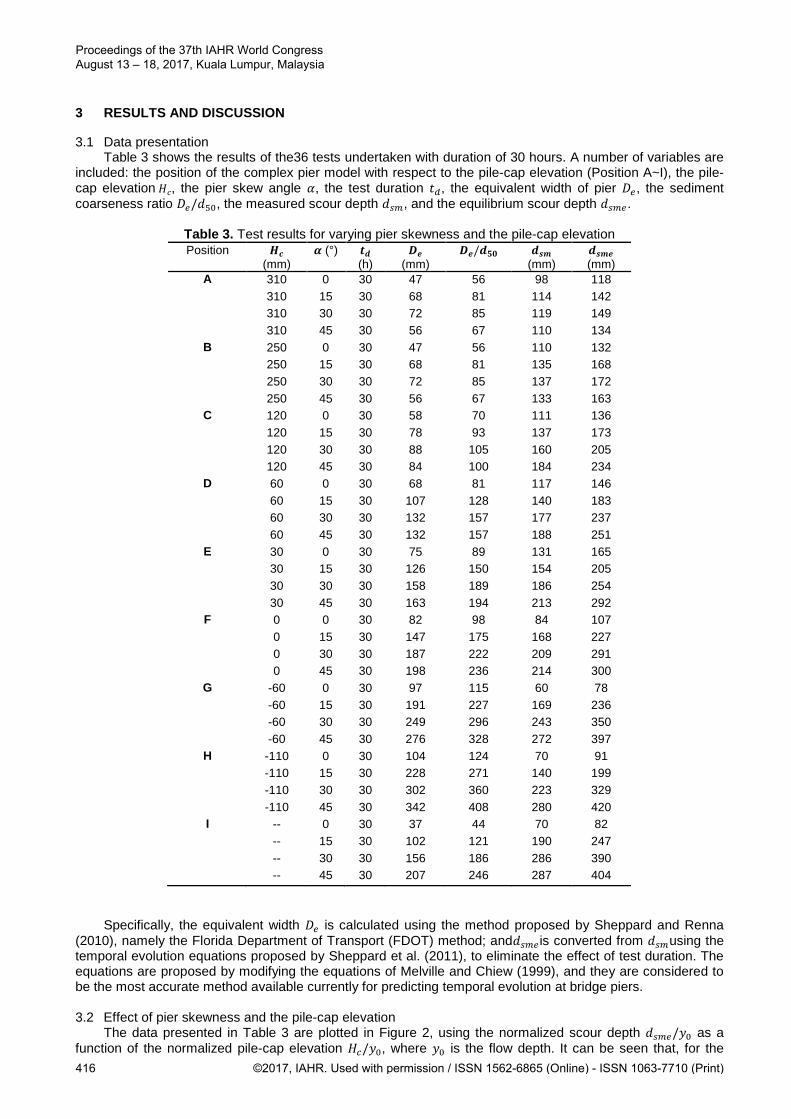
Specifically, the equivalent width 𝐷𝑒 is calculated using the method proposed by Sheppard and Renna (2010), namely the Florida Department of Transport (FDOT) method; and𝑑𝑠𝑚𝑒 is converted from 𝑑𝑠𝑚using the temporal evolution equations proposed by Sheppard et al. (2011), to eliminate the effect of test duration. The equations are proposed by modifying the equations of Melville and Chiew (1999), and they are considered to be the most accurate method available currently for predicting temporal evolution at bridge piers. 3.2 Effect of pier skewness and the pile-cap elevation The data presented in Table 3 are plotted in Figure 2, using the normalized scour depth 𝑑𝑠𝑚𝑒/𝑦0 as a function of the normalized pile-cap elevation 𝐻𝑐/𝑦0, where 𝑦0 is the flow depth. It can be seen that, for the
Proceedings of the 37th IAHR World Congress August 13 – 18, 2017, Kuala Lumpur, Malaysia
416 ©2017, IAHR. Used with permission / ISSN 1562-6865 (Online) - ISSN 1063-7710 (Print)
complex piers aligned to the flow (𝛼=0°), the scour depth increases with closer distance between the pile-cap and the undisturbed bed level, and reaches a maximum when the top of the pile-cap is close to the bed (which is 𝐻𝑐/𝑇 =0.5 in the present study). After this situation, with the decreasing pile-cap elevation, the top of the pile-cap is at the undisturbed level, and eventually lower than the bed level. During this stage, the scour depth decreases sharply, which is attributed by many researchers to the protection effect of the pile-cap that disturbs the downflow in front of the pier. In general, the data for the pier aligned to the flow are in accordance with the results of other studies.
\
Figure 2. Effect of pier skewness and the pile-cap elevation on scour depth
For the complex piers with a skew angle to the flow, the variation of the scour depth with the varying pile-cap elevation is completely different. Once a comparatively small skew angle exists (e.g. 𝛼=15°), the scour depth increases strikingly, especially in the situations where the top of the pile-cap is flushed with the bed level, or is fully buried. In addition, the increase of scour depth is proportional to the skew angle, as shown in Figure 2, and becomes less sensitive to skewness when 𝛼>30°. As a consequence, situations that are considered to be safe for aligned piers (e.g. 𝐻𝑐/𝑇≤0) can be extremely dangerous when the flow direction changes because of, for example, obstacles in the flow, flow contraction, or a particular flood event.
The dashed lines in Figure 2 are assumed based on existing data because of the limited test numbers, but the general trend of the lines are still reasonable. These lines start from the case where the equilibrium scour hole can just reach the top of the pile-cap. With increasing pile-cap elevation, the scour depth is assumed to be inversely proportional to the pile-cap elevation (where𝑑𝑠𝑒 = |𝐻𝑐|), until the side of the pile-cap can be exposed after scouring. Thereafter, the equilibrium scour depth starts to increase again with increasing pile-cap elevation, until a maximum value is obtained when the pile-cap is close to the bed level.
Generally, for skewed complex piers, if the column is inserted significantly into the flow, it causes much more disruption to the flow and much stronger downflow than that due to the pile-cap and the pile group. Thus, the increased scour depth for skewed piers is mostly attributed to the presence of the wall-like column. A complex pier behaves more like a wide pier with increasing skewness to the flow. This phenomenon also causes the variation of flow shallowness and sediment coarseness with skew angle.
3.3 Effect of sediment coarseness on scour depth
Because of the structural complexity and wide-pier feature of skewed complex piers, the sediment coarseness ratio 𝐷𝑒/𝑑50 becomes variable with changing pier skewness and pile-cap elevation, rather than being a constant value as that for simple cylindrical piers. Melville (1997), Sheppard et al. (2004), Lee and Sturm (2009) and Lança et al. (2013) proposed different equations for the relation between 𝐷𝑒/𝑑50 and 𝑑𝑠𝑒/𝐷𝑒.
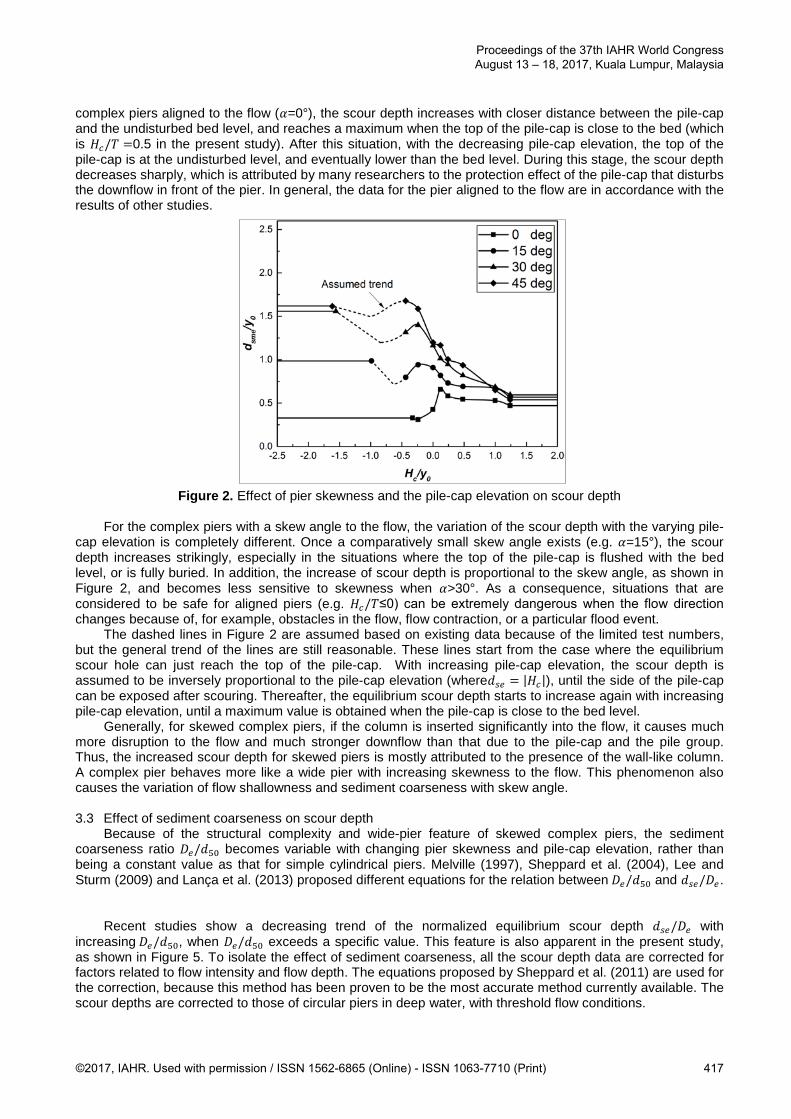
Recent studies show a decreasing trend of the normalized equilibrium scour depth 𝑑𝑠𝑒/𝐷𝑒 with
increasing 𝐷𝑒/𝑑50, when 𝐷𝑒/𝑑50 exceeds a specific value. This feature is also apparent in the present study, as shown in Figure 5. To isolate the effect of sediment coarseness, all the scour depth data are corrected for factors related to flow intensity and flow depth. The equations proposed by Sheppard et al. (2011) are used for the correction, because this method has been proven to be the most accurate method currently available. The scour depths are corrected to those of circular piers in deep water, with threshold flow conditions.
Proceedings of the 37th IAHR World Congress August 13 – 18, 2017, Kuala Lumpur, Malaysia
©2017, IAHR. Used with permission / ISSN 1562-6865 (Online) - ISSN 1063-7710 (Print) 417
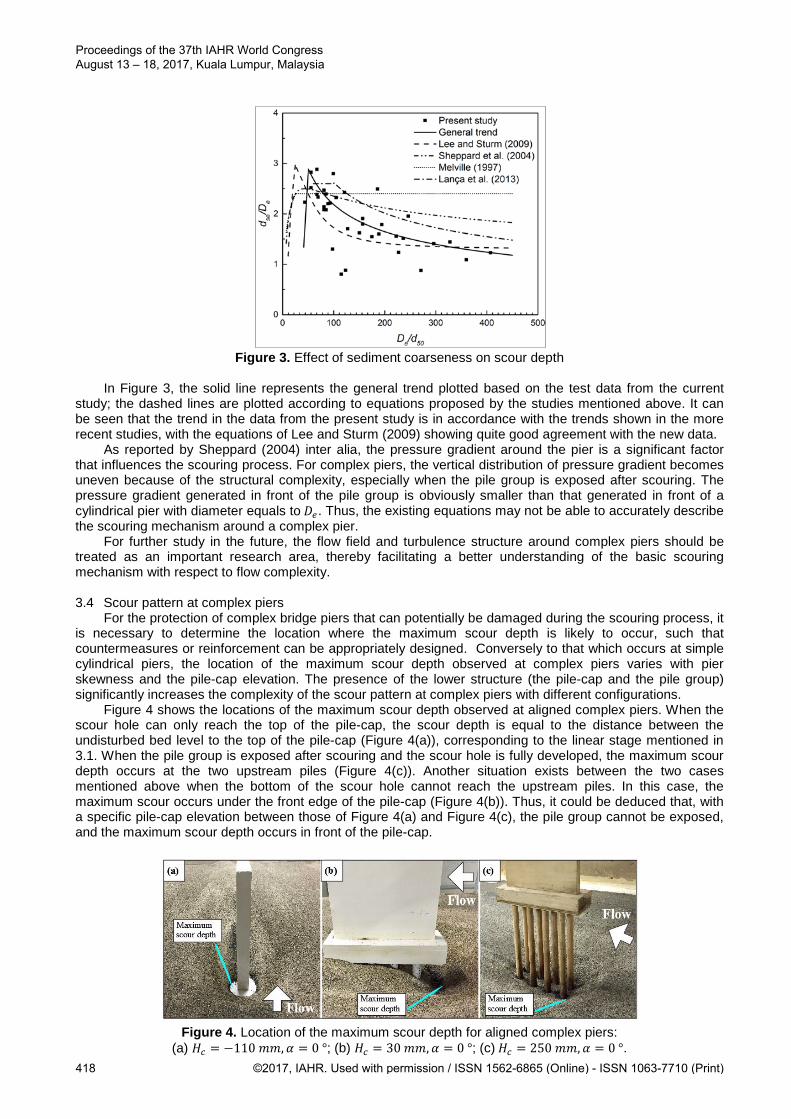
Figure 3. Effect of sediment coarseness on scour depth
In Figure 3, the solid line represents the general trend plotted based on the test data from the current
study; the dashed lines are plotted according to equations proposed by the studies mentioned above. It can be seen that the trend in the data from the present study is in accordance with the trends shown in the more recent studies, with the equations of Lee and Sturm (2009) showing quite good agreement with the new data.
As reported by Sheppard (2004) inter alia, the pressure gradient around the pier is a significant factor that influences the scouring process. For complex piers, the vertical distribution of pressure gradient becomes uneven because of the structural complexity, especially when the pile group is exposed after scouring. The pressure gradient generated in front of the pile group is obviously smaller than that generated in front of a cylindrical pier with diameter equals to 𝐷𝑒. Thus, the existing equations may not be able to accurately describe the scouring mechanism around a complex pier.
For further study in the future, the flow field and turbulence structure around complex piers should be treated as an important research area, thereby facilitating a better understanding of the basic scouring mechanism with respect to flow complexity.
3.4 Scour pattern at complex piers
For the protection of complex bridge piers that can potentially be damaged during the scouring process, it is necessary to determine the location where the maximum scour depth is likely to occur, such that countermeasures or reinforcement can be appropriately designed. Conversely to that which occurs at simple cylindrical piers, the location of the maximum scour depth observed at complex piers varies with pier skewness and the pile-cap elevation. The presence of the lower structure (the pile-cap and the pile group) significantly increases the complexity of the scour pattern at complex piers with different configurations.
Figure 4 shows the locations of the maximum scour depth observed at aligned complex piers. When the scour hole can only reach the top of the pile-cap, the scour depth is equal to the distance between the undisturbed bed level to the top of the pile-cap (Figure 4(a)), corresponding to the linear stage mentioned in 3.1. When the pile group is exposed after scouring and the scour hole is fully developed, the maximum scour depth occurs at the two upstream piles (Figure 4(c)). Another situation exists between the two cases mentioned above when the bottom of the scour hole cannot reach the upstream piles. In this case, the maximum scour occurs under the front edge of the pile-cap (Figure 4(b)). Thus, it could be deduced that, with a specific pile-cap elevation between those of Figure 4(a) and Figure 4(c), the pile group cannot be exposed, and the maximum scour depth occurs in front of the pile-cap.
Figure 4. Location of the maximum scour depth for aligned complex piers:
(a) 𝐻𝑐 = −110 𝑚𝑚,𝛼 = 0 °; (b) 𝐻𝑐 = 30 𝑚𝑚,𝛼 = 0 °; (c) 𝐻𝑐 = 250 𝑚𝑚,𝛼 = 0 °.
Proceedings of the 37th IAHR World Congress August 13 – 18, 2017, Kuala Lumpur, Malaysia
418 ©2017, IAHR. Used with permission / ISSN 1562-6865 (Online) - ISSN 1063-7710 (Print)

Figure 5 shows the locations of the maximum scour depth observed at skewed complex piers. When the pier is skewed to the flow (𝛼=15°~75°) and the pile group can be fully exposed after scouring, the maximum scour depth occurs at the downstream end of the upstream row of piles (Figure 5(a) (b)). For the piers perpendicular to the flow (𝛼=90°), the maximum scour depth occurs at the two middle piles of the upstream row (Figure 5(c)). This phenomenon is in accordance with the results of scour at a pile group reported by Zhao and Sheppard (1998), demonstrating that the exposed pile group becomes the dominant factor to determine the scour pattern at complex piers. When the scour hole cannot reach the top of the pile-cap (namely the column-only situation), the maximum scour depth occurs at one of the corners of the upstream flank (Figure 5(d)). In that case, the complex piers can be treated as a uniform simple pier, and the lower structure does not influence the scour depth.
In order to reduce scour depth at specific locations, countermeasures for complex piers can be optimized based on observed scour patterns in the present study. If a potential changing of flow direction in the future is predicted before construction, the riprap layer placed around the pier can be strengthened accordingly, e.g. larger layer depth or different stone size in the area where the maximum scour depth potentially occurs. The piles with high failure possibility can also be reinforced, for example, by using materials of higher standard or fixing the piles deeply upon bed rock.
Figure 5. Location of the maximum scour depth for skewed complex piers:
(a) 𝐻𝑐 = −60 𝑚𝑚,𝛼 = 30 °; (b) 𝐻𝑐 = 30 𝑚𝑚,𝛼 = 30 °; (c) 𝐻𝑐 = 30 𝑚𝑚,𝛼 = 90 °; column-only, 𝛼 = 30 °. 4 CONCLUSIONS
According to the data presented and analyzed in previous sections, the following conclusions can be drawn:
(1) When a complex pier is aligned to the flow, the maximum scour depth occurs for situations where the top of the pile-cap is close to the undisturbed bed level. This is in accordance with results reported by other studies. After the peak value occurs, with a lowering of the pile-cap position, the protection effect of the pile-cap decreases the scour depth significantly by disturbing the downflow in front of the pier.
(2) Once the flow becomes skewed, and even for a comparatively small skewness angle, e.g. 15°, the scour depth increases significantly, especially in situations where the pile-cap is fully buried. The increase is proportional to the skew angle 𝛼, and becomes less sensitive to 𝛼 when 𝛼 >30°. This phenomenon shows that, for complex piers with a wall-like column part, the column makes the greatest contribution to scour depth, and the wide-pier feature of the column is significant when skewness exists. Thus, the column should be treated as the most contributive part of a complex pier that can potentially fail in flow with varying directions.
(3) The equivalent width of a complex pier becomes larger with increasing skew angle, making the sediment coarseness ratio 𝐷𝑒/𝑑50 variable, and bringing more uncertainty to existing predictors. Results show that the existing equations, including Melville (1997), Lee and Sturm (2009), Sheppard and Renna (2010) and
Proceedings of the 37th IAHR World Congress August 13 – 18, 2017, Kuala Lumpur, Malaysia
©2017, IAHR. Used with permission / ISSN 1562-6865 (Online) - ISSN 1063-7710 (Print) 419

Lança et al. (2013) are incapable of accurately describing the effect of sediment coarseness. Comparatively, the equations of Lee and Sturm (2009) show better agreement with data from the present study. This feature is attributed to the structural complexity and corresponding flow complexity around complex pier. Thus, more study on the flow field is needed.
(4) For skewed complex piers where the pile group is exposed after scouring, the maximum scour depth usually occurs at the downstream end of the upstream row of piles; when the pier is aligned to flow, the maximum scour depth occurs at the two upstream piles, or under the front edge of the pile-cap, according to the degree of the pile-cap’s exposure after scouring; when the pier is perpendicular to the flow, the maximum scour depth usually occurs at the middle two piles of the upstream row. For piers where the pile-cap is partially buried after scouring, the maximum scour depth normally occurs in front of the pile-cap (aligned pier) or at the side of the pile-cap (skewed pier). If the pile-cap is completely buried after scouring, namely the column-only situation, the maximum scour depth occurs at one of the corners of the upstream flank of the column. This case typically shows the deepest scour. ACKNOWLEDGEMENTS
The leading author acknowledges the financial support from China Scholarship Council (CSC), the valuable suggestions for the manuscript from Dr Keith Adams, and the help from Mr. Chunguang Yuan in conducting the experiments. NOTATION 𝑏𝑐 = width of column; 𝑏𝑝𝑐 = width of pile-cap; 𝑏𝑝𝑔 = diameter of piles; 𝐵 = flume width; 𝑑𝑠 = scour depth; 𝑑𝑠𝑒 = equilibrium scour depth; 𝑑𝑠𝑚 = measured scour depth at the end of test; 𝑑𝑠𝑚𝑒 = equilibrium scour depth calculated by S/M method using 30 hours data; 𝑑50 = median diameter of sediment particles; 𝐷 = pier width; 𝐷𝑒 = equivalent width of complex pier calculated by FDOT method; 𝑓𝑐𝑏 = pile-cap extension in lateral direction; 𝑓𝑐𝑙 = pile-cap extension in longitudinal direction; 𝐻𝑐 = pile-cap elevation, e.g. the height of column base to the bed, positive when above the bed; 𝑙𝑐 = length of column; 𝑙𝑝𝑐 = length of pile-cap; 𝑆𝑚 = longitudinal pile row spacing ; 𝑆𝑛 = lateral pile row spacing; 𝑡𝑑 = test duration; 𝑇 = thickness of pile-cap; 𝑈 = depth-averaged mean approach flow velocity; 𝑈𝑐 =mean critical velocity for incipient motion of bed sediment, depth-averaged; 𝑦0 = flow depth; 𝛼 = skew angle to flow of pier; 𝜎𝑔 = geometric standard deviation of sediment size distribution. REFERENCES Amini, A., Melville, B. W. & Ali, T. M. (2014). Local Scour at Piled Bridge Piers Including an Examination of the
Superposition Method. Canadian Journal of Civil Engineering, 41(5), 461-471. Arneson, L. A., Zevenbergen, L. W., Lagasse, P. F. & Clopper, P. E. (2012). Evaluating Scour at Bridges
(HEC-18). Technical Rep. No. HIF-12-003, Federal Highway Administration, Washington, DC. Ataie-Ashtiani, B., Baratian-Ghorghi, Z. & Beheshti, A. A. (2010). Experimental Investigation of Clear-Water
Local Scour of Compound Piers. Journal of Hydraulic Engineering, 136(6), 343-351. Ballio, F., Teruzzi, A. & Radice, A. (2009). Constriction Effects in Clear-Water Scour at Abutments. Journal of
Hydraulic Engineering, 135(2), 140-145. Breusers, H. N. C. & Raudkivi, A. J. (1991). Scouring. Rotterdam: Balkema. Coleman, S. E. (2005). Clearwater Local Scour at Complex Piers. Journal of Hydraulic Engineering, 131(4),
330-334. Ferraro, D., Tafarojnoruz, A., Gaudio, R. & Cardoso, A. H. (2013). Effects of Pile Cap Thickness on the
Maximum Scour Depth at a Complex Pier. Journal of Hydraulic Engineering, 139(5), 482-491.
Proceedings of the 37th IAHR World Congress August 13 – 18, 2017, Kuala Lumpur, Malaysia
420 ©2017, IAHR. Used with permission / ISSN 1562-6865 (Online) - ISSN 1063-7710 (Print)
Friedrich, H. (2010). Evaluation of Statistical Analysis Techniques for Developing Bedforms Recorded In 3D, Doctoral Dissertation. University of Auckland.
Grimaldi, C. & Cardoso, A. H. (2010). Methods for Local Scour Depth Estimation at Complex Bridge Piers. In Procedings of 1st IAHR European Division Congress.
Jones, J. S., Kilgore, R. T. & Mistichelli, M. P. (1992). Effects of Footing Location on Bridge Pier Scour. Journal of Hydraulic Engineering, 118(2), 280-290.
Jones, J. S. & Sheppard, D. M. (2000). Local Scour at Complex Pier Geometries. In Pproceedings of the ASCE 2000 Joint Conference on Water Resources Engineering and Water Resources Planning and Management.
Kothyari, U. C. & Kumar, A. (2012). Temporal Variation of Scour around Circular Compound Piers. Journal of Hydraulic Engineering, 138(11), 945-957.
Lança, R. M., Fael, C. S., Maia, R. J., Pêgo, J. P. & Cardoso, A. H. (2013). Clear-Water Scour at Comparatively Large Cylindrical Piers. Journal of Hydraulic Engineering, 139(11), 1117-1125.
Laursen, E. M. & Toch, A. (1956). Scour Around Bridge Piers and Abutments, Bulletin No.4, Iowa Highways Research Board, Ames, IA.
Lee, S. O. & Sturm, T. W. (2009). Effect of Sediment Size Scaling on Physical Modeling of Bridge Pier Scour. Journal of Hydraulic Engineering, 135(10), 793-802.
Lu, J. Y., Shi, Z. Z., Hong, J. H., Lee, J. J. & Raikar, R. V. (2010). Temporal Variation of Scour Depth at Nonuniform Cylindrical Piers. Journal of Hydraulic Engineering, 137(1), 45-56.
Melville, B. W. (1997). Pier and Abutment Scour: Integrated Approach. Journal of Hydraulic Engineering, 123(2), 125-136.
Melville, B. W. & Chiew, Y. M. (1999). Time Scale for Local Scour at Bridge Piers. Journal of Hydraulic Engineering, 125(1), 59-65.
Melville, B. W., & Raudkivi, A. J. (1996). Effects of Foundation Geometry on Bridge Pier Scour. Journal of Hydraulic Engineering, 122(4), 203-209.
Moreno, M., Maia, R., & Couto, L. (2015). Effects of Relative Column Width and Pile-Cap Elevation on Local Scour Depth around Complex Piers. Journal of Hydraulic Engineering, 142(2), 1-9.
Moreno, M., Maia, R. & Couto, L. (2016a). Prediction of Equilibrium Local Scour Depth at Complex Bridge Piers. Journal of Hydraulic Engineering, 142(11), 1-13.
Moreno, M., Maia, R., Couto, L. & Cardoso, A. (2012). Evaluation of Local Scour Depth around Complex Bridge Piers. Proceedings of River Flow 2012, 2, 935-942.
Moreno, M., Maia, R., Couto, L. & Cardoso, A. (2014). Contribution of Complex Pier Components on Local Scour Depth. In Proc. 3rd IAHR Europe Congress.
Moreno, M., Maia, R., Couto, L. & Cardoso, A. H. (2016b). Subtraction Approach to Experimentally Assess the Contribution of the Complex Pier Components to the Local Scour Depth. Journal of Hydraulic Engineering, 06016030.
Parola, A. C., Mahavadi, S. K., Brown, B. M. & El Khoury, A. (1996). Effects of Rectangular Foundation Geometry on Local Pier Scour. Journal of Hydraulic Engineering, 122(1), 35-40.
Sheppard, D. M. & Glasser, T. (2009). Local Scour at Bridge Piers with Complex Geometries, In Contemporary Topics in In Situ Testing, Analysis, and Reliability of Foundations. International Foundation Congress and Equipment Expo 2009, ASCE, 506-513.
Sheppard, D. M., Odeh, M. & Glasser, T. (2003). Large Scale Clear-Water Local Pier Scour Experiments. Journal of Hydraulic Engineering, 130(10), 957-963.
Sheppard, D. M. & Renna, R. (2010). Bridge scour manual. Florida Department of Transportation, Florida. Yalin, M. S. (1972). Mechanics of Sediment Transport. Pergamon Press. Zhao, G. & Sheppard, D. M. (1998). The effect of flow skew angle on sediment scour near pile groups.
In Stream Stability and Scour at Highway Bridges: Compendium of Stream Stability and Scour Papers Conference, Sponsored by the Water Resources Engineering (Hydraulics) Division of the American Society of Civil Engineers (pp. 377-391). ASCE.
Proceedings of the 37th IAHR World Congress August 13 – 18, 2017, Kuala Lumpur, Malaysia
©2017, IAHR. Used with permission / ISSN 1562-6865 (Online) - ISSN 1063-7710 (Print) 421