education policy analysis archives - eric · education policy analysis archives vol. 18 no. 11 2...
TRANSCRIPT

education policy analysis archives A peer-reviewed, independent, open access, multilingual journal
Arizona State University
Volume 18 Number 11 May 25th, 2010 ISSN 1068–2341
Beyond Free Lunch:
Which Family Background Measures Matter?1
Sarah Theule Lubienski Corinna Crawford Crane
University of Illinois at Urbana-Champaign
Citation: Lubienski, S. T., & Crane, C. C. (2010) Beyond free lunch: Which family background measures matter? Education Policy Analysis Archives, 18(11). Retrieved [date], from http://epaa.asu.edu/ojs/article/view/756
Abstract: Most studies of school achievement use free-lunch eligibility or other basic indicators to adjust for differences in students’ socioeconomic backgrounds. This study determines whether these variables are enough to separate the confounding effects of students’ backgrounds from the main variables of interest in education studies. The Early Childhood Longitudinal Study dataset from the kindergarten class cohort of 1998-99 (ECLS-K) provides an unusually vast array of information regarding children’s home resources and experiences. This plethora of parent-reported data raises questions about which variables researchers should include in their analyses, and it provides an extraordinary opportunity to examine this question. Using a split-sample design, stepwise regression, and multi-level modeling, this study systematically examines over 200 ECLS-K student background variables to determine which factors predict reading and mathematics achievement after typical SES controls are employed. The study identifies several variables that are important supplements to traditional SES measures, including the
1 Accepted under the editorship of Sherman Dorn. The authors are grateful to Joseph P. Robinson,
Christopher Lubienski and Eric Camburn for their advice at various stages of this research. However, all errors and omissions are the authors’ alone. This research was generously supported by a Faculty Fellows Award from the College of Education, University of Illinois at Urbana-Champaign.

Education Policy Analysis Archives Vol. 18 No. 11 2
number of children in the household, mother’s age at first birth, and children’s books at home. Results indicate the extent to which “value added” studies can be flawed when using only basic demographic variables. The findings hold implications for data collection and accountability efforts, including NCLB, teacher evaluation plans, and the design of state longitudinal data systems. Keywords: social class; socioeconomic status; Early Childhood Longitudinal Study (ECLS-K); large-scale data; multi-level modeling; mathematics; reading; elementary school. Más allá del almuerzo escolar gratis: ¿Cuáles son las indicadores del contexto familiar que importan? Resumen: La mayoría de estudios sobre el desempeño de los estudiantes que usan calificación de las comidas escolares u otros indicadores de diferencias regulares socio-económico en el nivel de los estudiantes. El Este estudio determinó si estas variables son suficientes para distinguir los efectos de confusión de la situación socioeconómica otras variables de interés en los estudios en la Educación. El conjunto de datos del Estudio Longitudinal de la primera infancia con una clase de kindergarten de 1998-1999 (ECLS-K), proporciona un diferenciada gama de información sobre la vivienda de los niños y sus experiencias. Esta multiplicidad de datos informados por los padres, que plantea cuestiones acerca de las variables los investigadores deben incluir en sus análisis, y proporcionan una oportunidad extraordinaria para examinar este que se trate. Utilizando el diseño de la muestra dividida, la regresión "Por etapas" y los modelos multinivel, este estudio examina variar sistemáticamente el contexto familiar de más de 200 ECLS-K estudiantes para determinar qué factores predicen el rendimiento en lectura y matemáticas después de controlar para los trabajos de SES. El estudio identifica varias variables como suplementos importante de las medidas tradicionales de SES, incluyendo el número de los niños en el presupuesto familiar, la edad de la madre durante el primer parto y libros para los niños en residencia. Los resultados indican el grado de estudios que Por "valor añadido" podría ser errónea cuando se utiliza sólo el Variables demográficas básicas. Los resultados tienen implicaciones para recopilar datos y a los esfuerzos de la rendición de cuentas, incluyendo la ley NCLB, los planes de evaluación del profesorado y diseño del sistema de datos longitudinales del Estado. Palabras clave: clase social; nivel socioeconómico; estudio longitudinal de la primera infancia (ECLS-K) de datos a gran escala; modelo multinivel; matemáticas; lectura, educación primaria.. Para Além da merenda escolar gratuita: Quais são os indicadores de Contexto Familiar que importan? Resumo: A maioria dos estudos sobre o desempenho de alunos utiliza a qualificação à merenda escolar ou outros indicadores para regular as diferenças no nível sócio-econômico dos estudantes. O presente estudo determina se estas variáveis são suficientes para distinguir os efeitos de confusão dos níveis socioeconômicos de outras diversas variáveis de interesse nos estudos em Educação. O conjunto de dados do Estudo Longitudinal Da Primeira Infância com uma turma de Educação Infantil de 1998-1999 (ECLS-K) fornece uma diferenciada gama de informações a respeito da moradia das crianças e de suas experiências. Esta multiplicidade de dados informados pelos pais levanta questões sobre quais variáveis os pesquisadores deveriam incluir em suas análises, além de proporcionar uma extraordinária oportunidade para examinar esta questão. Utilizando o delineamento de amostra dividida, regressão “step-wise” e o modelo multiníveis, este estudo examina sistematicamente variáveis do contexto familiar de mais de 200 estudantes ECLS-K para determinar quais fatores predizem o desempenho de leitura e matemática após o emprego de controle SES. O estudo identifica diversas variáveis como suplementos importantes às medidas tradicionais da SES, incluindo o número de crianças no orçamento familiar, a idade da mãe durante o nascimento do primeiro filho e os livros infantis disponíveis na residência. Os achados indicam a

Beyond Free Lunch 3
medida em que os estudos de “valor adicionado” podem ser falhos quando utilizam apenas as variáveis demográficas básicas. Os resultados trazem implicações para a coleta de dados e para os esforços de prestação de contas, incluindo NCLB, planos de avaliação dos professores e o delineamento do sistema de dados longitudinais do Estado. Palavras-chave: classe social; nível socioeconômico; estudo longitudinal da primeira infância (ECLS-K); dados de larga escala; modelo multiníveis; matemática; leitura; ensino fundamental.
Introduction
Studies repeatedly show that socioeconomic status (SES) is among the strongest predictors of academic outcomes (Berliner, 2009; Lareau & Conley, 2008; Lee & Burkam, 2002; Rothstein, 2004; Sirin, 2005). Hence, it is important that studies of student achievement carefully account for relevant SES-related factors, even if equity is not the study’s primary focus. Many studies adjust for free-lunch eligibility and sometimes parent education level, income, and occupation. But are there other family background variables that have additional explanatory power and should routinely be included in studies of school achievement? Or are additional measures simply redundant with typical SES controls?
The Early Childhood Longitudinal Study–Kindergarten Class of 1998–1999 (ECLS-K) offers hundreds of parent-reported measures of children’s home resources and experiences. The availability of so many variables raises questions about which measures should be used in studies of achievement, yet it also offers an important opportunity to address such questions. This study systematically analyzes ECLS-K’s remarkably large range of parent-reported variables to determine the most powerful SES-related predictors of achievement. The Treatment of SES in Existing Research
“Socioeconomic status” (SES) is commonly used as a more measurable proxy for “social class,” a term that connotes more permanence and shared beliefs and practices than does SES (Secada, 1992). In this study, parental income (including lunch-program eligibility), occupation, and education level are used as traditional SES measures. However, the study also looks beyond those variables to include other measures of students’ home resources and experiences that relate to both SES and achievement.
SES and social class can be touchy subjects within the U.S. education research community. Talking in depth about class-related disparities can mean acknowledging problems such as teen pregnancy, and childhood trauma, which occur more often among low-SES families despite occurring in all social classes (Fine & Weis, 1998; Knitzer, 2002; National Center for Children in Poverty, 1997). Combined with the murky, contested definitions of class, our lack of comfort with discussions of class differences in the U.S. can limit discussions of the ways in which class differences can shape children’s academic futures (Duberman, 1976; Lubienski, 2003).
Despite these concerns, there is widespread agreement that studies of student achievement must account for social class differences among students, but lack of agreement as to which variables should be used. Free and reduced-price lunch eligibility is often the only socioeconomic indicator used in analyses of student achievement data. For example, under No Child Left Behind (NCLB) schools must disaggregate their data by free/reduced lunch eligibility, but no distinctions are made between the child of a doctoral student temporarily under the poverty line and the child of an unemployed single parent with no high school diploma, income, or home (Wenning, Herdman, Smith, McMahon, & Washington, 2003). The call for growth modeling proposals by former

Education Policy Analysis Archives Vol. 18 No. 11 4
Secretary of Education Margaret Spellings encouraged the use of more advanced statistical techniques to hold schools accountable for students’ progress, but again free/reduced lunch eligibility was the only SES measure mentioned in the guidelines.2 Unfortunately, emerging guidelines for state longitudinal data systems appear to do little more to promote the use of diverse SES-related variables.3 Even the most sophisticated statistical modeling techniques cannot accurately determine the effectiveness of particular teachers or schools if analysts do not account for important disparities in students’ backgrounds.
Still, it is often difficult for researchers and policy makers to know which home background measures to use. In a meta-analysis of education-related studies, Sirin (2005) found that parental income, education, and occupation as well as free/reduced lunch eligibility were the most commonly used SES indicators. He also observed that home resources such as books and computers tended to be significant correlates of both other SES indicators and achievement, but researchers used these variables less often. He noted that the strength between SES and achievement relied heavily on which variables were included and that parent-reported variables seemed to have stronger relationships with achievement than student-reported variables. He concluded that SES is a “multi-dimensional construct and different components yield different results” (p. 444). He recommended that researchers use multiple SES components in their studies but did not specify which components were the strongest correlates of achievement. In addition, his analysis was restricted to those relatively traditional measures used in the studies he reviewed.
A few studies of school achievement have gone beyond the most common SES measures. For example, Eagle (1989) analyzed the High School and Beyond data and found no significant relationship between family structure or maternal employment and student achievement. Blake (1992) focused specifically on the relationship between family size and achievement and found a negative correlation between number of siblings and several education-related outcomes, including verbal ability and high school completion.
Still other writers have published recommendations for researchers seeking guidance in measuring children’s socioeconomic backgrounds, but these recommendations have not been tied to specific studies of these measures’ predictive power in achievement analyses. For example, Entwisle and Astone (1994) provided practical guidance for researchers, as they outlined key questions that should be asked to measure each of three areas of “capital” that are important for children’s development, as discussed by Coleman (1988): financial (material resources), human (e.g., parent education level, occupation), and social (e.g., number of parents/grandparents living with the child). Hernandez (1997) outlined particular questions that researchers can use to gather demographic information comparable to U.S. Census data. Hauser (1994) argued that free lunch is a rough, unreliable measure and discussed ways to measure parents’ occupation, education, and financial resources. However, none of these scholars offered an empirical testing of the strength or redundancy of the various recommended SES-related variables as predictors of achievement.
More recently, Rothstein (2004) reviewed evidence regarding class differences in childhood experiences, as he argued that Black-White gaps are primarily due to social class differences that are not typically measured in large-scale education studies. Still, he found few studies that explicitly linked home resources with school achievement and therefore could make only tentative inferences about the effects of child rearing on later school achievement. Berliner (2009) reviewed a wide variety of evidence regarding correlations between various poverty-related measures (e.g., neighborhood concentrations of poverty, birth weight, health care access, etc.) and student
2 See 2006 guidelines for review of those proposals at
http://www.ed.gov/policy/elsec/guid/growthmodelguidance.pdf. 3 See http://nces.ed.gov/forum/longitudinal.asp.
Beyond Free Lunch 5
outcomes on tests, such as TIMSS and NAEP. Despite the potential importance of the individual correlations identified, his analysis leaves unanswered questions about confounding variables and the relative strength of the various predictors in shaping student achievement.
The Early Childhood Longitudinal Study—Kindergarten Class of 1998–1999
The Early Childhood Longitudinal Study—Kindergarten Class of 1998–1999 (ECLS-K), a National Center for Education Statistics (NCES) dataset, makes it possible to examine relationships between home background factors and achievement in new ways. ECLS-K followed a nationally representative sample of 22,000 students from 1277 schools. At the time of this study, data from kindergarten through fifth grade were available. In contrast with the National Assessment of Educational Progress (NAEP), which collects no data from parents, and in comparison with previous longitudinal studies such as the National Educational Longitudinal Study (NELS:88) and High School and Beyond, which focused on upper grades, ECLS-K offers an unusually rich array of information about students’ backgrounds at the start of their education career. Parents answered an extensive set of interview questions pertaining to traditional SES measures—such as occupation and income—as well as questions touching on issues typically excluded from large-scale education assessments, ranging from details of family structure, resources and activities to parents’ physical health, stress, and feelings toward their children. Despite the vast range of these parent-reported variables, most ECLS-K studies of achievement have used the SES composite of parent education, occupational prestige, and income, which is included in the ECLS-K dataset.
Existing research using ECLS-K. No study has systematically combed through the rich array of ECLS-K SES-related variables to determine the most powerful predictors of student achievement. Still, several studies have used ECLS-K data to examine class- and race-related equity issues. For example, researchers have used the standard SES composite when comparing kindergarten and first-grade growth rates of SES- and race-related disparities in the school year versus summer. These studies have tended to find that SES-related and most race-related gaps grow more quickly during the summer than during the school year but that the Black-White gap actually grows faster during the school year (Downey, von Hippel & Broh, 2004; Reardon, 2003). Burkam, Ready, Lee, and Logerfo (2004) found that higher-SES students’ participation in summer activities explained a small part of the growth in SES-related achievement disparities during the summer. Benson and Borman (2007) found that neighborhood differences exacerbate SES disparities in summer learning.
More recently, scholars have used ECLS-K data to study race- and ethnicity-related patterns in kindergarten through third- or fifth-grade achievement, concluding that after adjusting for SES, Black-White gaps in mathematics achievement widen as children progress through elementary school, while Hispanic-White gaps narrow (Reardon & Galindo, 2007; Reardon & Robinson, 2007). Also using ECLS-K, Easton-Brooks and Davis (2009) found that the Black-White gaps did not widen quite as much when students had teachers who were certified.
Fryer and Levitt (2004, 2006) used the kindergarten through third grade ECLS-K data to determine the extent to which Black-White test score gaps in achievement are attributable to SES. Unlike most studies discussed thus far, they went beyond the standard SES composite provided by ECLS-K (or the binary poverty measure used by Easton-Brooks & Davis, 2009). They found that a relatively small number of variables accounted for the entire Black-White gap in achievement that exists when students begin kindergarten, but these variables did not account for the increase in the Black-White gap between kindergarten and third grade. However, they admit that their selection of variables “might seem idiosyncratic” (2006, p. 256), and they do not explain how they arrived at those particular variables. It is unclear whether the particular subset of variables Fryer and Levitt
Education Policy Analysis Archives Vol. 18 No. 11 6
identified are indeed capturing the most important factors among the hundreds of parent-reported background variables available in ECLS-K.
Similarly, Lee and Burkam (2002) identified some parent-reported variables that account for much of the race- and SES-related gap in reading and mathematics achievement upon entry to kindergarten. They used a slightly different set of SES-related variables than did Fryer and Levitt and found relationships between children’s achievement upon entering school and indicators capturing family size/structure, preschool, books/computer in the home, and extracurricular activities. A similar study by Lin (2003) used roughly the same predictors as did Lee and Burkam, but she also examined interactions with race and found that parent emphasis on educational activities were particularly strong predictors of achievement for low-SES and non-White students.
Other scholars have focused on specific disparities in low- and high-SES students’ experiences and resources. For example, Magnuson, Meyers, Ruhm, and Waldfogel (2004) found that access to preschool programs is one source of SES-related achievement disparities in school readiness. Gershoff, Aber, Raver, and Lennon (2007) used path modeling and found two ways in which greater family income translates into better academic outcomes—the first route involving greater parent investment in educational resources and the second route involving less parental stress, which ultimately influences achievement through an increase in positive parenting behaviors and enhanced child socio-emotional competence. More recently, Cheadle (2008) used K–3 ECLS-K data to create a composite of 13 home environment and resource variables that captured Lareau’s (2003) concept of “concerted cultivation.” He then examined the extent to which this composite explained disparities in achievement gains related to parent education, occupation and income.
Despite these few notable exceptions, the vast majority of studies of the ECLS-K dataset have not looked beyond the standard SES composite when adjusting for student background differences. Furthermore, no study has systematically examined the rich set of ECLS-K parent-reported variables to identify the most powerful predictors of student achievement. In this era of accountability and the common use of only lunch-program eligibility to adjust for SES in analyses of teacher and school effectiveness, it is particularly important to determine the extent to which additional SES and other home background variables go beyond lunch-program eligibility to explain variation in student achievement. Research Questions
This study addresses the following questions: First, which ECLS-K home resource and climate measures are the most significant predictors of students’ reading and mathematics achievement at the start of kindergarten? Which of these variables are also significant predictors of kindergarten through fifth grade gains in achievement? Second, how much more variation in achievement is explained by those significant home resource and climate measures when compared to traditional NCLB demographic measures and the standard ECLS-K SES composite?
Taken together, these questions address whether there are important student home resources or practices that correlate with mathematics and reading achievement that are not simply redundant with traditional SES measures. The analyses will also reveal the portion of race-related achievement gaps and SES-related gaps (as traditionally measured) that are accounted for by the most significant home resource and climate measures. This study will contribute to future studies involving ECLS-K and other datasets (e.g., NAEP), as researchers can better account for relevant student background differences. Studies of education policy, including value-added analyses of particular schools or teachers, will be more effective if they can separate the confounding effects of SES and related background disparities from the main variables of interest. In this era of high-stakes accountability, it is particularly important for researchers to know how best to account for important demographic differences within and across diverse school contexts.

Beyond Free Lunch 7
Methods
This study was conducted using the kindergarten through fifth grade ECLS-K data. There were two main phases of data analysis. The first phase involved the use of stepwise regression to narrow the initial pool of 230 parent-reported variables. The second phase involved the use of multi-level models to examine the relationship between the final pool of background variables and student achievement. Data
ECLS-K data were collected at six points from kindergarten (fall 1998) through grade 5 (spring 2004). Data pertaining to selected students and their classrooms and schools were obtained from teacher surveys, school administrator surveys, parent interviews and phone surveys, and the students themselves. In early grades, ECLS-K personnel administered math and reading assessments to students orally in a one-to-one setting. (For more information on ECLS-K see Pollack, Najarian, Rock, & Atkins-Burnett, 2005; Tourangeau, Nord, Pollack, & Atkins-Burnett, 2006). To address the complex sampling design of ECLS-K (including the over-sampling of some groups and cluster sampling), student and design effect weights were used. The final sample for the kindergarten analysis included 16,124 children in 1231 schools, and the fifth-grade sample included 8,154 students in 1793 schools. Variables
The outcome measures for this study were the kindergarten and fifth grade mathematics and reading T-scores, which are standardized with each assessment wave to have a mean of 50 and a standard deviation of 10. Several variables were used to adjust for traditional demographic differences among students, including the child’s race, gender, age at time of assessment, child’s home language, and the socioeconomic status (SES) composite provided by ECLS-K. Binary variables were used for African American, Latino/a, Asian, “other race,” home language, and gender. School-level controls included a variable indicating the average SES composite (aggregated from the student level)4 and the percentages of lunch-eligible and White/Asian students in the school.
However, the primary focus of this study was examining home resource and climate variables. We first considered the hundreds of available ECLS-K variables and selected all those related to students’ home resources and experiences that might conceivably have an effect on students’ school achievement. The goal of the study was not to engage in theoretical debates about whether particular variables should or should not be considered “SES” or “social class” proxies. Instead, the goal was to empirically identify home background variables that were predictors of achievement and more prevalent in high-SES families, thereby providing a fuller picture of high-SES home advantages that could confound relationships typically under study in education policy research.
We initially selected 230 variables from the kindergarten data, including household composition and parent information (e.g. number of children in the household, parents’ marital status, mother’s age at first birth); parenting practices (e.g. reading, building things, chores, television habits, discipline); child care (e.g. cost, age at first enrollment, type of care, child:adult ratios); child’s
4 The school-level SES composite was not included in grade 5 models. The kindergarten sample
dispersed over time, resulting in many schools with few ECLS-K students. Hence, aggregating the student-level SES composite to the school level would not produce a reliable measure at grade 5.

Education Policy Analysis Archives Vol. 18 No. 11 8
health (e.g. weight at birth, frequency of doctor and dentist visits); access to resources (e.g. number of books in household, access to home computer); school involvement and connections (e.g. how often parents volunteer, attend meetings, contact school, contact parents of classmates); parental expectations (e.g. degree parents expect child to receive); and parents’ physical and mental health.
The distributions of these variables were examined; some were recoded as necessary to make binary variables, and we revised some ordinal scales to create more meaningful categories with a more linear relationship with achievement.
Stepwise regressions to narrow the pool of variables . Although factor analysis is often used to identify and combine large numbers of related variables, our goal was not to create composites of large numbers of variables. Instead, we sought to determine which individual home resource and climate variables were the most important predictors of achievement after adjusting for the usual demographic variables.5 Given the large numbers of variables and the consequent danger of “fishing,” the sample was randomly split in half, with one half used for initial determination of important variables, and the other used for confirmation. Whereas a variable typically has a 5% probability of being wrongfully identified as a significant predictor of achievement (with p<.05), the split-sample design reduces that probability to 0.25% (1 in 400).
We then performed a series of stepwise regressions with a forward-backward procedure on the first half of the sample, with the kindergarten reading and math T-scores each serving as the outcome variable along with basic demographic controls (race, home language, gender, age, lunch-program eligibility, and the SES composite). Stepwise regressions add and delete variables incrementally, determining which variables are the most important predictors of achievement to include in the model at each step. Even if student background variables are highly correlated with each other, all student background variables selected contribute something unique in terms of explaining variation in achievement. The change in p-value of the F statistic required for inclusion of potential variables was .05, with a change of .10 in p-value for removal.
Given the large number of variables to be considered, home resource and climate variables were initially run in related groups (e.g. child’s hobbies, parent involvement at school, child care, etc., as shown in the appendix), allowing the most important predictors of achievement within each group to be identified. These stepwise regressions produced a pool of 30 variables. These remaining variables were then collectively used as predictors in a stepwise regression (still with the first half of the sample only), narrowing the pool further to about 25 variables that were significant predictors of either mathematics or reading achievement at the start of kindergarten. These remaining variables were then entered in stepwise regressions (for both mathematics and reading) using the second half of the sample to determine which were truly significant and which may have been significant in the first half of the sample due to pure chance.6
5 We faced several dilemmas when determining which student background variables to include. For
example, we wondered whether to include birth weight, physical problems, and learning problems, which are certainly not unique to low-SES families but do significantly correlate with SES. When in doubt, we tended to include such variables to explore their significance. We chose to exclude “learning problem diagnosed” because this could be viewed as more of an outcome than a background measure, and we were interested in underlying SES-related factors that can lead to learning problems. However, speech and hearing problems were correlated with both SES and achievement and were included as background measures.
6 This further reduced the number of variables to 18 that were significant for mathematics or reading. However, we deleted 4 variables that were essentially alternate versions of variables that were significant in the other subject. For example, “child uses computer at home” and “child uses home computer to learn skills” both surfaced in the stepwise regressions, with the former in math and the latter in reading. In such cases, we simply took the stronger achievement predictor on average across the two subjects. Two other variables were found to increase the SES coefficient when entered into the regression equation (how

Beyond Free Lunch 9
Table 1. Descriptive statistics for kindergarten variables included in final analysis Variable N Min Max Mean SD Weight (kindergarten) 16124 0.01 3.94 1.00 0.48 Kindergarten math T-score 15498 18.66 86.26 50.32 9.99 Kindergarten reading T-score 14719 23.2 87.76 50.27 9.98 School-level % White and Asian 1231 0 100 62.04 34.46 School-level average SES score 1231 -1.63 2.01 -0.06 0.58 School-level % free/reduced lunch 1231 0 100 42.12 38.89 Continuous SES measure 16124 -4.75 2.75 -0.01 0.78 Lunch is free/reduced (0=no, 1=reduced, 2=free) 16124 0 2 0.69 0.91
African American (1=yes, 0=no) 16040 0 1 0.16 0.36 Latino/a (1=yes, 0=no) 16040 0 1 0.19 0.39 Asian (1=yes, 0=no) 16040 0 1 0.03 0.16 Pacific Isl., Native American, Multiracial 16040 0 1 0.05 0.21 Home language is not English (1=yes) 15481 0 1 0.11 0.31 Gender is male (1=yes, 0=no) 16124 0 1 0.51 0.50 Age in months 15766 45.77 87.2 68.21 4.11 How many books child has 15961 0 200 72.47 59.24 Have home computer child uses (1=yes) 16117 0 1 0.54 0.50 How often parent reads to child (1=not at all, 2=once or twice/week, 3=3-6 times/week, 4=everyday)
16097 1 4 3.24 0.79
What degree expected of child (1=< high school, 2=high school, 3=2+ years college, 4=college degree, 5=master’s degree, 6=PhD, M.D. other)
16028 1 6 4.08 1.12
How often parent volunteered at school in kindergarten year (if >10 = 11) 15985 0 11 2.41 3.70
Takes music lessons (1=yes, 0=no) 16103 0 1 0.07 0.26 Child had center care the year before kindergarten (1=yes, 0=no) 16100 0 1 0.57 0.50
Child's weight in ounces at birth 15539 16 219 117.92 21.38 Biological mother's age at first birth 15826 12 49 23.41 5.44 Number in household aged < 18 16124 1 11 2.48 1.17 Child had speech problems (1=yes 0=no) 16074 0 1 0.11 0.32 Child has difficulty hearing (1=yes, 0=no) 16078 0 1 0.03 0.16
important it is that the child knows letters and counts), indicating they are advantages and not disadvantages for low-SES students. Because this study focused on disadvantages related to SES that are not accounted for by traditional SES measures, these two variables were removed. However, this finding in itself was interesting in that lower-SES parents tended to be slightly more concerned than higher-SES parents that their children enter school with these basic math and reading skills. This pattern might exist because more higher-SES students had already mastered such skills and therefore their parents were less likely to view their child’s learning of these skills as important. Regardless, this SES difference suggests an area of strength of low-SES parents upon which policy makers and preschool educators could build.

Education Policy Analysis Archives Vol. 18 No. 11 10
The final 12 variables included in the HLM analysis are shown in Table 1 below, along with
their weighted descriptive information. Table 2 contains the mean of each variable for the lowest-, middle-, and highest-SES quintile.
Table 2. Descriptive statistics by 1st, 3rd and 5th SES quintiles –kindergarten
SES Quintile Variable Q1 Q3 Q5 Kindergarten math T-score 43.22 50.47 56.68 Kindergarten reading T-score 43.70 49.66 56.28 Lunch is free/reduced 1.58 0.57 0.09 Continuous SES measure -0.98 -0.10 1.15 African American 0.26 0.16 0.06 Latino/a 0.39 0.16 0.07 Asian 0.02 0.02 0.05 Other: Pacific Islander, Native American, multiracial 0.05 0.04 0.03 Home language is not English 0.30 0.05 0.05 Gender is male 0.51 0.50 0.51 Age in months 67.93 68.23 68.26 How many books child has 32.60 75.02 107.71 Have home computer child uses 0.20 0.55 0.85 How often parent reads to child 2.93 3.22 3.55 What degree expected of child 3.80 4.03 4.48 How often parent volunteered in kindergarten 0.86 2.35 4.23 Takes music lessons 0.03 0.06 0.17 Child had center care the year before kindergarten 0.28 0.58 0.81 Biological mother's age at first birth 19.93 22.92 27.84 Number in household aged < 18 2.87 2.37 2.36 Child's weight in ounces at birth 114.79 117.71 120.71 Child had speech problems 0.14 0.12 0.09 Child has difficulty hearing 0.04 0.02 0.02
Given the importance of home resources and experiences in shaping early achievement, the
exploration of demographic variables using stepwise regression focused on variables reported by parents when students were in kindergarten. However, this study sought to also understand whether the same variables that predict initial school achievement also predict gains in achievement as students progress through school. Initially, we had planned to use demographic variables reported at kindergarten to predict K–5 gains, so that the demographic variables would be consistent across the study’s four analyses. However, the correlation between some key demographic variables reported at kindergarten and the same variables reported at fifth grade were surprisingly low. For example, the Pearson correlation for kindergarten and fifth-grade lunch-program eligibility was only .62, and only

Beyond Free Lunch 11
.4 for the number of books children had.7 Hence, we used the variables reported at grade 5 for the fifth-grade analyses.8 It is likely that if we had conducted our initial search for demographic predictors using the grade 5 variables, we would have identified a slightly different set of variables. However, the focus here was on identifying the strongest home influences on achievement, and we focused on kindergarten for that initial analysis given that home resources and environment arguably have the strongest effect on students’ pre-k learning.9 Tables pertaining to grade 5 variables are included in the appendix.
HLM analysis. Multi-level modeling was used to examine the relationship between SES-related variables and achievement, with students nested within schools. We used multi-level modeling for several reasons. First, given the study’s focus on identifying powerful student demographic variables, it was important to separate the effects of individual students’ backgrounds from school-level and neighborhood-level demographic factors. At kindergarten, school-level demographics tend to mirror most students’ neighborhood demographics. Second, accounting for the fact that students were clustered by school was important for the K–5 analyses of student gains, and when possible we strove for consistency in the Kindergarten analyses and the K–5 analyses. Finally, this study holds implications for which SES variables should be used in other school achievement studies, which often use multi-level models to examine school effectiveness. The significant intraclass correlations in the various models reveal that the use of multi-level models was sensible at both kindergarten and grade 5.
The analyses reported below were conducted using HLM 6.0 (Raudenbush & Bryk, 2002; Raudenbush, Bryk, Cheong, Congdon, & du Toit, 2004). Four distinct series of models were run, with each nesting students within schools (2-level). The first two series of models used initial kindergarten mathematics and reading achievement as the outcome variables, and the latter two used fifth-grade mathematics and reading achievement as the outcomes. Each series began with a null model followed by several models containing the more traditional demographic variables at the student level (SES composite, race/ethnicity, age, home language), and school level (average SES composite, percentage White and Asian). In subsequent models, the more nontraditional student background measures were entered in blocks, with each block representing a cluster of conceptually related variables (e.g., educational resources, parent educational emphasis, child’s health).10 This
7 The SES composite of parents’ occupation, education and income was more stable with a correlation of
almost .9. 8 Two kindergarten parent-reported variables were not available in grade 5. There was no variable about
how often the parent reads to child in 5th grade, so we used the kindergarten variable in the grade 5 models. Also, there was no variable indicating how often a parent volunteered in 5th grade, but there was a binary variable indicating whether a parent volunteered during the school year, so that was included instead.
9 It is possible that a slightly different set of variables would have been identified if the analytical approach had been modified. For example, the conservative, split-sample design might have caused the omission of significant variables. However, the strength of the split-sample approach is that we can be fairly confident that all variables identified here are indeed significant predictors of achievement for U.S. students. Also, the manner in which the SPSS program randomly split the sample and the parameters set for the stepwise regressions might also have influenced the results. However, we found that the main change that occurred when manipulating these aspects was the substitution of one variable for another closely related variable—such as the two computer-related variables mentioned in footnote 4. In the end, the analysis succeeds in its primary goal of identifying important supplements to traditional SES measures, with each variable having proved its significance in multiple analyses.
10 The HLM equations for the full kindergarten reading and mathematics models were as follows. Binary variables were entered uncentered, and the remaining variables (italicized below) were grand-mean centered. Level-1 Model:
Education Policy Analysis Archives Vol. 18 No. 11 12
method allowed for an examination of the effect of each block of variables on the unexplained variation in achievement between and within schools, as well as on coefficients for student race and SES (as traditionally measured), indicating how much of the race- and SES-related gap in achievement can be attributed to them. The second two series of models were similar but used 5th grade mathematics and reading achievement as the outcome variables while adjusting for kindergarten scores, to examine the effects of the variables on students’ achievement gains from kindergarten through 5th grade.
Results
As explained above, the stepwise regressions resulted in a final set of variables to be included in the HLM models. Table 3 presents 13 models with kindergarten reading as the outcome variable. Three additional series of models were run—those with kindergarten mathematics, fifth-grade reading, and fifth-grade mathematics as the outcome. For the sake of brevity, only the kindergarten reading model is discussed in detail here, with a summary of results across all four sets of models presented in Tables 4 and 5. The appendix contains additional details regarding the analyses of kindergarten mathematics and fifth-grade reading and mathematics. HLM Results for Kindergarten Reading
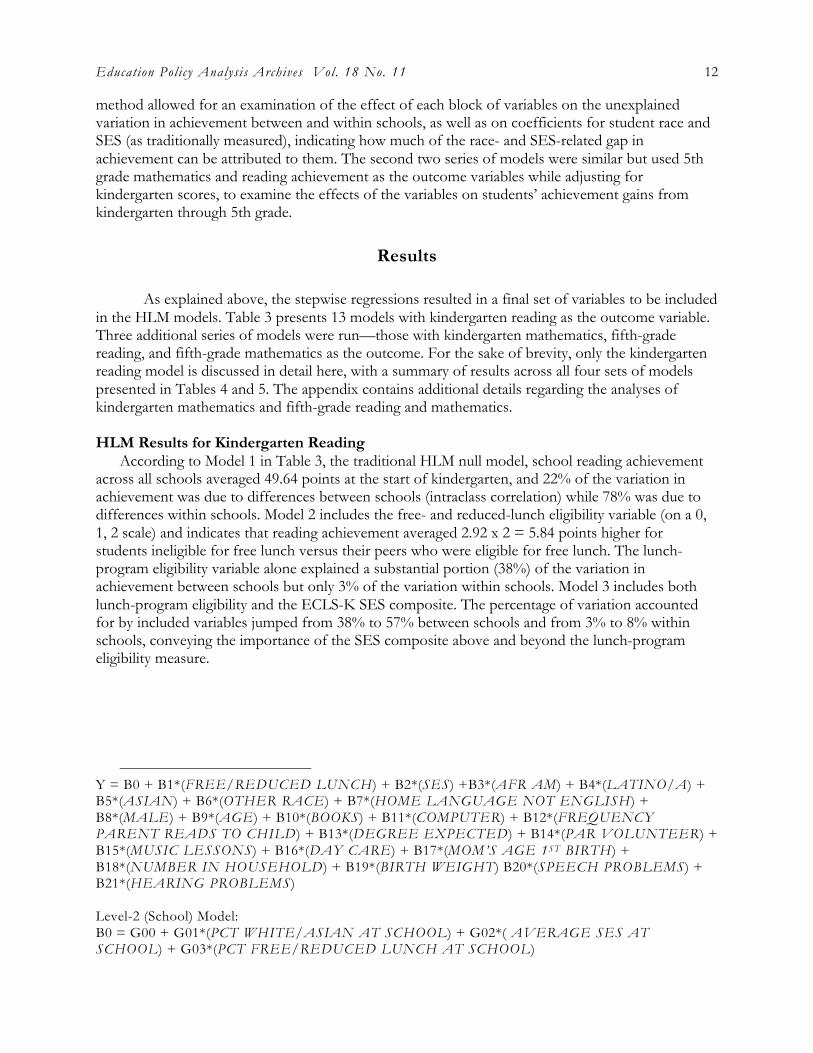
According to Model 1 in Table 3, the traditional HLM null model, school reading achievement across all schools averaged 49.64 points at the start of kindergarten, and 22% of the variation in achievement was due to differences between schools (intraclass correlation) while 78% was due to differences within schools. Model 2 includes the free- and reduced-lunch eligibility variable (on a 0, 1, 2 scale) and indicates that reading achievement averaged 2.92 x 2 = 5.84 points higher for students ineligible for free lunch versus their peers who were eligible for free lunch. The lunch-program eligibility variable alone explained a substantial portion (38%) of the variation in achievement between schools but only 3% of the variation within schools. Model 3 includes both lunch-program eligibility and the ECLS-K SES composite. The percentage of variation accounted for by included variables jumped from 38% to 57% between schools and from 3% to 8% within schools, conveying the importance of the SES composite above and beyond the lunch-program eligibility measure.
Y = B0 + B1*(FREE/REDUCED LUNCH) + B2*(SES) +B3*(AFR AM) + B4*(LATINO/A) + B5*(ASIAN) + B6*(OTHER RACE) + B7*(HOME LANGUAGE NOT ENGLISH) + B8*(MALE) + B9*(AGE) + B10*(BOOKS) + B11*(COMPUTER) + B12*(FREQUENCY PARENT READS TO CHILD) + B13*(DEGREE EXPECTED) + B14*(PAR VOLUNTEER) + B15*(MUSIC LESSONS) + B16*(DAY CARE) + B17*(MOM’S AGE 1ST BIRTH) + B18*(NUMBER IN HOUSEHOLD) + B19*(BIRTH WEIGHT) B20*(SPEECH PROBLEMS) + B21*(HEARING PROBLEMS) Level-2 (School) Model: B0 = G00 + G01*(PCT WHITE/ASIAN AT SCHOOL) + G02*( AVERAGE SES AT SCHOOL) + G03*(PCT FREE/REDUCED LUNCH AT SCHOOL)

Beyond Free Lunch 13
Table 3. HLM Results for Kindergarten Reading 1 2 3 4 5 6 7 8 9 10 11 12 13
Base +Lunch +SES
Race Languag
e Gender
Age NCLB groups
NCLB +school
All Basic Demog.
+Ed. Resource
s
+Parent Ed.
Emphasis
+Center Care
Pre-K +Home
Structure +Child Health
Lean Version
Intercept 49.64‡ 49.88‡ 50.02‡ 51.98‡ 50.71‡ 50.64‡ 51.46‡ 50.40‡ 50.41‡ 49.26‡ 49.44‡ 49.71‡ 49.68‡
Lunch-program eligibility -2.92‡ -1.76‡ -2.57‡ -2.26‡ -1.39‡ -1.21‡ -1.17‡ -1.08‡ -0.73‡ -0.68‡ -1.49‡
SES in kindergarten 3.69‡ 3.16‡ 2.70‡ 2.26‡ 2.07‡ 1.84‡ 1.78‡ African American -3.16‡ -1.43‡ -1.01† -0.55 -0.01 -0.14 -0.12 0.36 0.46 0.16
Latino/a -3.55‡ -2.85‡ -2.69‡ -1.93‡ -1.60‡ -1.78‡ -1.68‡ -1.49‡ -1.46‡ -1.89‡
Asian 3.48‡ 3.42‡ 3.48‡ 2.78‡ 3.19‡ 2.98‡ 3.07‡ 3.12‡ 3.15‡ 3.76‡
Other race -2.44‡ -1.71† -1.60† -1.41† -1.02* -1.07* -0.91* -0.72 -0.68 -0.98*
Home language not English -2.31‡ -1.67‡ -1.57‡ -1.29† -0.87* -1.22† -1.09† -1.17† -1.13† -0.87*
Gender - male -1.86‡ -1.91‡ -1.86‡ -1.69‡ -1.70‡ -1.74‡ -1.73‡ -1.71‡
Age at assessment (mos.) 0.42‡ 0.43‡ 0.44‡ 0.44‡ 0.43‡ 0.45‡ 0.45‡ 0.45‡
School % White/Asian -0.01 -0.02† -0.02† -0.01† -0.01* -0.01* -0.01* -0.02†
School average SES score 2.65‡ 2.39‡ 1.99‡ 1.69‡ 1.31‡ 1.26† School % free/reduced lunch -0.05‡ -0.01 -0.01 -0.01 -0.01 -0.01 -0.01 -0.04‡
Books child has 0.013‡ 0.009‡ 0.009‡ 0.010‡ 0.010‡ 0.017‡
Home computer child uses 1.49‡ 1.29‡ 1.22‡ 1.23‡ 1.19‡ 2.21‡
Freq. parent reads to child 0.75‡ 0.74‡ 0.69‡ 0.71‡ 1.03‡
Degree expected of child 0.56‡ 0.54‡ 0.47‡ 0.46‡ Freq. parent volunteers 0.12‡ 0.12‡ 0.12‡ 0.11‡ Takes music lessons 1.87‡ 1.86‡ 1.75‡ 1.76‡ 2.59‡
Center care yr before K 2.01‡ 1.67‡ 1.65‡ Bio mat. age at first birth 0.18‡ 0.18‡ Number in HH < 18 -0.74‡ -0.76‡ -0.92‡
Child's birth wt (oz.) 0.02‡ Speech problems ` -1.66‡
Hearing problems -2.30‡
Random ef f e c ts
Intercept 21.94 13.65 9.40 17.12 12.69 10.65 6.98 6.83 6.54 6.10 5.72 5.71 7.95 Level-1 (within-school variance) 76.83 74.37 70.62 71.99 73.35 73.38 66.78 65.87 64.80 64.25 62.97 62.62 66.47 Level-2 (intraclass correlation) 0.22 0.16 0.12 0.19 0.15 0.13 0.09 0.09 0.09 0.09 0.08 0.08 0.11 % between-school variation explained 38% 57% 22% 42% 51% 68% 69% 70% 72% 74% 74% 64% % within-school variation explained 3% 8% 6% 5% 4% 13% 14% 16% 16% 18% 18% 13%
*p < .05. †p < .01. ‡p < .001.

Education Policy Analysis Archives Vol. 18 No. 11 14
Model 4 does not include lunch-program eligibility but includes other basic demographics, including students’ race/ethnicity, home language, gender, and age. This model provides baseline estimates for race- and ethnicity-related gaps in achievement, which tend to diminish in later models. To help the reader interpret these HLM results, one should understand that the intercept is the estimated mean achievement of a student who is 0 on all of binary predictors and at the mean for all continuous predictors. For example, Model 4’s intercept of 51.98 is the estimated mean achievement for a White female of average age whose primary home language is English. For an African American student, the estimate would be 3.16 points less (or an effect size of roughly 0.3, given that the standard deviation of the achievement T-score is 10). Overall, the percentage of variation explained by these variables is far less than that explained by Model 3’s lunch-program eligibility and SES composite.
Model 5 includes student-level variables that correspond with NCLB reporting categories for race/ethnicity, language, and lunch-program eligibility. In this model, the African American estimate of –3.16 has now changed to -1.43 but is still significant. Hence, the lunch-program eligibility variable “accounts for” a major portion of but clearly not all of the achievement differences between African American and White students within the same school. The NCLB variables in Model 5 explain substantially less variation in achievement than Model 3’s lunch-program and SES composite variables.
Prior research has shown that the SES and racial composition of a school is related to student achievement within the school (what some call peer effects) (Coleman et al., 1966). Model 6 retains the NCLB student-level variables in Model 5 and adds the school-level percentage of White/Asian students and percentage eligible for free or reduced-price lunch. Given that the models focus on early kindergarten achievement, if significant the school composition variables are likely serving as a proxy for neighborhood demographics. Indeed, Model 6 reveals a significant relationship between the percentage of students eligible for subsidized lunch and school mean achievement. Almost 25% more variation in achievement between schools is accounted for by Model 6 than by the student-level variables in Model 5, suggesting the importance of the school-level lunch-program variable (as the racial composition variable was not statistically significant). This finding indicates that even for early elementary school studies, it is important to include school-level demographics to help account for background differences among students.
Model 7 retains the NCLB demographics from Model 6 and includes the ECLS-K SES composite at the individual and school level as well as student age and gender. Hence, this model includes the most commonly used demographic controls. With the addition of these variables, we see a substantial jump in the percentage of variation explained from Model 6, from 51% to 68% between schools and 4% to 13% within schools. The coefficient for African Americans was almost halved again (from -1.01 in Model 6 to -.55 in Model 7) and lost its statistical significance, indicating the importance of adjusting for parental education, occupation and income in addition to lunch-program eligibility.11,12 Consistent with Reardon and Galindo’s (2006) findings regarding
11 The strength of those parent variables, if added as three individual variables, is likely slightly greater
than what we see with the composite. However, since the composite is so commonly used in ECLS-K and other research, we chose to use the composite here.
12 The percentage of boys and girls does not differ by race/ethnicity, and the age of students was fairly consistent, with the mean age in months being 67.5 for Hispanic students, 67.9 for African-American students and 68.6 for White students. Given that White students’ mean age was slightly higher than that of other groups, the addition of age in Model 7 likely accounts for some of the increase in the race/ethnicity-related estimates we see from Model 6 to 7, with the remainder accounted for by the inclusion of the SES composite.

Beyond Free Lunch 15
mathematics achievement, although the coefficient for Latino students diminished, it remained a significant -1.93 points.
As we include additional home background variables in Models 8–12, we can examine the influence on SES and race coefficients as well as the percentage of variation accounted for. For example, if a background variable correlates positively with achievement and is less prevalent for African American families, then the African American coefficient would increase after adding that variable because we have adjusted for a “disadvantage” for African American students. Model 8 reveals that after adjusting for the availability of books and computer at home, a substantial increase in the African American coefficient occurs (from -0.55 to -0.01), leaving that coefficient near 0 and indicating that the entire Black-White gap in initial school reading achievement is accounted for. The reductions in the magnitude of the coefficients for lunch-program eligibility and the SES composite also indicate that a portion of the advantage for high-SES families (according to traditional measures) is accounted for by the inclusion of the availability of educational resources at home. Along with the fact that the overall variation in achievement explained increased only slightly, those reductions suggest that home educational resources are substantially but not completely redundant with the SES measures already in Model 7. Throughout the remaining models, the percentage of variation explained continues to incrementally increase, so that by Model 12, 74% of the variation in achievement between schools and 18% of variation within schools is explained. Most increases are small, with each subsequent model explaining an additional 1–2% of the variation in achievement between schools and 0–2% of the variation within schools. The addition of mother’s age and the number of siblings (Model 11) arguably had the strongest impact of all Models 8–12, increasing the percentage of variation explained by 2% both within schools and between schools.
In Model 12, the 74% of variation in achievement between schools and 18% of the variation within schools accounted for is almost double the 38% between-school variation accounted for by free and reduced-price lunch eligibility alone (Model 2) and is six times the 3% within-school variation accounted for by lunch-program eligibility alone. The amount of variation explained by the additional home background factors (Models 8–12) appears relatively small, but it is important to note that they were added last and therefore had far less of the potential variation in achievement left to explain. It is noteworthy that lunch-program eligibility explained only 3% of the variation in reading achievement within schools, and the addition of the other SES-related measures in Model 12 explained an additional 5% of this variation after all typical demographic controls were entered (in Model 7).
Hence, it is clear that for kindergarten at least, the inclusion of these parent-reported variables can account for vastly more of the variation in students’ reading achievement than the basic lunch-program eligibility and race/ethnicity demographics alone. These models also indicate that the inclusion of school-level variables matter, even in early kindergarten when those variables are likely serving as a proxy for neighborhood demographics, as opposed to conveying meaningful differences in students’ school experiences.
However, many researchers are not able or willing to collect demographic data from parents and few would want to use such a large number of SES-related variables as demographic controls in studies focusing on other (non-demographic) factors. Indeed, in NAEP, which is the largest, ongoing U.S. dataset related to school achievement, no parent-reported data are collected; instead, school administrators and students report demographic information.
Given the difficulty and expense of collecting demographic data from parents, we ran an additional model including only those variables that could reasonably be collected from school administrators and students. These variables include the typical NCLB information for students and schools, as well as student gender, age, the number of books the child has at home, whether the

Education Policy Analysis Archives Vol. 18 No. 11 16
child uses a computer at home, how often a parent reads to the child, whether the child takes music lessons,13 and the number of children in the household. Model 13 presents the results for this “lean version.” Clearly, this model is somewhat weaker than Model 12 in that the amount of variation between schools explained is 64% and within schools is 13% (in contrast to 74% and 18% for Model 12). However, this model is much stronger than Models 5 and 6, which include typical NCLB controls. Results for Kindergarten Mathematics and K–5 Reading and Mathematics
The above results pertain to kindergarten reading, but it is not yet clear how results might differ by subject matter or grade-level. For the sake of brevity, the kindergarten mathematics models and the K–5 models are not discussed in detail here but the final results are summarized in Tables 4, 5 and 6 (with more details in the appendix). Table 4 reveals the estimates for all variables that were significant in the final models (Model 12) for the four sets of HLM runs.
Virtually all of the variables included in the kindergarten reading models were also significant predictors of mathematics achievement at the start of kindergarten. However, there was much less consistency in the predictors of K–5 gains in reading and mathematics scores. Several patterns in Table 4 are worthy of note.
First, the number of children in the household was more closely related to students’ initial kindergarten reading abilities than mathematics abilities, as each additional child in the household corresponded with a decrease of 0.46 points in kindergarten mathematics scores, but 0.76 points in reading. Similarly, the number of children at home was negatively correlated with K–5 gains in reading but not mathematics. Curious, we investigated further and found that this relationship is much stronger for low-SES families than for high-SES families. Although a causal relationship cannot be definitively determined, it makes sense that having fewer children in the household could make it more likely that children will find time and a quiet space to read, and that parents might devote more attention to each child’s verbal and reading development (as argued by Blake, 1989). Additionally, perhaps high-SES families’ resources (e.g., larger living spaces or the ability to hire domestic help when needed) make it possible to buffer children from negative effects of multiple siblings.
The HLM coefficient estimate for “How often parent reads to child” was more than twice as large for kindergarten reading achievement (0.71) than math achievement (0.30), and the number of books a child has at home was a consistent predictor of mathematics and reading achievement at kindergarten but a predictor of K–5 gains in reading only. These patterns make sense and provide additional validation of the data and the analysis.
Many variables were not significant predictors of K–5 gains in achievement, despite being significant predictors of both mathematics and reading achievement at the start of kindergarten. This is not too surprising, given that these variables were in some sense indirectly accounted for in the K–5 models by the inclusion of the kindergarten score as a covariate in the model. Still, three variables were significant predictors of K–5 gains in both reading and mathematics, with the SES composite having the strongest relationship for both mathematics and reading and the degree parents expected and music lessons also showing significance for both school subjects.
13 Some might take issue with the inclusion of “music lessons,” because it seems less of a direct measure
of SES than the other variables. We ran an additional “lean model” without music lessons, which was only slightly weaker than Model 13, explaining 62% of the variation in achievement between schools (instead of 64% in Model 13), but roughly the same amount (13%) of variation within schools.

Beyond Free Lunch 17
Table 4. Significant SES-Related Predictors from Final Full Model (Model 12)
Kindergarten K-5 gain Variable Reading Math Reading Math School-level % White and Asian -0.01* School-level average SES score 1.26† 1.17‡ na na School-level % free/reduced lunch -0.01* Lunch is free/reduced -0.68‡ -0.55‡ -0.55* Continuous SES measure 1.78‡ 1.59‡ 0.88† 1.06‡ How many books child has 0.010‡ 0.012‡ 0.002* Have home computer child uses 1.19‡ 1.37‡ How often parent reads to child 0.71‡ 0.30† What degree expected of child 0.46‡ 0.52‡ 1.26‡ 1.06‡ Frequency parent volunteered in kindergarten 0.11‡ 0.13‡ Takes music lessons 1.76‡ 1.57‡ 0.82† 0.67* Center care the year before kindergarten 1.65‡ 1.48‡ Biological mother's age at first birth 0.18‡ 0.16‡ 0.07† Number in household aged < 18 -0.76‡ -0.46‡ -0.36† Child's weight in ounces at birth 0.02‡ 0.03‡ Child had speech problems -1.66‡ -1.50‡ -3.90† Child has difficulty hearing -2.30‡ -2.95‡ -2.92* Percentage of between-school variation explained in model 12 74% 90% 58% 60%
Percentage of within-school variation explained in model 12 18% 21% 32% 47%
*p < .05. †p < .01. ‡p < .001.
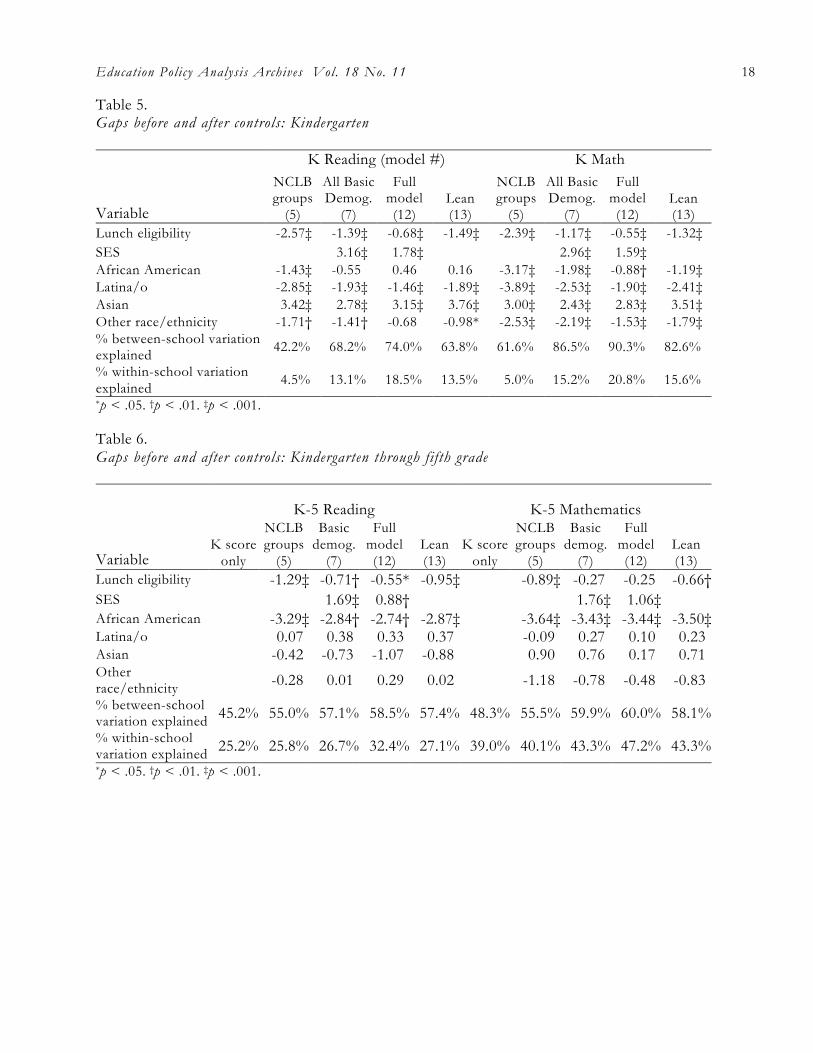
Tables 5 and 6 summarize the change in the SES- and race-related estimates and percentage
of variation explained before and after the addition of the extra SES-related variables (coefficients from Models 5, 7, 12 and 13).
Demographics tended to explain an even larger portion of the variation in kindergarten mathematics achievement than reading, particularly variation between schools. After the inclusion of all of the home resource and climate factors, the variables accounted for a total of 90% of the variation in kindergarten mathematics achievement between schools and 21% within schools (compared with 74% and 19%, respectively, for reading). At grade 5, the demographics appear to explain a larger portion of the within-school mathematics gap than for reading, but the bulk of that explanation lies with the kindergarten score covariate, which alone explained 39% of the math achievement variation within schools, compared with 25% for reading. This pattern reveals that the relationship between kindergarten and fifth-grade achievement was substantially stronger in mathematics than in reading.
Education Policy Analysis Archives Vol. 18 No. 11 18
Table 5. Gaps before and after controls: Kindergarten
K Reading (model #) K Math
Variable
NCLB groups
(5)
All Basic Demog.
(7)
Full model (12)
Lean (13)
NCLB groups
(5)
All Basic Demog.
(7)
Full model (12)
Lean (13)
Lunch eligibility -2.57‡ -1.39‡ -0.68‡ -1.49‡ -2.39‡ -1.17‡ -0.55‡ -1.32‡ SES 3.16‡ 1.78‡ 2.96‡ 1.59‡ African American -1.43‡ -0.55 0.46 0.16 -3.17‡ -1.98‡ -0.88† -1.19‡ Latina/o -2.85‡ -1.93‡ -1.46‡ -1.89‡ -3.89‡ -2.53‡ -1.90‡ -2.41‡ Asian 3.42‡ 2.78‡ 3.15‡ 3.76‡ 3.00‡ 2.43‡ 2.83‡ 3.51‡ Other race/ethnicity -1.71† -1.41† -0.68 -0.98* -2.53‡ -2.19‡ -1.53‡ -1.79‡ % between-school variation explained 42.2% 68.2% 74.0% 63.8% 61.6% 86.5% 90.3% 82.6%
% within-school variation explained
4.5% 13.1% 18.5% 13.5% 5.0% 15.2% 20.8% 15.6%
*p < .05. †p < .01. ‡p < .001. Table 6. Gaps before and after controls: Kindergarten through fifth grade
K-5 Reading K-5 Mathematics
Variable K score
only
NCLB groups
(5)
Basic demog.
(7)
Full model (12)
Lean (13)
K score only
NCLB groups
(5)
Basic demog.
(7)
Full model (12)
Lean (13)
Lunch eligibility -1.29‡ -0.71† -0.55* -0.95‡ -0.89‡ -0.27 -0.25 -0.66† SES 1.69‡ 0.88† 1.76‡ 1.06‡ African American -3.29‡ -2.84† -2.74† -2.87‡ -3.64‡ -3.43‡ -3.44‡ -3.50‡ Latina/o 0.07 0.38 0.33 0.37 -0.09 0.27 0.10 0.23 Asian -0.42 -0.73 -1.07 -0.88 0.90 0.76 0.17 0.71 Other race/ethnicity -0.28 0.01 0.29 0.02 -1.18 -0.78 -0.48 -0.83
% between-school variation explained 45.2% 55.0% 57.1% 58.5% 57.4% 48.3% 55.5% 59.9% 60.0% 58.1%
% within-school variation explained 25.2% 25.8% 26.7% 32.4% 27.1% 39.0% 40.1% 43.3% 47.2% 43.3% *p < .05. †p < .01. ‡p < .001.

Beyond Free Lunch 19
Kindergarten coefficients for African American, Latino/a, and “other race” tended to be larger and more persistent in mathematics than reading. For example, while the SES-related factors included in the model explained all of the Black-White reading gap at the start of kindergarten, those same factors explained most but not all of the kindergarten math gap. At grade 5, patterns varied, but again the Black-White gap was slightly wider and more persistent in mathematics than in reading. The results for Asian students indicate that home resource and climate factors do not explain the advantage of Asian students in initial kindergarten math and reading achievement, but these variables explain virtually all the Asian-White gap in K–5 mathematics gains. The extent to which tracking, teacher quality, and other factors contribute to the remaining race-related gaps is important but beyond the scope of this paper. Limitations
One potential limitation of ECLS-K data is that the parent data are self-reported. However, given that a goal of this study is to identify easily obtainable student background information that can be used in future studies, the fact that the data are self-reported makes those variables more replicable in future studies.
One area for future research is the extent to which student-reported data would have the same predictive power as parent-reported data, particularly for variables such as “number of children at home,” which could be relatively easily collected from students. Ensminger et al. (2000) compared Baltimore middle- and high-school students’ and their mothers’ responses to eight SES items in a 1991–92 survey (e.g., food stamps, lunch-program eligibility). Responses were consistent more often than not, with the percentage of agreement falling between 50% and 80% on most items. However, the consistency varied by age, SES, and the type of item. Hence, additional research is needed to determine whether student-reported data pertaining to the particular variables identified in this study would be similar to the parent-reported data in terms of predicting achievement.
Another potential limitation is the HLM models’ assumption of a linear relationship between the predictor variables and achievement. Yet, again, with the purpose of this study being to identify some basic controls that can be easily used in other studies, the assumption of linear relationships and the avoidance of adding more complicated terms (such as logs or squared variables) might make the results more useful to others, particularly those who simply want to institute basic controls for the most important differences in students’ backgrounds while focusing on other predictors of achievement.
Another limitation is raised by the work of Murnane, Willett, Bub, and McCartney (2006), who used the NICHD dataset and found quite different patterns relating to the Black-White gap than Fryer and Levitt’s (2004) analysis of ECLS-K. Given Murnane’s hypothesis that these differences were due at least in part to differences in the student assessments, additional studies with other datasets are needed to determine the extent to which the relevant student background variables identified in this study are consistently important predictors of achievement, regardless of the particular achievement measure used. Similarly, we focused on factors that predicted kindergarten achievement when selecting the pool of variables to include in the HLM analyses. It is unclear how this pool might have differed if variables from later grades had been used.
Finally the correlations identified here are not assumed to be causal. For example, the presence of a computer in the home or a child’s involvement in music lessons might not cause higher achievement but might instead serve as a proxy for other important aspects of parents’ priorities, practices or resources. Additionally, particularly at grade 5, the causal order involving some variables might be reversed—for example, parents might rate their children’s futures highly because they are already high-achieving students. Similarly, although the home background variables identified in this study are statistically related to SES (as defined by parent occupation, education,

Education Policy Analysis Archives Vol. 18 No. 11 20
and income), there will be conflicting perspectives on whether these background variables actually meaningfully measure some aspect of either SES or social class. Researchers will need to consider their own definitions of these constructs when determining if the variables identified here fit within the aims of their studies.
Discussion
This study provides a thorough examination of SES-related predictors of achievement using large-scale, nationally representative data. Before discussing the main results of this study it is worth noting several important patterns related to race and SES that are confirmed in the HLM estimates. We then take stock of the variables that were and were not significant predictors of achievement before turning to implications for researchers and policymakers, including what these results mean for conceptualizing SES, collecting data for future studies, interpreting value-added analyses, and addressing SES-related inequities. Confirming Recent Findings Regarding Race/Ethnicity
This study confirms recent studies indicating that, in contrast to the Latino/a-White gap, the Black-White gap in initial kindergarten disappears after adjusting for a small set of SES-related variables. However, while the Hispanic-White gap does not widen between kindergarten and grade 5, the Black-White gap and SES-related gaps significantly increase. Again, these findings are consistent with other recent studies using ECLS-K data (e.g., Fryer & Levitt, 2004, 2006; Reardon & Galindo, 2007; Reardon & Robinson, 2007).14 Insignificant Variables
This study reveals which variables do not correlate with achievement after basic demographic factors are accounted for. Family structure was not correlated: that is, whether students were in a single- or dual-parent household was not a significant predictor of achievement. Additionally, there were dozens of questions asked of parents to assess their mental and physical health and the climate in the home, including the degree of stress parents felt about finances, parenting, and relationships. None of these individual variables were significant predictors of achievement after adjusting for race/ethnicity and other SES variables. However, it is important to note that the home climate and stress variables were used individually to be compatible with the aims of this study; some of these variables collectively comprise established indices of family relationships and psychological well-being, and these composites might have been more powerful predictors of achievement than individual variables. Significant Predictors of Achievement
The main purpose of this study was to systematically comb through a wide array of parent-reported background variables to identify those that were significant predictors of achievement even after adjusting for the usual demographic variables. Those that predicted both kindergarten
14 However, while Fryer and Levitt (2006) found that the Black-White gap widened by 0.1 standard
deviations per year even after controlling for SES, this study found a smaller increase, with a total of roughly 0.3 standard deviations between kindergarten and the end of grade 5. Part of the discrepancy could be due to the fact that Fryer and Levitt did not account for school-level factors in their models. Additionally, they only examined data through grade 3, and it is possible that Black-White gaps in ECLS-K do not continue to increase between grades 3 and 5.

Beyond Free Lunch 21
achievement and gains in mathematics and reading included the SES composite, the degree parents expected the child to obtain, lunch-program eligibility, and music lessons. The number of books the child had, the number of children in the household, and whether the child had speech problems were statistically significant predictors of math and reading at the start of school and also K–5 gains in reading. Mother’s age at first birth and child’s hearing problems were statistically significant predictors of initial math and reading achievement and of K–5 gains in math but not in reading. The remaining parent-reported variables in Table 4 were statistically significant predictors of initial kindergarten achievement in both math and reading but not of growth over time in either subject.15 Still, it is important to note that these factors could be indirectly related to K–5 gains because they correlated significantly with initial kindergarten achievement, which was a strong predictor of K–5 gains. If initial kindergarten achievement was not controlled, it is likely that many of those variables would indeed be statistically significant predictors of fifth-grade achievement. Implications for Conceptualizing SES
Instead of beginning this study with fixed criteria for what “counts” as SES-related advantages, we approached the question empirically, sifting through potentially important background variables to identify those that mattered most. Using stepwise regressions, we identified those variables that both predicted achievement and were advantages for families of high SES (based on parent occupation, education, and income).
Gershoff et al. (2007) identified paths between parent education/occupation and income and subsequently parents’ investment in their children’s education. However, whereas Gershoff et al.’s results portrayed parental income as the main mediator between parent education and occupation, on the one hand, and subsequent parenting behaviors, on the other, the results of this study point to additional factors not considered, such as mother’s age, the child’s physical condition (e.g., hearing and speech problems), or number of children in the household, indicators that might also contribute to accounting for SES-related gaps in achievement.
The findings from this study support Coleman’s argument that there is more to “family background” than financial capital (financial income, books/computer in the home) or human capital (e.g., parents’ education level). He argued for the importance of “social capital,” or relationships within families and broader communities that support children’s development. Social capital can be seen in the energy many parents invest in their children, despite having limited education and few financial resources. This study confirms Coleman’s hypothesis by identifying several achievement predictors that can be considered “social capital,” including how often parents read to their child, how often parents volunteer in school, and the number of children in the household (which Coleman argued dilutes parental attention to each child). Still, some factors identified here do not clearly fall into Coleman’s or other traditional SES categories, raising questions about areas of advantage that relate to both SES and achievement but are not typically considered measures of SES or social class. These factors include children’s physical health (birth weight and speech/hearing problems) and music lessons. Still, physical health could conceivably be considered a measure of the child’s own human capital or the result of parents’ financial and social capital (i.e., access to and pursuit of pre-natal care), and music lessons could be considered a measure of parental commitment to learning and therefore social capital, as well as a measure of “concerted cultivation” (Lareau, 2003). Regardless, the variables identified here serve to support and
15 In contrast to the variables used by Fryer and Levitt (2004; 2006) the list identified in this study does
not contain WIC participation and instead includes the number of children at home, home computer, preschool care, music lessons, and parent involvement in school.

Education Policy Analysis Archives Vol. 18 No. 11 22
flesh out Coleman’s three categories while also pushing slightly on boundaries and definitions of SES-related advantages. Implications for Future Data Collection
This study used a nationally-representative data set and systematically analyzed its remarkably comprehensive array of parent-reported variables to identify the most powerful correlates of achievement. If time, money, and access to parents are plentiful, researchers should collect data on those correlates in future studies of achievement. However, when working under more typical resource constraints, researchers must ultimately make strategic decisions about which SES factors to include, based on the population to be studied, the ability and willingness of the participants to respond to various questions, the cost of data collection, and the achievement outcome to be measured (given that relevant demographic variables varied somewhat for mathematics versus reading). Additionally, researchers must carefully consider the probable size of any effects to be identified in the study—i.e., whether the main findings would likely be substantially altered by the inclusion of more sensitive demographic measures.
The results of this study can inform future data collection efforts by NCES and others, including states and school districts creating longitudinal data systems. As one example, the National Assessment of Education Progress (NAEP) does not collect information from parents but instead relies on school-reported lunch-program eligibility as well as student reports of the number of books and computer at home and parent education level (which is unknown by roughly one third of fourth graders and thus omitted some years). NAEP does not ask students to report how many children are at home, which according to this study is a highly significant predictor of achievement (particularly in reading) and could be collected from a relatively easy-to-answer question. Children could also be asked about some of the other significant achievement predictors identified in this study, such as whether they take music lessons or how often their parents volunteer in schools.16 Given concerns that the lunch-program eligibility variable is less reliable at the secondary level than for elementary-school students, it seems particularly important to ask high-school students to report on the variety of supplementary measures identified here. However, again, studies are needed to determine the extent to which student reports of these variables correlate with achievement. Implications for NCLB and “Value-Added” Studies
With the current emphasis on NCLB reporting categories, school districts and policy makers rarely look beyond free and reduced-lunch eligibility when adjusting for SES as they make determinations about teacher and school effectiveness. This study suggests that more accurate determinations of such effects could be made if schools (or state tests) collected more comprehensive demographic information from parents or perhaps students.
For example, at the kindergarten level, while the NCLB variables employed as controls at the student and school levels explained 42% of the variation in reading achievement between schools and less than 5% of the variation within schools, the full set of variables was far more powerful, explaining 74% of the variation in achievement between schools and almost 19% within schools. Even the use of only those variables that could conceivably be reported by students (the “Lean Model”) explained 64% of the variation between schools and 14% of the variation within schools.
16 Several variables, such as parent volunteerism, were significant predictors of kindergarten achievement
but were not predictors of fifth-grade achievement after kindergarten achievement was included in the model. However, for the purposes of identifying variables for cross-sectional studies such as NAEP (which has no earlier achievement control variable), it is important to note that such predictors would likely predict fifth-grade achievement if kindergarten achievement were not in the model.

Beyond Free Lunch 23
That is, the addition of books, home computer, music lessons, whether parents read with children, and the number of children in the household explained almost three times the variation in kindergarten achievement among students within schools as the NCLB demographics alone. Similarly, in mathematics, the “lean model” explained 33% more between-school and three times the amount of within-school variation as the basic NCLB model.
The results for grade 5 achievement are less dramatic in terms of additional variation explained, but kindergarten achievement served as a control and therefore diminished the direct effects of SES-related variables in the models (as would typically occur in value-added studies). Still, the grade 5 results reveal the relatively powerful role that additional SES variables play, particularly in explaining within-school variation in achievement.17 For example, in the case of reading achievement, the NCLB demographics explained only 1% more of the within-school variation than the 25% explained by the kindergarten score alone. In that context, the increase to the 32% explained by the final model is substantial.
Researchers attempting to determine the effects of particular teachers, teaching methods, or schools must thoughtfully adjust for students’ backgrounds, given that instruction tends to vary by student and school SES (Anyon, 1981; Lubienski, 2002). Even schools that do not formally track their students and therefore might appear to have random student placement likely have de facto tracking due to high-SES parents’ lobbying to get their children into popular teachers’ classrooms (McGrath & Kuriloff, 1999). Additionally, effects of particular teaching practices on student achievement gains often appear relatively small in statistical models (Rowan, Correnti & Miller, 2002). Researchers should consider going beyond lunch-program eligibility and include variables identified as important in this study. If only basic SES measures are used, researchers and policymakers must interpret findings cautiously, carefully considering the strength of any relationships identified and whether their results would likely stand if a range of SES-related variables had been included in the study. The findings of this study can help inform such judgments. As a specific example, this study suggests that if a “value-added” analysis using basic NCLB demographic controls identifies an instruction-related factor that accounts for an extra 5% variation in within-school achievement, it is quite possible that this result would not stand if a full set of demographic measures were used, particularly if access to that instructional factor varies by SES. Implications for Addressing SES-Related Achievement Disparities
Although causal relationships between predictors identified in this study and student achievement cannot be definitely determined, the fact that these predictors stand out as significant in models that adjust for all other major likely confounding factors suggests that predictors such as mother’s age and the number of children at home likely do influence children’s achievement. Hence, the results suggest possible policy interventions intended to reduce achievement inequities.
This study reveals that higher-SES parents tend to be older, have fewer children in the household, spend more time reading with children and volunteering in schools, and invest more in educational resources and preschool. As one potential policy implication, given that the mean mother’s age at first birth was less than 20 for the lowest-SES quintile of children (see Table 2), and given that mother’s age at first birth was a significant predictor of children’s achievement even after adjusting for other key demographic factors, this study suggests that programs aimed toward helping low-SES teens delay parenthood could hold promise for weakening generational poverty. Additionally, this analysis reveals that low-SES children are more likely to be raised with multiple children at home and are more negatively affected by those additional siblings than are their high-
17 If the SES composite could have been reliably aggregated for use in the grade 5 models, it is likely that
more between-school variation would have been explained.
Education Policy Analysis Archives Vol. 18 No. 11 24
SES peers, especially in reading. Although U.S. policymakers might not delve into the politics of reducing family sizes, literacy interventions could be more effectively targeted to help low-SES parents of multiple children gain additional parenting supports.
Another finding of note is that kindergarten achievement was a much stronger predictor of fifth-grade performance in the area of mathematics than in reading. This finding suggests that kindergarteners who are low-achieving in mathematics are particularly likely to remain low-achieving, thereby highlighting the importance of earlier mathematics interventions for low-SES students and for other groups disproportionately represented among low achievers upon entry to school.
In conclusion, even studies that are not focused on social class differences in achievement need to carefully account for differences in students’ backgrounds that can confound the relationships under examination. This study sheds light on the strengths and limits of demographic variables traditionally used in educational evaluation and research, and reveals which additional SES-related variables are and are not important to include in future studies. The study also suggests ways to more effectively target efforts to address education inequities.
References
Anyon, J. (1981). Social class and school knowledge. Curriculum Inquiry, 11(1), 3–42. Benson, J., & Borman, G. D. (2007). Family and contextual socioeconomic effects across seasons:
When do they matter for the achievement growth of young children? Madison: WCER Working Paper no. 2007–5. Retrieved March 10, 2010,from http://www.wcer.wisc.edu/publications/workingPapers/papers.php#W07.
Berliner, D. (2009). Poverty and potential: Out-of-school factors and school success. Tempe, AZ, and Boulder, CO: Education Policy Research Unit and the Education and the Public Interest Center. Retrieved March 9, 2009, from http://epicpolicy.org/publication/poverty-and-potential.
Burkam, D. T., Ready, D. D., Lee, V. E., & Logerfo, L. F. (2004). Social-class differences in summer learning between kindergarten and first grade: model specification and estimation. Sociology of Education, 77(1), 1–31.
Cheadle, J. E. (2008). Educational investment, family context, and children’s math and reading growth from kindergarten through the third grade. Sociology of Education, 81 (1), 1–31.
Coleman, J. S. (1988). Social capital in the creation of human capital. American Journal of Sociology, 94(Supplement), S95–S120.
Coleman, J. S., Campbell, E. Q., Hobson, C. J., McPartland, J., Mood, A. M., Weinfeld, F. D., et al. (1966). Equality of educational opportunity. Washington, DC: National Center for Educational Statistics.
Downey, D. B., von Hippel, P. T., & Broh, B. A. (2004). Are schools the great equalizer? Cognitive inequality during the summer months and the school year. American Sociological Review, 69(5), 613–635.
Duberman, L. (1976). Social inequality: Class and caste in America. Philadelphia: J.B. Lippincott. Eagle, E. (1989, March). Socioeconomic status, family structure, and parental involvement: The
correlates of achievement. Paper presented at the Annual Meeting of the American Educational Research Association (San Francisco).
Easton-Brooks, D., & Davis, A. (2009). Teacher qualification and the achievement gap in early primary grades. Education Policy Analysis Archives, 17(15). Retrieved March 10, 2010, from http://epaa.asu.edu/ojs/article/view/17.
Beyond Free Lunch 25
Entwisle, D. R., & Astone, N. M. (1994). Some practical guidelines for measuring youth’s race/ethnicity and socioeconomic status. Child Development, 65(6), 1521–1540.
Fine, M., & Weis, L. (1998). The unknown city: Lives of poor and working-class young adults. Boston: Beacon Press.
Fryer, R. G., & Levitt, S. D. (2004). Understanding the black-white test score gap in the first two years of school. Review of Economics and Statistics, 86(2), 447–464.
Fryer, R.G., & Levitt, S. D. (2006). The black-white test score gap through third grade. American Law and Economics Review, 8(2), 249–281.
Gershoff, E. T., Aber, J. L., Raver, C. C., & Lennon, M. C. (2007). Income is not enough: Incorporating material hardship into models of income associations with parenting and child development. Child Development, 78(1), 70–95. Hauser, R. M. (1994). Measuring socioeconomic status in studies of child development. Child
Development, 65(6), 1541–1545. Hernandez, D. J. (1997). Child development and the social demography of childhood. Child
Development, 68(1), 149–169. Knitzer, J. (2002). Building services and systems to support the healthy emotional development of
young children—An action guide for policymakers. New York: National Center for Children in Poverty.
Lareau, A., & Conley, D. (Eds.) (2008). Social class: How does it work? New York: Russell Sage Foundation.
Lee, V., & Burkam, D. (2002). Inequality at the starting gate: Social background differences in achievement as children begin school. Washington, DC: Economic Policy Institute.
Lin, Q. (2003, October). Parent involvement and early literacy. Cambridge, MA: Harvard Family Research Project. Retrieved March 10, 2010, from http://www.hfrp.org/publications-resources/browse-our-publications/parent-involvement-and-early-literacy.
Lubienski, S. T. (2002). A closer look at black-white mathematics gaps: Intersections of race and SES in NAEP achievement and instructional practices data. Journal of Negro Education, 71(4), 269–287.
Lubienski, S. T. (2003). Celebrating diversity or denying disparities: A critical assessment. Educational Researcher, 32(8), 30–38.
Magnuson, K. A., Meyers, M. K., Ruhm, C. J., & Waldfogel, J. (2004). Inequality in preschool education and school readiness. American Educational Research Journal, 41(1), 115–157.
McGrath, D. J., & Kuriloff, P. J. (1999). The perils of parent involvement: Tracking, curriculum, and resource distortions in a middle school mathematics program. Research in Middle Level Education Quarterly, 22(3), 59–83.
Murnane, R. J., Willett, J. B., Bub, K. L., & McCartney, K. (2006). Understanding trends in the black-white mathematics achievement gap during the first years of school. Brookings-Wharton Papers on Urban Affairs, 97–135.
National Center for Children in Poverty. (1997). Poverty and brain development in early childhood. New York: Author.
Pollack, J. M., Najarian, M., Rock, D. A., & Atkins-Burnett, S. (2005). Early Childhood Longitudinal Study, Kindergarten Class of 1998–99 (ECLS-K): Psychometric report for the fifth grade (NCES 2006–036). Washington, DC: National Center for Education Statistics.
Raudenbush, S. W., & Bryk, A. S. (2002). Hierarchical linear models: Applications and data analysis methods (2nd ed.). Thousand Oaks, CA: Sage.
Raudenbush, S. W., Bryk, A., Cheong, Y. F., Congdon, R., & du Toit, M. (2004). HLM 6: Linear and nonlinear modeling. Lincolnwood, IL: Scientific Software International.

Education Policy Analysis Archives Vol. 18 No. 11 26
Reardon, S. F. (2003). Sources of educational inequality: The growth of racial/ethnic and socioeconomic test score gaps in kindergarten and first grade. University Park, PA: Population Research Institute, Pennsylvania State University.
Reardon, S., & Galindo, C. (2006, April). K-3 academic achievement patterns of Hispanics and other racial/ethnic groups. Paper presented at the Annual American Education Research Association Conference (San Francisco).
Reardon, S. F., & Robinson, J. P. (2007). Patterns and trends in racial/ethnic and socioeconomic academic achievement gaps. In H. A. Ladd & E. B. Fiske (Eds.), Handbook of research in education finance and policy (pp. 499–518). Mahwah, NJ: Erlbaum.
Rothstein, R. (2004). Class and schools: Using social, economic, and educational reform to close the black-white achievement gap. New York: Teachers College Press.
Rowan, B., Correnti, R., & Miller, R. J. (2002). What large-scale survey research tells us about teacher effects on student achievement: Insights from the Prospects study of Elementary Schools. Teachers College Record, 104, 1525–1567.
Secada, W. (1992). Race, ethnicity, social class, language and achievement in mathematics. In D. Grouws (Ed.), Handbook of research on mathematics teaching and learning (pp. 623–660). New York: MacMillan.
Sirin, S. R. (2005). Socioeconomic status and academic achievement: a meta-analytic review of the research. Review of Educational Research, 75(3), 417–453.
Tourangeau, K., Nord, C., Lê T., Pollack, J. M., & Atkins-Burnett, S. (2006). Early Childhood Longitudinal Study, Kindergarten Class of 1998–99 (ECLS-K): Combined user’s manual for the ECLS-K fifth-grade data files and electronic codebooks (NCES 2006–032). Washington, DC: National Center for Education Statistics.
Wenning, R. Herdman, P. A., Smith, N., McMahon, N., & Washington, K. (2003). No Child Left Behind: Testing, reporting, and accountability. New York: ERIC Clearinghouse on Urban Education, Institute for Urban and Minority Education. (ERIC Reproduction Document No. ED 480 994).

Beyond Free Lunch 27
Appendix
Full List of Variables Included in Step-Wise Regressions Variables named with all capital letters are those provided in the ECLS-K dataset. Other variables were adapted slightly from existing ECLS-K variables.
Controls (included in all regressions) SES Black Hispanic Asian Other race Home language is Not English Male Age in Months Free/reduced lunch School percent white/Asian School percent lunch Family characteristics MOTHER MARRIED AT TIME OF BIRTH P1 MHQ165 BIOMOM'S AGE AT 1ST BIRTH P1 Biological parents are married and living together P1 MHQ165 BIOMOM'S AGE AT 1ST BIRTH P1 NUMBER IN HOUSEHOLD AGED <18 P1 NUMBER IN HOUSEHOLD AGED 18+ P1 TOTAL NUMBER IN HOUSEHOLD Priorities/Expectations P1 PIQ110 HOW IMPORTANT - CHILD COUNTS P1 PIQ110 HOW IMPORTANT - CHILD SHARES P1 PIQ110 HOW IMPORTANT - CHILD DRAWS P1 PIQ110 HOW IMPORTANT - CHILD IS CALM P1 PIQ110 HOW IMPORTANT - KNOWS LETTERS P1 PIQ110 IMPORTANT - COMMUNICATES WELL P1 PIQ120 WHAT DEGREE EXPECTED OF CHILD Home Environment, Activities and Cognitive Stimulation, P1 HEQ010 HOW OFTEN YOU READ TO CHILD P1 HEQ010 HOW OFTEN YOU TELL CHD STORIES P1 HEQ010 HOW OFTEN YOU ALL SING SONGS P1 HEQ010 HOW OFTEN YOU HELP CHD DO ART P1 HEQ010 HOW OFTEN CHILD DOES CHORES P1 HEQ010 HOW OFTEN YOU ALL PLAY GAMES P1 HEQ010 HOW OFTEN YOU TEACH CHD NATURE P1 HEQ010 HOW OFTEN YOU ALL BUILD THINGS

Education Policy Analysis Archives Vol. 18 No. 11 28
P1 HEQ010 HOW OFTEN YOU ALL DO SPORTS P1 HEQ040 HOW MANY BOOKS CHILD HAS P1 HEQ050 HOW MANY RECORDS, TAPES, CDS P1 HEQ060 HOW OFTEN READS PICTURE BOOKS P1 HEQ080 PRE K CHILD WATCHED SESAME ST Child Care P1 CFQ070 HOW MANY GRANDPARENTS CLOSE P1 CCQ030 # REL CARE ARRANGE YR BEFORE K P1 CCQ045 # HRS/WK REL CARE YR BEFORE K P1 CCQ050 # MONTHS REL CARE YR BEFORE K P1 Ratio of kids to adults of relative care P1 CCQ265 HAD CHILD REGULAR CARE EVER P1 Child Total Age in months when started center care P1 CCQ280 HAD CTR CARE YEAR BEFORE K P1 CCQ285 # CTR CARE ARRANGE YR BEFORE K P1 Child was in day care most year before K P1 Child was in Preschool/preK/nursery school most P1 CCQ310 # HRS/WK CTR CARE YR BEFORE K Child Physical and Mental Health P1 Childs weight in ounces at birth P1 Child weighed <5.5lb P1 CHQ120 LEARNING PROBLEM DIAGNOSED P1 CHQ175 LIMBS AS MOBILE AS OTHER CHILDREN’S P1 CHQ205 IF CHILD HAD SPEECH PROBLEMS P1 CHQ230 IF DIFFICULTY HEARING SPEECH P1 CHQ285 DIFFICULT SEEING FAR OBJECT P1 CHQ326 IF CHD OFTEN HAS EAR INFECTION P1 CHQ330 1-5 SCALE OF CHILD'S HEALTH Parent Employment and Money Issues P1 EMQ020 PERS 1 HAD PAID JOB LAST WEEK P1 EMQ040 PERSON 1 NUMBER OF ALL JOBS P1 EMQ050 PERSON 1 HOURS/WK AT ALL JOBS P1 EMQ170 IF RESP/BIOMOM HAD JOB FOR PAY P1 EMQ180 IF FROM BIRTH, MONEY PROBLEMS P1 EMQ190 MONEY PROBLEM LASTED - In months P1 WPQ070 ANY AID SINCE CHILD'S BIRTH (AFDC aid only) P1 CMQ010 NUMBER OF PLACES CHD LIVED

Beyond Free Lunch 29
Parent Contact with School P2 PIQ110 PARENT CONTACTED SCHOOL P2 PIQ120 REPORT AN ABSENCE P2 PIQ120 REQUEST A SPECIAL TEACHER P2 PIQ120 DISCUSS CHILD'S PROG W/TEACHER P2 PIQ120 IN REF TO CHILD'S HEALTH P2 PIQ120 DISCUSS SPECIAL NEEDS P2 PIQ120 SCHOOL POLICIES/RECORDS P2 PIQ120 VOLUNTEERING IN CLASSROOM P2 PIQ120 BUS/TRANSPORT ISSUES P2 PIQ120 ASSIGNMENT/HOMEWORK P2 PIQ120 INFORM TEACHER FAMILY ISSUES P2 PIQ120 DISCUSS PTA, OPEN HOUSE P2 PIQ120 TO FIND OUT RE SPEC ACTIVITIES P2 PIQ120 TO GET GENERAL INFORMATION Parent Involvement at School P2 PIQ130 ATTENDED OPEN HOUSE P2 PIQ136 HOW OFTEN ATTEND OPEN HOUSE P2 PIQ140 ATTENDED A PTA MEETING P2 PIQ144 HOW OFTEN ATTEND PTA/PTO P2 PIQ145 ATTENDED PAR ADVISORY GROUP P2 PIQ149 HOW OFTEN PARENT ADVISORY P2 PIQ150 ATTENDED PARENT-TEACHER CONF P2 PIQ156 HOW OFTEN PARENT-TEACHER CONF P2 PIQ160 ATTEND SCHOOL EVENT P2 PIQ166 HOW OFTEN ATTEND SCH EVENT P2 PIQ170 ACTED AS SCH VOLUNTEER P2 PIQ174 HOW OFTEN VOLUNTEERED P2 PIQ175 PARTICIPATED IN FUNDRAISING P2 PIQ179 HOW OFTEN FUNDRAISING P1 PIQ030 HAVE YOU MET CHILD'S TEACHER? P1 PIQ050 CURR SCHOOL AFFECT HOME CHOICE Reasons for Lack of School Involvement P2 PIQ300 # parents talk with P2 PIQ410 INCONVENIENT MEETING TIME P2 PIQ420 NO CHILD CARE P2 PIQ430 CANNOT GET OFF FROM WORK P2 PIQ440 SAFETY GOING TO SCHOOL P2 PIQ450 NOT FEEL WELCOMED BY SCHOOL P2 PIQ460 PROBLEMS W/ TRANSPORTATION P2 PIQ470 LANGUAGE PROBLEM (NON-ENGLISH) P2 PIQ480 DON'T HEAR OF INTERESTNG THNGS

Education Policy Analysis Archives Vol. 18 No. 11 30
Child’s Activities Outside School/Home P2 HEQ100 VISITED THE LIBRARY P2 HEQ130 GONE TO A PLAY, CONCERT, SHOWS P2 HEQ140 VISITED A MUSEUM P2 HEQ150 VISITED A ZOO, AQUARIUM P2 HEQ180 ATTENDED SPORTING EVENT Child’s Hobbies P2 HEQ200 FREQ LOOKS PICT BKS OUTSD SCH P2 HEQ220 HAVE HOME COMPUTER CHILD USES P2 HEQ230 FREQ CHILD USES COMPUTER P2 HEQ240 USE COMPUTER TO LEARN SKILLS P2 HEQ250 USE COMPUTER TO LEARN DRAWING P2 HEQ260 CHD USES COMPUTER FOR INTERNET P2 HEQ300 TAKES DANCE LESSONS P2 HEQ310 PARTCP IN ATHLETIC EVENTS P2 HEQ320 PARTICP IN ORGANIZED CLUBS P2 HEQ330 TAKES MUSIC LESSONS P2 HEQ340 TAKES DRAMA CLASSES P2 HEQ350 TAKES ART LESSONS P2 HEQ370 PARTCP IN ORGANIZED PERFORMING P2 HEQ380 TAKES CRAFT CLASSES P2 HEQ390 TAKES NONENG LNG INSTRUCTION Safety P2 HEQ400 HOW SAFE TO PLAY OUTSIDE P2 HEQ410 GARBAGE, LITTER ON THE STREET P2 HEQ420 SELLING/USING DRUGS IN AREA P2 HEQ430 BURGLARY/ROBBERY IN THE AREA P2 HEQ440 VIOLENT CRIME IN THE AREA P2 HEQ450 VACANT HOUSES IN THE AREA Family Culture, Rules & Interaction P2 HEQ570 LATEST BEDTIME ON WEEKDAYS (in minutes past 6pm) P2 HEQ580 DISCUSS ETHNIC/RACIAL HERITAGE P2 HEQ590 DISCUSS FAMILY RELIGION P2 HEQ600 PARTCP IN CULTURAL EVENTS P2 CFQ300 WKDAY TIME ADULT MALE W/ CHILD P2 CFQ310 WKEND TIME ADULT MALE W/ CHILD Feelings About Child P2 DWQ010 WARM, CLOSE TIME TOGETHER P2 DWQ015 CHILD LIKES ME P2 DWQ020 TOO BUSY TO PLAY WITH CHILD P2 DWQ025 ALWAYS SHOW CHILD LOVE P2 DWQ030 HARD TO BE WARM TO CHILD P2 DWQ035 EXPRESS AFFECTION P2 DWQ040 BEING PARENT HARDER THAN EXPCT

Beyond Free Lunch 31
P2 DWQ045 CHILD DOES THINGS BOTHER ME P2 DWQ050 SACRIFICE TO MEET CHILD'S NEED P2 DWQ055 FEEL TRAPPED AS PARENT P2 DWQ060 OFTEN FEEL ANGRY WITH CHILD P2 DWQ065 CHILD HARDER TO CARE FOR P2 DWQ070 MORE WORK THAN PLEASURE Television Watching P2 DWQ080 # HOURS WATCH TV (WEEKDAYS) recoded so 6=6+ P2 DWQ082 NUM HOURS WATCH TV (WEEKEND) recoded so 6=6+ P2 DWQ084 FAMILY RULES FOR TV (what programs) P2 DWQ086 RULES FOR # HOURS OF WATCH TV P2 DWQ088 TV RULE HOW LATE WATCH TV Discipline P2 DWQ100 FREQ SPANK LAST WEEK P2 DWQ110 SPANK CHILD P2 DWQ110 HAVE CHILD TAKE A TIME OUT P2 DWQ110 HIT CHILD BACK P2 DWQ110 DISCUSS WHAT CHILD DID WRONG P2 DWQ110 IGNORE IT P2 DWQ110 MAKE CHILD DO SOME CHORES P2 DWQ110 MAKE FUN OF CHILD P2 DWQ110 MAKE CHILD APOLOGIZE P2 DWQ110 TAKE AWAY A PRIVILEGE P2 DWQ110 GIVE CHILD A WARNING P2 DWQ110 YELL AT THE CHILD Doctor/Dentist P2 Last visit to Dentist P2 Last Routine Health Care Visit <1 yr P2 CHQ120 CHILD HEALTH INSURANCE COVERGE Activity and Exercise P2 CHQ130 DURING STRUCTURED ACTIVITIES P2 CHQ131 PHYSICALLY ACTIVE FREE TIME P2 CHQ137 AMOUNT OF AEROBIC EXERCISE P2 CHQ140 # DAYS/WK 20 MIN EXERCISE P2 CHQ150 GROUP SPORTS P2 CHQ150 INDIVIDUAL SPORTS P2 CHQ150 DANCE P2 CHQ150 RECREATIONAL SPORTS P2 CHQ150 MARTIAL ARTS P2 CHQ150 PLAYGROUND ACTIVITIES P2 CHQ150 CALISTHENICS/GENERAL EXERCISE Parent Psychological Well-Being P2 PPQ100 RESP UNUSUALLY BOTHERED

Education Policy Analysis Archives Vol. 18 No. 11 32
P2 PPQ110 RESP POOR APPETITE P2 PPQ120 RESP CAN'T SHAKE BLUES P2 PPQ130 RESP TROUBLE FOCUSING P2 PPQ140 RESP FELT DEPRESSED P2 PPQ150 RESP EVERYTHING AN EFFORT P2 PPQ160 RESP FELT FEARFUL P2 PPQ170 RESP SLEEP RESTLESS P2 PPQ180 RESP TALKED LESS THAN USUAL P2 PPQ190 RESP FELT LONELY P2 PPQ200 RESP FELT SAD P2 PPQ210 RESP COULD NOT GET GOING P2 PPQ220 RESPONDENT HEALTH STATUS P2 PPQ230 HEALTH PRBLM PROHIBITING WORK P2 PPQ240 HEALTH PRBLM LIMITING WORK P2 PPQ250 RESP NEEDS PROF HELP Parents’ Relationship P2 CFQ100 RESP RELATIONSHIP WITH PARTNER P2 CFQ106 TELL TROUBLES AFTER BAD DAY P2 CFQ108 LAUGH TOGETHER P2 CFQ110 CALMLY DISCUSS SOMETHING P2 CFQ112 WORK TOGETHER ON A PROJECT P2 CFQ114 EXCHANGE IDEAS P2 CFQ140 ARGUE OVER CHORES/RESPONSIBLTS P2 CFQ150 ARGUE ABOUT CHILDREN P2 CFQ160 ARGUE ABOUT MONEY P2 CFQ170 ARGUE ABOUT SHOWING AFFECTION P2 CFQ180 ARGUE ABOUT SEX P2 CFQ190 ARGUE ABOUT RELIGION P2 CFQ200 ARGUE ABOUT LEISURE TIME P2 CFQ210 ARGUE ABOUT DRINKING P2 CFQ220 ARGUE ABOUT OTHER WOMEN/MEN P2 CFQ230 ARGUE ABOUT IN-LAWS P2 CFQ240 KEEP OPINION TO YOURSELF P2 CFQ250 DISCUSS CALMLY P2 CFQ260 ARGUE HEATEDLY P2 CFQ270 HIT EACH OTHER
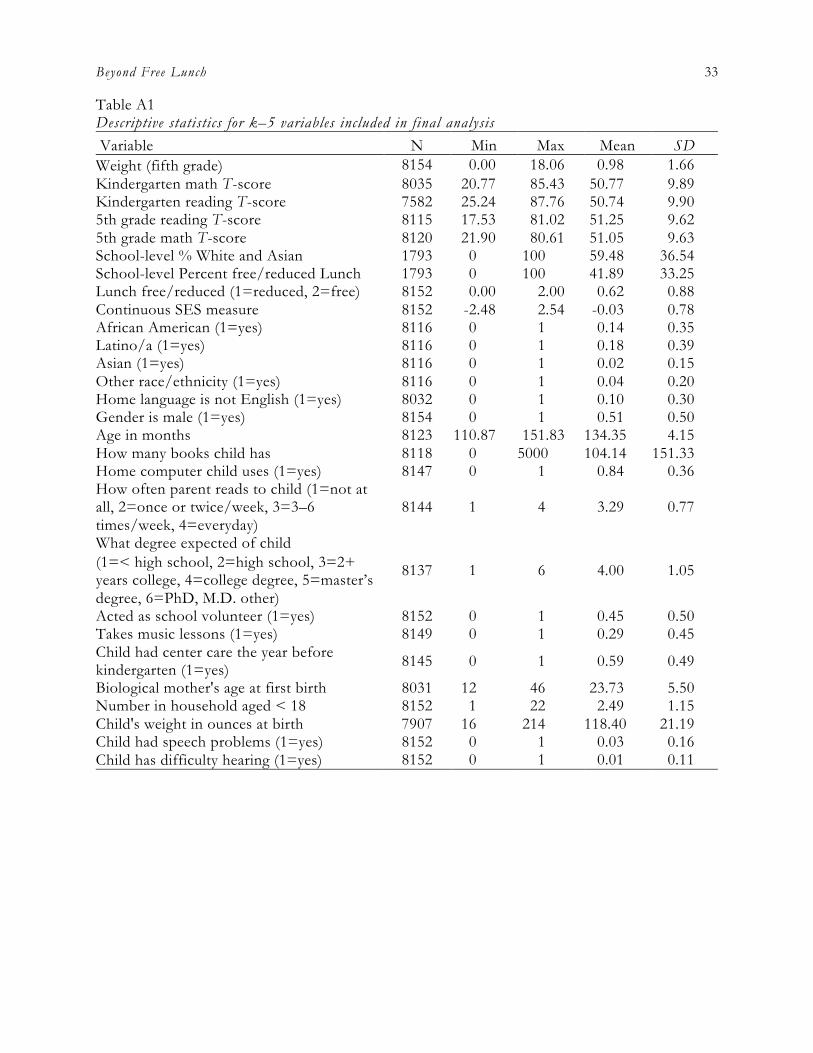
Beyond Free Lunch 33
Table A1 Descriptive statistics for k–5 variables included in final analysis Variable N Min Max Mean SD Weight (fifth grade) 8154 0.00 18.06 0.98 1.66 Kindergarten math T-score 8035 20.77 85.43 50.77 9.89 Kindergarten reading T-score 7582 25.24 87.76 50.74 9.90 5th grade reading T-score 8115 17.53 81.02 51.25 9.62 5th grade math T-score 8120 21.90 80.61 51.05 9.63 School-level % White and Asian 1793 0 100 59.48 36.54 School-level Percent free/reduced Lunch 1793 0 100 41.89 33.25 Lunch free/reduced (1=reduced, 2=free) 8152 0.00 2.00 0.62 0.88 Continuous SES measure 8152 -2.48 2.54 -0.03 0.78 African American (1=yes) 8116 0 1 0.14 0.35 Latino/a (1=yes) 8116 0 1 0.18 0.39 Asian (1=yes) 8116 0 1 0.02 0.15 Other race/ethnicity (1=yes) 8116 0 1 0.04 0.20 Home language is not English (1=yes) 8032 0 1 0.10 0.30 Gender is male (1=yes) 8154 0 1 0.51 0.50 Age in months 8123 110.87 151.83 134.35 4.15 How many books child has 8118 0 5000 104.14 151.33 Home computer child uses (1=yes) 8147 0 1 0.84 0.36 How often parent reads to child (1=not at all, 2=once or twice/week, 3=3–6 times/week, 4=everyday)
8144 1 4 3.29 0.77
What degree expected of child (1=< high school, 2=high school, 3=2+ years college, 4=college degree, 5=master’s degree, 6=PhD, M.D. other)
8137 1 6 4.00 1.05
Acted as school volunteer (1=yes) 8152 0 1 0.45 0.50 Takes music lessons (1=yes) 8149 0 1 0.29 0.45 Child had center care the year before kindergarten (1=yes) 8145 0 1 0.59 0.49
Biological mother's age at first birth 8031 12 46 23.73 5.50 Number in household aged < 18 8152 1 22 2.49 1.15 Child's weight in ounces at birth 7907 16 214 118.40 21.19 Child had speech problems (1=yes) 8152 0 1 0.03 0.16 Child has difficulty hearing (1=yes) 8152 0 1 0.01 0.11

Education Policy Analysis Archives Vol. 18 No. 11 34
Table A2 Descriptive statistics by 1st, 3rd and 5th SES quintiles – fifth grade
SES Quintile Variable Q1 Q3 Q5 5th Grade math t-score 44.16 51.29 57.24 5th Grade reading t-score 44.34 50.84 57.21 Lunch is free/reduced 1.56 0.45 0.05 Continuous SES measure -1.04 -0.10 1.12 African American 0.24 0.13 0.04 Latino/a 0.37 0.17 0.07 Asian 0.01 0.02 0.04 Other — Pacific Islander, Native American, multiple races 0.05 0.05 0.03
Home language is not English 0.27 0.06 0.04 Gender is male 0.48 0.50 0.50 Age in months 134.59 134.39 134.11 How many books child has 52.23 101.07 174.04 Have home computer child uses 0.55 0.91 0.99 What degree expected of child 3.55 3.95 4.49 If parent volunteered at school 0.23 0.42 0.70 Takes music lessons 0.14 0.28 0.50 Child had center care the year before kindergarten 0.30 0.64 0.79 Biological mother's age at first birth 19.97 23.35 28.06 Number in household aged < 18 2.85 2.35 2.41 Child's weight in ounces at birth 115.56 118.29 119.73 Child had speech problems 0.02 0.02 0.03 Child has difficulty hearing 0.04 0.01 0.00

Beyond Free Lunch 35
Table A3 Descriptive statistics by race — kindergarten
Race Variable White Black Latino/a Asian Other Number of cases 9389 2231 2784 836 861 Kindergarten math t-score 52.96 46.82 45.14 54.84 47.45 Kindergarten reading t-score 51.89 47.60 46.54 55.02 46.95 Lunch is free/reduced 0.35 1.33 1.15 0.55 1.00 Continuous SES measure 0.21 -0.34 -0.42 0.33 -0.12 Home language is not English 0.01 0.01 0.47 0.47 0.03 Age in months 68.56 67.91 67.52 67.39 68.02 How many books child has 93.51 39.46 41.04 49.70 61.96 Have home computer child uses 0.66 0.35 0.35 0.63 0.45 How often parent reads to child 3.36 3.00 3.06 3.23 3.18 What degree expected of child 3.97 4.14 4.33 4.64 3.97 How often parent volunteered at school in kindergarten
3.07 1.05 1.75 1.65 2.02
Takes music lessons 0.08 0.07 0.05 0.18 0.10 Child had center care the year before Kindergarten
0.65 0.49 0.39 0.55 0.42
Biological mother's age at first birth 24.65 20.63 21.74 25.85 22.09 Number in household aged < 18 2.36 2.71 2.62 2.60 2.68 Child's weight in ounces at birth 120.31 110.32 117.25 112.83 118.16 Child had speech problems 0.11 0.12 0.13 0.09 0.12 Child has difficulty hearing 0.02 0.03 0.03 0.03 0.03

Education Policy Analysis Archives Vol. 18 No. 11 36
Table A4 HLM results for kindergarten mathematics
Model 1 2 3 4 5 6 7 8 9 10 11 12 13
Variable Base +Lunch +SES
Race Language Gender
Age NCLB groups
NCLB +school
All Basic Demog.
+Ed. Resource
s
+Parent Ed.
Emphasis
+Center Care Pre-
K +Home
Structure +Child Health
Lean Version
Intercept 49.63‡ 50.07‡ 50.35‡ 52.18‡ 51.73‡ 51.58‡ 51.71‡ 50.48‡ 50.54‡ 49.53‡ 49.65‡ 49.96‡ 49.82‡
Lunch eligibility -3.05‡ -1.91‡ -2.39‡ -2.02‡ -1.17‡ -0.97‡ -0.92‡ -0.85‡ -0.60‡ -0.55‡ -1.32‡
SES in kindergarten 3.73‡ 2.96‡ 2.43‡ 2.02‡ 1.84‡ 1.64‡ 1.59‡ African American -4.60‡ -3.17‡ -2.46‡ -1.98‡ -1.30‡ -1.47‡ -1.46‡ -1.09† -0.88† -1.19†
Latino/a -4.45‡ -3.89‡ -3.51‡ -2.53‡ -2.11‡ -2.27‡ -2.18‡ -2.02‡ -1.90‡ -2.41‡
Asian 3.34‡ 3.00‡ 3.09‡ 2.43‡ 2.88‡ 2.65‡ 2.73‡ 2.71‡ 2.83‡ 3.51‡
Other Race -3.11‡ -2.53‡ -2.29‡ -2.19‡ -1.87‡ -1.92‡ -1.78‡ -1.59‡ -1.53‡ -1.79‡ Home language not English -3.47‡ -2.71 -2.42‡ -1.84‡ -1.33‡ -1.73‡ -1.60‡ -1.70‡ -1.79‡ -1.47‡
Male -0.47† -0.52† -0.48† -0.33* -0.35* -0.39* 0.40† -0.35* Age at assessment (mos.) 0.59‡ 0.60‡ 0.60‡ 0.60‡ -.60‡ 0.61‡ 0.62‡ 0.60‡
School % White/Asian 0.00 -0.01* -0.01* -0.00 -0.00 -0.00 -0.00 -0.01 School average SES score 2.49‡ 2.13‡ 1.73‡ 1.50‡ 1.20‡ 1.17‡ School % free/reduced lunch -0.05‡ -0.01* -0.01 -0.01* -0.01* -0.01* -0.01* -0.04‡ How many books child has 0.016‡ 0.013‡ 0.012‡ 0.012‡ 0.012‡ 0.020‡ Home computer child uses 1.71‡ 1.50‡ 1.44‡ 1.45‡ 1.37‡ 2.40‡ Freq. parent reads to child 0.32† 0.32† 0.28† 0.30† 0.61‡ Degree expected of child 0.62‡ 0.60‡ 0.54‡ 0.52‡ Freq. parent volunteered 0.15‡ 0.15‡ 0.13‡ 0.13‡ Takes music lessons 1.68‡ 1.67‡ 1.57‡ 1.57‡ 2.44‡ Center care year before K 1.76‡ 1.52‡ 1.48‡ Bio mom's age at first birth 0.16‡ 0.16‡ Number in HH < 18 -0.44‡ -0.46‡ -0.62‡ Child's birth weight (oz.) 0.030‡
Speech problems ` -1.50‡ Difficulty hearing -2.95‡ Random ef f e c ts
Intercept 24.16 12.48 7.14 12.92 9.27 7.10 3.27 3.04 2.90 2.61 2.41 2.35 4.20 Level-1 (in-school variance) 75.23 73.22 69.90 67.90 71.47 71.46 63.80 62.55 61.64 61.24 60.52 59.61 63.52 Level-2 (intraclass correlation) 0.24 0.15 0.09 0.16 0.11 0.09 0.05 0.05 0.04 0.04 0.04 0.04 0.06 % of between-school variation explained 48% 70% 47% 62% 71% 86% 87% 88% 89% 90% 90% 83% % of within-school variation explained 3% 7% 10% 5% 5% 15% 17% 18% 19% 20% 21% 16%
*p < .05. †p < .01. ‡p < .001.

Beyond Free Lunch 37
Table A5 Selected HLM models for fifth-grade reading 1 2 5 6 7 12 13
Base +Lunch NCLB groups
NCLB +school
All Basic Demog. Full model
Lean Version
Intercept 51.25‡ 52.22‡ 52.79‡ 52.62‡ 52.78‡ 51.50‡ 51.04‡
Kindergarten reading score 0.51‡ 0.47‡ 0.47‡ 0.47‡ 0.40‡ 0.46‡
Lunch eligibility -1.29‡ -1.23‡ -0.71† -0.55* -0.95‡
SES in kindergarten 1.69‡ 0.88† African American -3.29‡ -2.96‡ -2.84‡ -2.74‡ -2.87‡
Latino/a 0.07 0.24 0.38 0.33 0.37
Asian -0.42 -0.40 -0.73 -1.07 -0.88
Other race -0.28 -0.11 0.01 0.29 0.02
Home language is not English 1.02 1.09 1.24* 0.36 0.90
Gender - male -0.37 0.04 -0.31
Age at assessment in months -0.01 0.00 -0.02 School-level % White and Asian 0.01 0.01 0.01 0.00 School-level % free/reduced lunch -0.01 -0.00 0.00 -0.00
How many books child has 0.002* 0.003†
Have home computer child uses 1.01 1.62†
How often parent reads to child 0.24 What degree expected of child 1.26‡ How often parent volunteered 0.38 Takes music lessons 0.82† 1.25‡
Child had cntr care yr before k 0.08 Bio mom's age at first birth 0.05 Number in HH < 18 -0.36† -0.46†
Child's weight in ounces at birth -0.00 If child had speech problems -3.90† If difficulty hearing speech -1.67 Random ef f e c ts Intercept 61.96 33.97 27.88 27.94 26.60 25.74 26.37 Level-1 (within-school variance) 41.5 31.04 30.80 30.76 30.43 28.07 30.26 Level-2 (intraclass correlation) 0.60 0.52 0.48 0.48 0.47 0.48 0.47 % of between-school variation explained 45% 55% 55% 57% 58% 57% % of within-school variation explained 25% 26% 26% 27% 32% 27%
*p < .05 †p < .01 ‡p < .001
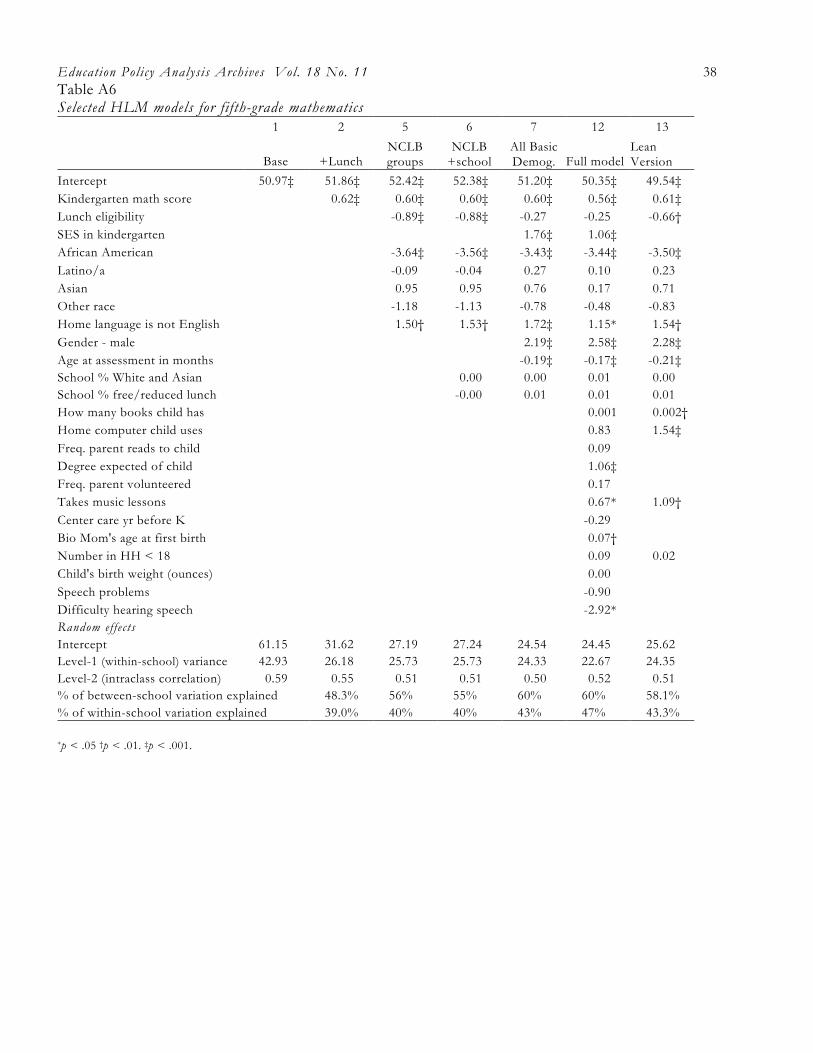
Education Policy Analysis Archives Vol. 18 No. 11 38
Table A6 Selected HLM models for fifth-grade mathematics 1 2 5 6 7 12 13
Base +Lunch NCLB groups
NCLB +school
All Basic Demog. Full model
Lean Version
Intercept 50.97‡ 51.86‡ 52.42‡ 52.38‡ 51.20‡ 50.35‡ 49.54‡ Kindergarten math score 0.62‡ 0.60‡ 0.60‡ 0.60‡ 0.56‡ 0.61‡ Lunch eligibility -0.89‡ -0.88‡ -0.27 -0.25 -0.66† SES in kindergarten 1.76‡ 1.06‡ African American -3.64‡ -3.56‡ -3.43‡ -3.44‡ -3.50‡ Latino/a -0.09 -0.04 0.27 0.10 0.23 Asian 0.95 0.95 0.76 0.17 0.71 Other race -1.18 -1.13 -0.78 -0.48 -0.83 Home language is not English 1.50† 1.53† 1.72‡ 1.15* 1.54† Gender - male 2.19‡ 2.58‡ 2.28‡ Age at assessment in months -0.19‡ -0.17‡ -0.21‡ School % White and Asian 0.00 0.00 0.01 0.00 School % free/reduced lunch -0.00 0.01 0.01 0.01 How many books child has 0.001 0.002† Home computer child uses 0.83 1.54‡ Freq. parent reads to child 0.09 Degree expected of child 1.06‡ Freq. parent volunteered 0.17 Takes music lessons 0.67* 1.09† Center care yr before K -0.29 Bio Mom's age at first birth 0.07† Number in HH < 18 0.09 0.02 Child's birth weight (ounces) 0.00 Speech problems -0.90 Difficulty hearing speech -2.92* Random effects Intercept 61.15 31.62 27.19 27.24 24.54 24.45 25.62 Level-1 (within-school) variance 42.93 26.18 25.73 25.73 24.33 22.67 24.35 Level-2 (intraclass correlation) 0.59 0.55 0.51 0.51 0.50 0.52 0.51 % of between-school variation explained 48.3% 56% 55% 60% 60% 58.1% % of within-school variation explained 39.0% 40% 40% 43% 47% 43.3% *p < .05 †p < .01. ‡p < .001.

Beyond Free Lunch 39
About the Authors
Sarah Theule Lubienski University of Illinois at Urbana-Champaign
Corinna Crawford Crane University of Illinois at Urbana-Champaign Email: [email protected]
Sarah Theule Lubienski is an associate professor in the Department of Curriculum and Instruction, College of Education, University of Illinois. She studies education and equity, focusing on mathematics achievement, instruction, policy, and reform. Her research includes both large-scale analyses and smaller, classroom-based studies.
Corinna Crawford Crane is a doctoral student in the College of Education at the University
of Illinois. Her interests include education policy, large-scale data analysis, and mathematics education. She has studied issues of equity, mathematics instruction, and school type using both NAEP and ECLS-K data.
education policy analysis archives Volume 18 Number 11 May 25th, 2010 ISSN 1068–2341
Readers are free to copy, display, and distribute this article, as long as the work is attributed to the author(s) and Education Policy Analysis Archives, it is distributed for non-commercial purposes only, and no alteration or transformation is made in the work. More details of this Creative Commons license are available at http://creativecommons.org/licenses/by-nc-sa/3.0/. All other uses must be approved by the author(s) or EPAA. EPAA is published by the Mary Lou Fulton Institute and Graduate School of Education at Arizona State University Articles are indexed EBSCO Education Research Complete, Directory of Open Access Journals, ERIC, H.W. WILSON & Co, QUALIS – A 2 (CAPES, Brazil), SCOPUS, SOCOLAR-China.
Please send errata notes to Gustavo E. Fischman [email protected]

Education Policy Analysis Archives Vol. 18 No. 11 40
education policy analysis archives education policy analysis archives
editorial board Editor Gustavo E. Fischman (Arizona State University)
Associate Editors: David R. Garcia & Jeanne M. Powers (Arizona State University)
Jessica Allen University of Colorado, Boulder Christopher Lubienski University of Illinois, Urbana-Champaign
Gary Anderson New York University Sarah Lubienski University of Illinois, Urbana-Champaign
Michael W. Apple University of Wisconsin, Madison Samuel R. Lucas University of California, Berkeley Angela Arzubiaga Arizona State University Maria Martinez-Coslo University of Texas, Arlington David C. Berliner Arizona State University William Mathis University of Colorado, Boulder Robert Bickel Marshall University Tristan McCowan Institute of Education, London Henry Braun Boston College Heinrich Mintrop University of California, Berkeley Eric Camburn University of Wisconsin, Madison Michele S. Moses University of Colorado, Boulder Wendy C. Chi* University of Colorado, Boulder Julianne Moss University of Melbourne Casey Cobb University of Connecticut Sharon Nichols University of Texas, San Antonio Arnold Danzig Arizona State University Noga O'Connor University of Iowa Antonia Darder University of Illinois, Urbana-
Champaign João Paraskveva University of Massachusetts,
Dartmouth Linda Darling-Hammond Stanford University Laurence Parker University of Illinois, Urbana-
Champaign Chad d'Entremont Strategies for Children Susan L. Robertson Bristol University
John Diamond Harvard University John Rogers University of California, Los Angeles Tara Donahue Learning Point Associates A. G. Rud Purdue University Sherman Dorn University of South Florida Felicia C. Sanders The Pennsylvania State University Christopher Joseph Frey Bowling Green State
University Janelle Scott University of California, Berkeley
Melissa Lynn Freeman* Adams State College Kimberly Scott Arizona State University Amy Garrett Dikkers University of Minnesota Dorothy Shipps Baruch College/CUNY Gene V Glass Arizona State University Maria Teresa Tatto Michigan State University Ronald Glass University of California, Santa Cruz Larisa Warhol University of Connecticut Harvey Goldstein Bristol University Cally Waite Social Science Research Council Jacob P. K. Gross Indiana University John Weathers University of Colorado, Colorado
Springs Eric M. Haas WestEd Kevin Welner University of Colorado, Boulder Kimberly Joy Howard* University of Southern
California Ed Wiley University of Colorado, Boulder
Aimee Howley Ohio University Terrence G. Wiley Arizona State University Craig Howley Ohio University John Willinsky Stanford University Steve Klees University of Maryland Kyo Yamashiro University of California, Los Angeles
Jaekyung Lee SUNY Buffalo * Members of the New Scholars Board

Beyond Free Lunch 41
archivos analíticos de políticas educativas consejo editorial
Editor: Gustavo E. Fischman (Arizona State University) Editores. Asociados Alejandro Canales (UNAM) y Jesús Romero Morante (U. Cantabria)
Armando Alcántara Santuario Instituto de
Investigaciones sobre la Universidad y la Educación, UNAM México
Fanni Muñoz Pontificia Universidad Católica de Perú
Claudio Almonacid Universidad Metropolitana de Ciencias de la Educación, Chile
Imanol Ordorika Instituto de Investigaciones Economicas – UNAM, México
Pilar Arnaiz Sánchez Universidad de Murcia, España Maria Cristina Parra Sandoval Universidad de Zulia, Venezuela
Xavier Besalú Universitat de Girona, España Miguel A. Pereyra Universidad de Granada, España
Jose Joaquin Brunner Universidad Diego Portales, Chile
Monica Pini Universidad Nacional de San Martín, Argentina
Damián Canales Sánchez Instituto Nacional para la Evaluación de la Educación, México
Paula Razquin UNESCO, Francia
María Caridad García Universidad Católica del Norte, Chile
Ignacio Rivas Flores Universidad de Málaga, España
Raimundo Cuesta Fernández IES Fray Luis de León, España
Daniel Schugurensky Universidad de Toronto-Ontario Institute of Studies in Education, Canadá
Marco Antonio Delgado Fuentes Universidad Iberoamericana, México
Orlando Pulido Chaves Universidad Pedagógica Nacional, Colombia
Inés Dussel FLACSO, Argentina José Gregorio Rodríguez Universidad Nacional de Colombia
Rafael Feito Alonso Universidad Complutense de Madrid
Miriam Rodríguez Vargas Universidad Autónoma de Tamaulipas, México
Pedro Flores Crespo Universidad Iberoamericana, México
Mario Rueda Beltrán Instituto de Investigaciones sobre la Universidad y la Educación, UNAM México
Verónica García Martínez Universidad Juárez Autónoma de Tabasco, México
José Luis San Fabián Maroto Universidad de Oviedo
Francisco F. García Pérez Universidad de Sevilla, España
Yengny Marisol Silva Laya Universidad Iberoamericana
Edna Luna Serrano Universidad Autónoma de Baja California, México
Aida Terrón Bañuelos Universidad de Oviedo, España
Alma Maldonado Departamento de Investigaciones Educativas, Centro de Investigación y de Estudios Avanzados, México
Jurjo Torres Santomé Universidad de la Coruña, España
Alejandro Márquez Jiménez Instituto de Investigaciones sobre la Universidad y la Educación, UNAM México
Antoni Verger Planells University of Amsterdam, Holanda
José Felipe Martínez Fernández University of California Los Angeles, U.S.A.
Mario Yapu Universidad Para la Investigación Estratégica, Bolivia

Education Policy Analysis Archives Vol. 18 No. 11 42
arquivos analíticos de políticas educativas conselho editorial
Editor: Gustavo E. Fischman (Arizona State University) Editores Associados: Rosa Maria Bueno Fisher e Luis A. Gandin
(Universidade Federal do Rio Grande do Sul)
Dalila Andrade de Oliveira Universidade Federal de
Minas Gerais, Brasil Jefferson Mainardes Universidade Estadual de Ponta
Grossa, Brasil Paulo Carrano Universidade Federal Fluminense, Brasil Luciano Mendes de Faria Filho Universidade Federal
de Minas Gerais, Brasil Alicia Maria Catalano de Bonamino Pontificia
Universidade Católica-Rio, Brasil Lia Raquel Moreira Oliveira Universidade do Minho,
Portugal Fabiana de Amorim Marcello Universidade Luterana
do Brasil, Canoas, Brasil Belmira Oliveira Bueno Universidade de São Paulo,
Brasil Alexandre Fernandez Vaz Universidade Federal de
Santa Catarina, Brasil António Teodoro Universidade Lusófona, Portugal
Gaudêncio Frigotto Universidade do Estado do Rio de Janeiro, Brasil
Pia L. Wong California State University Sacramento, U.S.A
Alfredo M Gomes Universidade Federal de Pernambuco, Brasil
Sandra Regina Sales Universidade Federal Rural do Rio de Janeiro, Brasil
Petronilha Beatriz Gonçalves e Silva Universidade Federal de São Carlos, Brasil
Elba Siqueira Sá Barreto Fundação Carlos Chagas, Brasil
Nadja Herman Pontificia Universidade Católica –Rio Grande do Sul, Brasil
Manuela Terrasêca Universidade do Porto, Portugal
José Machado Pais Instituto de Ciências Sociais da Universidade de Lisboa, Portugal
Robert Verhine Universidade Federal da Bahia, Brasil
Wenceslao Machado de Oliveira Jr. Universidade Estadual de Campinas, Brasil
Antônio A. S. Zuin Universidade Federal de São Carlos, Brasil

Education Policy Analysis Archives Vol. 18 No. 11 43