home school students, 1998 - education policy analysis archives
TRANSCRIPT

1 of 33
Education Policy Analysis Archives
Volume 7 Number 8 March 23, 1999 ISSN 1068-2341
A peer-reviewed scholarly electronic journalEditor: Gene V Glass, College of Education
Arizona State University
Copyright 1999, the EDUCATION POLICY ANALYSIS ARCHIVES.Permission is hereby granted to copy any article
if EPAA is credited and copies are not sold.
Articles appearing in EPAA are abstracted in the Current Index to Journals in Education by the ERIC Clearinghouse on Assessment and Evaluation and are permanently archived in Resources in Education.
Scholastic Achievement and Demographic Characteristicsof Home School Students in 1998
Lawrence M. RudnerERIC Clearinghouse on Assessment and Evaluation
College of Library and Information ServicesUniversity of Maryland, College Park
This article has Commentary
Abstract
This report presents the results of the largest survey and testingprogram for students in home schools to date. In Spring 1998, 20,760K-12 home school students in 11,930 families were administered eitherthe Iowa Tests of Basic Skills (ITBS) or the Tests of Achievement andProficiency (TAP), depending on their current grade. The parentsresponded to a questionnaire requesting background and demographicinformation. Major findings include: the achievement test scores of thisgroup of home school students are exceptionally high--the medianscores were typically in the 70th to 80th percentile; 25% of home schoolstudents are enrolled one or more grades above their age-level publicand private school peers; this group of home school parents has moreformal education than parents in the general population; the medianincome for home school families is significantly higher than that of allfamilies with children in the United States; and almost all home school

2 of 33
students are in married couple families. Because this was not acontrolled experiment, the study does not demonstrate that homeschooling is superior to public or private schools and the results must beinterpreted with caution. The report clearly suggests, however, thathome school students do quite well in that educational environment.
By current estimates, there are between 700,000 and 1,200,000 students enrolledin home schools in the United States. Further, by all accounts, the movement has beengrowing steadily over the past few years (Lines, 1998). Yet, there is very little scientificliterature concerning the population of home school students or even large samples ofhome school students. This study describes the academic achievement levels and some basicdemographic characteristics of a large sample of students and their families. While theacademic levels of home school students are described in terms of public and privateschool norms, this study is not a comparison of home schools with public or privateschools. Such comparisons would be fraught with problems. Home schooling istypically one-on-one. Public schools typically have classes with 25 to 30 students andan extremely wide range of abilities and backgrounds. Home school parents are, bydefinition, heavily involved in their children's education; the same, unfortunately, is nottrue of all public or private school parents. Home schools can easily pace and adapttheir curriculum; public and private schools typically have a mandated scope andsequence. The list of differences could continue. This study seeks to answer a much more modest set of questions: Does homeschooling tend to work for those who chose to make such a commitment? That is, arethe achievement levels of home school students comparable to those of public schoolstudents? Who is engaged in home schooling? That is, how does the home schoolpopulation differ from the general United States population?
Methods
Bob Jones University Press Testing and Evaluation Service provides assessmentservices to home school students and private schools on a fee-for-service basis. InSpring 1998, 39,607 home school students were contracted to take the Iowa Tests ofBasic Skills (ITBS; grades K-8) or the Tests of Achievement and Proficiency (TAP;grades 9-12). Students were given an achievement test and their parents were asked tocomplete a questionnaire entitled "Voluntary Home School Demographic Survey." Atotal of 20,760 students in 11,930 families provided useable questionnaires withcorresponding achievement tests. The achievement test and questionnaire results werecombined to form the dataset used in this analysis. This section provides descriptions of the achievement measures, thequestionnaires, the Bob Jones University Press Testing and Evaluation Service, and theprocedures used to develop the dataset.
Iowa Tests of Basic Skills (ITBS)
Home schooled students in Grades K-8 took the Iowa Tests of Basic Skills(ITBS) Form L, published by Riverside Publishing Company, a subsidiary of HoughtonMifflin. Developed by University of Iowa professors, the tests were designed anddeveloped to measure skills and standards important to growth across the curriculum inthe nation's public and private schools.

3 of 33
The ITBS reflects more than 50 years of test development experience andresearch on measuring achievement and critical thinking skills in Reading, LanguageArts, Mathematics, Social Studies, Science, and Information Sources. The scope andsequence of the content measured by the ITBS were developed after careful review ofnational and state curricula and standards, current textbook series and instructionalmaterials, and research (Riverside, 1993). All items were tried out and tested for ethnic, cultural, and gender bias andfairness prior to the development of the final form of the tests. Data on a nationallyrepresentative sample of public and private schools were collected in 1992 and used toform the initial national norms. The norms were updated in 1995 by Riverside. Thisstudy used these 1995 spring norms.
Tests of Achievement and Proficiency (TAP)
Home schooled students in Grades 9-12 took the Tests of Achievement andProficiency (TAP), Form L, also published by Riverside Publishing Company. The TAPwas designed and developed to measure skills and standards important to growth acrossthe high school curriculum. Like the ITBS, the TAP scope and sequence weredeveloped after careful review of national and state curricula and standards, and currenttextbook series and instructional materials. Developed as an upward extension of theITBS, the specifications, format, and design of the TAP tests are similar to that of theITBS. TAP is fully articulated with the Iowa Tests of Basic Skills (ITBS) Form L(Riverside, 1993).
Background Questionnaires
Background questionnaires were designed by the staff of the Home School LegalDefense Association (HSLDA). Questions were determined by reviewing the questionsin previous surveys, prioritizing them, and selecting only those that were most germaneto the objectives of the study. Where possible, questions and responses were made tomatch those used by the U.S. Census, U.S. Department of Labor and the NationalAssessment of Educational Progress to facilitate comparisons of home school studentswith students nationwide. HSLDA designed the survey to be much shorter than previous surveyinstruments. They also sought to pose all questions in an objective format, rather than aconstructed response format. In keeping with this approach, HSLDA worked withNational Computer Systems to design forms to be computer scanable, thereby removingthe need for manual data processing.
Bob Jones University Press Testing and Evaluation Service
The Bob Jones University (BJU) Press Testing and Evaluation Service is thelargest and oldest of four organizations providing home school families access tostandardized achievement tests. The Testing Service began offering the Iowa Tests ofBasic Skills and Tests of Achievement and Proficiency in 1984. In subsequent yearsthey added other helpful tools including practice materials, a personality inventory, anddiagnostic tests. In 1993, the Stanford Achievement Test series was added as BJU Pressassumed the testing that the Home School Legal Defense Association had beenproviding for its members. Since that time, a full range of writing evaluations (grades3-12) and a career assessment have been added to the growing number of evaluation

4 of 33
tools offered by the Testing Service. Just as home school families were the impetus behind the start of the TestingService, home school families continue to be the largest sector utilizing the service.However, there are also a number of private schools that have chosen to use theservices provided. Testing is provided for students throughout the United States andCanada, as well as many foreign countries. The BJU Press Testing and Evaluation Service sends testing materials toqualified testers who administer the tests and return them to the Testing Service forscoring. The results are then returned to the parent. Many parents test primarily for theirown information to verify that their home schooled students are progressingacademically at a normal pace. Other parents use the results to meet a state testingrequirement or to provide documentation when they choose to return their students to apublic or private school setting.
Data Generation Procedures
The following steps were followed to produce the data set:
Parents contracted with Bob Jones University to be administered the Iowa Testsof Basic Skills or the Tests of Achievement Proficiency (39,607 students inprobably 22,000 families).
1.
Bob Jones certified test administrators, many of whom were the students' parents.2.BJU sent questionnaires and answer forms to the test administrators.3.Tests and questionnaires were returned to BJU. BJU bundled the tests and sentthem to Riverside Publishers for machine scoring. BJU bundled thequestionnaires and sent them to National Computer Systems for scanning. Unlikein previous studies, the parents did not know their scores ahead of time.
4.
Electronic copy of the 23,415 test results and 23,311 questionnaire results weresent to the author of this report. These sets were merged to provide 20,900 caseswith matching identification numbers. In order to weight by state public schoolenrollment, 140 cases with missing state data were dropped. A total of 20,760students formed the initial dataset used in the study. After we formed the datasetwith 20,760 students, we asked for the remainder of the 39,607 achievement testscores. We were informed that it would not be possible to disaggregate theremaining home school students from students in private schools also contractingtesting services.
5.
Characteristics of Home School Students and Families
This section provides a description of home school students and their families based on the20,790 respondents to our questionnaire. The distribution of students by state, gender, age, race,parent marital status, family size, mother's religion, parent education, family income, televisionviewing, money spent on educational materials, and other demographic characteristics areidentified and, where possible, compared to national figures.
State
As shown in Table 2.1, respondents came from each of the fifty states. Several states,including Ohio, Georgia, and Virginia, have exceptionally high representation given their size.This is probably due to the fact that these states require testing of home school students. To reduce

5 of 33
the effects of these and other overrepresented states, the data were weighted in all subsequentanalyses by the number of public school students in each state. While we would have preferred toweight by the number of home schooled students in each state, such data are not available for all50 states (Lines, 1998).
Table 2.1Participating Home
School Students Classified by State
State Freq. Percent
of sample
AK 61 .3%
AL 181 .9
AR 42 .2
AZ 201 1.0
CA 815 3.9
CO 810 3.9
CT 54 .3
DC 17 .1
DE 28 .1
FL 860 4.1
GA 1547 7.4
GU 10 .0
HI 112 .5
IA 234 1.1
ID 28 .1
IL 451 2.2
IN 533 2.6
KS 319 1.5
KY 163 .8
LA 551 2.7
MA 343 1.6
MD 196 .9
ME 109 .5
MI 523 2.5
MN 794 3.8
MO 361 1.7
MS 25 .1
State Freq. Percent
of sample
MT 112 .5
NC 972 4.7
ND 100 .5
NE 126 .6
NH 176 .8
NJ 324 1.6
NM 189 .9
NV 53 .3
NY 942 4.5
OH 2484 11.9
OK 382 1.8
OR 67 .3
PA 532 2.6
PR 8 .0
RI 32 .2
SC 579 2.8
SD 27 .1
TN 322 1.5
TX 1126 5.4
UT 35 .2
VA 1608 7.7
VI 2 .0
VT 59 .3
WA 787 3.8
WI 246 1.2
WV 92 .4
WY 40 .2
Student Age and Gender
Table 2.2 shows the distribution of the respondents by gender and age. About 50.4% or10,471 of the respondents were females; 49.6% (10,319) were males. These figures are

6 of 33
comparable to that of the population of 3 to 34 years old enrolled in school (see U.S. Bureau ofthe Census, 1998, Table A-2). Some 51.4% of school enrollees nationally are male. Thepercentages are comparable at all age levels.
Table 2.2Participating Home School Students
Classified by Gender and Age
Age at time of testing (in years)
6 7 8 9 10 11 12 13 14 15 16 17
Females 507 879 1148 1318 1301 1248 1049 936 774 516 264 119
56.1% 51.7% 50.2% 49.2% 52.4% 50.6% 47.2% 50.5% 50.7% 51.0% 49.3% 57.5%
Males 397 820 1141 1360 1181 1216 1174 918 754 495 271 88
43.9% 48.3% 49.8% 50.8% 47.6% 49.4% 52.8% 49.5% 49.3% 49.0% 50.7% 42.5%
Total 904 1699 2289 2678 2482 2464 2223 1854 1528 1011 535 207
Student Grade
Home school student grade placement was identified by their parents, presumably based onthe grade level of the instructional materials. That grade was used by BJU to determine the testlevels and used in this report as a grouping variable. Tables 2.3 shows the distribution ofrespondents and the nation by grade. There is a large difference in the proportions of high school(grades 9-12) home school students and the nation. Compared to the national data, a relativelysmall percentage of home school students are enrolled in high school. Possible reasons for thislower participation for high school students may be the relative newness of the home schoolmovement, early graduation from high school, and possibly a desire on the part of some homeschool parents to enroll their children in a traditional high school. The distributional differencesfor students in grades 1 through 8 are minor.
Table 2.3Home School Students Classified
by Grade with Percents and National School Percents
Grade
1 2 3 4 5 6 7 8 9 10 11 12
Home school
7.4%(1504)
10.6%(2153)
14.1%(2876)
12.9%(2625)
12.6%(2564)
11.9%(2420)
10.3%(2087)
8.8%(1801)
5.7%(1164)
3.8%(775)
1.6%(317)
0.3%(66)
Nation 9.1% 8.8% 8.9% 8.7% 8.6% 8.7% 8.7% 8.4% 9.0% 7.9% 7.1% 6.3%
National data: US Census, 1997b, Table 254.
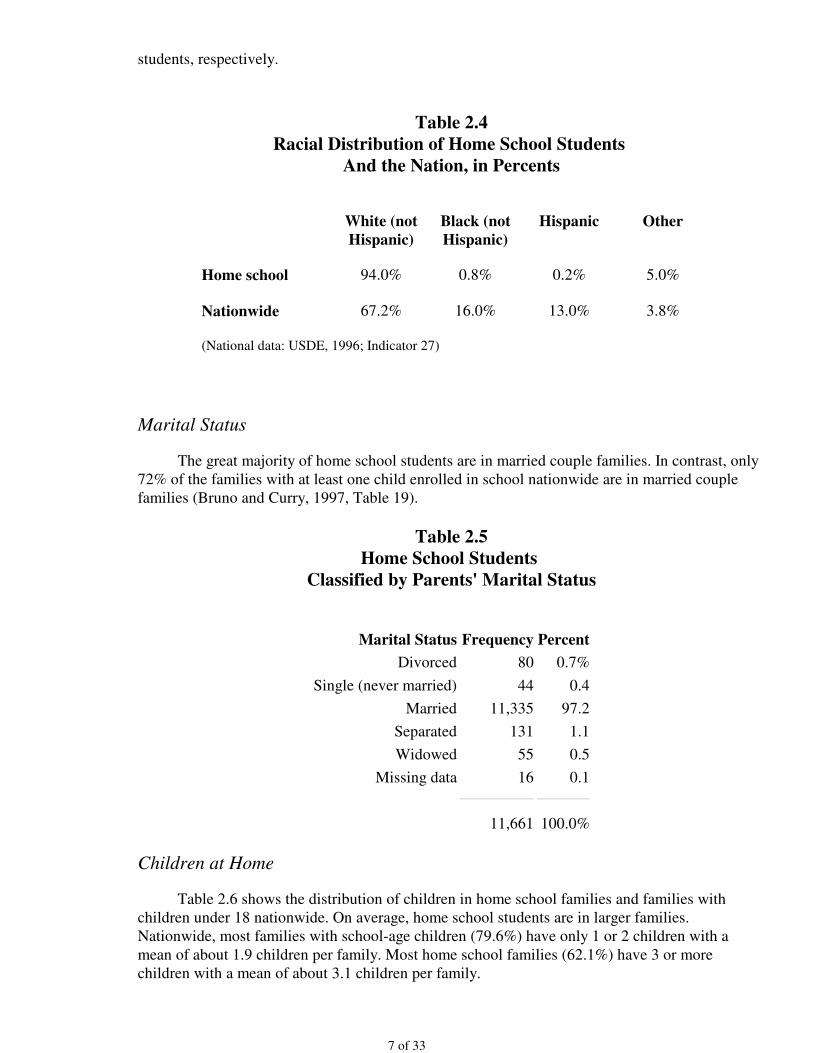
Student Race
Table 2.4 shows the racial distribution of home school students in 1998 and for the studentsenrolled in elementary and secondary public and private schools nationally in 1994. Thedistributions are quite different. The vast majority of home schooled children are non-HispanicWhite. The largest minority groups for home school students (not shown in the table) areAmerican Indians and Asian students who comprise some 2.4% and 1.2% of the home school
7 of 33
students, respectively.
Table 2.4Racial Distribution of Home School Students
And the Nation, in Percents
White (not Hispanic)
Black (not Hispanic)
Hispanic Other
Home school 94.0% 0.8% 0.2% 5.0%
Nationwide 67.2% 16.0% 13.0% 3.8%
(National data: USDE, 1996; Indicator 27)
Marital Status
The great majority of home school students are in married couple families. In contrast, only72% of the families with at least one child enrolled in school nationwide are in married couplefamilies (Bruno and Curry, 1997, Table 19).
Table 2.5Home School Students
Classified by Parents' Marital Status
Marital Status Frequency Percent
Divorced 80 0.7%
Single (never married) 44 0.4
Married 11,335 97.2
Separated 131 1.1
Widowed 55 0.5
Missing data 16 0.1
11,661 100.0%
Children at Home
Table 2.6 shows the distribution of children in home school families and families withchildren under 18 nationwide. On average, home school students are in larger families.Nationwide, most families with school-age children (79.6%) have only 1 or 2 children with amean of about 1.9 children per family. Most home school families (62.1%) have 3 or morechildren with a mean of about 3.1 children per family.

8 of 33
Table 2.6Home School Families Classified
by Family Size with National Comparison
Home School Families Nationwide
Number ofChildren
Percent Number ofChildren
Percent
1 8.3% 1 40.8%
2 29.6 2 38.8
3 28.6 3 14.3
4 18.6 4 or more 6.1
5 8.4
6 3.9
7 or more 2.6
National Data: US Census, 1997a, Table 77
Mother's Religion
We asked the home school families to identify the religious preference of each student'smother by selecting from a list of 27 religions. As shown in Table 2.7, the largest percentage ofmothers identified themselves as Independent Fundamental, Baptist, Independent Charismatic,Roman Catholic, Assembly of God, or Presbyterian. The religious preference of the father was thesame as that of the mother 93.1% of the time.
Table 2.7Home School Students
Classified by Mother's Religion
Frequency Percent
Independent Fundamental 5,119 25.1%
Baptist 5,072 24.4
Independent Charismatic 1,681 8.2
Roman Catholic 1,106 5.4
Assembly of God 838 4.1
Presbyterian 772 3.8
Reformed 685 3.4
Other Protestant 500 2.5
Pentecostal 459 2.2
Methodist 420 2.1
Lutheran 353 1.7

9 of 33
Other Christian 2,213 10.9
Other 1,572 6.2
Total 20,790 100.0%
Parent Academic Attainment
As shown in Table 2.8, home school parents have more formal education than the generalpopulation. While slightly less than half of the general population attended or graduated fromcollege, almost 88% of home school students have parents who continued their education afterhigh school.
Table 2.8Distribution of Home School Students and Students Nationally
Classified by Parent Academic Attainment
Percent
Did not finishhigh
school
High school
graduate
Some college,
no degree
Associate degree
Bachelors degree
Masters degree
Doctorate
Home school fathers 1.2% 9.3% 16.4% 6.9% 37.6% 19.8% 8.8%
Nation males
18.1 32.0 19.5 6.4 15.6 5.4 3.1
Home school mothers 0.5 11.3 21.8 9.7 47.2 8.8 0.7
Nation females
17.2 34.2 20.2 7.7 14.8 4.5 1.3
National data: U.S. Census (1996; Table 8)
Family Income
National data on family income are available for 1995. As shown in Table 2.9, home schoolfamilies span all income levels. On average, home school families have a higher income level thando families with children nationwide and all families nationwide. The median family income levelfor home school families in 1997 is about $52,000. The median income for families with childrenin 1995, nationwide, was about $36,000.
Table 2.9Distribution of Family Income for Home School Families,
Families with Children Nationwide, and All Families Nationwide by Income Levels, in Percents.

10 of 33
Home school
Families with
children All families
Less than $10,000 0.8% 12.6% 10.5%
$10,000 to $14,999 1.5 8.0 8.5
$15,000 to $19,999 2.2 6.1 6.8
$20,000 to $24,999 3.9 7.6 8.4
$25,000 to $29,999 4.9 7.5 7.8
$30,000 to $34,999 8.5 7.5 7.6
$35,000 to $39,999 8.1 7.1 7.0
$40,000 to $49,999 16.0 11.3 11.0
$50,000 to $74,999 32.5 18.4 18.1
$75,000 and over 21.6 13.8 14.3
National data: Bruno and Curry (1997, Table 19)
Television Viewing
The National Assessment of Educational Progress collects information on the televisionviewing habits of fourth-graders. Home school fourth-graders and fourth-graders nationally differmarkedly in terms of television viewing. Home school students rarely watch more than 3 hours oftelevision per day; nearly 40% of the students nationwide watch that much television.
Table 2.10Fourth-grade students Classified by Hours of Television Viewing
Percent of students
6 or more hours
per day
4 to 5 hours
per day
2 to 3 hours
per day
1 hour or less
per day
Home school 0.1% 1.6 33.1 65.3
Nationwide 19.0% 19.5 36.4 25.1
National data: NAEP Math 1997
Computer Use
The Condition of Education provides a tabulation of the percent of students nationwide whoreport using a computer by frequency of use for 4th, 8th, and 11th graders in 1996. At each gradelevel, the distribution of computer use in 1998 by home school students is different from that ofthe nation in 1996. At each of these three grade levels, much larger percentages of home school

11 of 33
students never use a computer. At the fourth-grade level, a much larger percent of home schoolstudents use a computer every day.
Table 2.11Computer Use among Home School Students and
Students Nationwide in Grades 4, 8, and 11, in Percent
Grade 4 Grade 8 Grade 11
Homeschool Nationwide
Homeschool Nationwide
Homeschool Nationwide
Never 28.2%
11.4% 37.1% 23.3% 40.5 % 16.0%
Less than once a week 29.4 16.3 28.9 29.2 28.9 34.2
Several times a week 21.6 62.5 18.0 30.7 17.5 31.8
Every day 20.8 9.9 16.0 16.7 13.1 18.1
National Data: Snyder and Wirt, 1998, Indicator 3.
Money Spent on Educational Materials
The amount of money spent in 1997 on home school education for textbooks, lessonmaterials, tutoring and enrichment services, and testing ranged from less than $200 to more than$2000. As shown in Table 2.12, the median amount of money spent was about $400.
Table 2.12 Home School Students Classified by Money Spent
On Home School Education in 1997
Amount Frequency Percent
<$200 3,718 17.9%
200-399 7,035 33.8
400-599 4,467 21.5
600-799 1,962 9.4
800-999 985 4.7
1,000-1,599 1,630 7.8

12 of 33
1,600-1,999 247 1.2
>2,000 411 2.0
Missing 336 1.6
Total 20,790 100.0%
Other Demographic Characteristics
Compared to the nation, a much larger percentage of home school mothers are stay-at-homemothers not participating in the labor force. Some 76.9% of home school mothers do not work forpay. About 86.3% that do work do so part time. Nationwide, in 1996, only 30% of married womenwith children under 18 did not participate in the labor force (US Dept of Census, 1997a, Table632). A very large percentage of home school parents are certified to teach. Some 19.7% of thehome school mothers are certified teachers; 7.1% of fathers. Almost one out of every four homeschool students (23.6%) has at least one parent who is a certified teacher. Only 7.7% of the respondents were enrolled in a full-service curriculum program, i.e., aprogram that serves students and their parents as a "one-stop" primary source for textbooks,materials, lesson plans, tests, counseling, evaluations, record keeping, and the like for the year'score required subjects such as language, social studies, mathematics, and science.
Academic Achievement
The complete batteries of The Iowa Tests of Basic Skills (ITBS) and the Tests ofAchievement and Proficiency (TAP) were used to assess student achievement in basicskills. The ITBS was used for home school students in Grades K-8; the TAP forstudents in grades 9-12. Almost all students took Form L; a handful took parallel FormK. Achievement test batteries like the ITBS and TAP are a collection of tests inseveral subject areas that have been standardized and normed. Norms for all tests withinthese test batteries are based on the same group of students at each grade level. Suchnorms allow students to be compared with other students and groups to be comparedwith other groups. The primary purpose of the ITBS and TAP is to assess the academic achievementof students in public and private schools. Consequently, much of the test developmenteffort is devoted to identifying the content to be covered by these batteries. RiversidePublishers follow a four step process: 1) content specifications, 2) editorial review, 3)pilot testing, and 4) national norms development and updating. The first and most critical step is developing content specifications and writingtest items. This step involves the experience, research, and expertise of a large numberof professionals representing a wide variety of specialties in the education community.Specifications are developed which outline the grade placement and emphasis of skills.These specifications draw heavily on an analysis of textbooks, research studies,nationally developed subject matter standards, and national curriculum committees. Once the items have been developed and pilot tested, the final forms of the testsare developed and administered to large standardization samples to gather normativedata and to develop scales.

13 of 33
The spring standardization sample for the 10 levels of the ITBS consisted ofapproximately 137,000 students from public schools, Catholic schools and privatenon-Catholic schools. The public school sample was stratified to assure adequaterepresentation based on geographic region, district enrollment, socioeconomic status ofthe district. The Catholic school sample was stratified on geographic region and dioceseenrollment. The non-Catholic private school sample was stratified on region and schooltype. The spring standardization sample for the four levels of the TAP consisted ofapproximately 20,000 students stratified on the same variables. National norms weredeveloped based on the combined weighted distributions of all three school types:public, Catholic and non-Catholic private. Catholic/private school norms weredeveloped based on the combined weighted distributions of the latter two groups. Forsimplicity, the combined public, Catholic and non-Catholic private school norms arereferenced in this report as national norms or public/private school norms. The data from the standardization sample are used to develop a variety ofreporting scales, such as percentiles and grade equivalent scores. The analyses in thisreport rely primarily on the Developmental Standard Score (DSS) scale developed byRiverside Publishers. The DSS is a number that describes a student's location on anachievement continuum that spans grades K through 12. Table 3.1 shows the medianDSS and median age that corresponds to each grade level in the national standardizationsample. The DSS scale shows that the average annual growth in DSS units decreaseseach year.
Table 3.1Median Developmental Scaled Scores and Median Age for the
ITBS/TAP Spring National Standardization Sample
Grade
K 1 2 3 4 5 6 7 8 9 10 11 12
DSS 130 150 168 185 200 214 227 239 250 260 268 275 280
Age 6.1 7.2 8.2 9.3 10.2 11.2 12.2 13.2 14.2 15.2 16.2 17.2 18.1
Source for age medians: Drahozal (1998, personal communication)
This same DSS scale is used for all tests and levels of the ITBS and TAP. Themain advantages of the DSS are that it mirrors reality well, spans all grade levels, andprovides a quasi equal interval scale which has a variety of attractive statisticalproperties. Most importantly, DSS scores can be compared to each other and can bemeaningfully averaged. The main disadvantage of DSS scores is that they have no built-in meaning.Reference points are needed to interpret DSS scores. "Grade level" is one possiblereference point. A DSS score of 170 in reading, for example, is about equal to thetypical reading score for second-grade students in public and private schools in thespring of the year. A more refined reference is the percentile score that corresponds toeach DSS score. The 170 in reading, for example, corresponds to the 54th percentile ofsecond graders. That is, this score is better than the score received by 54 percent of thesecond graders using the 1995 spring norms. The reader should note that while all tests of the ITBS/TAP have the same

14 of 33
median DSS score at each grade level, the distributions within each subject area vary. ADSS score of 310 for a tenth grader in reading, for example, corresponds to the 87thpercentile. A DSS score of 170 in mathematics for a tenth grader would place the student at the 79th percentile. Percentiles are always defined in terms of a grade level. This can be problematicwhen analyzing data for home school students. In this study, 24.5% of the home schoolstudents were one or more grades above the grade usually associated with that student'sage (see Table 3.2). A strong case can be made that rather than using the percentilecorresponding to the enrolled grade, as we did in this study, one should use thepercentile associated with the student's nominal grade, i.e., the grade usually associatedwith the student's age. The argument is that a 10-year-old home school student enrolledin 5th grade should be compared to his age peers in 4th grade. The counter argument isthat the percentiles already consider the fact that students are not always in theirnominal grade since the standardization sample had students above and below gradelevel. We initially analyzed the data both ways. Rather than expose our analysis tocriticism, we chose to take the more conservative route by employing the enrolledgrade. While very meaningful, percentiles do not provide a complete picture of astudent's or group's academic performance. In this study, we used grade equivalentscores as an additional reference point for interpreting DSS scores. A grade equivalentscore approximates a child's development in terms of grade and month within grade. ADSS reading score of 170 can be viewed as the typical DSS score earned by students inthe ninth month of the second grade or a GES score of 2.9. Just as the percentileassociated with a DSS scores varies by subtest, so do the properties of GES scores varyacross subjects. Grade Equivalent Scores are particularly useful for estimating a student'sdevelopmental status in terms of grade. But, these scores must be interpreted carefully.An GES Score of 6.3 in reading for an 9 year old in the 3rd grade, for example, clearlyindicates that the third grader is doing well. This does not, however, mean that the thirdgrader belongs in the 6th grade. It only means that the third grader can read as well as asixth grader. The usual interpretation of a Grade Equivalent Score of 6.3 for a third grader isthat this third grade student can read third grade material as well as a sixth grader canread third grade material, not that he or she can read sixth grade material. The DSS ofthe ITBS/TAP, however, is unique. The DSS scales were developed by administeringthe same special scaling test to students in grades K-3, another common scaling test tostudents in grades 3 to 9, and another to students in grades 8-12. Thus, in the scalingstudy, the third graders did take the same test as the sixth graders in each subject area.
Grade Placement
Home school students are able to progress through instructional material at thestudent's rate. Thus, it is easy for home school students to be enrolled one or moregrades above their public and private school-age peers. To evaluate the frequency ofadvanced placement, we compared students' enrolled and nominal grades. The enrolledgrade was identified by the parents and used to determine the ITBS/TAP level. Thenominal grade is the public school grade in which the student would normally beenrolled in based on the child's month and year of birth. As shown in Table 3.2, almost one fourth of the home school students (24.5%)are enrolled one or more grades above their nominal grade. While comparable figures

15 of 33
nationally do not exist, one research director in a large school district estimated that lessthan 5% of their students are enrolled above grade level.
Table 3.2Home School Students Classified
by Discrepancy Between Enrolled andNominal Grade
Enrolled minusNominal Grade
Frequency Percent
-2 58 0.3%
-1 1,019 5.1
0 13,931 69.8
+1 4,637 23.2
+2 199 1.0
+3 58 0.3
Percentages do not sum to 100% due to a small percentage of students outside this range.
Overall Achievement
Table 3.3 shows the median scaled score (DSS score) for home school studentson the Composite with Computation, Reading Total, Language, Mathematics Total withComputation, Social Studies, and Science subtest scores by grade. The correspondingpercentiles shown in the table are the within grade percentile scores for the nation thatcorrespond to the given scaled scores. For example, home school students in Grade 3have a median composite scaled score of 207 which corresponds to the 81st percentilenationwide. The median home school student in third grade out- performs 81% of thethird graders nationwide. As an additional comparison, we provide the national medianfor each grade in the last column. By definition this is the 50th percentile of studentsnationwide.
Table 3.3Median Scaled Scores (corresponding national percentile)
by Subtest and Grade for Home School Students
Grade N Composite Reading Language Math Soc. Stud.
Science NationalMedian

16 of 33
1 1504 170 (91) 174 (88) 166 (82)164 (81)
166 (80)
164 (78)
150 (50)
2 2153 192 (90) 196 (89) 186 (80)188 (85)
189 (81)
195 (86)
168 (50)
3 2876 207 (81) 210 (83) 195 (62)204 (78)
205 (76)
214 (83)
185 (50)
4 2625 222 (76) 228 (83) 216 (67)220 (76)
216 (68)
232 (81)
200 (50)
5 2564 243 (79) 244 (83) 237 (69)238 (76)
236 (71)
260 (86)
214 (50)
6 2420 261 (81) 258 (82) 256 (73)254 (76)
265 (81)
273 (84)
227 (50)
7 2087 276 (82) 277 (87) 276 (77)272 (79)
276 (79)
282 (81)
239 (50)
8 1801 288 (81) 288 (86) 291 (79)282 (76)
290 (79)
289 (78)
250 (50)
9 1164 292 (77) 294 (82) 297 (77)281 (68)
297 (76)
292 (73)
260 (50)
10 775 310 (84) 314 (89) 318 (84)294 (72)
318 (83)
310 (79)
268 (50)
11 317 310 (78) 312 (84) 322 (83)296 (68)
318 (79)
314 (77)
275 (50)
12 66 326 (86) 328 (92) 332 (85)300 (66)
334 (84)
331 (82)
280 (50)
It is readily apparent from Table 3.3 that the median scores for home schoolstudents are well above their public/private school counterparts in every subject and inevery grade. The corresponding percentiles range from the 62nd to the 91st percentile;most percentiles are between the 75th and the 85th percentile. The lowest percentilesare in Mathematics Total with Computation subtest (labeled Math in the tables); thehighest in Reading Total. While the grade-to-grade increase in national medians is 13DSS points in the lower grades, the annual increase for home school students is about16 points. These are exceptional scores and exceptional grade-to-grade gains. As shown in Table 3.4, the same superiority of median scaled scores holds whencomparing home school students to students enrolled in Catholic/Private schools. TheCatholic/Private school percentiles corresponding to median scaled scores range fromthe 53rd percentile to the 89th percentile; most are between the 65th to 75th percentile.In every area and every grade, the median scores for home school students exceed themedian scores of students enrolled in Catholic/Private schools.
Table 3.4Median Scaled Scores of Home School Students
(Corresponding Catholic/Private School Percentile)

17 of 33
by Subtest and Grade
Grade Composite Reading Language Math Soc. Stud. Science
1 170 (89) 174 (86) 166 (80) 164 (80) 166 (73) 164 (75)
2 192 (88) 196 (84) 186 (74) 188 (81) 189 (81) 195 (85)
3 207 (74) 210 (74) 195 (55) 204 (71) 205 (69) 214 (80)
4 222 (72) 228 (72) 216 (58) 220 (69) 216 (56) 232 (76)
5 243 (71) 244 (72) 237 (60) 238 (68) 236 (60) 260 (82)
6 261 (71) 258 (71) 256 (58) 254 (65) 265 (72) 273 (77)
7 276 (72) 277 (77) 276 (63) 272 (70) 276 (68) 282 (73)
8 288 (72) 288 (75) 291 (65) 282 (68) 290 (68) 289 (67)
9 292 (63) 294 (70) 297 (61) 281 (56) 297 (63) 292 (59)
10 310 (71) 314 (81) 318 (71) 294 (57) 318 (72) 310 (66)
11 310 (63) 312 (72) 322 (69) 296 (56) 318 (67) 314 (63)
12 326 (74) 328 (81) 332 (71) 300 (53) 334 (74) 331 (72)
The relationship between median composite scaled scores for home schoolstudents, Catholic/Private school students, and the nation is shown in the Figure 1. Ateach grade level, the test performance of Catholic/Private school students is above thenational performance levels, especially in the higher grade levels. Also at each gradelevel, the performance of home school students is above the performance levels ofstudents enrolled in Catholic/Private schools. The differences between these groups areconsiderable. For example, the median score for 7th graders nationwide is 239; forCatholic/Private school students the median is 257; for home school students themedian is 276. Another way to look at this chart is to examine the grades correspondingto a given composite score. A composite scale score of 250, for example, is typical of ahome school student in Grade 6, a Catholic/Private school student in Grade 7 andstudents nationwide in the later stages of grade 8.

18 of 33
Figure 1. Academic Achievement of Home School, Catholic/Private and the Nation's Students
The Grade Equivalent Scores (GES) corresponding to the median DSS scaledscores for home school students are shown in Table 3.5. These GES scores indicate theperformance levels of home school students in terms of student grade placementnationwide. The median composite scaled score for fourth-grade home school students,for example, is 217. This is comparable to the median score expected of studentsnationwide in the ninth month of fifth grade. Compared to students nationwide, themedian fourth-grade home school student test performance is 1.1 grade equivalentsabove his public/private school peers. By 8th grade, the median performance of homeschool students on the ITBS/TAP is almost four grade equivalents above that ofstudents nationwide. Similar trends hold for all subject areas. The reader should recognize that the grade equivalent scale tends to magnifydifferences at the high school level and that the percentile scale is more meaningful inthese higher grades. While 50% of eighth grade home school students have scores thatare 4 grade equivalents above the public school median, so do some 20% of eighthgrade students in public schools. The revealing statistics are the percentiles which areconsistently high across grade levels and subject areas.
Table 3.5Median Scaled Scores (corresponding Grade Equivalent Scores)
by Subtest and Nominal Gradefor Home School Students
Grade Composite Reading Language MathSoc.
Stud.Science
NationalMedian

19 of 33
1 170 ( 2.9) 174 ( 3.1) 166 ( 2.6)164 (
2.6)166 (
2.7)164 (
2.6)150 ( 1.8)
2 192 ( 4.1) 196 ( 4.5) 186 ( 3.8)188 (
4.0)189 (
4.0)195 (
4.5)168 ( 2.8)
3 207 ( 5.1) 210 ( 5.5) 195 ( 4.4)204 (
5.2)205 (
5.1)214 (
5.8)185 ( 3.8)
4 222 ( 6.2) 228 ( 6.9) 216 ( 5.9)220 (
6.4)216 (
5.9)232 (
7.3)200 ( 4.8)
5 243 ( 8.3) 244 ( 8.3) 237 ( 7.6)238 (
7.7)236 (
7.6)260 (
9.8)214 ( 5.8)
6 261 (10.1) 258 ( 9.6) 256 ( 9.4)254 (
9.1)265
(10.4)273
(11.6)227 ( 6.8)
7 276 (11.9)277
(12.0)276 (11.9)
272 (11.3)
276 (11.9)
282 (12.5)
239 ( 7.8)
8 288 (12.9)288
(12.9)291 ( - )
282 (12.5)
290 ( - ) 289 ( - ) 250 ( 8.8)
9 292 ( - ) 294 ( - ) 297 ( - )281
(12.4)297 ( - ) 292 ( - ) 260 ( 9.8)
10 310 ( - ) 314 ( - ) 318 ( - ) 294 ( - ) 318 ( - ) 310 ( - )268
(10.8)
11 310 ( - ) 312 ( - ) 322 ( - ) 296 ( - ) 318 ( - ) 314 ( - )275
(11.8)
12 326 ( - ) 328 ( - ) 332 ( - ) 300 ( - ) 334 ( - ) 331 ( - )280
(12.8)
(The - sign indicates the scaled scores are beyond the effective range for GES conversion.)
The grade equivalent score comparisons for home school students and the nationare shown in Figure 2. In grades one through four, the median ITBS/TAP compositescaled scores for home school students are a full grade above that of their public/privateschool peers. The gap starts to widen in grade five. By the time home school studentsreach grade 8, their median scores are almost 4 grade equivalents above theirpublic/private school peers.

20 of 33
Figure 2. Home School Students Compared to the National NormGroup in Grade Equivalent Units
Years of Home Schooling
Almost half of the respondents (47%) indicated that they have been homeschooled for each grade prior to their current grade, i.e., their entire academic life. Table3.6 shows that students who are home schooled for their entire academic life do betterthan students who have been home schooled for only a few years (F academic life =108.2; df=1,9750; p<.01). There is also a significant interaction between grade andyears home schooled (F=7.4; df=9,9750, p< .01), indicating that the effectiveness of home schooling varies with the student's grade. The differences are most meaningfulstarting in Grade 6. [All F ratios reported here are from a two-way analysis of variance with composite scaledscores as the dependent measure, grade as a blocking variable, and one independent variable.Because the students are within families, the dataset was trimmed by randomly selecting one childfrom each family. Had the full dataset been used, the variance of the children within a family wouldhave been artificially smaller than the variance of among children in the population of inference.This would have increased the risk of Type I error, showing significance when significance may notbe so. To assure adequate cell sizes, the analyses were also restricted to Grades 1 through 10. Astatistically significant difference only means that there is evidence of a difference in population
values. The difference may be small and not meaningful. "n.s." is used to indicate not significant.] One reviewer questioned whether this significant difference was due to life-longhome schooling or was life-long home schooling serving as a proxy for parent educationor income. The correlation of life-long home schooling and whether either parent has acollege degree is .12, indicating there is some, but not a great deal of overlap betweenthese variables. The correlation with income level was .02, indicating no relationship.Thus, whether a student is home schooled his or her entire life appears to besignificantly related to achievement.
Table 3.6Composite Scale Score Mean, Standard Deviation and Corresponding
Percentile

21 of 33
by Number of Grades Home Schooled and Grade
Grade 1 2 3 4 5 6 7 8 9 10
Home schooled entire academic life
Mean 170 195 208 224 244 265 278 291 300 314
sd 12 16 17 20 23 23 25 26 27 23
N 479 743 863 608 552 444 319 242 159 100
%ile 92 95 85 81 82 85 83 84 83 86
Home schooled some grades
Mean 168 192 206 222 241 256 270 282 288 299
sd 11 15 18 20 24 26 27 30 30 32
N 221 428 616 666 681 688 628 608 436 287
%ile 90 92 82 79 79 78 77 78 73 75
Difference 2 3 2 2 3 9 8 9 12 15
[The percentiles (%ile) shown in this and the following tables are the within-grade percentilescorresponding to the mean composite scale scores, differences and ranges refer to differences in andranges of mean composite scale scores, sd refers to standard deviation, N is the number of studentswithin each cell.]
Enrolled in a Full-Service Curriculum
There is no significant difference in the mean composite scaled scores of homeschool students enrolled in a full-service curriculum and home school students not soenrolled. As shown in Table 3.7, the means are quite close at all grade levels (F enrollment=.24; df=1,9750; n.s.).
Table 3.7Composite Scale Score Mean, Standard Deviation and
Corresponding Percentile by Full-service Curriculum Status and Grade
Grade 1 2 3 4 5 6 7 8 9 10
Not enrolled in a full-service curriculum
Mean 170 194 207 223 243 260 272 284 291 302
sd 12 15 17 20 23 25 26 29 30 31
N 646 1109 1361 1214 1145 1042 847 771 495 320
%ile 92 94 83 80 81 81 79 79 76 78
Enrolled in a full-service curriculum
Mean 167 199 209 220 241 256 272 286 289 306

22 of 33
sd 13 17 18 21 24 29 31 30 30 28
N 54 63 118 60 89 89 101 79 100 67
%ile 89 97 86 76 79 78 79 80 74 81
Difference 3 -5 -2 3 2 4 0 -2 -2 -4
Student Gender
There are no significant differences in the achievement levels of male versusfemale home school students (F for gender=.01; df=1,9750; n.s.). As shown in Table 3.8, the means are virtually identical at all grade levels.
Table 3.8Composite Scale Score Mean, Standard Deviation
and Corresponding Percentile by Grade and Gender
Grade 1 2 3 4 5 6 7 8 9 10
Males
Mean 170 195 208 223 243 260 271 285 288 303
sd 12 15 18 19 23 25 26 30 33 33
N 355 576 749 639 600 597 479 428 294 181
%ile 92 95 85 80 81 81 78 80 73 78
Females
Mean 169 193 207 223 242 260 274 284 293 303
sd 12 16 17 21 24 25 26 28 26 28
N 345 595 730 634 634 535 469 422 302 206
%ile 91 93 83 80 80 81 80 79 77 78
Difference 1 2 1 0 1 0 -3 1 -5 0
Money Spent on Educational Materials
There is a significant difference in the achievement levels of home schoolstudents depending on the amount of money spent per child on educational materialsincluding textbooks, lesson materials, tutoring, enrichment services, and testing (seeTable 3.9). At almost every grade level, students in families spending $600 or moreoutperform students in families spending less than $200 (F for money spent=41.1; df=3,9585; p <.01). There is also a significant interaction between grade and moneyspent (F=2.7; df=27,9585; p <.01) indicating that the amount of money spent oneducation makes a bigger difference at the higher grade levels. The correlation betweenmoney spent on educational materials and income is significant (r=.24, p <.01), indicating that this effect may be due to family characteristics rather than expenditures.

23 of 33
Table 3.9Composite Scale Score Mean, Standard Deviation and Corresponding
Percentile byMoney Spent on Educational Materials per Student and Grade
Grade 1 2 3 4 5 6 7 8 9 10
$600 or more
mean 171 195 208 227 245 264 278 289 298 307
sd 11 16 17 21 23 25 25 30 27 32
N 152 236 408 329 317 306 289 260 226 147
%ile 93 95 85 84 83 84 83 83 81 81
$400-599
mean 169 196 211 222 245 261 271 286 291 306
sd 13 15 17 19 22 25 26 25 31 30
N 160 286 376 263 268 253 261 179 105 69
%ile 91 96 88 79 83 82 78 80 76 81
$200-399
mean 171 194 206 220 241 257 270 280 284 299
sd 12 16 18 20 23 25 26 30 32 29
N 252 438 456 469 410 375 249 281 186 119
%ile 93 94 82 76 79 79 77 76 70 75
$199 or less
mean 166 191 203 222 238 258 265 285 284 299
sd 11 15 17 20 26 24 27 28 25 30
N 130 163 219 204 220 186 137 122 74 45
%ile 87 91 78 79 76 80 73 80 70 75
Range 5 4 8 7 7 7 13 9 14 8
Family Income
There is a significant difference in the achievement of home school studentsbased on family income. As shown in Table 3.10, students in higher income familiesconsistently have higher mean composite scaled scores (F for income = 79.1; df=3,9186; p < .01). There is also a significant interaction of income and grade (F =2.6; df=27,9186; p<.01). Achievement differences due to income are morepronounced for students in higher grades.
Table 3.10

24 of 33
Composite Scale Score Mean, Standard Deviation andCorresponding Percentile by Family Income and Student Grade
Grade 1 2 3 4 5 6 7 8 9 10
$70,000 or more
mean 173 196 211 225 247 264 278 292 301 306
Sd 10 15 16 20 23 24 25 28 27 29
N 188 300 370 350 296 300 226 202 139 80
%ile 95 96 88 82 85 84 83 85 84 81
$50,000 -69,999
mean 169 195 209 224 243 261 274 287 293 306
Sd 11 15 17 18 23 24 23 26 29 34
N 165 285 407 352 316 293 239 214 135 109
%ile 91 95 86 81 81 82 80 81 77 81
$35,000 -49,999
mean 169 193 206 222 241 258 270 281 292 305
sd 12 16 19 21 21 23 26 27 30 30
N 164 266 327 251 269 262 264 212 141 96
%ile 91 93 82 81 79 80 77 81 76 80
$34,999 or less
mean 167 192 204 218 237 255 262 276 278 297
sd 14 17 17 21 24 28 29 32 30 31
N 149 232 304 245 276 228 178 181 148 66
%ile 89 92 79 74 75 77 70 73 65 74
Range 6 4 7 7 10 9 16 16 13 9
Parent Certification as a Teacher
To determine whether there is a difference in achievement for students inhouseholds where at least one parent holds a state issued teaching certificate, weanalyzed the data for the 7,607 students with at least one parent that has a collegedegree. As shown in Table 3.11, the achievement levels across groups are remarkablysimilar. Controlling for grade and parent education level, there is no significantdifference in the achievement levels of home school students whose parents arecertified and those that are not (F for certification=2.9; df=1,7587; n.s.).
Table 3.11Composite Scale Score Mean, Standard Deviation and Corresponding
Percentile

25 of 33
by Parent Teaching Certificate and Student Grade
Grade 1 2 3 4 5 6 7 8 9 10
At least one certified parent
Mean 172 196 212 225 245 268 278 289 299 308
sd 11 16 15 20 21 21 24 24 25 31
N 183 293 342 285 290 245 243 208 137 88
%ile 94 96 89 82 83 87 83 83 82 82
Neither parent certified
Mean 171 195 210 225 246 263 276 291 299 309
sd 12 15 16 19 22 24 25 25 28 27
N 396 688 840 734 661 616 470 412 281 195
%ile 93 95 87 82 84 83 82 84 82 83
Difference 1 1 2 0 -1 5 2 -2 0 -1
Parent Education Levels
The National Assessment of Educational Progress has consistently shown markeddifferences in the performance levels of students nationwide as a function of parent'seducational level. Similar differences appear in the performance levels of home schoolstudents. As shown in Table 3.12, at every grade level, children of college graduates outperform children whose parents do not have a college degree (F=566.4; df=2,9744; p < .01). There is also a significant interaction between grade and parent education (F=8.7;df=18,9744; p < .01), indicating that the effect of parent education is more pronouncedin some grades. It is worthy to note that, at every grade level, the mean performance ofhome school students whose parents do not have a college degree is much higher thanthe mean performance of students in public schools. Their percentiles are mostly in the65th to 69th percentile range.
Table 3.12Composite Scale Score Mean, Standard Deviation and Corresponding
Percentileby Parent Education and Student Grade
Grade 1 2 3 4 5 6 7 8 9 10
Both parents have college degrees
Mean 178 196 212 228 249 268 278 296 306 314
sd 11 15 15 19 21 22 25 22 24 26
N 367 640 706 567 535 501 420 325 206 137
%ile 98 96 89 85 86 87 83 88 87 86

26 of 33
One parent has a college degree
Mean 172 194 208 222 242 260 275 285 293 304
sd 13 15 16 19 22 24 24 25 28 29
N 212 341 477 451 417 361 293 297 212 147
%ile 94 94 85 79 80 81 81 80 77 79
Neither parent has a college degree
Mean 161 187 196 212 231 245 260 268 271 288
sd 10 16 17 19 25 25 28 34 27 33
N 121 191 297 255 285 270 233 231 177 104
%ile 79 87 67 66 68 67 69 66 59 67
Range 17 9 16 14 17 23 18 28 35 26
Television Watching
It was pointed out above that home school students spend significantly less timewatching television than do the general population of school-age students. Like thenation as a whole, increased amounts of television viewing for home school students isassociated with lower achievement test scores. Table 3.13 shows that at every gradelevel, there is a steady decline in achievement as the amount of television viewingincreases (F for televison viewing =142.5; df=3,9685; p <.01). The interaction of grade and amount of television viewing is also significant (F=5.5; df=27,9685; p <.01). Theeffects of television on achievement are more pronounced with students in highergrades.
Table 3.13Composite Scale Score Mean, Standard Deviation and Corresponding
Percentile by Amount of Television Viewing Each Week and Grade
Grade 1 2 3 4 5 6 7 8 9 10
No Television
mean 166 199 213 227 251 271 281 294 308 307
sd 13 15 15 19 22 24 26 25 27 27
N 81 164 165 161 172 140 117 107 102 64
%ile 87 97 90 84 88 89 86 86 88 81
1 hour or less
mean 171 196 208 225 245 263 274 288 298 308
sd 12 15 17 20 22 23 25 29 25 29
N 355 554 795 650 586 525 453 369 225 186

27 of 33
%ile 93 96 85 82 83 83 80 82 81 82
2 hours
mean 169 191 205 219 238 253 268 279 278 299
sd 11 15 18 20 23 26 27 27 31 29
N 186 325 380 333 333 309 237 241 182 92
%ile 91 91 81 75 76 75 75 75 65 75
3 hours or more
mean 169 187 203 216 233 252 269 275 281 280
sd 11 17 17 20 26 27 28 31 29 35
N 75 121 136 117 135 155 140 130 86 43
%ile 91 87 78 71 70 74 76 72 67 60
Range 5 12 10 11 18 19 13 19 30 28
Summary of Major Findings
Major findings: Demographics
Home school parents have more formal education than parents in the generalpopulation; 88% continued their education beyond high school compared to 50%for the nation as a whole.The median income for home school families ($52,000) is significantly higherthan that of all families with children ($36,000) in the United States.Almost all home school students (98%) are in married couple families. Mosthome school mothers (77%) do not participate in the labor force; almost all homeschool fathers (98%) do work.Home school students watch much less television than students nationwide; 65%of home school students watch one hour or less per day compared to 25%nationally.The median amount of money spent annually on educational materials is about$400 per home school student.The distribution of home school students by grade in grades 1-6 is consistent withthat of all school children. Proportionally fewer home school students areenrolled at the high school level.
Major findings: Achievement
Almost 25% of home school students are enrolled one or more grades above theirage-level peers in public and private schools.Home school student achievement test scores are exceptionally high. The medianscores for every subtest at every grade (typically in the 70th to 80th percentile)are well above those of public and Catholic/Private school students.On average, home school students in grades 1 to 4 perform one grade level above

28 of 33
their age-level public/private school peers on achievement tests.The achievement test score gap between home school students and public/privateschool students starts to widen in grade 5.Students who have been home schooled their entire academic life have higherscholastic achievement test scores than students who have also attended othereducational programs.There are no meaningful differences in achievement by gender, whether thestudent is enrolled in a full-service curriculum, or whether a parent holds a stateissued teaching certificate.There are significant achievement differences among home school students whenclassified by amount of money spent on education, family income, parenteducation, and television viewing.
Discussion
Incorporating the largest sample ever used to study home school students andtheir families, this study is a rich source of information concerning their demographicsand achievement. It clearly shows that home school students and their families are aselect population. Family income and education levels are well above national averages.The family structure is traditional with married couples as parents, several children,father as bread winner, and a stay-at-home mother. A large percent of home schoolstudents have a parent that has held a state-issued teaching certificate. Home schoolfamilies do not spend a great deal of money on educational materials and tend not tosubscribe to pre-packaged full-service curriculum programs. In spite of the large size of this assessment, there are notable limitations to thisstudy. Foremost, home school students and their families are not a cross-section of theUnited States population. The act of home schooling distinguishes this group in termsof their exceptionally strong commitment to education and children. There are majordemographic differences between home school families and the general United Statespopulation. Further, it should be noted that it was not possible within the parameters ofthis study to evaluate whether this sample is truly representative of the entire populationof home school students. The content of the Riverside tests is another major limitation of this study. Whilehome schools teach the basic skill areas of reading, mathematics, social studies, andscience, they do not necessarily follow the same scope, sequence, or emphasis astraditional public and private schools. The primary focus of many home schools is onreligious and moral values. Home schools can and do place a greater emphasis on studyskills, critical thinking, working independently, and love of learning. Public and privateschools usually select the Riverside test due to its close alignment with theircurriculum; home schools select the test primarily out of convenience. We were conservative in our analysis of achievement test results. Even thoughsome 25% of home school students are enrolled in an advanced grade level, we usedcurrent grade placement rather than the age appropriate grade placement whendetermining percentiles and grade equivalents. When looking at test scores, we chosethe composite score with mathematics computation, even though mathematics appearsto be a weaker subject for older home school students. As a result, we have probablyunderestimated home school academic performance levels. Even with our conservative approach, the achievement levels of the home schoolstudents in this study are exceptional. Within each grade level and each skill area, themedian scores for home school students fell between the 70th and 80th percentile ofstudents nationwide and between the 60th and 70th percentile of Catholic/Private

29 of 33
school students. For younger students, this is a one year lead. By the time home schoolstudents are in 8th grade, they are four years ahead of their public/private schoolcounterparts. Our results are consistent with previous studies of the achievement of homeschool students. A 1990 national home schooling survey of 1,516 families in the UnitedStates noted that, on average, home education families have parents with greater formaleducation, more children, and higher family income (Home School Court Report, 1990). Two-parent families were the norm and they were predominantly Christian. The averageage of the children was just over eight years--a majority of the children had neverattended public or private schools. There were equal numbers of male and femalestudents. On standardized achievement tests, the home-schooled students performed ator above the 80th percentile on national norms in reading, listening, language, math,science, social studies, basic battery, and complete battery scores. Calvery et.al. (1992) compared the achievement of Arkansas home schooled andpublic schooled students in grades 4, 7, and 10 using 6 subscales of the MAT-6. Homeschooled students scored higher than their counterparts in reading, mathematics,language, total basic battery, science, and social studies at grade 4 and grade 7. Theyalso scored significantly above public school means for grade 10 in reading,mathematics, total basic battery, science, and social studies, but scored significantlylower in language. Ray (1997) analyzed demographic and achievement data from 5,402 home schoolstudents in 1,657 families. While Ray used a different approach to analyze achievementdata, he noted exceptionally high average achievement levels and that students withlong histories of being home schooled had higher achievement scores. Home school students did quite well in 1998 on the ACT college entranceexamination. They had an average ACT composite score of 22.8 which is .38 standarddeviations above the national ACT average of 21.0 (ACT, 1998). This places theaverage home school student in the 65th percentile of all ACT test takers. These comparisons between home school students and students nationwide mustbe interpreted with a great deal of caution. This was not a controlled experiment.Students were not randomly assigned public, private or home schools. As a result, thereported achievement differences between groups do not control for backgrounddifferences in the home school and general United States population and, moreimportantly, cannot be attributed to the type of school a child attends. This study doesnot demonstrate that home schooling is superior to public or private schools. It shouldnot be cited as evidence that our public schools are failing. It does not indicate thatchildren will perform better academically if they are home schooled. The design of thisstudy and the data do not warrant such claims. All the comparisons of home schoolstudents with the general population and with the private school population in thisreport fail to consider a myriad of differences between home school and public schoolstudents. We have no information as to what the achievement levels of home schoolstudents would be had they been enrolled in public or private schools. This studysimply shows that those parents choosing to make a commitment to home schooling areable to provide a very successful academic environment.
Note
This report was supported with a grant from the Home School Legal DefenseAssociation, Purcellville, Virginia. The opinions expressed in this report are those ofthe author and do not necessarily reflect the positions or policies of the Home SchoolLegal Defense Association.

30 of 33
References
ACT, Inc. (1998). The 1998 ACT High School Profile Report--National Data. Iowa City, IA. Available on-line: http://www.act.org/news/98/98data.html
Bruno, Rosaline and Andrea Curry (1997). Current Population Reports. PopulationCharacteristics: School Enrollment--Social and Economic Characteristics of Students: October 1995 (update).Available on-line:http://www.census.gov/prod/2/pop/p20/p20-492u.pdf
Calvery, Robert; and Others (1992). The Difference in Achievement between HomeSchooled and Public Schooled Students for Grades Four, Seven, and Ten in Arkansas.Paper presented at the Annual Meeting of the Mid-South Educational ResearchAssociation (21st, Knoxville, TN, November 11-13, 1992).
Day, Jennifer and Andrea Curry (1998). Current Population Survey (CPS) for theNation. United States Census Bureau. Available on-line:http://www.census.gov/population/www/socdemo/school.html
Drahozal, Edward (1997). Validity Information for the Iowa Test of Basic Skills (ITBS)and Iowa Test of Educational Development (ITED), Forms K, L, M. RiversidePublishing Company, working draft.
Home School Court Report (Dec. 1990). A Nationwide Study of Home. Available fromERIC Document Reproduction Service ED381725.
Hoover, H.D., N. Hieronymous, D.A. Frisbie, S.B. Dunbar (1996). Catholic/Private Norms: ITBS. Itasca: IL: Riverside Publishing Company.
Lines, Patricia (1998). Home schoolers: Estimating Numbers and Growth. Technicalpaper.
Ray, Brian (1997). Home Education Across the United States. Purcellville, VA: HomeSchool Legal Defense Association. Available on-line:http://www.hslda.org/media/statsandreports/ray1997/index.stm
Riverside Publishing Company (1994). Riverside 2000 Integrated Assessment Program, Technical Summary. Chicago: Riverside Publishing Company.
Scannell, D.P, O.M. Haugh, B.H. Loyd and C.F. Risinger (1996). Catholic/Private Norms: TAP. Itasca: IL: Riverside Publishing Company.
Snyder, Thomas and John Wirt (1998). The Condition of Education, US Department ofEducation, National Center for Educational Statistics.
US Census Bureau (1996). Educational Attainment in the United States March 1996(Update). Available on-line: http://www.census.gov/prod/2/pop/p20/p20-493u.pdf
US Census Bureau (1997a). Statistical Abstract of the United States, 1997. Available on-line: http://www.census.gov/prod/3/97pubs/97statab/labor.pdf
US Census Bureau (1997b). Statistical Abstract of the United States, 1997. Available

31 of 33
on-line: http://www.census.gov/prod/3/97pubs/97statab/educ.pdf
US Department of Education (1996). Youth Indicators, Washington, DC: NationalCenter for Educational Statistics.
US Department of Education (1997). National Assessment of Educational Progress,
1996 National Mathematics Results. Washington, DC: National Center for EducationStatistics.
Acknowledgments
This report relied on the creativity and expertise of several individuals. Michael Farris,Esquire, President of the Home School Legal Defense Association conceived the studyand secured the cooperation of the author and three contributing organizations - BobJones University Testing Service, National Computer Systems, and HSLDA. Earl Hallof HSLDA worked out the numerous logistics and details of working, was the primaryarchitect of the background questionnaire, and provided responses to my thousandquestions regarding home schooling. Janet Abbott of BJU provided information aboutthe testing program and the datasets. BJU staff also hand coded the studentidentification numbers to make corresponding background and achievementinformation possible. Tom Perry of National Computer Systems handled the logistics ofscanning the background questions. Edward Drahozal, Janet Adair and Vesna Plavsic ofRiverside Publishing Customer Support were wonderful, knowledgeable resourceshelping the author understand the ITBS/TAP norming process and data disks. Finally,the author is deeply indebted to H.D. Hoover of the Iowa Testing Program, Gene VGlass of Arizona State University, and Michael Scriven of Claremont GraduateUniversity for their invaluable comments on drafts of this report and for helping toassure appropriate analytical methodology.
About the Author
Lawrence M. Rudner
Email: [email protected]
Dr. Rudner is with the College of Library and Information Services, University ofMaryland, College Park. He has been involved in quantitative analysis for over 30years, having served as a university professor, a branch chief in the U.S. Department ofEducation, and a classroom teacher. For the past 12 years, he has been the Director ofthe ERIC Clearinghouse on Assessment and Evaluation, an information service sponsored by the National Library of Education, U.S. Department of Education whichacquires and abstracts articles and manuscripts pertaining to educational assessment,evaluation, and research; builds and maintains on-line databases; publishes articles andbooks; and provides a wide range of user services. Dr. Rudner holds a Ph.D. inEducational Psychology (1977), an MBA in Finance (1991), and lifetime teachingcertificates from two states. His two children attend public school.
Copyright 1999 by the Education Policy Analysis Archives
The World Wide Web address for the Education Policy Analysis Archives is

32 of 33
http://epaa.asu.edu
General questions about appropriateness of topics or particular articles may be addressed tothe Editor, Gene V Glass, [email protected] or reach him at College of Education, ArizonaState University, Tempe, AZ 85287-0211. (602-965-9644). The Book Review Editor isWalter E. Shepherd: [email protected] . The Commentary Editor is Casey D. Cobb:[email protected] .
EPAA Editorial Board
Michael W. AppleUniversity of Wisconsin
Greg CamilliRutgers University
John CovaleskieNorthern Michigan University
Andrew [email protected]
Alan Davis University of Colorado, Denver
Sherman DornUniversity of South Florida
Mark E. FetlerCalifornia Commission on Teacher Credentialing
Richard [email protected]
Thomas F. GreenSyracuse University
Alison I. GriffithYork University
Arlen GullicksonWestern Michigan University
Ernest R. HouseUniversity of Colorado
Aimee HowleyOhio University
Craig B. HowleyAppalachia Educational Laboratory
William HunterUniversity of Calgary
Richard M. JaegerUniversity of North Carolina--Greensboro
Daniel KallósUmeå University
Benjamin LevinUniversity of Manitoba
Thomas Mauhs- PughGreen Mountain College
Dewayne MatthewsWestern Interstate Commission for HigherEducation
William McInerneyPurdue University
Mary McKeown-MoakMGT of America (Austin, TX)
Les McLeanUniversity of Toronto
Susan Bobbitt NolenUniversity of Washington
Anne L. [email protected]
Hugh G. PetrieSUNY Buffalo
Richard C. RichardsonArizona State University
Anthony G. Rud Jr.Purdue University
Dennis SayersAnn Leavenworth Centerfor Accelerated Learning
Jay D. ScribnerUniversity of Texas at Austin
Michael [email protected]
Robert E. Stake University of Illinois--UC
Robert StonehillU.S. Department of Education
Robert T. StoutArizona State University

33 of 33
David D. WilliamsBrigham Young University
EPAA Spanish Language Editorial Board
Associate Editor for Spanish LanguageRoberto Rodríguez Gómez
Universidad Nacional Autónoma de México
Adrián Acosta (México)Universidad de [email protected]
J. Félix Angulo Rasco (Spain)Universidad de Cá[email protected]
Teresa Bracho (México)Centro de Investigación y DocenciaEconómica-CIDEbracho dis1.cide.mx
Alejandro Canales (México) Universidad Nacional Autónoma deMé[email protected]
Ursula Casanova (U.S.A.)Arizona State [email protected]
José Contreras DomingoUniversitat de Barcelona [email protected]
Erwin Epstein (U.S.A.)Loyola University of [email protected]
Josué González (U.S.A.)Arizona State [email protected]
Rollin Kent (México)Departamento de Investigación Educativa-DIE/[email protected] [email protected]
María Beatriz Luce (Brazil)Universidad Federal de Rio Grande do Sul- [email protected]
Javier Mendoza Rojas (México)Universidad Nacional Autónoma deMé[email protected]
Marcela Mollis (Argentina)Universidad de Buenos [email protected]
Humberto Muñoz García (México)Universidad Nacional Autónoma deMé[email protected]
Angel Ignacio Pérez Gómez (Spain)Universidad de Má[email protected]
Daniel Schugurensky(Argentina-Canadá)OISE/UT, [email protected]
Simon Schwartzman (Brazil)Fundação Instituto Brasileiro e Geografiae Estatística [email protected]
Jurjo Torres Santomé (Spain)Universidad de A Coruñ[email protected]
Carlos Alberto Torres (U.S.A.)University of California, Los [email protected]