education policy analysis archives · education policy analysis archives vol. 13 no. 19 5 this...
TRANSCRIPT

EDUCATION POLICY ANALYSIS ARCHIVES A peer-reviewed scholarly journal
Editor: Sherman Dorn College of Education
University of South Florida
Copyright is retained by the first or sole author, who grants right of first publication to the Education Policy Analysis Archives. EPAA is published jointly by the Colleges of Education at Arizona State University and the University of South Florida. Articles are indexed in the Directory of Open Access Journals (www.doaj.org).
Volume 13 Number 19 March 6, 2005 ISSN 1068-2341
Mandating Supplemental Intervention Services:
Is New York State Doing Enough to Help All Students Succeed?
Kieran M. Killeen University of Vermont
John W. Sipple
Cornell University
Citation: Killeen, K. M. & Sipple, J. W. (2005, March 6). Mandating supplemental intervention services: Is New York state doing enough to help all students succeed? Education Policy Analysis Archives, 13(19). Retrieved [date] from http://epaa.asu.edu/epaa/v13n19/. Abstract As states have become more active in establishing curriculum content standards and related assessments disappointingly little attention has been paid to policy efforts that create learning opportunities for students to meet the new standards. This study examines one state policy designed to bolster the opportunity to learn by mandating additional instruction for students not currently achieving proficiency in the state standards. The results focus on a detailed description of New York State’s Academic Intervention Services, including its organizational and instructional elements (e.g., staffing, scheduling, student grouping, instructional strategies) across NYS schools. While the majority of states have established curriculum frameworks and linked them to assessment instruments, this experience in NY may be unique for its coordinated emphasis on intervention services (academic and non-academic) linked to rigorous learning and accountability standards. However, the caveats identified in this study promote a familiar sense of local discretion in the interpretation and implementation of state policy mandates. The analyses describe how

Killeen & Sipple: Mandating supplemental intervention services 2
such practices vary by local district context, such as community wealth and geography, and if those practices have equity implications. The primary analyses draw on survey data from a stratified random sample of 764 teachers and principals from 125 school districts, and feature multi-variate methods with proper adjustment for the clustering of responses within districts (i.e., multiple teachers and administrators within each district).
Introduction1
As states have become more active in establishing curriculum content standards and related assessments (Skinner & Staresina, 2004), disappointingly little attention has been paid to policy efforts that create learning opportunities for students to meet the new standards (Wilson, 2004). The identification and proliferation of state curricula and state assessment systems are notable, and yet by themselves do little to ensure improved or additional learning opportunities for low achieving students. This study examines one state policy designed to bolster the opportunity to learn by mandating additional instruction for students not currently achieving proficiency in the state standards. In an attempt to ensure a bridge between the mandated curriculum content standards and multiple state examinations, New York State implemented a policy in 2000 calling for the provision of Academic Intervention Services (AIS) to every student achieving at levels less than proficient.
Academic intervention services (AIS) are services designed to help students achieve the learning standards in English language arts and mathematics in grades K-12 and social studies and science in grades 4-12. These services include two components: 1) additional instruction that supplements the general curriculum (regular classroom instruction); and/or 2) student support services needed to address barriers to improved academic performance. (NYS Commissioner’s Regulations, Part 100.1(g))2
A primary focus of this study entails a detailed description of AIS programming including its organizational and instructional elements (e.g., staffing, scheduling, student grouping, instructional strategies). We also analyze how such practices vary by local district context, such as community wealth and geography, to assess the equity implications of consistent or varied policy response. To accomplish these goals, we draw on survey and archival data from a stratified random sample of 764 teachers and principals from 125 school districts. The sample of districts was drawn from the universe of school districts with high schools and includes the largest urban districts in the state as well as a representative sample of suburban and rural districts (See Table 1). Analyses include bivariate and multi-variate methods with proper 1 The authors would like to thank the Governing Board of the Education Finance Research Consortium of New York State for their support of this research. A fuller version of the findings reported here are contained in a report published by the EFRC entitled “The Implementation of Academic Intervention Services (AIS) in NYS: Implications for School Organization and Instruction”. In particular, this study benefited from the careful reading and thoughtful suggestions of Deborah Cunningham and Jeanne Post of the New York State Department of Education. 2 Available at http://www.emsc.nysed.gov/part100/pages/1002i.html

Education Policy Analysis Archives Vol. 13 No. 19 3
adjustment for the clustering of responses within districts (i.e., multiple teachers and administrators within each district).
Context
Background in New York State
Beginning in the fall of 2000, New York State (NYS) school districts were required to implement Academic Intervention Services (AIS) that linked under-performing students with additional resources to improve their performance. Regulations mandate a new enrichment approach to provide additional instruction to students in grades K-12 who needed extra time and help to meet state learning standards. This strategy replaces the earlier reliance on later-grade remedial instruction. State policy mandates included specific guidelines for AIS implementation. For example, regulations now require students to receive services within one academic semester of identification. Eligibility for AIS services should be based upon multiple measures of student performance, including grades, test scores, and recommendations of teachers and parents. SED guidelines also suggested strategies to vary the intensity of the intervention, including ideas about scheduling, duration, and the level of student-teacher individualization3.
AIS policy and practice represents an attempt to promote policy coherence between curriculum, instructional, and assessment policies. AIS programming may be conceptualized as a bridge between the curriculum and assessment programs, an alternative and supplemental instructional program that targets poorly performing students. The AIS guidelines encouraged schools to generate additional instruction activity to meet student deficits. The policy guidelines, however, did not require explicit strategies to change instructional content or pedagogy, or for that matter, provide suggestions on how professional development could improve instructional services within an AIS plan. The specificity of the guidelines was more focused on identification criteria, as described above. This measured approach between policy prescription and encouragement of local innovation coincided with the dramatic change in learning and graduation standards in New York State.
Specifically, the State Board of Regents adopted new Learning and Graduation standards for all public schools in New York State, and began implementing the new standards in 2000. Briefly, the reform requires all students seeking a high school diploma to earn a state-endorsed Regents Diploma. While in practice for more than 100 years, the Regents courses, exams, and diplomas are only now mandated for all students. Heretofore, less than one-half of all high school graduates earned a state-endorsed diploma, with the majority earning a diploma meeting local school district standards.
Related Literature
This study of AIS implementation is timely given the long history of school systems
avoiding or reinterpreting policy prescriptions from state agencies (Tyack & Cuban, 1995; 3 Kadamus, J. (2000). Q and A. Guidelines on Academic Intervention Services Implementation. New York State Education Department. The University of the State of New York, Office of Elementary, Middle, Secondary and Continuing Education (available at http://www.emsc.nysed.gov/docs/AISQAweb.pdf).

Killeen & Sipple: Mandating supplemental intervention services 4
Tyack & Tobin, 1994). As a framework for this study, we introduce the literature on policy coherence, policy adherence, and instructional capacity. These terms provide a lens with which to understand this investigation into the implementation of state AIS policy. As a policy designed to build instructional capacity to assist low-performing students in achieving state curriculum and accountability standards, we posit that AIS represents an attempt to promote policy coherence between curricular, instructional, and accountability policies. Moreover, AIS policy is designed to bolster capacity by fiat (i.e., state regulation), the result of which is to add instruction services for students most in need.
The notion of policy coherence received much attention in the early 1990s and continues today (Fuhrman, 1993; Wilson, 2004b). Researchers, policymakers, and practitioners continually attempt to understand, explain, and alter the many ways in which schools function in light of the multiple and often contradictory policy messages (Chrispeels, 1997; McLaughlin & Talbert, 1993; Smith & O'Day, 1990a; Spillane & Jennings, 1997). One argument to gain support for increased coherence was that various and often disconnected strains of local, state, and federal policy left local educators with choices as to which policies to adopt, which to change, and which to ignore (Cuban, 1998; Tyack & Cuban, 1995). Hence, to generate consistent, equitable, and widespread educational change, it was suggested that designing tighter coherence among policies within and between different policy levels is possible and desirable (Clune, 2001; Smith & O'Day, 1990b). Wilson (2004a) argues for the integration of assessments, curriculum frameworks, and classroom instructional methods from the level of the classroom to the highest levels of state and policy. What would constitute evidence of policy coherence at the district level? A measure of coherence would be the degree to which individuals within and across districts adhere to the specific policy guidelines outlined by the State. Moss (2004) terms this coherence-through-alignment.
While much effort has been devoted to aligning local curriculum and instruction with state curriculum framework and assessment systems, others argue that such coherence is not without risk (Moss, 2004). Moss questions the virtue of tightly aligned local and state policies given the wide variety of local contexts, offering instead a coherence-through-negotiation-of-meaning argument:
Negotiation of meaning can result in alignment and alignment can encourage negotiation of meaning such that local actors come to ‘own’ the concepts provided in the assessment system. (p. 219)
Thus an alternative conception of policy coherence may not only be the alignment of practice across levels of the system, but may be interpreted as teachers understanding, taking ownership, and adapting the state-promoted instructional, curricular, and accountability practices to local student need. It remains to be seen whether the interpretation of policies differ randomly or systematically by context (e.g., geography, wealth, performance).
The literature on policy coherence and adherence points to several opportunities that could stimulate variation in local implementation of state policy. First, if the policy scripts are too loose, districts may elect to interpret the policy guidance in a wide variety of ways; this may result in potentially superficial responses or basic discontinuity in a child’s academic program. Second, if the policy is grounded within a conceptual framework and aligned with complementary policies, local interpretation may be more constrained. A third perspective emphasizes the role of organizational capacity in the implementation of state policy.
Education Policy Analysis Archives Vol. 13 No. 19 5
This study supports the now prevalent reform discourse suggesting that organizational capacity, which includes teacher’s professional knowledge and skills, financial resources, and effective leadership at the district and building levels, is important for increasing the organization’s ability for delivering high-quality instruction (Corcoran & Goertz, 1995; Darling-Hammond, 1993; Galvin, 2001; McDonnell & Elmore, 1987; O'Day, Goertz, & Floden, 1995). The existing research on capacity tends to stress how policy may stimulate or introduce capacity-building activities at the building level. Hightower’s (2002) case study of instructional reform within the San Diego City School District is illustrative of this. Here, the research points to the reform of capacity-building efforts such as developing school principals as instructional leaders, the hiring of school based instructional leaders (peer coaches) and staff developers, and the redirection and alignment of state and federal funding streams. Beyond the building level though, very little is known about capacity-building activities across intermediary educational organizations (Massel & Goertz, 2002). Here, the question addresses the role and emphasis of state, regional, district, and building level perspectives. Massel and Goertz also argue that as policy makers attempt to align state instructional policy to provide more coherent guidance for classroom teachers in support of ambitious learning outcomes, district response to these initiatives must be taken into account. Others such as Firestone (1989) emphasize that the measurement of “a will to change” at the district level, interacting with a district’s capacity to change, leads to substantial change within the district.
In terms of local capacity to meet the academic needs of all students, how do school districts use the additional regulatory and fiscal incentives associated with heightened educational standards? Researchers have documented a variety of strategies districts use to increase the instructional capacity of schools. Providing and controlling access to data, professional development, curriculum and instructional guidance, qualified staff, and fostering relationships with external agents and networks are some of the strategies used by districts (Galvin, 2001; Massell & Goertz, 2002; Spillane, 1996). Our own work in New York State documents a variety of capacity building activities that emerged or substantially changed with the heightened learning and graduation standards, including academic interventions, teacher professional development, staffing changes, and the availability of alternative student outcomes (e.g., dropout, GED, alternative education programs) (Sipple, Killeen, & Monk, 2004). Additional recent work documents how a broad range of capacity building activities at the district level are associated with local community characteristics, in ways that appear to disenfranchise children in impoverished schools (Sipple & Killeen, 2004). In this work we control for geographic, wealth, and spending factors among NYS districts, and find that educators in districts serving high concentrations of poor children are likely to report increases in alternatives to a college preparatory diploma (the Regents diploma), including transfers to GED and alternative education programs.
Research Questions
This article draws on new statewide survey data to answer three main questions:
A. Policy Coherence. How do AIS implementation practices (i.e., organization and instruction) vary across the state?
B. Policy Adherence. How well do district level implementation practices match the AIS policy guidelines outlined by the state?

Killeen & Sipple: Mandating supplemental intervention services 6
C. Capacity to Adhere. How well do districts possess the capacity to meet the AIS policy guidelines?
These questions fall short of asking whether academic intervention services improve
student achievement to proficiency levels, whether the policy is cost effective, or even just. Viewed through a lens of policy evaluation, and until sufficient data exist to assess changes in performance, important questions now must focus on descriptive accounts of policy implementation, organizational and instructional responses, as well as coherence and adherence at the local level.
Data and Methods
Our analyses will focus on AIS implementation strategies among NYS school districts
as reported by school principals and their teachers. This description relies on our discussion of item response variation by geography, wealth, and position, as well as district performance categories. Summary analyses also examine typical correlates of program implementation levels including student race and student English proficiency.
Survey Development
Over the course of day-long site visits to four school districts in the fall of 2002, we conducted 45 interviews with approximately 90 principals, regular education teachers, AIS teachers and guidance counselors. We had previously visited these districts on several occasions during the preceding two years as part of our attempt to carefully document the district responses to and implementation of the broader set of new state requirements. During the 2000-2001 school year we interviewed more than 120 educators and community leaders and report these findings elsewhere (Sipple, Killeen, & Monk, 2004). The more recent wave of interviews specifically targeted the relationship between AIS and other programs for underperforming and at risk students, the identification of students for AIS, how AIS is delivered, the focus of AIS instruction, as well as the role of nonacademic intervention services designed to alleviate obstacles to academic success.
Based on the findings from the qualitative interviews, we designed principal and teacher survey instruments. These instruments were designed to collect information about the process by which students are selected (and terminated) for AIS services, the scheduling and staffing of AIS programming, and the degree of participation in AIS among students in English and mathematics classes. While many questions in the surveys were asked of all respondents (principals and teachers), teachers were asked to provide additional information about their actual classroom instruction, organization, and planning, while principals were asked to provide information about broader school-wide organization, scheduling, and policy issues. Surveys ranged from 12-43 minutes in length and were conducted by trained staff using a computer-assisted telephone interviewing system at the Survey Research Institute (SRI) at Cornell University.4 4 “The Survey Research Institute (SRI) is a full-service survey research facility at Cornell University. The primary mission of SRI it to conduct surveys and provide survey research services to Cornell University faculty, students, and administration, federal, state, and local government agencies, other nonprofit organizations, and other organizations in need of survey research work. SRI is committed

Education Policy Analysis Archives Vol. 13 No. 19 7
In order to measure common instructional strategies within AIS classrooms, we reviewed and selected appropriate items from the National Education Longitudinal Study of 1988 (NELS: 88-94). Previously tested for reliability and validity by the US Department of Education’s National Center for Educational Statistics, the items included measures of general pedagogy, classroom organization, and subject-specific items related to the teaching of English or mathematics. While many other measures of instruction could have been used, the NELS measures serve our purpose of reliably, measuring whether basic instructional strategies differ between AIS and non-AIS teachers.
Sampling
The principal goal of our sampling strategy was to balance a representative selection of districts (as well as the population of students the districts represent) against a need to represent wealthy and poor, urban, suburban, and rural communities. This goal encouraged us to utilize both cluster and stratified sampling approaches.
In designing our data collection, we used a cluster sampling approach, selecting districts, then selecting schools within those districts, and finally selecting teachers within the schools (See Table 1). Overall, we selected 121 districts and then 246 schools (including 166 high schools and 80 middle schools) in these districts. We then surveyed the principal in each school. To provide an in-depth documentation of AIS in classrooms, we then chose a subset of these districts (70) to survey more than 500 teachers in grades 7-12, For the purpose of this study, we considered an ‘in-depth’ district to be a district where the middle and high school principals (if both exist) and four teachers completed surveys (two English and two math). This requirement did not hold for districts with fewer than four English and mathematics teachers, in which case we would select all the English and mathematics teachers. These 246 administrators and 500 teachers give us an overall picture of AIS. District Level
We selected the NYC Public Schools, the Big Four large urban districts (i.e., Buffalo, Rochester, Syracuse, and Yonkers), and then divided the rest of the upstate districts into low-wealth, mid-wealth, and high-wealth districts. The wealth categories were created using the Combined Wealth Ratio (CWR; a composite index of property and income wealth available to each school district). From the 638 non-Big Five school districts with high schools, we selected a total of 116 districts, 39 low-wealth districts, 38 mid-wealth districts, and 39 high-wealth districts. Letters were mailed to superintendents of selected districts in March 2003, asking them to respond if they did not want their district included in the study.
School Level We selected both high school and middle school principals to interview. In NYC, we
randomly selected 45 high schools and 20 middle schools to participate in the study. Forty-five (45) NYC High School Principals participated and 20 NYC Middle School Principals participated.
to offering state-of-the-art technology to its clientele, striving for the highest possible quality in performance while maintaining the highest possible ethical standards of conduct.” (http://www.sri.cornell.edu/about.html)

Killeen & Sipple: Mandating supplemental intervention services 8
With regard to the Big Four, we randomly selected four high schools and two middle schools from Buffalo, and two high schools and two middle schools each from Rochester, Syracuse, and Yonkers. Following the principal surveys, one of the Big Four districts declined to participate.5 Thus we dropped two principal interviews already collected from this district and did not collect any teacher data from this district.
From the remaining school districts with high schools in the state, we selected one high school from each of the 116 selected districts. If there was more than one high school in the district, the high school was randomly selected (fewer than 10% of these districts have more than one high school). Next, we randomly chose 17 middle schools from the 39 low-wealth districts, 17 from the 38 mid-wealth districts and 17 from the 39 high-wealth districts. If there was more than one middle school in the district selected, the middle school was randomly chosen. Some districts had combined high school and middle schools and hence there was no middle school principal.
Teacher Level Our initial sampling approach assumed that the 2001-2002 NYS Personnel Master
File6 would aid in the identification and description of AIS teachers within NYS schools, but we found dramatic underreporting of AIS course instruction by Teacher Assignment Code. This process led to a redesign of the teacher sampling strategy. From the schools that were selected to participate in the study and whose principal was interviewed, we selected five English and five mathematics teachers teaching at least one section of the subject area in grades 7-12 from the BEDS Personnel Master File database. • In NYC, we randomly selected five middle and five high schools from the set of schools
where we had successfully surveyed principals. We then randomly selected five math teachers and five English teachers from each school resulting in a target number of 100 teachers from NYC. We asked all teachers specific classroom information (i.e., number of students, number of AIS students, whether the teacher is responsible for providing AIS services in the class).
• For the Big Four districts, we selected 10 English and 10 math teachers (grades 7-10) from the high schools and middle schools in three of the four Big Four districts.
• From the 116 upstate districts, we chose 18 districts from each of the stratum (i.e., 18 of 39 low-wealth districts, 18 of 38 mid-wealth districts, and 18 of 39 high-wealth districts). Once the 54 districts were chosen, we randomly choose 10 teachers, five math and five English teachers, in grades 7-12 from each of the districts. In schools with fewer than six English or mathematics teachers, we did not sample but rather attempted to survey the universe of teachers in the building.
5 Per our human subjects agreement with each district, the name of the non-participating district will remain confidential. 6 The Personnel Master File is part of the Basic Educational Data System, update annually with survey data collected every October from every teacher and administrator in the state.

Education Policy Analysis Archives Vol. 13 No. 19 9
Table 1
Summary of Sampling Strategy for Data Collection
# Districts # Schools/ Principals
Teachers (Schools)
NYC 1 65 51(1) Big Four 3 16 38(3) Non-Big Five 136 172 422(56)
Lowest 1/3 CWR 43 56 155 Middle 1/3 CWR 47 59 142 Highest 1/3 CWR 46 57 125
Total 140 253 511(60)
Weighting Depending on the policy question posed, it may be more valuable to understand the
proportion of districts engaging in a particular practice, or possibly the proportion of students that are impacted by a given practice. As such, we applied two different weighting schemes to our sampled data in order to generalize the findings across the state. Specifically, the sampling design affords us the opportunity to properly weight the survey responses for the population of districts within each stratum, and separately for the population of students in each stratum. We calculate these weights to ensure that our sample of principals and teachers accurately represent the population of districts in each wealth stratum, and separately the number of students being educated in each of the three strata. To generate these weights, we calculated six separate weights – two for principals only, two for teachers only, and two for the combined sample of principals and teachers. One pair of weights is calculated to allow for generalization of the findings to the population of districts, and the second is for generalization of findings to the student population in each stratum across the state.
We calculated a district weight by dividing the total number of districts in each of the three wealth strata by the number of districts in our sample. Since we have multiple respondents in many districts, we divided the district weight by the number of principals, teachers, or both combined, and assigned each respondent the resultant weight. For example, if 120 districts are in the upper stratum and we have data from 40 districts in the same stratum, the district weight is 3 (120/40). If two principals and 10 teachers are in the sample from a given district, the individual principal weight is 3/2 or 1.5. The individual teacher weight is 3/10 or .3 and the combined weight for analyses using both principal and teacher data is 3/12 or .25. For the Big Four districts, we only have data from three of the four districts and hence each of the district weights is 4/3 or 1.333.
The student enrollment weight is calculated much the same way, but by using the aggregate enrollment of the districts in the strata and the total enrollment of each district. For example, if the aggregate enrollment of districts in the poorest third of the non-Big Five districts is 200,000 and a given district has a total enrollment of 10,000 students, the district weight is (200,000/10,000) or 20. Subsequently, if we have 15 respondents (2 principals and 13 teachers) the weight for each respondent is 20/15 or 1.333.

Killeen & Sipple: Mandating supplemental intervention services 10
Analytic Methods
Univariate Approaches We begin by presenting simple univariate means and standard deviations for two
distinct sets of variables. The first set of variables is related to the following AIS issues and relies on responses from principals only:
- Selection and termination criteria for students in AIS programming - Persons involved in the decision-making to assign students to AIS - Student participation - Planning - Scheduling - Staffing
The second set relies on teacher response and is related to the following issues: - Instructional and classroom organization practices - Instructional planning - Classroom environment We then test for significant statistical differences between subgroups of respondents. Using
the principal data to examine the logistics and scheduling of AIS, we analyze whether bi-variate differences exist between principals in NYC, the Big Four large city districts, and the non-Big Five districts. Subsequently, we use teacher data to assess any differences in instructional and classroom organization strategies between teachers responsible for AIS instruction and those teachers who are not responsible for the provisions of AIS.
Our survey also allowed for the collection of data from open-ended questions from both teachers and principals. We weave some of this qualitative data into our findings to help clarify and explicate the findings. Future studies will more fully describe this data.
Finally, we link the survey data with four years (1999-2003) of district performance and demographic data to examine the multivariate relationships between community wealth, district fiscal, demographic, and performance measures, and the AIS organizational and instructional strategies reported by principals and teachers. We use the publicly available Chapter 655 and School Report Card datafiles (1999-2003) to investigate demographic and performance differences and similarities between schools with different models of AIS programming, staffing, and scheduling.7 Multivariate Approaches
In order to effectively describe AIS practices and test for substantive differences across districts, we selected methods that would inform discussions of key AIS practices and the likelihood of their implementation given various contexts. The nested nature of the data (multiple teachers within districts) requires techniques other than ordinary least squares (OLS) regression models. Most of our regression models use either binary or categorical dependent variables as we tried to predict differences across contexts with specific AIS strategies. These robust regression estimates adjust the standard errors found in the correlated residuals
7 See http://www.emsc.nysed.gov/irts/655report/home.html and http://www.emsc.nysed.gov/irts/reportcard/home.html for the publicly available data.

Education Policy Analysis Archives Vol. 13 No. 19 11
stemming from the nested structure of the data (e.g., individuals within districts).8 Doing so properly accounts for the district-effect on the participants’ responses.
To serve as indicators of school district performance, we selected 8th grade ELA scores (district aggregates) both at the absolute level in 1999, and then a measure of change over time between 1999 and 2003. To calculate the change variable, we regressed the mean of the 2001/2 and 2002/3 scores on the mean of the 1999/0 and 2000/1 scores and saved the residuals as a new standardized variable. Hence, the indicator for change in 8th ELA performance over time has a mean of zero and one standard deviation above the mean of one. We chose these indicators given the time period during which we are collecting principal and teacher data on AIS programming (2003). Using the 1999 achievement levels, and then the growth in achievement in the initial years of AIS programming, we are able to analyze whether prior performance levels or gains in performance over time predict current AIS programming. It is not prudent at this time (though possible in future years) to use AIS programming to predict current achievement levels given the lag time necessary for the treatment (i.e., AIS) to have an effect on achievement.
The estimates reported are odds-ratios and are easily interpreted. For example, a value of one (1) indicates even odds of occurrence at different levels of the independent variable or between comparison groups. Any significant value greater than one indicates an increased likelihood of occurrence (e.g., a value of two indicates the practice is twice as likely as the comparison group) and any significant value less than one indicates a reduced likelihood of occurrence when compared with the comparison group (e.g., an odds ratios of .50 would indicate that the practice is only 50% as likely to be used as the comparison group).
Findings
We report our findings in four steps. We begin with simple descriptive (univariate and bi-variate) measures of organizational/structural strategies followed by instructional strategies and priorities. We then report multi-variate regression results for the organizational/structural strategies and then for instructional strategies. AIS Organizational/Structural Arrangements
Student Assignment How are students enrolled and dismissed from AIS programs? In this line of
questioning, principals were asked to weigh various criteria used to warrant the provision of AIS services to students as well as indicate the people typically involved in this decision. In summary, administrative decisions rely heavily on standardized tests, report cards, and guidance counselor recommendations to both provide and suspend AIS services for students. Criteria such as classroom behavior and student attendance do not factor heavily in this process.
8 We used xtlogit and ologit in Stata to conduct logistic regression analyses while adjusting for the effect of clustered responses.

Killeen & Sipple: Mandating supplemental intervention services 12
Generally across the state, formal report card grades and student performance on standardized tests factor heavily into the decision of administrators to provide AIS services to students. Of the two, student performance on standardized exams (including state exams) is more important in AIS placements. Principals representing 70% of all districts indicate that test scores on these exams are very important. Student attendance and classroom behavioral issues seem fairly unimportant in the decision-making process. Of those adults able to make recommendations regarding AIS placement, it appears that the recommendation of the guidance counselor is most important, with teacher and then parent recommendations being less important.
Yet when principals were asked how they would change their current AIS program, several noted that they would make improvements to the process of identifying AIS students. For example, principals commented that they would identify students earlier. One principal commented, “What we need to do is more timely diagnostics so we catch problems earlier.” Another principal explained the problem of identifying students for AIS services on outdated 4th grade test scores, “There are no exams in 5th and 6th grade, just the 4th grade exams. They come into 7th grade based on their 4th grade exams.” Still another principal commented that receiving the scores from NYS earlier would help, “I would like to see the test results back from NYS earlier, to identify earlier.”
Other principals commented on the characteristics of the student population identified for AIS. One principal noted:
I would take the special education students out of AIS - I don't believe they need that and it takes away from time that could be given to other students. They're already identified and receiving special education services and they're supposed to receive additional services, which is kind of a double dip but we're mandated to do that.
Other principals noted that they would expand the program to serve more kids in need of assistance. For example, one principal commented, “I would have more funding for additional staff so that we could service the kids who got twos on the state exams as well as we service the [students] who got ones.”
Interestingly, principals in NYC schools reported a heavier reliance on a wider number of criteria used to identify students for AIS in comparison with their counterparts upstate. While all districts tended to rely on performance exams equally, administrators in NYC indicated that report cards were more heavily utilized in their schools compared to upstate districts. Similarly, NYC districts relied more on parent recommendations, classroom behavior, and attendance than upstate schools.
Are the same criteria and individuals involved in the decision to terminate services? Report cards, tests, and the recommendation of the guidance counselor are most salient in terminating AIS services for students. Parents, attendance, and classroom behavior are not very important. Yet, when principals were asked about what they would change with their current AIS program, some noted the need for more flexibility in testing to decide whether to terminate. For example, one principal commented, “I would give the student the ability to test out of AIS. At this point, the only way a student can get out is with the next State exam.”
Principals were also asked to indicate which people were more or less involved in AIS programming decisions. Individuals were ranked on a scale as either not involved or very involved. Predictably, administrators and school counselors are very involved, as are teachers. Statewide, principals representing 31.1% of districts said that parents were involved in the

Education Policy Analysis Archives Vol. 13 No. 19 13
decision to grant AIS services. Twenty-eight percent (28%) of districts report that parents were important in the termination of AIS services. What stands out, however, is the absence of student involvement in the AIS programming decisions. Principals representing 63.7% of districts stated that students were not very involved in these decisions.
In contrast, NYC districts tended to have much greater involvement with parents and students in AIS programming than did the non-NYC districts. For example, the average involvement score for student participation in the AIS programming process was a 2.08 among upstate districts. However, among NYC schools, that same score was 3.32. When asked to name other individuals typically involved in this process, a great number of principals stated that central office administrators like directors of curriculum, as well as school psychologists and social workers, were also very involved.
Enrollment In general, AIS services are provided to far greater proportions of students in urban
districts than among upstate districts. Statewide, principals report that approximately one-third (31.1%) of their students receive AIS services. Among these students, 36% also receive special education services. By comparison, principals report that 56% of their students in NYC schools and 51% of their students in Big Four schools receive AIS programming. More than half of NYC AIS students also qualify for special education services as well.
However, principals in non-Big Five districts report that 6% of students that qualify for AIS do not receive services for one reason or another. In NYC, principals report that 15.3% of their students qualified to receive AIS do not actually receive those services. When asked to identify the primary reason for the discrepancy between the number of students who qualify for AIS but do not receive AIS instruction, the answers fell into one of three categories. First, principals stated that student absenteeism from school and AIS classes is a large issue. Some students simply avoid the AIS class and/or school altogether. Second, as there are no rules about compulsory AIS attendance, parents will often disallow students to attend AIS classes. Third, some schools have tremendous difficulty scheduling all students for AIS given their tight course schedules. Only a handful of principals mentioned transportation issues.
Staffing In general, multiple educators are employed to carry out AIS services. In 55% of
districts, principals reported that designated AIS teachers staff AIS services. Over 60% of districts have special education teachers employed in AIS services.
We inquired as to collaborative arrangements for AIS instruction and teaching models. Specifically, principals were asked whether co-teaching or consulting models existed. For example, this would be when special education or AIS teachers pushed into programs within regular classes. Sixty-two percent (62%) of districts followed this approachThis lends credence to the earlier findings that found about the same percentages for push-in and pull-out AIS service delivery mechanisms.
Yet, many principals spoke about the need for additional staff, most specifically to reduce class size and provide more individualized instruction. One principal commented, “Increase staffing and increase time for planning of delivery of individualized services.” In fact, when asked what would they change about their current AIS program, more principals responded that they would increase the number of staff than any other reported change. Staff included teachers, counselors, social workers, and paraprofessionals. One principal explained,

Killeen & Sipple: Mandating supplemental intervention services 14
“I would try and hire more staff or faculty so that we could differentiate some instruction in the areas that we currently do not, in science and in English, and also we'd like to add social studies.”
Scheduling AIS program patterns are multifaceted, and as such are difficult to generalize across the
state. Following a brief introduction to the section, we present and discuss some basic patterns to AIS program scheduling as well as some relationships between scheduling models. Though multiple scheduling models exist, and in any one school several models may be in place, we suspect that the prevalence of schools with two or more AIS delivery models per subject is actually small. The correlation evidence presented below supports this assertion.
Overall, English and math AIS programs are more common than other subject area AIS programs. Principals report that AIS is universally provided for English and Math subjects. While a little over eighty percent (80%) of districts report some social studies AIS and 76% report some science AIS programming.
For each subject area, the provision of AIS services occurs both during and outside of regular school hours. In the case of English AIS for example, approximately half of all districts manage AIS English either before or after school hours. However, we are unable to tell what programs are exclusively “in-school” versus “out-of-school”, or a blend of the two. As such, these overlapping conditions frustrate a clear and cogent description of AIS program scheduling patterns or model identification.
Interestingly, though more than half of all districts run AIS before or after school, when principals were asked what they would change about their AIS program, many commented that they would prefer to integrate the programs into the school day. For example, one principal said, “I would find a way to include more AIS during the school day. What happens is the kids could go to any school in the district and because of that, it is hard to schedule AIS after school. So I would like to build AIS into the schedule. I would need a little more money.” Principals’ comments suggest that when AIS is before or after school, students do not necessarily attend. Yet, if AIS is going to be effective, principals argue, students should be required to go. This is better ensured if AIS is provided during the school day. Another principal commented, “Provide funding to do AIS as part of the regular program during the day instead of after school…add an extra period so the students don't see as it as optional.”
A chief difference among AIS program scheduling appears to be the strength of their association with regular subject area classes. Akin to special education delivery models, the scheduling of AIS programs may be inclusionary in nature or held in self-contained classrooms. It is also true that schools may elect to schedule AIS programs in more than one way. We believe there are four general categories to AIS scheduling: Model 1. AIS inside the regular classroom
(Characterized as inclusive) Model 2. AIS held during classtime, outside the regular classroom
(Characterized as self-contained, pull-out) Model 3. AIS held in addition to the regular classroom, in lieu of electives (Characterized as self-contained and additive) Model 4. AIS held in place of the regular class
(Characterized as self-contained and supplanting)

Education Policy Analysis Archives Vol. 13 No. 19 15
In the first model, principals report that more than a third of students receive English AIS programming within the regular education classroom. We suspect that this first model includes AIS activity and programming during the regularly scheduled class session. However, it is unclear if the schedule involves instruction with a designated AIS teacher, or the regular education teacher performing AIS activities.
In the second model, principals report that a third of all students are drawn outside of their regular English class for AIS programming. Although students are drawn out of and thus away from the regular classroom, we believe principals still interpret these programs as supplementary or additive because they are so closely associated with the regular classroom. There is no statistically significant difference (p<.01) between these proportions among the city and upstate school districts. However, the means trend towards a higher proportion of students (47%) in NYC participating in this pullout model, compared with students (32%) in upstate school districts.
The third model appears to have less connectivity with regular education classrooms. When asked if students were placed in a specific AIS class that meets in addition to regular English class, principals representing 82% of districts respond affirmatively. Note however that this proportion is somewhat higher and somewhat in conflict with the second model described above. This third AIS model appears to be administered separately from the regular subject area class, and is attended by students in lieu of their electives and traditional study halls. In the case of English AIS, principals representing 48% of districts (and 47.7% of students) report that AIS is offered in lieu of study halls, and 44% of districts allow for electives such as art, music, and foreign language to be replaced. There is no statistically significant difference between these proportions among the city and upstate school districts. There is no statistical difference between the proportion of districts affected in this “additional” model among the city and upstate school districts.
In the last model, and consistent with prior research, we asked the question of whether academic intervention services were being offered in place of regular education or in addition to regular education classes. Prior case study research couched these differences as either supplementary (an additive program service) or supplanting (a replacement program service) (see Sipple, Killeen, and Monk, 2004). As was the case in this prior research, a number of districts representing a large proportion of children do report that AIS programs are being substituted for regular education classes. For example, principals representing 13% of districts offer English AIS instead of regular classes. This finding is also reinforced by answers to the contrary question. Principals representing 81% of districts report that English AIS programs are offered in addition to regular classes. These basic patterns hold across subject areas and do not appear to differ between urban and upstate districts.
As previously mentioned, we believe some schools elect to administer AIS programs through a variety of scheduling models. Given this, we also calculated the strength of the association between principal responses to survey items using Pearson correlations on unweighted response data9. In the case of English AIS, if programs are run either before or after school, then there is a tendency to not run the programs in place of electives (r = -.14; p < .05). This type of modest association is consistent for subject areas like English and
9 The strength of several correlations and their significance levels are reported as necessary. Tables showing the correlations for each survey item in this section are available upon request to the authors, but are not included in this report.

Killeen & Sipple: Mandating supplemental intervention services 16
mathematics. In the sciences, however, the strength and frequency of the item associations increase, again likely due to the inability to fit additional sections of AIS into the regular school day.
AIS science scheduling may create unique issues within schools given the need for specialized lab equipment that is not easily moved around in school facilities. Again, we draw on relationships between responses from principals. If AIS science is offered in place of the regular education class, it appears to be associated with replacing electives as well (r = .28; p < .05). The strength of this association indicates that at least some of the “supplanting” AIS models mentioned earlier include AIS science classes. Interestingly, if AIS science is offered in addition to the regular education class, then it is slightly more associated with the replacement of electives (r = .32; p < .05). In this instance, it seems likely that AIS science may actually be offered as a separate lab. The association between AIS science being offered outside of the regular class and in a designated AIS academic lab is modestly strong (r = .33; p < .05).
In summary, AIS programming is delivered for each subject area (English, math, science, and social studies) in the vast majority of NYS school districts. A key distinction among AIS scheduling models is the degree to which the AIS model is associated with the regular education class, similar to the typical variations in self-contained and inclusive special education service models. Though schools may deliver multiple AIS models for each subject, the prevalence of such practices among districts appears small. Instruction
Our focus on AIS classroom instruction hinges on whether instructional strategies in AIS classes differ from those found in regular subject area classes. The survey asked teachers to focus on one particular class they taught during the week. We then asked teachers to describe this class, and to respond to a set of general instructional questions and subject-specific instructional questions related to this class.
Whereas the principals report a global estimate for AIS participation, we asked teachers to report on a specific class period. Over the full sample of more than 500 teachers, we have in essence, a random sample of classes taught across the state at a given point in time. Responding to a specific class they are actually teaching, we asked teachers to report both their class enrollment and AIS enrollment, and whether or not the teacher is required to provide AIS instruction in that class. For the Big Four and other non-NYC Needs Resource Capacity Categories, the teachers’ reports do closely mirror the principals. For instance, teachers in Big Four districts report 44% of their students as AIS students (43% for principals) and in average need districts, teachers report 32% AIS students and principals 28%. In NYC, however, the teachers (29%) report a far smaller proportion of AIS students than do principals (56%).
The typical classroom portrait based on the current teacher sample has, on average, 19 students, with eight of the students receiving AIS services. As a proportion (43%) this figure is slightly higher than the figure reported by their principals. Teachers in one-third (33%) of districts had no AIS students in their classroom, teachers in 14% of districts reported having only AIS students in their classrooms, and teachers in 50% of districts reported a mixed classroom with both AIS and non-AIS students. In addition, 17%, or approximately three of

Education Policy Analysis Archives Vol. 13 No. 19 17
Table 2 AIS Class Descriptive Statistics (Teacher Report)
Need Resource Capacity Index
Teacher Required to Give AIS?
# of Students in Class
# AIS Students in class % AIS Students
Mean 21.7 15.9 76.8% Yes Std. Dev. 7.9 10.6 Mean 27.3 3.5 13.8% No Std. Dev. 6.2 6.0 Mean 25.9 6.3 28.7%
NYC
Total Std. Dev. 7.0 8.9 Mean 24.0 15.4 65.6% Yes Std. Dev. 9.3 12.1 Mean 25.6 5.6 18.9% No Std. Dev. 12.2 16.4 Mean 24.8 10.8 43.7%
Big Four
Total Std. Dev. 8.5 11.8 Mean 14.7 9.2 77.2% Yes Std. Dev. 8.0 6.1 Mean 21.2 4.4 21.0% No Std. Dev. 4.6 6.3 Mean 18.9 6.0 40.2%
High Need Urb/Sub
Total Std. Dev. 6.6 6.6 Mean 11.6 7.7 80.4% Yes Std. Dev. 7.4 4.5 Mean 18.0 3.0 16.6% No Std. Dev. 5.1 3.9 Mean 16.4 4.2 31.9%
High Need Rural
Total Std. Dev. 6.3 4.5 Mean 16.3 8.7 69.4% Yes Std. Dev. 9.4 5.9 Mean 21.6 2.7 13.3% No Std. Dev. 5.1 3.0 Mean 19.8 4.8 33.0%
Ave Need
Total Std. Dev. 7.3 5.1 Mean 17.1 9.8 66.3% Yes Std. Dev. 9.1 8.9 Mean 22.6 1.5 7.6% No Std. Dev. 5.4 3.5 Mean 21.3 3.5 21.4%
Low Need
Total Std. Dev. 6.7 6.2 Mean 16.0 9.7 73.5% Yes Std. Dev. 8.9 7.1 Mean 21.6 3.0 14.4% No Std. Dev. 6.1 4.4 Mean 20.0 4.9 31.5%
Total
Total Std. Dev. 7.5 6.1

Killeen & Sipple: Mandating supplemental intervention services 18
the 19 students, were receiving non-academic AIS services such as counseling, nutrition, or health assistance. Teachers also reported, on average, that an additional 11% of students in this classroom could benefit from AIS services but were not receiving them. This latter figure is within the range reported by principals.
Comparing classes taught by a teacher responsible for providing AIS instruction versus those who are not responsible, the class makeup is quite different (see Table 2). Class sizes are consistently smaller for teachers responsible for AIS instruction (e.g., 22 vs. 27 in NYC, 15 vs. 21 in High Need Rural Districts) and the proportion of AIS students is consistently higher (e.g., 77% vs. 13% in NYC, 66% vs. 19% in the Big Four, and 80% vs. 17% in High-Need-Rural).
Principals in non-Big Five districts report that 6% of students that qualify for AIS do not receive services for one reason or another. In NYC, however, principals report that 15.3% of their students qualified to receive AIS do not actually receive those services.
Modal Model of Instruction Teachers report that whole class instruction is the most common mode of instructional
delivery. By way of actual pedagogy, popular delivery methods include straight lecture, whole group discussion, and/or oral responses to individual student questions (See Table 3). Teachers were asked the percentage of time they spent on various practices necessary to provide instruction in their classroom. On average, teachers representing 52% of students report spending most of their time (50-100%) instructing the whole class. In this sense, teachers spend the majority of student seat time focused on instructional delivery. They report only spending small amounts of time spent on maintaining order and discipline and performing routine administrative tasks.
Teachers were also asked more specific questions about how often they use more detailed teaching methods and instructional media (see Table 4). Most students, according to teachers, are engaged in oral question and answer sessions several times per week. Teachers often lead whole group discussions, and other times students work cooperatively in teams or complete individualized writing assignments in class. Several teaching methods are less frequently used, including lecturing as well as computer work.
AIS versus non-AIS instruction To examine whether AIS instruction is distinct from non-AIS instruction, we
compared the responses of teachers who were responsible for AIS instruction in this particular class to those teachers who were not responsible for AIS instruction in the class. AIS teachers distinguish themselves from non-AIS teachers through their utilization of small group interactions with students (see Table 3). While lecture and whole class discussion was the modal model for all teachers, those teachers responsible for delivering AIS instruction reported using small-group and individual instruction more frequently, and using lecture/whole group methods less frequently than those teachers not responsible for delivering AIS in this classroom. They report more individualized or one-on-one attention with students. Although teachers report administering tests and quizzes less frequently in AIS classes than in non-AIS classes, they are more likely to teach test taking skills (see Table 5).

T
able
3
Am
ount
of T
ime
Tea
cher
Spe
nds
on K
ey A
ctiv
ities
in th
e C
lass
room
(by
AIS
Tea
cher
/Non
-AIS
Tea
cher
) In
dica
te
abou
t w
hat
perc
ent
of
clas
s tim
e is
spen
t in
a ty
pica
l wee
k do
ing
each
of
the
follo
win
g w
ith
this
clas
s
S
cale
Dist
ribut
ion
as P
erce
ntag
e of
all
Teac
hers
M
ean
for
ALL
te
ache
rs
>10
%
10-2
4%
25-
49%
50
-74%
75
-100
%
Mea
n fo
r Te
ache
rs
Resp
onsib
le fo
r A
IS
Mea
n fo
r Te
ache
rs N
OT
Resp
onsib
le fo
r A
IS
Prov
idin
g in
stru
ctio
n to
the
cla
ss
as a
who
le 3.
65
8.39
10
.49
29.3
7 33
.57
18.1
8 **
3.43
3.
78
Prov
idin
g in
stru
ctio
n to
indi
vidu
al
stud
ents
2.
40
7.75
40
.14
22.5
4 14
.79
14.7
9 **
2.89
2.
26
Prov
idin
g in
stru
ctio
n to
sm
all
grou
ps o
f stu
dent
s 2.
34
20.5
7 32
.62
25.5
3 7.
80
13.4
8 **
2.61
2.
14
Mai
ntai
ning
or
der/
disc
iplin
ing
stud
ents
1.
44
71.5
3 17
.36
3.47
1.
39
6.25
1.
53
1.51
Adm
inist
erin
g te
sts o
r qui
zzes
1.
68
52.4
5 40
.56
5.59
0.
70
0.70
**
1.57
1.
75
Perf
orm
ing
rout
ine
adm
inist
rativ
e ta
sks
1.27
84
.03
11.1
1 0.
69
0.69
3.
47
1.28
1.
28
Con
duct
ing
lab
perio
ds
1.56
67
.63
8.63
12
.23
4.32
7.
19
**1.
75
1.45
*p
<.1
0, *
*p<
.05

Kille
en &
Sip
ple: M
anda
ting s
upple
ment
al in
terve
ntion
serv
ices
20
T
able
4. F
requ
ency
of C
lass
room
Ins
truc
tiona
l Met
hods
by
Tea
cher
Typ
e (b
y A
IS T
each
er/N
on-A
IS T
each
er)
*p<
.10,
**p
<.0
5
How
ofte
n do
you
use
th
e fo
llow
ing
teac
hing
m
etho
d or
med
ia
Resp
onse
M
ean
for A
LL
teac
hers
Nev
er/r
arel
y
1- 2x/m
ont
h
1- 2x/w
eek
Alm
ost
ever
yda
y
ever
yday
M
ean
for T
each
ers
Res
pons
ible
for A
IS
inst
ruct
ion
Mea
n fo
r Te
ache
rs N
OT
Resp
onsib
le fo
r A
IS in
stru
ctio
n Le
ctur
e 2.
42
24.7
5.
5 28
.1
24.7
17
.1
**2.
04
2.64
U
se C
ompu
ters
.9
9 42
.1
19.3
24
.1
7.6
6.9
**1.
18
0.90
U
se A
udio
-visu
al m
ater
ial
1.65
24
.0
28.8
15
.8
12.3
19
.2
1.74
1.
78
Hav
e te
ache
r-le
d w
hole
gr
oup
disc
ussio
n 2.
59
10.3
8.
2 24
.0
26.7
30
.8
2.60
2.
60
Hav
e st
uden
ts re
spon
d or
ally
to q
uest
ions
on
a su
bjec
t mat
ter
3.61
0.
7
10.9
17
.0
71.4
3.
59
3.65
Hav
e st
uden
t-led
who
le
grou
p di
scus
sions
1.
49
33.3
15
.0
24.5
8.
2 19
.0
**1.
65
1.35
Hav
e st
uden
ts w
ork
toge
ther
in c
oope
rativ
e gr
oups
2.45
6.
1 17
.0
29.3
21
.8
25.9
2.
44
2.32
Hav
e st
uden
ts c
ompl
ete
indi
vidu
al w
ritte
n as
signm
ents
or
wor
kshe
ets i
n cl
ass
2.36
6.
2 6.
2 32
.2
30.1
25
.3
**2.
62
2.33
Hav
e st
uden
ts g
ive
oral
re
port
s .7
5 58
.5
27.2
10
.2
2.0
2.0
0.62
0.
66

Edu
catio
n Po
licy A
nalys
is A
rchive
s V
ol. 1
3 N
o. 19
2
1
T
able
5
Wha
t Stu
dent
s do
in a
n A
IS C
lass
room
(by
AIS
Tea
cher
/Non
AIS
Tea
cher
)
Doe
s AIS
inst
ruct
ion
in th
is de
partm
ent/
team
, typ
icall
y ha
ve
stud
ents
……
Mea
n Re
spon
se
Re
spon
se fo
r ALL
te
ache
rs
Teac
hers
Re
spon
sible
for
AIS
inst
ruct
ion
Teac
hers
NO
T Re
spon
sible
fo
r AIS
inst
ruct
ion
Lear
n ba
sic sk
ills
1.13
1.
09
1.13
Re
view
cor
e co
ncep
ts
1.05
1.
02
1.05
Le
arn
test
taki
ng sk
ills
1.13
**
1.07
1.
14
Oth
er
1.50
**
1.38
1.
56
*p<
.10,
**p
<.0
5

Several teachers (non-AIS and AIS), when asked what they would change about their
AIS program, noted that they would decrease the number of AIS students in a class or group. In fact, this was one of the most common responses. Teachers made such comments as, “I'd like to get class size down,” “More teachers with support of aides. Lower teacher to student ratio with administrative support,” and “I would have smaller groups, no more than 10, for those that qualify. On an as need basis if they need it, for a shortened time period.” On the whole, teachers reported spending comparable amounts of time on routine administrative tasks and on issues regarding classroom behavior. We found no evidence to support a claim that AIS teachers contend with greater classroom conflict and student discipline issues than non-AIS teachers.
Classroom instruction strategies do differ across academic subject areas between the two groups of teachers. However, these differences are not dramatic and only appear in certain instances. For example, AIS English teachers reported requiring students to read novels, plays, essays, etc. less often than non-AIS English teachers (see Table 6). Yet, there appear to be no differences in letting children choose their own reading material, discussing assigned reading materials, or even the focus on technical aspects of writing. In the case of math, teachers in AIS classrooms report more frequent attention to the importance of math in daily life. However, on many other common items, there appear to be no other significant differences. Issues such as the memorization of facts, rules and steps, understanding the nature of proofs, and even items such as performing calculations with speed and accuracy appear to receive even attention in both the AIS and non-AIS classroom.
Interestingly, when math teachers were asked whether they focus on increasing students’ interest in math, there was no difference among AIS vs. non-AIS classrooms (see Table 7). This is significant given that one of the major barriers to the effectiveness of AIS reported by teachers was student motivation and participation. In fact, student participation/engagement was the most common response by teachers when asked what the biggest challenge for AIS students in meeting the learning and graduation requirements. For example, one teacher noted, “Motivation; lower level learners struggle so much it's hard to get them interested.” This included getting students to AIS as well as their motivation once they were in the AIS setting. For example, one teacher commented, “Making sure the students who need the services are in the class.” Another teacher noted, “All of the kids who did their homework regularly are out of AIS this year. Those who didn't are still in it.” Multivariate Analyses of AIS Programming
Having presented basic descriptive statistics, frequencies, and correlations of AIS organization and practice, we relate these practices with wealth, performance, and relevant teacher and classroom characteristics. In other words, we ask whether certain practices are more or less prevalent in wealthy communities, in districts with higher levels of academic performance, or in districts that have made greater gains in performance, since the implementation of the new Regents Standards and AIS regulation. In this study, we focus on three sets of AIS-related practices: scheduling, elements of instruction, and teacher planning for AIS.

Tab
le 6
D
escr
iptiv
e St
atis
tics
for E
nglis
h T
each
er I
nstr
uctio
n (b
y A
IS T
each
er/N
on-A
IS T
each
er)
How
ofte
n do
you
und
erta
ke
each
of
the
follo
win
g ac
tiviti
es
in th
is cl
ass?
Resp
onse
1
2
3
4
5
V
ery
Rare
ly 1
-2x/
mon
th o
nce
a w
eek
2-3
x/w
eek
eve
ryda
y
M
ean
for
All
EN
GLI
SH
Te
ache
rs
Ver
y ra
rely
1- 2x/m
onth
O
nce
a w
eek
2- 3x/w
eek
ever
yday
M
ean
for
Tea
cher
s R
espo
nsib
le fo
r A
IS in
stru
ctio
n
Mea
n fo
r T
each
ers
NO
T
Res
pons
ible
for
AIS
inst
ruct
ion
Allo
w s
tude
nts
to c
hoos
e th
eir
own
read
ing
mat
eria
l; 2.
65
32.1
26
.2
10.7
6.
0 25
.0
2.65
2.
37
Show
fil
ms,
film
strip
s, or
vi
deot
apes
1.
49
63.1
35
.7
0 1.
2 0
**1.
39
1.60
Hav
e st
uden
ts g
ive
oral
repo
rts
1.90
48
.8
36.9
8.
3 2.
4 3.
6 1.
75
1.81
Re
quire
w
ritte
n re
ports
on
re
adin
gs
2.75
26
.2
25.0
23
.8
17.9
7.
1 2.
55
2.78
Disc
uss
assig
ned
read
ing
mat
erial
4.
24
4.8
6.0
7.1
26.2
56
.0
4.23
4.
31
Hav
e st
uden
ts
read
no
vels,
pl
ays,
essa
ys, e
tc.
3.97
13
.3
10.8
7.
2 15
.7
53.0
*3
.84
4.15
Hav
e st
uden
ts w
rite
impr
ompt
u es
says
2.
46
19.0
40
.5
16.7
17
.9
6.0
2.51
2.
39
Dev
ote
atte
ntio
n to
the
sta
ges
of th
e w
ritin
g pr
oces
s 3.
65
2.4
14.5
14
.5
34.9
33
.7
*3.8
3 3.
53
Dev
ote
atte
ntio
n to
te
chni
cal
aspe
cts a
nd sk
ills o
f writ
ing
3.65
4.
8 13
.1
19.0
29
.8
33.3
3.
74
3.63
Hav
e st
uden
ts w
rite
in s
tyle
s th
at e
ncou
rage
the
ir em
otio
nal
and
imag
inat
ive
deve
lopm
ent
2.85
17
.9
27.4
13
.1
26.2
15
.5
2.94
2.
78
*p<
.10,
**p
<.0
5

Kille
en &
Sip
ple: M
anda
ting s
upple
ment
al in
terve
ntion
serv
ices
24
T
able
7
Des
crip
tive
Stat
istic
s fo
r Mat
hem
atic
s T
each
er I
nstr
uctio
n H
ow m
uch
emph
asis
do y
ou
give
to e
ach
of th
e fo
llow
ing
obje
ctiv
es?
Resp
onse
1
2
3
4
Non
e
Min
or M
oder
ate
Maj
or
M
ean
resp
onse
for
all M
ATH
te
ache
rs
Non
e M
inor
M
oder
ate
M
ajor
M
ean
for
Tea
cher
s R
espo
nsib
le fo
r A
IS in
stru
ctio
n
Mea
n fo
r T
each
ers
NO
T
Res
pons
ible
for
AIS
inst
ruct
ion
Und
erst
andi
ng th
e na
ture
of
proo
fs
2.29
37
.1
32.3
22
.6
8.1
2.02
2.
24
Mem
oriz
ing
fact
s, ru
les a
nd
step
s 3.
15
1.6
16.1
50
.0
32.3
3.
13
3.16
Lear
ning
to re
pres
ent p
robl
em
stru
ctur
es in
mul
tiple
way
s 3.
76
0 1.
6 19
.4
79.0
3.
77
3.73
Inte
grat
ing
diff
eren
t bra
nche
s of
mat
hem
atic
s 3.
48
0 4.
8 45
.2
50.0
3.
45
3.47
Con
ceiv
ing
and
anal
yzin
g ef
fect
iven
ess o
f mul
tiple
ap
proa
ches
to p
robl
em so
lvin
g
3.59
0
3.2
30.6
66
.1
3.63
3.
57
Perf
orm
ing
calc
ulat
ions
with
sp
eed
and
accu
racy
2.
90
6.5
17.7
54
.8
21.0
2.
90
2.95
Show
ing
impo
rtanc
e of
mat
h in
da
ily li
fe
3.52
1.
6 3.
2 24
.2
71.0
**
3.65
3.
47
Solv
ing
equa
tions
3.
50
0 4.
8 46
.8
48.4
3.
44
3.45
Ra
ising
que
stio
ns a
nd
form
ulat
ing
conj
ectu
re
3.34
1.
6 16
.1
37.1
45
.2
3.26
3.
32
Incr
easin
g st
uden
ts’ i
nter
est i
n m
ath
3.61
1.
6 1.
6 22
.6
74.2
3.
69
3.58
*p<
.10,
**p
<.0
5

Scheduling We first examine the contextual differences associated with (though not necessarily
caused by) the scheduling of AIS instructional time for students. Table 8 represents English AIS scheduling and Table 9 represents the scheduling of AIS in mathematics. In examining the possible times to schedule student AIS, three questions are important to answer: 1) Is AIS scheduled before and/or after regular school hours? 2) Are students missing electives or using study halls to ‘fit in’ AIS class time? 3) Is AIS class time for students scheduled during the regular Academic (English or Mathematics) class, outside of the regular Academic class, or in addition to the regular Academic class?
We have substantial qualitative evidence from principals and teachers that a major obstacle of their AIS programming is simply getting students to show up. Many noted that when AIS is not required (e.g., before or after school hours or voluntary in-school drop-centers) many students do not attend the designated AIS sessions.
The regression findings suggestthat while the absolute level of performance prior to implementation of AIS is unrelated to the availability of before or after school scheduling options, district change in performance over time (8th grade ELA scores) is positively related to scheduling AIS before or after school. It is important to note here that these scheduling options are not mutually exclusive and many districts use any number of combinations of scheduling options. Neither community wealth (property wealth or income wealth) nor the proportions of poor children (% frpl) are related to the use of before or after school AIS instruction. District size is positively associated with before and after school AIS with larger districts more likely to include the strategy. In terms of where the districts are located, NYC, the Big Four, and small city schools all have odds ratios over two (2) for English, though only small city schools are statistically significant different than the comparison group of rural districts. There are no significant differences between suburban and rural district practice, indicating the prevalence of this practice is roughly consistent across these districts, once controlling for size, wealth, and performance.

Tab
le 8
- L
ogis
tic R
egre
ssio
n E
stim
ates
of E
nglis
h A
IS S
ched
ulin
g O
ptio
ns (
Val
ues
are
Odd
s R
atio
s)
Eng
lish
AIS
Bef
/Afte
r S
choo
l Hrs
In P
lace
of
Ele
ctiv
esS
tudy
Hal
lA
cade
mic
La
bIn
Add
ition
to
Reg
Cla
ss
Inst
ead
of
Reg
ular
C
lass
Dur
ing
Reg
ular
C
lass
Out
side
of
Reg
ular
C
lass
z 8t
h E
LA '9
90.
950.
851.
52*
1.36
^0.
961.
57*
1.63
*0.
89z
Cha
nge
ELA
'99-
'03
1.65
^1.
051.
311.
141.
101.
221.
121.
23
Enr
ollm
ent/1
001.
01*
1.00
1.00
*1.
001.
001.
001.
001.
00z
%FR
PL
1.02
1.07
1.73
^1.
302.
21*
1.13
1.20
1.77
^P
rope
rty $
/Tap
u1.
001.
011.
001.
001.
000.
991.
01^
1.00
Inco
me
$/Ta
pu1.
001.
010.
971.
030.
991.
041.
001.
02
NYC
$7.
260.
370.
380.
17*
0.08
*2.
592.
480.
19*
Big
Fou
r2.
840.
20^
0.28
0.56
0.02
*0.
594.
020.
32^
Sm
all C
ity2.
61^
1.47
0.82
1.36
0.39
^1.
502.
070.
92S
ubur
ban
1.19
1.84
0.87
1.19
0.69
1.34
1.06
1.49
Teac
her&
0.74
0.65
*1.
380.
68^
1.00
1.48
1.54
*0.
78n=
494
(min
imum
; inc
lude
s pr
inci
pals
and
Eng
lish
teac
hers
)
Tab
le 9
- L
ogis
tic R
egre
ssio
n E
stim
ates
of M
athe
mat
ics
AIS
Sch
edul
ing
Opt
ions
(V
alue
s ar
e O
dds
Rat
ios)
Mat
hem
atic
s A
ISB
ef/A
fter
Sch
ool H
rsIn
Pla
ce o
f E
lect
ives
Stu
dy H
all
Aca
dem
ic
Lab
In A
dditi
on
to R
eg C
lass
Inst
ead
of
Reg
ular
C
lass
Dur
ing
Reg
ular
C
lass
Out
side
of
Reg
ular
C
lass
z 8t
h E
LA '9
91.
241.
131.
151.
011.
081.
051.
220.
94z
Cha
nge
ELA
'99-
'03
1.15
1.33
1.04
1.03
1.01
1.19
0.96
1.02
Enr
ollm
ent/1
001.
01^
1.00
1.00
1.00
*1.
001.
001.
001.
00z
%FR
PL
1.22
1.69
1.50
0.83
1.56
1.14
0.79
1.18
Pro
perty
$/T
apu
1.00
1.00
1.00
1.00
1.00
0.99
1.00
1.00
Inco
me
$/Ta
pu1.
001.
010.
981.
010.
981.
041.
011.
00
NYC
$6.
010.
290.
08*
0.20
^0.
11^
1.91
5.07
^0.
31B
ig F
our
0.57
0.23
0.14
*0.
25^
0.06
*0.
005.
17*
0.37
Sm
all C
ity1.
421.
480.
531.
090.
431.
501.
850.
48*
Sub
urba
n0.
851.
840.
731.
010.
711.
221.
120.
76
Teac
her&
0.77
0.68
^1.
43^
0.62
*1.
231.
90^
0.68
^0.
38*
n=47
6 (m
inim
um; i
nclu
des
prin
cipa
ls a
nd m
athe
mat
ics
teac
hers
)*
p² .0
5, ^
p² .
10z
= S
tand
ardi
zed
Val
ues
$ =
Wea
lth&
Com
paris
on g
roup
is p
rinci
pals
$ C
ompa
rison
gro
up fo
r al
l urb
anic
ities
is r
ural

Edu
catio
n Po
licy A
nalys
is A
rchive
s V
ol. 1
3 N
o. 19
2
7
Tab
le 1
0 -
Ord
inal
Log
it R
egre
ssio
n M
odel
s fo
r In
stru
ctio
n
S3Q
9_A
% T
ime
Inst
ruct
W
hole
Cla
ss
% T
ime
Inst
ruct
In
divi
dual
s
% T
ime
Inst
ruct
S
mal
l G
roup
s
% T
ime
Mai
ntai
ning
O
rder
How
Ofte
n T
each
er L
ed
Dis
cuss
ion
How
Ofte
n S
tude
nt L
ed
Dis
cuss
ion
Inst
ruct
Tes
t-T
akin
g S
trat
egie
s (Y
/N)
z 8t
h E
LA '9
91.
47^
0.83
1.18
0.61
*1.
37^
0.90
1.07
z C
hang
e E
LA 9
9-03
0.95
1.13
1.30
0.56
*0.
64*
0.85
1.03
Dis
t Enr
ollm
ent/1
001.
001.
00^
1.00
1.00
*0.
99*
1.00
1.00
z %
FR
PL
1.53
0.96
1.11
0.23
*0.
730.
950.
79P
rope
rty
$/T
apu
0.99
*1.
00*
1.00
1.00
1.00
*1.
001.
01In
com
e $/
Tap
u0.
971.
001.
020.
94^
0.99
1.03
*1.
05
NY
C$
0.19
*0.
492.
0345
.96
*16
.76
*0.
940.
77B
ig F
our
0.69
0.89
1.70
19.9
9*
12.4
4*
1.61
2.42
Sm
all C
ity1.
001.
120.
47*
1.57
1.19
0.64
^0.
73S
ubur
ban
1.69
0.98
0.42
*0.
760.
900.
660.
88
Eng
lish
Tea
cher
&1.
061.
36^
1.61
*1.
43^
0.89
1.69
*2.
05*
Res
pons
ible
for
AIS
0.67
1.50
^1.
280.
601.
141.
64*
3.31
*C
lass
Siz
e1.
03^
0.94
*0.
97^
1.03
1.03
*1.
000.
96%
AIS
Stu
dent
s in
cla
ss0.
901.
602.
13*
4.18
*1.
230.
750.
67*
p² .0
5, ^
p²
.10
n(m
inim
um)=
454
teac
hers
, unw
eigh
ted
z =
Sta
ndar
dize
d V
alue
s$
= W
ealth
& C
ompa
rison
gro
up is
Mat
hem
atic
s Te
ache
rs$
Com
paris
on g
roup
for
all u
rban
iciti
es is
Rur
al

A popular concern is that some students will be unable to take elective courses as their AIS classes are scheduled in place of the electives. Is this scheduling phenomenon more likely to take place in poor districts, with poor students, or in small rural districts with fewer scheduling options? The findings suggest that the scheduling of AIS in place of electives is not associated with the measures of performance, wealth, or size, and is only related to location in that the Big Four educators are less likely to report this practice than those in rural areas. While only approaching significance, it does appear that this practice may be more likely in wealthier and more suburban communities than in the urban or rural areas. Further investigation should attempt to determine if this is because of the reduced reliance of before and after school options in the suburban districts, and hence greater pressure placed on student schedules, than in districts where before and after school times are used for AIS.
Once controlling for urbanicity, greater proportions of poor children are strongly related to using study halls for English AIS services. The use of study halls for AIS is also positively related to district enrollment. Finally, districts averaging one standard deviation more than others on the 1999 8th grade ELA exams are one and one-half times as likely to use study halls. Perhaps this signals a complacency of higher performing districts to simply use study halls rather than creating more specific AIS programming.
The AIS regulations require additional instruction for under-performing students, though the details of exactly how to implement are left up to local districts. We have already shared evidence that most school districts are scheduling AIS time in addition to regular academic classes, though we also see that some districts are substituting an AIS version of the course for the regular academic class. Alternatively, districts may provide additional instruction via a class that pulls students out of their regular subject area classes. Another model is to push AIS instruction into the regular English class, or require the regular English teacher to provide the AIS services. Again, many of these options are not mutually exclusive. The regression results indicate that higher performing districts are more likely to offer AIS instruction during the regularly scheduled English classes (possibly via pushing support staff into regular classes or requiring the regular academic teacher to provide AIS). The wealth and size variables are generally not significant, though the measure of property wealth (1.01) may suggest an increased prevalence of offering AIS during the regular academic class time in communities with greater property wealth. NYC and the Big Four are several times more likely than rural districts to provide instruction during regular class time. No difference exists between rural and suburban districts.
With regard to which districts provide AIS services in addition to regular academic classes, the results are quite clear. Once controlling for performance and wealth variables, urban districts of all types are less likely to provide AIS in addition to regular academic classes. In fact, NYC, the Big Four, and small cities are only 8%, 2% and 39% as likely, respectively, as rural districts to provide AIS in addition to regular academic classes. There is no significant difference between suburban and rural districts. Of note, for both English (significant) and math (only approaching significance) and controlling for urbanicity, districts serving greater proportions of poor children are associated with a practice of providing AIS in addition to regular academic classes.
It is important to note that the aforementioned strategies are not necessarily mutually exclusive. It is plausible, and further analyses will tease this out, that some districts offer AIS

Education Policy Analysis Archives Vol. 13 No. 19 29
before school, during regularly scheduled academic classes, and also in addition to regular academic classes. Other districts may limit their AIS programming to one scheduling model.
Instruction Turning to the measures of classroom instruction (See Table 10), we sought to
document general classroom organization and pedagogical strategies, and then determine whether differences exist between teacher types (e.g., English vs. mathematics, responsible for AIS vs. not responsible for AIS) and across district (e.g., wealth, location) and classroom (e.g., class size, proportion of AIS students in the class) contexts. While we reported on many measures above in the descriptive sections, here we focus on three important sets of indicators for instruction.
How does the percent of classroom time spent on whole class instruction, with individual students, and in maintaining order vary by context and teacher type and responsibilities?
These measures are important signals of how teachers set priorities for classroom time and activities. Teachers in districts that had higher levels of performance in 1999 now tend to use more classroom time for whole class instruction than do districts with lower past performance, though districts in wealthier communities tend to use the strategy for less of each class period than those in poorer communities. The property wealth of the community is negatively related to time spent maintaining order in classrooms and positively related to time spent instructing individuals. No differences between urbanicity were found along these measures.
With regard to instructional differences between teachers responsible for AIS instruction and those not responsible (controlling for performance, wealth, and urbanicity), AIS teachers are one and one-half as likely to spend a greater proportion of class time on individual instruction than the non-AIS teachers. Not surprisingly, larger class sizes are positively associated with whole class instruction, and negatively associated with individual and small group instruction. Moreover, as the proportion of AIS students in a class increases (from 0% to 100%), the teachers are twice as likely to instruct in small groups.
The proportion of class time spent on maintaining order offers a window into classrooms and suggests important differences between urbanicity, performance, and high concentrations of AIS students in classes. While there are no significant difference in this measure between teachers responsible for AIS and those reporting no AIS responsibility for the class, teachers instructing greater concentrations of AIS students in the class are more than four times as likely to report greater proportions of class time maintaining order. Above and beyond this finding is a clear distinction in classroom working conditions between Big Five and non-Big Five teachers. It is a near certainty that Big Five teachers report spending greater proportions of class time maintaining order than teachers working outside the Big Five. Finally, both prior levels of academic performance and gains in achievement over the past four years are strongly and negatively associated with time spent on maintaining order. This clearly suggests that more orderly classrooms are both related to absolute levels of district performance, and to districts that have substantially improved their performance over time, regardless of what performance level they started.

Killeen & Sipple: Mandating supplemental intervention services 30
How do differences in how often teachers lead discussion in class versus how often students lead discussions in class vary by context and type of teacher?
AIS teachers use student led-discussions more frequently than non-AIS teachers. The same is true for English teachers when compared with mathematics teachers. Similar to the finding above regarding whole class instruction, teachers in previously high performing districts are more likely to engage in teacher led discussions. In terms of districts making greater gains in performance over time, teachers in these improving districts are less likely to engage in teacher led discussions. Teachers in Big Five districts are more than ten times as likely to engage in teacher led discussions in class, when compared with their rural colleagues.
Finally, the teaching of test-taking strategies appears to be strongly related to the classroom practice of teachers responsible for AIS instruction (see Table 10). Teachers with AIS responsibilities for a particular class are more than three times as likely to teach test-taking strategies.
How does planning among teachers vary by performance and context? We examine the frequency of teacher planning in three realms. We first explore
planning within a department, then across grade levels, and finally between school buildings. The data reveal no relation of district performance to reported levels of planning by teachers of any type. Despite other findings related to the challenging working conditions of teachers in the largest school districts, we find that Big Five teachers are most likely to report collaborative planning in their departments, though the planning ‘advantage’ does not hold when examining planning across grade levels or across buildings. In fact, teachers in the smaller urban and suburban districts are more likely to report collaborative planning across grade levels. English teachers, when compared to mathematics teachers, are more likely to collaboratively plan across grades and buildings.
With regard to AIS, we find teachers responsible for AIS instruction report more frequent planning within departments than do those non-AIS teachers. This is an encouraging finding given the importance of integrating AIS work with regular class work for under performing students.
In sum, teachers responsible for AIS instruction are more likely than their colleagues without AIS responsibilities to teach test-taking strategies, instruct individual students, and engage in student led class discussions. Having a high concentration of AIS students in classrooms is strongly related to small group instruction and greater proportions of class time spent on maintaining order. With regard to collaborative planning, we find a positive relationship between AIS teachers and such planning within academic departments when compared with their non-AIS teacher colleagues.
Discussion and Conclusion
This case from New York State addresses the question of whether state activism can
focus local district policy and program in a manner that increases instructional resources on under-performing students. With some caveats, the AIS policy mandate has encouraged local districts to adhere to guidelines promoting near universal policy response of providing supplemental instruction for eligible students. While the majority of states have established curriculum frameworks and linked them to assessment instruments, this experience in NY may be unique for its coordinated emphasis on intervention services (academic and non-academic) linked to rigorous learning and accountability standards. However, the caveats identified in this

Education Policy Analysis Archives Vol. 13 No. 19 31
study promote a familiar sense of local discretion in the interpretation and implementation of state policy mandates. While the primary focus in the prior sections entailed a detailed description of AIS programming across NYS, including its structural elements as well as instructional interventions, in this section we review whether the implementation practices were coherent in the development of new instructional capacity and in adhering to state regulation. Prior to addressing whether AIS leads under-performing children to achieve high standards, we ask whether the policy itself is coherent enough to generate appropriate instructional capacity to motivate such learning.
Coherence and Adherence
We found, generally, that current AIS practices within districts adhere to the general criteria established in the Commissioner’s Regulations of NYS, and as further delineated by the Administrative Guidelines disseminated by the State Education Department. Table 11 summarizes the degree to which local practice is adhering to state policy. Overall this discussion identifies two rather interesting findings. First, implied in the discussion is the observation that nearly all schools can demonstrate a high degree of compliance with the AIS guidelines that were enacted in the fall of 2000. This diffusion of practice has appeared rather quickly, which contrasts with frequent critiques of public schools as stable and slow to change (Cuban, 1983; Tyack & Cuban, 1995). Second, the AIS policy has stimulated new organizational and instructional arrangements within schools. The result of such change being greater individualized instruction for students performing below accepted performance levels. Taken together, these two points indicate a great degree of policy adherence by schools across the State.
Specifically, AIS practice across the State indicates compliance with the following general criteria: additional instructional attention to children scoring below accepted performance levels; AIS instruction provided by certified staff; multiple measures of performance used to determine eligibility; wide variation in scheduling options provided by schools. However, there exists some variation in practice around these general criteria that indicates the State guidance is sufficiently broad as to allow for local discretion and interpretation. This may offer support what Moss (2004) describes as coherence-through-negotiation, local interpretation, and adaptation of the state policy to meet local needs.
There are several salient examples of local interpretation of the AIS guidelines. For one, the State requires that AIS teachers be licensed to teach the AIS subjects they supervise. The survey respondents, however, indicate that more than half of all districts rely on special education staff to provide AIS instruction. Special educators are often certified in both subject area specialties and in special education, but not always. They are generally skilled at serving students through consulting teacher or inclusionary instructional models, and thus may be interpreted at the local level as best able to provide AIS instruction despite the intent of the regulations. At a quick glance, this could be simple non-compliance; however, the tone of the policy deviation may also signal a simple call of professional judgment. For instance, the policy implies that teachers with additional subject area expertise (certified in the academic subject area of concern) are best suited to provide additional AIS instruction, while this local response pattern may reflect an interpretation that expertise in special education services is better suited for intervention services. This “non-compliance” can be viewed two ways. This might be interpreted as local educators rejecting state policy, and hence not adhering to a regulation that

Killeen & Sipple: Mandating supplemental intervention services 32
seems inconsistent with a policy that calls for improving the learning of each student. Conversely, viewed through Moss’s coherence-through-negotiation lens, such practice may reflect valuable local variation in response and policy coherence. Local educators may size up the individual needs of students, make adjustments to staffing and programs, and provide what they deem as appropriate supplemental instruction to students in need. Determining which of these interpretations is more appropriate is beyond the scope of our data, but we suggest any interpretation of policy coherence and implementation should include such debate.
A different indicator of a lack of adherence to the state policy is the finding that some students eligible for AIS services are not receiving them. A common response among school principals following open ended survey questions was the statement that they wished their AIS program could serve all students that score a level 2 on a state examination. This finding is supported by their observation that 5-15% of children eligible to receive services don’t, for reasons of scheduling constraints, resources, absenteeism, and lack of student interest. Clearly the intent of the AIS regulations is that students scoring below an acceptable performance level should receive AIS programming. Given the clear indicator of who is eligible it may seem like a clear case of a lack of interest in complying or an inability to comply. One plausible explanation for the lack of strict compliance is that the guidelines state that students scoring below the level of proficiency (Level 3 on the comprehensive assessments) are “eligible” to receive AIS programming. In negotiating local response to the AIS mandate, the use of the word eligible may connote an opportunity to negotiate how many level 1 and level 2 students will be served in any given district. Of course, issues such as meeting the needs of all eligible students can go beyond interest in compliance, and bump up against capacity constraints of any given district.

Tab
le 1
1 A
lignm
ent o
f AIS
Pol
icy
Man
date
s an
d Im
plem
enta
tion
Prac
tice
in N
ew Y
ork
Stat
e
Po
licy
Orig
inat
ion
Polic
y G
uida
nce
Polic
y Im
plem
enta
tion
Polic
y A
rea
AIS
Reg
. 100
.2 (e
e)
Stat
e D
epar
tmen
t of E
duca
tion
Gui
delin
es
AIS
Im
plem
enta
tion
Cha
ract
eris
tics-
Stud
y
Elig
ibili
ty
crite
ria fo
r st
uden
ts to
re
ceiv
e A
IS
"Sch
ools
shal
l pro
vide
AIS
whe
n st
uden
ts…
.scor
e be
low
the
stat
e de
signa
ted
perf
orm
ance
leve
l on
one
or m
ore
of th
e St
ate…
.asse
ssm
ents
."
"Eac
h ye
ar th
e el
emen
tary
and
inte
rmed
iate
Sta
te
asse
ssm
ents
will
hav
e fo
ur d
esig
nate
d pe
rfor
man
ce
leve
ls on
eac
h as
sess
men
t. A
ll st
uden
ts w
ho sc
ore
belo
w
leve
l 3 (i
n le
vels
1 an
d 2)
are
elig
ible
to re
ceiv
e ac
adem
ic
inte
rven
tion
serv
ices
" an
d "D
istric
ts sh
ould
ass
ure
that
m
ultip
le a
sses
smen
ts/s
ourc
es o
f evi
denc
e ar
e us
ed"
to
dete
rmin
e el
igib
ility
.
Ass
essm
ent s
core
s, re
port
car
ds, a
nd g
uida
nce
coun
selo
r rec
omm
enda
tions
are
use
d he
avily
to
dete
rmin
e A
IS e
ligib
ility
. Stu
dent
beh
avio
r, at
tend
ance
and
par
ent r
ecom
men
datio
ns le
ss
influ
entia
l in
the
deci
sion
proc
ess.
Evi
denc
e sig
nals
that
dist
ricts
serv
ing
a la
rge
num
ber o
f A
IS st
uden
ts st
rugg
le to
pro
vide
AIS
serv
ices
for
stud
ents
sco
ring
leve
l 2 o
n be
nchm
ark
exam
inat
ions
.
Scop
e of
st
uden
ts
serv
ed
No
spec
ific
guid
ance
off
ered
.
"A sc
hool
dist
rict h
as th
e au
thor
ity a
nd re
spon
sibili
ty to
pl
ace
stud
ents
in a
ppro
pria
te a
cade
mic
pr
ogra
ms d
urin
g th
e re
gula
r sch
ool d
ay. T
hus,
a di
stric
t m
ay p
lace
stu
dent
s in
aca
dem
ic in
terv
entio
n se
rvic
es a
s par
t of t
heir
acad
emic
pro
gram
."
Far m
ore
stud
ents
in th
e la
rges
t urb
an c
ente
rs
are
serv
ed in
AIS
pro
gram
s, th
an in
non
-urb
an
dist
ricts
; 15%
of N
YC
stud
ents
qua
lify
for A
IS
but d
o no
t rec
eive
ser
vice
s, co
mpa
red
with
6%
in
non
-big
five
dist
ricts
.
AIS
Sc
hedu
ling
"(i)
Scho
ol d
istric
ts m
ay u
se ti
me
avail
able
for a
cade
mic
inte
rven
tion
inst
ruct
iona
l and
/or s
tude
nt
supp
ort s
ervi
ces d
urin
g th
e re
gula
r sc
hool
day
. (ii)
Sch
ool d
istric
ts m
ay
prov
ide
stud
ents
with
ext
ende
d ac
adem
ic ti
me
beyo
nd th
e re
gula
r sc
hool
day
and
scho
ol y
ear."
"The
dist
rict a
nd sc
hool
s sho
uld
incl
ude
as m
any
sche
dulin
g op
tions
as a
re n
eces
sary
to m
eet t
he ra
nge
of
stud
ent n
eeds
in th
e di
stric
t." A
nd, "
spec
ific
inte
rven
tions
sh
ould
be
prov
ided
bey
ond
gene
ral i
nstr
uctio
n in
the
cour
se."
AIS
pro
gram
s exi
st in
nea
rly a
ll N
YS
scho
ols f
or
Eng
lish
and
mat
h co
urse
s, an
d in
alm
ost 7
5% o
f sc
hool
s for
soci
al st
udie
s and
scie
nce.
Man
y sc
hedu
ling
mod
els e
xist
that
incl
ude
incl
usio
nary
an
d se
lf-co
ntai
ned
AIS
mod
els a
s wel
l as A
IS in
lie
u of
ele
ctiv
es o
r out
side
of re
gula
r sch
ool
hour
s.
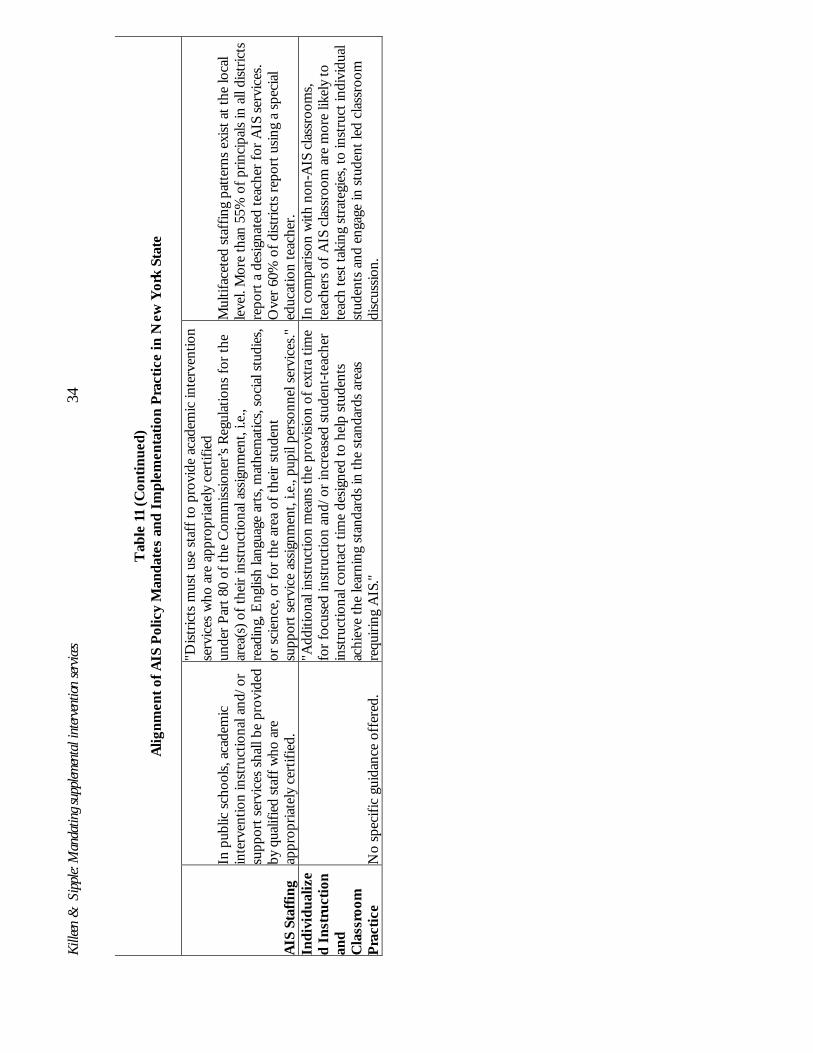
Kille
en &
Sip
ple: M
anda
ting s
upple
ment
al in
terve
ntion
serv
ices
34
T
able
11
(Con
tinue
d)
Alig
nmen
t of A
IS P
olic
y M
anda
tes
and
Impl
emen
tatio
n Pr
actic
e in
New
Yor
k St
ate
AIS
Sta
ffing
In p
ublic
scho
ols,
acad
emic
in
terv
entio
n in
stru
ctio
nal a
nd/o
r su
ppor
t ser
vice
s sha
ll be
pro
vide
d by
qua
lifie
d st
aff w
ho a
re
appr
opria
tely
cer
tifie
d.
"Dist
ricts
mus
t use
staf
f to
prov
ide
acad
emic
inte
rven
tion
serv
ices
who
are
app
ropr
iate
ly c
ertif
ied
unde
r Par
t 80
of th
e C
omm
issio
ner’s
Reg
ulat
ions
for t
he
area
(s) o
f the
ir in
stru
ctio
nal a
ssig
nmen
t, i.e
., re
adin
g, E
nglis
h la
ngua
ge a
rts, m
athe
mat
ics,
soci
al st
udie
s, or
sci
ence
, or f
or th
e ar
ea o
f the
ir st
uden
t su
ppor
t ser
vice
ass
ignm
ent,
i.e.,
pupi
l per
sonn
el se
rvic
es."
Mul
tifac
eted
staf
fing
patte
rns e
xist
at t
he lo
cal
leve
l. M
ore
than
55%
of p
rinci
pals
in a
ll di
stric
ts
repo
rt a
des
igna
ted
teac
her f
or A
IS s
ervi
ces.
Ove
r 60%
of d
istric
ts re
port
usin
g a
spec
ial
educ
atio
n te
ache
r. In
divi
dual
ize
d In
stru
ctio
n an
d C
lass
room
Pr
actic
e N
o sp
ecifi
c gu
idan
ce o
ffer
ed.
"Add
ition
al in
stru
ctio
n m
eans
the
prov
ision
of e
xtra
tim
e fo
r foc
used
inst
ruct
ion
and/
or in
crea
sed
stud
ent-t
each
er
inst
ruct
iona
l con
tact
tim
e de
signe
d to
hel
p st
uden
ts
achi
eve
the
lear
ning
stan
dard
s in
the
stan
dard
s are
as
requ
iring
AIS
."
In c
ompa
rison
with
non
-AIS
cla
ssro
oms,
teac
hers
of A
IS c
lass
room
are
mor
e lik
ely
to
teac
h te
st ta
king
stra
tegi
es, t
o in
stru
ct in
divi
dual
st
uden
ts a
nd e
ngag
e in
stud
ent l
ed c
lass
room
di
scus
sion.

Capacity While the intent of the AIS policy is to generate enhanced local capacity to attend to
the needs of underperforming students, the evidence also demonstrates how broader constructions of district capacity can impede this implementation. While all districts are being told they must provide supplemental services for all low-achieving students, the policy has a dramatic and differential impact within districts. Take for instance a 200-student high school with 25% of level 1 and 2 students. This school must provide supplemental instruction for 50 students. Large urban high schools with 2000 students and 50% of students below proficiency must provide supplemental services for 1,000 students.
The research literature on the district role in helping build instructional capacity highlights a set of strategies engaged by district that serve their component schools. Many of these strategies, such as providing schools with access to data, professional development, curriculum and instructional guidance, qualified staff, and fostering relationships with external agents and environment (Massell & Goertz, 2002; Spillane, 1996), may be unable to address some of the constraints we find in high need NYS schools. For instance, the scheduling of students into AIS classes appears to be untenable if half of all students require additional instruction in multiple subject areas all at the same time. Specifically, districts may be constrained in their ability to lengthen the school day, build more classrooms, and mandate that students stay after school or attend Saturday classes.
AIS policy was designed to bolster local instructional capacity by demanding the addition of supplemental instruction for students in need. This capacity is a key feature or nexus between the standard’s based curriculum and assessment system. In this sense the State’s AIS policy has enhanced local capacity.
However, as we have stated, this capacity varies dramatically as does the required response. Elsewhere, we document the importance of local context (e.g., location, size, wealth) and how contextual factors relate to levels of local capacity in meeting the new state Learning and graduation standards (Sipple & Killeen, 2004). We find that students in districts with a greater proportion of poor students are more likely to offer GED programs to their students, have teachers more likely to agree that a GED program enhances student learning, and more likely to have teachers teaching rote test taking skills. In short, context matters and hence it should not come as a surprise that context can constrain school districts’ abilities to comply with state regulation. This is especially so when the regulation requires more than a report to be written, a core curriculum to be taught, or a set of exams to be administered. When a state demands increase in the amount of instruction, the district response is particularly constrained and the challenges are great.
Of course, the differential impact of state policy has the potential to raise significant equity concerns. This policy in NY State has accomplished much and time will tell how well the creation of mechanisms to generate supplemental instructional models in grades K-12 can reduce the need for remediation in later grades. However, it is also clear that the disproportionate impact of the policy on certain high need schools and districts create demands on students’ and teachers’ time that seemingly cannot be met with the current six hour school day, and the other demands on students schedules.

Killeen & Sipple: Mandating supplemental intervention services 36
References
Chrispeels, J. H. (1997). Educational policy implementation in a shifting political climate: The
California experience. American Educational Research Journal, 34(3), 453-481. Clune, W. (2001). Toward a theory of standards-based reform: The case of nine nsf statewide
systemic initiatives. In S. H. Fuhrman (Ed.), From the capitol to the classroom: Standards-based reform in the states (pp. 13-38). Chicago, Illinois: The University of Chicago Press.
Corcoran, T., & Goertz, M. (1995). Instructional capacity and high performing schools.
Educational Researcher, 24(9), 27-31. Cuban, L. (1998). How schools change reforms: Redefining reform success and failure. Teachers
College Record, 99(3), 453-477. Darling-Hammond, L. (1993). Reframing the school reform agenda: Developing capacity for
school transformation. Phi Delta Kappan, 74, 753-761. Fuhrman, S. H. (Ed.). (1993). Designing coherent educational policy: Improving the system. San
Francisco: Jossey-Bass. Galvin, P. (2001). Organizational boundaries, authority, and school district organization. In B.
Malen (Ed.), Balancing local control and state responsibility for k-12 education (pp. 279-310). Larchmont, NY: Eye on Education.
Guba, E. G., & Lincoln, Y. S. (1989). Fourth generation evaluation. Newbury Park, Calif.: Sage
Publications. Hightower, A. (2002). San Diego's Big Boom: Systematic Instructional Change in the Central
Office and Schools. In A. Hightower, M. S. Knapp, J. A. Marsh & M. W. McLaughlin (Eds.), School districts and instructional renewal (pp. 76-93). New York: Teachers College Press.
Massell, D., & Goertz, M. E. (2002). District strategies for building instructional capacity. In A.
Hightower, M. S. Knapp, J. A. Marsh & M. W. McLaughlin (Eds.), School districts and instructional renewal (pp. 43-60). New York: Teachers College Press.
McDonnell, L. M., & Elmore, R. F. (1987). Getting the job done: Alternative policy
instruments. Education Evaluation and Policy Analysis, 9, 133-152. McLaughlin, M. W., & Talbert, J. (1993). How the world of students and teachers challenges
policy coherence. In S. H. Fuhrman (Ed.), Designing coherent education policy (pp. 220-249). San Francisco: Jossey-Bass.

Education Policy Analysis Archives Vol. 13 No. 19 37
Moss, P. A. (2004). The risk of coherence. In M. Wilson (Ed.), Towards coherence between classroom assessment and accountability (pp. 217-238). Chicago: University of Chicago Press.
O'Day, J., Goertz, M. E., & Floden, R. E. (1995). Building capacity for education reform. In cpre policy
briefs: Reporting on issues and research in education policy. New Brunswick, NJ: Rutgers University.
Sipple, J. W., & Killeen, K. (2004). Context, capacity and concern: A district-level analysis of
the implementation of standards-based reform. Education Policy, 18(3), 456-490. Sipple, J. W., Killeen, K., & Monk, D. H. (2004). Adoption and adaptation: New York state
school districts' responses to state imposed high school graduation requirements. Educational Evaluation and Policy Analysis, 26(2).
Skinner, R. A., & Staresina, L. N. (2004). The state of the states. In quality counts 2004: Special
education in an era of standards (a report on education in the 50 states by the editorial projects in education). Education Week, 23(17), 68-92.
Smith, M. S., & O'Day, J. (1990a). Systemic school reform. In Politics of education association
yearbook 1990 (pp. 233-236). New York: Taylor & Francis. Smith, M. S., & O'Day, J. A. (1990b). Systemic school reform. In S. H. Fuhrman & B. Malen
(Eds.), The politics of curriculum and testing. Bristol, PA: Falmer Press. Spillane, J. P. (1996). School districts matter: Local educational authorities and state
instructional policy. Educational Policy, 10(1), 63. Spillane, J. P., & Jennings, N. E. (1997). Aligned instructional policy and ambitious pedagogy:
Exploring instructional reform from the classroom perspective. Teachers College Record, 98(3), 449-480.
Tyack, D. B., & Cuban, L. (1995). Tinkering toward utopia : A century of public school reform.
Cambridge, MA: Harvard University Press. Wilson, M. (2004a). Assessment, accountability and the classroom. In M. Wilson (Ed.), Towards
coherence between classroom assessment and accountability (pp. 1-19). Chicago: Univ. of Chicago Press.
Wilson, M. (2004b). Towards coherence between classroom assessment and accountability. Chicago:
University of Chicago Press.

Killeen & Sipple: Mandating supplemental intervention services 38
About the Authors Kieran M. Killeen Assistant Professor 445 Waterman Hall Department of Education University of Vermont Burlington, VT 05405 [email protected] 802-656-3250 – Phone 802-656-2702 – Fax Kieran M. Killeen, Ph.D., Assistant Professor, College of Education and Human Services, University of Vermont. Research interests include school finance, teacher professional development, and organizational studies. John W. Sipple Assistant Professor 421 Kennedy Hall Department of Education Cornell University Ithaca, NY 14850 [email protected] John W. Sipple, Ph.D., Assistant Professor, Department of Education, Cornell University. Research interests include the implementation of social policy, school administration, and organizational studies.

Education Policy Analysis Archives Vol. 13 No. 19 39
Education Policy Analysis Archives http://epaa.asu.edu Editor: Sherman Dorn, University of South Florida
Production Assistant: Chris Murrell, Arizona State University General questions about appropriateness of topics or particular articles may be addressed to the Editor, Sherman Dorn, [email protected].
EPAA Editorial Board Michael W. Apple University of Wisconsin
David C. Berliner Arizona State University
Greg Camilli Rutgers University
Linda Darling-Hammond Stanford University
Mark E. Fetler California Commission on Teacher Credentialing
Gustavo E. Fischman Arizona State Univeristy
Richard Garlikov Birmingham, Alabama
Gene V Glass Arizona State University
Thomas F. Green Syracuse University
Aimee Howley Ohio University
Craig B. Howley Appalachia Educational Laboratory
William Hunter University of Ontario Institute of Technology
Patricia Fey Jarvis Seattle, Washington
Daniel Kallós Umeå University
Benjamin Levin University of Manitoba
Thomas Mauhs-Pugh Green Mountain College
Les McLean University of Toronto
Heinrich Mintrop University of California, Berkeley
Michele Moses Arizona State University
Gary Orfield Harvard University
Anthony G. Rud Jr. Purdue University
Jay Paredes Scribner University of Missouri
Michael Scriven Western Michigan University
Lorrie A. Shepard University of Colorado, Boulder
Robert E. Stake University of Illinois—UC
Kevin Welner University of Colorado, Boulder
Terrence G. Wiley Arizona State University
John Willinsky University of British Columbia

Killeen & Sipple: Mandating supplemental intervention services 40
Archivos Analíticos de Políticas Educativas Associate Editors
Gustavo E. Fischman & Pablo Gentili Arizona State University & Universidade do Estado do Rio de Janeiro
Founding Associate Editor for Spanish Language (1998—2003)
Roberto Rodríguez Gómez
Editorial Board
Hugo Aboites Universidad Autónoma Metropolitana-Xochimilco
Adrián Acosta Universidad de Guadalajara México
Claudio Almonacid Avila Universidad Metropolitana de Ciencias de la Educación, Chile
Dalila Andrade de Oliveira Universidade Federal de Minas Gerais, Belo Horizonte, Brasil
Alejandra Birgin Ministerio de Educación, Argentina
Teresa Bracho Centro de Investigación y Docencia Económica-CIDE
Alejandro Canales Universidad Nacional Autónoma de México
Ursula Casanova Arizona State University, Tempe, Arizona
Sigfredo Chiroque Instituto de Pedagogía Popular, Perú
Erwin Epstein Loyola University, Chicago, Illinois
Mariano Fernández Enguita Universidad de Salamanca. España
Gaudêncio Frigotto Universidade Estadual do Rio de Janeiro, Brasil
Rollin Kent Universidad Autónoma de Puebla. Puebla, México
Walter Kohan Universidade Estadual do Rio de Janeiro, Brasil
Roberto Leher Universidade Estadual do Rio de Janeiro, Brasil
Daniel C. Levy University at Albany, SUNY, Albany, New York
Nilma Limo Gomes Universidade Federal de Minas Gerais, Belo Horizonte
Pia Lindquist Wong California State University, Sacramento, California
María Loreto Egaña Programa Interdisciplinario de Investigación en Educación
Mariano Narodowski Universidad Torcuato Di Tella, Argentina
Iolanda de Oliveira Universidade Federal Fluminense, Brasil
Grover Pango Foro Latinoamericano de Políticas Educativas, Perú
Vanilda Paiva Universidade Estadual do Rio de Janeiro, Brasil
Miguel Pereira Catedratico Universidad de Granada, España
Angel Ignacio Pérez Gómez Universidad de Málaga
Mónica Pini Universidad Nacional de San Martin, Argentina
Romualdo Portella do Oliveira Universidade de São Paulo
Diana Rhoten Social Science Research Council, New York, New York
José Gimeno Sacristán Universidad de Valencia, España
Daniel Schugurensky Ontario Institute for Studies in Education, Canada
Susan Street Centro de Investigaciones y Estudios Superiores en Antropologia Social Occidente, Guadalajara, México
Nelly P. Stromquist University of Southern California, Los Angeles, California
Daniel Suarez Laboratorio de Politicas Publicas-Universidad de Buenos Aires, Argentina
Antonio Teodoro Universidade Lusófona Lisboa,
Carlos A. Torres UCLA
Jurjo Torres Santomé Universidad de la Coruña, España