texas miracle - education policy analysis archives - arizona state
TRANSCRIPT

EPAA Vol. 8 No. 41 Haney: The Myth of the Texas Miracle in Education
This article has been retrieved times since August 19, 2000
prior vols. | abstracts | editors | board | submit | comment | subscribe | search
Volume 8 Number 41 August 19, 2000 ISSN 1068-2341
A peer-reviewed scholarly electronic journalEditor: Gene V Glass, College of Education
Arizona State University
Copyright 2000, the EDUCATION POLICY ANALYSIS ARCHIVES.Permission is hereby granted to copy any article
if EPAA is credited and copies are not sold.
Articles appearing in EPAA are abstracted in the Current Index to Journals in Education by the ERIC Clearinghouse on Assessment and Evaluation and are permanently archived in Resources in Education.
http://epaa.asu.edu/epaa/v8n41/index.html (1 of 7)7/30/2004 4:21:44 AM
EPAA Vol. 8 No. 41 Haney: The Myth of the Texas Miracle in Education
The Myth of the Texas Miracle in Education
Walt HaneyBoston College
Related articles:Klein et al.: Vol. 8 No. 49
Camilli: Vol. 8 No. 42Toenjes & Dworkin: Vol. 10 No. 17
Abstract:I summarize the recent history of education reform and statewide testing in Texas, which led to introduction of the Texas Assessment of Academic Skills (TAAS) in 1990-91. A variety of evidence in the late 1990s led a number of observers to conclude that the state of Texas had made near miraculous progress in reducing dropouts and increasing achievement. The passing scores on TAAS tests were arbitrary and discriminatory. Analyses comparing TAAS reading, writing and math scores with one another and with relevant high school grades raise doubts about the reliability and validity of TAAS scores. I discuss problems of missing students and other mirages in Texas enrollment statistics that profoundly affect both reported dropout statistics and test scores. Only 50% of minority students in Texas have been progressing from grade 9 to high school graduation since the initiation of the TAAS testing program. Since about 1982, the rates at which Black and Hispanic students are required to repeat grade 9 have climbed steadily, such that by the late 1990s, nearly 30% of Black and Hispanic students were "failing" grade 9. Cumulative rates of grade retention in Texas are almost twice as high for Black and Hispanic students as for White students. Some portion of the gains in grade 10 TAAS pass rates are illusory. The numbers of students taking the grade 10 tests who were classified as "in special education" and hence not counted in schools' accountability ratings nearly doubled between 1994 and 1998. A substantial portion of the apparent increases in TAAS pass rates in the 1990s are due to such exclusions. In the opinion of educators in Texas, schools are devoting a huge amount of time and energy preparing students specifically for TAAS, and emphasis on TAAS is hurting more than helping teaching and learning in Texas schools, particularly with at-risk students, and TAAS contributes to retention in grade and dropping out. Five different sources of evidence about rates of high school completion in Texas are compared and contrasted. The review of GED statistics indicated that there was a sharp upturn in numbers of young people taking the GED tests in Texas in the mid-1990s to avoid TAAS. A convergence of evidence indicates that during the 1990s, slightly less than 70% of students in Texas actually graduated from high school. Between 1994 and 1997, TAAS results showed a 20% increase in the percentage of students passing all three exit level TAAS tests (reading, writing and math), but TASP (a college readiness test)
http://epaa.asu.edu/epaa/v8n41/index.html (2 of 7)7/30/2004 4:21:44 AM
EPAA Vol. 8 No. 41 Haney: The Myth of the Texas Miracle in Education
results showed a sharp decrease (from 65.2% to 43.3%) in the percentage of students passing all three parts (reading, math, and writing). As measured by performance on the SAT, the academic learning of secondary school students in Texas has not improved since the early 1990s, compared with SAT takers nationally. SAT-Math scores have deteriorated relative to students nationally. The gains on NAEP for Texas fail to confirm the dramatic gains apparent on TAAS. The gains on TAAS and the unbelievable decreases in dropouts during the 1990s are more illusory than real. The Texas "miracle" is more hat than cattle.
Click on items in list below for full text.
● Part 1: Introduction ● Part 2: Recent History of Testing in Texas ● Part 3: Evidence and Boosters of the Myth ● Part 4: Problems with TAAS ● Part 5: Missing Students and Other Mirages ● Part 6: Educators' Views of TAAS ● Part 7: Other Evidence on Education in Texas ● Part 8: Summary and Lessons from the Myth Deflated ● Notes and References ● Appendices
About the Author
Walt HaneyCenter for the Study of Testing, Evaluation and Educational PolicyCampion Hall 323Lynch School of EducationBoston CollegeChestnut Hill, MA 02467617-552-4199617-552-8419 (Fax)Email: [email protected] page
Walt Haney, Ed.D., Professor of Education at Boston College and Senior Research Associate in the Center for the Study of Testing Evaluation and Educational Policy (CSTEEP), specializes in educational evaluation and assessment and educational technology. He has published widely on testing and assessment issues in scholarly journals such as the Harvard Educational Review, Review of Educational Research, and Review of Research in Education and in wide-audience periodicals such as Educational Leadership, Phi Delta Kappan, the Chronicle of Higher Education and the
http://epaa.asu.edu/epaa/v8n41/index.html (3 of 7)7/30/2004 4:21:44 AM
EPAA Vol. 8 No. 41 Haney: The Myth of the Texas Miracle in Education
"Washington Post." He has served on the editorial boards of Educational Measurement: Issues and Practice and the American Journal of Education and on the National Advisory Committee of the ERIC Clearinghouse on Assessment and Evaluation.
ACKNOWLEDGEMENTS As I worked on this article over a period of more than two years, literally dozens of people helped me in numerous ways. At Boston College, graduate students Cathy Horn, Kelly Shasby, Miguel Ramos and Damtew Teferra helped on specific portions of the work reported here. Damtew Teferra has been especially helpful over a period of nearly two years in tracking down references and other source material and in checking accuracy of data input. Ed Rincon and Terry Hitchock both helped me more than once as I sought to build the data set on enrollments in Texas public schools over the last quarter century. Among many scholars who have answered repeated questions and kindly provided me with references and reviews of various portions of this article in many different versions, I thank James Hoffman, John Tyler, Jeff Rodamar, Angela Valenzuela, Bob Hauser, Duncan Chaplin, Richard Murnane, Linda McNeil, Dennis Shirley, Anne Wheelock, and Janet Baldwin. Diane Joyce, Lauren McGrath, Anna Geraty, Courtney Danley, and Genia Young helped me, as they do everyone else in our research center, in ways too many to mention here. Also, I thank Jane Hodosi of Market Data Retrieval who, under an extraordinarily short deadline, helped me get the mailing labels that allowed us to carry out two of the surveys recounted here. Thanks too to Chris Patterson for providing me with a great deal of useful information. Three electronic mail correspondents—Audrey Amrein, Craig Bolon and Alein Jehlen also provided me with helpful suggestions and encouragement. I also wish to express my appreciation to Judge Edward Prado. Though I think he may have erred in his ruling in the GI Forum case (as may be apparent from what is to follow), during the four days I was on the stand in his courtroom, he treated me with attention, respect and good humor. He even had the good sense to tell me simply to "answer the question," when the professor in me launched into discussions of literature on topics on which I was questioned. My wife, Kris, and daughter, Elizabeth, also deserve great appreciation for their tolerance in putting up with work that I told them many times would be done long before now. Thanks also to Gene V Glass who encouraged me to submit this work to Education Policy Analysis Archives. As a former editor, I know how hard it sometimes can be to pry manuscripts away from authors who know that there are always other nooks and crannies to explore. Thanks too to nine anonymous reviewers from the EPAA Editorial Board who commented generously on a previous version of this article. More than anyone else, though, I wish to express my appreciation and respect for Al Kauffman. Over the past two years, on several occasions I have cursed him under my breath (and once or twice aloud), for getting me involved with TAAS and education reform in Texas. But after spending more than twice as long on this topic as I ever thought I would, I have developed enduring respect for Al, his integrity and good humor, and his quest for truth and justice. I regret that I was not able to complete all of the analyses reported here before the TAAS trial. But it will be a long time before I let Al talk me into working on another case, even if next time he tries to tell me I am not his second choice as an expert witness. Any errors of fact or interpretation in this report are, of course, despite the enormous help of many good and generous people, entirely my responsibility. No corporations, foundations or anonymous donors have supported the research reported here. But I do owe an enormous debt of gratitude to Boston College for awarding me a sabbatical leave during the 1999-2000 academic year. Without the leave, there is no way I would have been able to complete this research. I did not do what I said I would when I applied for sabbatical leave, but I hope that the work reported here will win me, if not forgiveness, at least tolerance for being distracted from well-intentioned plans. And on the topic of forgiveness, I am almost certain there are people I should have thanked here but could not remember. Forgive me, please, but I simply had to finish this work before returning to normal academic duties in September.
http://epaa.asu.edu/epaa/v8n41/index.html (4 of 7)7/30/2004 4:21:44 AM

EPAA Vol. 8 No. 41 Haney: The Myth of the Texas Miracle in Education
Copyright 2000 by the Education Policy Analysis Archives
The World Wide Web address for the Education Policy Analysis Archives is epaa.asu.edu
General questions about appropriateness of topics or particular articles may be addressed to the Editor, Gene V Glass, [email protected] or reach him at College of Education, Arizona State University, Tempe, AZ 85287-0211. (602-965-9644). The Commentary Editor is Casey D. Cobb: [email protected] .
EPAA Editorial Board
Michael W. AppleUniversity of Wisconsin
Greg CamilliRutgers University
John CovaleskieNorthern Michigan University
Alan Davis University of Colorado, Denver
Sherman DornUniversity of South Florida
Mark E. FetlerCalifornia Commission on Teacher Credentialing
Richard [email protected]
Thomas F. GreenSyracuse University
Alison I. GriffithYork University
Arlen GullicksonWestern Michigan University
Ernest R. HouseUniversity of Colorado
Aimee HowleyOhio University
Craig B. HowleyAppalachia Educational Laboratory
William HunterUniversity of Calgary
Daniel KallósUmeå University
Benjamin LevinUniversity of Manitoba
Thomas Mauhs-PughGreen Mountain College
Dewayne MatthewsWestern Interstate Commission for Higher Education
William McInerneyPurdue University
Mary McKeown-MoakMGT of America (Austin, TX)
Les McLeanUniversity of Toronto
Susan Bobbitt NolenUniversity of Washington
http://epaa.asu.edu/epaa/v8n41/index.html (5 of 7)7/30/2004 4:21:44 AM
EPAA Vol. 8 No. 41 Haney: The Myth of the Texas Miracle in Education
Anne L. [email protected]
Hugh G. PetrieSUNY Buffalo
Richard C. RichardsonNew York University
Anthony G. Rud Jr.Purdue University
Dennis SayersAnn Leavenworth Centerfor Accelerated Learning
Jay D. ScribnerUniversity of Texas at Austin
Michael [email protected]
Robert E. Stake University of Illinois—UC
Robert StonehillU.S. Department of Education
David D. WilliamsBrigham Young University
EPAA Spanish Language Editorial Board
Associate Editor for Spanish LanguageRoberto Rodríguez Gómez
Universidad Nacional Autónoma de México
Adrián Acosta (México)Universidad de [email protected]
J. Félix Angulo Rasco (Spain)Universidad de Cá[email protected]
Teresa Bracho (México)Centro de Investigación y Docencia Económica-CIDEbracho dis1.cide.mx
Alejandro Canales (México) Universidad Nacional Autónoma de Mé[email protected]
Ursula Casanova (U.S.A.)Arizona State [email protected]
José Contreras DomingoUniversitat de Barcelona [email protected]
Erwin Epstein (U.S.A.)Loyola University of [email protected]
Josué González (U.S.A.)Arizona State [email protected]
Rollin Kent (México)Departamento de Investigación Educativa-DIE/[email protected] [email protected]
María Beatriz Luce (Brazil)Universidad Federal de Rio Grande do [email protected]
Javier Mendoza Rojas (México)Universidad Nacional Autónoma de Mé[email protected]
Marcela Mollis (Argentina)Universidad de Buenos [email protected]
http://epaa.asu.edu/epaa/v8n41/index.html (6 of 7)7/30/2004 4:21:44 AM
EPAA Vol. 8 No. 41 Haney: The Myth of the Texas Miracle in Education
Humberto Muñoz García (México)Universidad Nacional Autónoma de Mé[email protected]
Angel Ignacio Pérez Gómez (Spain)Universidad de Má[email protected]
Daniel Schugurensky (Argentina-Canadá)OISE/UT, [email protected]
Simon Schwartzman (Brazil)Fundação Instituto Brasileiro e Geografia e Estatística [email protected]
Jurjo Torres Santomé (Spain)Universidad de A Coruñ[email protected]
Carlos Alberto Torres (U.S.A.)University of California, Los [email protected]
other vols. | abstracts | editors | board | submit | comment | subscribe | search
http://epaa.asu.edu/epaa/v8n41/index.html (7 of 7)7/30/2004 4:21:44 AM
EPAA Vol. 8 No. 41 Haney: The Myth of the Texas Miracle in Education--Part 1: Introduction
Education Policy Analysis Archives
Volume 8 Number 41 The Texas Miracle in Education Walt Haney
1. Introduction
Accountability Narrows Racial Gap in Texas; Expand It—Editorial headline, USA Today, March 21, 2000, p. 14A
For several years the state of Texas has been widely cited as a model of standards-based education reform. Some have even called recent educational progress in Texas a miracle. Indeed Texas has been cited from west coast to east as a model worthy of emulation by other states. As in the USA Today editorial cited above, the Texas system of educational accountability has even been touted as a model to be followed in federal education legislation. In this article, I review evidence to show that the "miracle" of education reform in Texas is really a myth and illusion. What should be learned from this is not just to be suspicious of the "tall tales" of Texans (as Jeff Rodamar, 2000, put the matter), but that more broadly, we should be cautious in drawing sweeping conclusions about large and complex educational endeavors, based on only one form of evidence, such as test scores. This may seem strange advice coming from one who would call a purported miracle a myth. But as I will explain, even if the Texas approach to education reform is not worthy of emulation elsewhere, there is still something to be learned from Texas about how not to judge the health of education and the progress of education reform elsewhere. The story of the Texas miracle is reported here in eight parts. Following this introduction, Part 2 provides a summary of recent education history in Texas, with particular focus on how statewide testing has evolved in the Lone Star state over the last two decades into the Texas Assessment of Academic Skills (TAAS) which is now the linchpin of educational accountability in Texas. Part 3 summarizes evidence upon which the Texas tale of success in the 1990s is based, and recounts some of the praise that has been lavished recently on the Texas miracle story. Part 4 summarizes some of the problems with the TAAS tests that make them suspect as sources of evidence about the progress of education in Texas. Part 5 describes the problem of missing students in Texas, and other mirages, reminding us that when trying to interpret summary test results, it is always helpful to pay attention to who is and is not present for the testing. Part 6 summarizes views of educators in Texas about TAAS and teaching and learning in the state. Part 7 reviews other evidence on the status of education in Texas. Finally, the conclusion suggests some broader lessons from this story of the myth of the education "miracle" in Texas—about both the limits of test-based accountability and the need to remember the broad aims of education in a democratic society. Before reviewing the story of the Texas "miracle," I offer two caveats—one very large, and the other inevitable in any work of limited scope. The big caveat is that approximately two years ago Al Kauffman, Regional Counsel for the Mexican American Legal Defense and Education Fund (MALDEF) persuaded me to serve as an expert witness in a MALDEF lawsuit, GI Forum v. Texas
http://epaa.asu.edu/epaa/v8n41/part1.htm (1 of 2)7/30/2004 4:26:35 AM

EPAA Vol. 8 No. 41 Haney: The Myth of the Texas Miracle in Education--Part 1: Introduction
Education Agency, brought against the state of Texas. As a result, I served as one of several expert witnesses for MALDEF in its effort to prove that that the high school graduation test in Texas, the TAAS "exit level" test, has illegal discriminatory impact on Black and Hispanic students. After a trial in the fall of 1999 (which in the press came to be called the "TAAS trial,") the federal judge who heard the case, Edward C. Prado, ruled on January 7, 2000, against MALDEF and for the state of Texas. (Note 1) In essence, Judge Prado ruled that while TAAS does have discriminatory impact on Black and Hispanic students, the use of TAAS to withhold diplomas is not illegal because it is educationally necessary. I am not a legal expert and, hence, in the body of this article will comment only on matters of evidence and facts in the TAAS case. Nonetheless, in appendices to this article, I provide the full text of Judge Prado's ruling, documentation on summary arguments made by the two sides in the case, and my own summary comments on the judge's ruling. (Note 2) The second caveat is one that is inevitable in any presentation in any medium. One can never tell the whole story. Texas is well known for its size. Hence the territory I try to cover in this article is rather large. To provide some indication of its scope, the TAAS trial lasted for five weeks, and in addition to direct testimony, was based on hundreds of documents submitted by plaintiffs and defendants. Indeed, my personal files on TAAS and the TAAS case occupy six feet of shelf space and several megabytes of computer storage. So, in trying to recount the Texas miracle story and why I think it is a myth, I will have to be somewhat selective. This may seem dangerous since I was on one side of a hard fought legal battle. I make no apologies for that, but want to make it clear simply as fair warning to readers. I leave it to others to judge how fair-minded I have been in recounting this version of the Texas miracle. And one final caution. During preparation for the TAAS trial, Mr. Kauffman, the lead attorney for MALDEF in the TAAS case, several times referred to me as his "Yankee testing expert." While I do now reside in New England, I am actually a native of Texas. So beware the tall tales of Texans.
0: Home | 1: Intro. | 2: History | 3: The Myth | 4: TAAS | 5: Missing Students 6: Teachers | 7: Other Evidence | 8: Summary | Notes & Ref. | Appendix
http://epaa.asu.edu/epaa/v8n41/part1.htm (2 of 2)7/30/2004 4:26:35 AM
EPAA Vol. 8 No. 41 Haney: The Myth of the Texas Miracle in Education--Part 2: Recent History of Testing in Texas
Education Policy Analysis Archives
Volume 8 Number 41 The Texas Miracle in Education Walt Haney
2. Recent History of Testing in Texas
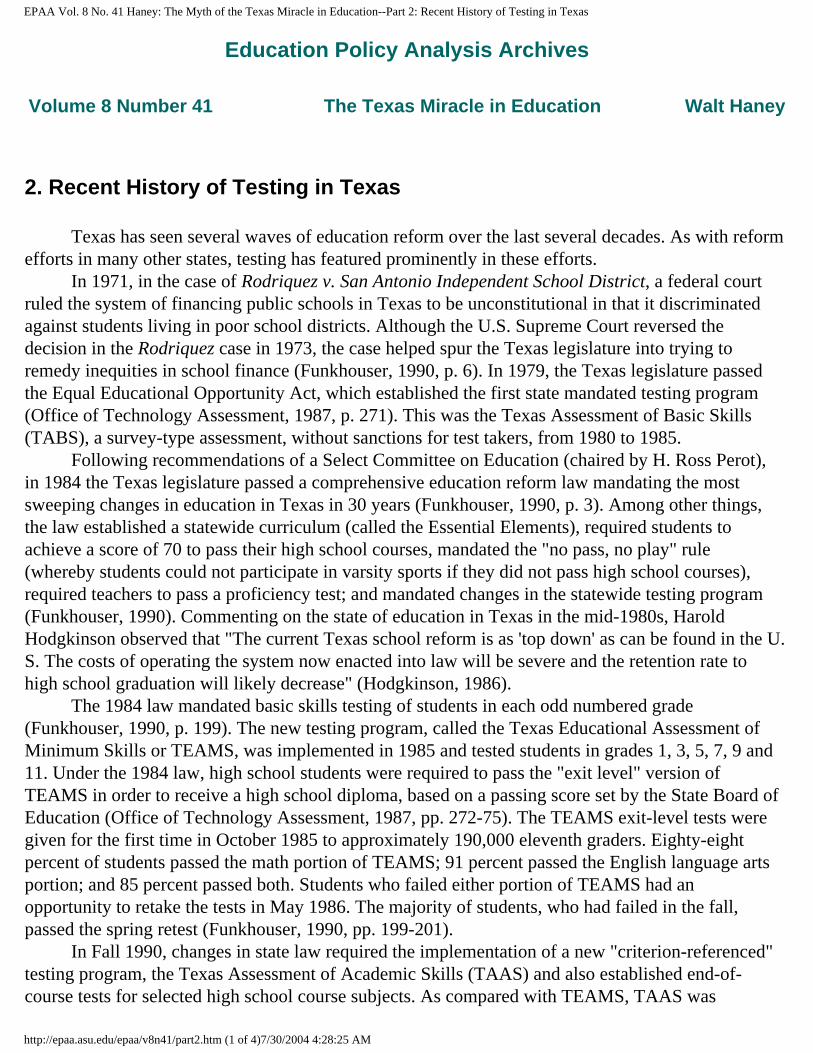
Texas has seen several waves of education reform over the last several decades. As with reform efforts in many other states, testing has featured prominently in these efforts. In 1971, in the case of Rodriquez v. San Antonio Independent School District, a federal court ruled the system of financing public schools in Texas to be unconstitutional in that it discriminated against students living in poor school districts. Although the U.S. Supreme Court reversed the decision in the Rodriquez case in 1973, the case helped spur the Texas legislature into trying to remedy inequities in school finance (Funkhouser, 1990, p. 6). In 1979, the Texas legislature passed the Equal Educational Opportunity Act, which established the first state mandated testing program (Office of Technology Assessment, 1987, p. 271). This was the Texas Assessment of Basic Skills (TABS), a survey-type assessment, without sanctions for test takers, from 1980 to 1985. Following recommendations of a Select Committee on Education (chaired by H. Ross Perot), in 1984 the Texas legislature passed a comprehensive education reform law mandating the most sweeping changes in education in Texas in 30 years (Funkhouser, 1990, p. 3). Among other things, the law established a statewide curriculum (called the Essential Elements), required students to achieve a score of 70 to pass their high school courses, mandated the "no pass, no play" rule (whereby students could not participate in varsity sports if they did not pass high school courses), required teachers to pass a proficiency test; and mandated changes in the statewide testing program (Funkhouser, 1990). Commenting on the state of education in Texas in the mid-1980s, Harold Hodgkinson observed that "The current Texas school reform is as 'top down' as can be found in the U.S. The costs of operating the system now enacted into law will be severe and the retention rate to high school graduation will likely decrease" (Hodgkinson, 1986). The 1984 law mandated basic skills testing of students in each odd numbered grade (Funkhouser, 1990, p. 199). The new testing program, called the Texas Educational Assessment of Minimum Skills or TEAMS, was implemented in 1985 and tested students in grades 1, 3, 5, 7, 9 and 11. Under the 1984 law, high school students were required to pass the "exit level" version of TEAMS in order to receive a high school diploma, based on a passing score set by the State Board of Education (Office of Technology Assessment, 1987, pp. 272-75). The TEAMS exit-level tests were given for the first time in October 1985 to approximately 190,000 eleventh graders. Eighty-eight percent of students passed the math portion of TEAMS; 91 percent passed the English language arts portion; and 85 percent passed both. Students who failed either portion of TEAMS had an opportunity to retake the tests in May 1986. The majority of students, who had failed in the fall, passed the spring retest (Funkhouser, 1990, pp. 199-201). In Fall 1990, changes in state law required the implementation of a new "criterion-referenced" testing program, the Texas Assessment of Academic Skills (TAAS) and also established end-of-course tests for selected high school course subjects. As compared with TEAMS, TAAS was
http://epaa.asu.edu/epaa/v8n41/part2.htm (1 of 4)7/30/2004 4:28:25 AM
EPAA Vol. 8 No. 41 Haney: The Myth of the Texas Miracle in Education--Part 2: Recent History of Testing in Texas
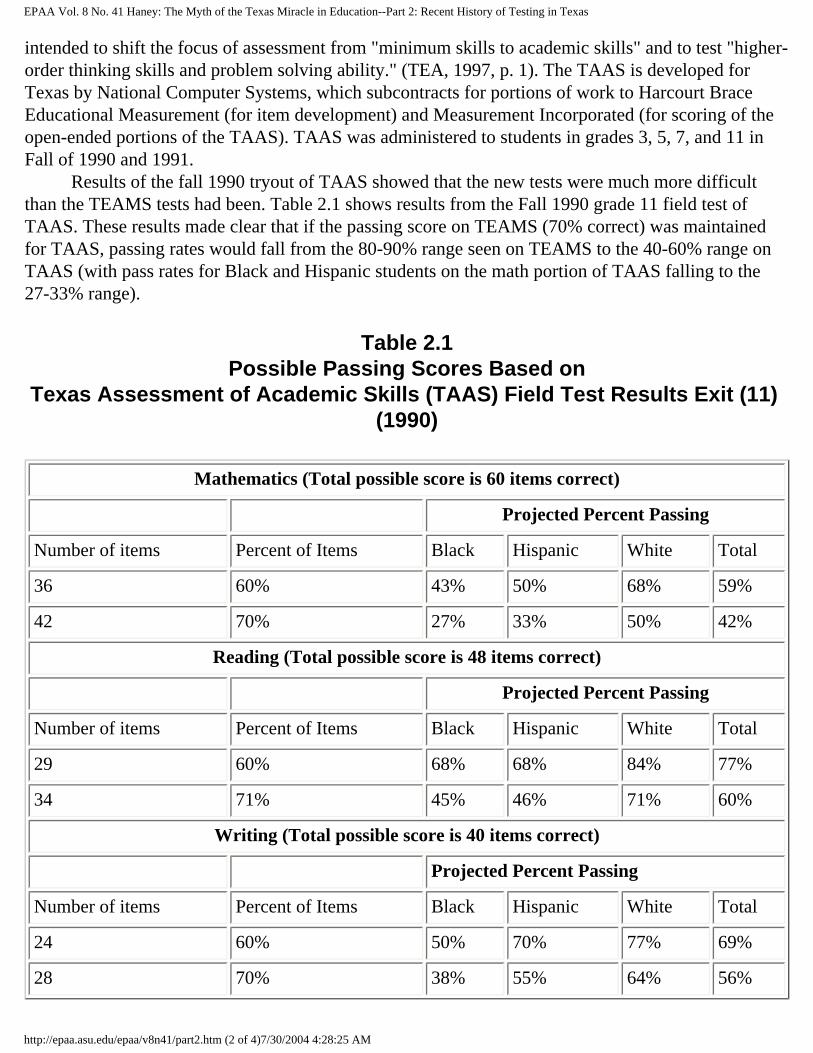
intended to shift the focus of assessment from "minimum skills to academic skills" and to test "higher-order thinking skills and problem solving ability." (TEA, 1997, p. 1). The TAAS is developed for Texas by National Computer Systems, which subcontracts for portions of work to Harcourt Brace Educational Measurement (for item development) and Measurement Incorporated (for scoring of the open-ended portions of the TAAS). TAAS was administered to students in grades 3, 5, 7, and 11 in Fall of 1990 and 1991. Results of the fall 1990 tryout of TAAS showed that the new tests were much more difficult than the TEAMS tests had been. Table 2.1 shows results from the Fall 1990 grade 11 field test of TAAS. These results made clear that if the passing score on TEAMS (70% correct) was maintained for TAAS, passing rates would fall from the 80-90% range seen on TEAMS to the 40-60% range on TAAS (with pass rates for Black and Hispanic students on the math portion of TAAS falling to the 27-33% range).
Table 2.1Possible Passing Scores Based on
Texas Assessment of Academic Skills (TAAS) Field Test Results Exit (11) (1990)
Mathematics (Total possible score is 60 items correct)
Projected Percent Passing
Number of items Percent of Items Black Hispanic White Total
36 60% 43% 50% 68% 59%
42 70% 27% 33% 50% 42%
Reading (Total possible score is 48 items correct)
Projected Percent Passing
Number of items Percent of Items Black Hispanic White Total
29 60% 68% 68% 84% 77%
34 71% 45% 46% 71% 60%
Writing (Total possible score is 40 items correct)
Projected Percent Passing
Number of items Percent of Items Black Hispanic White Total
24 60% 50% 70% 77% 69%
28 70% 38% 55% 64% 56%
http://epaa.asu.edu/epaa/v8n41/part2.htm (2 of 4)7/30/2004 4:28:25 AM
EPAA Vol. 8 No. 41 Haney: The Myth of the Texas Miracle in Education--Part 2: Recent History of Testing in Texas
(Data presented to the Texas Board of Education, July 1990. Reproduced from TEA, 1997, appendix 9 of Texas Student Assessment Program Technical Digest for the Academic Year 1996-1997, p. 347.)
The 1992-93 school year was a time of transition for statewide testing in Texas with some grades being tested in the fall and some in the spring. In the Spring of 1994, the TAAS reading and mathematics assessments were administered to students in grades 3, 4, 5, 6, 7, 8, and 10; and the TAAS writing tests were administered at Grades 4, 8, and 10. If students do not pass the grade 10 or exit level TAAS, they may continue taking portions they have not yet passed during grades 11 and 12. Since 1994, the TAAS Reading, Mathematics and Writing tests have consistently been administered to students in grades 4, 8 and 10 in the spring of each year. In addition to being used to help ensure student learning, TAAS results are also used to hold schools and school systems "accountable" for student learning. By state law, the State Board of Education is mandated to rate the performance of schools and school districts according to a set of "academic excellence indicators," including TAAS results, dropout rates and student attendance rates (TEA, 1997, p. 159). State law also prescribes that student performance data be disaggregated by ethnicity and socioeconomic status. The performance rating system holds that school performance is not acceptable if the performance of all subgroups is not acceptable. Based primarily on percentage of students passing each of the TAAS tests, the more than 6,000 schools in Texas have been rated since 1994 as "exemplary," "recognized," "acceptable" or "unacceptable."
TAAS passing standards [for schools' performance ratings] . . . are based on the passing rates for all students and the disaggregated rates for four student groups: African American, Hispanic, White, and Economically Disadvantaged. Of the four categories, only the exemplary rating has had a consistent passing standard, requiring at least 90 percent of all students and each student group to pass each subject area. The recognized rating has increased from at least 65 percent of students passing in 1994 to a current 70 percent, the acceptable rating has gone from at least 25 percent passing to 30 percent, and the low-performing rating from less than 25 percent to less than 30 percent. (Gordon & Reese, 1997, p. 347-480)
Schools are eligible for cash awards for high ratings; and if they are rated as low performing twice in a row, they are subject to sanctions from the Texas Education Agency, including possible closure. In short, over the past decade TAAS has become an extremely high stakes test for students, educators and schools in the state of Texas. If students do not pass all three portions of the exit level version of TAAS (reading, math and writing), they cannot graduate from high school, regardless of grades in their high school courses. And schools' reputations, funding and their continued existence depend on students' performance on TAAS. (Note 3) Before summarizing TAAS results in the 1990s, it is useful to describe the tests themselves. The focus of test-based accountability in Texas is on the TAAS tests of reading, mathematics and writing (there are also TAAS tests of social studies and science and end-of course tests in some high school subjects). The TAAS tests are mostly multiple-choice in format. The numbers of questions on the TAAS tests varies somewhat across grade level versions, but the grade 10 (or exit level) versions
http://epaa.asu.edu/epaa/v8n41/part2.htm (3 of 4)7/30/2004 4:28:25 AM

EPAA Vol. 8 No. 41 Haney: The Myth of the Texas Miracle in Education--Part 2: Recent History of Testing in Texas
contain 48 reading questions, 60 math questions and 40 writing questions. The TAAS writing test also includes an open-ended question to which students must write their answers. The written composition portion of the TAAS writing test is scored on a 4-point scale (released versions of the TAAS tests are available at www.tea.state.tx.us/student.assessment/release.htm). Finally, I should mention that though several observers have described the TAAS tests as criterion-referenced, traditional norm-referenced test construction techniques (such as screening of candidate items in terms of item discrimination) have been used in their construction. Also it is clear that the TAAS tests have so few items that they cannot be used to yield reliable scores below the aggregate reading, math and writing levels—and as we will see, there is ample cause to doubt their reliability and validity even at these aggregate levels. Moreover, as will be explained, the passing scores on the TAAS test were set without any reference to performance criteria external to TAAS, but only after review of group performance on TAAS—in effect a norm-referenced rather than criterion-referenced comparison. As mentioned, by law the Texas State Board of Education was required to set passing scores on the TAAS tests (or as legislative language put it, "determine the level of performance considered to be satisfactory," TEA, 1997, p. 157). Here is how the Texas Student Assessment Program Technical Digest describes the evolution of the TAAS "passing standard":
In 1990 the State Board of Education set minimum expectations as equivalent to 70% of the multiple-choice items correct on the fall 1990 test and a score of at least 2 on the written composition. The 70%-equivalent standard was in effect beginning with the 1991-1992 school year. The 1990-1991 school year served as a transition from the previous assessment program, The Texas Assessment of Minimum Skills (TEAMS). The SBOE set the interim minimum expectations standard at 65% of the multiple-choice items correct for Grades 3, 3-Spanish, and 5, and 60% of the items correct for grades 7, 9 and exit level. A student also had to score at least 2 on the written composition to meet minimum expectations on the writing test. (TEA, 1997, p. 28)
So, since 1992 the passing scores on the TAAS exit level tests (reading, writing and math) have been set at a level equivalent to the 70% of items correct on Fall 1990 form of the tests. As new forms of the tests were used in subsequent years, analysts used test-equating methods to try to make passing scores on the new forms equivalent to 70% correct on the 1990 forms. (Note 4)
0: Home | 1: Intro. | 2: History | 3: The Myth | 4: TAAS | 5: Missing Students 6: Teachers | 7: Other Evidence | 8: Summary | Notes & Ref. | Appendix
http://epaa.asu.edu/epaa/v8n41/part2.htm (4 of 4)7/30/2004 4:28:25 AM
EPAA Vol. 8 No. 41 Haney: The Myth of the Texas Miracle in Education--Part 3: Evidence and Boosters of the Myth
Education Policy Analysis Archives
Volume 8 Number 41 The Texas Miracle in Education Walt Haney
3. Evidence and Boosters of the Myth
Given the consequences attached to performance on TAAS, it is not surprising that this test has had major impact on education in Texas. At first glance, this impact appears to have been largely positive; and it is evidence of the apparent positive impact of TAAS, and the Texas system of school accountability, that has helped give rise to the "miracle" story of education reform in Texas over the last decade. Four kinds of evidence seem to have been most widely cited as indicative of major improvements in education in Texas, namely: 1) sharp increases in the overall pass rates on TAAS during the 1990s; 2) apparent decreases in the achievement gap between White and minority students in Texas (again based on TAAS scores); 3) seemingly decreasing rates of students dropping out of school before high school graduation; and, 4) apparent confirmation of TAAS gains by results on the National Assessment of Educational Progress (NAEP).
3.1 Improved results on TAAS
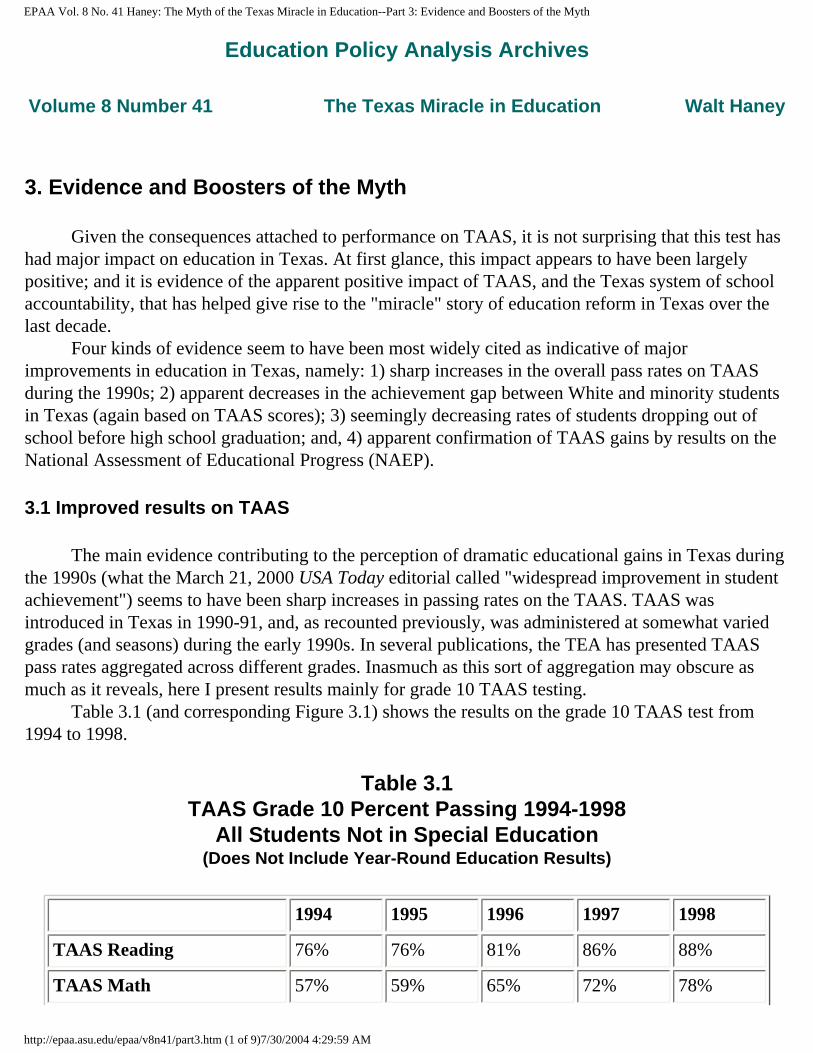
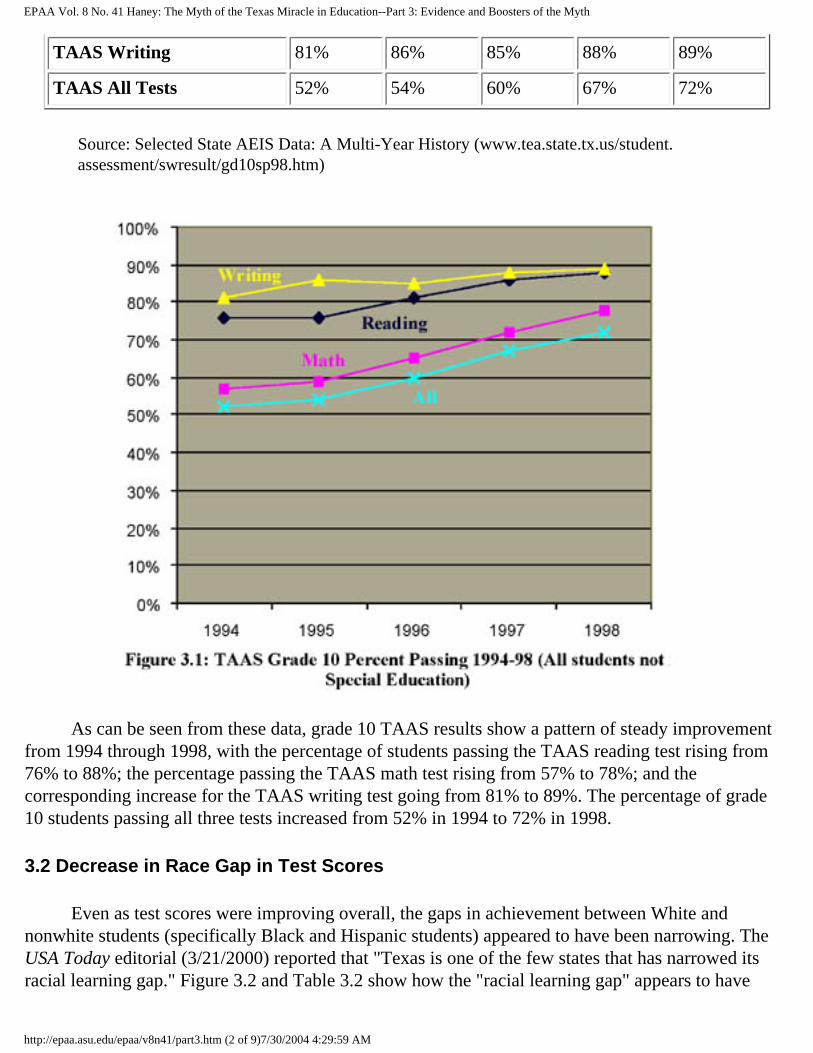
The main evidence contributing to the perception of dramatic educational gains in Texas during the 1990s (what the March 21, 2000 USA Today editorial called "widespread improvement in student achievement") seems to have been sharp increases in passing rates on the TAAS. TAAS was introduced in Texas in 1990-91, and, as recounted previously, was administered at somewhat varied grades (and seasons) during the early 1990s. In several publications, the TEA has presented TAAS pass rates aggregated across different grades. Inasmuch as this sort of aggregation may obscure as much as it reveals, here I present results mainly for grade 10 TAAS testing. Table 3.1 (and corresponding Figure 3.1) shows the results on the grade 10 TAAS test from 1994 to 1998.
Table 3.1TAAS Grade 10 Percent Passing 1994-1998
All Students Not in Special Education(Does Not Include Year-Round Education Results)
1994 1995 1996 1997 1998
TAAS Reading 76% 76% 81% 86% 88%
TAAS Math 57% 59% 65% 72% 78%
http://epaa.asu.edu/epaa/v8n41/part3.htm (1 of 9)7/30/2004 4:29:59 AM
EPAA Vol. 8 No. 41 Haney: The Myth of the Texas Miracle in Education--Part 3: Evidence and Boosters of the Myth
TAAS Writing 81% 86% 85% 88% 89%
TAAS All Tests 52% 54% 60% 67% 72%
Source: Selected State AEIS Data: A Multi-Year History (www.tea.state.tx.us/student.assessment/swresult/gd10sp98.htm)
As can be seen from these data, grade 10 TAAS results show a pattern of steady improvement from 1994 through 1998, with the percentage of students passing the TAAS reading test rising from 76% to 88%; the percentage passing the TAAS math test rising from 57% to 78%; and the corresponding increase for the TAAS writing test going from 81% to 89%. The percentage of grade 10 students passing all three tests increased from 52% in 1994 to 72% in 1998.
3.2 Decrease in Race Gap in Test Scores
Even as test scores were improving overall, the gaps in achievement between White and nonwhite students (specifically Black and Hispanic students) appeared to have been narrowing. The USA Today editorial (3/21/2000) reported that "Texas is one of the few states that has narrowed its racial learning gap." Figure 3.2 and Table 3.2 show how the "racial learning gap" appears to have
http://epaa.asu.edu/epaa/v8n41/part3.htm (2 of 9)7/30/2004 4:29:59 AM

EPAA Vol. 8 No. 41 Haney: The Myth of the Texas Miracle in Education--Part 3: Evidence and Boosters of the Myth
narrowed on the grade 10 TAAS tests (for economy of presentation here, I do not show results separately for the reading, writing, and math tests, but only the percentages of grade 10 students passing all three tests).
Table 3.2TAAS Grade 10 Percent Passing All Tests by Race 1994-1998
All Students Not in Special Education (Does Not Include Year-Round Education Results)
1994 1995 1996 1997 1998
Black 29% 32% 38% 48% 55%
Hispanic 35% 37% 44% 52% 59%
White 67% 70% 74% 81% 85%
Source: Selected State AEIS Data: A Multi-Year History: www.tea.state.tx.us/student.assessment/swresult/gd10sp98.htm
As can be seen, in 1994 there was a huge disparity in the grade 10 pass rates for Black and Hispanic students as compared with White students. The 1994 White pass rate of 67% was 38 points higher than the Black pass rate of 29%; and 32 points more than the Hispanic rate of 35%. In other
http://epaa.asu.edu/epaa/v8n41/part3.htm (3 of 9)7/30/2004 4:29:59 AM
EPAA Vol. 8 No. 41 Haney: The Myth of the Texas Miracle in Education--Part 3: Evidence and Boosters of the Myth
words, in 1994, White students were passing the grade 10 TAAS tests at about double the rate of Black and Hispanic students. This gap was just about what might have been predicted based on the 1990 field test results (see Table 2.1). By 1998, the White grade 10 pass rate had climbed 18 points to 85%. But the Black and Hispanic pass rates had climbed even more, 26 and 24 points respectively. So in a period of just five years, the race gaps had been reduced from 38 to 30 percentage points for Whites and Blacks and from 32 to 26 for Whites compared with Hispanic tenth grade students. Or in other words, minorities had increased their rate of passing grade 10 TAAS tests from less than 50% of the White pass rate to two-thirds of the White pass rate in just four years.
3.3 Decreases in Dropout Rates
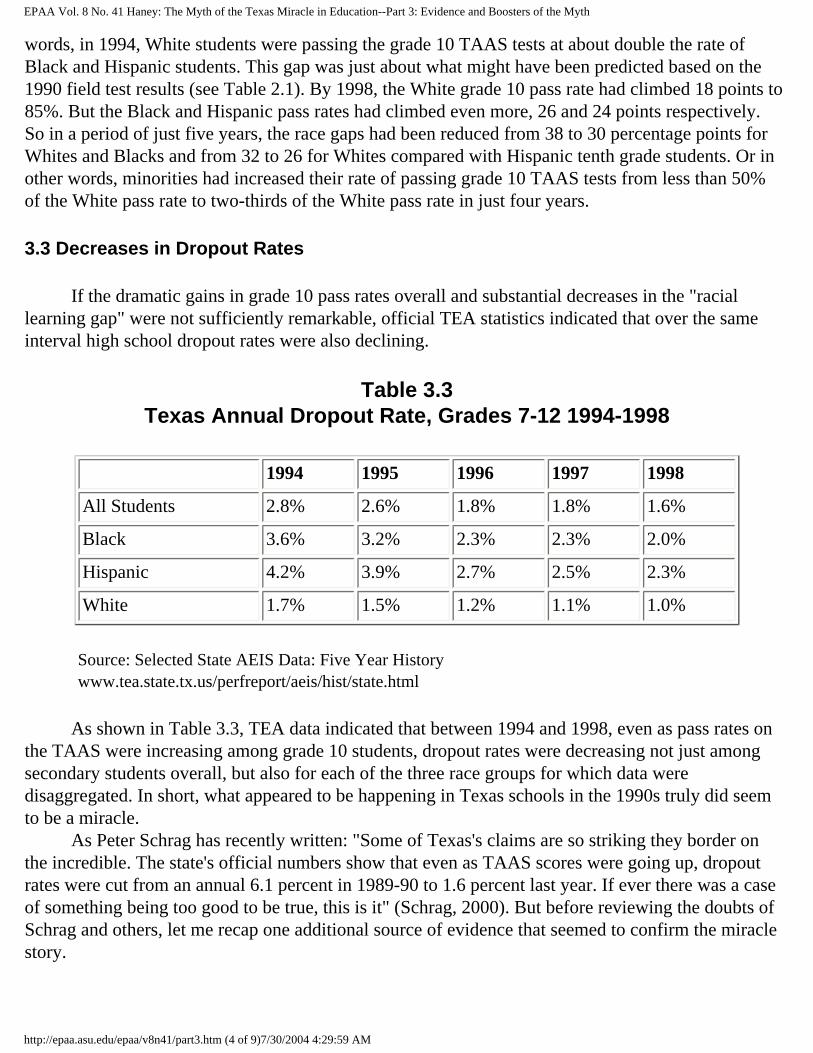
If the dramatic gains in grade 10 pass rates overall and substantial decreases in the "racial learning gap" were not sufficiently remarkable, official TEA statistics indicated that over the same interval high school dropout rates were also declining.
Table 3.3Texas Annual Dropout Rate, Grades 7-12 1994-1998
1994 1995 1996 1997 1998
All Students 2.8% 2.6% 1.8% 1.8% 1.6%
Black 3.6% 3.2% 2.3% 2.3% 2.0%
Hispanic 4.2% 3.9% 2.7% 2.5% 2.3%
White 1.7% 1.5% 1.2% 1.1% 1.0%
Source: Selected State AEIS Data: Five Year History www.tea.state.tx.us/perfreport/aeis/hist/state.html
As shown in Table 3.3, TEA data indicated that between 1994 and 1998, even as pass rates on the TAAS were increasing among grade 10 students, dropout rates were decreasing not just among secondary students overall, but also for each of the three race groups for which data were disaggregated. In short, what appeared to be happening in Texas schools in the 1990s truly did seem to be a miracle. As Peter Schrag has recently written: "Some of Texas's claims are so striking they border on the incredible. The state's official numbers show that even as TAAS scores were going up, dropout rates were cut from an annual 6.1 percent in 1989-90 to 1.6 percent last year. If ever there was a case of something being too good to be true, this is it" (Schrag, 2000). But before reviewing the doubts of Schrag and others, let me recap one additional source of evidence that seemed to confirm the miracle story.
http://epaa.asu.edu/epaa/v8n41/part3.htm (4 of 9)7/30/2004 4:29:59 AM

EPAA Vol. 8 No. 41 Haney: The Myth of the Texas Miracle in Education--Part 3: Evidence and Boosters of the Myth
3.4 NAEP Results for Texas
Anyone even remotely familiar with recent education history of the United States must view with some skepticism the meaningfulness of the almost inevitable increases in performance that follow introduction of a new testing program. When a new testing program is introduced, students and teachers have little familiarity with the specifics of the new tests. But after a few years, they become familiar with the style and format of the tests and students can be coached specifically for the test in question. Hence, performance—or at least average test scores—almost inevitably increases. That students can be successfully coached for particular tests has been well known among education researchers for decades. As far back as 1927, Glimore, for example, reported that students could be coached on Otis group intelligence tests "to the point of increasing their standing and score in intelligence tests even in the case of the material used in coaching being only similar and not identical with that of the basic test" (Gilmore, 1927, p. 321). Indeed what happens when students are coached for a specific test has come to called the "saw tooth" phenomenon because of the regular pattern in which scores steadily rise following introduction of a new testing program, only to fall dramatically when a different test is introduced (Linn, 2000, p. 7). The phenomenon of falsely inflated test scores was brought to wide public attention in the late 1980s and early 1990s because of publicity for what came to be known as the "Lake Wobegon" phenomenon in test results. Lake Wobegon is the mythical town in Minnesota popularized by Garrison Keillor in his National Public Radio program "A Prairie Home Companion." It is the town where "all the women are strong, all the men are good looking, and all the children are above average." In the late 1980s it was discovered that Lake Wobegon seemed to have invaded the nation's schools. For according to a 1987 report by John Cannell, the vast majority of school districts and all states were scoring above average on nationally normed standardized tests (Cannell, 1987). Since it is logically impossible for all of any population to be above average on a single measure, it was clear that something was amiss, that something about nationally normed standardized tests or their use had been leading to false inferences about the status of learning in the nation's schools. Cannell was a physician by training and not a specialist in education or education research. His original (1987) report was published by "Friends for Education," the foundation he established to promote accountability in education. A revised version of Cannell's report was published in the Summer 1988 issue of Educational Measurement: Issues and Practice (Cannell, 1988) together with responses and commentary from representatives of major test publishers and officials of the U.S Department of Education (Phillips and Finn, 1988; Drahozal and Frisbie, 1988; Lenke and Keene, 1988; Williams, 1988; Qualls-Payne, 1988; Stonehill, 1988). Cannell's charges regarding misleading test results were hotly debated in this and other forums. Some people doubted whether the Lake Wobegon phenomenon was real (that is, whether large majorities of states, schools and districts were in fact scoring above average on the national norms of the tests), while most observers accepted the reality of the phenomenon but disputed what caused it. Among the causes suggested and debated were problems in the original norming of the tests, outdated norms, lack of test security, manipulation of populations of students tested, artificial statistical manipulation of test results, and teachers and schools teaching to the tests, either purposely or inadvertently. The publicity surrounding the Lake Wobegon phenomenon was sufficiently widespread that the U.S. Department of Education funded researchers at the Center for Research on Evaluation,
http://epaa.asu.edu/epaa/v8n41/part3.htm (5 of 9)7/30/2004 4:29:59 AM

EPAA Vol. 8 No. 41 Haney: The Myth of the Texas Miracle in Education--Part 3: Evidence and Boosters of the Myth
Standards and Student Testing (CRESST) to investigate. On the basis of a survey of state directors of testing, Shepard (1989) concluded that the conditions for inflated test results—such as high stakes being pinned on test results, efforts to align curricula to the tests, and direct teaching to the tests—existed in virtually all of the states. And on the basis of an analysis of up to three years of test results from 35 states from which they were available, Linn, Graue and Sanders (1989) essentially confirmed Cannell's basic finding that test results across the nation were implausibly inflated—Lake Wobegon had invaded the nation's schools. For instance, they found that "for grades 1 through 6, the percentage of students scoring above the national median in mathematics ranges from a low of 58% in grade 4 for the 1985 school year to a high of 71% in grade 2 for the 1987-88 school year . . . " (p. 8). Linn, Graue and Sanders concluded that the use of old norms was one cause of the abundance of "above average scores" (p. 23), but also pointed out that in situations in which the same form of a test is used year after year, "increased familiarity with a particular form of a test" (p.24) likely contributed to inflated scores.
The practice of using a single form of a test year after year poses a logical threat to making inferences about the larger domain of achievement. Scores may be raised by focusing narrowly on the test objectives without improving achievement across the broader domain that the test objectives are intended to represent. Worse still, practice on nearly identical or even the actual items that appear on a test may be given. But as Dyer aptly noted some years ago, "if you use the test exercises as an instrument of teaching you destroy the usefulness of the test as an instrument for measuring the effects of teaching (Dyer, 1973, p. 89)." (Linn, Graue and Sanders, 1989, p. 25).
The problem was illustrated even more clearly in a subsequent study reported by Koretz, Linn, Dunbar & Shepard (1991), which compared test results on one "high- stakes" test, used for several years in a large urban school district, with those on a comparable test that had not been used in that district for several years. They found that performance on the regularly used high-stakes test did not generalize to other tests for which students had not been specifically coached, and again commented that "students in this district are prepared for high-stakes testing in ways that boost scores . . . substantially more than actual achievement in domains that the tests are intended to measure" (p. 2). To put the matter bluntly, teaching to a particular test undermines the validity of test results as measures of more general learning. While education researchers were essentially confirming Cannell's initial charges, the intrepid physician was continuing his own investigations. In late summer 1989, Cannell released a new report entitled The "Lake Wobegon" Report: How Public Educators Cheat on Standardized Achievement Tests. This time Cannell presented new instances of the Lake Wobegon phenomenon and a variety of evidence of outright fraud in school testing programs, including a sampling of testimony from teachers concerned about cheating on tests. After presenting results of his own survey of test security in the 50 states (concluding that security is generally so lax as to invite cheating), Cannell outlined methods to help people detect whether cheating is going on in their school districts, and "inexpensive steps" to help prevent it. More recently Koretz and Barron (1998; RAND, 1999) of the RAND Corporation investigated the validity of dramatic gains on Kentucky's high stakes statewide tests. Like Texas, Kentucky had
http://epaa.asu.edu/epaa/v8n41/part3.htm (6 of 9)7/30/2004 4:29:59 AM
EPAA Vol. 8 No. 41 Haney: The Myth of the Texas Miracle in Education--Part 3: Evidence and Boosters of the Myth
adopted policies to hold schools and teachers accountable for student performance on statewide tests. During the first four years of the program, Kentucky students showed dramatic improvements on the state tests. What Koretz and Barron sought to assess was the validity of the Kentucky test gains by comparing them with Kentucky student performance on comparable tests, specifically the National Assessment of Educational Progress (NAEP) and the American College Testing Program (ACT) college admissions tests. What they found was that the dramatic gains on the Kentucky test between 1992 and 1996 were simply not reflected in NAEP and ACT scores. They concluded that the Kentucky test scores "have been inflated and are therefore not a meaningful indicator of increased learning" (RAND, 1999). Even before the release of the report showing inflated test scores in Kentucky, anyone familiar with the Lake Wobegon phenomenon, widely publicized in the late 1980s and early 1990s, had to view the dramatic gains reported on TAAS in Texas in the 1990s with considerable skepticism. Were the gains on TAAS indicative of real gains in student learning, or just another instance of artificially inflated test scores? In 1997, results from the 1996 the National Assessment of Educational Progress (NAEP) in mathematics were released. The 1996 NAEP results showed that among the states participating in the state-level portion of the math assessment, Texas showed the greatest gains in percentages of fourth graders scoring at the proficient or advanced levels. Between 1992 and 1996, the percentage of Texas fourth grades scoring at these levels had increased from 15% to 25%. The same NAEP results also showed North Carolina to have posted unusually large gains at the grade 8 level, with the percentages of eighth graders in North Carolina scoring at the proficient or advanced levels improving from 9% in 1990 to 20% in 1996. (Reese et al., 1997) Putting aside for the moment that the 1996 NAEP results also showed that math achievement in these two states was no better (and in some cases worse) than the national average, these findings led to considerable publicity for the apparent success of education reform in these two states. The apparent gains in math, for example, led the National Education Goals Panel in 1997 to identify Texas and North Carolina as having made unusual progress in achieving the National Education Goals.
3.5 Plaudits for the Texas Miracle
In Spring 1998, Tyce Palmaffy published an article titled "The Gold Star State: How Texas jumped to the head of the class in elementary school achievement." Citing both 1996 NAEP results and TAAS score increases, Palmaffy praised Texas for being in the vanguard of "an accountability movement sweeping the states" (not surprisingly he also mentioned North Carolina and Kentucky). Regarding TAAS, Palmaffy reported "In 1994, barely half of Texas students passed the TAAS math exam. By last year, the proportion had climbed to 80 percent. What's more, the share of black and Hispanic children who passed the test doubled during that time to 64 percent and 72 percent respectively." Palmaffy's article, published in a Heritage Foundation journal, also included testimonials for the Texas success story from divergent vantage points. Kati Haycock, "director of the Education Trust, a Washington D.C.-based organization devoted to improving educational opportunities for low-income children" was quoted as touting Texas as "a real model for other states to follow." The article also referred to "researcher Heidi Glidden of the American Federation of
http://epaa.asu.edu/epaa/v8n41/part3.htm (7 of 9)7/30/2004 4:29:59 AM
EPAA Vol. 8 No. 41 Haney: The Myth of the Texas Miracle in Education--Part 3: Evidence and Boosters of the Myth
Teachers union" as praising the sort of education accountability system used in Texas. Meanwhile, the National Education Goals Panel had "commissioned Dr. David Grissmer, an education researcher with the RAND Corporation, to conduct an analysis of education reforms in both states [Texas and North Carolina] to determine that the improvements were indeed significant and to seek to identify the factors that could and could not account for their progress" (Grissmer & Flanagan, 1998, p. i). The National Education Goals Panel released the Grissmer/Flanagan report in November 1998. Without trying to recap or critique the Grissmer/Flanagan report here, let me simply summarize how it was conveyed to the outside world. The report was released November 5, 1998 with a press release titled "North Carolina and Texas Recognized as Models for Boosting Student Achievement." The first paragraph of the press release read:
(WASHINGTON, D.C.) A new study that both belies conventional wisdom about problems in K-12 education and illuminates some approaches for solving them points to the extraordinarily successful policies of two states North Carolina and Texas as models for reform throughout the nation. (NEGP, 11/5/98)
After quotes from North Carolina Governor Jim Hunt and Texas Governor George W. Bush, the press release went on to summarize the Grissmer/Flanagan findings. The researchers found that "several factors commonly associated with student achievement, such as real per pupil spending, teacher pupil ratios, teachers with advanced degrees, and experience level of teachers—are not adequate for explaining the test score gains." (National Education Goals Panel, November 5, 1998, p. 1). The press release explained that, instead, Grissmer and Flanagan attributed the achievement gains in Texas and North Carolina to three broad factors common to the two states (business leadership, political leadership, consistent reform agendas) and seven educational policies (adopting statewide standards by grade for clear teaching, holding all students to the same standards, linking statewide assessments to academic standards, creating accountability systems with benefits and consequences for results, increasing local control and flexibility for administrators and teachers, providing test scores and feedback via computer for continuous improvement, and shifting resources to schools with more disadvantaged students). Grissmer and Flanagan (1998) did not explain how they had determined that these were the factors behind the apparent achievement gains in Texas and North Carolina; but whatever the case, this 1998 report from the National Education Goals Panel, coupled with the sort of diverse support for the Texas model education accountability system cited by Palmaffy, seemed to certify the apparent miracle of education reform in Texas. The success of education reform in Texas was being heralded by observers as diverse as Palmaffy (of the Heritage Foundation), Haycock (head of an organization dedicated to improving the educational opportunities of low-income children), and Glidden (a researcher with one of the nation's largest teachers unions). The Grissmer/Flanagan report seemed to be the clincher. Here was a report from a bipartisan national group (the National Education Goals Panel), prepared by a Ph.D. researcher from a prestigious research organization, the RAND Corporation, that straight out said, "The analysis confirms that gains in academic achievement in both states are significant and sustained. North Carolina and Texas posted the largest average gains in student scores on tests of the National Assessment of Educational Progress (NAEP) administered between 1990 and 1997. These results are mirrored in state assessments during the same period, and
http://epaa.asu.edu/epaa/v8n41/part3.htm (8 of 9)7/30/2004 4:29:59 AM
EPAA Vol. 8 No. 41 Haney: The Myth of the Texas Miracle in Education--Part 3: Evidence and Boosters of the Myth
there is evidence of the scores of disadvantaged students improving more rapidly than those of advantaged students" (Grissmer & Flanagan, 1998, p. i). Few people seemed to notice that the Grissmer & Flanagan report was not actually published by RAND. Nonetheless, the report from the National Education Goals Panel seemed to certify the seeming miracle of education reform in Texas. Subsequently, the story of the Texas miracle has been circulated far and wide. Without trying to document all of the stories on the Texas miracle I have seen, let me mention here just two examples. On June 10, 1999, the Boston Globe ran a front-page story headlined "Embarrassed into success: Texas school experience may hold lessons for Massachusetts" (Daley, 1999). And on March 21, 2000, in the editorial cited at the start of this article, USA Today, in urging the U.S. Senate to adopt a Texas-style school accountability system for the $8 billion Title I program providing federal aid to poor schools, the editors cited "Texas-size school success" in the Lone Star state. In an apparent reference to 1996 NAEP results, the editorial cited the Education Trust as the source of evidence about gains in Texas on 1996 math tests administered nationally.
0: Home | 1: Intro. | 2: History | 3: The Myth | 4: TAAS | 5: Missing Students 6: Teachers | 7: Other Evidence | 8: Summary | Notes & Ref. | Appendix
http://epaa.asu.edu/epaa/v8n41/part3.htm (9 of 9)7/30/2004 4:29:59 AM
EPAA Vol. 8 No. 41 Haney: The Myth of the Texas Miracle in Education--Part 4: Problems with TAAS
Education Policy Analysis Archives
Volume 8 Number 41 The Texas Miracle in Education Walt Haney
4. Problems with TAAS
Two years ago when I agreed to help MALDEF on the TAAS case, I had no way of foreseeing the extent to which education reform in Texas would come to be touted as a model to be emulated elsewhere. Nonetheless, as I studied what had been happening with TAAS in Texas, I quickly came to think otherwise. Before summarizing what I think is wrong with TAAS and how it is being misused in Texas, I should mention that some of what I recount in the remainder of this article is based on two unpublished reports that I prepared in connection with the TAAS case—a preliminary report in December 1998, and supplementary report in July 1999 (Haney, 1998; 1999). However, it also draws on additional evidence acquired and analyses undertaken since completion of the supplementary report in summer 1999. The problems with TAAS and the way it is being used in Texas may be summarized under five sub-headings: 1) the TAAS is having a continuing adverse impact on Black and Hispanic students; 2) the use of the TAAS test in isolation to control award of high school diplomas is contrary to professional standards concerning test use; 3) the passing score on TAAS is arbitrary and discriminatory; 4) a variety of evidence casts doubt on the validity of TAAS scores; and 5) more appropriate use of test results would have more validity and less adverse impact.
4.1 Adverse impact
In previous research and law, three standards have been recognized for determining whether observed differences constitute discriminatory disparate impact: 1) the 80 percent (or four-fifths) rule; 2) tests of the statistical significance of observed differences; 3) and evaluation of the practical significance of differences. The "80 percent" or four-fifths rule refers to a provision of the 1978 Uniform Guidelines on Employee Selection Procedures (43 F.R. No. 166, 38290-38296, 1978) which reads:
Sec. 6D. Adverse impact and the "four-fifths rule." A selection rate for any race, sex or ethnic group which is less than four-fifths (or eighty percent) of the rate for the group with the highest rate will be generally regarded by Federal enforcement agencies as evidence of adverse impact, while a greater than four-fifths rate will generally not be regarded by Federal enforcement agencies as evidence of adverse impact. (As quoted in Fienberg, 1989, p. 91).
As a result of its standing in federal regulations, the 80 percent rule as a test of adverse or disparate impact has been widely recognized. Nonetheless, simple differences in percentage rates have
http://epaa.asu.edu/epaa/v8n41/part4.htm (1 of 24)7/30/2004 4:31:16 AM

EPAA Vol. 8 No. 41 Haney: The Myth of the Texas Miracle in Education--Part 4: Problems with TAAS
some undesirable properties. The simple difference, for example "is inevitably small when the two percentages are close to zero" (David H. Kaye and David A. Freedman, Reference guide on statistics, Federal Judicial Center, 1994). Hence, most observers and considerable case law now hold that in assessing disparate impact, it is important to apply not just the 80% or four- fifths rule but also to consider the practical and statistical significance of differences in selection or pass rates (Fienberg, 1989; Kaye & Freedman, 1994; see also, Office of Civil Rights, 1999). In previous reports regarding the TAAS case (Haney, 1998; 1999), I applied these three tests of adverse impact to a variety of TAAS results. However, for economy of presentation here, I provide only illustrative results. Eighty Percent or Four-Fifths Rule. To apply this test of adverse impact, we simply multiply the pass rates on TAAS for White students by 80% and check to see whether the pass rates for Blacks and Hispanics fall below these levels. Table 4.1 presents the application of the 80% rule to the TAAS results previously presented in Table 3.2 above. As can be seen, even though grade 10 pass rates for all three TAAS tests for Black and Hispanics have improved between 1994 and 1998, these pass rates still lag below 80% of the White pass rates. According to this standard of adverse impact, the TAAS grade 10 tests continue to show adverse impact on Black and Hispanic students. (Note 5)
Table 4.1Eighty Percent Rule and TAAS Grade 10 Pass Rates: Percent Passing All
Tests by Race 1994-1998 All Students Not in Special Education(Does Not Include Year-Round Education Results)
1994 1995 1996 1997 1998
White 67% 70% 74% 81% 85%
White*80% 53.6% 56.0% 59.2% 64.8% 68.0%%
Black 29% 32% 38% 48% 55%
Hispanic 35% 37% 44% 52% 59%
Source: Selected State AEIS Data: A Multi-Year History
Statistical Significance of Differences in Pass Rates. As mentioned, comparisons of simple percentages passing have some weaknesses from a statistical point of view. For example, differences in pass rates, particularly if small numbers of examinees are involved, may result from random variation in the particular sample of candidates who take an examination in a particular year. To check against this possibility, a second kind of standard for evaluating discriminatory disparate impact is generally employed; namely, a test of the statistical significance of observed differences. A test of statistical significance is used to assess the probability that a particular outcome (such as differences in proportions passing a test) might have occurred simply by chance or random sampling. The obvious statistical significance test to apply in a case such as that of proportions of
http://epaa.asu.edu/epaa/v8n41/part4.htm (2 of 24)7/30/2004 4:31:16 AM
EPAA Vol. 8 No. 41 Haney: The Myth of the Texas Miracle in Education--Part 4: Problems with TAAS
candidates passing the TAAS is the test of the difference in proportions of two populations. As explained in most statistics textbooks, such as Paul Hoel's Introduction to mathematical statistics (1971, pp. 134-137), if p
1 and p
2 refer to the proportions of successes in two samples, q
1 and q
2 refer
to the proportions of failures in the two samples, and n1 and n
2 refer to the sizes of the samples, the
standard error of the difference in proportions is calculated as follows:
SEdiff = (p 1
q1/n 1
+ p2q
2/ n
2) 1/2
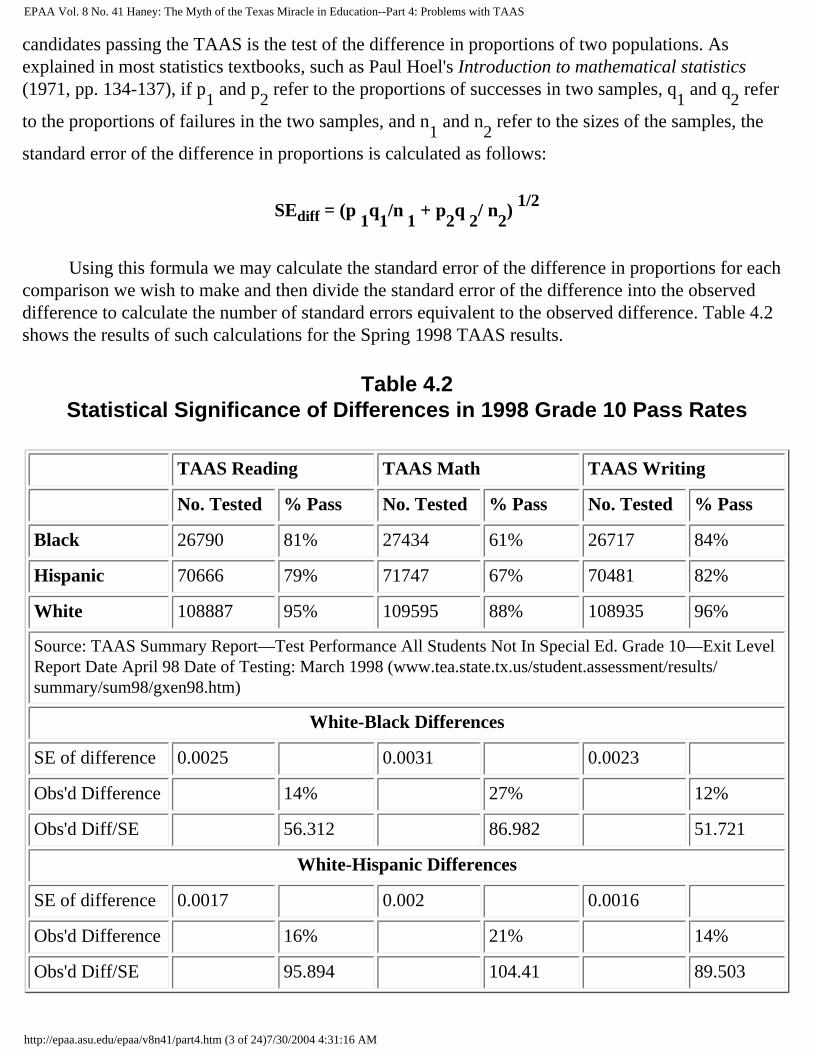
Using this formula we may calculate the standard error of the difference in proportions for each comparison we wish to make and then divide the standard error of the difference into the observed difference to calculate the number of standard errors equivalent to the observed difference. Table 4.2 shows the results of such calculations for the Spring 1998 TAAS results.
Table 4.2Statistical Significance of Differences in 1998 Grade 10 Pass Rates
TAAS Reading TAAS Math TAAS Writing
No. Tested % Pass No. Tested % Pass No. Tested % Pass
Black 26790 81% 27434 61% 26717 84%
Hispanic 70666 79% 71747 67% 70481 82%
White 108887 95% 109595 88% 108935 96%
Source: TAAS Summary Report—Test Performance All Students Not In Special Ed. Grade 10—Exit Level Report Date April 98 Date of Testing: March 1998 (www.tea.state.tx.us/student.assessment/results/summary/sum98/gxen98.htm)
White-Black Differences
SE of difference 0.0025 0.0031 0.0023
Obs'd Difference 14% 27% 12%
Obs'd Diff/SE 56.312 86.982 51.721
White-Hispanic Differences
SE of difference 0.0017 0.002 0.0016
Obs'd Difference 16% 21% 14%
Obs'd Diff/SE 95.894 104.41 89.503
http://epaa.asu.edu/epaa/v8n41/part4.htm (3 of 24)7/30/2004 4:31:16 AM

EPAA Vol. 8 No. 41 Haney: The Myth of the Texas Miracle in Education--Part 4: Problems with TAAS
As can be seen from Table 4.2, the differences in pass rates for both White-Black and White-Hispanic comparisons are easily statistically significant, with observed differences equivalent to some fifty to over 100 standard errors. (Other statistical tests on TAAS results also yield results of this magnitude; see Haney, 1998; 1999). Practical significance of observed differences What of the practical significance of the observed differences in the 1998 grade 10 TAAS pass rates? Later in this report, I discuss the apparent consequences of the TAAS for grade retention and dropping out of school, but for the moment let us simply examine the numbers of students involved in the differential pass rates. On the TAAS writing test in 1998, 96% of White students passed, 84% of Black students and 82% of Hispanic students. While these differences do not exceed the 80% rule (96%*0.80 = 76.8%), let us consider the numbers of students involved. Specifically we may consider the numbers of Black and Hispanic students who would have passed the 1998 grade 10 writing test had the passing rates for Black and Hispanic students been the same as that for White students. These numbers are approximately 3,200 Black students and 9,900 Hispanic students, for a total of about 13,000 (comparable calculations show that on the TAAS math for 1998, about 22,000 more Black and Hispanic students would have passed had their pass rates been the same as for White students). Do the differential results on the 1998 grade 10 TAAS writing test, on which approximately 13,000 more Black and Hispanic students failed than would have been the case had the Black and Hispanic pass rates been the same as that of White students, constitute practical adverse impact? Do the differential results on all of the 1998 grade 10 TAAS tests, on which close to 34,000 more Black and Hispanic students failed (10,700 Black and 23,200 Hispanic students) than would have been the case had the Black and Hispanic pass rates been the same as that for White students constitute practical adverse impact? The answer, especially when results are also suspect under both the 80% rule and tests of statistical significance, seems clear, at least to me. A test that leads to failure for tens of thousands more minority than non-minority students, had they had equivalent passing rates, surely has practical adverse impact. Hence, the validity and educational necessity of such a test deserve close scrutiny. Before turning to those issues, however, I should mention that in his opinion in the TAAS case on January 7, 2000, Judge Prado ruled that "Plaintiffs have made a prima facie showing of significant adverse impact" (p. 23, though it should be added that the opinion has a discussion of disparate impact in two places, pp.15-17 and 20-23)
4.2 TAAS Use in Isolation Violates Professional Standards
The use of TAAS scores in isolation to control award of high school diplomas (or for that matter use of any test results alone to make high stakes decisions about individuals or institutions) is contrary both to professional standards regarding testing and to sound professional practice. The standards to which I refer are the Standards for Educational and Psychological Testing published by the American Educational Research Association (AERA), the American Psychological Association (APA) and the National Council on Measurement in Education (NCME). These standards have been in existence for nearly 50 years (in current and previous editions; AERA, APA & NCME, 1985; 1999), and have been relied upon in numerous legal proceedings concerning testing in state and federal courts. (Note 6) One specific provision of these standards reads as follows:
http://epaa.asu.edu/epaa/v8n41/part4.htm (4 of 24)7/30/2004 4:31:16 AM

EPAA Vol. 8 No. 41 Haney: The Myth of the Texas Miracle in Education--Part 4: Problems with TAAS
Standard 13.7 In educational settings, a decision or characterization that will have a major impact on a student should not be made on the basis of a single test score. Other relevant information should be taken into account if it will enhance the overall validity of the decision. . . . It is important that in addition to test scores, other relevant information (e.g., school record, classroom observation, parent report) is taken into account by the professionals responsible for making the decision. (AERA, APA & NCME, 1999, pp. 146-47) (Note 7)
It seems clear that the practice in Texas of controlling award of high school diplomas on the basis of TAAS test scores in isolation without weighing other relevant information such as students' grades in high school (HSGPA) is contrary to this provision of the 1999 Standards for Educational and Psychological Testing (and the corresponding provision of the 1985 Standards). Witnesses for the state of Texas during the TAAS trial (Susan Phillips and William Mehrens) disputed my interpretation of this standard. Here is how Judge Prado summarized and resolved the dispute in his decision:
There was little dispute at trial over whether this standard exists and applies to the TAAS exit-level examination. What was disputed was whether the TAAS test is actually the sole criterion for graduation. As the TEA points out, in addition to passing the TAAS test, Texas students must also pass each required course by 70 percent. See Texas Admin. Code § 74.26(c). Graduation in Texas, in fact, hinges on three separate and independent criteria: the two objective criteria of attendance and success on the TAAS examination, and the arguably objective/subjective criterion of course success. However, as the Plaintiffs note, these factors are not weighed with and against each other; rather, failure to meet any single criterion results in failure to graduate. Thus, the failure to pass the exit-level exam does serve as a bar to graduation, and the exam is properly called a "high-stakes" test. On the other hand, students are given at least eight opportunities to pass the examination prior to their scheduled graduation date. In this regard, a single TAAS score does not serve as the sole criterion for graduation. The TEA presented persuasive evidence that the number of testing opportunities severely limits the possibility of "false negative" results and actually increases the possibility of "false positives," a fact that arguably advantages all students whose scores hover near the borderline between passing and failing. (Prado 2000, pp. 14-15)
Nonetheless, I believe that my interpretation of this standard is more in keeping with preponderance of professional opinion than are the narrow interpretations offered by the witnesses for the state of Texas. This may be illustrated by reference to the 1999 report from the Board on Testing and Assessment of the Commission on Behavioral and Social Sciences of the National Research Council. As a result of increasing controversy over high stakes testing, the U.S. Congress passed
http://epaa.asu.edu/epaa/v8n41/part4.htm (5 of 24)7/30/2004 4:31:16 AM
EPAA Vol. 8 No. 41 Haney: The Myth of the Texas Miracle in Education--Part 4: Problems with TAAS
legislation in 1997 requesting that the National Academy of Sciences undertake a study and make recommendations regarding the appropriate use of tests for student grade promotion, tracking and graduation (Heubert & Hauser, 1999, p. 1). The resulting report High Stakes: Testing for Tracking, Promotion, and Graduation specifically cites Standard 8.12 of the 1985 joint standards and clearly points out that a compensatory or sliding scale approach to using test scores in combination with grades would be "more compatible with current professional standards" than using an absolute cut-off score on a test to control high school graduation (Heubert & Hauser, 1999, pp. 165-66). More generally, this National Research Council report recommends:
High stakes decisions such as tracking, promotion, and graduation should not automatically be made on the basis of a single test score but should be buttressed by other relevant information about students' knowledge and skills such as grades, teacher recommendations and extenuating circumstances. (Heubert & Hauser, 1999, p. 279) (Note 8)
Ironically enough, reliance on TAAS scores in isolation to control award of high school diplomas in Texas is even contrary to the following passage from the TEA's own Texas Student Assessment Program Technical Digest:
All test result uses regarding individual students or groups should incorporate as much data as possible. . . . Student test scores should also be used in conjunction with other performance indicators to assist in making placement decisions, such as whether a student should take a reading improvement course, be placed in a gifted and talented program or exit a bilingual program. (pp. 2-3)
In sum, the state of Texas's use of TAAS scores in isolation, without regard to students' high school grades, to control award of high school diplomas, is contrary not only to both professional standards regarding test use and the advice of the recent NRC report, but also to the TEA's own advice on the need to use test results in conjunction with other performance indicators.
4.3 Passing scores on TAAS Arbitrary and Discriminatory
The problem of using TAAS scores in isolation to control award of high school diplomas is exacerbated by the fact that the passing scores set for TAAS are arbitrary and discriminatory. This is important because when a pass or cut score is set on a test, the validity of the test depends not just on test content, administration and scoring, but also on the manner in which the passing score is set. The 1999 Standards for Educational and Psychological Testing state:
Standard 4.19 When proposed score interpretations involve one or more cut scores, the rationale and procedures used for establishing cut scores should be clearly documented. (AERA, APA & NCME, 1999, p. 59)
http://epaa.asu.edu/epaa/v8n41/part4.htm (6 of 24)7/30/2004 4:31:16 AM
EPAA Vol. 8 No. 41 Haney: The Myth of the Texas Miracle in Education--Part 4: Problems with TAAS
Also, standard 2.14 says that "Where cut scores are specified for selection or classification, the standard errors of measurement should be reported in the vicinity of each cut score (AERA, APA & NCME, 1999, p. 35) . (Note 9) Considerable technical and professional literature has been published on alternative methods for setting passing scores on tests. Glass (1978) wrote an early critique of methods of setting passing scores that questioned the very advisability of even attempting to make this use of tests. In 1986, Ronald Berk published "A consumer's guide to setting performance standards on criterion-referenced tests" (Review of Educational Research, 56:1, 137-172) in which he reviewed 38 different methods for setting standards (or pass or cut-scores) on standardized tests. (Note 10) I sought to learn exactly how the passing scores were set on the TAAS in 1990 and to obtain copies of any data that were used in the process of setting passing scores on the TAAS exit test. The most complete account of the process by which the passing scores were set is provided in Appendix 9 of the Texas Student Assessment Program Technical Digest for the Academic Year 1996-1997, (TEA, 1997, pp. 337-354). Specifically contained in this appendix are 1) a memo dated July 14, 1990, from Texas Education Commissioner Kirby to members of the state Board of Education (including a summary of results from a field test of the TAAS) and 2) Minutes of the State Board of Education meeting in July 1990 at which the passing scores on the grade 10 TAAS were established. In his memo, Commissioner Kirby recommended a passing score of 70% correct for the exit level of TAAS, but also recommended that this standard be phased in over a period of three years, with the passing score of 60% proposed for Fall 1990. After considerable discussion, the State Board voted unanimously to adopt the recommendations of the commissioner regarding the Texas Assessment of Academic Skills, specifically that: "For the Academic Skills Level, a minimum standard of 70% of the test items must be answered correctly." Following a statement by a Dr. Crawford about the importance of giving "notice regarding the standard required for graduation from high school . . . to those students who will be taking the exit level test" (p. 6/353), the Board also voted 11 to 3 in favor of an amendment to the original proposal to "give notice that the 1991-92 standard will be 70" (p. 7/354). What struck me about this record of how the passing score on the TAAS exit test was set are the following:
1. The process was not based on any of the professionally recognized methods for setting passing standards on tests;
2. It appears to have failed completely to take the standard error of measurement into account; and,
3. As I explain below, the process yielded a passing score that effectively maximized the adverse impact of the TAAS exit test on Black and Hispanic students.
Before I elaborate on the latter point, let me emphasize that from the available record I have done my utmost to understand the rationale that motivated the Board to set the passing score where it did, namely at 70% correct. As best I can tell from the record, the main reasons for setting the passing score at 70% correct appear to have been that this is where the passing score had been set on TEAMS and this level was suggested by the Texas Education Code. The minutes of the Board meeting report that "the Commissioner cited the portion of the Texas Education code that requires 70 percent as
http://epaa.asu.edu/epaa/v8n41/part4.htm (7 of 24)7/30/2004 4:31:17 AM
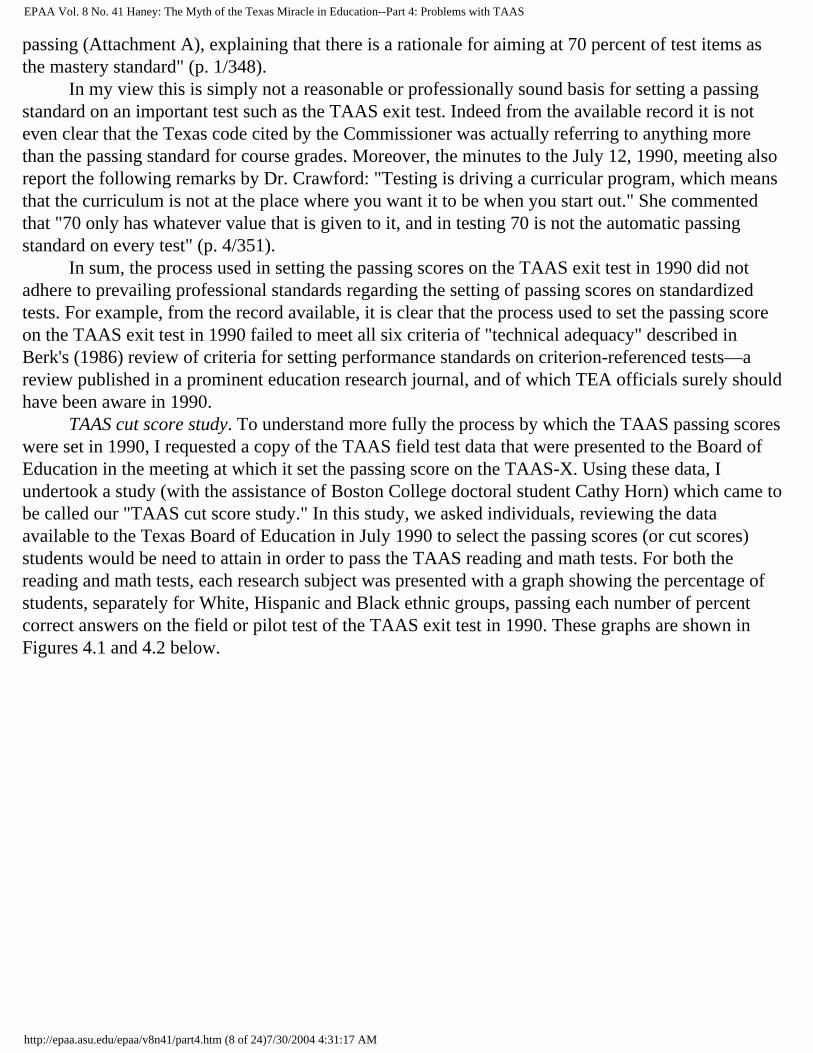
EPAA Vol. 8 No. 41 Haney: The Myth of the Texas Miracle in Education--Part 4: Problems with TAAS
passing (Attachment A), explaining that there is a rationale for aiming at 70 percent of test items as the mastery standard" (p. 1/348). In my view this is simply not a reasonable or professionally sound basis for setting a passing standard on an important test such as the TAAS exit test. Indeed from the available record it is not even clear that the Texas code cited by the Commissioner was actually referring to anything more than the passing standard for course grades. Moreover, the minutes to the July 12, 1990, meeting also report the following remarks by Dr. Crawford: "Testing is driving a curricular program, which means that the curriculum is not at the place where you want it to be when you start out." She commented that "70 only has whatever value that is given to it, and in testing 70 is not the automatic passing standard on every test" (p. 4/351). In sum, the process used in setting the passing scores on the TAAS exit test in 1990 did not adhere to prevailing professional standards regarding the setting of passing scores on standardized tests. For example, from the record available, it is clear that the process used to set the passing score on the TAAS exit test in 1990 failed to meet all six criteria of "technical adequacy" described in Berk's (1986) review of criteria for setting performance standards on criterion-referenced tests—a review published in a prominent education research journal, and of which TEA officials surely should have been aware in 1990. TAAS cut score study. To understand more fully the process by which the TAAS passing scores were set in 1990, I requested a copy of the TAAS field test data that were presented to the Board of Education in the meeting at which it set the passing score on the TAAS-X. Using these data, I undertook a study (with the assistance of Boston College doctoral student Cathy Horn) which came to be called our "TAAS cut score study." In this study, we asked individuals, reviewing the data available to the Texas Board of Education in July 1990 to select the passing scores (or cut scores) students would be need to attain in order to pass the TAAS reading and math tests. For both the reading and math tests, each research subject was presented with a graph showing the percentage of students, separately for White, Hispanic and Black ethnic groups, passing each number of percent correct answers on the field or pilot test of the TAAS exit test in 1990. These graphs are shown in Figures 4.1 and 4.2 below.
http://epaa.asu.edu/epaa/v8n41/part4.htm (8 of 24)7/30/2004 4:31:17 AM
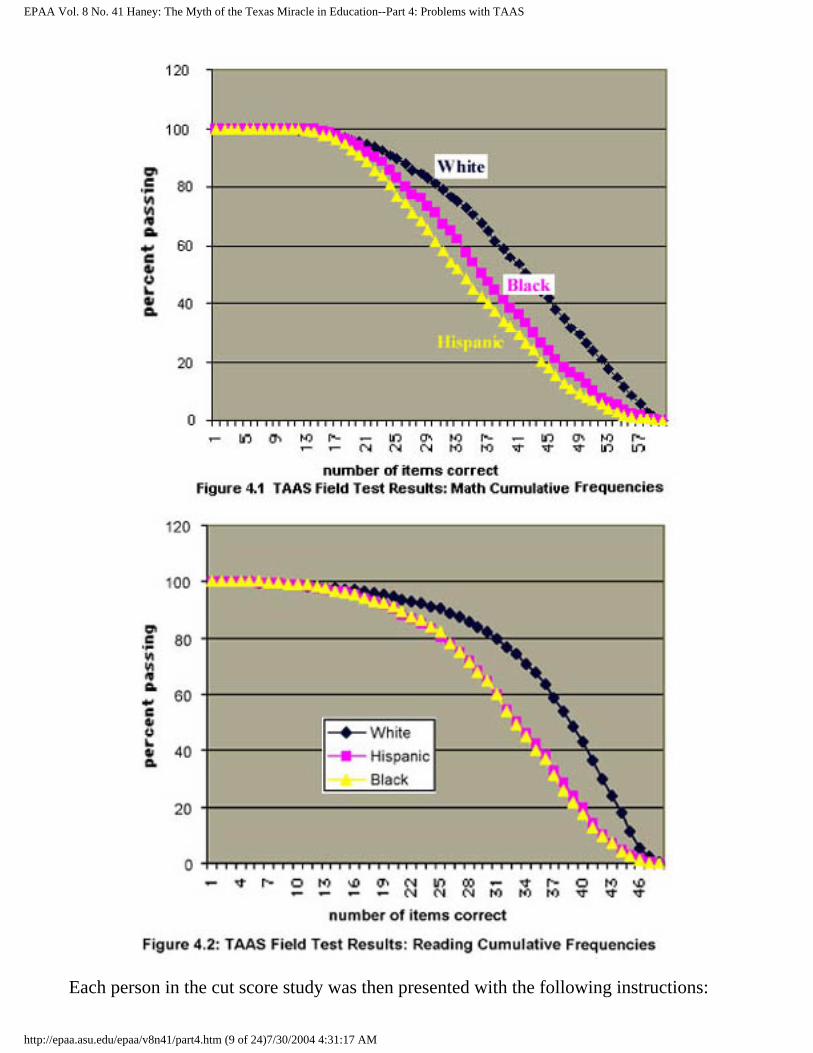
EPAA Vol. 8 No. 41 Haney: The Myth of the Texas Miracle in Education--Part 4: Problems with TAAS
Each person in the cut score study was then presented with the following instructions:
http://epaa.asu.edu/epaa/v8n41/part4.htm (9 of 24)7/30/2004 4:31:17 AM

EPAA Vol. 8 No. 41 Haney: The Myth of the Texas Miracle in Education--Part 4: Problems with TAAS
The following graph presents the percentage of students passing the reading / math section of the Texas Assessment of Academic Skills (TAAS) at each number of questions answered correctly. Choose the number of questions correct that most clearly differentiates White students (represented by a black line) from Black and Hispanic students.
Respondents could then ask clarifying questions before selecting a response. After a pilot test of the cut score study in 1998, Ms. Horn (a native of Texas and secondary school teacher there before she came to Boston College for graduate studies) extended the cut score study to nine Texans. The exercise was administered, by phone or in person, to 9 individuals residing in the state of Texas. (Those individuals who were interviewed by phone had paper copies of the Figure 4.1 and 4.2 graphs and the prompt for the exercise in front of them when they selected cut points.) The professions of the nine respondents are listed below.
Respondents (all currently living in Texas):2 teachers3 engineers2 college students1 financial analyst1 director of communications
The cut or passing scores selected by these nine individuals as most clearly differentiating between White students and Black/Hispanic students are shown in Table 4.3 below.
Table 4.3Results of Cut Score Study with Nine Texans
Reading Math
Person 1 34 34
Person 2 35 37
Person 3 35 38
Person 4 34 37
Person 5 36 40
Person 6 33 40
Person 7 34 37
Person 8 36 43
http://epaa.asu.edu/epaa/v8n41/part4.htm (10 of 24)7/30/2004 4:31:17 AM
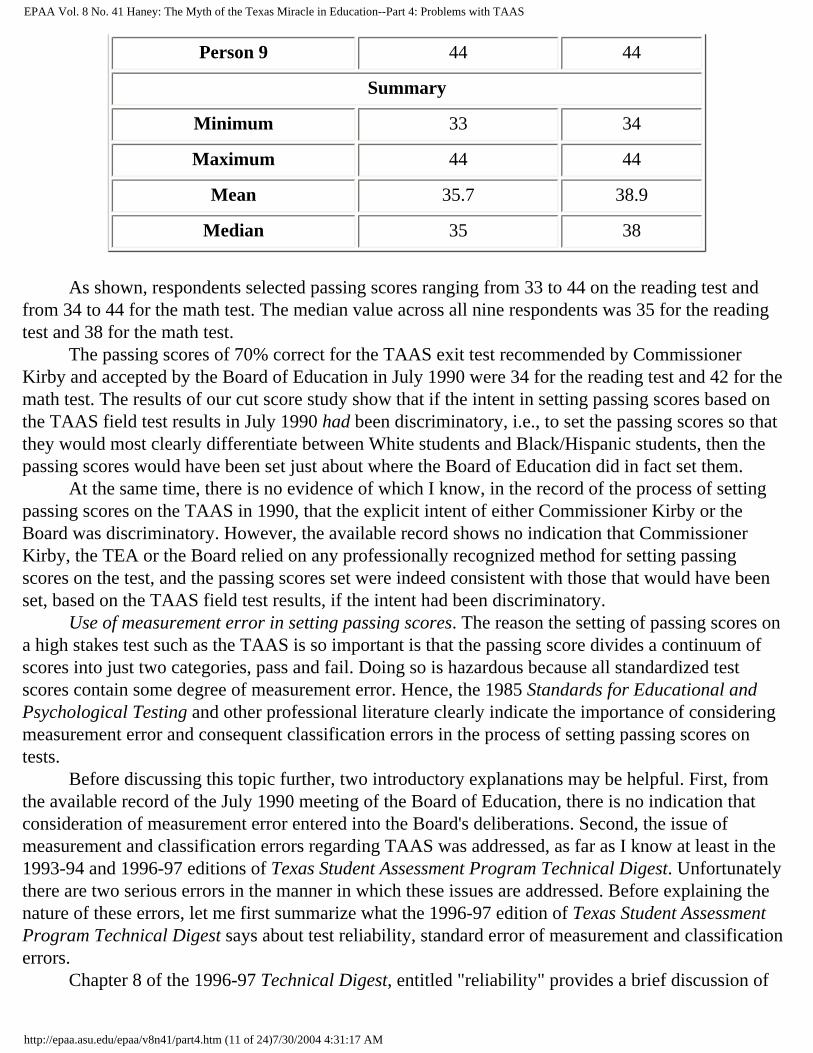
EPAA Vol. 8 No. 41 Haney: The Myth of the Texas Miracle in Education--Part 4: Problems with TAAS
Person 9 44 44
Summary
Minimum 33 34
Maximum 44 44
Mean 35.7 38.9
Median 35 38
As shown, respondents selected passing scores ranging from 33 to 44 on the reading test and from 34 to 44 for the math test. The median value across all nine respondents was 35 for the reading test and 38 for the math test. The passing scores of 70% correct for the TAAS exit test recommended by Commissioner Kirby and accepted by the Board of Education in July 1990 were 34 for the reading test and 42 for the math test. The results of our cut score study show that if the intent in setting passing scores based on the TAAS field test results in July 1990 had been discriminatory, i.e., to set the passing scores so that they would most clearly differentiate between White students and Black/Hispanic students, then the passing scores would have been set just about where the Board of Education did in fact set them. At the same time, there is no evidence of which I know, in the record of the process of setting passing scores on the TAAS in 1990, that the explicit intent of either Commissioner Kirby or the Board was discriminatory. However, the available record shows no indication that Commissioner Kirby, the TEA or the Board relied on any professionally recognized method for setting passing scores on the test, and the passing scores set were indeed consistent with those that would have been set, based on the TAAS field test results, if the intent had been discriminatory. Use of measurement error in setting passing scores. The reason the setting of passing scores on a high stakes test such as the TAAS is so important is that the passing score divides a continuum of scores into just two categories, pass and fail. Doing so is hazardous because all standardized test scores contain some degree of measurement error. Hence, the 1985 Standards for Educational and Psychological Testing and other professional literature clearly indicate the importance of considering measurement error and consequent classification errors in the process of setting passing scores on tests. Before discussing this topic further, two introductory explanations may be helpful. First, from the available record of the July 1990 meeting of the Board of Education, there is no indication that consideration of measurement error entered into the Board's deliberations. Second, the issue of measurement and classification errors regarding TAAS was addressed, as far as I know at least in the 1993-94 and 1996-97 editions of Texas Student Assessment Program Technical Digest. Unfortunately there are two serious errors in the manner in which these issues are addressed. Before explaining the nature of these errors, let me first summarize what the 1996-97 edition of Texas Student Assessment Program Technical Digest says about test reliability, standard error of measurement and classification errors. Chapter 8 of the 1996-97 Technical Digest, entitled "reliability" provides a brief discussion of
http://epaa.asu.edu/epaa/v8n41/part4.htm (11 of 24)7/30/2004 4:31:17 AM

EPAA Vol. 8 No. 41 Haney: The Myth of the Texas Miracle in Education--Part 4: Problems with TAAS
internal consistency estimates and formulas for calculating internal consistency reliability estimates (p.41). This is followed (p. 42) by a discussion of (and formulas for) calculating standard errors of measurement from reliability estimates. These discussions provide references to appendix 7 which shows data to indicate that for the Spring 1997 administration of TAAS at grade 10 (administered to 214,000 students) the internal consistency estimates for the TAAS math, reading and writing sub-tests were 0.934, 0.878 and 0.838, respectively; and the corresponding standard errors of measurement were 2.876, 2.352 and 2.195. This represents the first serious error in the technical report's handling of measurement and classification error. Specifically, while the technical report bases the calculation of standard error of measurement on internal consistency reliability estimates, it clearly should have been based on test-retest or alternate-forms reliability estimates. Test-retest reliability refers to the consistency of scores on two administrations of a test. Alternate-forms reliability refers to the consistency of scores on two different forms or versions of the same test. Since the purpose of TAAS testing is not simply to estimate students' performance on one version of the TAAS test, but to estimate their competence in reading, math and writing, in general, as might be measured by any version of the relevant TAAS tests, alternate-forms reliability is more appropriate for assessing reliability than is internal consistency reliability. As Thorndike and Hagen (1977, p. 79) point out in their textbook on measurement and evaluation, "evidence based on equivalent test forms should usually be given the most weight in evaluating the reliability of a test." In general, alternate forms test reliability tends to be lower than internal consistency reliability. Hence, it seems clear to me that the figures reported in the 1996-97 Technical Digest overestimate the relevant reliability of grade 10 TAAS test scores and underestimate the standard error of measurement associated with TAAS scores. I have attempted to estimate the alternate-forms reliability of TAAS test scores using two independent sources of data. First I employed the cross-tabulations reported by Linton & Debeic (1992) of test-retest data on students in several large Texas districts who took the TAAS exit level test in October 1990 and again in April 1991. Using the Linton & Debeic cross tabular results, I calculated the following test-retest correlations: TAAS-Reading 0.536; TAAS-Math 0.643; and TAAS-Writing 0.555. Second, as part of the background work for the TAAS case, Mark Fassold developed a remarkable longitudinal database of all 1995 sophomore students in Texas and their TAAS scores on up to ten different administrations of TAAS:
1 March 1995 2 May 1995 3 July 1995 4 October 1995 5 March 1996 6 May 1996 7 July 1996 8 October 1996 9 February 1996 10 April 1996
http://epaa.asu.edu/epaa/v8n41/part4.htm (12 of 24)7/30/2004 4:31:17 AM

EPAA Vol. 8 No. 41 Haney: The Myth of the Texas Miracle in Education--Part 4: Problems with TAAS
At my request Mr. Fassold ran an analysis of all test-retest correlations on this cohort of students (total N of about 230,000). Correlations were calculated separately by ethnic group and for TAAS Reading and Math tests. Given 16 different test-retest possibilities this yielded 214 different coefficients (2 x 16 x 6 ethnic groups). Results varied widely (in part because in some comparisons sample sizes were very small). Overall, however, the observed test-retest correlations tended to cluster in the 0.30 to 0.50 range. These test-retest correlations based on both the Linton-Debeic and Fassold data are, however, attenuated in that in both data sets only students who failed a TAAS test took it again. There are methods for correcting observed test-retest correlations for such attenuation (see Haney, Fowler and Wheelock, 1999, for an example), but as a more conservative approach here, let me simply discuss what previously published literature suggests about the relationships between test-retest and internal consistency reliability. As mentioned above, the 1996-97 Technical Digest cites internal consistency reliability estimates for the three grade 10 TAAS sub-tests of 0.934, 0.878 and 0.838, and standard errors of measurement of 2.876, 2.352 and 2.195. It is common for tests which show internal consistency reliability of about 0.90 to show alternate forms reliability of 0.85 or 0.80 (see for example, Thorndike & Hagen, 1977, p. 92). On page 42 of the 1996-97 Technical Digest, the example is shown in which a test with an internal consistency reliability of 0.90 (and a standard deviation of 6.3) is estimated to have a standard error of measurement of 2.0. However, if instead of an internal consistency reliability of 0.90, we were to use in these calculations an alternate forms reliability of 0.85 or 0.80, the resulting standard errors of measurement would be 2.44 and 2.82. This suggests that the appropriate standard errors of measurement for the TAAS tests may be on the order of 20 to 40% greater than the estimates reported in the TAAS 1996-97 Technical Digest. The second serious error in the technical report's handling of measurement and classification error occurs on pages 30 and 31 in a section labeled " Exit level testing standards and the standard error of measurement." Here the authors of the 1996-97 Technical Digest point out that a student with a "true achievement level at the passing standard would be likely to pass on the first attempt only 50% of the time" (p. 31). This passage then goes on to assert that "if such a student has attempted that test eight times, the student's passing is almost assured (probability of passing is 99.6%)" (p. 31). In other words, the chances of a minimally qualified student failing the TAAS eight times and being misclassified as not having the requisite skills is only 0.4% (0.50 to the 8th power is 0.0039). This calculation strikes me as erroneous, or at least potentially badly misleading, because the authors have presented absolutely no evidence to show the probability that a student who fails the TAAS will continue to take the test seven more times. As I explain later, available evidence suggests that students who fail the TAAS grade 10 test more than once or twice are likely to be held back in grade and to drop out of school long before they reach grade 12 by which time they would have had a chance to take the TAAS exit test eight times. Since 0.50 to the second power is 0.25; and to the third power is 0.125, this indicates that a student with a "true achievement level at the passing standard" who takes the TAAS twice or three times, before becoming discouraged and not taking the test again, has a 25% or 12.5% chance of being misclassified as failing. Before proceeding to present evidence bearing on this point, let me discuss how the standard error of measurement might usefully have been taken into account in adjusting passing scores. Because of the error of measurement in test scores, when scores are used to make pass-fail decisions
http://epaa.asu.edu/epaa/v8n41/part4.htm (13 of 24)7/30/2004 4:31:17 AM

EPAA Vol. 8 No. 41 Haney: The Myth of the Texas Miracle in Education--Part 4: Problems with TAAS
about students, two kinds of classification errors can occur. A truly unqualified student can pass the test (a false pass) or a truly qualified student can fail the test (a false failure). How one thinks about the balance of these two misclassification errors depends on the risks (or benefits and costs) associated with each type of misclassification. If one were confident that a student failing TAAS would receive special attention and support educationally, one might be inclined to weigh false passes as more serious than false failures. If on the other hand, one thought that students failing TAAS were unlikely to receive effective instruction, and instead merely to be retained in grade 10 and to be stigmatized as failures, then one would probably feel that false failures would be more harmful than false passes. Here is how Berk (1986) discussed this point:
Assessing the relative seriousness of these consequences, is a judgmental process. It is possible to assign plusses (benefits) and minuses (costs or losses) to the consequences so that the cutoff scores can be set in favor of a specific error reduction rate. A loss ratio (benefits: losses) can be specified for each decision application with the cutoff score adjusted accordingly. (Berk, 1986, p. 139).
To study the relative risks associated with the two kinds of classification errors associated with a high school graduation test, with the assistance of Kelly Shasby, (a doctoral sudent in the Educational Research, Measurement and Evaluation program at Boston College), I undertook what came to be known as our "risk analysis" study. The survey form used in the risk analysis study was entitled "Survey of risk associated with classification decisions" and opened with the following introduction:
When classifying large numbers of individuals using standardized exams, two different kinds of mistakes are made. Some people will be falsely classified as "qualified" or "passing" while others will be falsely classified as "unqualified" or "failing." There is a degree of risk associated with mistakes of this kind, both for the individual who is incorrectly classified and for the society in which that individual lives. We would like your help in assessing the severity of the risk, or possible harm, caused to individuals and to society when mistakes are made on a number of different types of standardized tests. The purpose of this survey is to assess the public's perception of misclassifications of individuals. These misclassifications can have an impact on the individual and on the society in which that individual lives. This impact has the potential to be harmful, and we are interested in determining how harmful the public thinks different misclassifications can be. On a scale from 1 to 10, 1 being "minimum harm" and 10 being "maximum harm," rate each scenario with respect to the degree of harm it would cause that individual and then the degree of harm it would cause society. Then circle the number, which corresponds, to the rating you chose.
After this introduction, respondents were asked to rate the risk on a 1 to 10 scale of harm
http://epaa.asu.edu/epaa/v8n41/part4.htm (14 of 24)7/30/2004 4:31:17 AM

EPAA Vol. 8 No. 41 Haney: The Myth of the Texas Miracle in Education--Part 4: Problems with TAAS
associated with 16 different misclassifications that might results from classifying people pass-fail based on standardized test results. Respondents were asked to rate separately the harm to individuals and to society—and to give credit where it is due, this distinction, a clear improvement over the initial version of our survey, was suggested by Ms. Shasby. Specifically, survey respondents were asked to rate the degree of harm, separately for individuals and society, associated with the following kinds of misclassification:
1. A kindergartner who is ready to enter school is denied entrance.2. A kindergartner who is not ready to enter school is granted entrance.3. An airline pilot who is not qualified is given a license to fly.4. An airline pilot who is qualified is denied a license to fly.5. A qualified high school student is denied a diploma.6. An unqualified high school student is granted a diploma.7. A qualified accountant is denied certification.8. An unqualified accountant is granted certification.9. A qualified student is denied promotion from grade eight to grade nine.
10. An unqualified student is granted promotion from grade eight to grade nine.11. A qualified doctor is denied a license to practice.12. An unqualified doctor is granted a license to practice.13. A qualified candidate is denied admission into college.14. An unqualified candidate is granted admission into college.15. A qualified teacher is denied certification.16. An unqualified teacher is granted certification.
The risk survey form was sent to a random sample of 500 secondary teachers in Texas (specifically only math and English/Language Arts teachers) on May 23, 1999. As of June 30, 1999, we had received 66 responses (representing a response rate of 13.2%). (Note 11) Table 4.4 below summarizes the results of the risk analysis survey.
Table 4.4Results of Risk Analysis Survey with Secondary Teachers in Texas
For
individualFor
society
Mean SD Mean SD
1. A kindergartner who is ready to enter school is denied entrance. 6.45 2.67 3.94 2.64
2. A kindergartner who is not ready to enter school is granted entrance. 7.20 2.23 5.06 2.71
3. An airline pilot who is not qualified is given a license to fly. 8.36 2.32 9.55 1.00
http://epaa.asu.edu/epaa/v8n41/part4.htm (15 of 24)7/30/2004 4:31:17 AM
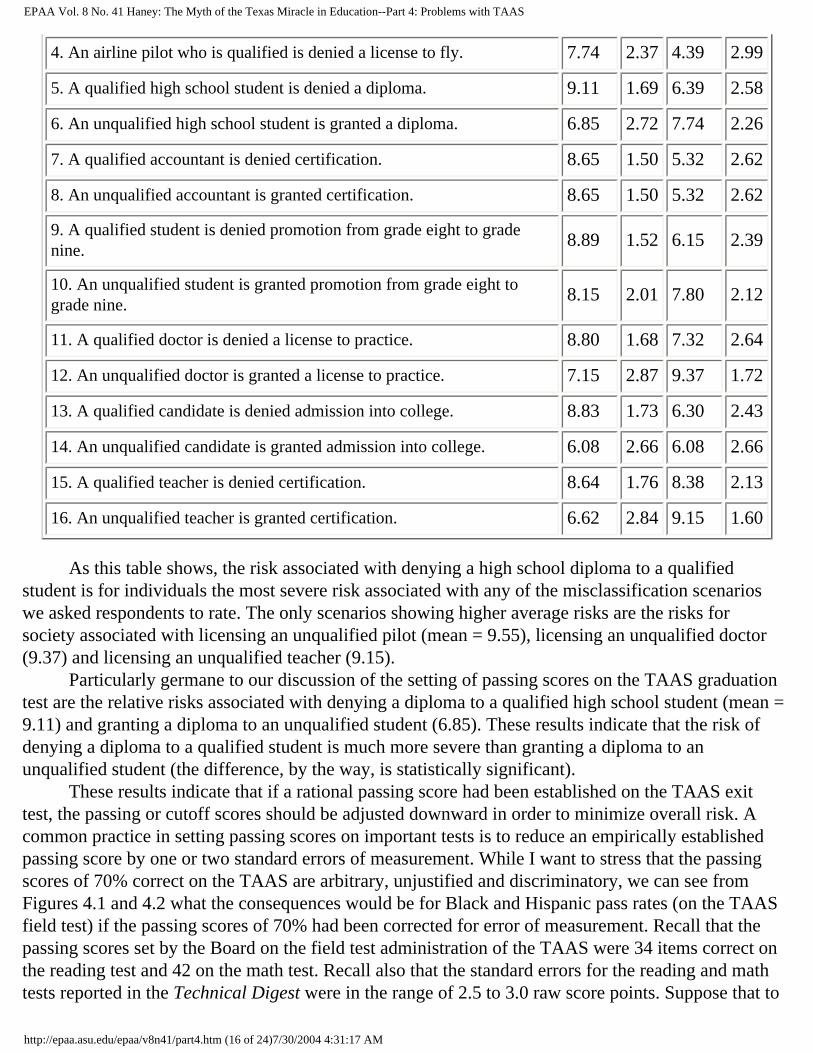
EPAA Vol. 8 No. 41 Haney: The Myth of the Texas Miracle in Education--Part 4: Problems with TAAS
4. An airline pilot who is qualified is denied a license to fly. 7.74 2.37 4.39 2.99
5. A qualified high school student is denied a diploma. 9.11 1.69 6.39 2.58
6. An unqualified high school student is granted a diploma. 6.85 2.72 7.74 2.26
7. A qualified accountant is denied certification. 8.65 1.50 5.32 2.62
8. An unqualified accountant is granted certification. 8.65 1.50 5.32 2.62
9. A qualified student is denied promotion from grade eight to grade nine.
8.89 1.52 6.15 2.39
10. An unqualified student is granted promotion from grade eight to grade nine.
8.15 2.01 7.80 2.12
11. A qualified doctor is denied a license to practice. 8.80 1.68 7.32 2.64
12. An unqualified doctor is granted a license to practice. 7.15 2.87 9.37 1.72
13. A qualified candidate is denied admission into college. 8.83 1.73 6.30 2.43
14. An unqualified candidate is granted admission into college. 6.08 2.66 6.08 2.66
15. A qualified teacher is denied certification. 8.64 1.76 8.38 2.13
16. An unqualified teacher is granted certification. 6.62 2.84 9.15 1.60
As this table shows, the risk associated with denying a high school diploma to a qualified student is for individuals the most severe risk associated with any of the misclassification scenarios we asked respondents to rate. The only scenarios showing higher average risks are the risks for society associated with licensing an unqualified pilot (mean = 9.55), licensing an unqualified doctor (9.37) and licensing an unqualified teacher (9.15). Particularly germane to our discussion of the setting of passing scores on the TAAS graduation test are the relative risks associated with denying a diploma to a qualified high school student (mean = 9.11) and granting a diploma to an unqualified student (6.85). These results indicate that the risk of denying a diploma to a qualified student is much more severe than granting a diploma to an unqualified student (the difference, by the way, is statistically significant). These results indicate that if a rational passing score had been established on the TAAS exit test, the passing or cutoff scores should be adjusted downward in order to minimize overall risk. A common practice in setting passing scores on important tests is to reduce an empirically established passing score by one or two standard errors of measurement. While I want to stress that the passing scores of 70% correct on the TAAS are arbitrary, unjustified and discriminatory, we can see from Figures 4.1 and 4.2 what the consequences would be for Black and Hispanic pass rates (on the TAAS field test) if the passing scores of 70% had been corrected for error of measurement. Recall that the passing scores set by the Board on the field test administration of the TAAS were 34 items correct on the reading test and 42 on the math test. Recall also that the standard errors for the reading and math tests reported in the Technical Digest were in the range of 2.5 to 3.0 raw score points. Suppose that to
http://epaa.asu.edu/epaa/v8n41/part4.htm (16 of 24)7/30/2004 4:31:17 AM

EPAA Vol. 8 No. 41 Haney: The Myth of the Texas Miracle in Education--Part 4: Problems with TAAS
take error of measurement into account, the initially selected passing scores of 34 and 42 were lowered 5 points, to 29 and 37 on the reading and math tests, respectively. What can be easily seen from Figures 4.1 and 4.2 is that these adjustments would have increased the passing rates for Black and Hispanic students about 12% on the math test and 20% on the reading test. The foregoing results were presented in a written report before the TAAS trial (Haney, 1999) and also discussed during testimony at trial. Judge Prado (2000) apparently did not find these points persuasive for he commented merely that in setting the passing score on the TAAS tests, "the State Board of Education looked at the passing standard for the TEAMS test, which was also 70 percent, and also considered input from educator committees" (p. 11). Regarding the disparate impact of the passing score, he commented simply, "The TEA understood the consequences of setting the cut score at 70 percent" (p. 11).
4.4 Doubtful Validity of TAAS Scores
The Technical Digest on TAAS (TEA, 1997) contains an extremely short section (pp. 45-47) discussing test validity. Though this three-page passage mentions content, construct and criterion-related validity, it maintains that "the primary evidence for the validity of the TAAS and end-of-course tests lies in the content validity of the test" (TEA, 1997, p. 47). This discussion, it seems to me is woefully inadequate because test validation should never rest primarily on test content. Test validation refers to the interpretation and meaning of test scores and these depend not just on test content, but also on a host of other factors, such as the conditions under which tests are administered, and how results are scored and interpreted (e.g., in terms of a passing score, as discussed in the previous section). Nonetheless, the TEA has previously undertaken a number of studies examining the relationship between TAAS scores and course grades. In one study, for example, it was reported that in one large urban district, 50% of the students who had received a grade of B in their math courses failed the TAAS math test (TEA, 1996 Comprehensive Report on Texas Public Schools, pp. 14-15). Another summary finding was that when "TEA correlated exit level students' TAAS mathematics scores with the same students' course grades for several different mathematics courses in the 1992-93 school year . . . the correlation between TAAS scale scores and students' end-of-year grades was only moderately positive (0.32). . . " (TEA, 1997, Technical Digest, p. 47). Inasmuch as this correlation is remarkably low in light of previous research that has generally shown test scores to correlate with high school grades in the range of 0.45 to 0.60 (see Haney, 1993, p. 58), as part of work on the TAAS case I sought to acquire the actual data set on which this TEA finding was based. The data set in question contains records for 3,281 students in three districts that TEA documentation describes as "large urban district," "mid-sized suburban district," and "small rural district." The TEA has previously reported analyses of these data in "Section V: A study of correlation of course grades with Exit Level TAAS Reading and Writing Tests" pp. 189-197 in Student Performance Results 1994-95, Texas Student Assessment Program, TAAS and End-of-Course Examinations and Other Studies (Texas Education Agency, Austin, Texas, ND, but presumably 1995). After opening the file and verifying its structure, I sought to confirm that the results reported by the TEA could be replicated. This was impossible to do precisely because TEA did not report results
http://epaa.asu.edu/epaa/v8n41/part4.htm (17 of 24)7/30/2004 4:31:17 AM
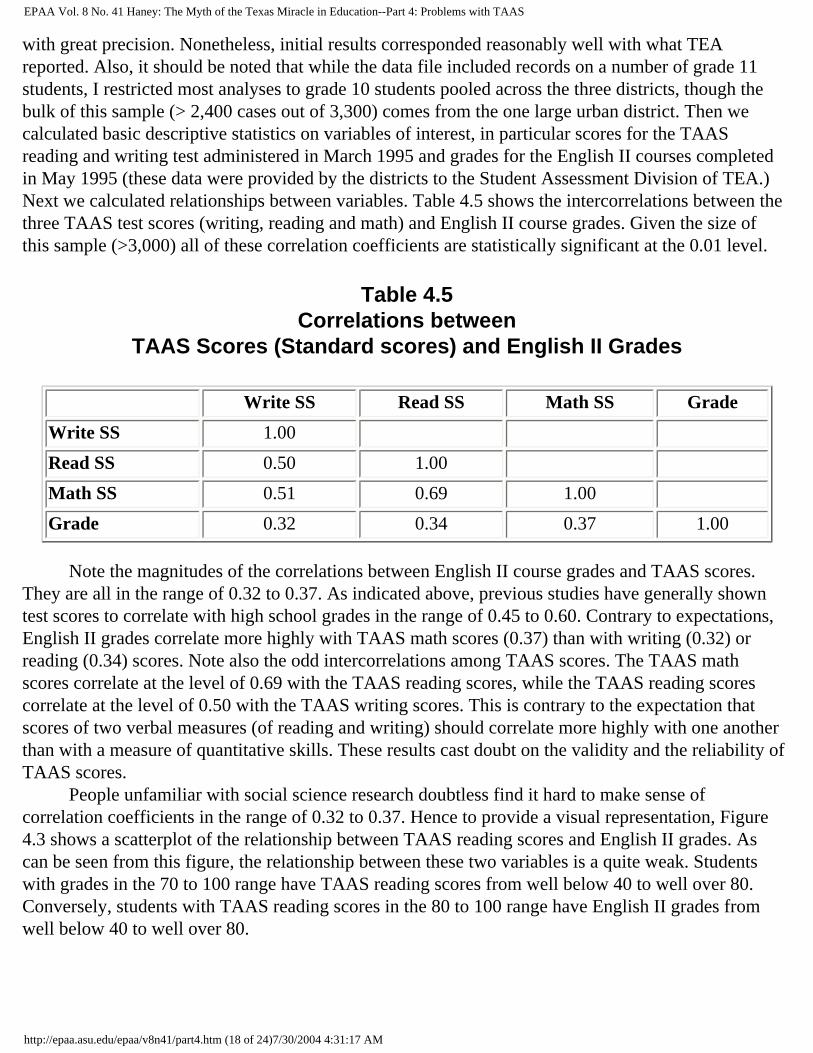
EPAA Vol. 8 No. 41 Haney: The Myth of the Texas Miracle in Education--Part 4: Problems with TAAS
with great precision. Nonetheless, initial results corresponded reasonably well with what TEA reported. Also, it should be noted that while the data file included records on a number of grade 11 students, I restricted most analyses to grade 10 students pooled across the three districts, though the bulk of this sample (> 2,400 cases out of 3,300) comes from the one large urban district. Then we calculated basic descriptive statistics on variables of interest, in particular scores for the TAAS reading and writing test administered in March 1995 and grades for the English II courses completed in May 1995 (these data were provided by the districts to the Student Assessment Division of TEA.) Next we calculated relationships between variables. Table 4.5 shows the intercorrelations between the three TAAS test scores (writing, reading and math) and English II course grades. Given the size of this sample (>3,000) all of these correlation coefficients are statistically significant at the 0.01 level.
Table 4.5Correlations between
TAAS Scores (Standard scores) and English II Grades
Write SS Read SS Math SS Grade
Write SS 1.00
Read SS 0.50 1.00
Math SS 0.51 0.69 1.00
Grade 0.32 0.34 0.37 1.00
Note the magnitudes of the correlations between English II course grades and TAAS scores. They are all in the range of 0.32 to 0.37. As indicated above, previous studies have generally shown test scores to correlate with high school grades in the range of 0.45 to 0.60. Contrary to expectations, English II grades correlate more highly with TAAS math scores (0.37) than with writing (0.32) or reading (0.34) scores. Note also the odd intercorrelations among TAAS scores. The TAAS math scores correlate at the level of 0.69 with the TAAS reading scores, while the TAAS reading scores correlate at the level of 0.50 with the TAAS writing scores. This is contrary to the expectation that scores of two verbal measures (of reading and writing) should correlate more highly with one another than with a measure of quantitative skills. These results cast doubt on the validity and the reliability of TAAS scores. People unfamiliar with social science research doubtless find it hard to make sense of correlation coefficients in the range of 0.32 to 0.37. Hence to provide a visual representation, Figure 4.3 shows a scatterplot of the relationship between TAAS reading scores and English II grades. As can be seen from this figure, the relationship between these two variables is a quite weak. Students with grades in the 70 to 100 range have TAAS reading scores from well below 40 to well over 80. Conversely, students with TAAS reading scores in the 80 to 100 range have English II grades from well below 40 to well over 80.
http://epaa.asu.edu/epaa/v8n41/part4.htm (18 of 24)7/30/2004 4:31:17 AM

EPAA Vol. 8 No. 41 Haney: The Myth of the Texas Miracle in Education--Part 4: Problems with TAAS
Figure 4.3 Scatterplot of TAAS Reading Scores and English II Grades
I next examined whether there were differences in the relationships between TAAS scores and English II grades across ethnic groups. Table 4.6 provides an example of the relationship between passing and failing TAAS and passing or failing in terms of English II course grades for Hispanics, Blacks and Whites. As can be seen from this table, of those students who passed their English II courses in the spring of 1995, 27-29% of Black and Hispanic students failed the TAAS reading test taken the same semester as their English courses compared with 10% of White students. In other words, of grade 10 students in these three districts who are passing their English II courses, the rate of failure on the TAAS reading test for Black and Hispanic students is close to triple that of White students. A similar, but slightly smaller, disparity is apparent on the TAAS writing sub-test.
Table 4.6Rates of Passing and Failing TAAS and English II Course
TAAS-Exit Test Results
Black students Hispanic students White students
http://epaa.asu.edu/epaa/v8n41/part4.htm (19 of 24)7/30/2004 4:31:17 AM

EPAA Vol. 8 No. 41 Haney: The Myth of the Texas Miracle in Education--Part 4: Problems with TAAS
Reading Reading Reading
English II Course Failed Passed Failed Passed Failed Passed
Failed N 39 23 242 189 17 34
(%) 10.1% 5.9% 11.0% 8.6% 3.1% 6.3%
Passed N 111 214 596 1181 55 436
(%) 28.7% 55.3% 27.0% 53.5% 10.1% 80.4%
Writing Writing Writing
English II Course Failed Passed Failed Passed Failed Passed
Failed N 33 29 173 258 20 31
(%) 8.5% 7.5% 7.8% 11.7% 3.7% 5.7%
Passed N 69 256 366 1411 50 441
(%) 17.8% 66.1% 16.6% 63.9% 9.2% 81.4%
Such a disparity can result from several causes. First, if the TAAS reading test is in fact a valid and unbiased test of reading skills, the fact that close to 30% of Black and Hispanic students who are passing their sophomore English courses failed the TAAS reading test, as compared with only 10% of White students must indicate that minority students in these three districts are simply not receiving the same quality of education as their White counterparts—especially when one realizes, as I will show in Part 5 of this article that by 1995 Black and Hispanic students in Texas statewide were being retained in grade 9 at much higher rates than White students. The only other explanation for the sharp disparity is that the TAAS tests and the manner in which they are being used (with a passing score of 70% correct) are simply less valid and fair measures of what Black and Hispanic students have had an opportunity to learn, as compared with White students. These analyses were reported in the July 1999 report (Haney, 1999) and discussed in direct testimony and cross-examination during the TAAS trial in September 1999. Here is how Judge Prado interpreted these findings in his January 7 ruling:
The Plaintiffs provided evidence that, in many cases, success or failure in relevant subject-matter classes does not predict success or failure in that same area on the TAAS test. See Supplemental Report of Dr. Walter Haney, Plaintiff's expert, at 29-32. In other words, a student may perform reasonably well in a ninth-grade English class, for example, and still fail the English portion of the exit-level TAAS exam. The evidence suggests that the disparities are sharper for ethnic minorities. Id. at 33. However, the TEA has argued that a student's classroom grade cannot be equated to TAAS performance, as grades can measure a variety of factors, ranging from effort and improvement to objective mastery. The TAAS test is a solely objective measurement of
http://epaa.asu.edu/epaa/v8n41/part4.htm (20 of 24)7/30/2004 4:31:17 AM
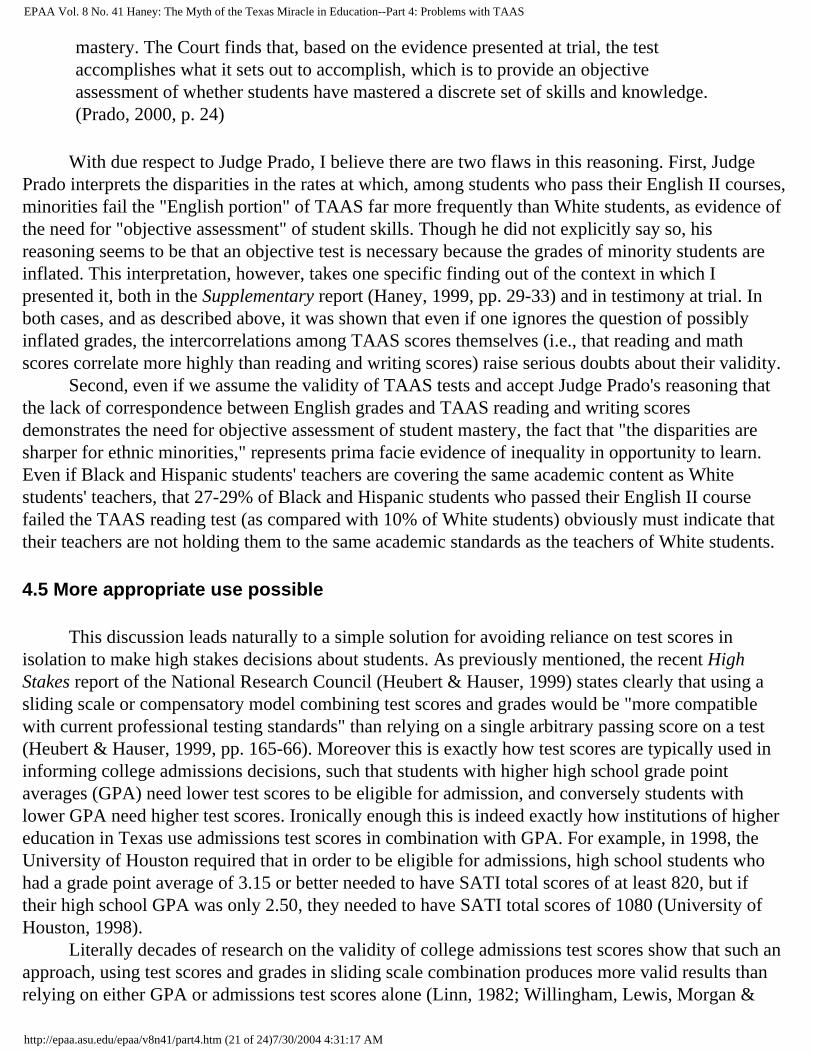
EPAA Vol. 8 No. 41 Haney: The Myth of the Texas Miracle in Education--Part 4: Problems with TAAS
mastery. The Court finds that, based on the evidence presented at trial, the test accomplishes what it sets out to accomplish, which is to provide an objective assessment of whether students have mastered a discrete set of skills and knowledge. (Prado, 2000, p. 24)
With due respect to Judge Prado, I believe there are two flaws in this reasoning. First, Judge Prado interprets the disparities in the rates at which, among students who pass their English II courses, minorities fail the "English portion" of TAAS far more frequently than White students, as evidence of the need for "objective assessment" of student skills. Though he did not explicitly say so, his reasoning seems to be that an objective test is necessary because the grades of minority students are inflated. This interpretation, however, takes one specific finding out of the context in which I presented it, both in the Supplementary report (Haney, 1999, pp. 29-33) and in testimony at trial. In both cases, and as described above, it was shown that even if one ignores the question of possibly inflated grades, the intercorrelations among TAAS scores themselves (i.e., that reading and math scores correlate more highly than reading and writing scores) raise serious doubts about their validity. Second, even if we assume the validity of TAAS tests and accept Judge Prado's reasoning that the lack of correspondence between English grades and TAAS reading and writing scores demonstrates the need for objective assessment of student mastery, the fact that "the disparities are sharper for ethnic minorities," represents prima facie evidence of inequality in opportunity to learn. Even if Black and Hispanic students' teachers are covering the same academic content as White students' teachers, that 27-29% of Black and Hispanic students who passed their English II course failed the TAAS reading test (as compared with 10% of White students) obviously must indicate that their teachers are not holding them to the same academic standards as the teachers of White students.
4.5 More appropriate use possible
This discussion leads naturally to a simple solution for avoiding reliance on test scores in isolation to make high stakes decisions about students. As previously mentioned, the recent High Stakes report of the National Research Council (Heubert & Hauser, 1999) states clearly that using a sliding scale or compensatory model combining test scores and grades would be "more compatible with current professional testing standards" than relying on a single arbitrary passing score on a test (Heubert & Hauser, 1999, pp. 165-66). Moreover this is exactly how test scores are typically used in informing college admissions decisions, such that students with higher high school grade point averages (GPA) need lower test scores to be eligible for admission, and conversely students with lower GPA need higher test scores. Ironically enough this is indeed exactly how institutions of higher education in Texas use admissions test scores in combination with GPA. For example, in 1998, the University of Houston required that in order to be eligible for admissions, high school students who had a grade point average of 3.15 or better needed to have SATI total scores of at least 820, but if their high school GPA was only 2.50, they needed to have SATI total scores of 1080 (University of Houston, 1998). Literally decades of research on the validity of college admissions test scores show that such an approach, using test scores and grades in sliding scale combination produces more valid results than relying on either GPA or admissions test scores alone (Linn, 1982; Willingham, Lewis, Morgan &
http://epaa.asu.edu/epaa/v8n41/part4.htm (21 of 24)7/30/2004 4:31:17 AM
EPAA Vol. 8 No. 41 Haney: The Myth of the Texas Miracle in Education--Part 4: Problems with TAAS
Ramist, 1990). Moreover, such a sliding scale approach generally has been shown to have less disparate impact on ethnic minorities (and women) than relying on test scores alone (Haney, 1993). The tendency for a sliding scale approach to have smaller adverse impact on minorities can be illustrated with the data on TAAS scores and English II grades discussed in the last section. Texas now effectively uses a double-cut or conjunctive model of decision-making, whereby students currently must have a grade of 70 in their academic courses (such as English II) and a score of 70 on TAAS to graduate from high school. These requirements are illustrated in Figure 4.4 (which is the same as Figure 4.3 except that a vertical line has been added to represent the 70-grade requirement and a horizontal line has been added to represent the TAAS 70-score requirement.
Figure 4.4 Scatterplot of TAAS Reading Scores and English II Grades with 70 Minima Shown
Note also that the data shown in Figure 4.4 are the same as those summarized in the top portion of Table 4.6. As indicated there, 80.4% of white students in this sample passed both the English II course and the TAAS reading test, while only 10.1% of White students passed English II and failed the TAAS reading test. In contrast, 53-55% of Black and Hispanic students passed both the course and
http://epaa.asu.edu/epaa/v8n41/part4.htm (22 of 24)7/30/2004 4:31:17 AM

EPAA Vol. 8 No. 41 Haney: The Myth of the Texas Miracle in Education--Part 4: Problems with TAAS
the test, but 27-29% of Black and Hispanic students passed English II, but failed the TAAS test. Suppose now that instead of applying a double cut rule so that students have to have scores of 70 in both the course and the test to pass, they need to have a minimum of 140 combined. This circumstance is illustrated in Figure 4.5, below.
Figure 4.5 Scatterplot of TAAS Reading Scores and English II Grades with Sliding Scale Shown
As can be seen, under such a sliding scale approach, higher grades can compensate for lower test scores and vice versa (that is why the sliding scale approach is sometimes called a compensatory model). Under this approach, the number of Black and Hispanic students passing would increase from 1,395 to 1,765—a 27% increase. Under a sliding scale approach, the number of White students passing would also increase slightly (from 436 to 487), but since the latter increase is smaller proportionately, the disparate impact on Black and Hispanic students would be reduced. The sliding scale decision rule illustrated here (TAAS-R + Eng II grade > 140) was chosen merely for illustrative purposes. As with college admissions tests, in practice such a sliding scale
http://epaa.asu.edu/epaa/v8n41/part4.htm (23 of 24)7/30/2004 4:31:17 AM
EPAA Vol. 8 No. 41 Haney: The Myth of the Texas Miracle in Education--Part 4: Problems with TAAS
approach ought to be based on empirical validation studies. But the example illustrates the way in which an approach more in accord with professional standards would significantly reduce adverse impact. The literature on college admissions testing strongly suggests it would yield more valid decisions too.
0: Home | 1: Intro. | 2: History | 3: The Myth | 4: TAAS | 5: Missing Students 6: Teachers | 7: Other Evidence | 8: Summary | Notes & Ref. | Appendix
http://epaa.asu.edu/epaa/v8n41/part4.htm (24 of 24)7/30/2004 4:31:17 AM
EPAA Vol. 8 No. 41 Haney: The Myth of the Texas Miracle in Education--Part 5: Missing Students and Other Mirages
Education Policy Analysis Archives
Volume 8 Number 41 The Texas Miracle in Education Walt Haney
5. Missing Students and Other Mirages
As previously mentioned, dropout rate is one of the indicators used in the TEA accountability system for rating Texas districts and campuses. Also, as summarized in Section 3.3 above, the TEA has reported that dropout rates have been decreasing in Texas during the 1990s. However, in 1998 when I began studying what had been happening in Texas schools, I quickly became suspicious of the validity of the TEA-reported dropout data. At least one independent organization in Texas had previously challenged TEA's "dropout calculation methodology" (TRA, 1998, p. 2). Moreover, two independent sources were reporting substantially higher rates of dropouts (or attrition) or, conversely, lower rates of high school completion than would be implied by TEA dropout data (Fassold, 1996; IDRA, 1996). Hence, to examine independent evidence on recent patterns of high school completion in Texas and possible effects of the TAAS on grade enrollment patterns and high school completion, I assembled data on the numbers of White, Hispanic and Black students enrolled in every grade (kindergarten to grade 12) in Texas over the last two decades. (Note 12) Before describing analyses of these data, three additional points should be made. First, in assembling this data set, we have taken care to double-check the accuracy of all data input (in this context, "we" refers to myself and Damtew Teferra, a Boston College doctoral student who helped me assemble the Texas enrollment data set). Second, to my original set of data on grade enrollment by ethnic group for each year between 1975-76 and 1998-99, I added data on the numbers of high school graduates each year (provided to me, again, thanks to the kind assistance of Dr. Rincon and Terry Hitchcock). Third, I should mention that data on enrollments and graduates for 1998-99 were not available until recently and hence were not considered in my previous reports or in the TAAS trial in the Fall of 1999. Finally, in case others might wish to verify results shown below, or conduct other analyses of Texas enrollments over the last quarter century, I make available via this publication, the set of data I have assembled (see, Appendix 7).
http://epaa.asu.edu/epaa/v8n41/part5.htm (1 of 18)7/30/2004 4:32:22 AM

EPAA Vol. 8 No. 41 Haney: The Myth of the Texas Miracle in Education--Part 5: Missing Students and Other Mirages
5.1 Progress from Grade 9 to High School Graduation
In this analysis, I simply took the numbers of White, Black and Hispanic Texas high school graduates by year and divided each of these numbers respectively by the number of White, Black and Hispanic students enrolled in grade nine three years earlier. The resulting ratios show the proportion of grade nine students for each ethnic group who progress on time to high school graduation three-and-a-half years later. The results of this analysis are shown in Figure 5.1.
Figure 5.1 shows that between 1978 and 1985-86, the ratio of HS graduates to grade nine students three years earlier ranged between 0.72 and 0.78 for White students and between 0.57 and 0.64 for Black and Hispanic students. Between 1985-86 and 1989-90 these ratios declined slightly for all ethnic groups, from 0.72 to 0.70 for Whites, from 0.59 to 0.57 for Blacks and from 0.57 to 0.56 for Hispanics. However, in 1990-91, the first year the TAAS high school graduation test was used, the ratios for all three groups evidence the most precipitous drops in the whole 20-year time series: for Whites from 0.699 to 0.640 (a drop of 0.059), for Blacks from 0.567 to 0.474 (a drop of 0.093) and for Hispanics from 0.564 to 0.476 (a drop of 0.088). In other words, the steep drop in this indicator of progress from grade 9 to high school graduation was about 50% greater for Black and Hispanic students than for White students. In 1991, the ratios for all three ethnic groups showed a slight rebound, from 0.640 to 0.700 for Whites, from 0.474 to 0.518 for Blacks and 0.476 to 0.513 for Hispanics. In 1992-93, the first year
http://epaa.asu.edu/epaa/v8n41/part5.htm (2 of 18)7/30/2004 4:32:22 AM

EPAA Vol. 8 No. 41 Haney: The Myth of the Texas Miracle in Education--Part 5: Missing Students and Other Mirages
in which the TAAS graduation requirement was fully implemented, Whites showed a minor decline, from 0.700 to 0.689, but for Blacks and Hispanics declines were larger: from 0.518 to 0.479 for Blacks and from 0.513 to 0.491 for Hispanics. From full implementation of the TAAS as a requirement for high school graduation in Texas in 1992-93 (with the passing score set at 70%) until 1998-99, the ratio of HS graduates to grade nine students three years earlier has been just at or below 0.500 for Black and Hispanic students, while it has been just about 0.700 for White students. Figure 5.2 presents another view of these data. This figure shows the ratio of the number of Texas high school graduates divided by the number of grade nine students three years earlier for White and Nonwhite students. What this figure shows even more clearly than the previous figure is that since the three-year period 1990-92 in which the TAAS exit test requirement was phased in, the gap in this ratio for White and Nonwhite students has widened substantially. Specifically, during the period 1978 through 1989, the average gap in the ratios graphed in Figure 5.2 was 0.146. However, the average gap in the ratios for Whites and Nonwhites since the TAAS exit test requirement was fully implemented in 1992-93 has been 0.215. This indicates that the TAAS exit test has been associated with a 50% increase in the gap in progression from grade 9 to high school graduation for Nonwhite students as compared with White students.
5.2 Grade-to-Grade Progression Ratios
What happened between the late 1970s and the mid-1990's? (Note 13) Where did the decline in progression between grade nine and high school graduation occur for Black and Hispanic students? Was it at grade 10 when they first took the TAAS exit test, or in grade 12 after they had had a chance to take the TAAS-X as many as eight times?
http://epaa.asu.edu/epaa/v8n41/part5.htm (3 of 18)7/30/2004 4:32:22 AM

EPAA Vol. 8 No. 41 Haney: The Myth of the Texas Miracle in Education--Part 5: Missing Students and Other Mirages
To shed light on this question, I calculated the grade-to-grade progression ratios of the number of students enrolled in one grade divided by the number of students enrolled in the previous grade in the previous year, separately for the Black, Hispanic and White ethnic groups. Altogether, 858 such calculations were computed—13 grade transitions (from kindergarten to grade 1, etc., to grade 12 to high school graduation) for 22 years and three ethnic groups. Overall there was considerable consistency in these grade transition ratios. Across the last twenty years, and the 13 grade transitions, for the three ethnic groups, overall, transitions from one grade to another have been highly consistent, with 99 or 100% of each ethnic group, on average, progressing from one grade in one year to the next grade in the following year. What the detailed results show, however, is that there are two sets of grade progression ratios that were highly unusual (greater than 1.24 or more than 2 standard deviations from the mean across all transition ratios; see Haney 1999, Table 5). First, in the decade 1976 to 1986, there were 25 grade progression ratios that exceeded 1.24. These were all for the grade 1/kindergarten ratios, and mostly for Black and Hispanic students, though there were a few years for which the comparable ratios for White students exceeded 1.24. It is likely that these high ratios resulted partly from a time when kindergarten attendance in Texas was not universal and many students entered school in grade 1 without previously having attended kindergarten. Since 1990, there were more than a dozen grade progression ratios that exceeded 1.24. For each and every year from 1992-93 to 1998-99, the grade 9/grade 8 progression ratio for Black and Hispanic students has exceeded 1.24, while the comparable ratio for White students has remained in the range of 1.08 to 1.11. As shown in Figure 5.3, since 1990 the grade 9/grade 8 progression ratio for Black and Hispanic students has risen dramatically, while the comparable rate for White students increased only slightly.
http://epaa.asu.edu/epaa/v8n41/part5.htm (4 of 18)7/30/2004 4:32:22 AM

EPAA Vol. 8 No. 41 Haney: The Myth of the Texas Miracle in Education--Part 5: Missing Students and Other Mirages
The data also reveal that before the mid-1980s, the grade9/grade8 progression ratios for Black and Hispanic students were only slightly higher than those for Whites. These results clearly indicate that since 1992 progress from grade 9 to high school graduation has been stymied for Black and Hispanic students not after grade 10 when they first take the TAAS exit test, but in grade nine before they take the test. These results clearly support the hypothesis advanced in my December 1998 report, namely that after 1990 schools in Texas have increasingly been retaining students, disproportionately Black and Hispanic students, in grade nine in order to make their grade 10 TAAS scores look better (Haney, 1998, pp. 17-18). This hypothesis was discussed during the TAAS trial. In his ruling, Judge Prado held that "Expert Walter Haney's" hypothesis that schools are retaining students in ninth grade in order to inflate tenth-grade TAAS results was not supported with legally sufficient evidence demonstrating the link between retention and TAAS (Prado, 2000, p. 27). In Section 5.6 below, I present documentation that was not allowed into the TAAS trial as evidence to support the hypothesis. For now, however, suffice it to note that the pattern apparent in Figure 5.3 provides a clear explanation for one aspect of the Texas "miracle," namely, the apparent decrease in the racial gap in test scores (reviewed in Section 3.3 above). One clear cause for the decrease in the racial gap in grade 10
http://epaa.asu.edu/epaa/v8n41/part5.htm (5 of 18)7/30/2004 4:32:22 AM

EPAA Vol. 8 No. 41 Haney: The Myth of the Texas Miracle in Education--Part 5: Missing Students and Other Mirages
TAAS scores in the 1990s (see Table 3.2 and Figure 3.2) is that Black and Hispanic students are being increasingly retained in grade 9 before they take the grade 10 TAAS tests. Between 1989-90 (the year before TAAS was implemented) and the late 1990s, the grade9/grade8 progression ratios for Black and Hispanic students grew from about 1.20 to 1.30, while the comparable ratio for White students remained at about 1.1. It is apparent from Figure 5.3 that the higher rates of grade 9 retention of Black and Hispanic students, as compared White students, did not begin with TAAS. The results shown in Figure 5.3 indicate that the grade9/grade8 progression ratios for minorities began to diverge from those of White students in Texas in the 1980s, before TAAS and even before TEAMS. In an historical sense, then, TAAS and TEAMS could not have directly caused the steady increase since the early 1980s in the proportions of Black and Hispanics retained in grade 9. But the first statewide testing program in Texas, the TABS, did begin in 1980, just about the time the ratio of minority ninth graders to eighth graders began its upward climb, compared with the relative stability of this ratio for White students. Whatever the historical cause, the fact that by the end of the 1990s 25-30% of Black and Hispanic students, as compared with only 10% of White students, were being retained to repeat grade 9, instead of being promoted to grade 10, makes it clear that the apparent diminution in the grade 10 racial gap in TAAS pass rates is in some measure an illusion. Data for the last two academic years, i.e., 1997-98 and 1998-99, provide a picture of how grade progression ratios compare across the grade levels. Specifically, Figure 5.4 shows the grade progression ratios for grades 1 through 12 and for graduates. For grades 1 through 12 these are simply the number of students enrolled in a particular grade in 1998-99 divided by the number enrolled in the previous grade in 1997-98. The only exception to this pattern is for graduates in which the ratio shown is the number of graduates in 1999 divided by the number enrolled in grade 12 in the fall of 1998-99.
http://epaa.asu.edu/epaa/v8n41/part5.htm (6 of 18)7/30/2004 4:32:22 AM
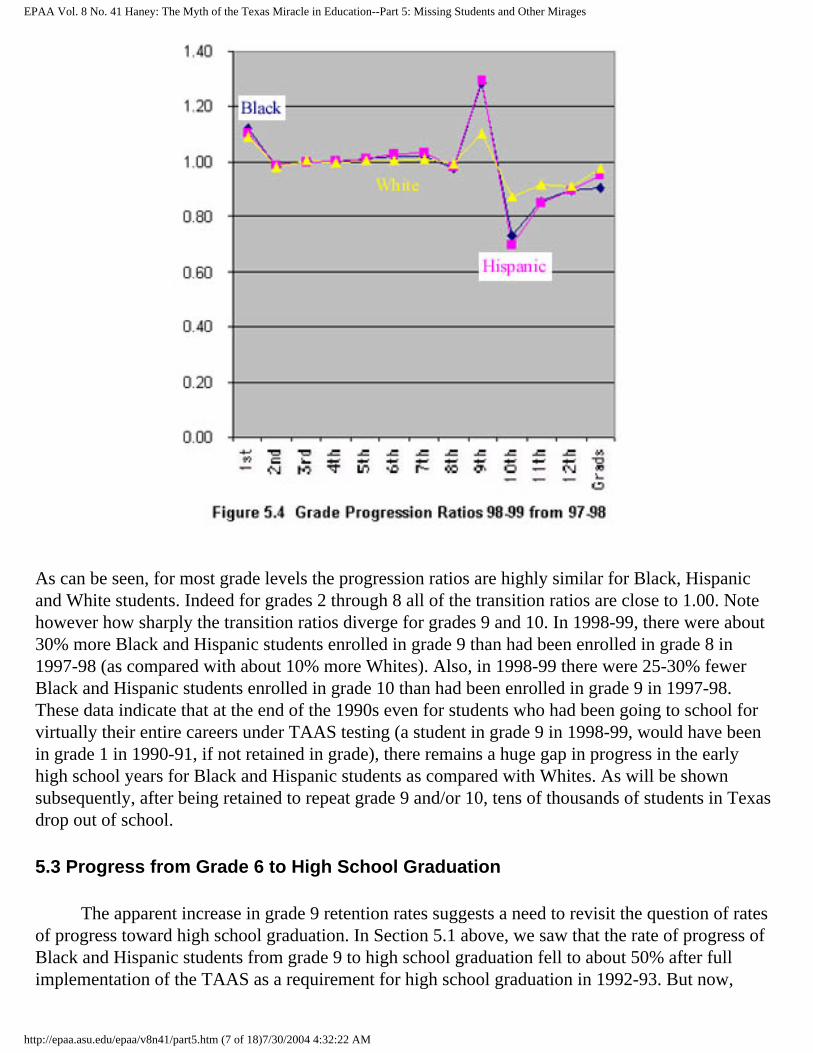
EPAA Vol. 8 No. 41 Haney: The Myth of the Texas Miracle in Education--Part 5: Missing Students and Other Mirages
As can be seen, for most grade levels the progression ratios are highly similar for Black, Hispanic and White students. Indeed for grades 2 through 8 all of the transition ratios are close to 1.00. Note however how sharply the transition ratios diverge for grades 9 and 10. In 1998-99, there were about 30% more Black and Hispanic students enrolled in grade 9 than had been enrolled in grade 8 in 1997-98 (as compared with about 10% more Whites). Also, in 1998-99 there were 25-30% fewer Black and Hispanic students enrolled in grade 10 than had been enrolled in grade 9 in 1997-98. These data indicate that at the end of the 1990s even for students who had been going to school for virtually their entire careers under TAAS testing (a student in grade 9 in 1998-99, would have been in grade 1 in 1990-91, if not retained in grade), there remains a huge gap in progress in the early high school years for Black and Hispanic students as compared with Whites. As will be shown subsequently, after being retained to repeat grade 9 and/or 10, tens of thousands of students in Texas drop out of school.
5.3 Progress from Grade 6 to High School Graduation
The apparent increase in grade 9 retention rates suggests a need to revisit the question of rates of progress toward high school graduation. In Section 5.1 above, we saw that the rate of progress of Black and Hispanic students from grade 9 to high school graduation fell to about 50% after full implementation of the TAAS as a requirement for high school graduation in 1992-93. But now,
http://epaa.asu.edu/epaa/v8n41/part5.htm (7 of 18)7/30/2004 4:32:22 AM

EPAA Vol. 8 No. 41 Haney: The Myth of the Texas Miracle in Education--Part 5: Missing Students and Other Mirages
having seen in section 5.2 that the rate of retention in grade 9 appears to have increased markedly for Black and Hispanic students in Texas during the 1990s, it is useful to revisit the question of rates of progress toward high school graduation using base years other than grade 9 as a starting point from which to chart progress. This is because the grade 9 to high school graduation progress ratio may be lowered because of the increasing numbers of students "bunching up" in grade 9. A number of analyses have been conducted, examining the rates of progress from grades 6, 7, and 8 to high school graduation, six, five and four years later, respectively. For the sake of economy of presentation in an already overlong treatment, I present here only the results of the grade 6 to high school graduation six years later (this also allows us later to compare these results with data reported by TEA on grade 7-12 dropout rates). These are presented for cohorts labeled by their expected year of high school graduation. The cohort class of 1999, for example, would have been in grade 6 in 1992-93. Figures 5.5 and 5.6 show the progress of grade 6 White and minority (Black and Hispanic) grade 6 cohorts of students to grades 8, 10, 11, 12 and high school graduation. As can be seen, over the last 20 years, for both White and minority cohorts, close to 100% of grade 6 students appear to be progressing to grade 8 two years later. For White students in grade 6 cohorts of the classes of 1982-85, about 90% proceeded to grade 11 and 12 on time and about 80% graduated six years after they were in grade 6. For minority grade 6 cohorts the rates of progress were lower: for grade 6 cohorts of the classes of 1982-85 about 80% of Black and Hispanic students progressed on time to grades 11 and 12 and about 65% graduated. For classes of 1986 to 1990, there were slow but steady declines in all rates of progress for White students, from grade 6 to 8, from grade 6 to 10, etc. For minority cohorts of the classes of 1986 to 1990, there were initially sharper declines in rates of progress to grades 10, 11, and 12, but the cohorts of the 1989 and 1990 classes showed some rebounds in rates of progress to grades 10, 11 and 12 (and for the 1990 cohort to graduation). These patterns are associated with implementation of the first Texas high school graduation test, the TEAMS from 1985 to 1990. In 1991, the initial year of TAAS testing, the grade 6 to high school graduation ratios fell precipitously; from 1990 to 1991, the ratio fell from 0.75 to 0.68 for Whites and from 0.65 to 0.55 for minorities. From 1992 to 1996, this ratio held relatively steady, for Whites at about 0.75 and for minorities at about 0.60. Since 1996, there have been slight increases in the high school graduation to grade six ratios, for Whites to 0.78 in 1999 and for minorities to almost 0.65. Stepping back from specific numbers represented in Figures 5.5 and 5.6, three broad findings are apparent. First, the plight of Black and Hispanic students in Texas is not quite as bleak as it appeared when looking at grade 9 to high school graduation ratios, which showed only 50% since 1992 progressing from grade 9 to high school graduation. The bottom line in Figure 5.6 indicates that for most classes of the 1990s, 60-65% of Black and Hispanic students progressed from grade 6 to graduate on-time six years later (the grade 9 to graduation ratios are lower because of the increasing rates of retention in grade 9).
http://epaa.asu.edu/epaa/v8n41/part5.htm (8 of 18)7/30/2004 4:32:22 AM

EPAA Vol. 8 No. 41 Haney: The Myth of the Texas Miracle in Education--Part 5: Missing Students and Other Mirages
http://epaa.asu.edu/epaa/v8n41/part5.htm (9 of 18)7/30/2004 4:32:23 AM
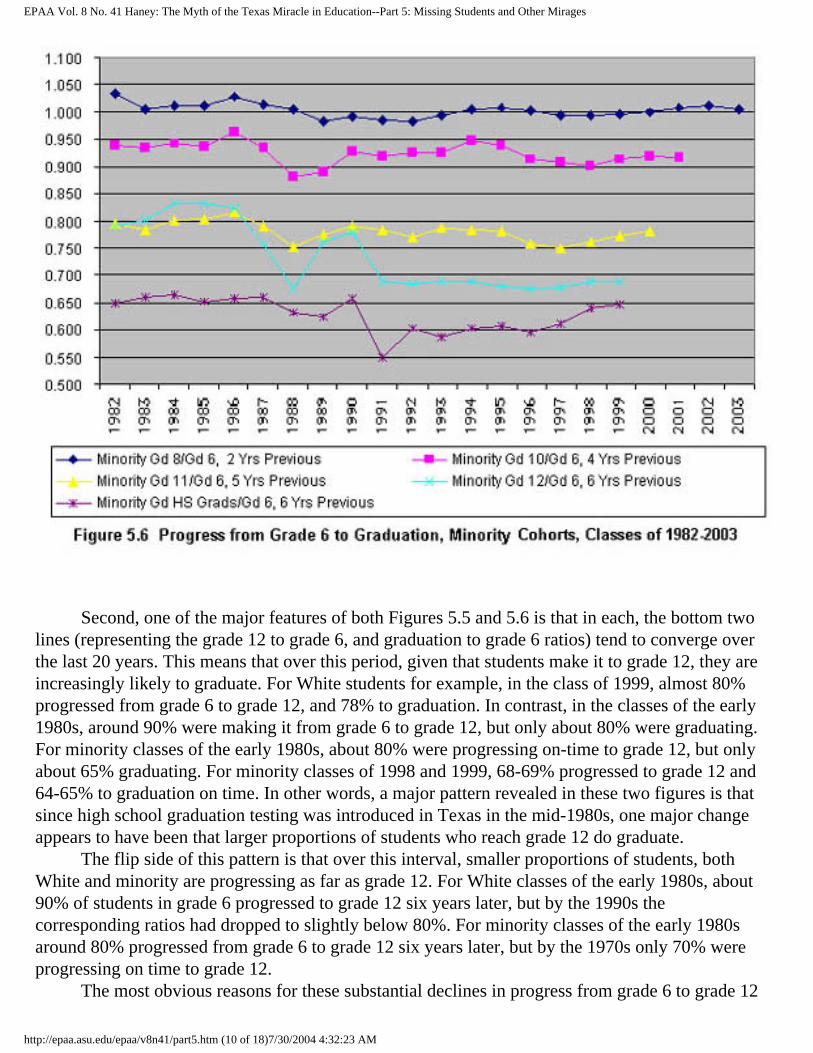
EPAA Vol. 8 No. 41 Haney: The Myth of the Texas Miracle in Education--Part 5: Missing Students and Other Mirages
Second, one of the major features of both Figures 5.5 and 5.6 is that in each, the bottom two lines (representing the grade 12 to grade 6, and graduation to grade 6 ratios) tend to converge over the last 20 years. This means that over this period, given that students make it to grade 12, they are increasingly likely to graduate. For White students for example, in the class of 1999, almost 80% progressed from grade 6 to grade 12, and 78% to graduation. In contrast, in the classes of the early 1980s, around 90% were making it from grade 6 to grade 12, but only about 80% were graduating. For minority classes of the early 1980s, about 80% were progressing on-time to grade 12, but only about 65% graduating. For minority classes of 1998 and 1999, 68-69% progressed to grade 12 and 64-65% to graduation on time. In other words, a major pattern revealed in these two figures is that since high school graduation testing was introduced in Texas in the mid-1980s, one major change appears to have been that larger proportions of students who reach grade 12 do graduate. The flip side of this pattern is that over this interval, smaller proportions of students, both White and minority are progressing as far as grade 12. For White classes of the early 1980s, about 90% of students in grade 6 progressed to grade 12 six years later, but by the 1990s the corresponding ratios had dropped to slightly below 80%. For minority classes of the early 1980s around 80% progressed from grade 6 to grade 12 six years later, but by the 1970s only 70% were progressing on time to grade 12. The most obvious reasons for these substantial declines in progress from grade 6 to grade 12
http://epaa.asu.edu/epaa/v8n41/part5.htm (10 of 18)7/30/2004 4:32:23 AM
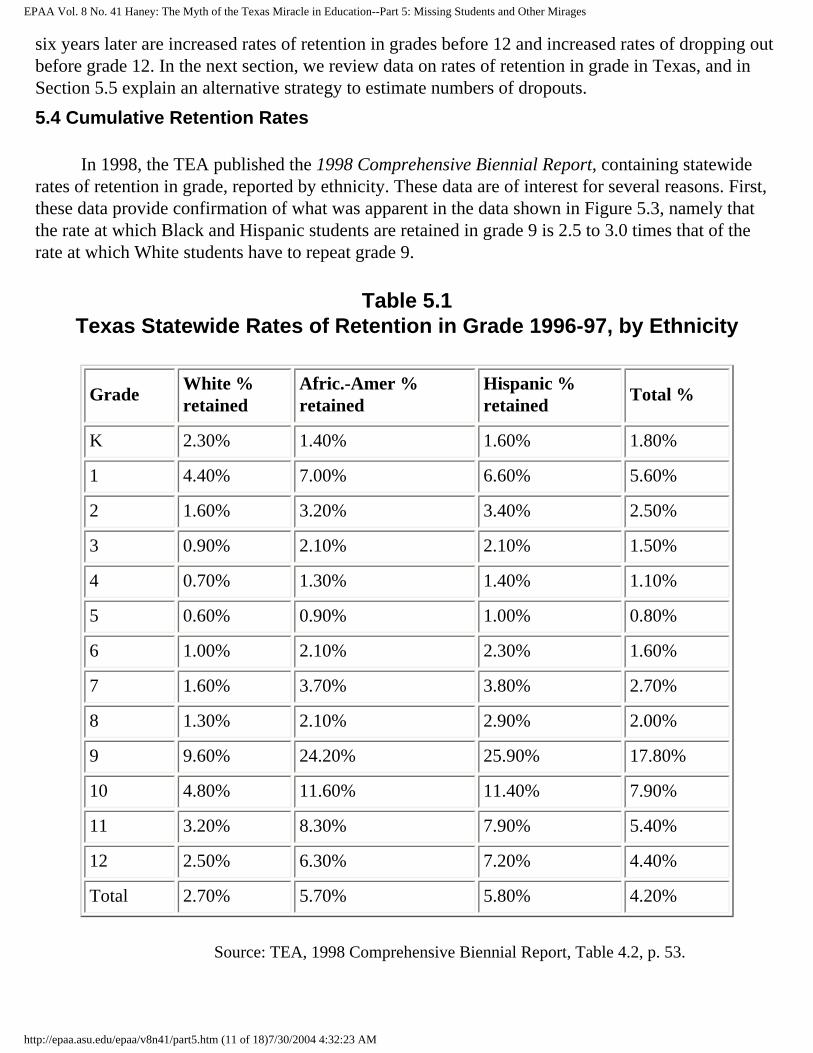
EPAA Vol. 8 No. 41 Haney: The Myth of the Texas Miracle in Education--Part 5: Missing Students and Other Mirages
six years later are increased rates of retention in grades before 12 and increased rates of dropping out before grade 12. In the next section, we review data on rates of retention in grade in Texas, and in Section 5.5 explain an alternative strategy to estimate numbers of dropouts.
5.4 Cumulative Retention Rates
In 1998, the TEA published the 1998 Comprehensive Biennial Report, containing statewide rates of retention in grade, reported by ethnicity. These data are of interest for several reasons. First, these data provide confirmation of what was apparent in the data shown in Figure 5.3, namely that the rate at which Black and Hispanic students are retained in grade 9 is 2.5 to 3.0 times that of the rate at which White students have to repeat grade 9.
Table 5.1Texas Statewide Rates of Retention in Grade 1996-97, by Ethnicity
Grade White %retained
Afric.-Amer %retained
Hispanic % retained
Total %
K 2.30% 1.40% 1.60% 1.80%
1 4.40% 7.00% 6.60% 5.60%
2 1.60% 3.20% 3.40% 2.50%
3 0.90% 2.10% 2.10% 1.50%
4 0.70% 1.30% 1.40% 1.10%
5 0.60% 0.90% 1.00% 0.80%
6 1.00% 2.10% 2.30% 1.60%
7 1.60% 3.70% 3.80% 2.70%
8 1.30% 2.10% 2.90% 2.00%
9 9.60% 24.20% 25.90% 17.80%
10 4.80% 11.60% 11.40% 7.90%
11 3.20% 8.30% 7.90% 5.40%
12 2.50% 6.30% 7.20% 4.40%
Total 2.70% 5.70% 5.80% 4.20%
Source: TEA, 1998 Comprehensive Biennial Report, Table 4.2, p. 53.
http://epaa.asu.edu/epaa/v8n41/part5.htm (11 of 18)7/30/2004 4:32:23 AM

EPAA Vol. 8 No. 41 Haney: The Myth of the Texas Miracle in Education--Part 5: Missing Students and Other Mirages
These data also allow us to see that despite much rhetoric lately about so-called "social promotion," retention in grade may be more common for Black and Hispanic students in Texas than is social promotion. Using an approach suggested by Robert Hauser, I analyzed data on patterns of retention in grade in Texas statewide as reported by the Texas Education Agency (and summarized in the table above). The approach suggested by Hauser is simply to subtract annual grade retention rates from 1.00 to yield rates of non-retention. The non-retention rates can then be multiplied across the grades to yield "compound" non-retention rates. The results for 1996-97 are shown in Table 5.2.
Table 5.2 Cumulative Rates of Grade Promotion, 1996-97
White Black Hispanic
Grades 1-3 93.22% 88.13% 88.33%
Grades 4-6 97.72% 95.76% 95.37%
Grades 7-8 97.12% 94.28% 93.41%
Grades 9-12 81.22% 57.57% 56.11%
All twelve grades 71.86% 45.81% 44.15%
Source: Based on TEA, 1998 Comprehensive Biennial Report, Table 4.2, p. 53
White students have a probability of progressing through 12 grades without being retained in grade of about 72%. However, for Black and Hispanic students the comparable rates are 46% and 44%. In short, even before the end of so-called social promotion, Black and Hispanic students in Texas appear more likely than not to be retained in grade over the course of a 12-year school career. Note also that the compound retention rate for Hispanics (56%) is about double that for White students (28%), even before taking into account that Hispanics are much more likely than White students to drop out of school before grade 12. Note also that even before the secondary level of education, Black and Hispanic students in Texas are more likely not to be promoted (that is, to be retained in grade) than White students. The data in Table 5.2 indicated that at both the early elementary (grades 1-3) and upper elementary (grades 4-6) Black and Hispanic students are 70-75% more likely than White students to be "flunked," and retained to repeat a grade in school.
http://epaa.asu.edu/epaa/v8n41/part5.htm (12 of 18)7/30/2004 4:32:23 AM
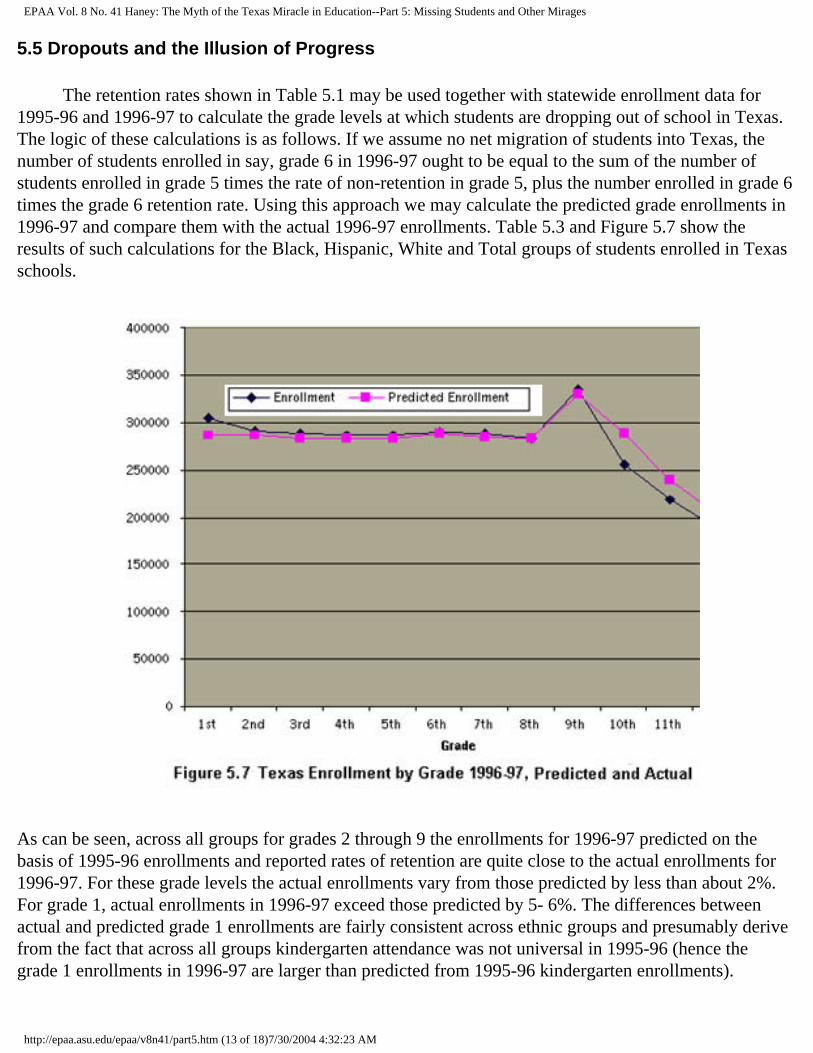
EPAA Vol. 8 No. 41 Haney: The Myth of the Texas Miracle in Education--Part 5: Missing Students and Other Mirages
5.5 Dropouts and the Illusion of Progress
The retention rates shown in Table 5.1 may be used together with statewide enrollment data for 1995-96 and 1996-97 to calculate the grade levels at which students are dropping out of school in Texas. The logic of these calculations is as follows. If we assume no net migration of students into Texas, the number of students enrolled in say, grade 6 in 1996-97 ought to be equal to the sum of the number of students enrolled in grade 5 times the rate of non-retention in grade 5, plus the number enrolled in grade 6 times the grade 6 retention rate. Using this approach we may calculate the predicted grade enrollments in 1996-97 and compare them with the actual 1996-97 enrollments. Table 5.3 and Figure 5.7 show the results of such calculations for the Black, Hispanic, White and Total groups of students enrolled in Texas schools.
As can be seen, across all groups for grades 2 through 9 the enrollments for 1996-97 predicted on the basis of 1995-96 enrollments and reported rates of retention are quite close to the actual enrollments for 1996-97. For these grade levels the actual enrollments vary from those predicted by less than about 2%. For grade 1, actual enrollments in 1996-97 exceed those predicted by 5- 6%. The differences between actual and predicted grade 1 enrollments are fairly consistent across ethnic groups and presumably derive from the fact that across all groups kindergarten attendance was not universal in 1995-96 (hence the grade 1 enrollments in 1996-97 are larger than predicted from 1995-96 kindergarten enrollments).
http://epaa.asu.edu/epaa/v8n41/part5.htm (13 of 18)7/30/2004 4:32:23 AM

EPAA Vol. 8 No. 41 Haney: The Myth of the Texas Miracle in Education--Part 5: Missing Students and Other Mirages
Table 5.3Grade Enrollments in Texas, 1996-97Predicted and Actual Minus Predicted
Black Hispanic White Total
Grade Predicted ActualMinusPred'd
% Diff.
Pred. Act.MinusPred'd
% Diff.
Pred. Act.MinusPred'd
% Diff.
Pred. Act.MinusPred'd
% Diff.
1st 42,925 2,870 6.3% 117,564 6,390 5.2% 126,306 9,202 6.8% 286,858 18,399 6.4%
2nd 42,998 917 2.1% 112,510 2,330 2.0% 131,440 1,560 1.2% 287,020 4,735 1.7%
3rd 42,112 584 1.4% 109,434 2,081 1.9% 132,480 1,097 0.8% 284,020 3,768 1.3%
4th 42,016 499 1.2% 107,748 2,355 2.1% 133,683 814 0.6% 283,697 3,418 1.2%
5th 41,052 388 0.9% 105,989 2,015 1.9% 137,246 568 0.4% 284,170 3,088 1.1%
6th 41,390 369 0.9% 106,360 1,575 1.5% 141,235 -281 -0.2%
288,843 1,805 0.6%
7th 41,220 513 1.2% 105,656 2,237 2.1% 137,625 1,779 1.3% 284,566 4,464 1.6%
8th 40,208 19 0.1% 104,465 46 0.0% 138,044 189 0.1% 282,768 203 0.1%
9th 50,696 392 0.8% 131,492 1,225 0.9% 149,454 2,175 1.4% 330,422 5,012 1.5%
10th 42,418 -5,791
-15.8%
103,814 -14,969
-16.9%
141,855 -10,705
-8.2%
288,978 -32,356
-11.2%
11th 34,138 -3,504
-11.4%
79,894 -8,984 -12.7%
125,045 -7,767 -6.6%
239,395 -20,573
-8.6%
12th 27,732 -1,679
-6.4% 64,911 -5,375 -9.0% 111,361 -8,038 -7.8%
203,876 -14,964
-7.3%
Note however that for grades 10, 11 and 12 much larger disparities are apparent and vary considerably by ethnic group. Overall, enrollments in grades 10, 11 and 12 in 1996-97 were more than 65,000 lower than predicted based on the previous year's enrollments. The missing students were predominantly Black and Hispanic. Grade 10 enrollments in 1996-97 were about 16% lower than expected for Black and Hispanic students, but only about 8% lower than expected for White students. What happened to these missing students? It seems extremely likely that they dropped out of school. This is not terribly surprising since previous research shows clearly that retention in grade is a common precursor to dropping out of school. The grade 9 retention rates in Texas are far in excess of national trends. A recent national study, for example, showed that among young adults aged 16-24, only 2.4 percent had been retained in grades 9-12 (NCES, Dropout rates in the United States 1995, Report No. dp95/97473- 5). The recent report of the National Research Council (NRC) also shows Texas to have among the highest grade 9 retention rates for 1992 to 1996 among the states for which such data are available (Heubert
http://epaa.asu.edu/epaa/v8n41/part5.htm (14 of 18)7/30/2004 4:32:23 AM

EPAA Vol. 8 No. 41 Haney: The Myth of the Texas Miracle in Education--Part 5: Missing Students and Other Mirages
& Hauser, 1999, Table 6-1). (Note 14) A casual observer might well wonder what is wrong with retaining students in grade 9 if they are academically weak. The answer is explained in the recent report on high stakes testing from the National Research Council:
The negative consequences, as grade retention is currently practiced, are that retained students persist in low achievement levels and are more likely to drop out of school. Low performing students who have been retained in kindergarten or primary grades lose ground both academically and socially relative to similar students who have been promoted (Holmes, 1989; Shepard and Smith, 1989). In secondary school, grade retention leads to reduced achievement and much higher rates of school dropout. (Heubert & Hauser, 1999, p. 285).
Even the TEA has acknowledged that "research has consistently shown that being overage for grade is one of the primary predictors of dropping out of school in later years. . . . Being overage for grade is a better predictor of dropping out than underachievement." (TEA, 1996 Comprehensive Biennial Report on Texas Public Schools, pp. 35, 36.). Hence, it is fair to say that the soaring grade 10 TAAS pass rates are not just an illusion, but something of a fraud from an educational point of view. Table 5.4 presents data to support this view.
Table 5.4Texas Grade 10 Enrollments 1996-97 and Taking TAAS February 1997, by Ethnicity
Enrollments 1996-
97 Taking TAAS Tests,
February 1997 Alternative Pass Rates
Predicted Actual No. % passing all 3 tests
Based on Actual F96
Enrl.
Based on Pred't F96
Enrl.
Black 42,418 36,627 27,451 48.0% 36.0% 31.1%
Hispanic 103,814 88,845 69,421 52.0% 40.6% 34.8%
White 141,855 131,150 108,215 81.0% 66.8% 61.8%
Source: Enrollments and no. taking and passing TAAS: TEA, PEIMS Data 1996-1997 and www.tea.state.tx.us/student.assessment/results/summary/sum97/gxen97.htm (downloaded March 22, 2000). Predicted enrollments based on 1995-96 enrollments and rates of grade promotion and retention as explained in text.
What these data show is that the dramatically improved pass rates on the 1997 grade 10 TAAS tests are in part a result of students who dropped out (or are otherwise missing) between grade 9 in 1996 and the TAAS testing in February 1997. The overall pass rates reported by TEA on the 1997
http://epaa.asu.edu/epaa/v8n41/part5.htm (15 of 18)7/30/2004 4:32:23 AM

EPAA Vol. 8 No. 41 Haney: The Myth of the Texas Miracle in Education--Part 5: Missing Students and Other Mirages
grade 10 TAAS tests, of 48%, 52% and 81% for Black, Hispanic and White students, respectively, drop to 36%, 40.6% and 66.8% if we base the pass rates on the Fall 1996 actual enrollments. And they drop even further, to 31.1%, 34.8% and 61.8% if we base the pass rates on the number of students predicted to have been in grade 10 in 1996-97 (based, as explained above on the 1995-96 grade 9 enrollments and the TEA reported rates of retention in 1996-97). This is, of course, also a reminder of an elementary fact of arithmetic. One can increase a proportion (such as percent passing) not just by increasing the numerator--but also by decreasing the denominator. In the next two sections, I estimate the proportions of the apparent gains in pass rates on the grade 10 TAAS tests between 1994 and 1998 that are attributable to decreases in the denominator (because of exclusion of students because either they dropped out of school or were classified as special education) and increases in the numerator (that is actual increases in numbers of students passing TAAS). Later, in Part 7, I return to the topic of dropouts in Texas, specifically to review and try to reconcile sources of evidence about high school completion in Texas.
5.6 Increase in Special Education Exclusions
Before trying to distinguish the proportions of apparent TAAS gains that are real from those that are illusory, it is necessary to explain another manner in which students may be excluded from the grade 10 TAAS results used to rate secondary schools in Texas. It may be recalled that the soaring pass rates on the grade 10 TAAS summarized in Part 3 above were based on grade 10 students "not in special education." As far as I know, the TEA has not reported directly numbers of grade 10 students over time who were "in special education." However, TEA has reported the grade 10 pass rates separately for all students and for all students not in special education (at www.tea.state.tx.us/student.assessment/results/summary/). This allows us simply to subtract the two sets of data to derive the numbers and percentages of students who took the grade 10 TAAS who were classified as "in special education." Summary results are shown in Table 5.5. (Note 15)
Table 5.5Number and % of Grade 10 TAAS Takers
in Special Education, 1994-1998
Numbers of Grade 10 TAAS Takers in Special Education
Year All groups Afric.-Amer. Hispanic White
1994 7602 833 1991 4685
1995 9049 1032 2351 5581
1996 11467 1500 3017 6810
1997 13005 1518 3707 7617
1998 14558 1818 4271 8284
http://epaa.asu.edu/epaa/v8n41/part5.htm (16 of 18)7/30/2004 4:32:23 AM
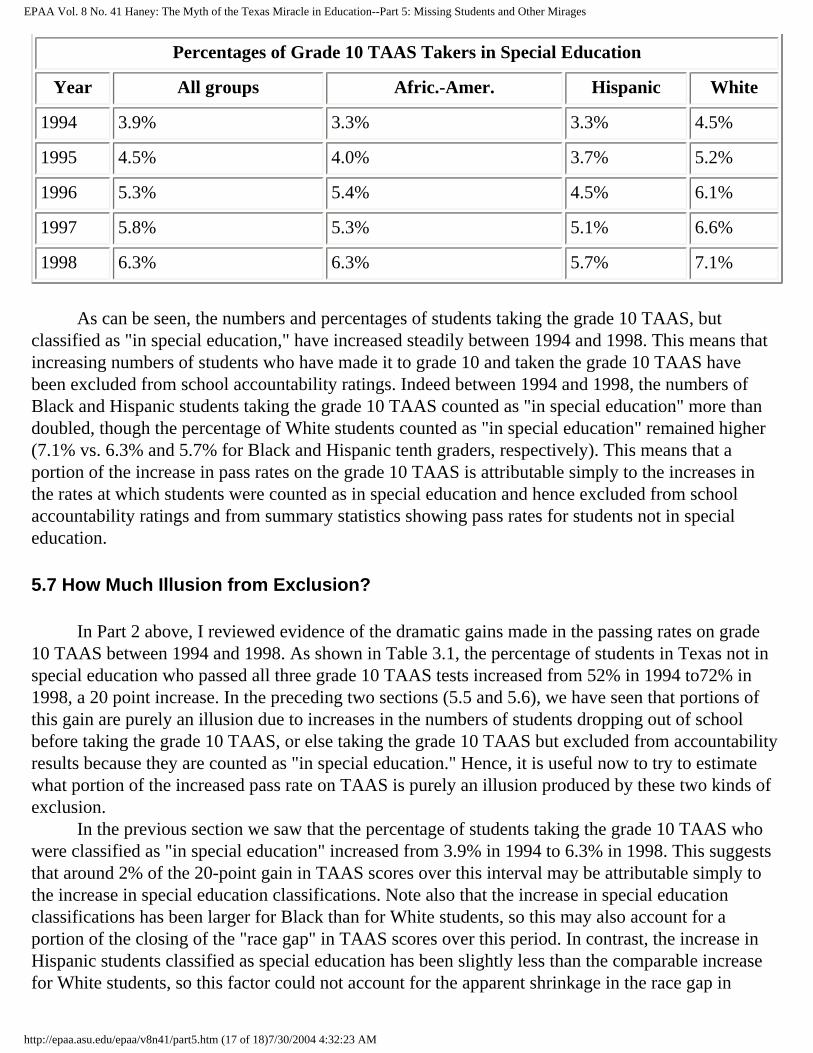
EPAA Vol. 8 No. 41 Haney: The Myth of the Texas Miracle in Education--Part 5: Missing Students and Other Mirages
Percentages of Grade 10 TAAS Takers in Special Education
Year All groups Afric.-Amer. Hispanic White
1994 3.9% 3.3% 3.3% 4.5%
1995 4.5% 4.0% 3.7% 5.2%
1996 5.3% 5.4% 4.5% 6.1%
1997 5.8% 5.3% 5.1% 6.6%
1998 6.3% 6.3% 5.7% 7.1%
As can be seen, the numbers and percentages of students taking the grade 10 TAAS, but classified as "in special education," have increased steadily between 1994 and 1998. This means that increasing numbers of students who have made it to grade 10 and taken the grade 10 TAAS have been excluded from school accountability ratings. Indeed between 1994 and 1998, the numbers of Black and Hispanic students taking the grade 10 TAAS counted as "in special education" more than doubled, though the percentage of White students counted as "in special education" remained higher (7.1% vs. 6.3% and 5.7% for Black and Hispanic tenth graders, respectively). This means that a portion of the increase in pass rates on the grade 10 TAAS is attributable simply to the increases in the rates at which students were counted as in special education and hence excluded from school accountability ratings and from summary statistics showing pass rates for students not in special education.
5.7 How Much Illusion from Exclusion?
In Part 2 above, I reviewed evidence of the dramatic gains made in the passing rates on grade 10 TAAS between 1994 and 1998. As shown in Table 3.1, the percentage of students in Texas not in special education who passed all three grade 10 TAAS tests increased from 52% in 1994 to72% in 1998, a 20 point increase. In the preceding two sections (5.5 and 5.6), we have seen that portions of this gain are purely an illusion due to increases in the numbers of students dropping out of school before taking the grade 10 TAAS, or else taking the grade 10 TAAS but excluded from accountability results because they are counted as "in special education." Hence, it is useful now to try to estimate what portion of the increased pass rate on TAAS is purely an illusion produced by these two kinds of exclusion. In the previous section we saw that the percentage of students taking the grade 10 TAAS who were classified as "in special education" increased from 3.9% in 1994 to 6.3% in 1998. This suggests that around 2% of the 20-point gain in TAAS scores over this interval may be attributable simply to the increase in special education classifications. Note also that the increase in special education classifications has been larger for Black than for White students, so this may also account for a portion of the closing of the "race gap" in TAAS scores over this period. In contrast, the increase in Hispanic students classified as special education has been slightly less than the comparable increase for White students, so this factor could not account for the apparent shrinkage in the race gap in
http://epaa.asu.edu/epaa/v8n41/part5.htm (17 of 18)7/30/2004 4:32:23 AM
EPAA Vol. 8 No. 41 Haney: The Myth of the Texas Miracle in Education--Part 5: Missing Students and Other Mirages
TAAS scores between Hispanic and White students. What about the possible effects of increases in dropout rates in inflating the apparent grade 10 pass rates? To answer this question we would need to have estimates of the dropout rates between the early 1990s and 1998. In Section 5.5 above, I presented estimates of dropouts for one year, namely 1996-97. Nonetheless, the grade 8 to 9 progression ratios discussed in Section 5.2 clearly suggest that dropout rates increased between the early and late 1990s. Specifically between the early and late 1990s, the grade 8 to 9 progression ratios for Black and Hispanic students increased from around 1.20 to nearly 1.30. This suggests that the rate at which Black and Hispanic students are being retained in grade, and having to repeat grade nine increased over this interval by around 50%. Since grade retention is a common precursor to dropping out, this certainly suggests an increased dropout rate. At the same time, the analyses of progress for grade 6 cohorts presented in Section 5.3 revealed that grade 6 to grade 11 progression ratios for Whites and minorities varied by not more than 5% during the 1990s (for Whites, the ratio was consistently between 85% and 89%; and for minorities between 75% and 80%). The reason for focusing here on progress to grade 11 is because the data on enrollments is from the fall whereas TAAS is taken in the spring. But if students progress to grade 11, they presumably have taken the exit level version of TAAS in spring of the tenth grade. What this suggests is that the majority of the apparent 20-point gain in grade 10 TAAS pass rates cannot be attributed to exclusion of the types just reviewed. Specifically, if rates of progress from grades 6 to grade 11 have varied by no more than 5% for cohorts of the classes of the 1990s, this suggests even if we take this as an upper bound, the extent to which increased retention and dropping out before fall grade 11, and add 2% for the increased rate of grade 10 special education classification, we still come up with less than half of the apparent 20-point gain in grade 10 TAAS pass rates between 1993 and 1998. So at this point in our analysis, it appears that while some of the gains may be due to these three forms of exclusion, a majority portion of the apparent gain is not. Hence it will be useful to turn in Part 7 to see whether the apparent gains on TAAS show up in any other evidence on the status and progress of education in Texas. Before turning to that topic, in Part 6 we review evidence from survey research about the effects of TAAS on education in Texas.
0: Home | 1: Intro. | 2: History | 3: The Myth | 4: TAAS | 5: Missing Students 6: Teachers | 7: Other Evidence | 8: Summary | Notes & Ref. | Appendix
http://epaa.asu.edu/epaa/v8n41/part5.htm (18 of 18)7/30/2004 4:32:23 AM
EPAA Vol. 8 No. 41 Haney: The Myth of the Texas Miracle in Education--Part 6: Teachers' Views of Education in Texas
Education Policy Analysis Archives
Volume 8 Number 41 The Texas Miracle in Education Walt Haney
6. Educators' Views of TAAS
When it was learned in early May 1999 that the trial in the GI Forum case was to be postponed from June until September 1999, I realized that this delay would allow sufficient time to undertake surveys of Texas teachers about TAAS. We had a variety of indirect evidence that raised doubts about the validity and reliability of TAAS scores and the relationship of TAAS tests to secondary school teaching: TAAS results statewide from 1990 to 1998, the historical record concerning the setting of the passing score of 70% correct on the TAAS, patterns of grade enrollments in Texas over the last two decades, and data on the relationship between high school course grades and TAAS scores. However, we did not have any systematic evidence from those most directly affected by the TAAS graduation test, namely, secondary teachers and students, as to the educational value and effects of the TAAS testing. Consequently, a survey was in order. Though we lacked the time and resources to survey the opinions of Texas students, with the help of Boston College graduate students, I undertook two different surveys of statewide samples of secondary teachers in Texas. One survey, previously described above was the survey for the Risk Analysis study. The second and larger survey was a "Survey of Testing and Teaching in Grades 7-12 in Texas," or what in shorthand was called the Testing and Teaching (TT) survey. To undertake these surveys, I purchased mailing labels for a random sample of 4000 secondary teachers in Texas (specifically math and English/Language Arts) from Market Data Retrieval of Shelton, Connecticut. The number of 4,000 mailing labels was selected simply to meet the minimum purchasing requirements of this firm. From this list of 4,000, I then randomly selected 1,000 names to be used for the Testing and Teaching survey and 500 names to be used for the Risk Analysis survey. The survey forms were mailed on May 23, 1999, with self-addressed, stamped return envelopes. We tabulated all responses that were returned by the end of June, 1999, specifically 148 responses for the TT survey and 66 for the Risk Analysis survey. For both surveys we double-checked the accuracy of data entry before tabulating results. Since the Risk Analysis survey has been described in Part 4 above, I do not discuss it further here. After undertaking this survey, I learned of two other surveys of Texas educators regarding TAAS: one by James Hoffman of the University of Texas at Austin and colleagues and the other by Gordon and Reese (1997). I describe these surveys in the order in which they were undertaken and reported, rather than the order in which I learned of them.
http://epaa.asu.edu/epaa/v8n41/part6.htm (1 of 15)7/30/2004 4:33:30 AM

EPAA Vol. 8 No. 41 Haney: The Myth of the Texas Miracle in Education--Part 6: Teachers' Views of Education in Texas
6.1 Survey/Interviews with Public School Teachers in Texas
Gordon and Reese surveyed 100 Texas teachers and followed up with interviews with 20 of the initial respondents. The authors do not explain how the survey respondents were sampled, but they do mention they were "graduate students in educational administration" (Gordon & Reese , 1997, p. 349). Given the authors' affiliation as professors of educational administration at Southwest Texas State University, one suspects that respondents may well have been an opportunity sample of graduate students in the authors' program and perhaps other similar graduate programs. Nonetheless the authors do report that respondents' schools represented a cross section of Texas public schools relative to education level (elementary, middle school, high school), size, location (urban, suburban, rural), socioeconomic status (high and low SES) and TAAS category (exemplary, recognized, acceptable and low performing) (Gordon & Reese , 1997, p. 349). In both the written survey and the follow-up interviews respondents were asked to address four broad questions:
1. How are students at your school prepared for TAAS?2. What are the effects of TAAS on your students?3. What are the effects of TAAS on you as a teacher?4. What are the effects of TAAS on your school?
In the initial written survey, respondents were given a full blank page to respond to each question. In the follow-up interviews, a stratified random sample of respondents was chosen for in-depth interviews. Interviews were audio-taped, transcribed and coded to identify patterns among responses. Regarding preparation for TAAS, respondents indicated that a huge amount of school time was devoted to coaching students for TAAS, with TAAS preparation becoming "all-consuming" during a period of four to eight weeks before the testing (p. 355). In most schools TAAS practice quizzes were administered on a regular basis with emphasis on teaching to the TAAS format, such as having students practice "bubbling" in answers on machine scorable answer sheets. Respondents' answers regarding effects of TAAS on students were categorized as dealing with emotional, academic and social effects. For one group of students, teachers reported "no emotional effects at all because these students fail to recognize the importance of TAAS and are totally indifferent about it" (p. 356). A second group experiences moderate stress "which tends to motivate them to work harder to prepare for the test" (p. 356). A third group of students experience high stress as a result of TAAS. Among some in this group, according to respondents, the stress leads to anxiety and even panic. Among others it leads to anger and resentment. And another "subgroup eventually responds to the stress by "shutting down";; they cope by telling themselves they have no chance of doing well on TAAS and giving up" (p. 356). One respondent reported that the stress of TAAS "contributes to the dropout rate" (p. 357). Regarding effects of TAAS on teachers, the vast majority of interview respondents (17 of 20) reported that TAAS leads to an emphasis on teaching TAAS-related content and "de-emphasis on
http://epaa.asu.edu/epaa/v8n41/part6.htm (2 of 15)7/30/2004 4:33:30 AM
EPAA Vol. 8 No. 41 Haney: The Myth of the Texas Miracle in Education--Part 6: Teachers' Views of Education in Texas
teaching content not related to TAAS," (p. 359), including less emphasis on higher-level skills. All 20 interviewees also reported "concern, frustration and disappointment, caused by observing the negative effects of TAAS failure on at-risk students" (p. 360). Interviewees also reported that TAAS scores are "not accurate measures of the academic progress that their at-risk students have made" (p.360). Regarding effects on teachers, "Nineteen of the interviewees agreed that TAAS makes them accountable in terms of teaching TAAS-related content, but that it does not make them accountable in terms of being effective teachers" (p. 360). While acknowledging the need for teacher accountability, respondents felt that TAAS was not a good vehicle for achieving accountability because "TAAS is not a true measure of student learning and . . .it is unfair to use a single instrument like TAAS to compare the performance of teachers who are working with students of widely varying socioeconomic backgrounds, academic abilities and motivational levels" (pp. 360-61). Regarding effects on schools, interviewees reported that "considerable human and material resources are expended on TAAS preparation" (p. 361) and that aspects of the curriculum that did not relate to TAAS were de-emphasized. Respondents were split as to whether or not their schools were "receiving pressure from parents and the community to do well on TAAS" (p. 362). In their discussion, Gordon and Reese write that teacher respondents "reported not just 'teaching to the test' but also teaching to the test format, and doing so at the expense of large portions of the curriculum" (p. 363, emphasis in original). They also report that via focused "TAAS prep" teachers can "teach students how to respond correctly to test items even though the students have never learned the concepts on which they are being tested" (p. 364). The authors conclude that "drill and kill" coaching and preparation for TAAS are taking a "toll on teachers and students alike" and comment:
The most devastating effects of high-stakes testing seem to be occurring to the students who these tests are supposed to help the most—lower achieving students. Presumably, by setting clear standards and measuring results, state mandated tests make schools accountable for the basic education to which all children are entitled. According to participants in our study, however, their at-risk students" academic progress is being hindered by the negative effects of failing a test that many teachers insist does not measure what their students need to learn at their current stages of development, does not measure the progress their students have made, and is culturally biased. (Gordon & Reese, 1997, pp. 364-65).
The authors concluded with a number of recommendations for public dialog about the merits of high stakes testing, staff development, monitoring of the effects of high stakes testing, and establishment of a broader system of student assessment.
http://epaa.asu.edu/epaa/v8n41/part6.htm (3 of 15)7/30/2004 4:33:30 AM

EPAA Vol. 8 No. 41 Haney: The Myth of the Texas Miracle in Education--Part 6: Teachers' Views of Education in Texas
6.2 Testing and Teaching Survey of Secondary Math/English Teachers
I did not learn of the Gordon & Reese (1997) survey until recently. However, as previously explained, when the TAAS trial was postponed from June until September 1999, my colleagues and I decided to undertake a survey of a representative sample of teachers in Texas statewide. The purpose of our Testing and Teaching survey was to obtain the opinions of a representative sample of secondary math and English/Language arts teachers in Texas statewide about the relationships between mandated testing and teaching and the effects of mandated testing. The survey form we used is a minor revision of a survey instrument that was administered to teachers nationwide in the early 1990s as part of a study funded by the National Science Foundation (Madaus et al., 1992). Specifically, from their survey instrument, one set of questions related to elementary education was deleted, one question was added, and space was provided at the end of the survey form for respondents to comment and provide their name and address, if they wished to receive a summary of survey results. Note that our survey form did not specifically ask about TAAS. A copy of our Testing and Teaching survey form is provided in Appendix 1. By the end of June 1999, we had received 148 responses to our Testing and Teaching survey (representing a 14.8% response rate). (Note 16) After survey forms were received, data were entered and checked for accuracy, and a code book documenting data coding was developed. Before summarizing overall results of the Testing and Teaching survey, I should mention that on two of the forms returned, respondents had not completed answers to most questions, so they were excluded, leaving the main analysis sample with 146 respondents. Respondents showed a good distribution of grade levels from 7 to 12, with several indicating teaching at more than one grade level. The vast majority were certified teachers (143) and roughly half (72) indicated that they had more than 12 years of teaching experience. The vast majority (123) also reported that they were "very comfortable" teaching their subject area. As the survey form we used was addressed to the topic of mandated testing, it did not ask respondents directly about TAAS. However, in response to one question (C1), 118 respondents indicated that students in their class were required by their state or district to take standardized tests in the subject during the current calendar year. Space was provided for respondents to write the names of mandated tests to which they were referring and 112 respondents explicitly mentioned TAAS. In response to a question about how mandated test results are used, respondents indicated that the most common uses were:
to publish test scores (81%);to evaluate teachers (66%);to place students in programs (57%);to promote/graduate students (53%).
In contrast, only a minority of respondents (46%) indicated that mandated test results were used to alter the school curriculum.
http://epaa.asu.edu/epaa/v8n41/part6.htm (4 of 15)7/30/2004 4:33:30 AM

EPAA Vol. 8 No. 41 Haney: The Myth of the Texas Miracle in Education--Part 6: Teachers' Views of Education in Texas
In response to two sets of questions about teachers' own use and administrators' use of mandated test results, teachers indicated that results were "minimally" to "somewhat" important for a variety of purposes; but the uses rated most important across both sets of questions were two uses by administrators:, namely school evaluation and district evaluation (both rated on average between "very" and "extremely" important). A section of questions asked about test preparation. Results for these questions suggested a huge amount of test preparation, with the majority of respondents indicating that they do many different kinds of test preparation and 50% of respondents indicating that they spend more than 30 hours per year on test preparation. Also, 75% of respondents said that they begin test preparation more than one month before the mandated test. In a set of questions addressed to the relationships between testing, curriculum and evaluation, respondents indicated that mandated testing influences teaching in a variety of ways, including influencing the increase or decrease of emphasis on certain topics and the content and format of tests that teachers use. In response to a question about the similarity of content of mandated testing and their own instruction, only 52% of 129 respondents answered "quite" or "very" similar. Another series of questions asked about more general influences of mandated testing. The percentages of teachers agreeing (that is, agreeing or agreeing strongly) with each of these statements are summarized in Table 6.1.
Table 6.1Summary Results of Secondary Teachers' Answers about
General Influences of Mandated Testing in Texas
StatementPercent of teachers answering
"Agree" or "Strongly Agree" (n=139 to 142)
6. Mandated testing influences teachers to spend more instructional time in whole group instruction.
65%
7. Mandated testing influences teachers to spend more instructional time in developing critical thinking skills.
45
8. Mandated testing influences teachers to spend more instructional time on individual seat work.
57
9. Mandated testing influences teachers to spend more instructional time in developing basic skills.
73
10. Mandated testing influences teachers to spend more instructional time with small groups of students working together (cooperative learning).
24
11. Mandated testing influences teachers to spend more instructional time solving problems that are likely to appear on tests.
88
http://epaa.asu.edu/epaa/v8n41/part6.htm (5 of 15)7/30/2004 4:33:30 AM
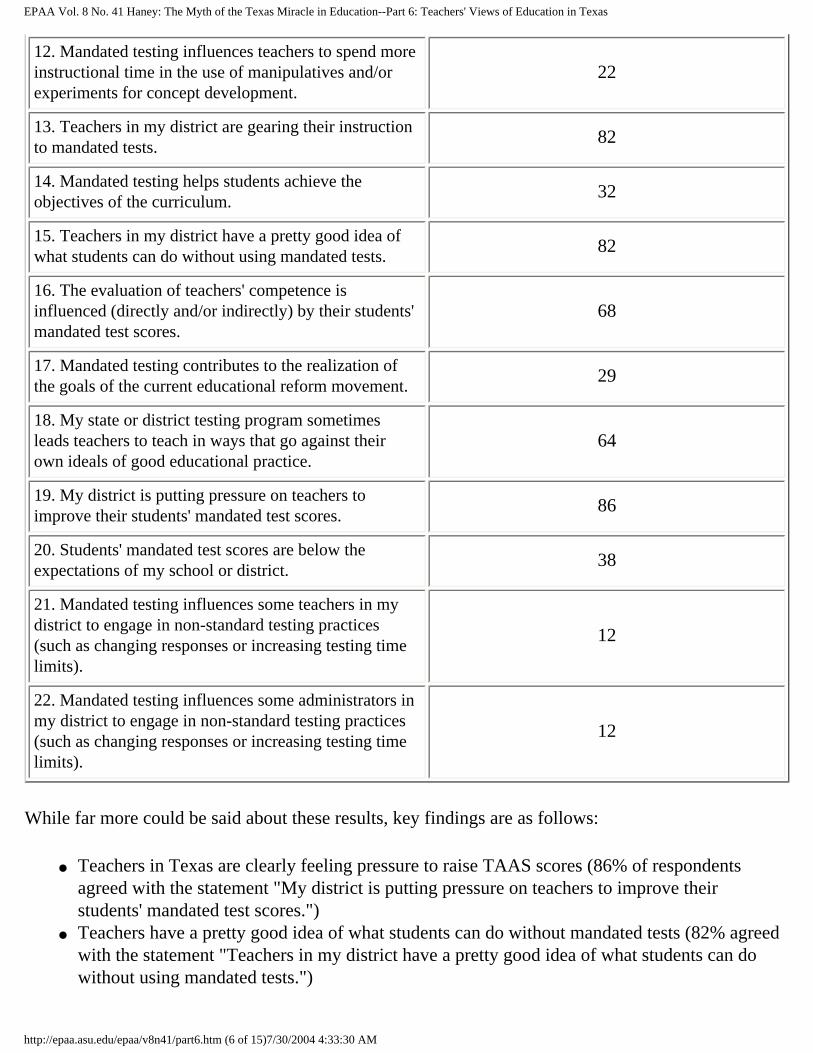
EPAA Vol. 8 No. 41 Haney: The Myth of the Texas Miracle in Education--Part 6: Teachers' Views of Education in Texas
12. Mandated testing influences teachers to spend more instructional time in the use of manipulatives and/or experiments for concept development.
22
13. Teachers in my district are gearing their instruction to mandated tests.
82
14. Mandated testing helps students achieve the objectives of the curriculum.
32
15. Teachers in my district have a pretty good idea of what students can do without using mandated tests.
82
16. The evaluation of teachers' competence is influenced (directly and/or indirectly) by their students' mandated test scores.
68
17. Mandated testing contributes to the realization of the goals of the current educational reform movement.
29
18. My state or district testing program sometimes leads teachers to teach in ways that go against their own ideals of good educational practice.
64
19. My district is putting pressure on teachers to improve their students' mandated test scores.
86
20. Students' mandated test scores are below the expectations of my school or district.
38
21. Mandated testing influences some teachers in my district to engage in non-standard testing practices (such as changing responses or increasing testing time limits).
12
22. Mandated testing influences some administrators in my district to engage in non-standard testing practices (such as changing responses or increasing testing time limits).
12
While far more could be said about these results, key findings are as follows:
● Teachers in Texas are clearly feeling pressure to raise TAAS scores (86% of respondents agreed with the statement "My district is putting pressure on teachers to improve their students' mandated test scores.")
● Teachers have a pretty good idea of what students can do without mandated tests (82% agreed with the statement "Teachers in my district have a pretty good idea of what students can do without using mandated tests.")
http://epaa.asu.edu/epaa/v8n41/part6.htm (6 of 15)7/30/2004 4:33:30 AM

EPAA Vol. 8 No. 41 Haney: The Myth of the Texas Miracle in Education--Part 6: Teachers' Views of Education in Texas
● More teachers disagreed (45%) than agreed (32%) with the statement that "Mandated testing helps students achieve the objectives of the curriculum."
● More teachers disagreed (39%) than agreed (29%) with the statement that "Mandated testing contributes to the realization of the goals of the current educational reform movement."
● On the brighter side, results of the Testing and Teaching survey suggest that teachers and administrators are not widely engaging in non-standard testing practices (only 12% of respondents agreed with the last two statements (# 21 and #22) in part of F of the survey form). Indeed, one respondent commented "Perhaps I misunderstood questions 21 & 22. Are you asking if my district condones cheating? Absolutely not, the repercussions for that are very severe in this state" [173].
As indicated, the last portion of the Testing and Teaching survey form provided space for respondents to offer comments after these instructions: "If you would like to offer any comments about the relationship between mandated testing and teaching in Texas secondary schools, please write them here." A total of 51 respondents offered comments. On balance, these spontaneous comments on the relationship between mandated testing and teaching in Texas secondary schools were far more negative than positive about the role of mandated testing, with comments such as the following:
TAAS results haven't had the desired effect. It is used more as a "HAMMER" rather than a tool to improve. (Case 17)
I am not against mandated testing; but every time we work out a procedure for balancing the teaching, the state moves the test to a different grade level. We have it working well now, and now they're talking about moving it to 9th & 11th instead of 10th. (Case 39)
Mandated state TAAS Testing is driving out the best teachers who refuse to resort to teaching to a low-level test! (Case 67)
In citing these few comments here, I note that the full set of all respondents' comments appears as Appendix 2.
http://epaa.asu.edu/epaa/v8n41/part6.htm (7 of 15)7/30/2004 4:33:30 AM
EPAA Vol. 8 No. 41 Haney: The Myth of the Texas Miracle in Education--Part 6: Teachers' Views of Education in Texas
6.3 Survey of Texas Reading Specialists
The third survey of educators in Texas about TAAS was by Hoffman, Pennington & Assaf of the University of Texas—Austin and Paris of the University of Michigan. I did not learn of this survey until just before the TAAS trial in the Fall of 1999 and results of this survey were not allowed to be entered as evidence in the TAAS case. Nonetheless, Hoffman and colleagues have been very generous in sharing with me not just a manuscript reporting on their survey results, but also an entire set of their original data. The Hoffman et al. (1999) survey was of members of the Texas State Reading Association (TSRA), an affiliate of the International Reading Association, whose membership includes classroom teachers, reading specialists, curriculum supervisors, and others in leadership positions. The purpose of the survey "was to examine the ways in which TAAS affects teachers, teaching and students from the perspective of the professional educators who are closest to classrooms and schools" (Hoffman et al., 1999, p. 3). The survey form contained 113 items, many duplicated or slightly adapted from Urdan & Paris's (1994) survey of teachers in the state of Michigan and the Haladyna, Nolen, and Haas (1991) survey of teachers in Arizona. The survey items were mostly Likert-scale items (with a five-point scale answer format: 1=strongly disagree, 2=disagree, 3= agree, 4=strongly agree, and 5=don't know) asking about attitudes, test preparation and administration practices, uses of scores, effects on students, and overall impressions of trends. In addition, five items were included containing invitations for extended written responses. The authors surveyed a random sample of members of the TSRA. After a reminder letter and a second random sampling, they received a total of 201 usable responses representing an overall return rate of 27% of surveys sent (representing 5% of the total membership of TSRA). The authors report that no biases were detected in the response rates "based on geographical areas of the state" of Texas (p. 4). The authors reported results in three different ways: percentages responding to particular questions in particular ways, scaled response representing answers summed across items relating to similar topics, and verbatim quotations of written responses. Overall, respondents to the Hoffman et al. survey were older (61% between the ages of 40-60), and more experienced (63% with over 10 years experience and 45% with over 20 years experience) than classroom teachers in general in the state of Texas (p. 5). Scaled score responses indicated that on a composite measure of general attitudes toward TAAS "reading specialists strongly disagree with some of the underlying assumptions and intentions for TAAS" (p. 5). Other scaled score responses revealed that that "reading specialists challenge the basic validity of the test and in particular for minority and ESL speakers who are the majority in Texas public schools" (p. 6). Another composite variable representing general attitudes towards TAAS reflected "a strong negative attitude toward TAAS" (p. 7). Respondents' answers regarding effects of TAAS on students revealed that a majority said that TAAS often or always caused student irritability, upset stomachs and headaches. Responses to three questions regarding overall impressions of TAAS were particularly striking. One question asked:
The results from TAAS testing over the past several years seem to indicate that scores are on the rise. Do you think this rise in test scores reflects increased learning and
http://epaa.asu.edu/epaa/v8n41/part6.htm (8 of 15)7/30/2004 4:33:30 AM

EPAA Vol. 8 No. 41 Haney: The Myth of the Texas Miracle in Education--Part 6: Teachers' Views of Education in Texas
higher quality teaching?
To this question, 50% answered no, and 27% answered yes. Another question read as follows:
It has been suggested that the areas not tested directly on TAAS (e.g., fine arts) and other areas not tested at certain grades levels (e.g., science at the 4 th grade level) receive less and less attention in the curriculum. What do you feel about this assertion?
In response to this question, 85% answered "very true" or "somewhat true." A third question read as follows:
It has also been suggested that the emphasis on TAAS is forcing some of the best teachers to leave teaching because of the restraints the tests place on decision making and the pressures placed on them and their students.
A total of 85% of respondents agreed with this statement. Written comments "revealed the depth of feeling and passion on the part of teachers with respect to trends in TAAS testing:"
I am very sad that education has stooped to the low level of measuring performance with standardized testing and Texas has taken it even lower with their TAAS. We know what works in education. We just seem to ignore the research and keep on banging our heads against the "TAAS wall" and "retention walls."
Please support teachers more than ever. Our children are hurting more than ever. If there was ever a time to change it is now. Give teachers back their classrooms. Let them teach and spend quality time with their students. They need us!
I think TAAS is the biggest joke in Texas. I have never seen such an injustice.
I believe that TAAS interferes with the very nature of our job. The pressure from administrators to increase campus scores leaves teachers little time for real instruction...."
My heart breaks to see so many teachers "just surviving." I believe that our solution is just to support each other because the public has no real concept of the situation.
TAAS is ruining education in Texas! Help!
6.4 Similarities and Differences in Survey Results
http://epaa.asu.edu/epaa/v8n41/part6.htm (9 of 15)7/30/2004 4:33:30 AM
EPAA Vol. 8 No. 41 Haney: The Myth of the Texas Miracle in Education--Part 6: Teachers' Views of Education in Texas
The surveys summarized above were undertaken independently and polled somewhat different samples of Texas educators. Gordon and Reese surveyed Texas teachers who were "graduate students in educational administration" (Gordon & Reese , 1997, p. 349). Though the authors do not explain exactly when this survey was conducted, it was presumably around 1996. The survey by Hoffman et al. and the one undertaken by me were both performed during 1998-99, though of somewhat different populations. Hoffman et al. surveyed reading specialists statewide, while I surveyed secondary math and English/language arts teachers. Despite these differences, results of the three independent surveys of Texas educators have four broad findings in common. Texas schools are devoting a huge amount of time and energy preparing students specifically for TAAS. As mentioned, in the Gordon & Reese survey, respondents reported a huge amount of school time was devoted to coaching students for TAAS, with TAAS preparation becoming "all-consuming" during a period of four to eight weeks before the testing (p. 355). In the Testing and Teaching survey, 75% of respondents said that they begin test preparation more than one month before the mandated test (TAAS). And in the Hoffman et al. survey, when asked whether the rise in TAAS scores reflected "increased learning and higher quality teaching," nearly twice as many respondents answered "no" (50%), as answered "yes" (27%). In their written comments to this question many teachers explained that they felt test preparation was what accounted for the rising scores:
I feel that it reflects that we are doing a better job teaching for the test. We are being forced to teach the test. (Case 11).
Students are being trained earlier on how to take the TAAS test. In 5-10 more years a different format will be provided & low scores will be the reason to teach to that test too. (Case 17).
I think students know how to take the test because we practice ad nauseum. (Case 20).
TAAS is a poor measure of actual student performance. Increases are due to becoming accustomed to the test. (Case 38).
Teachers are teaching to TAAS period. Curriculum is directed by TAAS even in K. TAAS doesn"t address all areas - if it did colleges would have better results than ever before instead of remedial classes! (Case 46).
The scores reflect an increase in time spent on one test instead of teaching students the regular curr.[iculum]. (Case 49).
Teachers are spending the school day teaching to the test. (Case 84).
Higher quality teaching is not exhibited on a daily basis. However TAAS test taking
http://epaa.asu.edu/epaa/v8n41/part6.htm (10 of 15)7/30/2004 4:33:30 AM

EPAA Vol. 8 No. 41 Haney: The Myth of the Texas Miracle in Education--Part 6: Teachers' Views of Education in Texas
skills occur everyday. (Case 95).
We've been teaching to the TAAS so long, our students are used to it. (Case 102).
The rising scores may be a result of better test-taking skills rather than knowledge. (Case 131).
No, School districts have figured out how to teach to the TAAS and to exclude students from being accounted. (Case 136).
I believe the scores reflect that students are learning test-taking strategies. (Case147).
Kids are just being programmed on how to take and pass the TAAS test, not truly mastering skills. (Case 151).
Teachers are learning how to teach the TAAS (Case 169).
I believe that students are simply being taught to take the test, not learn and apply the knowledge. (Case 199).
One comment from the Hoffman et al. survey described the emphasis on test preparation this way:
Our campus has 2 practice TAAS (annually) (Nov. & Feb) plus the "real" taas. Our wkly lesson plans contain TAAS warm-ups, TAAS lesson objectives, and 20 min of reading. I personally am sick of TAAS by April & May. My Teacher evaluation last yr was down because my student scores were down by 7 pts. I personally have 6 friends who quit teaching altogether because of TAAS. (Case No. 94)
Even some of the teachers who answered "Yes" in the Hoffman survey, that the rise in TAAS scores did reflect "increased learning and higher quality teaching," qualified their answers considerably in their written comments:
Students are learning more of the basic skills TAAS tests because teachers are figuring out better ways to teach them. Students are NOT receiving a well-rounded education because Social Studies & Science are being cut to teach TAAS skills. (Case 106).
Yes, there is increased learning but at a partial price. I have seen more students who can pass the TAAS but cannot apply those skills to anything if it's not in TAAS format. I have students who can do the test but can't look up words in a dictionary and understand the different meanings. They can write a story but have trouble following
http://epaa.asu.edu/epaa/v8n41/part6.htm (11 of 15)7/30/2004 4:33:30 AM
EPAA Vol. 8 No. 41 Haney: The Myth of the Texas Miracle in Education--Part 6: Teachers' Views of Education in Texas
directions for other types of learning. As for higher quality teaching, I'm not sure that I would call it that. Because of the pressure for passing scores, more and more time is spent practicing the test and putting everything in TAAS format. (Case 184).
A handful of respondents suggested that that the rise in TAAS scores was due not to test preparation or increased learning, but to the TAAS tests getting easier over time, to schools excluding low scoring students, or to administrators' cheating:
TAAS scores have seemed to rise in election years. The tests seemed easier in those years. (Case 121).
It seems as though the questions are actually easier. (Case 127).
No, School districts have figured out how to teach to the TAAS and to exclude students from being accounted. (Case 136)
I think the tests are easier to make the legislators look better. (Case 155).
The test seems to have gotten easier. (Case 159)
There are a lot of teachers and administrators who know how to "cheat" and get higher scores by kids. They don't want their school to score bad, so they cheat. (Case 160).
I also think there are admin. who are cheating ex. Austin schools. (Case 193).
Emphasis on TAAS is hurting more than helping teaching and learning in Texas schools. As mentioned, the results of the Hoffman et al. survey showed that a clear plurality of respondents (50%) reported that TAAS score gains were not due to "increased learning and higher quality teaching." No directly analogous questions were asked in the Testing and Teaching or Gordon & Reese surveys, but some of the findings from these surveys confirm Texas teachers' generally negative views about the educational impact of TAAS. Recall that in the Testing and Teaching survey, it was found that more teachers disagreed (45%) than agreed (32%) with the statement that "Mandated testing helps students achieve the objectives of the curriculum." Also, more teachers disagreed (39%) than agreed (29%) with the statement that "Mandated testing contributes to the realization of the goals of the current educational reform movement." Recall also that Gordon & Reese concluded that "drill and kill" coaching and preparation for TAAS were taking a "toll on teachers and students alike"—especially "lower achieving students" whose "academic progress is being hindered by the negative effects of failing a test that many teachers insist does not measure what their students need to learn at their current stages of development, does not measure the progress their students have made, and is culturally biased." (pp. 364-65). As in the Hoffman et al. survey, written responses to our Testing and Teaching survey help to convey something of teachers' depth of feeling and passion about TAAS:
http://epaa.asu.edu/epaa/v8n41/part6.htm (12 of 15)7/30/2004 4:33:30 AM
EPAA Vol. 8 No. 41 Haney: The Myth of the Texas Miracle in Education--Part 6: Teachers' Views of Education in Texas
Texas has the "Texas Assessment of Academic Skills" test. Most schools have established a class strictly for the TAAS test. Our curriculum is based on previous TAAS test questions. We "teach the TAAS" in our classes. Our administrators have even gone as far as incorporating TAAS objectives and materials into daily instruction in ALL subject areas. We are not covering skills for higher level thinking at times because of state mandated tests. (Case 13).
Testing is now more important than teaching. Students learn much about testing, little about subject. (Case 20).
We are testing our students to death! My students have been taken out of class four times this year for standardized testing. Too MUCH! (and for what?) (Case 29).
There are too many loopholes. Students who were never on an IEP or in CM are being forced into it so that they will be exempt from standardized tests. (Case 42).
Mandated state TAAS Testing is driving out the best teachers who refuse to resort to teaching to a low level test! (Case 67).
TAAS has become the Be All and End All. It is ridiculous to put so much on one test, where even good students have been known to guess and not even read the question. I have seen them. Our school can be at risk because one student chooses to mess up. One year we were on probation for 1 student over the limit. (Case 87, emphasis in original).
Mandated testing has severely damaged the mathematics curriculum! (Case 93).
Teaching to the TAAS results in a level of education which is substandard. I strongly feel TAAS should be abolished. (Case 104).
Mandatory tests are hard on both teachers and students. Our state set the End of Course test one week before semester finals. The stress level for all of us is high. The end of school in itself is difficult. Why do we compound the situation by adding another useless test. Our state is also taking the EOCourse test out of the schedule. They are replacing the EOC with another TAAS test. At least the EOC covered current material. Now extra work is added because the TAAS covers different areas than Algebra essential elements. (Case 123).
We are so concerned about the TAAS & End of Course exam that we are teaching the test, but the kids are not learning the material. I can teach the test, and have a very high percentage pass, yet have kids that know no Algebra. Going to three years TAAS
http://epaa.asu.edu/epaa/v8n41/part6.htm (13 of 15)7/30/2004 4:33:30 AM
EPAA Vol. 8 No. 41 Haney: The Myth of the Texas Miracle in Education--Part 6: Teachers' Views of Education in Texas
testing in the future will reduce education to completely teaching the test, and we will graduate an illiterate generation. (Case 130).
I really feel that we are definitely getting away from teaching the basic concepts to teaching the test and this is very sad because the farther the student goes in mathematics the less he or she knows of the why's. (Case 133).
It stiffles professional growth and academic growth as well. Too much emphasis on testing. (Case 147).
Emphasis on TAAS is particularly harmful to at-risk students. A third finding common across the three surveys is that the focus on TAAS in Texas is especially harmful to particular kinds of students. This finding is interesting because none of the surveys asked directly about this issue. Nonetheless, the matter arose in all three inquiries. Recall Gordon & Reese's concluding comment that in the common opinion of their interviewees "their at-risk students' academic progress is being hindered by the negative effects of failing a test that many teachers insist does not measure what their students need to learn at their current stages of development, does not measure the progress their students have made, and is culturally biased" (Gordon & Reese, 1997, pp. 364-65). Also, spontaneous comments in the Testing and Teaching and Hoffman et al. surveys raised similar concerns. From the former:
I personally wonder about the fairness of these tests. Children from lower SES tend not to do as well. Therefore, it tends to be discriminatory I think. I think some children do not have the cultural experiences that help them answer the questions accurately. (Case 84).
The TAAS test is driving the curriculum and not teaching students how to think. It also punishes ESL studentsóthey can complete four years of high school with adequate grades but not be allowed to walk at graduation because they do not have enough command of English to pass the TAAS Exit. (Case 66).
In teachers' written comments in the Hoffman et al. survey, several teachers mentioned the problems created for special education students by emphasis on TAAS. Here is one extended example:
Special education assessments. . . and diagnostic evaluations are NOT aligned with TAAS objectives. Therefore children are sometimes not qualified for spe. ed. services who have low IQs and yet are expected to pass TAAS to graduate. I.E.P. goals for reading and math (other than "mainstream" IEP's) are not compatible with TAAS in our district. Reading goals are not detailed enough in comprehension, math is not grade-level appropriate. IEP's tend to emphasize discrete skills, such as computation while TAAS emphasizes application and problem solving. Texas criteria for diagnosis
http://epaa.asu.edu/epaa/v8n41/part6.htm (14 of 15)7/30/2004 4:33:30 AM
EPAA Vol. 8 No. 41 Haney: The Myth of the Texas Miracle in Education--Part 6: Teachers' Views of Education in Texas
of L.D. do not take into consideration TAAS standards. Teachers, under pressure to have good scores, over-refer students for spe. ed. testing—sometimes 1/3-1/2 of their classes! Most administrators (NOT mine) pressure ARD committees to exempt all students in spe. ed. from taking TAAS. Appropriate alternative assessments are not available. TAAS does not take into account LEP students, or students in special education, who are being "included" in higher numbers. (Case No. 89) (Note 17)
Emphasis on TAAS contributes to retention in grade and dropping out of school. Finally, all three surveys provide support for the proposition that emphasis on TAAS contributes to both retention in grade and students dropping out of school. One question in the Hoffman et al. survey asked respondents:
Are there efforts to exclude/exempt students from testing who might not do well on the test and thereby negatively affect a school's rating?
Overall, 67% of respondents answered "often" or "sometimes" in response to this question. Obviously, there are ways of excluding students other than by retention in grade and encouraging drop outs (such as special education classification). But recall that one out of 20 interviewees in the Gordon and Reese survey said directly that "the stress of TAAS contributes to the dropout rate." A majority of respondents in the Testing and Teaching survey rated "to promote/graduate students" as a common use of mandated tests in Texas. Additionally, many written comments in the Hoffman et al. surveys expressed dissatisfaction with the practice of retaining students in grade based on TAAS scores, irrespective of other evidence about student learning. In concluding this discussion of the results of three surveys of Texas educators regarding TAAS, it is only fair to add one major caveat. Despite the preponderance of negative comments about the effects of TAAS on education in Texas, there were some comments suggesting that the role of TAAS is at least somewhat beneficial:
It seems to wor kout fairly well for most of us with TAAS, however, the end of course tests are not that useful. (Case 5).
I believe there is a purpose for these tests. If nothing else, it gives teachers goals for their students. But I do not believe my teaching competence should be based on those scores solely. (Case 34, emphasis in original).
In light of this contrast, with most teachers reporting the effects of TAAS to be harmful, but with a minority reporting positive effects, it is useful to draw back, to try to gain a broader picture of the status of education in Texas. It is to such a perspective that we turn in Part 7. (Note 18)
0: Home | 1: Intro. | 2: History | 3: The Myth | 4: TAAS | 5: Missing Students 6: Teachers | 7: Other Evidence | 8: Summary | Notes & Ref. | Appendix
http://epaa.asu.edu/epaa/v8n41/part6.htm (15 of 15)7/30/2004 4:33:30 AM
EPAA Vol. 8 No. 41 Haney: The Myth of the Texas Miracle in Education--Part 7: Other Evidence
Education Policy Analysis Archives
Volume 8 Number 41 The Texas Miracle in Education Walt Haney
7. Other Evidence on Education in Texas
Beyond the views of teachers, what other evidence is available that might provide a picture of the status and progress of education in Texas? In Part 7, we review four kinds of evidence. First, we compare sources of evidence on high school completion in Texas with the data previously presented in Part 5 above. Next we compare data on retention in grade for states which have reported such data. In Section 7.3 we review evidence available from SAT college admissions testing over the last 30 years. Then, in Section 7.4 we return to take a closer look at NAEP data—some of which, as we saw in Part 2 above, has previously been cited as evidence of the Texas "miracle" in education. Finally, we comment briefly on several other sources of evidence about education in Texas.
7.1 Dropout Data on Texas Revisited
As mentioned previously, when I first started studying education in Texas approximately two years ago, a major discrepancy quickly contributed to my suspicions about the validity of the TEA reported data on dropout rates in Texas (some of which was reproduced in Table 3.3 above). The TEA data showing declining dropout rates in Texas were contradicted by two independent sources of evidence: a series of attrition studies reported by the Intercultural Development Research Association (IDRA), and reports on dropouts in the United States from the National Center for Education Statistics (NCES). The IDRA and NCES sources did not, however, contain estimates of dropout rates for Texas as far back as I needed to examine the apparent effects of high school graduation testing on grade enrollments and high school graduation. Consequently, I sought to analyze data on Texas high school graduates and enrollments by grade going back to the mid-1970s. Nonetheless, having done so, it is now helpful to recount the IDRA and NCES reports' findings and to compare them with results previously presented. Before reviewing and comparing these sources, let me review TEA-reported dropout data in more detail than was done in Part 3 above. TEA Dropout Data. In the Fall of 1999, the Texas Education Agency (TEA) released a report titled 1997-98 Report on Texas Public School Dropouts. (The report was originally issued in September 1999, and in a revised edition in December.) The highlights of the report were as follows:
How many students drop out?
● In 1997-98, a total of 27,550 students in Grades 7-12 dropped out ofTexas public schools.
● Statewide, the annual dropout rate was 1.6 percent, unchanged from 1996-97. ● The 1997-98 actual longitudinal dropout rate, calculated for a cohort of students
http://epaa.asu.edu/epaa/v8n41/part7.htm (1 of 36)7/30/2004 4:34:52 AM
EPAA Vol. 8 No. 41 Haney: The Myth of the Texas Miracle in Education--Part 7: Other Evidence
tracked from 7th to 12th grade, was 14.7 percent.
Who drops out and why?
● About 77 percent of dropouts were overage for grade, down from over 80 percent in 1996-97.
● On average, males continued to drop out at a slightly higher rate than females. ● Hispanic students had the highest average dropout rate, at 2.3 percent, followed
by African American students (2.1%). ● Reasons cited for dropping out of school included poor attendance, entering non-
state-approved General Educational Development (GED) programs, and pursuing a job.
Are they leaving certain districts?
● School districts with the largest enrollments (50,000 or more students) had the highest average dropout rate, at 2.1 percent.
● Generally, districts with lower student passing rates on the Texas Assessment of Academic Skills (TAAS) had higher dropout rates.
How do we compare nationally?
● Based on the Current Population Survey, an estimated 4.6 percent of students in Grades 10-12 dropped out of school across the nation.
● Texas had one of the lower dropout rates out of 32 states that met required Common Core of Data collection standards for school year 1996-97. (TEA, 1999, 1997-98 Report on Texas Public School Dropouts, p. iii)
Table 8 of the TEA report presented data on "historical dropout rates by ethnicity." Figure 7.1 presents a graph of these data.
http://epaa.asu.edu/epaa/v8n41/part7.htm (2 of 36)7/30/2004 4:34:52 AM
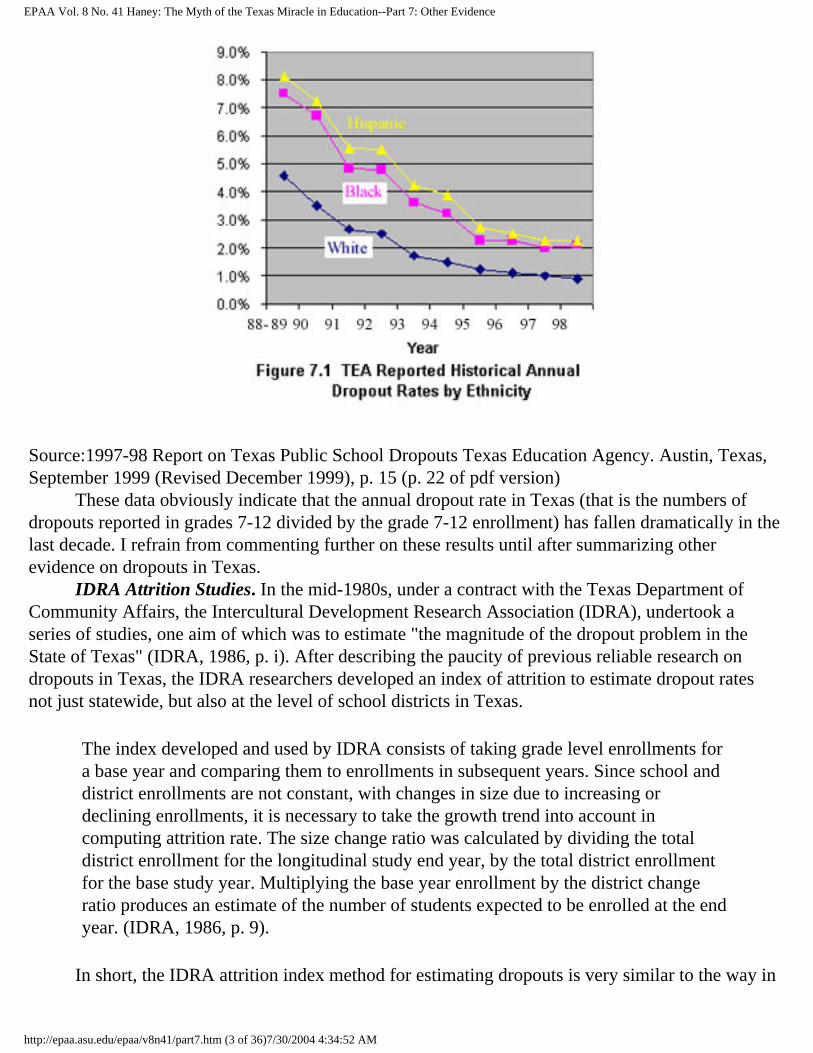
EPAA Vol. 8 No. 41 Haney: The Myth of the Texas Miracle in Education--Part 7: Other Evidence
Source:1997-98 Report on Texas Public School Dropouts Texas Education Agency. Austin, Texas, September 1999 (Revised December 1999), p. 15 (p. 22 of pdf version) These data obviously indicate that the annual dropout rate in Texas (that is the numbers of dropouts reported in grades 7-12 divided by the grade 7-12 enrollment) has fallen dramatically in the last decade. I refrain from commenting further on these results until after summarizing other evidence on dropouts in Texas. IDRA Attrition Studies. In the mid-1980s, under a contract with the Texas Department of Community Affairs, the Intercultural Development Research Association (IDRA), undertook a series of studies, one aim of which was to estimate "the magnitude of the dropout problem in the State of Texas" (IDRA, 1986, p. i). After describing the paucity of previous reliable research on dropouts in Texas, the IDRA researchers developed an index of attrition to estimate dropout rates not just statewide, but also at the level of school districts in Texas.
The index developed and used by IDRA consists of taking grade level enrollments for a base year and comparing them to enrollments in subsequent years. Since school and district enrollments are not constant, with changes in size due to increasing or declining enrollments, it is necessary to take the growth trend into account in computing attrition rate. The size change ratio was calculated by dividing the total district enrollment for the longitudinal study end year, by the total district enrollment for the base study year. Multiplying the base year enrollment by the district change ratio produces an estimate of the number of students expected to be enrolled at the end year. (IDRA, 1986, p. 9).
In short, the IDRA attrition index method for estimating dropouts is very similar to the way in
http://epaa.asu.edu/epaa/v8n41/part7.htm (3 of 36)7/30/2004 4:34:52 AM

EPAA Vol. 8 No. 41 Haney: The Myth of the Texas Miracle in Education--Part 7: Other Evidence
which I calculated progress from grade 9 to high school graduation (as reported in Section 5.1 above). The IDRA method differs, however, in two respects from the one used in calculating results presented in Section 5.1. First, instead of simply assuming that the numbers of students in grade nine in a particular year (say 1990-91) in a particular school system represents a reasonable estimate of the numbers expected to graduate three years later (in 1993-94), the IDRA approach adjusts this estimate to take into account the overall growth or decline in enrollments in the system over the time period studied (thus, for example, if overall grade 9-12 enrollment increased 25% between 1990-91 and 1993-94), the IDRA approach assumes that the number enrolled in grade 12 in 1993-94 would be 25% greater than the 1990-91 grade 9 enrollments). Second, the IDRA approach focuses on grade enrollments and has not been applied, at least insofar as I am aware, to the question of how many students actually graduate from Texas high schools at the end of grade 12. The IDRA has regularly updated its attrition calculations since its original study in 1986. Table 7.1 presents the organization's most recent results, showing percent attrition from grades 9 to 12, from 1985-86 to 1998-99 (note that data for 1990-91 are missing).
Table 7.1IDRA Reported Attrition Rates, Grades 9-12 (% Attrition)
Race/Ethnic Group
'85-86
'86-87
'87-88
'88-89
'89-90
'91-92
'92-93
'94-95
'95-96
'96-97
'97-98
'98-99
Black 34% 38% 39% 37% 38% 39% 43% 50% 51% 51% 49% 48%
White 27 26 24 20 19 22 25 30 31 32 31 31
Hispanic 45 46 49 48 48 48 49 51 53 54 53 53
Total 33 34 33 31 31 34 36 40 42 43 42 42
Source: IDRA website, www.idra.org/, accessed 5/8/00 (data for 1990-91 missing)
Comparison of the TEA and IDRA data reveals two broad findings. First, for the academic year 1988-89, their estimates of dropouts are somewhat comparable. For that year, the IDRA reported attrition rates of 37%, 20% and 48% for Black, White and Hispanic students respectively. And if we multiply the TEA-reported annual dropout rates for grades 7-12 by six to approximate a longitudinal dropout rate across this grade span, we get 45.1%, 27.3% and 48.6% for Black, White and Hispanic students respectively. These estimates are not terribly close, but at least they are in the same ballpark. And the differences are in the directions one would expect. The TEA reported data yield slightly higher percentages since they cover grades 7-12, while the IDRA attrition percentages cover just grades 9-12. Second, after 1988-89, the IDRA and TEA results diverge dramatically. The IDRA data show attrition increasing between 1988-89 and 1998-99, while the TEA data show dropouts to be decreasing sharply over the same period. The divergence is so dramatic as to make one wonder whether the two organizations are referring to the same state—or even living on the same planet.
http://epaa.asu.edu/epaa/v8n41/part7.htm (4 of 36)7/30/2004 4:34:52 AM
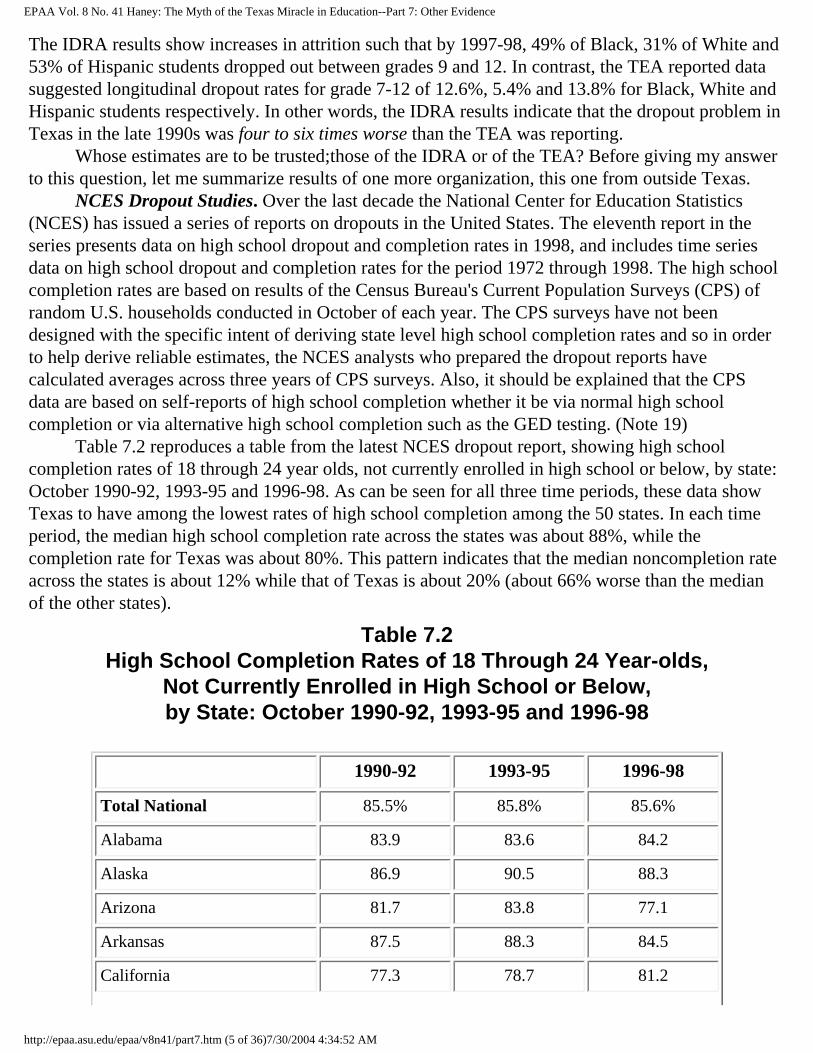
EPAA Vol. 8 No. 41 Haney: The Myth of the Texas Miracle in Education--Part 7: Other Evidence
The IDRA results show increases in attrition such that by 1997-98, 49% of Black, 31% of White and 53% of Hispanic students dropped out between grades 9 and 12. In contrast, the TEA reported data suggested longitudinal dropout rates for grade 7-12 of 12.6%, 5.4% and 13.8% for Black, White and Hispanic students respectively. In other words, the IDRA results indicate that the dropout problem in Texas in the late 1990s was four to six times worse than the TEA was reporting. Whose estimates are to be trusted;those of the IDRA or of the TEA? Before giving my answer to this question, let me summarize results of one more organization, this one from outside Texas. NCES Dropout Studies. Over the last decade the National Center for Education Statistics (NCES) has issued a series of reports on dropouts in the United States. The eleventh report in the series presents data on high school dropout and completion rates in 1998, and includes time series data on high school dropout and completion rates for the period 1972 through 1998. The high school completion rates are based on results of the Census Bureau's Current Population Surveys (CPS) of random U.S. households conducted in October of each year. The CPS surveys have not been designed with the specific intent of deriving state level high school completion rates and so in order to help derive reliable estimates, the NCES analysts who prepared the dropout reports have calculated averages across three years of CPS surveys. Also, it should be explained that the CPS data are based on self-reports of high school completion whether it be via normal high school completion or via alternative high school completion such as the GED testing. (Note 19) Table 7.2 reproduces a table from the latest NCES dropout report, showing high school completion rates of 18 through 24 year olds, not currently enrolled in high school or below, by state: October 1990-92, 1993-95 and 1996-98. As can be seen for all three time periods, these data show Texas to have among the lowest rates of high school completion among the 50 states. In each time period, the median high school completion rate across the states was about 88%, while the completion rate for Texas was about 80%. This pattern indicates that the median noncompletion rate across the states is about 12% while that of Texas is about 20% (about 66% worse than the median of the other states).
Table 7.2High School Completion Rates of 18 Through 24 Year-olds,
Not Currently Enrolled in High School or Below,by State: October 1990-92, 1993-95 and 1996-98
1990-92 1993-95 1996-98
Total National 85.5% 85.8% 85.6%
Alabama 83.9 83.6 84.2
Alaska 86.9 90.5 88.3
Arizona 81.7 83.8 77.1
Arkansas 87.5 88.3 84.5
California 77.3 78.7 81.2
http://epaa.asu.edu/epaa/v8n41/part7.htm (5 of 36)7/30/2004 4:34:52 AM

EPAA Vol. 8 No. 41 Haney: The Myth of the Texas Miracle in Education--Part 7: Other Evidence
Colorado 88.1 88.4 85.5
Connecticut 89.9 94.7 91.6
D.C. 86.2 93.0 88.5
Delaware 84.0 87.7 84.9
Florida 84.1 80.6 83.6
Georgia 85.1 80.3 84.8
Hawaii 93.5 92.0 92.3
Idaho 84.7 86.1 85.8
Illinois 96.0 86.5 86.6
Indiana 87.8 88.5 89.3
Iowa 94.6 93.2 88.0
Kansas 93.2 90.9 91.2
Kentucky 81.1 82.4 85.2
Louisiana 83.9 80.1 81.6
Maine 91.9 92.9 91.6
Maryland 88.6 93.6 94.5
Massachusetts 89.8 92.5 90.6
Michigan 87.2 88.6 91.0
Minnesota 92.5 93.1 90.0
Mississippi 85.4 93.9 82.0
Missouri 88.1 90.4 90.4
Montana 91.6 89.6 91.1
Nebraska 92.5 94.1 91.2
Nevada 82.1 81.9 78.2
New Hampshire 87.9 86.9 89.2
New Jersey 90.8 91.6 91.8
New Mexico 84.1 82.3 78.6
New York 88.0 87.0 84.7
http://epaa.asu.edu/epaa/v8n41/part7.htm (6 of 36)7/30/2004 4:34:52 AM
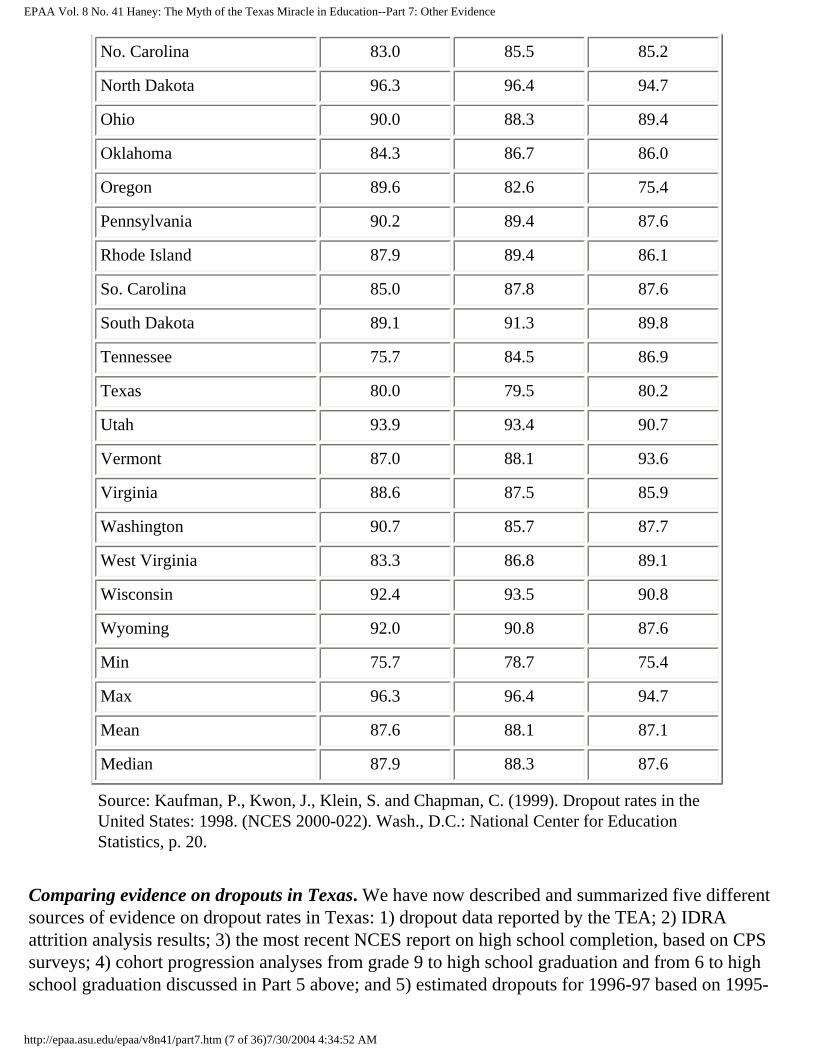
EPAA Vol. 8 No. 41 Haney: The Myth of the Texas Miracle in Education--Part 7: Other Evidence
No. Carolina 83.0 85.5 85.2
North Dakota 96.3 96.4 94.7
Ohio 90.0 88.3 89.4
Oklahoma 84.3 86.7 86.0
Oregon 89.6 82.6 75.4
Pennsylvania 90.2 89.4 87.6
Rhode Island 87.9 89.4 86.1
So. Carolina 85.0 87.8 87.6
South Dakota 89.1 91.3 89.8
Tennessee 75.7 84.5 86.9
Texas 80.0 79.5 80.2
Utah 93.9 93.4 90.7
Vermont 87.0 88.1 93.6
Virginia 88.6 87.5 85.9
Washington 90.7 85.7 87.7
West Virginia 83.3 86.8 89.1
Wisconsin 92.4 93.5 90.8
Wyoming 92.0 90.8 87.6
Min 75.7 78.7 75.4
Max 96.3 96.4 94.7
Mean 87.6 88.1 87.1
Median 87.9 88.3 87.6
Source: Kaufman, P., Kwon, J., Klein, S. and Chapman, C. (1999). Dropout rates in the United States: 1998. (NCES 2000-022). Wash., D.C.: National Center for Education Statistics, p. 20.
Comparing evidence on dropouts in Texas. We have now described and summarized five different sources of evidence on dropout rates in Texas: 1) dropout data reported by the TEA; 2) IDRA attrition analysis results; 3) the most recent NCES report on high school completion, based on CPS surveys; 4) cohort progression analyses from grade 9 to high school graduation and from 6 to high school graduation discussed in Part 5 above; and 5) estimated dropouts for 1996-97 based on 1995-
http://epaa.asu.edu/epaa/v8n41/part7.htm (7 of 36)7/30/2004 4:34:52 AM

EPAA Vol. 8 No. 41 Haney: The Myth of the Texas Miracle in Education--Part 7: Other Evidence
96 grade enrollments and 1996-97 retention rates (reported in Section 5.5 above). How can we make sense of these vastly different estimates of the extent of the dropout problem in Texas, with dropout rate estimates for the late 1990s ranging from a low of 14.7% reported by the TEA as the "1997-98 actual longitudinal dropout rate" for grades 7 through 12, to a high of the 42% attrition rate reported by IRDA, also for 1997-98, but only for grades 9 through 12? First, it seems clear that the TEA-reported dropout rates can be largely discounted, as inaccurate and misleading. A November 1999 report from the Texas House Research Organization, The Dropout Data Debate, recounts that "In 1996, the State Auditor's Office estimated that the 1994 dropout numbers reported by the Texas Education Agency (TEA) likely covered only half of the actual number of dropouts" (p. 1). The report goes on to recount numerous problems in TEA's approach to calculating dropout rates including changing rules over time in how to define dropouts, relying on district reports of dropouts, while at the same time, beginning in 1992-93 using dropout rate as a key factor in TEA's accountability ratings of districts, and apparent fraud in district reporting. The TEA has developed a system for classifying school leavers in dozens of different ways and many types of "leavers" are not counted as dropouts. Indeed, in 1994, the TEA started classifying students who "met all graduation requirements but failed to pass TAAS" as non-dropout "leavers." Second, based on a comparison of the cohort progression analyses from grade 9 to high school graduation with those from 6 to high school graduation, it seems clear that the IRDA attrition analyses may represent somewhat inflated estimates of the extent of dropouts because of the increased rate of retention of students in grade 9 (see Figure 5.3). Still the IDRA approach does have one virtue as compared with cohort progression analyses; namely, it attempts to adjust for net immigration of students into Texas schools. I return to this point later. But first let us compare the other three sources of evidence. The estimates of dropouts for 1996-97 based on 1995-96 grade enrollments and 1996-97 retention rates indicated that about 68,000 high school students dropped out of school between 1995-96 and 1996-97. Adding the missing students across the three grades to estimate longitudinal dropout rates suggests overall dropout rates of 27% across grades 10-12 (22.5% for White, 33.7% for Black and 38.5% for Hispanic students). These estimates correspond relatively well with the grade 6 to high school graduation cohort analyses (results of which were graphed in Figures 5.5 and 5.6). These results showed that of grade 6 students in the cohort class of 1997, 75.8% of White students and 61.1% of Black and Hispanic students graduated in 1997, implying that 24.2% of White and 38.9% of minority students did not graduate and may have dropped out. Overall for the cohort class of 1997, 31% of the students in grade 6 in 1990-91 did not graduate in 1997. (The 27% figure just cited is slightly lower, presumably because it does note take into account students who drop out between fall of grade 12 and high school graduation the following spring). Can these results be reconciled with the most recent NCES report on high school completion, based on CPS surveys? Recall that this report indicated that for 18 through 24 year-olds in Texas (not currently enrolled in high school or below) surveyed in October 1996-98, 80.2% reported completing high school. This implies a non-completion or dropout rate of 19.8%. (The CPS survey samples on which this estimate is based are not large enough to derive separate estimates by ethnic group.) It should be noted first that the CPS surveys of 18-24 year-olds in 1996-1998, do not correspond very precisely with the cohort of students in the Texas class of 1997. Nonetheless, two
http://epaa.asu.edu/epaa/v8n41/part7.htm (8 of 36)7/30/2004 4:34:52 AM
EPAA Vol. 8 No. 41 Haney: The Myth of the Texas Miracle in Education--Part 7: Other Evidence
other factors may explain why the CPS derived non-completion (or dropout) estimate of 19.8% is so much lower than 31% estimate derived above for the class of 1997. One possibility suggested by a previous National Research Council report is that the CPS household surveys tend to under-represent minority youth generally and to underestimate high school dropout rates specifically. In discussing evidence on educational attainment of Black youth, Jaynes and Williams (1989, p. 338) comment that "after age 16, there are very serious, and perhaps growing, problems of surveying the black population, especially black men," and go on to discount a dropout estimate from CPS data from the 1980s for Blacks as simply not credible. If the CPS surveys do in fact under-represent minority youth, this would deflate the overall dropout estimates for Texas derived from this source, since all indications (even those from the TEA) are that dropout rates in Texas are higher for Black and Hispanic youth than for White youth. (Note 20) The other possibility, alluded to previously, is that the CPS surveys are based on self-reports of high school completion whether it be via normal high school completion or via alternative high school completion such as the GED testing. To explore this possibility, I consulted annual Statistical Reports from the GED Testing Service (1990-1998). Before presenting results from this source, it may be useful to explain the GED Testing program briefly. The Tests of General Educational Development were developed during World War II to provide adults who did not complete high school with an opportunity to earn a high school equivalency diploma. There are five GED tests: Writing Skills, Social Studies, Science, Interpreting Literature and the Arts, and Mathematics. States and other jurisdictions that contract to use the GED tests establish their own minimum scores for award of the high school equivalency diploma, with the condition that state minimum requirements cannot be below a floor approved by the Commission on Educational Credit and Credentials (an agency of the American Council on Education). For most of the past 10 years, the approved minimum was that examinees had to attain standard scores of at least 40 on each of the five GED tests or an average standard score of at least 45. "In the United States, this minimum standard of 'Minimum 40 or Mean 45' was met by an estimated 75% of the 1987 high school norm group." (GED Testing Service, 1995, GED 1994 Statistical Report, p. 31). In the early 1990s, four states were using this Commission-approved minimum passing standard on the GED tests for award of the high school equivalency degree: Louisiana, Mississippi, Nebraska, and Texas. An additional 27 states were using a similarly low "Minimum 35 and Mean 45" standard. The GED has been widely used in Texas; and in 1996, Texas became the first state in the nation to issue more than 1,000,000 GED credentials since 1971, when the GED started tracking this statistic" (GED Testing Service, 1997, GED 1996 Statistical Report, p. 27). About this time, in keeping with the national movement to raise educational standards, the GED Testing Service decided to raise the minimum passing score on the GED:
In concert with the secondary schools movement to raise standards, in January 1997 the GED Testing Service raised the minimum score required for passing the tests. The new standard is one that only 67 percent of graduating seniors can meet. (GED Testing Service, 1998, GED 1997 Statistical Report, p. ii). (Note 21) (Source: GED Testing Service, 1990-1999, Statistical Reports, 1989, 1990, 1991, 1992, 1994, 1996, 1997, 1998. Washington, D.C.: American Council on Education.)
http://epaa.asu.edu/epaa/v8n41/part7.htm (9 of 36)7/30/2004 4:34:52 AM

EPAA Vol. 8 No. 41 Haney: The Myth of the Texas Miracle in Education--Part 7: Other Evidence
Given this background, let us now examine the evidence on GED taking in Texas. Figure 7.2 shows the numbers of people taking and passing the GED (complete battery) from 1989 to 1998. As can be seen, the numbers taking the GED in Texas increased steadily between 1989 and 1996, from about 47,000 to 74,000, a increase of 57% (during the same interval the increase in GED taking nationally was about 26%). GED statistics also make it clear that during this interval the Texas GED-taking population was younger than the national GED-taking population. Over this interval from 25% to 30% of GED takers in Texas were reported to be age 18 or less. (Note 22)
The sharp upturn in GED taking in Texas between 1995 and 1996 (from 74,000 to 87,000, a 17.5% increase) seems readily explained by anticipation of the increase in the GED passing score as of January 1, 1997 (nationally there was a 5% increase in GED test taking between 1995 and 1996). As the GED Testing Service GED 1997 Statistical Report explains "The five percent increase in 1996 is most likely attributed to adults attempting to complete the battery before implementation of the 1997 standard" (GED Testing Service, 1998, p. iii). As a result of the new GED Testing Service minimum passing standard for 1997, 36 jurisdictions were required to raise their passing standard in 1997. Texas was one of them. Surely not coincidentally, the number of people taking the GED in Texas in 1997 dropped from 87,000 to 61,000—an almost 30% decrease. Nationally there was a 5% decrease in GED-taking between 1996 and 1997. Among the 36 jurisdictions required to increase their passing scores on the GED between
http://epaa.asu.edu/epaa/v8n41/part7.htm (10 of 36)7/30/2004 4:34:52 AM
EPAA Vol. 8 No. 41 Haney: The Myth of the Texas Miracle in Education--Part 7: Other Evidence
1996 and 1997, "the passing rate decreased by 3.8 percent from 1996 (71.8 percent) to 1997 (68 percent)" (GED Testing Service, 1999, p. 6). In Texas, the GED passing rate fell from 75.2% to 64.2%. This 11% decrease in the passing rate was almost triple the average decrease among the 36 jurisdictions that were required to increase the GED passing scores in 1997. (Note 23) These developments regarding the GED in Texas suggest a clear explanation for why the percentages of the cohort classes of 1997, 1998 and 1999, began to show slight increases in the percentages of students progressing from grade 6 to high school graduation (for minorities from 60% to 65% and for Whites from 75% to 77%, see Figures 5.6 and 5.7). After the requirements for passing the GED in Texas were stiffened in 1997, and the GED pass rate fell sharply, it appears likely that more students in Texas decided to persist in school to graduation instead of seeking the alternative certification via the more difficult GED standard required by the GEDTS as of January 1, 1997. (Note 24) Now we can return to the question that prompted my study of GED data. Can GED credentialling in Texas explain why the CPS derived non-completion (or dropout) estimate of 19.8% is so much lower than the 31% non-graduation rate derived from analyses of progress of the cohort class of 1997 from grade 6 to high school graduation? Before addressing this question let me note that neither GED Testing Service data, nor CPS-reported high school completion data are available at the state level disaggregated by ethnicity, so we will have to address this issue across the three major ethnic groups in Texas, namely, White, Black and Hispanic. In 1990-91, according to TEA statistics there were are total of 256,000 White, Black and Hispanic students enrolled in grade 6 in Texas. Eleven per cent (i.e., the difference between the 20% non-completion rate indicated by CPS results and the 31% non-graduation rate derived from the cohort analyses) equals about 28,000. This number—28,000—appears strikingly smaller than the numbers of people who were taking and passing the GED in Texas in 1996 and 1997 (see Figure 7.2). But it must be recalled that though the Texas population of GED takers is younger than the national population of GED takers, only about 35% of GED test takers in 1997 were age 18 or less. If we assume that 35% of the 40,000 GED test-takers in Texas who passed in 1997 might have been members of the cohort class of 1997 (surely a liberal estimate) we get 14,000. This suggests that while GED-taking may account for a substantial portion of the difference between estimates of non-completion of high school based on our cohort analyses (31%) and from CPS-derived estimates (20%), it may not account for all of the difference. Before summarizing conclusions from this discussion of different sources of evidence on dropout rates in Texas, let me mention briefly two other sources of evidence, and explain why the TEA's exclusion of GED aspirants from its definition of dropouts is misleading. The first additional source of evidence is from the Annie E. Casey Foundation and in particular, the Casey Foundation's 2000 KIDS Count on-line data base. I was alerted to this source by Hauser (1997), who, while pointing out many limitations of CPS data for estimating dropout rates, also mentions that KIDS Count project as using CPS data in an unusual way to try to obtain relatively current evidence on dropouts across the states. Specifically, this project has compiled from CPS data three-year rolling average estimates from 1985 to 1997 of the percentage of teens ages 16-19 who are dropouts and the percentage of teens not attending school and not working. Since the 2000 KIDS Count results are readily available on-line in table, graph and down loadable database form (www.aecf.org/kidscount/kc1999/), I do not discuss them in detail here. Suffice it to say that: 1) according to both indicators of youth welfare, between 1985 and 1997, Texas had one of the poorer records among the states,
http://epaa.asu.edu/epaa/v8n41/part7.htm (11 of 36)7/30/2004 4:34:52 AM

EPAA Vol. 8 No. 41 Haney: The Myth of the Texas Miracle in Education--Part 7: Other Evidence
consistently showing more than 10% of teens ages 16-19 as dropouts and more than 10% of teens not attending school and not working; and 2) if one examines the standing of Texas on these two indicators relative to those of other states, conditions in Texas seemed to have worsened in the early 1990s after implementation of TAAS. Second, in a remarkable research effort for MALDEF in the TAAS case, Mark Fassold assembled longitudinal data sets on the Texas sophomore cohorts of 1994 and 1995 (the classes of 1996 and 1997). Using these data sets, Fassold (1999) was able to calculate the cumulative rates of passing the TAAS exit test for up to ten administrations of the test for which students were eligible before their scheduled graduation. He found that the cumulative pass rates for the classes of 1996 and 1997 were 85.2% and 87.1% for White students, 62.3% and 66.1% for Blacks and 65.9% and 69.4% for Hispanics. These results indicate that the White non-graduation rate was in the range of 13-15%, for Blacks 34-38% and Hispanics 30-34%. Fassold's results correspond reasonably well with the cohort progression analyses presented in Part 5 above—especially when two factors are noted. First, Fassold's analysis excluded students classified as special education students. As we saw in part 5.6 above, some 5 to 7% of students taking the TAAS exit test in recent years have been have been classified as special education. Second it is important to note that Fassold's analysis began with grade 10 enrollments, but we have seen that the largest numbers of students drop out between grade 9 and 10. Before leaving this brief summary of Fassold's analyses, it is worth mentioning that despite criticisms by Texas state attorneys, Judge Prado found Fassold's analyses credible and if anything "likely over-estimated the minority pass rate" (Prado, 2000, p. 16). As mentioned, TEA's reports on dropouts can be largely discounted, as inaccurate and misleading. But one aspect of the TEA approach to defining dropouts deserves commentary. According to the TEA approach to defining dropouts, a student who leaves school to pursue a GED high school equivalency degree in a state approved program is counted as a school "leaver," but not as a dropout. This approach is potentially misleading for a number of reasons. Here I will explain two. First, the common meaning of the term "dropout" is a student who leaves school without graduating from high school. In this sense, students who leave high school without graduating, whether or not they pursue a GED high school equivalency degree, are dropouts. At the same time, there is support for Texas's practice of not counting students enrolled in secondary school programs aimed at preparing for the GED as dropouts in the NCES Common Core of Data definitions (see Winglee et al., 2000, for a recent discussion of the problem of defining dropouts). Nonetheless, recent research suggests that despite the term "high school equivalency degree," obtaining such certification is not equivalent to normal high school graduation and moreover, relatively lax standards for GED certification, as in Texas, can encourage students to drop out of high school before graduation. As Chaplin (1999, p. 2) recounts, "Recent evidence . . . suggests that dropping out to get a GED would be a very costly decision (Cameron and Heckman, 1993; Murnane, Willett, and Tyler, 1998)." He goes on to conclude that "the most reliable evidence generally suggests that obtaining a GED instead of a regular high school degree is likely to result in substantially lower earnings later in life." (Chaplin, 1999, p. 6). (Note 25) Indeed, the earning power of GED recipients appears to be more similar to that of dropouts than to high school graduates. Moreover, Chaplin explains:
GED policies which make it easier to get a GED are designed primarily to help high
http://epaa.asu.edu/epaa/v8n41/part7.htm (12 of 36)7/30/2004 4:34:52 AM

EPAA Vol. 8 No. 41 Haney: The Myth of the Texas Miracle in Education--Part 7: Other Evidence
school dropouts. By doing so, however, they may have the perverse effect of encouraging additional students to drop out. This is because by making it easier to get a GED the policies may increase the expected earnings of high school dropouts and, therefore, increase dropout rates. . . . In general less strict GED policies probably increase dropout rates. (Chaplin, 1999, p. 6).
Chaplin presents evidence bearing on this point nationally, but what seems clear is that this is precisely what has happened in Texas through most of the 1990s. Conclusions regarding dropouts in Texas. It is clear that the TEA has been playing a Texas-sized shell game on the matter of counting dropouts. Every source of evidence other than the TEA (including IDRA, NCES, the Casey Foundation's KIDS Count data, Fassold's analyses and my own) shows Texas as having one of the worst dropout rates among the states. (Recall that even the Texas State Auditor's Office estimated that the 1994 dropout numbers reported by the TEA likely covered only half of the actual number of dropouts.) If we adopt the common sense definition that a dropout is a student who leaves school without graduating from high school, analyses of data on enrollment by year, grade and ethnicity (and numbers of high school graduates each year), tell a reasonably clear story of what has happened in Texas over the last two decades. As shown in Figures 5.5 and 5.6, for the cohort classes of 1982 to 1990, the percentage of Black and Hispanic students who progressed from grade 6 to graduation six years later hovered around 65%. For White students, the corresponding percentage started at about 80% and gradually declined to about 75% in 1990. For the cohort class of 1991, the year TAAS was implemented, the percentages fell dramatically, to 55% for minorities and about 68% for White students. Between 1992 and 1996, the corresponding percentages were 60% for minorities and 75% for Whites. Only after Texas was forced by the GED Testing Service to raise its passing standard for receipt of a so-called high school equivalency degree in 1997, did the percentages persisting from grade 6 to high school graduation begin to creep back up, to 65% for minorities in the class of 1999, and for White students to 78% in the same class. In sum, these results lead me to conclude that since the implementation of the TAAS high school graduation test in 1991, 22-25% of White students and 35-40% of Black and Hispanic students, have not been persisting from grade 6 to regular high school graduation six years later. Overall, during the 1990s the dropout rate in Texas schools was about 30%. As appalling as this result appears, in concluding this discussion of dropout evidence, I should point out that the high school completion and drop out estimates derived from cohort analyses may actually understate the extent of the problem of dropouts (or to use TEA's euphemism, "school-leaving before graduation"). Recall that one of the virtues of the IDRA attrition analyses was that they sought to adjust estimates for net changes in school populations because of student migration. The results of the cohort progression analyses just summarized implicitly assume that between the ages of 12 (grade 6) and 18 (grade 12), there is no net change in the size of the student population in Texas because of immigration (from either other states or countries). If in fact there is a net out-migration, the dropout estimates just summarized may be too high. If there is a net in-migration into Texas, the estimates are low. To check on this possibility, I consulted a recent book on the demography of Texas, The Texas challenge: Population change and the future of Texas by Murdock et al. (1997). I cannot adequately summarize this interesting book here. Suffice it to say simply that these demographers conclude that
http://epaa.asu.edu/epaa/v8n41/part7.htm (13 of 36)7/30/2004 4:34:52 AM

EPAA Vol. 8 No. 41 Haney: The Myth of the Texas Miracle in Education--Part 7: Other Evidence
between 1990 and 1995, migration into the state of Texas from other states and foreign countries increased relative to what it had been in the 1980s (see Chapter 2). They suggest that annual rates of net migration into Texas have been on the order or 1-2% in the 15 years preceding 1995. The authors do not provide direct estimates of the age distribution of immigrants into Texas, but the overall implication of their results is clear. The estimates of the dropout problem in Texas derived from cohort progression analyses are somewhat low because they fail to take into account net in-migration of school age youth into the schools of Texas. (Note 26) But to be absolutely clear (and to avoid getting into semantic arguments about the meaning of the term "dropout"), I readily acknowledge that what the cohort progression analyses show is the extent of the problem in Texas of students failing to persist in school through to high school graduation—regardless whether it is caused by students having to repeat grade 9, failing to pass the exit level version of TAAS, officially "dropping out," opting out of regular high school programs to enter GED preparation classes, or some combination of these circumstances.
7.2 Patterns of Grade Retention in the States
As recounted above, previous research indicates clearly that retention of students in grade, especially beyond the early elementary level, tends to increase the probability that students drop out of high school before graduation. As the recent report from the National Research Council succinctly stated, "In secondary school, grade retention leads to reduced achievement and much higher rates of school dropout" (Heubert & Hauser, 1999, p. 285). For this reason, I sought to analyze rates of grade retention across the states (as reported in Heubert & Hauser, 1999, Table 6.1 corrected) in a variety of ways and to see if there was a relationship between rates of retention at the secondary level and rates of high school completion subsequently reported by Kaufman et al. (1999). In their Table 6.1, Heubert & Hauser (1999) reported rates of grade retention (specifically percentages of students retained in grade) for 26 states and the District of Columbia in selected states for years for which such data were available (most other states do not collect grade retention data at the state level). As Heubert & Hauser (1999, p. 137) themselves observe, "Retention rates are highly variable across the states." For example, first grade retention rates are reported as varying from 20% to only 1 %. Rates of retention in the high school years are reported to vary similarly, from highs of 21-26% to lows of less than 5%. Using the approach described in Section 5.4 above, I have analyzed rates of cumulative promotion and retention. Not surprisingly, cumulative chances of retention also vary widely. For example, in Mississippi and the District of Columbia, in recent years the chance of students being retained in grades 1 through 3 are more than 20%, while in other states (such as Maryland and Arizona) chances are less than 5%. To explore the possible link between retention in grade 9 and high school completion, I merged data from Heubert & Hauser's Table 6.1 with data from the recent NCES Dropouts in the United States 1998 report (Kaufman et al., 1999). The resulting data set is shown in Table 7.3.
Table 7.3Grade 9 Retention and High School Completion in the States
http://epaa.asu.edu/epaa/v8n41/part7.htm (14 of 36)7/30/2004 4:34:52 AM

EPAA Vol. 8 No. 41 Haney: The Myth of the Texas Miracle in Education--Part 7: Other Evidence
State YearGrade 9
Retention RateHigh school completion rate
18-24 year-olds, 1996-98
Alabama 1996-97 12.6% 84.2%
Arizona 1996-97 7.0 77.1
District of Columbia 1996-97 18.7 84.9
Florida 1996-97 14.3 83.6
Georgia 1996-97 13.1 84.8
Kentucky 1995-96 10.7 85.2
Maryland 1996-97 10.3 94.5
Massachusetts 1995-96 6.3 90.6
Michigan 1995-96 4.8 91.0
Mississippi 1996-97 19.7 82.0
New York 1996-97 19.5 84.7
North Carolina 1996-97 15.8 85.2
Ohio 1996-97 11.4 89.4
Tennessee 1996-97 13.4 86.9
Texas 1995-96 17.8 80.2
Vermont 1996-97 4.8 93.6
Virginia 1995-96 13.2 85.9
Wisconsin 1996-97 8.5 90.8
Sources: Heubert & Hauser (1999) Table 6.1; Kaufman et al. (1999), Table 5.
Note that from the first source I took the grade 9 retention rate for 1995-96 or 1996-97, whichever was latest. Note also that the high school completion rates suffer from the problems discussed earlier regarding CPS data as a source of evidence on high school graduation and dropouts. Nonetheless even a casual inspection of these data reveals a clear pattern. States with the higher rates of grade 9 retention tend to have lower rates of high school completion. This pattern can be seen more clearly in Figure 7.3. (Note 27) Interestingly, Texas with a grade 9 retention rate of 17.8% has a slightly lower high school completion rate (80.2%) than we would expect given the overall pattern among the states shown in Figure 7.3--even though, as previously discussed this rate for Texas may well be inflated relative to other states because of the high rate of GED taking in Texas. Obviously, such a correlation between two variables, in this case, higher rates of grade 9 retention associated with lower rates of high
http://epaa.asu.edu/epaa/v8n41/part7.htm (15 of 36)7/30/2004 4:34:53 AM
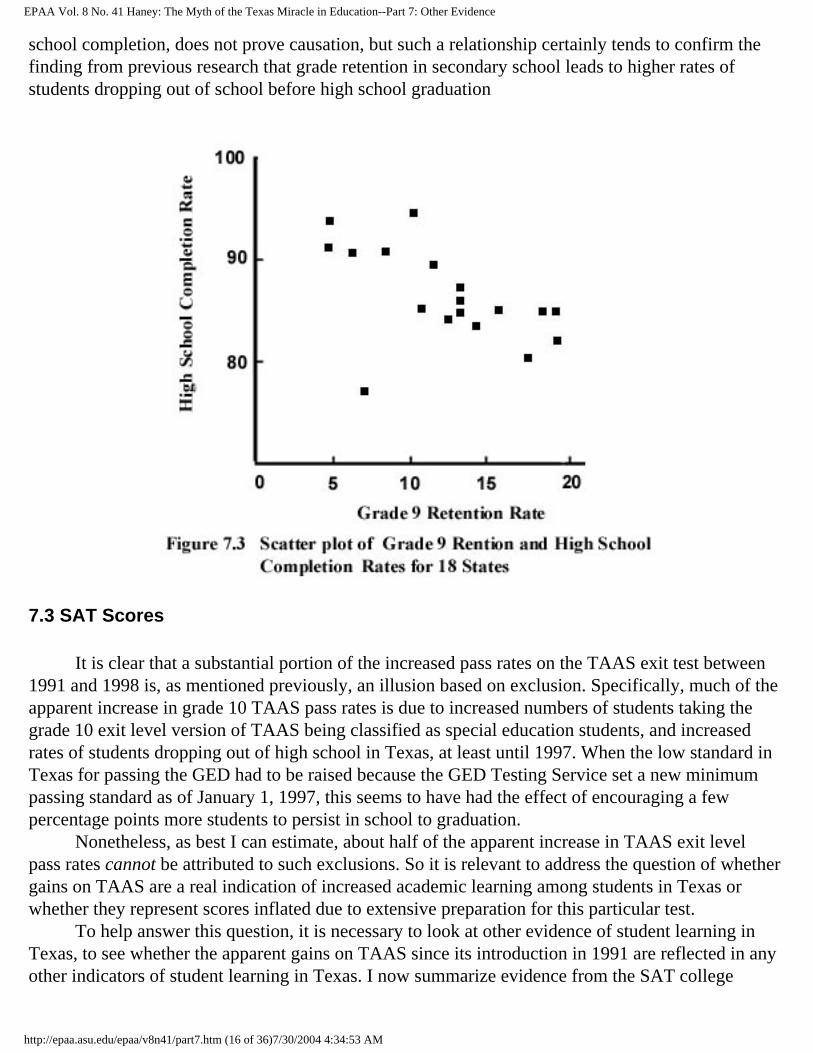
EPAA Vol. 8 No. 41 Haney: The Myth of the Texas Miracle in Education--Part 7: Other Evidence
school completion, does not prove causation, but such a relationship certainly tends to confirm the finding from previous research that grade retention in secondary school leads to higher rates of students dropping out of school before high school graduation
7.3 SAT Scores
It is clear that a substantial portion of the increased pass rates on the TAAS exit test between 1991 and 1998 is, as mentioned previously, an illusion based on exclusion. Specifically, much of the apparent increase in grade 10 TAAS pass rates is due to increased numbers of students taking the grade 10 exit level version of TAAS being classified as special education students, and increased rates of students dropping out of high school in Texas, at least until 1997. When the low standard in Texas for passing the GED had to be raised because the GED Testing Service set a new minimum passing standard as of January 1, 1997, this seems to have had the effect of encouraging a few percentage points more students to persist in school to graduation. Nonetheless, as best I can estimate, about half of the apparent increase in TAAS exit level pass rates cannot be attributed to such exclusions. So it is relevant to address the question of whether gains on TAAS are a real indication of increased academic learning among students in Texas or whether they represent scores inflated due to extensive preparation for this particular test. To help answer this question, it is necessary to look at other evidence of student learning in Texas, to see whether the apparent gains on TAAS since its introduction in 1991 are reflected in any other indicators of student learning in Texas. I now summarize evidence from the SAT college
http://epaa.asu.edu/epaa/v8n41/part7.htm (16 of 36)7/30/2004 4:34:53 AM
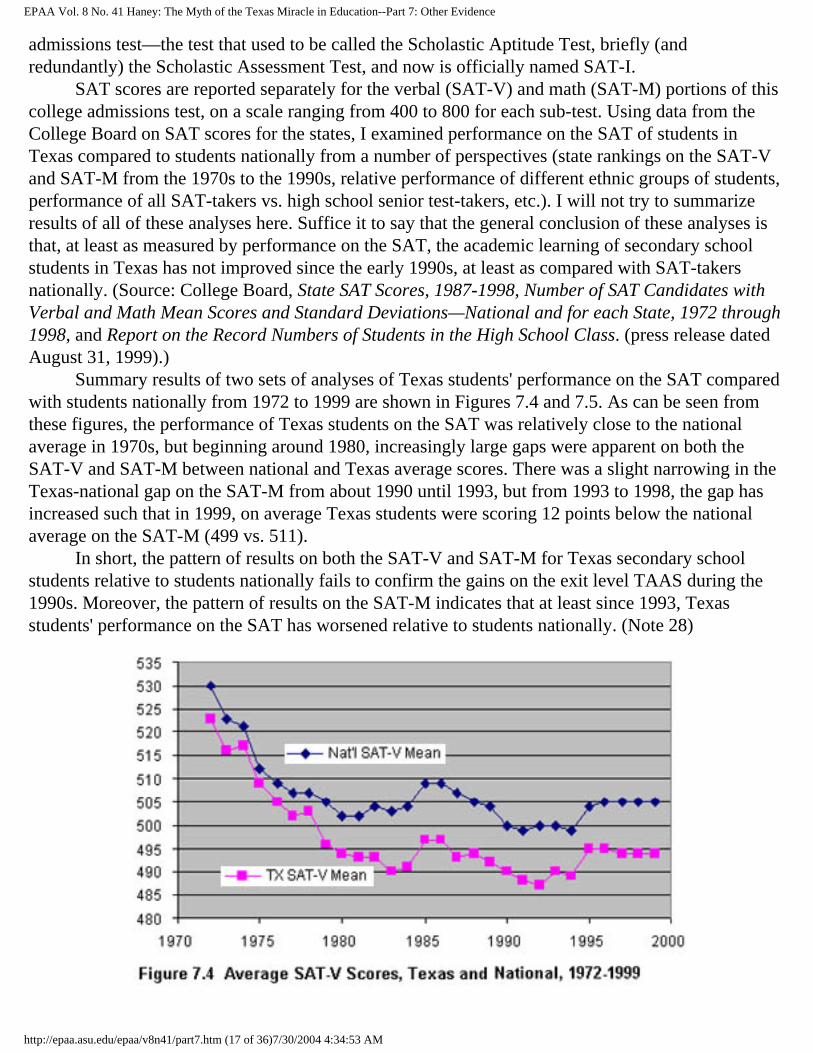
EPAA Vol. 8 No. 41 Haney: The Myth of the Texas Miracle in Education--Part 7: Other Evidence
admissions test—the test that used to be called the Scholastic Aptitude Test, briefly (and redundantly) the Scholastic Assessment Test, and now is officially named SAT-I. SAT scores are reported separately for the verbal (SAT-V) and math (SAT-M) portions of this college admissions test, on a scale ranging from 400 to 800 for each sub-test. Using data from the College Board on SAT scores for the states, I examined performance on the SAT of students in Texas compared to students nationally from a number of perspectives (state rankings on the SAT-V and SAT-M from the 1970s to the 1990s, relative performance of different ethnic groups of students, performance of all SAT-takers vs. high school senior test-takers, etc.). I will not try to summarize results of all of these analyses here. Suffice it to say that the general conclusion of these analyses is that, at least as measured by performance on the SAT, the academic learning of secondary school students in Texas has not improved since the early 1990s, at least as compared with SAT-takers nationally. (Source: College Board, State SAT Scores, 1987-1998, Number of SAT Candidates with Verbal and Math Mean Scores and Standard Deviations—National and for each State, 1972 through 1998, and Report on the Record Numbers of Students in the High School Class. (press release dated August 31, 1999).) Summary results of two sets of analyses of Texas students' performance on the SAT compared with students nationally from 1972 to 1999 are shown in Figures 7.4 and 7.5. As can be seen from these figures, the performance of Texas students on the SAT was relatively close to the national average in 1970s, but beginning around 1980, increasingly large gaps were apparent on both the SAT-V and SAT-M between national and Texas average scores. There was a slight narrowing in the Texas-national gap on the SAT-M from about 1990 until 1993, but from 1993 to 1998, the gap has increased such that in 1999, on average Texas students were scoring 12 points below the national average on the SAT-M (499 vs. 511). In short, the pattern of results on both the SAT-V and SAT-M for Texas secondary school students relative to students nationally fails to confirm the gains on the exit level TAAS during the 1990s. Moreover, the pattern of results on the SAT-M indicates that at least since 1993, Texas students' performance on the SAT has worsened relative to students nationally. (Note 28)
http://epaa.asu.edu/epaa/v8n41/part7.htm (17 of 36)7/30/2004 4:34:53 AM
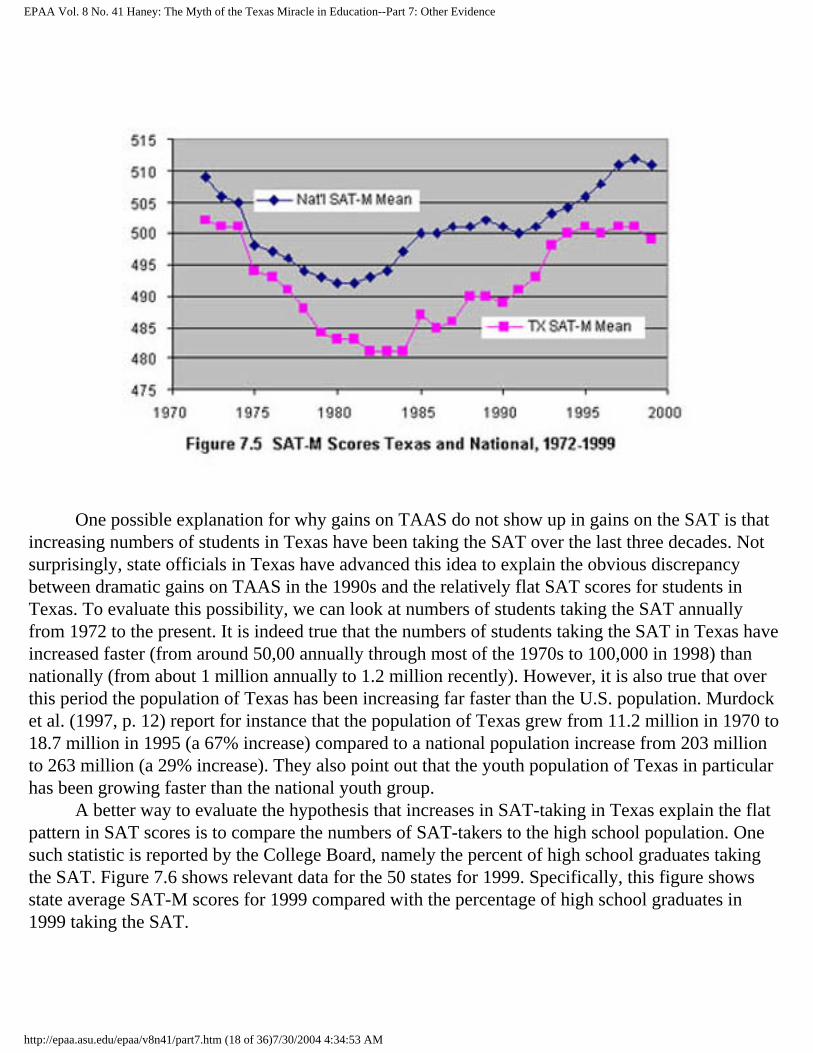
EPAA Vol. 8 No. 41 Haney: The Myth of the Texas Miracle in Education--Part 7: Other Evidence
One possible explanation for why gains on TAAS do not show up in gains on the SAT is that increasing numbers of students in Texas have been taking the SAT over the last three decades. Not surprisingly, state officials in Texas have advanced this idea to explain the obvious discrepancy between dramatic gains on TAAS in the 1990s and the relatively flat SAT scores for students in Texas. To evaluate this possibility, we can look at numbers of students taking the SAT annually from 1972 to the present. It is indeed true that the numbers of students taking the SAT in Texas have increased faster (from around 50,00 annually through most of the 1970s to 100,000 in 1998) than nationally (from about 1 million annually to 1.2 million recently). However, it is also true that over this period the population of Texas has been increasing far faster than the U.S. population. Murdock et al. (1997, p. 12) report for instance that the population of Texas grew from 11.2 million in 1970 to 18.7 million in 1995 (a 67% increase) compared to a national population increase from 203 million to 263 million (a 29% increase). They also point out that the youth population of Texas in particular has been growing faster than the national youth group. A better way to evaluate the hypothesis that increases in SAT-taking in Texas explain the flat pattern in SAT scores is to compare the numbers of SAT-takers to the high school population. One such statistic is reported by the College Board, namely the percent of high school graduates taking the SAT. Figure 7.6 shows relevant data for the 50 states for 1999. Specifically, this figure shows state average SAT-M scores for 1999 compared with the percentage of high school graduates in 1999 taking the SAT.
http://epaa.asu.edu/epaa/v8n41/part7.htm (18 of 36)7/30/2004 4:34:53 AM

EPAA Vol. 8 No. 41 Haney: The Myth of the Texas Miracle in Education--Part 7: Other Evidence
As can be seen in Figure 7.6, there is a clear relationship between these two variables. States with smaller percentages of high school graduates taking the SAT tend to have higher average SAT-M scores. States with larger percentages of high school graduates taking the SAT tend to have lower average SAT-M scores. What about Texas? According to College Board data, in 1999 Texas had 50% of high school graduates taking the SAT, scoring on average 499 on the SAT-M. This means that Texas, according to the pattern shown in Figure 7.6, has a slightly lower SAT-M average than states with comparable percentages of high school graduates taking the SAT. For example, according to the 1999 College Board data, there were seven states that had between 49% and 53% of high school graduates taking the SAT (Alaska, California, Florida, Hawaii, Oregon, Texas and Washington). Among these states Texas had the lowest SAT-M average in 1999 (499), except for Florida (498). Leaving aside Florida, Texas had an SAT-M average 15-25 points below states with comparable percentages of high school graduates taking the SAT. These results clearly indicate that the relatively poor standing of Texas among the states on SAT scores cannot be attributed to the proportion of secondary school students in Texas taking the SAT. Moreover, the College Board data may actually understate the relatively poor performance of Texas students on the SAT. This is because Texas has such a poor record regarding student progress to grade 12 and graduation. Even if we use the very conservative estimates of high school completion derived from CPS data (and reproduced in Table 7.2 above) we see that Texas has a rate of non-completion of high school among young adults of about 20%—more than 5 percentage points above the national rate (and as the discussion in Section 7.1 indicated, this figure surely
http://epaa.asu.edu/epaa/v8n41/part7.htm (19 of 36)7/30/2004 4:34:53 AM
EPAA Vol. 8 No. 41 Haney: The Myth of the Texas Miracle in Education--Part 7: Other Evidence
underestimates the extent of the high school dropout problem in Texas).
7.4 NAEP Scores Revisited
As mentioned in Section 3.4 above, 1996 NAEP mathematics scores were released in 1997 and seemed to provide confirmation that gains apparent on TAAS were not just artificial, but instead represented real gains in student learning. After the NEGP identified Texas and North Carolina as having made unusual progress toward the National Education Goals, many boosters of the Texas miracle story pointed to the NAEP results, as well as TAAS gains, as evidence of substantial educational progress in the Lone Star state. Before revisiting the NAEP evidence, some background on NAEP or the National Assessment of Educational Progress, may be helpful. NAEP began in 1969 as a means of charting progress in student learning using nationally representative samples of schools. Originally begun with foundation funding, NAEP quickly became a program of the U.S. Office of Education and its successor, the U.S. Department of Education. During the 1970s and 1980s, NAEP sought to assess the performance of national samples of students and schools; but beginning in 1990, NAEP undertook assessments aimed at measuring student learning at the state level (between 1990 and 1994, these state assessments were called "trial state assessments.") Since 1990, there have been eight state assessments conducted, as follows:
● 1990 Mathematics, grade 8● 1992 Mathematics, grades 4 and 8● 1992 Reading, grade 4● 1994 Reading, grade 4● 1996 Mathematics, grades 4 and 8● 1996 Science, grade 8● 1998 Reading, grades 4 and 8● 1998 Writing, grade 8
As this listing indicates, NAEP state assessments have focused on measuring the learning of students at particular grade levels, namely grades 4 and 8. This constitutes a little recognized limitation of NAEP, viz., that in focusing on performance of students enrolled in grades 4 and 8, results of NAEP state assessments are inevitably confounded with grade retention differences across the states. This means that in states in which failure and grade repetition are common, students in grades 4 and 8 will be older than students in states where grade retention is less common. Thus, it is probably no accident that the two states identified in 1997 by the NEGP as having made unusual "progress" on NAEP math assessments, Texas and North Carolina, have unusually high rates of failure and grade repetition before grade 4 (see Heubert & Hauser, Table 6-1, corrected). A little history on the current focus of state NAEP on grade level performance is worth noting. When NAEP began, it focused not on grade-level, but on age-level performance, namely the performance of students ages 9, 13 and 17 years. Long-term trend analyses by NAEP continue to focus on performance of students of these ages (see for example, NAEP Facts reports, Volume 3, Nos. 1-4, 1998). However, in an effort to make NAEP results more "policy relevant," most NAEP
http://epaa.asu.edu/epaa/v8n41/part7.htm (20 of 36)7/30/2004 4:34:53 AM

EPAA Vol. 8 No. 41 Haney: The Myth of the Texas Miracle in Education--Part 7: Other Evidence
studies over the last decade, including all of the NAEP state assessments, have focused on grade-level, rather than age. So in examining NAEP evidence regarding Texas, all we have to work with are data on performance of students in grades 4 and 8. Another development in the history of NAEP motivated by the desire for "policy relevance" was the introduction of "achievement levels," that is the description of student performance not just in terms of test score numbers, but with the adjectives, "below basic," "basic," "proficient," and "advanced" attached to particular test score ranges. The introduction into NAEP of these achievement levels seems to have spurred similar developments in state testing programs, for example, in TAAS with student test scores described as "fail" "pass," and "academic recognition." However, even as the interpretation of test results in terms of "achievement levels" (sometimes called performance standards) has become common, many people are unaware of the repeated scientific criticisms that have been leveled at NAEP's use of achievement levels. Here is an extended summary of the controversy over NAEP's "achievement levels" from a 1999 NAEP report:
The Developmental Status of Achievement Levels
The 1994 NAEP reauthorization law requires that the achievement levels be used on a developmental basis until the Commissioner of Education Statistics determines that the achievement levels are "reasonable, valid, and informative to the public." Until that determination is made, the law requires the Commissioner and the Board to make clear the developmental status of the achievement levels in all NAEP reports.
In 1993, the first of several congressionally mandated evaluations of the achievement-level-setting process concluded that the procedures used to set the achievement levels were flawed and that the percentage of students at or above any particular achievement level cut point may be underestimated. Others have critiqued these evaluations, asserting that the weight of the empirical evidence does not support such conclusions.
In response to the evaluations and critiques, NAGB conducted an additional study of the 1992 achievement levels in reading before deciding to use those levels for reporting 1994 NAEP results. When reviewing the findings of this study, the National Academy of Education (NAE) Panel expressed concern about what it saw as a "confirmatory bias" in the study and about the inability of this study to "address the panel's perception that the levels had been set too high."
In 1997, the NAE Panel summarized its concerns with interpreting NAEP results based on the achievement levels as follows: "First, the potential instability of the levels may interfere with the accurate portrayal of trends. Second, the perception that few American students are attaining the higher standards we have set for them may deflect attention to the wrong aspects of education reform. The public has indicated its interest in benchmarking against international standards, yet it is noteworthy that when American students performed very well on a 1991 international reading assessment, these results were discounted because they were contradicted by poor performance against the possibly flawed NAEP reading
http://epaa.asu.edu/epaa/v8n41/part7.htm (21 of 36)7/30/2004 4:34:53 AM
EPAA Vol. 8 No. 41 Haney: The Myth of the Texas Miracle in Education--Part 7: Other Evidence
achievement levels in the following year."
The NAE Panel report recommended "that the current achievement levels be abandoned by the end of the century and replaced by new standards . . . ." The National Center for Education Statistics and the National Assessment Governing Board have sought and continue to seek new and better ways to set performance standards on NAEP. For example, NCES and NAGB jointly sponsored a national conference on standard setting in large-scale assessments, which explored many issues related to standard setting. Although new directions were presented and discussed, a proven alternative to the current process has not yet been identified. The Acting Commissioner of Education Statistics and NAGB continue to call on the research community to assist in finding ways to improve standard setting for reporting NAEP results. The most recent congressionally mandated evaluation conducted by the National Academy of Sciences (NAS) relied on prior studies of achievement levels, rather than carrying out new evaluations, on the grounds that the process has not changed substantially since the initial problems were identified. Instead, the NAS Panel studied the development of the 1996 science achievement levels. The NAS Panel basically concurred with earlier congressionally mandated studies. The Panel concluded that "NAEP's current achievement-level-setting procedures remain fundamentally flawed. The judgment tasks are difficult and confusing; raters' judgments of different item types are internally inconsistent; appropriate validity evidence for the cut scores is lacking; and the process has produced unreasonable results."
The NAS Panel accepted the continuing use of achievement levels in reporting NAEP results only on a developmental basis, until such time as better procedures can be developed. Specifically, the NAS Panel concluded that ". . . tracking changes in the percentages of students performing at or above those cut scores (or in fact, any selected cut scores) can be of use in describing changes in student performance over time." In a recent study, eleven testing experts who provided technical advice for the achievement-level-setting process provided a critical response to the NAS report.
The National Assessment Governing Board urges all who are concerned about student performance levels to recognize that the use of these achievement levels is a developing process and is subject to various interpretations. The Board and the Acting Commissioner of Education Statistics believe that the achievement levels are useful for reporting on trends in the educational achievement of students in the United States. In fact, achievement level results have been used in reports by the President of the United States, the Secretary of Education, state governors, legislators, and members of Congress. The National Education Goals Panel and government leaders in the nation and in more than 40 states use these results in their annual reports.
However, based on the congressionally mandated evaluations so far, the Acting Commissioner agrees with the recommendation of the National Academy of Sciences that caution needs to be exercised in the use of the current achievement levels. Therefore, the Acting Commissioner concludes that these achievement levels should continue to be considered developmental and should continue to be interpreted and used with caution. (Greenwald et al., 1999, pp. 14-16)
http://epaa.asu.edu/epaa/v8n41/part7.htm (22 of 36)7/30/2004 4:34:53 AM

EPAA Vol. 8 No. 41 Haney: The Myth of the Texas Miracle in Education--Part 7: Other Evidence
I have recounted this background regarding NAEP achievement levels to help explain a basic choice one faces in reviewing NAEP evidence regarding Texas, or for that matter any jurisdiction. The choice is whether to review evidence in terms of NAEP "achievement levels" or in terms of the underlying test scores. I have chosen to review NAEP evidence in terms of the underlying test scores for three reasons. First, the doubtful meaning of the NAEP "achievement levels," as evidenced in the passage just quoted renders them suspect. Second, fundamental finding from the applied science of statistics favors the test scores over the achievement levels. Measures of central tendency (such as the average or the mean) are generally a better way of summarizing distributions of numbers, such as test scores, than percentages above some arbitrarily selected level (such as 70% correct on TAAS tests). Third, Jeff Rodamar (2000) has already conducted an excellent study (alas, as yet unpublished) comparing TAAS pass rates with NAEP results for Texas in terms of achievement levels. The astute reader may well have realized that the first two points in the previous paragraph apply to interpretation not just of NAEP results, but also of TAAS results. Consequently, before reviewing NAEP results for Texas, let us revisit TAAS results. Instead of summarizing TAAS results in terms of percent passing the arbitrarily established passing scores on TAAS tests, as was done in parts II and III above, this time we review TAAS results in terms of average or mean scores. Before doing so, a brief explanation of the scaling of the TAAS test results is necessary. In 1994, the TEA and its testing contractors introduced a new scale for reporting TAAS reading and math test scores. They called it the Texas Learning Index or TLI. The TLI is a "T-score" type of scale described in the 1996-97 Texas Student Assessment Program Technical Digest as follows:
The TLI is very much like the T-score previously described. Unlike the T-score, however, the TLI is anchored at the exit level passing standard, rather than at the mean of the distribution. To distinguish between the [Rasch] scale score system and the TLI, TEA chose a two-digit metric for the TLI so that it anchored at the exit level passing standard with a value of 70 and a standard deviation of 15. (TEA, the 1996-97 Texas Student Assessment Program Technical Digest, p. 34)
Via norm-referenced comparisons and similar score transformations, separate TLI scales were developed for most TAAS tests given in grades 3 through 9. In other words, the TLI grade level scale does not represent a "vertical scale" allowing direct measurement of student growth from one grade to another. Interestingly, the Technical Digest gives the following as a reason for not trying to develop a vertical scale for interpreting TAAS results: "a vertical scale implies a linear and well-defined curriculum from Grades 3 through exit, when such a well-ordered curriculum may not be in place" (p. 33). So for most TAAS tests, there is a relevant TLI scale, such as 4-TLI for grade 4 and x-TLI for the grade 10 or exit level TAAS tests. The exception to this general pattern of using TLI scales to report TAAS results is for the TAAS writing tests. The TAAS writing tests for grades 4, 8 and exit level consist of 40-multiple choice questions and a written composition that is scored "holistically" on a scale of 1, 2, 3 and 4. The score on the written composition is multiplied by 7 and added to the
http://epaa.asu.edu/epaa/v8n41/part7.htm (23 of 36)7/30/2004 4:34:53 AM
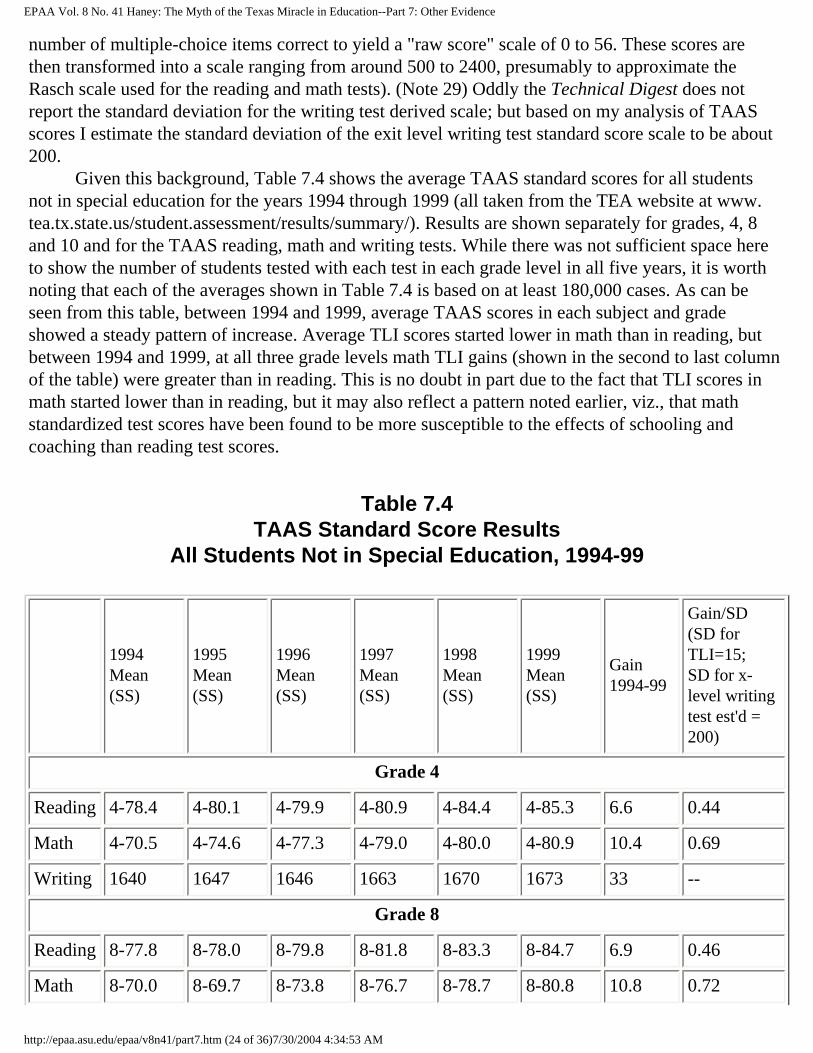
EPAA Vol. 8 No. 41 Haney: The Myth of the Texas Miracle in Education--Part 7: Other Evidence
number of multiple-choice items correct to yield a "raw score" scale of 0 to 56. These scores are then transformed into a scale ranging from around 500 to 2400, presumably to approximate the Rasch scale used for the reading and math tests). (Note 29) Oddly the Technical Digest does not report the standard deviation for the writing test derived scale; but based on my analysis of TAAS scores I estimate the standard deviation of the exit level writing test standard score scale to be about 200. Given this background, Table 7.4 shows the average TAAS standard scores for all students not in special education for the years 1994 through 1999 (all taken from the TEA website at www.tea.tx.state.us/student.assessment/results/summary/). Results are shown separately for grades, 4, 8 and 10 and for the TAAS reading, math and writing tests. While there was not sufficient space here to show the number of students tested with each test in each grade level in all five years, it is worth noting that each of the averages shown in Table 7.4 is based on at least 180,000 cases. As can be seen from this table, between 1994 and 1999, average TAAS scores in each subject and grade showed a steady pattern of increase. Average TLI scores started lower in math than in reading, but between 1994 and 1999, at all three grade levels math TLI gains (shown in the second to last column of the table) were greater than in reading. This is no doubt in part due to the fact that TLI scores in math started lower than in reading, but it may also reflect a pattern noted earlier, viz., that math standardized test scores have been found to be more susceptible to the effects of schooling and coaching than reading test scores.
Table 7.4 TAAS Standard Score Results
All Students Not in Special Education, 1994-99
1994 Mean (SS)
1995 Mean (SS)
1996 Mean (SS)
1997 Mean (SS)
1998 Mean (SS)
1999 Mean (SS)
Gain 1994-99
Gain/SD (SD for TLI=15;SD for x-level writing test est'd = 200)
Grade 4
Reading 4-78.4 4-80.1 4-79.9 4-80.9 4-84.4 4-85.3 6.6 0.44
Math 4-70.5 4-74.6 4-77.3 4-79.0 4-80.0 4-80.9 10.4 0.69
Writing 1640 1647 1646 1663 1670 1673 33 --
Grade 8
Reading 8-77.8 8-78.0 8-79.8 8-81.8 8-83.3 8-84.7 6.9 0.46
Math 8-70.0 8-69.7 8-73.8 8-76.7 8-78.7 8-80.8 10.8 0.72
http://epaa.asu.edu/epaa/v8n41/part7.htm (24 of 36)7/30/2004 4:34:53 AM
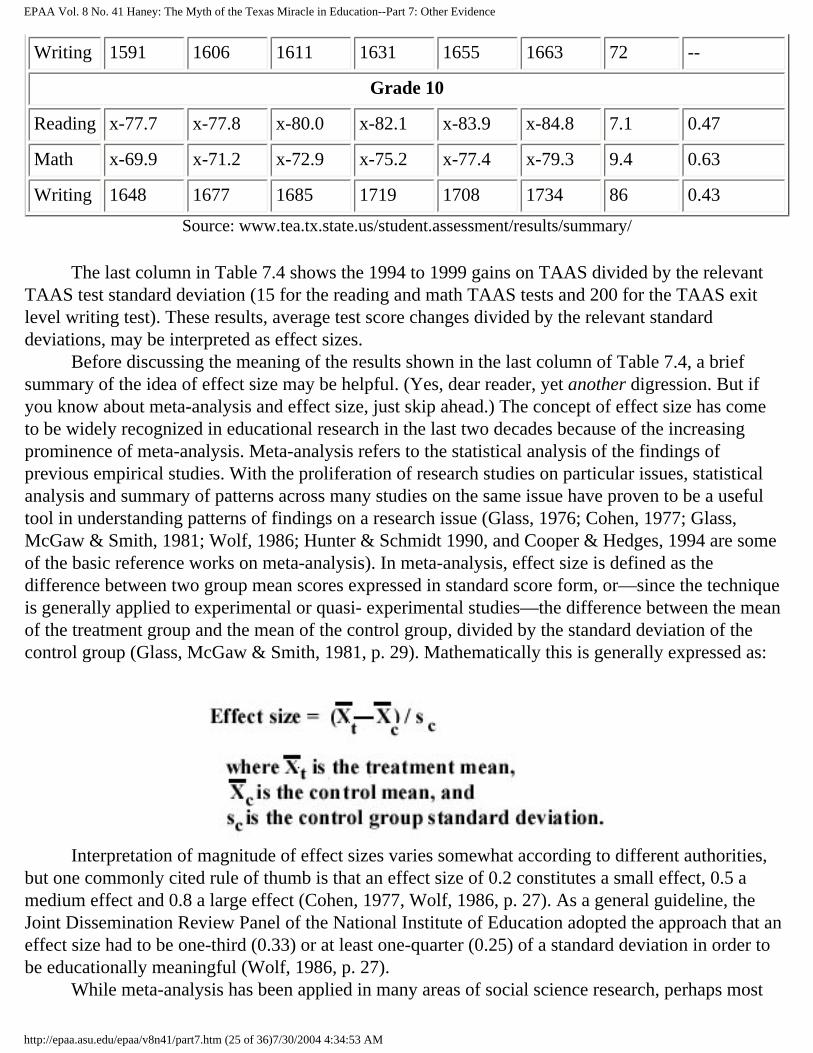
EPAA Vol. 8 No. 41 Haney: The Myth of the Texas Miracle in Education--Part 7: Other Evidence
Writing 1591 1606 1611 1631 1655 1663 72 --
Grade 10
Reading x-77.7 x-77.8 x-80.0 x-82.1 x-83.9 x-84.8 7.1 0.47
Math x-69.9 x-71.2 x-72.9 x-75.2 x-77.4 x-79.3 9.4 0.63
Writing 1648 1677 1685 1719 1708 1734 86 0.43
Source: www.tea.tx.state.us/student.assessment/results/summary/
The last column in Table 7.4 shows the 1994 to 1999 gains on TAAS divided by the relevant TAAS test standard deviation (15 for the reading and math TAAS tests and 200 for the TAAS exit level writing test). These results, average test score changes divided by the relevant standard deviations, may be interpreted as effect sizes. Before discussing the meaning of the results shown in the last column of Table 7.4, a brief summary of the idea of effect size may be helpful. (Yes, dear reader, yet another digression. But if you know about meta-analysis and effect size, just skip ahead.) The concept of effect size has come to be widely recognized in educational research in the last two decades because of the increasing prominence of meta-analysis. Meta-analysis refers to the statistical analysis of the findings of previous empirical studies. With the proliferation of research studies on particular issues, statistical analysis and summary of patterns across many studies on the same issue have proven to be a useful tool in understanding patterns of findings on a research issue (Glass, 1976; Cohen, 1977; Glass, McGaw & Smith, 1981; Wolf, 1986; Hunter & Schmidt 1990, and Cooper & Hedges, 1994 are some of the basic reference works on meta-analysis). In meta-analysis, effect size is defined as the difference between two group mean scores expressed in standard score form, or—since the technique is generally applied to experimental or quasi- experimental studies—the difference between the mean of the treatment group and the mean of the control group, divided by the standard deviation of the control group (Glass, McGaw & Smith, 1981, p. 29). Mathematically this is generally expressed as:
Interpretation of magnitude of effect sizes varies somewhat according to different authorities, but one commonly cited rule of thumb is that an effect size of 0.2 constitutes a small effect, 0.5 a medium effect and 0.8 a large effect (Cohen, 1977, Wolf, 1986, p. 27). As a general guideline, the Joint Dissemination Review Panel of the National Institute of Education adopted the approach that an effect size had to be one-third (0.33) or at least one-quarter (0.25) of a standard deviation in order to be educationally meaningful (Wolf, 1986, p. 27). While meta-analysis has been applied in many areas of social science research, perhaps most
http://epaa.asu.edu/epaa/v8n41/part7.htm (25 of 36)7/30/2004 4:34:53 AM
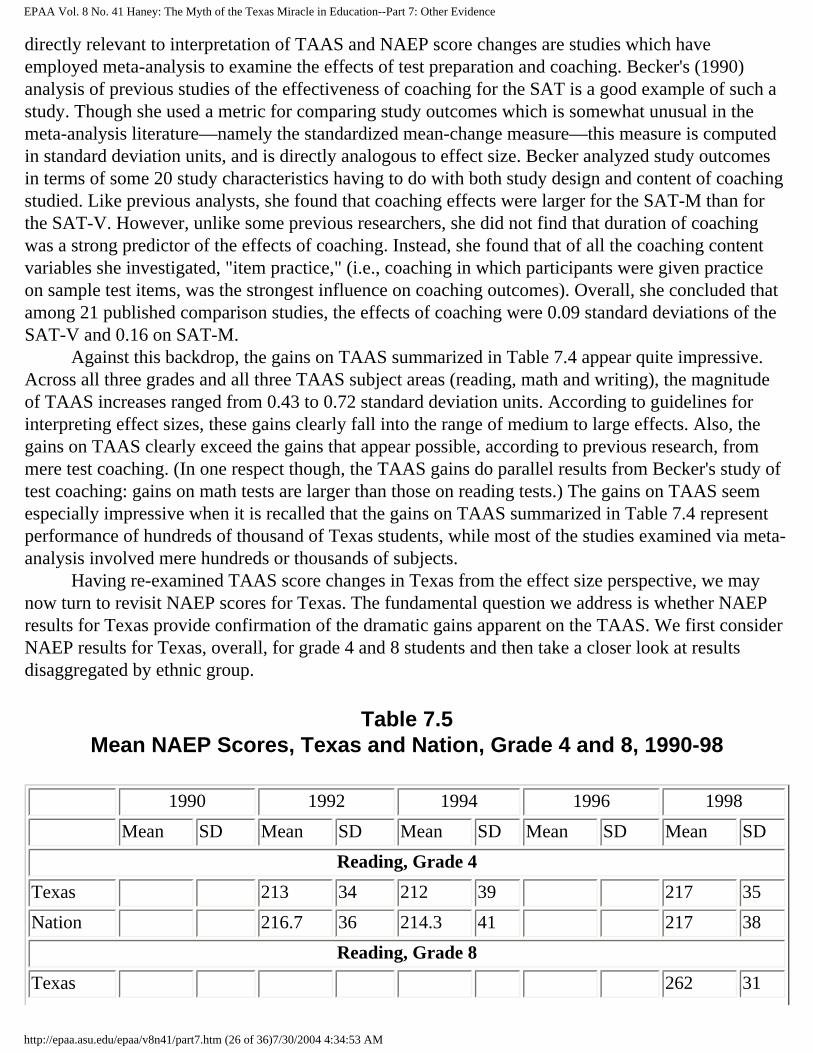
EPAA Vol. 8 No. 41 Haney: The Myth of the Texas Miracle in Education--Part 7: Other Evidence
directly relevant to interpretation of TAAS and NAEP score changes are studies which have employed meta-analysis to examine the effects of test preparation and coaching. Becker's (1990) analysis of previous studies of the effectiveness of coaching for the SAT is a good example of such a study. Though she used a metric for comparing study outcomes which is somewhat unusual in the meta-analysis literature—namely the standardized mean-change measure—this measure is computed in standard deviation units, and is directly analogous to effect size. Becker analyzed study outcomes in terms of some 20 study characteristics having to do with both study design and content of coaching studied. Like previous analysts, she found that coaching effects were larger for the SAT-M than for the SAT-V. However, unlike some previous researchers, she did not find that duration of coaching was a strong predictor of the effects of coaching. Instead, she found that of all the coaching content variables she investigated, "item practice," (i.e., coaching in which participants were given practice on sample test items, was the strongest influence on coaching outcomes). Overall, she concluded that among 21 published comparison studies, the effects of coaching were 0.09 standard deviations of the SAT-V and 0.16 on SAT-M. Against this backdrop, the gains on TAAS summarized in Table 7.4 appear quite impressive. Across all three grades and all three TAAS subject areas (reading, math and writing), the magnitude of TAAS increases ranged from 0.43 to 0.72 standard deviation units. According to guidelines for interpreting effect sizes, these gains clearly fall into the range of medium to large effects. Also, the gains on TAAS clearly exceed the gains that appear possible, according to previous research, from mere test coaching. (In one respect though, the TAAS gains do parallel results from Becker's study of test coaching: gains on math tests are larger than those on reading tests.) The gains on TAAS seem especially impressive when it is recalled that the gains on TAAS summarized in Table 7.4 represent performance of hundreds of thousand of Texas students, while most of the studies examined via meta-analysis involved mere hundreds or thousands of subjects. Having re-examined TAAS score changes in Texas from the effect size perspective, we may now turn to revisit NAEP scores for Texas. The fundamental question we address is whether NAEP results for Texas provide confirmation of the dramatic gains apparent on the TAAS. We first consider NAEP results for Texas, overall, for grade 4 and 8 students and then take a closer look at results disaggregated by ethnic group.
Table 7.5Mean NAEP Scores, Texas and Nation, Grade 4 and 8, 1990-98
1990 1992 1994 1996 1998
Mean SD Mean SD Mean SD Mean SD Mean SD
Reading, Grade 4
Texas 213 34 212 39 217 35
Nation 216.7 36 214.3 41 217 38
Reading, Grade 8
Texas 262 31
http://epaa.asu.edu/epaa/v8n41/part7.htm (26 of 36)7/30/2004 4:34:53 AM
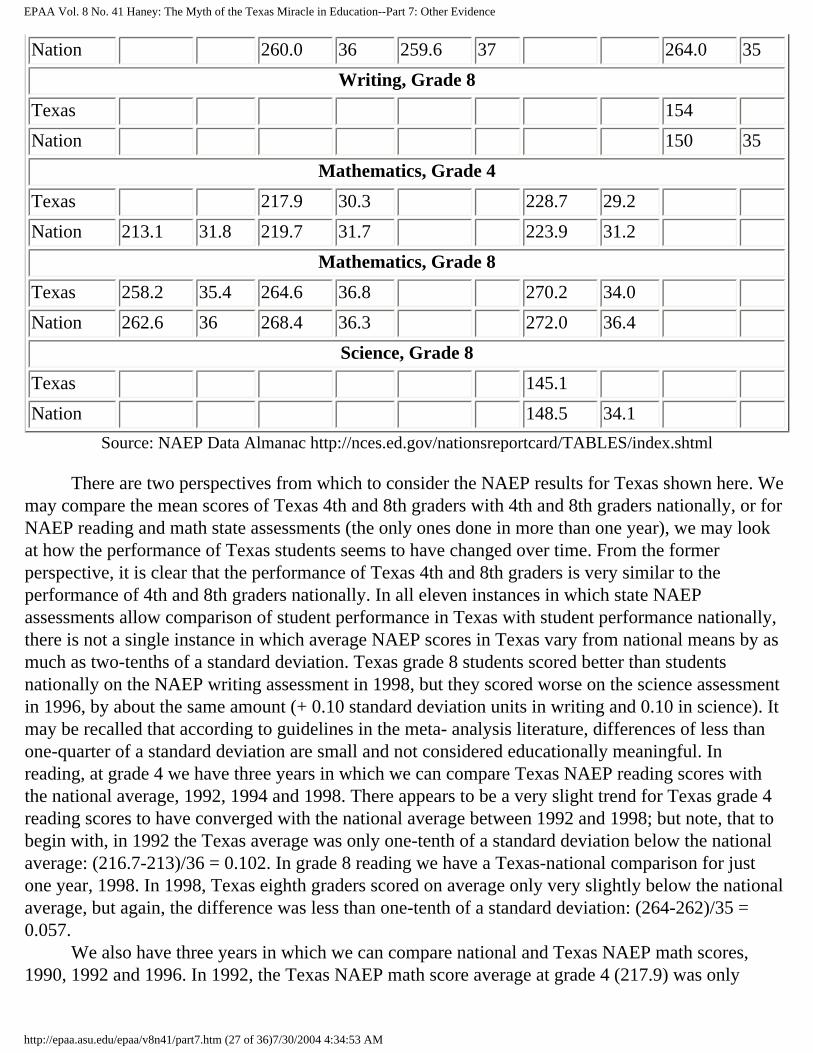
EPAA Vol. 8 No. 41 Haney: The Myth of the Texas Miracle in Education--Part 7: Other Evidence
Nation 260.0 36 259.6 37 264.0 35
Writing, Grade 8
Texas 154
Nation 150 35
Mathematics, Grade 4
Texas 217.9 30.3 228.7 29.2
Nation 213.1 31.8 219.7 31.7 223.9 31.2
Mathematics, Grade 8
Texas 258.2 35.4 264.6 36.8 270.2 34.0
Nation 262.6 36 268.4 36.3 272.0 36.4
Science, Grade 8
Texas 145.1
Nation 148.5 34.1
Source: NAEP Data Almanac http://nces.ed.gov/nationsreportcard/TABLES/index.shtml
There are two perspectives from which to consider the NAEP results for Texas shown here. We may compare the mean scores of Texas 4th and 8th graders with 4th and 8th graders nationally, or for NAEP reading and math state assessments (the only ones done in more than one year), we may look at how the performance of Texas students seems to have changed over time. From the former perspective, it is clear that the performance of Texas 4th and 8th graders is very similar to the performance of 4th and 8th graders nationally. In all eleven instances in which state NAEP assessments allow comparison of student performance in Texas with student performance nationally, there is not a single instance in which average NAEP scores in Texas vary from national means by as much as two-tenths of a standard deviation. Texas grade 8 students scored better than students nationally on the NAEP writing assessment in 1998, but they scored worse on the science assessment in 1996, by about the same amount (+ 0.10 standard deviation units in writing and 0.10 in science). It may be recalled that according to guidelines in the meta- analysis literature, differences of less than one-quarter of a standard deviation are small and not considered educationally meaningful. In reading, at grade 4 we have three years in which we can compare Texas NAEP reading scores with the national average, 1992, 1994 and 1998. There appears to be a very slight trend for Texas grade 4 reading scores to have converged with the national average between 1992 and 1998; but note, that to begin with, in 1992 the Texas average was only one-tenth of a standard deviation below the national average: (216.7-213)/36 = 0.102. In grade 8 reading we have a Texas-national comparison for just one year, 1998. In 1998, Texas eighth graders scored on average only very slightly below the national average, but again, the difference was less than one-tenth of a standard deviation: (264-262)/35 = 0.057. We also have three years in which we can compare national and Texas NAEP math scores, 1990, 1992 and 1996. In 1992, the Texas NAEP math score average at grade 4 (217.9) was only
http://epaa.asu.edu/epaa/v8n41/part7.htm (27 of 36)7/30/2004 4:34:53 AM

EPAA Vol. 8 No. 41 Haney: The Myth of the Texas Miracle in Education--Part 7: Other Evidence
slightly below the national average (219.7), but by 1996, it was slightly above the national average, by an amount equivalent to about 15% of a standard deviation: (228.7-223.8)/31.2= 0.154. For 1990, 1992 and 1996, the Texas NAEP math grade 8 average was slightly below the national average by amounts equivalent to 12%, 10% and 5% of the national standard deviation. Now, let us put aside national NAEP results and simply consider the gains apparent in state NAEP results for Texas. Between 1994 and 1998, the Texas NAEP reading average increased from 212 to 217, an amount equivalent to 12% of the 1994 national standard deviation (5/41 = 0.122). At grade 8, the Texas NAEP math average increased 12 points between 1990 and 1996, an amount equivalent to 33% of a standard deviation (12/36 = 0.33). According to the guidelines cited earlier from the meta-analysis literature, this is an amount that qualifies as a small, but educationally meaningful difference. More germane to the question whether TAAS gains are real is consideration of the magnitude of the gains apparent on TAAS (shown in Table 7.4 above) and those apparent on state NAEP results (shown in Table 7.5). In general, the gains on TAAS, between 1994 and 1999 (in the range of 0.43 to 0.72 standard deviation units) are far larger than the range of gains apparent on NAEP (in the range of 0.12 to 0.33). Unfortunately, there is only one pair of years in which we have results from state NAEP and TAAS for the same subject, namely reading. Between 1994 and 1998, the average grade 4 TLI increased from 78.4 to 84.4, equivalent to 0.40 standard deviations. Between 1994 and 1998, the average grade 4 Texas NAEP score increased from 212 to 217, equivalent to 0.12 standard deviations (5/41 =0.122, and even if we divide by the Texas standard deviation, we get just 5/39 = 0.128). Even before we look beneath the surface of NAEP averages for Texas, these results, with gains on NAEP far less than half the size of gains apparent on TAAS (and in the single instance when a direct comparison was possible, NAEP gains of 0.12 were just 30% the size of the 0.40 gain apparent on grade 4 TAAS), suggest clearly that the bulk (at least two-thirds) of the dramatic gains on TAAS are simply not real. Next, let us delve below the surface of the Texas state NAEP averages and consider the Texas NAEP reading and math averages separately for White, Black and Hispanic students. Table 7.6 shows relevant results for state NAEP reading and math tests.
Table 7.6Texas Mean NAEP Scores by Ethnicity
Grade 4 and 8, 1992, 1994 and 1998
1990 1992 1994 1996 1998
Reading, Grade 4
White 224 227 232
Black 200 191 197
Hispanic 201 198 204
Reading, Grade 8
http://epaa.asu.edu/epaa/v8n41/part7.htm (28 of 36)7/30/2004 4:34:53 AM
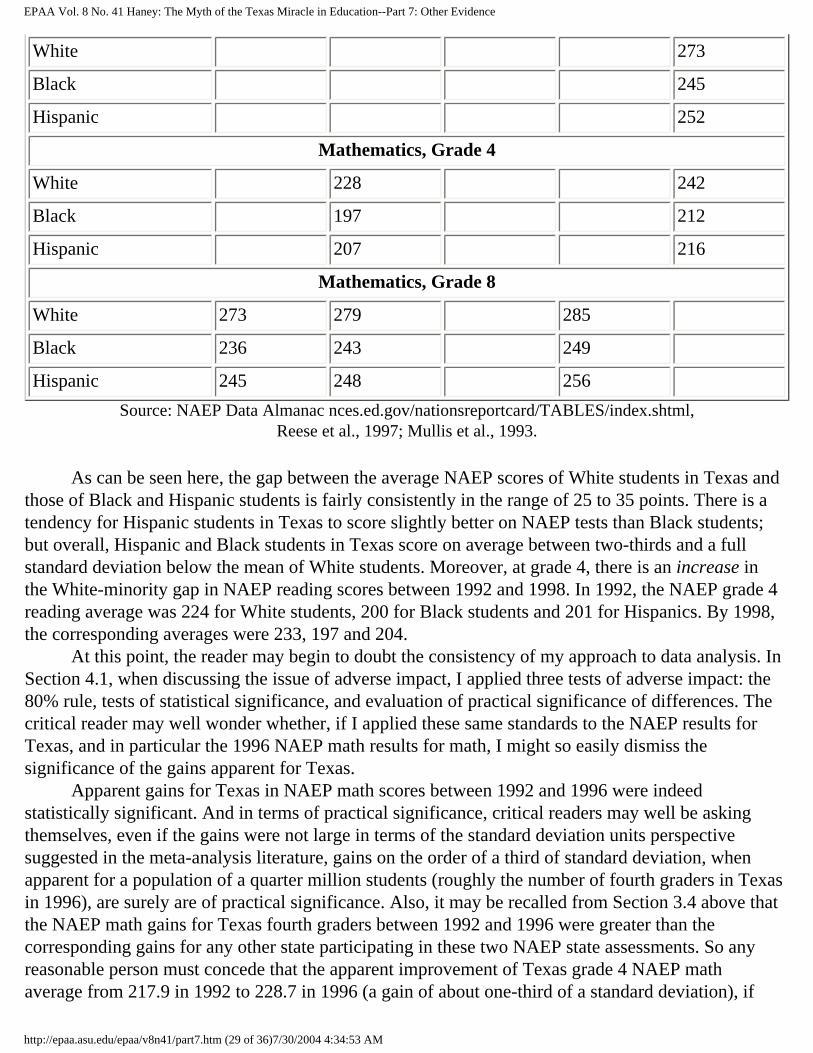
EPAA Vol. 8 No. 41 Haney: The Myth of the Texas Miracle in Education--Part 7: Other Evidence
White 273
Black 245
Hispanic 252
Mathematics, Grade 4
White 228 242
Black 197 212
Hispanic 207 216
Mathematics, Grade 8
White 273 279 285
Black 236 243 249
Hispanic 245 248 256
Source: NAEP Data Almanac nces.ed.gov/nationsreportcard/TABLES/index.shtml, Reese et al., 1997; Mullis et al., 1993.
As can be seen here, the gap between the average NAEP scores of White students in Texas and those of Black and Hispanic students is fairly consistently in the range of 25 to 35 points. There is a tendency for Hispanic students in Texas to score slightly better on NAEP tests than Black students; but overall, Hispanic and Black students in Texas score on average between two-thirds and a full standard deviation below the mean of White students. Moreover, at grade 4, there is an increase in the White-minority gap in NAEP reading scores between 1992 and 1998. In 1992, the NAEP grade 4 reading average was 224 for White students, 200 for Black students and 201 for Hispanics. By 1998, the corresponding averages were 233, 197 and 204. At this point, the reader may begin to doubt the consistency of my approach to data analysis. In Section 4.1, when discussing the issue of adverse impact, I applied three tests of adverse impact: the 80% rule, tests of statistical significance, and evaluation of practical significance of differences. The critical reader may well wonder whether, if I applied these same standards to the NAEP results for Texas, and in particular the 1996 NAEP math results for math, I might so easily dismiss the significance of the gains apparent for Texas. Apparent gains for Texas in NAEP math scores between 1992 and 1996 were indeed statistically significant. And in terms of practical significance, critical readers may well be asking themselves, even if the gains were not large in terms of the standard deviation units perspective suggested in the meta-analysis literature, gains on the order of a third of standard deviation, when apparent for a population of a quarter million students (roughly the number of fourth graders in Texas in 1996), are surely are of practical significance. Also, it may be recalled from Section 3.4 above that the NAEP math gains for Texas fourth graders between 1992 and 1996 were greater than the corresponding gains for any other state participating in these two NAEP state assessments. So any reasonable person must concede that the apparent improvement of Texas grade 4 NAEP math average from 217.9 in 1992 to 228.7 in 1996 (a gain of about one-third of a standard deviation), if
http://epaa.asu.edu/epaa/v8n41/part7.htm (29 of 36)7/30/2004 4:34:53 AM

EPAA Vol. 8 No. 41 Haney: The Myth of the Texas Miracle in Education--Part 7: Other Evidence
real, is indeed a noteworthy and educationally significant accomplishment. But there is that "if." The other perspective not yet brought to bear in considering changes in NAEP test score averages is advice offered in Part 1. When considering average test scores, it is always helpful to pay attention to who is and is not tested. NAEP seeks to estimate the level of learning of students in the states not by testing all students in the states in a particular grade, but through use of systematic and representative sample of schools and students. Without getting into details of NAEP sampling, let us focus here on the fact that not all students sampled are actually tested. Some students selected for NAEP testing are excluded because they are limited English proficient (LEP) or because of their status as special education students, whose individualized education plans (IEPs) may call for them to be excluded from standardized testing. NAEP researchers have long recognized that exclusion of sampled students from NAEP testing has the potential to create bias in NAEP results. Here is how one NAEP report discussed the issue:
The interpretation of comparisons of achievement between two or more assessments depends on the comparability of the populations assessed at each point in time. For example, even if the proficiency distribution of the entire population at time 2 was unchanged from that at time 1, an increase in the rate of exclusion would produce an apparent gain in the reported proficiencies between the two time points if the excluded students tend to be lower performers. (Mullis et al., 1993, p. 353).
Because excluding sampled students from NAEP testing has the potential for skewing results, over time NAEP has developed detailed guidelines for excluding students from testing, and has taken special steps to try to include LEP and special education students in NAEP testing, for example, by allowing accommodations to standard NAEP testing procedures to meet the needs of special education students. (See Reese et al., 1997, Chapter 4 for a discussion of efforts to make NAEP math assessments more inclusive.)
Table 7.7Percentages of IEP and LEP Students
Excluded from NAEP State Math Assessments, Texas and Nation
Mathematics, Grade 4 1990 1992 1996
Texas 8% 11%
Nation 8% 6%
Mathematics, Grade 8
Texas 7% 7% 8%
Nation 6% 7% 5%
http://epaa.asu.edu/epaa/v8n41/part7.htm (30 of 36)7/30/2004 4:34:53 AM
EPAA Vol. 8 No. 41 Haney: The Myth of the Texas Miracle in Education--Part 7: Other Evidence
Source: Reese et al., 1997, pp. 91, 93; Mullis et al., 1993, pp. 324-25
Given this background, let us now consider the percentages of students sampled in state NAEP math assessments who were excluded from testing. Table 7.7 shows the percentages of sampled students excluded from testing in NAEP state math assessments in 1990, 1992 and 1996 for both Texas and the nation; recall that in the original trial state NAEP assessment in 1990 only grade 8 was tested. As can be seen in this table, at the national level, between 1992 and 1996, the percentages of students excluded fell slightly (from 8% to 6% at grade 4, and from 7% to 5% at grade 8). These results at the national level were presumably a result of efforts to make NAEP more inclusive in testing LEP and special education students. However, in Texas, the percentages of students excluded from testing increased at both grade levels: from 8% to 11% at grade 4, and from 7% to 8% at grade 8. This means that some portion of the increased NAEP math averages for Texas in 1996 are illusory, resulting from the increased rates of exclusion of LEP and special students in Texas from NAEP testing. The gaps in rates of exclusion between Texas and the nation in 1996 also mean that comparisons of Texas with national averages in that year will be skewed in favor of Texas for the simple reason that more students in Texas were excluded from testing. In short, as with TAAS results, some portion of the apparent gains on NAEP math tests in Texas in the 1990s is an illusion arising from exclusion. As with TAAS gains, can we estimate what portion of the apparent NAEP gains are real and what portion are artifactual attributable to the increased rates of exclusion of Texas students from NAEP testing? Fortunately, regarding NAEP we have a clear model for estimating the impact of exclusion on NAEP scores. In NAEP 1992 Mathematics Report card for the Nation and the States, Mullis et al. (1993, pp. 352-355) discuss the problem of excluding students from NAEP testing and apply a model for estimating the effects of exclusion on distributions of NAEP scores. What these researchers did was to recompute national NAEP results based on the assumption that "all excluded and all absent students, had they been assessed, would have scored below the 25th percentile of all students" (Mullis et al.,1993, pp. 353). Using this approach, we can recompute the NAEP math averages for Texas in 1996, assuming that the percentages of Texas students excluded from NAEP testing were at the national average (6% at grade 4 and 5% at grade 8, as opposed to the observed 11% and 8% exclusions reported for Texas in 1996.). The NAEP data almanac reports that on the 1996 NAEP math assessments, the scores equivalent to the 10th percentile in Texas were 190.4 and 225.5 for grade 4 and 8, respectively. Using these figures, assuming that the 1996 exclusion rates in Texas were the same as the national rates (and that excluded students in Texas would have scored at the 10th percentile), we may recompute the average grade 4 and grade 8 NAEP math scores for Texas as follows:
Grade 4: 0.95(228.7) + 0.05(190.4) = 226.9
Grade 8: 0.97(270.2) + 0.03(225.5) = 268.9
These results indicate that on the order of 20%-25% of the NAEP gains for Texas between 1992 and 1996 were due simply to the high rate of exclusion of students from NAEP testing in 1996. In other words, given these calculations to adjust for the high rates of exclusion of Texas students
http://epaa.asu.edu/epaa/v8n41/part7.htm (31 of 36)7/30/2004 4:34:53 AM
EPAA Vol. 8 No. 41 Haney: The Myth of the Texas Miracle in Education--Part 7: Other Evidence
from NAEP testing in 1996, the gain of scores in Texas from 1992 to 1996 would be 9 points at grade 4 and 4.3 points at grade 8. The former is still considerably above the national increase of 4 points at grade 4, but no longer highest among the states (North Carolina showed a grade 4 NAEP math gain of 11 points between 1992 and 1996, while excluding just 7% of grade 4 students from testing in 1996). And the gain of 4.3 points at grade 8 would leave Texas very near the level of the national gain apparent between 1992 and 1996. In summary, review of results of NAEP from the 1990s suggests that grade 4 and grade 8 students in Texas performed much like students nationally. On some NAEP assessments, Texas students scored above the national average, and on some below. In the two subject areas in which state NAEP assessments were conducted more than once during the 1990s, there is evidence of modest progress by students in Texas; but it is much like the progress evident for students nationally. Reviewing NAEP results for Texas by ethnic group, we see a more mixed picture. In many comparisons, Black and Hispanic students show about the same gain in NAEP scores as White students, but the 1998 NAEP reading results, suggest that while White grade 4 reading scores in Texas have improved since 1992, those of Black and Hispanic students have not. More generally, however, the magnitudes of the gains apparent on NAEP for Texas fail to confirm the dramatic gains apparent on TAAS. Gains on NAEP in Texas are consistently much less than half the size (in standard deviation units) of Texas gains on state NAEP assessments. These results indicates that the dramatic gains on TAAS during the 1990s are more illusory than real. The Texas "miracle" is more myth than real. Before leaving this review of state NAEP results for Texas, it may be helpful to mention Rodamar's (2000) excellent review once more. As mentioned previously, he reviewed TAAS and NAEP results for Texas not in terms of changes measured in standard deviation units, but in terms of percent passing TAAS and percent meeting the NAEP "basic" proficiency standard. While he focused on reading and math test scores (i.e., he did not review NAEP science and writing results), Rodamar reached conclusions very similar to those derived from reviewing NAEP results in terms of effect size changes:
When it comes to educational achievement, by nearly any measure except TAAS, Texas looks a lot like America. Texas was near the national average on many measures of educational performance when TAAS was introduced—and remains there. (Rodamar, 2000, p. 27).
7.5 Other Evidence
TAAS scores, graduation rates, SAT scores, and evidence from NAEP are the most obvious sources of evidence regarding education in Texas. But I have also searched for other evidence that might be available. For example, in its annual review of the "state of the states," Education Week has assembled a wide range of data on a number of dimensions of education in the states (Jerald, 2000). Since this source is widely available, I will not review it in detail. But three findings are worth mentioning. First, Texas received a grade of D in the category of Improving Teacher Quality. Second, the Lone Star state received only middling marks on dimensions of School Climate (C) , Resource Adequacy (C+), and Equity (C). Finally, I was struck by the relatively low rate of going to college in
http://epaa.asu.edu/epaa/v8n41/part7.htm (32 of 36)7/30/2004 4:34:53 AM

EPAA Vol. 8 No. 41 Haney: The Myth of the Texas Miracle in Education--Part 7: Other Evidence
Texas. In Texas, in 1996, only 54 % of high school graduates were reported to be enrolling in a two- or four-year college, as compared with 65% nationally (Jerald, 2000, p. 71). (Note 30) This led me to inquire further into another Texas testing program—the Texas Academic Skills Program of TASP test. The Texas Higher Education Coordinating Board describes the TASP testing program thus at its website (www.thecb.state.tx.us/):
You Ready for College?Are you are ready for college courses? Not sure?
Texas, you can find out if you have the reading, writing, and math skills you need to do college-level work through the Texas Academic Skills Program—or TASP. The TASP Test, which is part of the TASP program, is required—it is not optional.
Beginning in fall 1998, you must take the TASP Test, or an alternative test, before beginning classes at a public community college, public technical college, or public university in Texas.
TASP Test is not an admissions test, however. You cannot be denied admission to a public institution of higher education based on your TASP Test score. If you need to improve your skills, you are not alone. About one-half of students entering college need some help. Take the TASP Test while you are in high school so you can identify the skills you need to improve. You'll be confident that you are ready for college.
What have been the results of this "college readiness" testing program? I found the graph reproduced in Figure7.7 in a report available on the same website.
http://epaa.asu.edu/epaa/v8n41/part7.htm (33 of 36)7/30/2004 4:34:53 AM
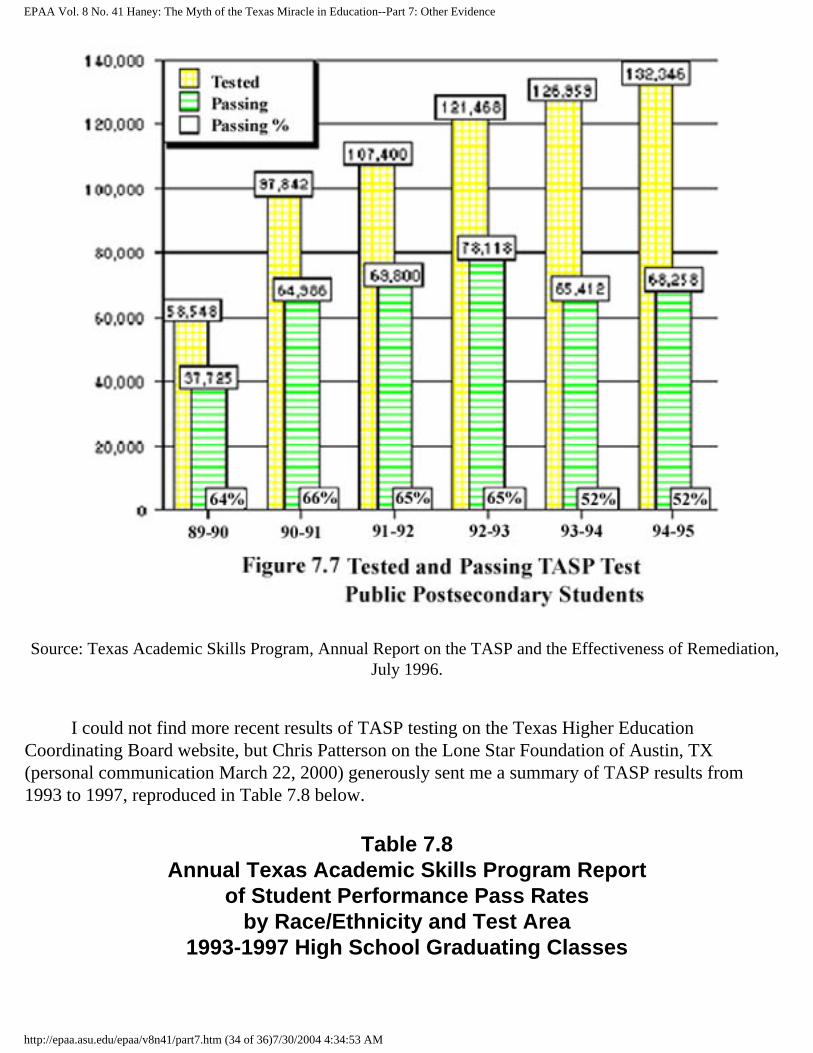
EPAA Vol. 8 No. 41 Haney: The Myth of the Texas Miracle in Education--Part 7: Other Evidence
Source: Texas Academic Skills Program, Annual Report on the TASP and the Effectiveness of Remediation, July 1996.
I could not find more recent results of TASP testing on the Texas Higher Education Coordinating Board website, but Chris Patterson on the Lone Star Foundation of Austin, TX (personal communication March 22, 2000) generously sent me a summary of TASP results from 1993 to 1997, reproduced in Table 7.8 below.
Table 7.8Annual Texas Academic Skills Program Report
of Student Performance Pass Ratesby Race/Ethnicity and Test Area
1993-1997 High School Graduating Classes
http://epaa.asu.edu/epaa/v8n41/part7.htm (34 of 36)7/30/2004 4:34:53 AM

EPAA Vol. 8 No. 41 Haney: The Myth of the Texas Miracle in Education--Part 7: Other Evidence
YearTotalCount
All 3 PartsPass Rate
ReadingPass Rate
MathPass Rate
WritingPass Rate
All Groups
1993 64,662 78.0% 90.3% 86.0% 90.3%
1994 63,257 65.2% 83.2% 79.3% 82.5%
1995 73,207 51.7% 75.3% 64.3% 80.8%
1996 68,810 48.1% 74.4% 60.6% 80.0%
1997 67,833 43.3% 70.7% 55.9% 79.3%
Native American
1993 107 83.2% 92.5% 89.7% 90.7%
1994 108 64.8% 82.4% 84.3% 81.5%
1995 161 52.8% 77.0% 66.5% 89.4%
1996 136 57.5% 79.4% 69.1% 84.6%
1997 130 42.3% 64.6% 65.4% 82.3%
Asian
1993 2,424 79.5% 90.5% 95.7% 84.8%
1994 2,625 63.0% 78.6% 92.5% 69.3%
1995 3,168 53.9% 69.7% 85.2% 66.9%
1996 2,608 49.2% 68.9% 80.8% 66.2%
1997 2,392 48.5% 66.1% 78.6% 68.7%
Black
1993 5,678 57.7% 79.8% 69.0% 79.6%
1994 5,859 44.2% 70.9% 60.3% 69.3%
1995 7,015 31.2% 60.8% 43.4% 69.3%
1996 7,008 29.7% 61.1% 41.2% 69.5%
1997 7,867 24.9% 56.9% 35.9% 68.2%
Hispanic
http://epaa.asu.edu/epaa/v8n41/part7.htm (35 of 36)7/30/2004 4:34:53 AM

EPAA Vol. 8 No. 41 Haney: The Myth of the Texas Miracle in Education--Part 7: Other Evidence
1993 14,349 67.6% 84.2% 79.6% 85.1%
1994 15,075 52.9% 75.9% 70.9% 75.3%
1995 18,121 37.9% 65.4% 53.2% 72.2%
1996 17,926 34.8% 65.1% 49.1% 71.4%
1997 19,166 30.9% 62.3% 45.0% 70.9%
White
1993 42,104 84.2% 93.7% 89.9% 93.9%
1994 39,590 73.1% 88.2% 84.5% 87.9%
1995 44,742 60.3% 82.0% 70.7% 87.1%
1996 41,132 57.0% 81.1% 67.6% 86.4%
1997 38,278 53.0% 78.1% 64.0% 86.4%
Source: Texas Higher Education Coordinating BoardNote: These results reflect pass rates on the initial attempt on the TASP test only.
Reviewing these results from TASP testing, and comparing them with results of TAAS testing (see Figure 3.1 for example), the conclusion seems inescapable that something is seriously amiss in the Texas system of education, the TAAS testing program or the TASP testing program—or perhaps all three. Between 1994 and 1997, TAAS results showed a 20% increase in the percentage of students passing all three exit level TAAS tests (reading, writing and math). But during the same interval, TASP results showed a sharp decrease (from 65.2% to 43.3%) in the percentage of students passing all three parts (reading, math, and writing) of the TASP college readiness test.
0: Home | 1: Intro. | 2: History | 3: The Myth | 4: TAAS | 5: Missing Students 6: Teachers | 7: Other Evidence | 8: Summary | Notes & Ref. | Appendix
http://epaa.asu.edu/epaa/v8n41/part7.htm (36 of 36)7/30/2004 4:34:53 AM

EPAA Vol. 8 No. 41 Haney: The Myth of the Texas Miracle in Education--Part 8: Summary and Lessons Learned
Education Policy Analysis Archives
Volume 8 Number 41 The Texas Miracle in Education Walt Haney
8. Summary and Lessons from the Myth Deflated
Before recapping the territory covered in this article and suggesting some of the broader lessons that might be gleaned from the myth of the Texas miracle in education, I pause for one more digression (readers who have made it this far likely will not be too surprised by yet another detour). The detour is to recount a small survey of scholars undertaken in the summer of 1999. After this side excursion, I summarize "the myth of the Texas miracle." Finally, in closing, I suggest some of the broader lessons that might be gleaned from this examination of the illusory Texas miracle.
8.1 The "Two Questions Survey" on School Reform
In August 1999, as I was preparing for the start of the TAAS trial in September, I re-read a number of key documents regarding the development of the TAAS testing program in Texas. One was the Minutes of the Texas State Board of Education in July 1990 (a full copy of these minutes is reproduced in appendix 8 of this article for ease of reference). It may be recalled that it was at this meeting that the Board set the passing scores on TAAS. When reviewing minutes of this meeting, I was struck by the following passage:
Commissioner [of Education in Texas] Kirby reiterated some of the information presented to Committee of the Whole during the Thursday, July 12, 1990, work session on the TAAS, noting the recommendations of the staff regarding this item. Mr. Davis asked for the rationale for the two-year phase in rather than going immediately to the 70% [passing score on TAAS] or a one-year phase in. The commissioner stated that this would give the board an opportunity to clearly set that 70% is the standard--to state the expectation and expect the schools to present the skills to the students and help the students develop those skills so that this is not an unreasonable expectation. Dr. Kirby said that since this is a different, more difficult test, the needed phase- in time is suggested at least until the results of the fall administration are known. Mr. Davis expressed concern that the test does not appear to be indicative of what is being presented in the classroom. Commissioner Kirby replied that the test is an accurate measurement of what students should be learning, but the test is moving much further in the areas of problem solving, higher order thinking skills, making inferences, and drawing conclusions. He said that it is not believed that at this point in time every student has been adequately prepared in those skills, because with the Texas Educational Assessment of Minimum Skills (TEAMS) tests, emphasis has been placed on the basic skills. The commissioner noted that the test drives the
http://epaa.asu.edu/epaa/v8n41/part8.htm (1 of 10)7/30/2004 4:37:00 AM
EPAA Vol. 8 No. 41 Haney: The Myth of the Texas Miracle in Education--Part 8: Summary and Lessons Learned
curriculum and that it will require a year or two to make that kind of adjustment in the focus of the curriculum. (TEA, 1997, Appendix 9 of the Texas Student Assessment Program Technical Digest for the Academic Year 1996-1997, pp. 337 – 354)
My reaction to this record was that it is, shall we say, slightly implausible to suppose that simply changing from the basic skills TEAMS test to the more challenging TAAS test would lead to statewide changes in teaching in Texas such that within "a year or two" teachers would be focusing not simply on "basic skills" but on "problem solving, higher order thinking skills, making inferences, and drawing conclusions." To test my own reaction against the views of a broader sample of school reform observers, I undertook a "two questions survey of school reform." So, on Monday, August 16, 1999, I sent a survey via electronic mail to sixteen people, whom I respected as knowledgeable students of school reform initiatives around the country. On August 21, I resent the query to an additional 11 people whose names had been suggested by respondents to my first query. As of September 6, 1999, I had received 10 responses to my questions. Though I do not know what typical response rates are to email surveys of this sort (odd questions posed to busy people in late summer, with no explanation as to their possible import), my own view is that a response rate of 37% (10/27=0.3704) is probably not too bad. Here is the full text of the email survey, including the two questions posed:
Colleagues: I would like to ask the favor of asking you to answer two questions. Given your professional expertise, I trust the questions will be of some interest. Also, your answers may be of some import. For now, I will not explain the exact reason for my questions, as I would not want it to influence your answers. Imagine a very large school system that has been focusing on basic skills instruction for some years. The focus has been spurred in part by a high stakes test of basic skills. It is assumed that 80-90% of teachers have been covering the basic skills in their instruction. In light of current educational reform ideas, the system decides that it needs to move beyond basic skills teaching to focus in the future on problem solving, higher order thinking skills, making inferences and drawing conclusions. In light of this situation, and your expertise in studying school reform, my two questions to you are these:
1. How long would it likely take for this large school system to shift from having 80-90% of teachers teaching basic skills, to having 80-90% of teachers teaching the more advanced skills?
2. What would be the key ingredients required to make such a shift in instruction possible in the time you envision in your answer to the first question?
Please keep your answers brief and email them to me by August 30. In exchange for your kindness in responding to my request, I will compile answers, distribute them to whomever responds, and explain the specific reason that motivates the questions.
http://epaa.asu.edu/epaa/v8n41/part8.htm (2 of 10)7/30/2004 4:37:00 AM

EPAA Vol. 8 No. 41 Haney: The Myth of the Texas Miracle in Education--Part 8: Summary and Lessons Learned
The ten scholars who responded to the survey were (in alphabetical order): David K. Cohen, Jane David, Daniel Koretz, Henry Levin, Hayes Mizell, Fred Newmann, Stan Pogrow, Ted Sizer, Adam Stoll, and Anne Wheelock. Before summarizing what they said in response to the survey, two prefatory points should be added. First, all of these correspondents have generously allowed me to reproduce the full text of their survey responses (see Appendix 9). Second, despite the generosity of these people in responding so quickly (all within three weeks at the end of summer 1999), we did not even attempt to use the survey results in the TAAS trial in September. Inasmuch as lawyers for the State of Texas were already trying to exclude from the trial evidence they had known about for months, Mr. Kauffman advised me that that they might not entirely welcome new evidence from a survey they had not even heard about before the trial began. As mentioned, all ten responses are reproduced in their entirety in Appendix 9. Here I simply summarize three overall patterns in the ten responses. Gentle Chiding. Half of the respondents (Cohen, Koretz, Pogrow, Stoll and Wheelock) chided me gently for advancing something of a false dichotomy between "basic skills" and advanced or "higher order thinking" skills. I can only plead mea culpa, but given the background to the survey explained above, I trust that my oversimplification may be forgiven. Shifting the course of large educational systems takes years. The first question asked "How long would it likely take for this large school system to shift from having 80-90% of teachers teaching basic skills, to having 80-90% of teachers teaching the more advanced skills?" Though all respondents qualified their answers in one way or another, all did provide some sort of time estimate. In brief these were: Cohen, 10 years; David, 10 to 20 years; Koretz, 3 to 4 years; Levin, 2 to 5 years; Mizell, 7 to 8 years; Newmann, At least six years; Pogrow, 2 to 4 years; Sizer, At least 5 years; Stoll, At least 20 years; Wheelock, 10 to 15 years. Two things strike me about these responses. First is the remarkable variance in responses; from "2 to 4 years" to "at least 20 years" (and even if we throw out these outliers, variance remains nearly as great). This suggests that even among scholars who have studied such matters, we really do not know very much about long it takes to shift the course of large educational enterprises. Second is that the median value seems to fall somewhere in the range of 5 to 10 years. This is of course far longer than the 1 to 2 years presumed by Commissioner Kirby in Texas in 1990. Huge resources required. The second survey question was:"What would be the key ingredients required to make such a shift in instruction possible in the time you envision in your answer to the first question?" Answers to this question were generally far longer than answers to the first question, but in general indicated that a large quantity and range of resources would be needed to change the course of a large educational enterprise, including professional development opportunities for teachers, leadership, community outreach, lower pupil/teacher ratios, more instructional resources, better social services for students, and reform of teacher education institutions. Jane David's summary answer was "massive teacher re-education and powerful recruitment strategies." Henry Levin's answer suggested that significant change in instruction could come about in two to five years, given the following ingredients:
continuous staff development, continuous support and technical assistance, administrative encouragement, intrinsic and extrinsic incentives, public information on
http://epaa.asu.edu/epaa/v8n41/part8.htm (3 of 10)7/30/2004 4:37:00 AM

EPAA Vol. 8 No. 41 Haney: The Myth of the Texas Miracle in Education--Part 8: Summary and Lessons Learned
results, and a culture of commitment. Add to this transformation of local teacher training programs, careful selection of new teachers, and a strong public relations campaign, and things will move. Every administrator will have to become a cheerleader.
He then added "The problem is that no district has ever been able to achieve these conditions. Further, this will be competing with basic skills testing that is often high stakes and high visibility promoted by the states." Adam Stoll wrote, in part:
It's immensely hard to get a critical mass of teachers within a school, let alone a district, to significantly change their practice. I would think getting a majority to exhibit practice that is highly supportive of advanced skill acquisition would be very optimistic, but possibly attainable under optimal circumstances. I can only imagine having 80-90 % of teachers place a lot of emphasis on "teaching the more advanced skills" if some pretty sweeping changes occurred. I think it would take at least 20 years for these changes to begin affecting practice on this scale.
These extracts are really an inadequate summary of the observations offered by survey respondents, so I encourage readers to review their observations, reproduced in full in Appendix 9. Nonetheless, it is clear that very few of the ingredients suggested as needed for large-scale educational reform were provided in Texas in the early 1990s. This suggests why the purported "miracle" of educational reform in Texas is not only largely illusory, but indeed has had widespread negative consequences for both students and educators in the Lone Star state. After recapping the myth of the Texas miracle, I will suggest that this is a lesson from which we should learn. Myopic accountability schemes based on high stakes testing likely will have similarly perverse consequences elsewhere if we do not learn from the unfortunate story of Texas education in the last decade of the 20th century.
8.2 Recapping the Myth
Since the territory covered in this article is extensive, let me try to sum up the journey so far. After an introduction (pointing out among other things that this writer may not be viewed by all as a totally unbiased observer of education in Texas), I summarized the recent history of education and statewide testing in Texas, which led to introduction of the Texas Assessment of Academic Skills (TAAS) in 1990-91. Since then TAAS testing has been the linchpin of educational accountability in Texas, not just for students, but also for educators and schools. Part 3 recounted how a variety of evidence in the late 1990s led a number of observers to conclude that the state of Texas had made near miraculous educational progress on a number of fronts. Between 1994 and 1998, the percentage of students passing the three grade 10 TAAS tests had grown from 52% to more than 70%. Also, the racial gap in TAAS results seemed to have narrowed.
http://epaa.asu.edu/epaa/v8n41/part8.htm (4 of 10)7/30/2004 4:37:00 AM

EPAA Vol. 8 No. 41 Haney: The Myth of the Texas Miracle in Education--Part 8: Summary and Lessons Learned
Statistics from the Texas Education Agency showed that over the same interval dropout rates had declined steadily. Finally, in 1997, release of results from the National Assessment of Educational Progress (NAEP) showed Texas 4th graders to have made more progress on NAEP math tests between 1992 and 1996 than those in any other state participating in state NAEP testing. These developments led to a flurry of editorial praise for the apparent educational progress of the Lone Star State. Some went so far as to suggest even that the Texas experience should serve as a model for federal education legislation. Part 4 began a closer examination of both TAAS and what has been happening in Texas schools over the last several decades. Section 4.1 showed that by any of the prevailing standards for ascertaining adverse impact, grade 10 TAAS results continue to show discriminatory adverse impact on Black and Hispanic students in Texas. It was also shown that use of TAAS results in isolation to control award of high school diplomas is a clear violation of professional standards concerning appropriate test use. Previously I explained how expert witnesses for the state of Texas had challenged my interpretation or the Standards for Educational and Psychological Testing, sponsored by AERA, APA and NCME. In July, 2000, AERA issued a statement that, at least in my view confirms my interpretation of the Standards. (See www.aera.net/about/policy/stakes.htm) Section 4.2 demonstrated that the passing scores set on TAAS tests were arbitrary, discriminatory and failed to take measurement error into account. Furthermore, analyses comparing TAAS reading, writing and math scores with one another and with relevant high school grades raise doubts about the reliability and validity of TAAS scores. Finally, it was demonstrated how a sliding scale approach (taking into account both test scores and grades) could be applied in a more professionally sound and less discriminatory manner. Stepping back from the arcane technology of standardized testing, Part 5 discussed problems of missing students and other mirages in Texas. First, patterns of student enrollment in Texas between 1975 and 1999 were examined by studying rates of progress from grade 9 to high school graduation, grade to grade progression ratios, and grade 6 to high school graduation rates. Without trying to summarize results of all of those analyses here, let me mention just some of the substantive findings from these analyses. In 1990-91, Black and Hispanic high school graduates relative to the number of Black and Hispanic students enrolled in grade 9 three years earlier fell to less than 0.50 and this ratio remained just about at or below this level from 1992 to 1999 (the corresponding ratio had been about 0.60 in the late 1970s and early 1980s). This finding indicated that only 50% of minority students in Texas have been progressing from grade 9 to high school graduation since the initiation of the TAAS testing program. Subsequent analyses of progression ratios for all the grades indicated that the rates of Texas students being denied promotion from grade 9 to 10 have changed sharply over the last two decades. From 1977 until about 1981 rates of grade 9 retention were similar for Black, Hispanic and White students, but since about 1982, the rates at which Black and Hispanic students are denied promotion and required to repeat grade 9 have climbed steadily, such that by the late 1990s, nearly 30% of Black and Hispanic students were "failing" grade 9 and required to repeat that grade. This finding led to a third series of analyses examining rates of progress from grade 6 and grade 8 to high school graduation. It was found that the rate of progress from grade 6 to high school graduation fell from about 0.75 in 1990 to less than 0.70 for White students and from about 0.65 to 0.55 for minority students. (The rate for minority students started to climb above 0.60 only in 1997,
http://epaa.asu.edu/epaa/v8n41/part8.htm (5 of 10)7/30/2004 4:37:00 AM

EPAA Vol. 8 No. 41 Haney: The Myth of the Texas Miracle in Education--Part 8: Summary and Lessons Learned
the year in which Texas was forced to raise the passing score on the GED high school equivalency tests). Since all this discussion of rates and ratios may well obscure what is happening – or not happening – to large numbers of children in Texas, let us take one last look at the grade enrollment data for Texas. This time I show simply numbers of students, not ratios or percentages. Figure 8.1 shows progress from grade 6 to high school graduation 6.5 years later for the Texas high school classes of 1982 to 1999 simply in terms of numbers of students (that is, total numbers of Black, Hispanic and White students).
Also shown in this figure is the difference, that is the numbers of students who do not make it from grade 6 to high school graduation 6.5 years later. As can be seen, the numbers of children lost between grade 6 and high school graduation in Texas were in the range of 50 to 60 thousand for the classes of 1982 to 1986. The numbers of lost children started to increase for the class of 1987 and jumped too almost 90 thousand for the class of 1991. For the classes of 1992 through 1999, in the range of 75 to 80 thousand children are being lost in each cohort. (For readers who may have not waded through all of the previous parts of this very long article and simply skipped to this conclusion, it is worth noting that as discussed in Part 7, these estimates are probably conservative, since there has been a net in-migration of people into Texas in the last two decades. Cumulatively for the classes of 1992 through 1999, there were about 2.2 million enrolled in
http://epaa.asu.edu/epaa/v8n41/part8.htm (6 of 10)7/30/2004 4:37:00 AM
EPAA Vol. 8 No. 41 Haney: The Myth of the Texas Miracle in Education--Part 8: Summary and Lessons Learned
grade 6 (in the academic years 1984-85 through 1992-93). The total number graduating from these classes was about 1.5 million. In other words, for the graduating classes of 1992 through 1999, around 700,000 children in Texas were lost or left behind before graduation from high school. Section 5.4 of the article examined cumulative rates of grade retention in Texas. These are almost twice as high for Black and Hispanic students as for White students. The next section (Section 5.5) reports on estimates of dropouts by grade. It was found that most dropouts occur between grade 9 and 10 (about 16% of Black and Hispanic students and 8% of White students) but that another 6 to 10 percent dropout after grade 10 and also after grade 11. This portion of the article also shows the way in which apparent increases in grade 10 TAAS pass rates tend to disappear, if they are based not on numbers of students taking TAAS in the spring of grade 10, but instead on fall grade 9 or even fall grade 10 enrollments. Having been alerted to the fact that some portion of the gains in grade 10 TAAS pass rates were illusory, in Section 5.6 I next sought to estimate the numbers of students taking the grade 10 tests who were classified as "in special education" and hence not counted in schools' accountability ratings. As reported in Section 5.6, the numbers of such students nearly doubled between 1994 and 1998. In the closing portion of Part 5, I sought to estimate what portion of apparent gains in TAAS pass rates might be due to such forms of exclusion. It was estimated that a substantial portion, but probably less than half of the apparent increases in TAAS pass rates in the 1990's are due to such exclusions. In Part 6 of this article, I sought to summarize the views of educators in Texas about TAAS, based on three statewide surveys of educators. These surveys were undertaken entirely independently, and surveyed somewhat different populations of educators. General findings from this review were as follows:
1. Texas schools are devoting a huge amount of time and energy preparing students specifically for TAAS.
2. Emphasis on TAAS is hurting more than helping teaching and learning in Texas schools. 3. Emphasis on TAAS is particularly harmful to at- risk students.4. Emphasis on TAAS contributes to retention in grade and dropping out of school.
Survey results indicated that the emphasis on TAAS is contributing to dropouts from Texas schools not just of students, but also teachers. In one survey, reading specialists were asked whether they agreed with the following statement:
It has also been suggested that the emphasis on TAAS is forcing some of the best teachers to leave teaching because of the restraints the tests place on decision making and the pressures placed on them and their students.
A total of 85% of respondents agreed with this statement. In another survey, teachers volunteered comments such as the following: "Mandated state TAAS Testing is driving out the best teachers who refuse to resort to teaching to a low level test!" The penultimate portion of this article, Part 7, reviews a variety of additional evidence about
http://epaa.asu.edu/epaa/v8n41/part8.htm (7 of 10)7/30/2004 4:37:00 AM

EPAA Vol. 8 No. 41 Haney: The Myth of the Texas Miracle in Education--Part 8: Summary and Lessons Learned
education in Texas. Five different sources of evidence about rates of high school completion are compared and contrasted. In an effort to reconcile sharp differences apparent in these sources, a review of statistics on numbers of students, in Texas and nationally, taking the Tests of General Educational Development (GED) was undertaken. People take the GED tests in order, by achieving passing scores, to be awarded high school equivalency degrees. The review of GED statistics indicated tat there was a sharp upturn in numbers of young people taking the GED tests in Texas in the mid-1990s. This finding helps to explain why the TEA statistics on dropouts are misleading. According to TEA accounting procedures, if students leave regular high school programs to go into state-approved GED preparation programs, they are not counted as dropouts. As Greene (1998) observed:
[A]n important misleading feature of the [TEA] reported drop-out rates is that they exclude students who were transferred to approved alternate programs, including drop-out recovery programs. If the students in these drop-out or other alternative programs subsequently drop out, it is not counted against the district. This is like reporting death rates at hospitals where you exclude patients transferred to intensive care units.
If we put aside the TEA-reported dropout rates as misleading, differences in other sources of evidence on rates of high school completion in Texas appear reconcilable. NCES reports (based on CPS surveys) indicate that the rate of high school completion among young people in Texas in the 1990s was about 80%. This would imply a non-completion (or dropout) rate of 20%. Initially this would appear markedly lower than the non-graduation rate of at least 30% derived from my analyses of TEA data on enrollments and graduates. But the CPS surveys count as high school completers, those who receive a regular high school diploma and those who receive a GED high school equivalency degree. So it seems clear that a convergence of evidence indicates that during the 1990s, slightly less than 70% of students in Texas actually graduated from high school (e.g. 1.5 million/2.2 million = 0.68). This implies that about 1 in 3 students in Texas in the 1990s dropped out of school and did not graduate from high school. (Some of these dropouts may have received GED equivalency degrees, but as discussed in Part 7, GED certification is by no means equivalent to regular high school graduation). Section 7.2 examined patterns of retention in grade 9 and high school completion among states for which such data are available. Results indicated that there is a strong association between high rates of grade 9 retention and low rates of high school completion (specifically, results suggested that for every 10 students retained to repeat grade 9, about seven will not complete high school). Part 7.3 examined SAT scores for Texas students as compared with national results. Evidence indicates that at least as measured by performance on the SAT, the academic learning of secondary school students in Texas has not improved since the early 1990s, at least as compared with SAT-takers nationally. Indeed results from 1993 to 1999 on the SAT-M indicate that the learning of Texas student has deteriorated relative to students nationally (and this result holds even after controlling for percentage of high school graduates taking the SAT). Part 7.4 revisited NAEP results for Texas. Results for eight state NAEP assessments conducted between 1990 and 1998 were reviewed. Because of the doubtful meaningfulness of the NAEP achievement levels, NAEP results for Texas and the nation were compared in terms of NAEP test
http://epaa.asu.edu/epaa/v8n41/part8.htm (8 of 10)7/30/2004 4:37:00 AM
EPAA Vol. 8 No. 41 Haney: The Myth of the Texas Miracle in Education--Part 8: Summary and Lessons Learned
scores. In order to compare NAEP results with those from TAAS, the "effect size" metric (from the meta-analysis literature) was employed. This review of NAEP results from the 1990s, showed that grade 4 and grade 8 students in Texas performed much like students nationally. On some NAEP assessments Texas students scored above the national average and on some below. In the two subject areas in which state NAEP assessments were conducted more than once during the 1990s, there is evidence of modest progress by students in Texas, but it is much like the progress evident for students nationally. Reviewing NAEP results for Texas by ethnic group, we see a more mixed picture. In many comparisons, Black and Hispanic students show about the same gain in NAEP scores as White students, but the 1998 NAEP reading results indicate that while White grade 4 reading scores in Texas have improved since 1992, those of Black and Hispanic students have not. More generally, however, the magnitudes of the gains apparent on NAEP for Texas fail to confirm the dramatic gains apparent on TAAS. Gains on NAEP in Texas are consistently far less than half the size (in standard deviation units) of Texas gains on state NAEP assessments. These results indicate that the dramatic gains on TAAS during the 1990s are more illusory than real. The Texas "miracle" is more hat than cattle. The final portion of the penultimate portion of this article (Section 7.5) provided a brief review of other evidence concerning the state of education in Texas. Perhaps the most striking portion of this review were results from the Texas Academic Skills Program or TASP test during the 1990s. Between 1994 and 1997, TAAS results showed a 20% increase in the percentage of students passing all three exit level TAAS tests (reading, writing and math). But during the same interval, TASP results showed a sharp decrease (from 65.2% to 43.3%) in the percentage of students passing all three parts (reading, math, and writing) of the TASP college readiness test.
8.3 Testing and Accountability
What might be the broader lessons from the Texas myth for education elsewhere? Surely there are many different ones that might be read into this story (such as the need to be wary of the party line emanating from large bureaucracies, which education in Texas seems to have become; and the importance of comparing alternative forms of evidence in order to begin to get at the truth about large and complex enterprises). But in closing, I comment briefly on only three of what I view as the broader lessons from the Texas myth story. Aims of Education. The Texas myth story surely helps remind us of the broader aims of education in our society. The dramatic gains apparent on TAAS in the 1990s are simply not born out by results of other testing programs (such as the SAT, NAEP and TASP). But quite apart from test scores, surely one of the main outcomes of pre-collegiate education is how many students finish and graduate from high school. By this measure of success, surely the Texas system of education in which only two out of three young people in the 1990s actually graduated from high school should not be deemed a success, much less a miracle. Testing and Accountability. The TAAS testing program in Texas seems to have been spawned mainly by a yen for holding schools "accountable" for student learning. It is an unfortunately common manifestation of what has come to be called in the last several decades "outcomes accountability." As suggested above, however, quite apart from test scores, surely one of the most important outcomes of public education is how many young people finish schooling and graduate
http://epaa.asu.edu/epaa/v8n41/part8.htm (9 of 10)7/30/2004 4:37:00 AM
EPAA Vol. 8 No. 41 Haney: The Myth of the Texas Miracle in Education--Part 8: Summary and Lessons Learned
from high school. And this reminds us of the broader meaning of the term accountability (Haney & Raczek, 1994). In its broader meaning the word accountability refers to providing an account or explanation not just of consequences, but of conduct. The Texas myth story, it seems to me, reminds us of how vital it is when judging educational endeavors to return to the root meaning of the word accountability and inquire into conduct as well as consequences. It is of course always possible to come up with some sort of bureaucratic scheme, as in Texas, for weighing various sorts of data about schools and coming up with some kind of summary judgment about their quality. But anyone who believes in the rationality of such approaches has forgotten the old paradox of value from the field of economics. The paradox refers to the fact that many obviously useful commodities, such as air and water, have very low if any exchange values, whereas much less useful ones such as diamonds and gold, have extremely high value. According to Schumpeter's (1954) History of economic analysis, it was recognized as early as the 16th century, by "scholastic doctors" and natural philosophers that the exchange value or price of commodities derived not from any inherent characteristics of the commodities themselves but from their utility or "desiredness" and relative scarcity. Without wandering into a digression on the field of economic theory (concerning which I am an absolute amateur anyway), let me simply mention how this paradox was resolved by Kenneth Arrow. In 1950, Arrow published what has come to be known as his "impossibility theorem," in an article modestly titled "A difficulty in the concept of social welfare." In this article, Arrow proved mathematically that if there are at least three alternatives which members of society are free to order in any way, any social welfare function yielding an ordering based on those preferences violates one of three rational conditions (as long as trivial and dictatorial methods of aggregation are excluded). In short Arrow's "impossibility theorem" extended Pareto's finding about the immeasurability of general social welfare. Hazards of High Stakes Testing. More than anything though, the Texas miracle story shows us the hazards of high stakes testing. It is, of course, possible to impose a "whips and chains" test-based accountability system on schools (as Schrag, 2000, described the Texas approach). Yet the Texas miracle story shows us the need to return standardized testing to its rightful place, as a source of potentially useful information to inform human judgment, and not as a cudgel for implementing education policy.
0: Home | 1: Intro. | 2: History | 3: The Myth | 4: TAAS | 5: Missing Students 6: Teachers | 7: Other Evidence | 8: Summary | Notes & Ref. | Appendix
http://epaa.asu.edu/epaa/v8n41/part8.htm (10 of 10)7/30/2004 4:37:00 AM
EPAA Vol. 8 No. 41 Haney: The Myth of the Texas Miracle in Education--Notes and References
Volume 8 Number 41 The Texas Miracle in Education Walt Haney
Notes
A previous version of this paper was presented at the Annual Meeting of the American Educational Research Association, New Orleans, April, 2000.
1. The normal legal citation for Judge Prado's decision in the TAAS case is GI Forum Image De Tejas v. Texas Education Agency, 87 F. Supp. 667 (W.D.Tex. 2000). However, since this citation only recently became available, in the body of this paper I cite Judge Prado's decision as Prado, 2000.
2. The volume 2, number 2 issue of The Scholar: St. Mary's Law Review on Minority Issues has recently published major portions of the reports of eight experts who testified in the TAAS trial, including portions of both my original (Haney, 1998) and supplementary (Haney, 1999) reports concerning the case.
3. I do not know how many schools have been taken over by the state, but I am aware that the TEA took over control of the Wilmer-Hutchins district in 1996 because of poor performance (Wertheimer, 1999).
4. At least one independent analyst has found that the equating of TAAS forms has not been successful. In a study commissioned by the Tax Research Association of Houston and Harris County (TRA), Sandra Stotsky analyzed TAAS reading tests for 1995 through 1998 and found that the grade 4, 8 and 10 TAAS reading tests for these years and grades were not comparable in difficulty (see, Stotsky, 1998).
5. In the second report for the TAAS case (Haney 1999), I also applied the 80% rule to results for three different grade 10 TAAS tests (reading writing and math). Writing test results for Blacks and Hispanics have generally not fallen below 80% of the White pass rates, but TAAS math test results consistently have.
6. The latest version of the joint test Standards was issued in 1999, after the TAAS case and my work on it, were under way. Therefore, here I cite both 1985 and 1999 versions of the Standards. Where pertinent, I also document how specific provisions changed between 1985 and 1999.
7. The corresponding 1985 standard read: Standard 8.12 In elementary or secondary education, a decision or characterization that will have a major impact on a test taker should not automatically be made on the basis of a single test score. Other relevant information for the decision should also be taken into account by the professionals responsible for making the decision. (APA, AERA & NCME, 1985, p. 54)
8. MALDEF attorneys sought to have the Heubert & Hauser report entered as evidence in the TAAS trial, but after attorneys for the state of Texas objected, the judge refused to allow the NRC report entered as evidence in the case. In a symposium on the GI Forum case at the Annual Conference of the Council of Chief State School Officers, Snowbird Utah, June 17, 2000, I asked Geoffrey T. Amsel, the lead lawyer for the State of Texas in the case, why in the
http://epaa.asu.edu/epaa/v8n41/refs.htm (1 of 11)7/30/2004 4:39:11 AM
EPAA Vol. 8 No. 41 Haney: The Myth of the Texas Miracle in Education--Notes and References
world he had sought to have NRC report excluded from evidence in the case. His public response? "I was just trying to be a pain in the ass."
9. The corresponding passages from the 1985 Standards are: Standard 6.9 When a specific cut score is used to select, classify, or certify test takers, the method and rationale for setting that cut score, including any technical analyses, should be presented in a manual or report. When cut scores are based primarily on professional judgment, the qualifications of the judges also should be documented. (AERA, APA & NCME, 1985, p. 34) And 1985 Standard 2.10 specifies that "standard errors of measurement should be reported for score levels at or near the cut score" (p. 22).
10. It is worth mentioning that since 1990 considerable literature has been published on methods for setting passing scores on tests (for example, Gregory Cizek, Setting passing scores, Educational Measurement: Issues and Practice, Summer 1996, pp. 20-31). However in discussing the setting of passing scores on TAAS in 1990, it seems reasonable to focus on literature that was prominently available before that year.
11. Part 6.2 below provides more explanation on how this survey was undertaken. Haney, Myth of the Texas Miracle, v. 4, July 28, 2000, p. 58.
12. I was able to assemble this data set thanks to the generous assistance of Dr. Ed Rincon of Rincon Associates and Terry Hitchcock of the Texas Education Agency (TEA).
13. When a graph like Figure 5.2 was presented during the TAAS trial (the same, except that it did not include 1998-99 data), the pattern was sufficiently startling that Judge Prado interjected exactly this question, ìWhat happened?î
14. The original Table 6.1 in the NRC report contained several printing errors, but a corrected version has been released.
15. It should be explained that the TEA data cited shows slightly different numbers of students taking the three portions of the grade 10 TAAS (reading writing and math) in any given administration. To derive the results shown in Table 5.5, I calculated the number of special education students taking each portion of the TAAS in each years and then averaged the numbers and percentages taking each portion.
16. We should acknowledge that this response rate of less than 15% was certainly less than ideal. One likely reason for the low response rate is that we were able to mail the survey only one week before the last week of the 1998-99 Texas school year. One respondent even spontaneously chided us for sending a survey that arrived during such a hectic time in the school year. Because of this timing we were unable to send follow-up letters to non-respondents.
17. ARD stands for Admission, Review and Dismissal, the name of the Committee in Texas schools that oversees special education designations and plans.
18. Recently, thanks to a suggestion of Jeff Rodamar, I have become aware of a set of short papers on the web site of the Texas Public Policy Foundation (http://www.tppf.org/). One paper, by John Pisciotta summarizes two 1996 surveys of satisfaction and dissatisfaction of teachers in Texas. The report states: "Overall, this report indicates that with all the Texas public education reforms of recent years, the environment for Texas professional educators has not improved. One key finding is that public school teachers did not generally believe the teaching quality in their schools was improving. When asked if quality of teaching at their school had improved
http://epaa.asu.edu/epaa/v8n41/refs.htm (2 of 11)7/30/2004 4:39:11 AM
EPAA Vol. 8 No. 41 Haney: The Myth of the Texas Miracle in Education--Notes and References
compared to five years ago, only 39% of public school teachers said yes. Almost a third believed teaching quality was worse than five years ago. In contrast, 71% of private school teachers saw their schools as better than five years ago. Social promotion, passing students from one grade to the next without adequate academic achievement, was another topic of the surveys. Public school teachers viewed social promotion as a widespread problem. Over half of the public school teachers indicated that social promotion was a problem at their school, compared to 29% of private school teachers. The most central question relating to teacher attrition was: Are you seriously considering leaving the teaching profession? For public school teachers, 44% said they were. Only 28% of the private-school teachers were seriously considering leaving the profession. As the major reason for leaving, private school teachers cited inadequate financial compensation. Public school teachers cited poor working conditions as their major reason for leaving." (http://www.tppf.org/, accessed 5/7/00).
19. In trying to track down possible sources of discrepancies in Texas dropout rates, I talked with Phil Kaufman of MPR of Berkeley California. Among other things he explained that the CPS data gathering began to use computer assisted telephone interviewing in 1994, and hence it is hazardous to compare CPS results from before and after that date.
20. In order to further explore this issue, I consulted with a number of scholars who have previously analyzed CPS, data including Robert Hauser, Phil Kaufman, Richard Murnane, Duncan Chaplin and John Tyler. What I conclude from these consultations is that for a variety of reasons, one needs to be wary of dropout rate estimates based on CPS data. See, for example, Hauser, 1997; Chaplin, 1999.
21. The very next sentence after the passage quoted here says "Consequently, GED graduates in 1997 and beyond must meet or surpass the performance of the top two- thirds of traditional graduating high school seniors." Obviously this statement is mistaken. What was meant was that the new GED passing standard raised the minimum scores such that instead of exceeding the performance of 25% of the norm group of high school seniors, the new minimum was equal to or surpassed the performance of 33% of the norm group.
22. A minor mystery appeared when it was learned that 15 to 20% of GED takers in Texas were only 16 or 17 years of age. GED annual reports indicate that the minimum age for taking the GED in Texas is 18. So I called the Office of Continuing Education in the Texas Education Agency (512-463-9292, 6/1/00). It was readily explained that people can take the GED in Texas below age 18 if they have a letter from a parent, parole officer. or judge. In a personal communication (6/8/00), John Tyler generously told me how to solve another mystery. GED statistics from the TEA are slightly different than those reported by GEDTS, apparently because TEA tends to report GED statistics in terms of GED certificates actually awarded, whereas GEDTS also reported numbers who pass the GED tests.
23. The only jurisdiction with a larger drop in its passing rate in 1997 was American Samoa, where only 30 people were tested in 1997.
24. To be clear, the new GED passing standard in Texas was more difficult than the pre-1997 Texas standard. It appears to be much lower than the passing standard on TAAS. Though I have been unable to locate any studies comparing the difficulty of the TAAS and GED tests, according to Barasch et al. (1990, p. 9) ìTo be successful in passing the GED in most states, a candidate must get a total minimum standard score of 225 on the five tests, with no score less
http://epaa.asu.edu/epaa/v8n41/refs.htm (3 of 11)7/30/2004 4:39:11 AM
EPAA Vol. 8 No. 41 Haney: The Myth of the Texas Miracle in Education--Notes and References
than 35 on any single test. In general this means that a candidate who answers just over half of the questions in each test will get a passing score.î As we have seen, in Texas until 1997, people could pass the GED with a total standard score of only 200.
25. For more recent evidence on economic returns to earning the GED, see Murnane, Willett, & Tyler, 2000.
26. It is worth noting that analyses of grade enrollment data in part 5.5 above suggest that Murdock et al.ís estimate of the 1-2% annual in-migration rate for the Texas population appears to hold for the school age population in the 1990s. For example, referring to Table 5.3, if we average the % difference between predicted and actual grade enrollments for 1996-97 for grades 2-7 where retention in grade is quite uncommon, we get a little over 1% across the three ethnic groups. Note too that to the extent that Hispanic in-migration is greater than White in-migration, as Murdock et al., indicate, so too will the Hispanic-White gap in dropout rates be underestimated.
27. The correlation between these two variables is -0.51, statistically significant at the 0.05 level, even with the small sample of states for which grade 9 retention rates are available. Also, I suspect that for Arizona, the outlier data point in Figure 7.3, data on high school completion may be unreliable. If we replace the 77.1 % high school completion rate for 1996-98 for Arizona with the rate of 83.8% that Kaufman et al. (1999) report for Arizona for 1993-95, the correlation changes to -0.7. And if we simply delete the Arizona case, the correlation is -0.80. If the Arizona case is deleted, the regression of HS completion rate on grade 9 retention rate is HSC = 95.6 - 0.69G9R (R2 = 0.657) This suggests that for every 10 students retained to repeat grade 9, about seven will not complete high school. Given this regression equation, the predicted rate of high school completion for Texas would be 83.3, but the actual rate is about three points lower, at 80.2.
28. This finding is particularly significant given that previous research has shown that quantitative test scores are more sensitive to school experiences than are verbal test scores (Haney, Madaus & Lyons, 1993).
29. The exception to this pattern is that since it was decided that a student must achieve at least a 2 score on the written composition in order to pass the TAAS writing test, a composition score of "1" plus 27 or more multiple-choice items is truncated to a scale score of 1499, which is one point below mastery.
30. Rodamar (2000) also has an interesting summary of how college-going in Texas has changed between 1994 and 1996 (see exhibit 15, p. 21).
References
APA, & NCME. (1999) Standards for Educational and Psychological Testing. Washington, DC: American Psychological Association.
Arrow, K. J. (1950). A difficulty in the concept of social welfare. Journal of political economy. 58, 328-346.
http://epaa.asu.edu/epaa/v8n41/refs.htm (4 of 11)7/30/2004 4:39:11 AM
EPAA Vol. 8 No. 41 Haney: The Myth of the Texas Miracle in Education--Notes and References
Barasch, S. et al. (1990). ARCO GED High School Equivalency Examination. NY: Prentice Hall.
Becker, B. J. (1990). Coaching for the Scholastic Aptitude Test: Further synthesis and appraisal. Review of Educational Research, 60(3), 373-417.
Berk, R. (1986). A consumer's guide to setting performance standards on criterion-referenced tests. Review of Educational Research, 56(1), 137-172.
Cameron, S. V. and Heckman, J.J. (1993), "The Nonequivalence of High School Equivalents," Journal of Labor Economics, 11(1) Part 1, 1-47.
Cannell, J. J. (1987). Nationally normed elementary achievement testing in America's public schools: How all 50 states are above the national average. Daniels, WV: Friends for Education.
Cannell, J. J. (1988). Nationally normed elementary achievement testing in America's public schools: How all 50 states are above the national average. Educational Measurement: Issues and Practice, 7(2), 5-9.
Cannell, J. J. (1989). The 'Lake Wobegon' report: How public educators cheat on standardized achievement tests. Albuquerque, NM: Friends for Education.
Catterall, J. S. (1989). Standards and school dropouts: A national study of tests required for graduation. American Journal of Education, 98(1), 1-34.
Chaplin, D. (1999). GED Policies and High School Completion: Are there Unintended Consequences? (Paper presented at the 1998 annual meetings of the Association for Public Policy Analysis and Management, New York, N.Y.). Wash. D.C.: The Urban Institute.
Cizek, G. (1996) Setting passing scores, Educational Measurement: Issues and Practice (Summer 1996) 20-31.
Cohen, J. (1977). Statistical power analysis for the behavioral sciences. (Revised. Ed.). New York: Academic press.
Cooper, H. and Hedges, L. V. (1994). The handbook of research synthesis. New York: Russell Sage.
Daley, B. (1999), Embarassed into success: Texas school experience may hold lessons for Massachusetts. "Boston Globe" (June 10, 1999), p. A1.
Drahozal, E. C., & Frisbie, D. A. (1988). Riverside comments on the Friends for Education report. Educational Measurement: Issues and Practice, 7, 12-16.
http://epaa.asu.edu/epaa/v8n41/refs.htm (5 of 11)7/30/2004 4:39:11 AM
EPAA Vol. 8 No. 41 Haney: The Myth of the Texas Miracle in Education--Notes and References
Dyer, H. S. (1973). Does Coaching Help? College Board Review, 19, 331-335.
Fassold, M. (1999) Affidavit filed in case of GI Forum Image De Tejas v. Texas Education Western District of Texas (Civil Action No. SA-97-CA-1278-EP), July 13, 1999.
Fienberg, S. (1989). The evolving role of statistical assessments as evidence in courts. (Report of the Panel on Statistical Assessments as Evidence in Courts of the National Research Council.) NY: Springer-Verlag.
Funkhouser, C. (1990). Education in Texas. Policies, practices and perspectives. (5th Edn.) Scottsdale, AZ: Gorsuch Scarisbrick.
GED Testing Service. (1989-1998). Statistical Reports, 1989, 1990, 1991, 1992, 1994, 1996, 1997, 1998. Washington, D.C.: American Council on Education.
Gilmore, M. E. (1927). Coaching for intelligence tests. Journal of Educational and Psychological Measurement, 19, 319-330.
Glass, G. V (1976). Primary, secondary and meta-analysis of research. Educational Researcher, 5, 3-8.
Glass, G. V. (1978). Standards and criteria. Journal of Educational Measurement, 15, 237-261.
Glass, G.V, McGaw, B. and Smith, M.L. (1981) Meta-analysis in Social Research. Beverly Hills, CA: SAGE Publications.
Gordon, S. P. and Reese, M. High stakes testing: Worth the price? Journal of School Leadership. Volume 7 ( July 1997) 345-368.
Greene, J. (1998). Why do over half of the public school students in big Texas districts fail to graduate? "Houston Chronicle" (October 22, 1998).
Greenwald, E, Persky, H. Cambell, J. & Mazzeo, J. (1999). NAEP 1998 Writing report card for the nation and the states. (NCES report 1999-462). Washington, D.C. National Center for Education Statistics.
Grissmer, D. & Flanagan A. (1998). Exploring rapid achievement gains in North Carolina and Texas. Washington, D.C.: National Education Goals Panel. (Available at http://www.negp.gov/reports).
Haas, N. S., Haladyna, T. M., & Nolen, S. B. (1990, April). Standardized achievement testing: War stories from the trenches. Paper presented at the Annual Meeting of the National Council on
http://epaa.asu.edu/epaa/v8n41/refs.htm (6 of 11)7/30/2004 4:39:11 AM
EPAA Vol. 8 No. 41 Haney: The Myth of the Texas Miracle in Education--Notes and References
Measurement in Education, Boston, MA.
Haladyna, T. M., Nolen, S. B., & Haas, N. S. (1991). Raising standardized test scores and the origins of test score pollution. Educational Researcher, 20(5), 2-7.
Haney, W. (1993). Testing and minorities. In Weis, L. & Fine, M. (Eds). Beyond silence: Class, race and gender in United States schools. Albany, NY: State University of New York Press, pp. 45-73.
Haney, W. (1998). Preliminary report on Texas Assessment of Academic Skills Exit Test (TAAS-X). Chestnut Hill, MA: Boston College Center for the Study of Testing Evaluation and Educational Policy. (Portions of this report have been published in volume 2, number 2 issue of The Scholar: St. Mary's Law Review on Minority Issues).
Haney, W. (1999). Supplementary report on Texas Assessment of Academic Skills Exit Test (TAAS-X). Chestnut Hill, MA: Boston College Center for the Study of Testing Evaluation and Educational Policy. (Portions of this report have been published in volume 2, number 2 issue of The Scholar: St. Mary's Law Review on Minority Issues).
Madaus, G., West, M., Harmon, M. Lomax, R., and Viator, K. (1992). The influence of testing on teaching math and science in grades 4 – 12. (report of a study funded by the National Science Foundation under grant SPA8954759) Chestnut Hill, MA: Boston College Center for the Study of Testing Evaluation and Educational Policy.
Haney, W., Fowler, C., and Wheelock, A. (1999) Less Truth Than Error?: An independent study of the Massachusetts Teacher Tests. Education Policy Analysis Archives Volume 7 Number 4 February 11, 1999. Published on the WWW at: http://epaa.asu.edu. (With Damian Bebell and Nicole Malec).
Haney, W., Madaus, G., and Lyons, R. (1993) The Fractured Marketplace for Standardized Testing. Boston: Kluwer Academic Publishers. Boston: Kluwer Academic Publishers.
Haney, W. & Raczek, A. (1994). Surmounting outcomes accountability in education. Report prepared for the U.S. Congress Office of Technology Assessment.
Hauser, R. M. (1997). Indicators of High School Completion and Dropout. Pp. 152-84 in R. M. Hauser, B. V. Brown, and W. Prosser (Eds.) Indicators of Children's Well-Being. New York: Russell Sage Foundation.
Heubert, J. & Hauser, R. (Eds.) (1999). High Stakes: Testing for Tracking, Promotion, and Graduation. A Report of the National Research Council, Washington, D.C.: National Academy Press.
Hodgkinson, H. (1986) Texas: The State and Its Educational System. Institute for Educational
http://epaa.asu.edu/epaa/v8n41/refs.htm (7 of 11)7/30/2004 4:39:11 AM
EPAA Vol. 8 No. 41 Haney: The Myth of the Texas Miracle in Education--Notes and References
Leadership.
Hoel, P. (1971). Introduction to mathematical statistics . NY: Wiley, 1971.
Hoffman, J., Pennington, J., Assaf, L. & Paris, S. (1999) High Stakes Testing in Reading and Its Effects on Teachers, Teaching, and Students: Today in Texas, Tomorrow? (Unpublished manuscript). University of Texas at Austin.
Intercultural Development Research Association. (1986). Texas School Survey project: A Summary of Findings. San Antonio: TX: Intercultural Development Research Association. (October 31, 1986).
Jaynes, G., D. and Williams, R.n. W. (Eds.) (1989). A common destiny: Blacks and American society. National Academy Press.
Jerald, C. (2000). The state of the states. Education Week (January 13, 2000) pp. 62-163.
Kaufman, P., Kwon, J., Klein, S. and Chapman, C. (1999). Dropout rates in the United States: 1998. (NCES 2000-022). Wash., D.C.: National Center for Education Statistics, p. 20.
Kaye, D. H. and Freedman, D. (1994) Reference guide on statistics. Federal Judicial Center.
Koretz, D. M. & Barron, S. I. (1998) The validity of gains in scores on the Kentucky Instructional Results Information System (KIRIS). (RAND report MR-1014-EDU). Washington, D.C. RAND.
Koretz, D. M. & Barron, S. I. (1999) Test-based accountability systems: Lessons of Kentucky's experiment. (RAND research brief RB-8017) (http://www.rand.org/publications/RB8017).
Koretz, D. M., Linn, R. L., Dunbar, S. B., & Shepard, L. A. (1991, April). The effects of high stakes testing on achievement: Preliminary findings about generalization across tests. Paper presented at the Annual Meeting of the American Educational Research Association, Chicago, IL:
Lenke, J. M., & Keene, J. M. (1988). A response to John J. Cannell. Educational Measurement: Issues and Practice, 7, 16-18.
Linn, R. L. (1982). Ability testing: Individual differences, prediction and differential prediction. In Wigdor, A. K. & Garner, W. R. Ability testing: Uses consequences and controversies. Part II. Washington, D.C. National Academy Press. Pp. 335- 388.
Linn, R. L. (2000). Assessments and accountability. Educational Researcher 29:2, 4-15.
Linn, R. L., Graue, M. E., and Sanders, N. M. (1989, March). Comparing state and district test
http://epaa.asu.edu/epaa/v8n41/refs.htm (8 of 11)7/30/2004 4:39:11 AM
EPAA Vol. 8 No. 41 Haney: The Myth of the Texas Miracle in Education--Notes and References
results to national norms: Interpretations of scoring 'above the national average'. Paper presented at the Annual Meeting of the American Educational Research Association, San Francisco, CA.
Linn, R. L., Graue, M. E., and Sanders, N. M. (1990). Comparing state and district test results to national norms: The validity of claims that "everyone is above average". Educational Measurement: Issues and Practice, 9(3), 5-14.
Linton, T.H. and Debiec, M. (1992). The secondary level TAAS test: An analysis of the 70% mastery level. Paper presented to the Texas Testing Conference, Austin, Texas, March 2-4, 1992.
Madaus, G.; West, M.M.; Harmon, M.C.; Lomax, R.G.; and Viator, K.A. (1992) The influence of testing on teaching math and science in grades 4-12. Report of research funded by National Science Foundation Grant SPA8954759. Chestnut Hill, MA: Center for the Study of Testing, Evaluation and Educational Policy.
Mullis, I. V. S., Dossey, J. A., Owen, E. H., & Phillips, G. W. (1993). NAEP 1992 Mathematics Report card for the Nation and the States. (Report No. 23-ST02). Washington, D.C.: National Center for Education Statistics.
Murdock, S., Hoque, M. N., Michael, M., White, S., & Pecotte, B.. (1997). The Texas challenge: Population change and the future of Texas. College Station, TX: Texas A&M University Press.
Murnane, R. J., J. B. Willett, and J. H. Tyler. (2000) Who Benefits from Obtaining a GED?: Evidence from High School and Beyond? Review of Economics and Statistics, 82:1, 23-37
National Education Goals Panel, (November 5, 1998). North Carolina and Texas Recognized as Models for Boosting Student Achievement (press release). Washington, D.C.: National Education Goals Panel.
Office of Civil Rights (1999). The use of tests when making high-stakes decisions for students: A resource guide for educators and policy-makers. (Draft) Washington, D.C.: U.S. Department of Education.
Office of Technology Assessment. (1987). State Educational Testing Practices. (Background Paper, December 1987). Washington, D.C.: Office of Technology Assessment.
Palmaffy, T. (1998). The Gold Star State: How Texas jumped to the head of the class in elementary school achievement. Policy Review (March-April, 1998). No. 88. (http://www.policyreview.com//mar98/goldstar.html)
Phillips, G. W., & Finn, C. E. (1988). The Lake Wobegon effect: A skeleton in the testing closet? Educational Measurement: Issues and Practice, 7, 10-12.
http://epaa.asu.edu/epaa/v8n41/refs.htm (9 of 11)7/30/2004 4:39:11 AM

EPAA Vol. 8 No. 41 Haney: The Myth of the Texas Miracle in Education--Notes and References
Prado, E. (2000). Order in case of GI Forum Image De Tejas v. Texas Education Western District of Texas (Civil Action No. SA-97-CA-1278-EP. Filed January 7, 2000. (GI Forum Image De Tejas v. Texas Education Agency, 87 F. Supp. 667 (W.D. Tex. 2000).
Qualls-Payne, A. L. (1988). SRA responds to Cannell's article. Educational Measurement: Issues and Practice, 7, 21-22.
RAND (1999) Test-based accountability systems: Lessons of Kentucky's experiment. (RAND research brief RB-8017) (www.rand.org/publications/RB8017). (Base on Koretz, Daniel M. & Barron, Sheila I., 1998).
Reese, C. M., Millert, K. E. Mazzeo, J. and Dossey, J. A. NAEP 1996 Mathematics Report Card for the Nation and the States. Washington, D.C.: National Center for Education Statistics. (Report available at http://www.ed.gov/NCES/naep).
Rodamar, J. (2000). Tall Tales? Texas Testing Moves from Pecos to Wobegon. Washington, D.C.: Unpublished draft v.2.1 dated Feb. 29, 2000.
Schrag, P. (2000). "Too Good to be True ," The American Prospect. 11:4 (January 3, 2000). (http://www.prospect.org/archives/V11-4/schrag.html).
Schumpeter, J. A. (1954). History of economic analysis. NY: Oxford University press.
Shepard, L. (1989, March). Inflated test score gains: Is it old norms or teaching to the test? Paper presented at the Annual Meeting of the American Educational Research Association San Francisco, CA.
Shepard, L. A. (1990). Inflated test score gains: Is the problem old norms or teaching to the test? Educational Measurement: Issues and Practice, 9(3), 15-22.
Shepard, L.A. & Smith, M.L. (1989) Flunking Grades: Research and Policies on Retention. London: The Falmer Press.
Stonehill, R. M. (1988). Norm-referenced test gains may be real: A response to John Jacob Cannell. Educational Measurement: Issues and Practice, 7, 23-24.
Stotsky, S. (1998). Analysis of Texas reading tests, grades 4, 8 and 10, 1995-1998. (report prepared for the Tax Research Association). Available: http://www.educationnews.org/analysis_of_the_texas_reading_te.htm (August 1, 2000)
http://epaa.asu.edu/epaa/v8n41/refs.htm (10 of 11)7/30/2004 4:39:11 AM
EPAA Vol. 8 No. 41 Haney: The Myth of the Texas Miracle in Education--Notes and References
Taxpayer Research Association (1999) TRA OVERVIEW, TRA Reading Tests. (http://tra.org. Accessed September 11, 1999).
Texas House of Representatives House Research Organization (1999). The Dropout Data Debate. Austin TX: Texas House of Representatives. (http:www.capitol.state.tx.us/hrofr).
Texas Education Agency (1997). Texas Student Assessment ProgramTechnical Digest for the Acadmeic year 1996-97. Austin, TX: TEA.
Thorndike, Robert and Hagen, Elizabeth (1977). Measurement and evaluation in psychology and education (4th Edition). New York: Wiley.
University of Houston. (1998). Freshman admission requirements. (http://www.uh.edu/enroll/admis/freshman_req.html ) November 3, 1998.
Wertheimer, Linda (1999) Inquiry into tampering names 4 local districts. Dallas Morning News, February 18, 1999.
Williams, P. L. (1988). The time-bound nature of norms: Understandings and misunderstandings. Educational Measurement: Issues and Practice, 7, 18-21.
Willingham, W., Lewis, C., Morgan, R., & Ramist, L. (1990). Predicting college grades: An analysis of institutional trends over two decades. Princeton NJ: Educational Testing Service.
Winglee, M., Marker, D., Henderson, A. Young, B. A. & Hoffman, L. (2000). A recommended approach to providing high school dropout and completion rates at the state level. (NCES 2000-305). Washington, D.C.: National Center for Education Statistics
Wolf, F. M. (1986). Meta-analysis: Quantitative methods for research synthesis. Newbury Park, CA: Sage.
0: Home | 1: Intro. | 2: History | 3: The Myth | 4: TAAS | 5: Missing Students 6: Teachers | 7: Other Evidence | 8: Summary | Notes & Ref. | Appendix
http://epaa.asu.edu/epaa/v8n41/refs.htm (11 of 11)7/30/2004 4:39:11 AM

EPAA Vol. 8 No. 41 Haney: The Myth of the Texas Miracle in Education--Appendices
Volume 8 Number 41 The Texas Miracle in Education Walt Haney
The Myth of the Texas Miracle in Education: Appendices
● Appendix 1: Testing & Teaching Survey Form ● Appendix 2: Testing & Teaching Survey Comments ● Appendix 3: Judge Prado Decision in GI Forum Case ● Appendix 4: Plaintiffs' Post Trial Brief ● Appendix 5: Defendants Response to Plaintiff's Post Trial Brief ● Appendix 6: Summary Comment on Judge Prado's Decision in the GI Forum Case ● Appendix 7: Texas Enrollments by Grade and Race (1975-1999) ● Appendix 8: Minutes of the Texas State Board of Education Meeting, July 1990 ● Appendix 9: Responses to Two Questions Survey
0: Home | 1: Intro. | 2: History | 3: The Myth | 4: TAAS | 5: Missing Students 6: Teachers | 7: Other Evidence | 8: Summary | Notes & Ref. | Appendix
http://epaa.asu.edu/epaa/v8n41/appendices.htm7/30/2004 5:03:55 AM

Boston CollegeCenter for the Study of Testing, Evaluation, and Educational Policy
Funded by the Mexican American Legal Defense and Education Fund
Instructions for completing the questionnaire: The purpose of the attached questionnaire is to gather information abouttesting and testing issues from people like yourself who teach English and Math in grades 7 through 12. These issues areparticularly important for the reform efforts that are currently taking place.
A few key terms should be defined as they are used in the questionnaire: (1) State-mandated tests are thosestandardized tests that a state requires of its schools at specific grade levels (such as a statewide basic skills or minimumcompetency test. (2) District-mandated tests are those standardized tests that a school district requires of students in itsschools at specific grade levels (such as an achievement test ). (3) Text-supplied tests are those tests that are supplied bythe publisher of the textbook you are using, either in the textbook itself (such as end of chapter tests) or as a supplemen-tary publication (such as a teacher’s guide). (4) Teacher-made tests are those tests that you and/or your colleagues havebuilt. (5) Test preparation materials are those materials designed to prepare students for upcoming standardized tests(such as developing test-taking skills, or using practice tests).
We are interested in your candid beliefs and practices about these important testing issues. Your responses will bekept strictly confidential and will not be provided to any other person or group. Since you have been selected as part of astatewide sample, your responses are extremely valuable in learning what teachers across Texas think about these issues.
If you currently teach at the middle school or high school level to more than one class, select the class that youmeet with first on Monday. Think only of this class and/or subject as you complete the questions.
Some of the questions may not be relevant to what takes place in your class, school district, or state. In that casesimply respond “not applicable.” Please return the completed questionnaire in the enclosed self-addressed stampedenvelope within the next week. We thank you in advance for participating in this important study.
SURVEY OF TESTING AND TEACHING IN GRADES 7-12 IN TEXAS
1. Which one of the following categories best describes the grade level(s) of the students in this class?
Grade 7 Grade 10 Grade 8 Grade 11 Grade 9 Grade 12
2. Are you certified to teach this particular class? Yes No
3. Are students placed in this class based on their ability/ achievement?
Yes No If no, go to question 5.
4. Which one of the following categories best describes the ability/achievement level of this class?
High ability/achievement Average ability/achievement Low ability/achievement Mixed ability/achievement Special Needs
5. Have you taken graduate coursework related to this subject area in the last five years?
Yes No
6. How comfortable are you teaching this subject area? Very comfortable Quite comfortable Somewhat comfortable Not too comfortable Not comfortable at all
A Class Information
Page 1
IMPORTANT: USE NO 2 PENCIL ONLYRIGHT MARK WRONG MARKS
.

7. For EACH of the following groups, estimate as closely as possible the percentage that these groups are of your total class. Since a student may fall into more than one category, the percentages need NOT total 100%
African-American (not Hispanic) American Indian or Alaskan Native Hispanic Asian or Pacific Islander Caucasian (not Hispanic) Limited English proficiency English as a second language Gifted and talented Learning-disabled Mentally handicapped/developmentally delayed Emotionally disturbed Multiple handicapped Visually/hearing impaired Chapter 1
1. For the textbook you use most often in this class, estimate the percent of your weekly instructional time that is based (directly or indirectly) on this text (including supplementary materials).
0-10% 41-50% 71-80% 11-20% 51-60% 81-90% 21-30% 61-70% 91-100% 31-40%
2. How useful are the text-supplied tests in your text book? (Text-supplied tests are supplied by the publisher of your textbook, either separately packaged or in the text.)
Extremely useful Occasionally useful Very useful Not very useful Somewhat useful
3. How frequently do you use the text-supplied tests in your textbook for this class?
Daily 1-3 times a month 2-3 times a week 1-3 times a year Once a week Almost never
4. How frequently do you use teacher-made tests in this class? (Teacher-made tests are those that you and/or your colleagues have built.)
Daily 1-3 times a month 2-3 times a week 1-3 times a year Once a week Almost never
5. Do you use a scoring machine to score teacher-made or text-supplied tests?
Yes No
6. How frequently are students in this class asked to engage in the following types of activities as part of (a) your own teacher-made tests, (b) other in-class activities, and (c) homework?
Selecting a best answer from a list of alternative answers (such as multiple choice ) Giving short answer (such as a number or word) Giving a long answer (such as an essay, a list of steps or an explanation) Creating a product or performing an action (such as a manipulative or an experiment) Solving problems with a single acceptable solutions Solving problems with multiple acceptable solutions
B Instructional Materialsand Activities
A B CTeacher Tests Class Activities Homework
0 1-10 11-20 21-30 31-40 41-50 51-60 61-70 71-80 81-90 91-100
Daily
2-4 times a w
eek1-3 tim
es a month
1-3 times a year
Never
Once a w
eek
Daily
2-4 times a w
eek1-3 tim
es a month
1-3 times a year
Never
Once a w
eek
Daily
2-4 times a w
eek1-3 tim
es a month
1-3 times a year
Never
Once a w
eek
Page 2

Information About State AndDistrict Testing Programs
C
1. Are students in your class REQUIRED by yourSTATE and/or DISTRICT to take standardized tests inthis subject during the current academic year (do notinclude department tests)?
YesNo If no, skip to section F
2. What are the names of these required standardizedtests? Write the names in the spaces provided, or “don’tknow” if you don’t know the name of a test. Whorequires these test: your state, or your district?
Test #1 Test #2 Test #3
3. Which one of the tests that you have indicated in question 2 is MOST important to you in your own work with students in this class? Even if these tests are of little importance to you, please indicate the one that is MOST important.
Test #1Test #2Test #3
For the remainder of the questionnaire, when responding to questions about a mandated standardized test, think only of the test you selected as most important in question 3 above.
4. For the test you selected above in question 3, are the test results used for any of the following activities? Select as many as apply.
To place students in programsTo promote/graduate studentsTo evaluate teachersTo award teacher merit payTo retain faculty/staffTo publish test scoresTo attract/deter home buyersTo take-over a schoolTo alter the school curriculumNone that I know of
5. How familiar are you with what it is the mandated standardized test your students take measures?
Very familiarQuite familiarSomewhat familiarNot too familiarNot familiar at all
State DistrictNotSureTest Name
Required By
6. How familiar are you with the specific test items on the mandated standardized test your students take?
Very familiarQuite familiarSomewhat familiarNot too familiarNot familiar at all
7. The following is a list of ways in which standard ized tests are used by teachers. In your own work with students in this class, how important is the state or district mandated test you have selected for each of the functions listed below? Please rate each function with the following codes:
Recommend placement in gifted andtalentedRecommend placement in specialservicesRecommend remediationRecommend promotion/retentionin gradeRecommend graduation fromhigh schoolRecommend grouping by abilityin a gradeGroup within my classEvaluate student progressAssess teaching effectivenessRecommend textbookPlan my instructionPlan curriculumGive feedback to studentsGive feedback to parentsDetermine student grades in wholeor in part
Page 3
Extrem
ely Important
Very Important
Som
ewhat Im
portant
Minim
allyImportant
Not Im
portant

3. How far in advance of the mandated standardized test you selected do you typically begin preparation?
No preparationDay beforeWeek beforeMonth beforeOver one month before
4. Do you use any test preparation materials to prepare your students for the mandated standardized test you have selected? If no or don’t know, then skip to Section E. If yes, check ALL the materials that you use, and whether the decision was made by yourself, the administration, or both (fill in both circles).
State Developed MaterialsDistrict Developed MaterialsCommercially Developed Materials
Please List Names of all Commercially Developed Materials
5. How similar is the content of the test preparation materials you use to the content of the mandated standardized test you selected?
Very similarQuite similarSomewhat similarQuite dissimilarVery dissimilar
1. Did you receive test results for the state or district mandated standardized test selected on page 3 that was given to your class last year?
YesNo
2. How often do you refer to the results of the selected state or district mandated standardized test in your own work with students in this class?
Daily2-3 times a weekOnce a week1-3 times a month1-3 times a yearAlmost never
8. In your opinion, how important is the state or district mandated standardized test you selected to administrators when they make the following decisions? Please rate each decision below with the following codes:
Placement in gifted and talented Placement in special services Placement in remediation Promotion/retention in grade Determine graduation from high school Group students by ability in a grade Recommend textbook Curriculum planning Feedback to students Feedback to parents Teacher evaluation Teacher merit pay Instructional program evaluation School evaluation District evaluation
1. How do you prepare your students for the mandated standardized test you selected on page 3? Indicate ALL that apply:
I do no special test preparation.I teach test-taking skills.I encourage students to work hard andprepare.I use materials that motivate students todo well.I provide rewards for test completion.I teach topics known to be on the test.I provide test-specific preparation materials.I provide students with similar items.I provide students with the same items.
2. Approximately how many class hours PERYEAR do you spend in preparing students to takethe mandated standardized test you selected?
None1-23-56-1011-2021-30More than 30
D Test Preparation
E Reporting of Test Results
Extrem
ely Important
Very Important
Som
ewhat Im
portant
Minim
allyImportant
Not Im
portant
Page 4

For questions 1-3, please indicate separately yourresponses for the state or district mandated standardizedtest you selected on page 3 and for text-supplied teststhat you use for this class (tests supplied by the publisherof the textbook you are using, separately packaged or inthe text). Indicate “not applicable” if a particular typeof test is not administered to your students.
1. How similar is the content of your primary text and the content of the following tests?
Mandated standardized test Text-supplied tests
Relationship of Testing toCurriculum, Instruction
and Evaluation 2. How similar is the content of your instruction and the following tests?
Mandated standardized test Text-supplied tests
3. How accurate are the following tests in measuring what your students REALLY know and can do?
Mandated Standardized test Text supplied tests
F
4. To what extent does the mandated standardized test you selected influence (a) you and your teaching, and (b) other teachers in your district?
TO WHAT EXTENT DOES THE MANDATEDTEST SELECTED INFLUENCE.....
The inclusion of topics not otherwise taught The exclusion of topics otherwise taught Increasing the emphasis on certain topics Decreasing the emphasis on certain topics The content of tests you and/or your colleagues have built The format of tests you and/or your colleagues have built
5. To what extent do text-supplied tests influence (a) you and your teaching, and (b) other teachers in your district
TO WHAT EXTENT DO TEXT-SUPPLIED TESTS INFLUENCE .....
The inclusion of topics not otherwise taught The exclusion of topics otherwise taught Increasing the emphasis on certain topics Decreasing the emphasis on certain topics The content of tests you and/or your colleagues have built The format of tests you and/or your colleagues have built
Very Sim
ilarQ
uite Sim
ilarS
omew
hat Sim
ilar
Quite D
issimilar
Very Dissim
ilarN
ot Applicable
Very Sim
ilarQ
uite Sim
ilarS
omew
hat Sim
ilar
Quite D
issimilar
Very Dissim
ilarN
ot Applicable
Very Accurate
Fairly Accurate
Som
etimes A
ccurate
Fairly Inaccurate
Very InaccurateN
ot Applicable
A Lot
Som
e
None
Not A
pplicable
A Little
A Lot
Som
e
None
Not A
pplicable
A Little
AFOR
YOURSELF
BFOR OTHERTEACHERS
A Lot
Som
e
None
Not A
pplicable
A Little
A Lot
Som
e
None
Not A
pplicable
A Little
AFOR
YOURSELF
BFOR OTHERTEACHERS
Page 5
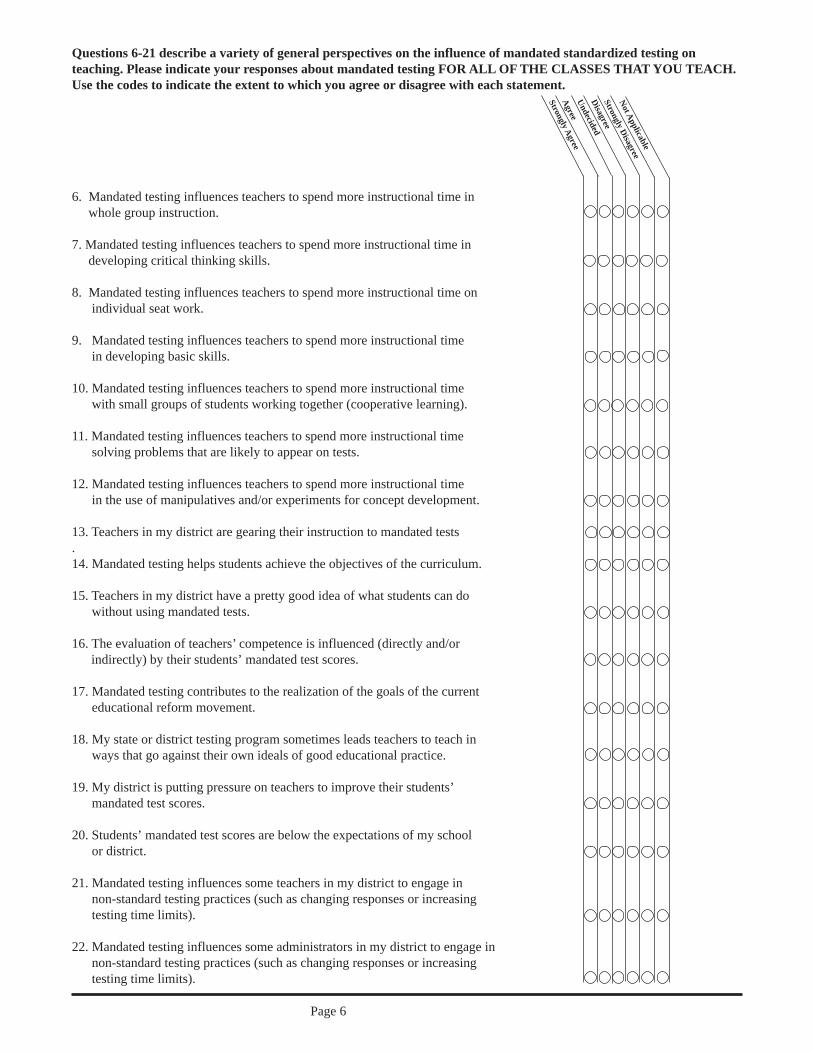
Questions 6-21 describe a variety of general perspectives on the influence of mandated standardized testing onteaching. Please indicate your responses about mandated testing FOR ALL OF THE CLASSES THAT YOU TEACH.Use the codes to indicate the extent to which you agree or disagree with each statement.
6. Mandated testing influences teachers to spend more instructional time in whole group instruction.
7. Mandated testing influences teachers to spend more instructional time in developing critical thinking skills.
8. Mandated testing influences teachers to spend more instructional time on individual seat work.
9. Mandated testing influences teachers to spend more instructional time in developing basic skills.
10. Mandated testing influences teachers to spend more instructional time with small groups of students working together (cooperative learning).
11. Mandated testing influences teachers to spend more instructional time solving problems that are likely to appear on tests.
12. Mandated testing influences teachers to spend more instructional time in the use of manipulatives and/or experiments for concept development.
13. Teachers in my district are gearing their instruction to mandated tests.14. Mandated testing helps students achieve the objectives of the curriculum.
15. Teachers in my district have a pretty good idea of what students can do without using mandated tests.
16. The evaluation of teachers’ competence is influenced (directly and/or indirectly) by their students’ mandated test scores.
17. Mandated testing contributes to the realization of the goals of the current educational reform movement.
18. My state or district testing program sometimes leads teachers to teach in ways that go against their own ideals of good educational practice.
19. My district is putting pressure on teachers to improve their students’ mandated test scores.
20. Students’ mandated test scores are below the expectations of my school or district.
21. Mandated testing influences some teachers in my district to engage in non-standard testing practices (such as changing responses or increasing testing time limits).
22. Mandated testing influences some administrators in my district to engage in non-standard testing practices (such as changing responses or increasing testing time limits).
Strongly A
greeA
greeU
ndecidedD
isagreeS
trongly Disagree
Not A
pplicable
Page 6
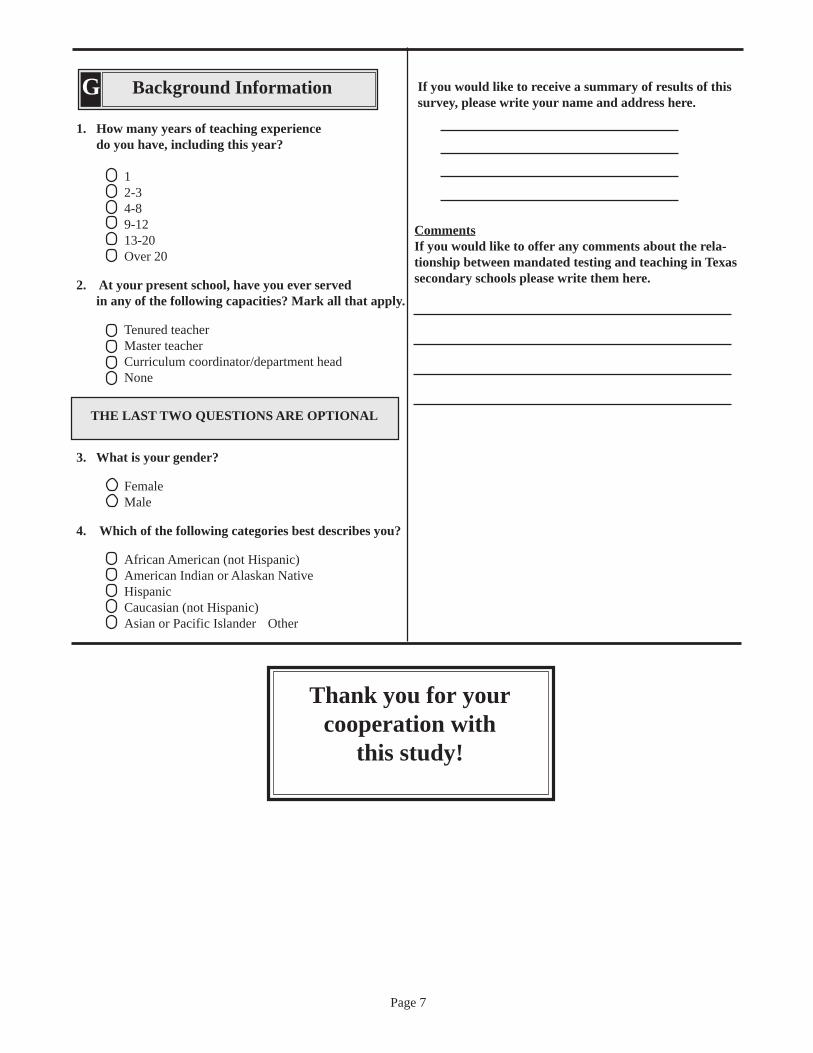
1. How many years of teaching experience do you have, including this year?
12-34-89-1213-20Over 20
2. At your present school, have you ever served in any of the following capacities? Mark all that apply.
Tenured teacherMaster teacherCurriculum coordinator/department headNone
3. What is your gender?
FemaleMale
4. Which of the following categories best describes you?
African American (not Hispanic)American Indian or Alaskan NativeHispanicCaucasian (not Hispanic)Asian or Pacific Islander Other
If you would like to receive a summary of results of this survey, please write your name and address here.
CommentsIf you would like to offer any comments about the rela-tionship between mandated testing and teaching in Texassecondary schools please write them here.
G Background Information
Thank you for yourcooperation with
this study!
Page 7
THE LAST TWO QUESTIONS ARE OPTIONAL
TT SurveyComments, 7/30/2004, p. 1 of 5.
TT Comments (F: TT Comments) Case nos. and verbatim comments written in on survey form by Texas teachers who responded to survey so that it was received at Boston College before 6/30/99. All comments including indications of emphasis (such as underlining and asterisks) are exactly as teachers wrote them. In brackets at end of each comment is the case ID number. 3 Teachers too many times teach to the test (TAAS) which measures very basic skills; critical thinking and analysis are ignored. I rarely if ever let the word TAAS into the classroom. Teachers fear repercussion from test scores, and TAAS takes over. I've been lucky; my students usually pass the first time even though I NEVER teach the test. [814] 5 It seems to workout fairly well for most us with TAAS, however, the end of course test are not that useful. [826] 8 Too many tests for 12th grade, college-bound students! EXIT TAAS, SAT, ACT, TASP!!! $$[504] 11 I teach Algebra II. I usually have seniors. My subject goes above and beyond almost all Exit TAAS objectives. This MATH EXIT TAAS should be given to 8th graders. I believe it is a good 8th grade test. I believe this is where they should be retained for failing and remediated. When they can pass it, then they can go on to Algebra, Geometry, etc. [473] 13 Texas has the "Texas Assessment of Academic Skills" test. Most schools have established a class strictly for the TAAS test. Our curriculum is based on previous TAAS test questions. We "teach the TAAS" in our classes. Our administrators have even gone as far as incorporating TAAS objectives and materials into daily instruction in ALL subject areas. We are not covering skills for higher level thinking at times because of state mandated tests. [451] 17 TAAS results haven't had the desired effect. It is used more as a "HAMMER" rather than a tool to improve. [497] 20 Testing is now more important than teaching. Students learn much about testing, little about subject. [380] 25 Teaching directly to TAAS takes up too much class time. Because of this and being on a block schedule, we eliminate much test material. We lose about 1 week per 6 weeks on block schedule. *There are too many students in class to
TT SurveyComments, 7/30/2004, p. 2 of 5.
give individual help during class time and most students won't come in for tutorials. [515] 29 We are testing our students to death! My students have been taken out of class four times this year for standardized testing. Too MUCH! (and for what?) [375] 32 TAAS is testing minimal skills learned in 7th grade so schools lower expectations in high school. Where I teach, 90+% pass all sections first attempt so we don't do much "teaching the test" [754] 33 I have a great concern about Special Ed students required to take the same test and same scoring as regular students. Not valid results; Special Ed has reduced and modified curriculum needs [180] 34 I believe there is a purpose for these tests. If nothing else, it gives teachers goals for their students. But I do not believe my teaching competence should be based on those scores solely. If students came to middle school with basic knowledge, then emphasis wouldn't be placed. Unfortunately, way too many students start 7th grade reading, vocabulary and writing far below 7th grade work. My 3rd/4th grade! [58] 35 Send this in the middle of the year — I don't have time, or interest in this on the last day of school!!! [Note case with this comment deleted from analysis sample because of no other responses] [82] 36 It is hard to include testing material and curriculum in the short time that we have. I teach math and I feel that we bear a lot of responsibility compared to other departments. For ex., the Biology EOC does not demand the knowledge that Algebra EOC does. We are also responsible for [540] 38 Our classes are too large for teaching to be very effective. [177] 39 I am not against mandated testing; but every time we work out a procedure for balancing the teaching, the state moves the test to a different grade level. We have it working well now, and now they're talking about moving it to 9th & 11th instead of 10th. [42] 41 I think it is important that you also know that our district uses the Saxon Math Series for a text. [681] 42 There are too many loopholes. Students who were never on an IEP or in CM are being forced into it so that they will be exempt from standardised tests. [590]
TT SurveyComments, 7/30/2004, p. 3 of 5.
44 The mandated TAAS test is the driving force for curriculum in my district. [752] 45 I feel that it wastes my students’ time. 98% of the students in my school passed the TAAS test this year. [262] 50 I teach TAAS Math class, (students who failed math TAAS in 7th grade, take my TAAS math class in the 8th grade.) So the results of mandated testing ever very important to me.[93] 53 I consider state mandated testing a necessary evil. Helpful sometimes—a burden others. [880] 59 I feel that these results should be sent to all teachers who received this questionnaire.[866] 60 We need testing for evaluation purposes, I just wish "the test" was not the driving force behind the set curriculum. [330] 66 The TAAS test is driving the curriculum and not teaching students how to think. It also punishes ESL students—they can complete four years of high school with adequate grades but not be allowed to walk at graduation because they do not have enough command of English to pass the TAAS Exit. [747] 67 Mandated state TAAS Testing is driving out the best teachers who refuse to resort to teaching to a low level test! [790] 68 It is a good example of the tail wagging the dog. [24] 70 Most schools in our area spend the two months prior to EXIT Test "getting ready" instead of teaching core curriculum. Students enter 9th grade with skills far below average, but they have never been held back. The system should include exit tests at every level!!! [369] 73 I do believe that in 8th grade we've tested on so many objectives that we don't have time to "have fun" learning by concentrating on a few areas to teach well! [647] 79 I believe that test results can be useful, but I'd like to see them used more as a resource than "report card." [103] 80 I teach all advanced placement classes and do not use textbooks other than grammar review. [20]

TT SurveyComments, 7/30/2004, p. 4 of 5.
83 The pressure to perform well on state mandated tests is enormous on both the students & teachers. Perhaps I misunderstood questions 21 & 22. Are you asking if my district condones cheating? Absolutely not, the repercussions for that are very severe in this state. [173] 84 I personally wonder about the fairness of these tests. Children from lower SES tend not to do as well. Therefore, it tends to be discriminatory I think. I think some children do not have the cultural experiences that help them answer the questions accurately. [ID chopped off] 87 TAAS has become the Be All and End All. It is ridiculous to put so much on one test, where even good students have been known to guess and not even read the question. I have seen them. Our school can be at risk because one student chooses to mess up. One year we were on probation for 1 student over the limit. [709] 93 Mandated testing has severely damaged the mathematics curriculum! [898] 94 I think that most teachers that teach the grade level in which the test is given are fed up with the pressure of the TAAS test. We just want to teach the children. If that is done well then the test results should fall into place. Just let us teach! [331] 98 TAAS Rules! [300] 101 Tests are directing the schools, To give this survey in May when attempting to finish grades is not really very smart. I wasn’t very cooperative! [887] 103 Note - As a private school we are not subjected to mandated tests—(TAAS). However, all our students take the SAT or ACT, so we often teach the type of problems often encountered there. [486] 104 Teaching to the TAAS results in a level of education which is substandard. I strongly feel TAAS should be abolished. [921] 106 Mandated, state, teacher or whatever hardly measures what students are capable of or achieved for that matter. Oral assessment or merely, discussing with students’ paints a far greater understanding of what is important. [978] 116 Get rid of mandated testing! [14]
TT SurveyComments, 7/30/2004, p. 5 of 5.
118 I have found the T.A.A.S. test to be helpful in focusing my efforts on basic skills, and at the same time not overly restrictive in allowing me the freedom to employ group activities and critical thinking activities in my instruction. [708] 121 The questions and answers involving textbooks may change, because we are adopting a new math textbook next year. The new texts are geared more to the TAAS. The TAAS objectives are our curriculum. It seems as if we live and breathe for the TAAS test. [881] 123 Mandatory tests are hard on both teachers and students. Our state set the End of Course test one week before semester finals. The stress level for all of us is high. The end of school in itself is difficult. Why do we compound the situation by adding another useless test. Our state is also taking the EOCourse test out of the schedule. They are replacing the EOC with another TAAS test. At least the EOC covered current material. Now extra work is added because the TAAS covers different areas than Algebra essential elements. [211] 130 We are so concerned about the TAAS & End of Course exam that we are teaching the test, but the kids are not learning the material. I can teach the test, and have a very high percentage pass, yet have kids that know no Algebra. Going to three years TAAS testing in the future will reduce education to completely teaching the test, and we will graduate an illiterate generation. [675] 133 I really feel that we are definitely getting away from teaching the basic concepts to teaching the test and this is very sad because the farther the student goes in mathematics the less he or she knows of the why's [354] 139 If students are required to pass the TAAS test for grade promotion, then remove the pass/fail meeting clause (parent, administration and teacher) for it has NO validity. Give academic accountability to this TAAS test, or throw it out. If a student fails, the parent whines & signs an agreement and the student is passed. If students have concrete consequences, the public will stop screaming [159] 142 Even though many districts "teach the test," we have found that teaching at a higher level, using a variety of strategies and materials, removes the necessity of focusing on a single test. [660] 144 I feel testing should be a diagnostic tool ONLY. FAR too much importance is placed on it, taking time away from more meaningful learning experiences [829] 147 It stiffles professional growth and academic growth as well. Too much emphasis on testing. [Pointing to her response to G2-D that she has never served

TT SurveyComments, 7/30/2004, p. 6 of 5.
in any of the categories, she writes] Not by choice—My administrator thinks I am not capable, she acts like she doesn't care for my accent or my teaching style. [915]

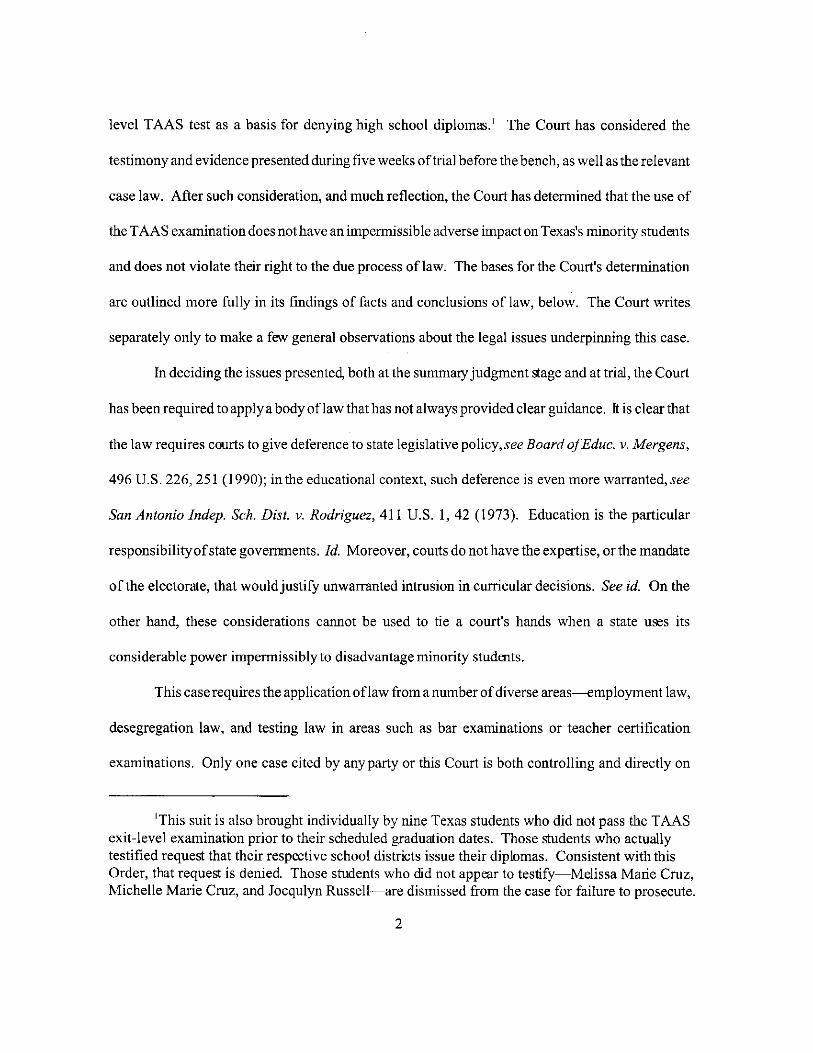

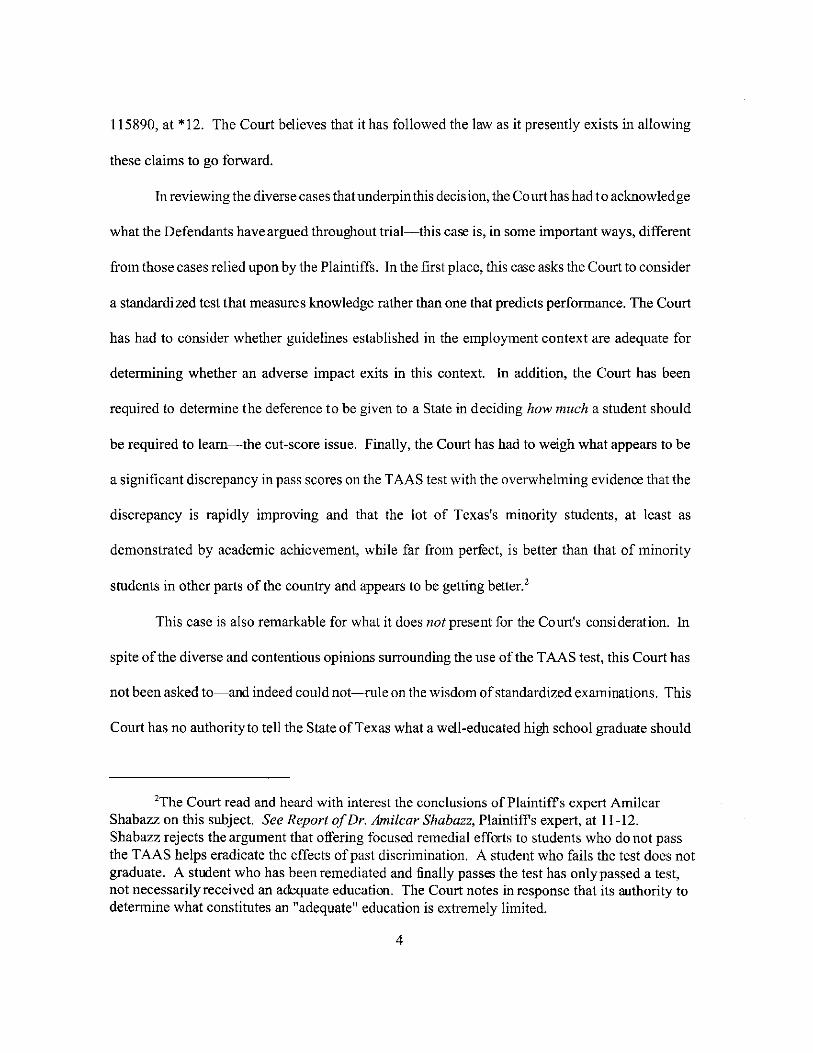


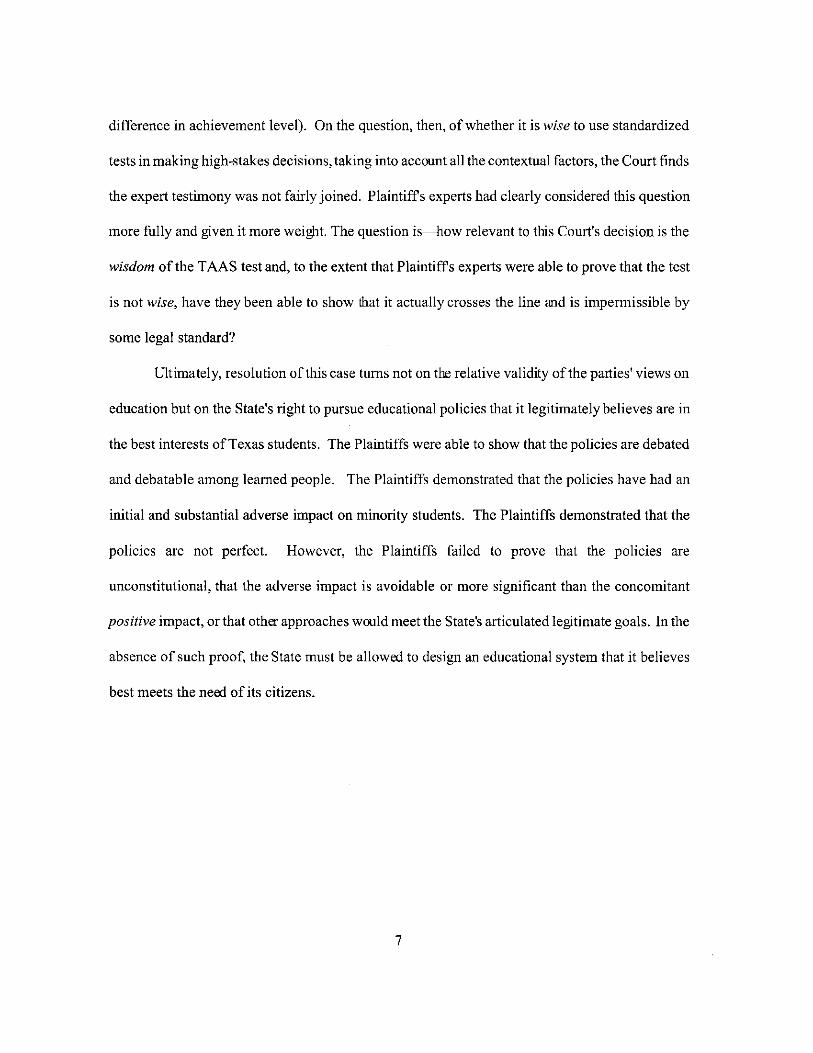
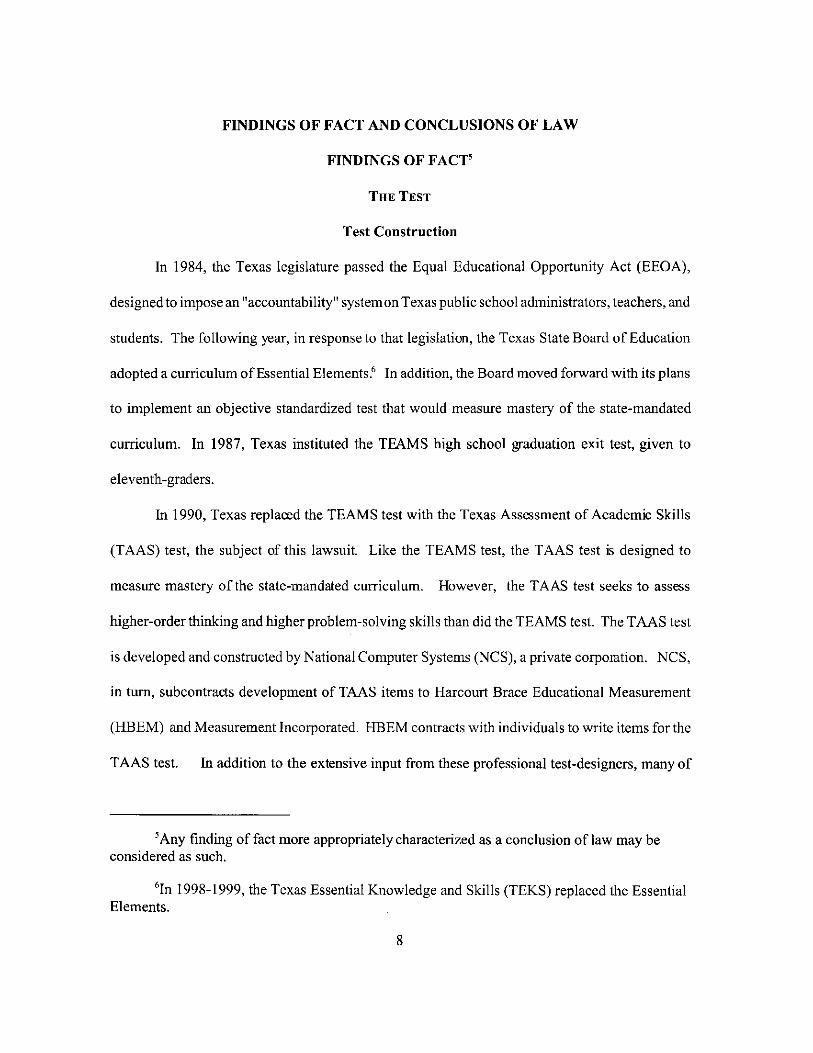


IN THE UNITED STATES DISTRICT COURT FOR THE WESTERN DISTRICT OF TEXAS
SAN ANTONIO DIVISION GI FORUM, IMAGE DE TEJAS, § RHONDA BOOZER, MELISSA § MARIE CRUZ, MICHELLE MARIE § CRUZ, LETICIA ANN FAZ, § ELIZABETH GARZA, MARK § GARZA, ALFRED LEE HICKS, § BRANDYE R. JOHNSON, § JOCQULYN RUSSELL § § Plaintiffs, §
§ V. §
§ Civil Action No. SA-97-CA-1278EP TEXAS EDUCATION AGENCY, § DR. MIKE MOSES, MEMBERS § OF THE TEXAS STATE BOARD § OF EDUCATION, in their official § capacities, §
§ Defendants. §
PLAINTIFFS’ POST-TRIAL BRIEF
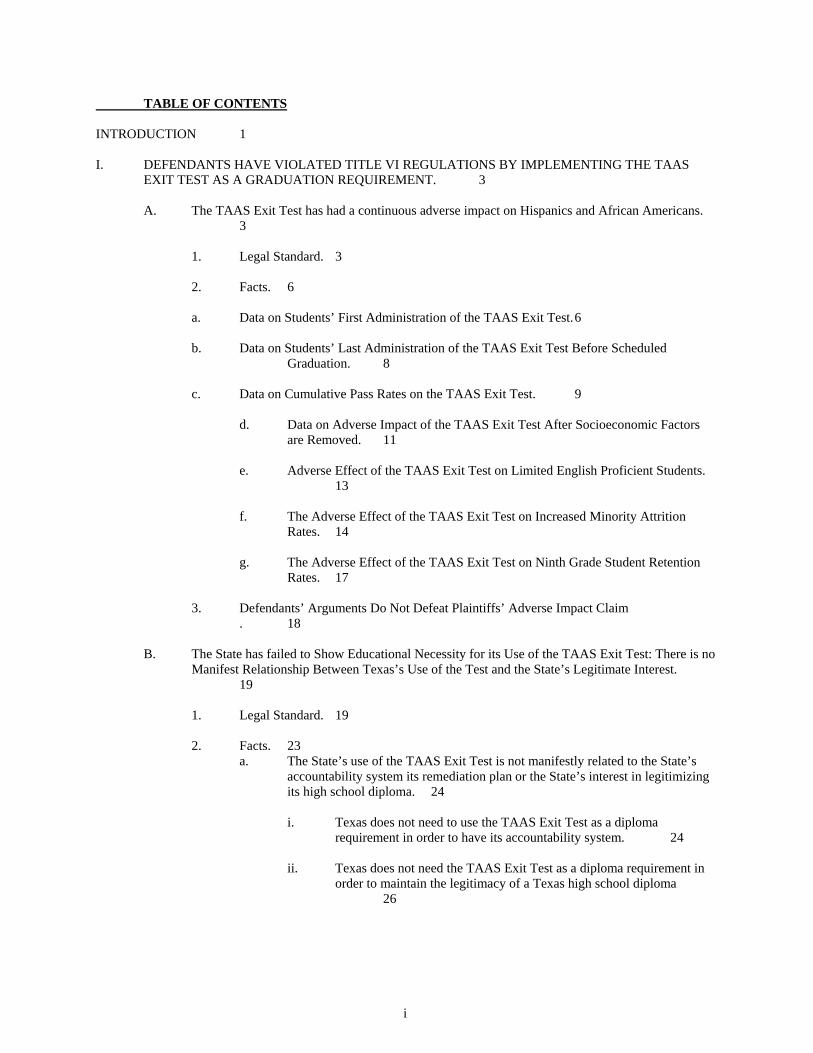
i
TABLE OF CONTENTS INTRODUCTION 1 I. DEFENDANTS HAVE VIOLATED TITLE VI REGULATIONS BY IMPLEMENTING THE TAAS
EXIT TEST AS A GRADUATION REQUIREMENT. 3 A. The TAAS Exit Test has had a continuous adverse impact on Hispanics and African Americans.
3 1. Legal Standard. 3
2. Facts. 6
a. Data on Students’ First Administration of the TAAS Exit Test. 6
b. Data on Students’ Last Administration of the TAAS Exit Test Before Scheduled Graduation. 8
c. Data on Cumulative Pass Rates on the TAAS Exit Test. 9
d. Data on Adverse Impact of the TAAS Exit Test After Socioeconomic Factors are Removed. 11
e. Adverse Effect of the TAAS Exit Test on Limited English Proficient Students.
13 f. The Adverse Effect of the TAAS Exit Test on Increased Minority Attrition
Rates. 14
g. The Adverse Effect of the TAAS Exit Test on Ninth Grade Student Retention Rates. 17
3. Defendants’ Arguments Do Not Defeat Plaintiffs’ Adverse Impact Claim . 18
B. The State has failed to Show Educational Necessity for its Use of the TAAS Exit Test: There is no Manifest Relationship Between Texas’s Use of the Test and the State’s Legitimate Interest. 19
1. Legal Standard. 19 2. Facts. 23
a. The State’s use of the TAAS Exit Test is not manifestly related to the State’s accountability system its remediation plan or the State’s interest in legitimizing its high school diploma. 24
i. Texas does not need to use the TAAS Exit Test as a diploma
requirement in order to have its accountability system. 24 ii. Texas does not need the TAAS Exit Test as a diploma requirement in
order to maintain the legitimacy of a Texas high school diploma 26
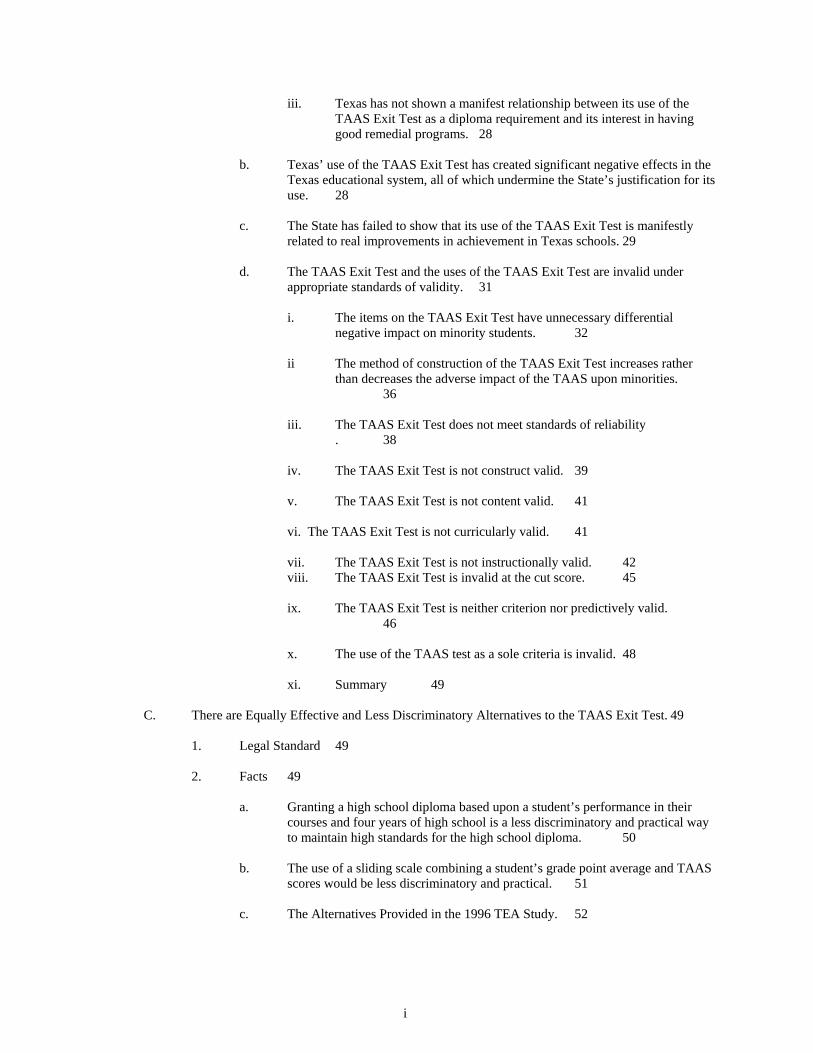
i
iii. Texas has not shown a manifest relationship between its use of the TAAS Exit Test as a diploma requirement and its interest in having good remedial programs. 28
b. Texas’ use of the TAAS Exit Test has created significant negative effects in the
Texas educational system, all of which undermine the State’s justification for its use. 28
c. The State has failed to show that its use of the TAAS Exit Test is manifestly
related to real improvements in achievement in Texas schools. 29
d. The TAAS Exit Test and the uses of the TAAS Exit Test are invalid under appropriate standards of validity. 31
i. The items on the TAAS Exit Test have unnecessary differential
negative impact on minority students. 32 ii The method of construction of the TAAS Exit Test increases rather
than decreases the adverse impact of the TAAS upon minorities. 36
iii. The TAAS Exit Test does not meet standards of reliability . 38 iv. The TAAS Exit Test is not construct valid. 39
v. The TAAS Exit Test is not content valid. 41
vi. The TAAS Exit Test is not curricularly valid. 41
vii. The TAAS Exit Test is not instructionally valid. 42 viii. The TAAS Exit Test is invalid at the cut score. 45
ix. The TAAS Exit Test is neither criterion nor predictively valid.
46 x. The use of the TAAS test as a sole criteria is invalid. 48
xi. Summary 49
C. There are Equally Effective and Less Discriminatory Alternatives to the TAAS Exit Test. 49
1. Legal Standard 49 2. Facts 49
a. Granting a high school diploma based upon a student’s performance in their courses and four years of high school is a less discriminatory and practical way to maintain high standards for the high school diploma. 50
b. The use of a sliding scale combining a student’s grade point average and TAAS
scores would be less discriminatory and practical. 51 c. The Alternatives Provided in the 1996 TEA Study. 52

ii
d. The State Board of Education considered several alternatives in 1992 and 1993 that would have been less discriminatory and practical.
53 e. Several other alternatives suggested by witnesses. 53
II DEFENDANTS HAVE VIOLATED THE DUE PROCESS CLAUSE OF THE U.S. CONSTITUTION BY
IMPLEMENTING THE TAAS EXIT TEST AS A GRADUATION REQUIREMENT. 54 III. CONCLUSION: PLAINTIFFS REQUEST INJUNCTIVE RELIEF. 55
2
NOW COME Plaintiffs, G. I. Forum, et al., and file this post-trial brief in support of their request for declaratory and injunctive relief against the State of Texas’ use of the TAAS Exit Test as a graduation requirement. The State’s use of the TAAS Exit Test violates regulations promulgated pursuant to Title VII, 34 C.F.R. § 100.3, and the Due Process Clause of the United States Constitution. As support for their arguments Plaintiffs submit the following:
INTRODUCTION
The TAAS Exit Test wreaks havoc with the educational opportunities of the State’s African American and
Hispanic students. The results of the TAAS Exit Test since its implementation in the State demonstrate that African
American and Hispanic students consistently do worse than whites, whether the results are viewed on a single
administration or cumulative basis.
The TAAS Exit Test has even more insidious effects on students who may not even have taken the test.
Because the test is touted as a part of the State’s accountability system, school districts, schools and teachers have an
incentive to encourage student retention or to exempt students in order to “improve” TAAS Exit Test performance.
High retention rates, in turn, have led to overaged students in high school, which is a major reason for increased
drop out rates. In addition, schools have tended to focus on the “bubble kids” on the cusp of passing the TAAS Exit
Test rather than students who need much more help reaching the passing score of 70. These students — the
retained, the tracked, the limited English proficient, the drop outs — all tend to fall through the cracks of the State’s
accountability and educational system. It is no wonder that they cannot pass the TAAS Exit Test. It is on behalf of
these “olvidados” and “desaparecidos” — victims of an educational system harmful and arbitrary in its effect on
minority students — that Plaintiffs seek relief from the TAAS Exit Test requirements.
The State has failed to show how the TAAS Exit Test meets the standard of educational necessity. Because
the TAAS Exit Test is an invalid test, it cannot serve in a significant way the State’s goals of determining whether
students have mastered higher order thinking skills. The State has the duty to show that the material covered on the
test is covered in the State’s classrooms – including its lower educational tracks and its ESL tracks. The Court must
scrutinize the State’s duty more carefully when the State has a history of past discrimination, as does the State of
Texas. As described below, Plaintiffs have demonstrated that the State did not ensure that the material covered by
this test was actually taught in the classrooms across the State. Plaintiffs, in turn, have met their burden of showing
that there are equally effective and less discriminatory alternatives to the TAAS Exit Test.

3
It is important to note that Plaintiffs are not asking the Court to diminish educational standards or to make
decisions about educational policy. Contrary to Defendants’ arguments during trial, Plaintiffs are not against high
standards. Fifth Circuit law governing the use of standardized tests in this context requires that Plaintiffs show that
the test has an adverse impact, there are less discriminatory alternatives and that the test is invalid. The Plaintiffs
have met their burden. On the other hand, the State has failed to show that its test is educationally necessary and
that it did what was necessary to ensure that the test fairly covers what the State’s children are taught. The Court
has the power and the duty to strike down educational policies such as the use of the TAAS Exit Test as a graduation
requirement when those policies unnecessarily infringe on students’ constitutional and statutory rights. Plaintiffs
ask this Court to take that step here.

4
I. DEFENDANTS HAVE VIOLATED TITLE VI REGULATIONS BY IMPLEMENTING THE TAAS EXIT TEST AS A GRADUATION REQUIREMENT. A. The TAAS Exit Test has had a continuous adverse impact on Hispanics and African
Americans. " \l 2
1. Legal Standard.
Title VI requires that any recipient of federal funding refrain from discriminating on the basis of race,
color, or national origin. 42 U.S.C. 2000d. The Department of Education regulations promulgated under Title VI
require that:
A recipient, in determining the types of services, financial aid, or other benefits, or facilities which will be
provided under any such program, or the class of individuals to whom, or the situations in which, such
services, financial aid, other benefits, or facilities will be provided under any such program, or the class of
individuals to be afforded an opportunity to participate in any such program, may not, directly or through
contractual or other arrangements, utilize criteria or methods of administration which have the effect of
subjecting individuals to discrimination because of their race, color, or national origin, or have the effect of
defeating or substantially impairing accomplishment of the objectives of the program as respect individuals
of a particular race, color, or national origin.
34 C.F.R. 100.3(2)
The TAAS Exit Test is a criterion or method of administration of a program that has the effect of defeating
or substantially impairing the ability of minorities to graduate from high school. As with Title VII cases, Plaintiffs
must identify the specific practice that is being challenged. See, e.g., Wards Cove Packing Co. v. Atonio, 490 U.S.
642, 656 (1989). In this case, the discriminatory practice is the State’s use of the TAAS Exit Test as a high school
graduation requirement. A student’s failure to pass the TAAS Exit Test bars him from eligibility for graduation.
Plaintiffs must simply show by a preponderance of the evidence that this facially neutral practice has a racially
disproportionate effect. See Quarles v. Oxford Municipal Sep. School Dist., 868 F.2d 750, 754 n.3 (5th Cir. 1989);
Georgia State Conf. of Branches of NAACP v. Georgia, 775 F.2d 1403, 1417 (11th Cir. 1985); Larry P. v. Riles, 793
F.2d 969, 982 (9th Cir. 1981). In this case, each administration of the TAAS Exit Test denies thousands of minority1
students the ability to graduate from high school.
1 Plaintiffs’ use of the term “minority” in this brief refers to African Americans and Hispanics.
5
Case law suggests that the relevant inquiry into whether the TAAS Exit Test has a disparate impact is a
review of single administration passing rates on the exit test. Connecticut v. Teal, 457 U.S. 440, 102 S.Ct. 2525
(1982); Richardson v. Lamar Cty. Bd. of Educ., 729 F.Supp. 806 (M.D. Ala. 1989). In Connecticut v. Teal, for
example, the Plaintiffs challenged the state’s ability to rely on a written examination to determine welfare
supervisors’ promotions. Connecticut v. Teal, 457 U.S. 440, 102 S.Ct. 2525 (1982). The evidence in that case
showed that while more African Americans than whites failed the exam, African American employees were
promoted in greater numbers than whites. The Supreme Court rejected the “bottom line” defense, stating that it was
appropriate to focus on the disparate impact caused by the challenged test requirement. The disparate impact
analysis should focus, therefore, on the “effect of each component of a selection system, even though the impact of
the overall system is not racially disproportionate.” NAACP v. Town of Harrison, 904 F.2d 792, 801 (3d Cir. 1991)
(quotations omitted).
The court in Richardson v. Lamar Cty. Bd. of Educ. faced a case similar to the one at hand. There, the
Plaintiff claimed that a teacher certification test had a disparate impact on minority candidates. The Plaintiff
presented three types of test pass-fail data for the court’s review. One set of data was composed of total test
administration data which included information on multiple retakes by the same person. The court rejected that data
because it could not demonstrate adverse impact against individuals. The court rejected a second set of data that
included final candidate results because, “[t]o accept this data would amount to an acceptance of the proposition
that, regardless of how many times a candidate failed the test, she became a “success” as soon as she passed. Such a
proposition is erroneous because it fails to recognize that the initial failure was a discrete injury (citing Jenkins v.
United Gas Corporation, 400 F.2d 28, 31-32 (5th Cir. 1968)).” Richardson, 729 F. Supp. at 816. The court
determined that the most appropriate way to analyze the disparate impact case before it was to review the pass-fail
rates of persons taking the test for the first time. Similarly, in this case, the most appropriate method of determining
the effect of the TAAS Exit Test is to compare the pass-fail rates of students who are first exposed to the test in high
school.
Adverse impact can be determined by one of several statistical tests. The EEOC’s 80% Rule, 29 C.F.R.
§1607.4(d), is used as a rule of thumb. Even under the EEOC guidelines, however, ratios greater than 80% may
nevertheless constitute adverse impact in circumstances where the differences are significant in both practical and
6
statistical terms. Id. In fact, the EEOC specifically recommended utilizing tests of statistical significance instead of
relying on the 80% rule where large populations were being measured. See 44 Fed. Reg. 11999.244 Fed. Reg.
11999. Methodologies such as the test for differences between independent proportions (e.g., the Shoben test) have
been found appropriate by courts to find adverse impact in cases involving differential pass-fail rates on
standardized tests. See e.g., Bew v. City of Chicago, 979 F. Supp. 693, 696 (N.D. Ill. 1997). It is prima facie
2 The EEOC Interpretation of the Uniform Guidelines on Employee Selection Practices at 44 Fed. Reg. 11999 states, in relevant part:
Where large numbers of selections are made, relatively small differences in selection rates may nevertheless constitute adverse impact if they are both statistically and practically significant. . . . For that reason, if there is a small difference in selection rates (one rate is more than 80% of the other), but large numbers of selections are involved, it would be appropriate to calculate the statistical significance of the difference in selection rates.
In addition, the EEOC Interpretation explains the meaning of practical significance in the context of large numbers of selections:
If for the sake of illustration, we assume that nationwide statistics show that use of an arrest record would disqualify 10% of all Hispanic persons but only 4% of whites other than Hispanic, the selection rate for that selection procedure is 90% for Hispanic and 96% for non-Hispanics. Therefore, the 4/5 rule of thumb would not indicate the presence of adverse impact. . . But in this example, the information is based upon nationwide statistics, and the sample is large enough to yield statistically significant results, and the difference (Hispanics are 2 ½ times as likely to be disqualified as non-Hispanics) is large enough to be practically significant.

7
evidence of disparate impact if the results of such a test yield a Z-score of more than two or three standard
deviations. Castañeda v. Partida, 430 U.S. 482, 496 n.17 (1977).3
1. Facts.
A review of the following sets of data demonstrate that the TAAS Exit Test has an adverse impact on
African Americans and Mexican Americans:
a. The first administration of the test in the students’ tenth grade year.
b. The last administration of the test at the end of the students’ senior year.
3 The Z scores in this case are greater than 50, as opposed to the 2 or 3 standard deviations referred to in Castaneda.
c. The cumulative pass rates of students.
d. The adverse impact on minority students considered as a subpopulation group, i.e. excluding low
income students, LEP students, etc.
In addition, the TAAS Exit Test has caused increased attrition rates, increased retention in the ninth grade,
and has had negative effects on the curriculum.
a. Data on Students’ First Administration of the
TAAS Exit Test.
8
Since the field test data on the TAAS Exit Test was presented in 1990, there has been a consistent adverse
impact on minorities on the TAAS Exit Test on the first administrations of the test every year. Haney test.; Fassold
test.; Phillips test.; Haney report, PX 36; Haney suppl. report, PX 52; PX 44; Fassold report, Phillips report, DX 316
at p. 13; FOF ¶¶ 39-40, 43.4
The results of the first administration of the TAAS Exit Test on first time, non-special education test takers
for 1993-1998 are summarized by TEA in its 1998 Biennial Report PX 257 at p. 6, as follows:
Grade 10, All Tests Taken
Source: Figure 1.2 “Percent Passing TAAS: Results by Student Groups,” A Report to the 76th Texas Legislature
from the Texas Education Agency: 1998 Comprehensive Biennial Report on Texas Public Schools, p. 6,
December, 1998, Plaintiff’s Exhibit 257.
Dr. Haney considered adverse impact by looking at three different criteria: (A) the eighty percent rule; (B)
tests of statistical significance; and (C) tests of practical significance. He defined practical significance both in
terms of the number of minorities who would have passed had their passing rates been the same as whites and by the
importance of the interest implicated by the test, i.e. receiving a high school diploma or being discouraged from
4 Plaintiffs’ and Defendants’ exhibits are hereinafter referred to as “PX __” and “DX__.” For convenience, Plaintiffs will refer to corresponding paragraphs of the Plaintiffs’ Proposed Findings of Fact and Conclusions of Law attached to the Pre-Trial Order, where appropriate, as “FOF ¶__.”
29%32%
38%
48%
55%
35% 37%44%
52%59%
67%70%
74%
81%85%
33% 35%42%
50%
58%
1994 1995 1996 1997 1998
0%10%20%30%40%50%60%70%80%90%
100%
African American Hispanic
White Economically Disadvantaged
9
continuing high school education. Dr. Haney concluded that under all three criteria, the first administration of the
TAAS Exit Test had an adverse impact on minorities. Haney report, PX 36.
Even Defendants’ witnesses conceded this adverse impact. Dr. Phillips admitted in her report and
testimony that when looking at first administrations there is adverse impact against minority students on the TAAS
Exit Test. Phillips test.; Phillips report, DX 316 at p. 13. While Dr. Mehrens and Dr. Treisman testified that the
only analysis they conducted was under the eighty percent rule,5 they in effect, agreed that for the first
administration (all tests taken) there is a continuous pattern of adverse impact on minorities from 1990 through
1999. DX 239; PX 278; PX 279; PX 280; PX 281.
In addition, the results of the alternative tests, i.e., the set of end-of-course tests that a student may pass to
avoid the TAAS Exit Test requirement, show significant adverse impact against Hispanic and African American
students. PX 257. Specifically, on the first “live test” of the Algebra I exam 40% of whites, 14% of Hispanics and
11% of African Americans passed the test. PX 257 at p. 10. On the latest administration of the Algebra I test, 52%
of whites, 26% of Hispanics and 20% of African Americans passed the test. Id. There was also significant adverse
impact in the results of the Biology alternative tests. PX 257 at p. 14, PX 210 at p. 14. a. Data on Students’ Last Administration of the
TAAS Exit Test Before Scheduled Graduation.
There has been a continuous adverse impact on African Americans and Hispanics at the last administration
of the TAAS Exit Test at the end of the students’ senior years. FOF ¶¶ 44-45; Fassold test.; Fassold report, PX 26
at p. 8-9. The final administration of the TAAS Exit Test has an adverse impact in terms of the eighty percent rule
and tests of statistical and practical significance. Id. Defendants’ witness, Dr. Treisman presented evidence that
there was, in fact, adverse impact on minorities at the last administration of the test.6
5 Neither Dr. Treisman nor Dr. Mehrens felt the eighty percent rule was appropriate yet they analyzed the data in terms of the eighty percent rule in response to Plaintiffs’ statistics. Defendants never offered what they thought was the appropriate test for determining statistical significance; they merely criticized Plaintiffs’ efforts.
6 Although Dr. Treisman concluded that the small numbers of students showed a “minimal” effect, his materials failed to include the numbers of students who dropped out of school before the end of their senior years or students who have given up and stopped taking the TAAS Exit Test after their junior year even though they have continued to remain in school and pass their courses.
10
In 1997 at the end of the twelfth grade, approximately ten thousand seniors were still taking the TAAS Exit
Test. Fassold report, PX 26. Of these, 87% were either Hispanic or African American. On this “final”
administration of the TAAS Exit Test, 41% of whites, 32% of African Americans and 27% of Hispanics passed the
test. Fassold test.; Fassold report, PX 26 at pp. 8-9.
Dr. Moses testified that there were at least 45,000 students since 1994 who would have completed their
high school diplomas but for the TAAS Exit Test. Moses test. And on a more local basis, Mr. Cooke, Mr. Billescas,
Ms. Gutierrez and Ms. Henderson stated that significant numbers of minority students were not able to get their high
school diplomas simply because of the TAAS Exit Test.
a. Data on Cumulative Pass Rates on the TAAS Exit
Test.
The TAAS Exit Test had an adverse impact upon African Americans and Hispanics in terms of their
respective cumulative passing rates. FOF ¶ 46. Regardless of which cumulative statistics or which methods of
analysis are used, there is still significant adverse impact. Haney test. Specifically, Dr. Haney analyzed both Dr.
Treisman’s cumulative statistics (the best case for the state) and Mr. Fassold’s cumulative statistics. Analyzing Mr.
Fassold’s data, Dr. Haney found violations of the eighty percent rule, very significant statistical differences, and
large differences of practical significance. Haney test.; Fassold test.; Fassold report, PX 27. Reviewing Dr.
Treisman’s analyses, Dr. Haney found very significant differences of practical and statistical significance even
though there was no violation of the eighty percent rule.7
Plaintiffs urge the court to adopt the analysis of cumulative passing rates performed by Mr. Fassold and to
reject the analysis performed by Dr. Treisman.8 Mr. Fassold based his data upon students whom local school
districts determined were to be tested on the TAAS Exit Test at the end of their sophomore years, i.e., all students in
regular attendance who are not exempt under TEA Rules and Regulations. He then calculated how many of these
7 Dr. Treisman agreed that there is significant practical significance to his cumulative statistics in terms of the actual negative effect on large numbers of minority students. Treisman test.
8 In either case, there is significant adverse impact on minorities on the cumulative statistics.

11
students eventually passed the TAAS Exit Test by the end of their senior years to determine that for 1997, 87%
white, 69% Hispanic and 66% African Americans passed the TAAS Exit Test on a cumulative basis.
Dr. Treisman’s statistics should not be given the same weight as Mr. Fassold’s. Dr. Treisman excluded
students who were determined by their local school districts to be required to take the test at the end of their
sophomore years but did not actually sit for the exam at that time.9 Dr. Treisman also excluded sophomore students
who have repeated their sophomore year and who have failed the test again. Treisman test. His numbers also
excluded students who took the test at the end of their sophomore years but were later determined by their special
education committees to be exempt from the test.10 Dr. Treisman admitted that his version of the cumulative
statistics show statistical and practical significance, even though he does not think that those tests apply.
Dr. Mehrens admitted that if Mr. Fassold’s cumulative passing rates are correct, there is indeed a violation
of the eighty percent rule and the appearance of adverse impact against minorities. Specifically, if, as Mr. Fassold
asserted, there is an 87% white cumulative passing rate, 69% Hispanic cumulative passing rate and 66% African
American cumulative passing rate, the cumulative passing rates violate the eighty percent rule. Mehrens test., PX
27. a. Data on Adverse Impact of the TAAS Exit Test
After Socioeconomic Factors are Removed.
Even after the usual factors for poor test performance are removed from the analysis, there are still very
significant differences between passing rates of African Americans, Hispanics and whites on the TAAS Exit Test.
Plaintiffs have presented an analysis of the passing rates of African Americans, Hispanics and whites after all
students who fit any one of ten categories (determined and designated by the Texas Education Agency) are removed
from the analysis.11 Particularly, Plaintiffs presented evidence that after removing students who fit one of the ten 9 Other statistics in the case show that these students who do not “appear” for the first testing are predominantly minority. See PX 28 at p. 13, n.10.
10 These numbers are particularly suspect. DX 333. Students who have not been identified as eligible for special education and are later determined special education exempt after failing the test raise the concern of arbitrary “reconsiderations.” These students are also predominantly minority students. Id.
11 These categories, often referred to as the real causes of test performance differences include: (1) economically disadvantaged; (2) eligible for Chapter I/Title I financial support; (3) participating in special education programs; (4) identified as At-Risk; (5) participating in vocational education programs; (6) foreign exchange students; (7) participating in bilingual education programs; (8) participating in ESL programs; (9) designated as limited English proficient; and (10) designated as migrant students.
12
categories, there are still violations of the eighty percent rule, statistical significance rule, and practical significance
rule. Fassold report, PX 26 at pp. 5-8; FOF ¶¶ 41-42. Specifically in 1997, of the 26,819 African Americans who
took the TAAS Exit Test at the first administration, only 5,047 (approximately 20%) did not fit into one of the above
categories. Of the 69,303 Hispanic students who first took the test only 6,821 (approximately 10%) did not fit into
any of the above categories. Of the 108,926 whites who took the TAAS Exit Test at the first administration, 40,341
(approximately 37%) did not fit into those categories. Fassold report, PX 26. Nevertheless of these “non-special”
students — students who one would expect to be the highest performers and the “cream of the crop” — 92% of
whites passed the TAAS Exit Test and only 76% of Hispanics and 64% of African Americans passed the TAAS Exit
Test. Fassold report, PX 26 at p. 8.12 The same pattern was exhibited in 1993, 1994, 1995, 1996, each of the other
years examined. Id. at pp. 6-8.
This analysis highlights a point made by many of Plaintiffs’ witnesses: even after taking out the other
factors for test score differences often offered by Defendants, there are still very significant differences in
standardized test performance based on race and national origin. Shapiro test.; Bernal test.; Haney test.
None of the Defendants’ witnesses attempted to control for outside factors in accounting for the adverse
effect of the TAAS Exit Test. Dr. Phillips, for example, admitted that she had not conducted any statistical test to
determine whether, after all of the factors are removed from the analysis, race and national origin are still major
factors explaining TAAS Exit Test scores. Neither officials from TEA’s TAAS contractors (Johnson and Denny)
nor the Texas Education Agency (Cruse) were aware of any TEA research looking at the effects of race on test
scores after appropriate controls for other factors.
It is reasonable to infer from this failure of proof by the Defendants that Plaintiffs’ numbers are correct.
The Defendants did not criticize Mr. Fassold’s numbers nor did they rebut his analysis. More important, Defendants
have failed to form an alternative analysis to support their theory that there are reasons other than differential
opportunity to learn and test bias for test performance differences. On the other hand, Plaintiffs produced
12 The passing rate for African Americans violates the eighty percent rule, and tests of statistical and practical significance. The passing rate for Hispanics violates the statistical significance rule and practical significance rule.

13
uncontroverted evidence that race is indeed a factor which explains the differences in test performance regardless of
socioeconomic or other factors. a. Adverse Effect of the TAAS Exit Test on Limited
English Proficient Students.
The TAAS Exit Test has an especially negative effect upon students of limited English proficiency. FOF ¶
47. Valenzuela report, PX 6; Cardenas report, PX 7; Valencia report, PX 23. Defendants’ reports show a
continuous pattern of extremely low passing rates for limited English proficient students on the TAAS Exit Test,
with no reduction in the gap between white scores and limited English proficient scores on the TAAS Exit Test.13
See, e.g., PX 257 at p. 7. Between 1994 and 1998 on all tests taken, LEP students “improved” from 14% passing to
26% passing. During the same time, white students went from 67% passing to 85% passing. PX 257 at p. 6.
Plaintiffs have presented detailed evidence that the large differences between passing rates of Hispanic
limited English proficient students and white students are statistically significant, practically significant and they
violate the eighty percent rule. The inappropriate use of the TAAS Exit Test for students of limited English
proficiency was explained by Dr. Valenzuela, Dr. Bernal and individual witnesses Billescas, Duarte-Noboa and
Gutierrez, as well as in Dr. Cardenas’ report, PX 7. Defendants’ witness Castañon agreed that students of limited
English proficiency had problems with the TAAS Exit Test math problems even though they knew the mechanics of
mathematics.
On the other hand, Dr. Porter’s testimony about the appropriateness of the TAAS Exit Test for LEP
students carries no weight. It is not based on any knowledge or experience with Texas bilingual education programs
or Texas education. Her recommendation that students of limited English proficiency could appropriately take the
TAAS Exit Test after only one or two years of English instruction were not even accepted by the Massachusetts
commission on which Dr. Porter sits, and it contradicts the testimony of Drs. Valenzuela, Bernal, Valencia and
Cardenas that up to seven years of English instruction is necessary. Indeed, in Massachusetts, LEP students have a
13 Defendants made much of the decreasing gap between minority and white TAAS Exit Test scores. This argument is of very little validity. White scores were much higher than minority scores when the TAAS Exit Test was first implemented. As Mr. Cruse testified, whites “didn’t have very far to go” while minority scores had a lot of “room to grow” because they were much lower. Nevertheless, even under this rosy picture of reduced gaps, there has been no reduction in gap between LEP scores and white scores. PX 257 at p. 6.

14
three-year exemption from taking the exit test. In addition, the Massachusetts exit test actually includes a Spanish
exit test as well as an English exit test. Porter test. f. The Adverse Effect of the TAAS Exit Test on Increased Minority Attrition
Rates.
The TAAS Exit Test has led to increased attrition rates among Hispanic and African American students.
Documentary evidence in the record, the testimony of several witnesses, and reasonable inferences from school
district policies support Plaintiffs’ arguments that the attrition rates of minority students have increased since the
implementation of the TAAS Exit Test. Haney test.; Haney report, PX 52 at pp. 23-27 and Figures 3 & 4; Billescas
test.; Bernal test.; McNeil test.; Valenzuela test.; FOF ¶ 49-61.14
Plaintiffs presented over twenty years of data comparing the numbers of students in the ninth grade
compared to the number of students in the twelfth grade, three years later. PX 47; Haney report, PX 52.15 Ninth
grade and twelfth grade enrollments are especially relevant because they compare the number of students entering
the high school years to the students completing high school in the Texas education system. Haney test.; Cruse test.
Several clear patterns emerged from this data. First, the rates of completion for minority students have decreased
significantly since the implementation of the TEAMS Exit Test and decreased even more after the implementation
of the TAAS Exit Test. Second, there has been a significant increase in the gap between minority completion rates
and white completion rates. Third, the number of the minorities completing high school in Texas in recent years is
only half the number that entered the ninth grade three years earlier. PX 52. The gap between white and minority
rates of completion has gone from 15% in the early 1980s to 22% after the implementation of the TAAS Exit Test.
The most precipitous increases in this gap occurred immediately after the implementation of the TAAS Exit Test. In
addition, the loss from ninth grade to twelfth grade enrollment has gone from 40% to 50% of minorities. See Haney
report, PX 52 at pp. 23-27. If African American and Hispanic attrition rates had remained at their already dismal
14 The increased attrition rates of African Americans and Hispanics are relevant to this case in at least three ways: (1) they are direct evidence of adverse impact of the TAAS Exit Test; (2) they significantly weaken the Defendants’ claims that there has been a significant improvement in minority test scores on the TAAS Exit Test which reflects real improvement in education; and (3) they weaken the State’s argument that the TAAS Exit Test is manifestly related to legitimate state goals.
15 The analysis presented by Plaintiffs is the same sort of analysis that has been performed by the Intercultural Development Research Association for fifteen years. Cardenas report, PX 7 at pp. 4-5.

15
rate of 40% (as in 1979-1986) rather than increase to 50%, (as they did between 1992 and 1997), an additional
100,000 minority students would have graduated from high school over five years. Haney report, PX 52 at pp. 41-
42.
Based upon articles he has written and studies of the comparative dropout rates of states with and without a
state exit test, Dr. Haney concluded that there is a causal relationship between the implementation of the exit test and
the decrease in high school completion rates among Texas minorities. Haney test. See also, Shabazz report, PX 56
at p. 11; Valenzuela report, PX 6. Dr. Cardenas report, PX 7. Even Dr. Treisman’s enrollment numbers matched
Dr. Haney’s. In other words, Dr. Treisman testified that there were only 52% as many African Americans
graduating from high school in 1998 as entered in the ninth grade in 1995. This is exactly the number shown on Dr.
Haney’s charts. Dr. Moses agreed that TAAS failure can add to a student’s decision to dropout.
Defendants, on the other hand, have not produced an analysis showing the patterns of twelfth grade
enrollment compared to ninth grade enrollment. Defendants’ dropout and attrition numbers are not reliable for
evaluating the adverse effects of the TAAS Exit Test on minorities. A 1996 report by the Texas State Auditor
criticized the methodology used by TEA and Texas school districts for the collection of dropout information. The
Texas State Auditor maintained that an accurate number of school dropouts would be more than twice as high as that
reported by TEA. Cardenas report, PX 7 at p. 5.
Dr. Treisman testified that TEA’s dropout statistics are not valid numbers. He admitted that the TEA’s
dropout numbers are the biggest weakness in their accountability system. In fact, TEA’s dropout statistics have
undergone several major changes in computation during the last eight years making them even less reliable. PX 257
at p. 20. For example, TEA does not count a student as a dropout if the student has left school because he has not
passed the TAAS Exit Test. Nor does TEA include a student as a dropout if the student left school and later passed
the GED test. Defendants also admit that their dropout statistics are very weak because they are based on numbers
that are self reported by school districts to TEA. Moses test. Plaintiffs introduced credible evidence of the
relationship between the TAAS Exit Test and minority dropout rates. TEA’s rosy picture of the reduction of
dropout rates as a justification for the TAAS Exit Test is simply inconsistent with Plaintiffs’ analysis as well as its
own enrollment data, Defendants’ witnesses’ description of their own data, and national statistics. g. Adverse Effect of the TAAS Exit Test on Ninth
Grade Student Retention Rates.
16
The use of the TAAS Exit Test has led to a significant increase in retention rates of students, especially
minority students, in the ninth grade. Haney report, PX 52; Bernal report, PX 1 at p. 6; FOF ¶ ¶ 62-77. Before
1985, the grade 9/grade 8 progression ratios for African Americans and Hispanics were only slightly higher than for
whites. Since 1992, however, the ratios have been 1.24 for African Americans and Hispanics and 1.08 to 1.11 for
whites. There is really no dispute about the retention data. Dr. Treisman’s data, Dr. Haney’s data and TEA’s own
documents show retention rates of 25% of minority students in the ninth grade in Texas public schools — more than
in any other grade in the Texas public school system. PX 295 at pp. 3-5. Dr. Treisman testified that the increase in
retention rates is a real tragedy. See generally, DX 341, PX 52.
Ms. Gutierrez and Mr. Billescas each testified about local policies which increase retention in the ninth
grade in order to improve TAAS scores in the tenth grade and the effects of these retentions upon the dropout rate.
They also testified that their school districts are quite aware that retaining large numbers of students in the ninth
grade will increase the next year’s tenth grade TAAS Exit Test scores. Billescas test., Gutierrez test. This is but one
example of the tensions between the interest of the school and the interest of the students inherent in the TAAS Exit
Test. Districts must show that each ethnic group has at least an 80% passing rate in order to be certified as a
recognized school district. TEA’s data shows that there is a very high correlation between the students’ scores on
the eighth grade TAAS test and their scores on the tenth grade TAAS Exit Test. Phillips report, DX 316, chart 22.
Districts have an incentive to retain students in the ninth grade who are likely not to pass the TAAS Exit Test in the
tenth grade in order to improve their tenth grade exit test scores. The record in this case contains unrebutted
evidence that overaged students are the most likely to drop out of high school. Retaining students in the ninth grade
is thus also related to a major cause in the dropout rate of students who are overage for their grade, which in turn is
an adverse effect of the TAAS Exit Test.16
The few states whose ninth grade retention rates approach those of Texas include Florida, Georgia and
North Carolina; all are states with high school graduation tests. Haney report, PX 36. Plaintiffs’ evidence regarding
16 A consideration of the chances that a nineteen year old tenth grade student will complete high school is enough to understand the relevance of this statistic.
17
statewide retention patterns, local retention policies,17 and the inherent conflicts in the State’s accountability system,
all compel the conclusion that the TAAS Exit Test has increased retention rates.
17 Ms. Gutierrez testified that her district has made a local decision to require students to pass Algebra I or English I in the ninth grade in order to move on to the tenth grade. This is a local but not a state requirement.
3. Defendants’ Arguments Do Not Defeat Plaintiffs’ Adverse Impact
Claim.
While Defendants may argue with Plaintiffs’ adverse impact numbers, they cannot rebut the Plaintiffs’
showing of adverse impact by arguing that minorities are actually benefitted in the long run as a consequence of the
TAAS Exit Test’s adverse impact. See Connecticut v. Teal, 457 U.S. 440, 455, 102 S.Ct. 2525 (1982); Larry P. v.
Riles, 793 F.2d 969 (9th Cir. 1981). In Connecticut v. Teal, the Court rejected the defendant’s argument that an
overall beneficial impact in the end compensated for any adverse impact at the beginning of the process. In Larry P.
v. Riles, the Defendants tried to argue that an IQ test that disproportionately placed minorities in special education
classes actually benefitted minorities. The district court rejected the argument because special education classes de-
emphasize academic skills and stigmatize students. In the case at hand, the State cannot point to the alleged
beneficial impacts of failing the test such as remediation or additional years in school in order to justify the disparate
impact initially caused by the TAAS Exit Test.
Nor can Defendants rebut Plaintiffs’ proof of disparate impact by pointing to other factors that may affect a
student’s ability to graduate. The test itself creates a limitation on minority students’ opportunities for graduation.
The test itself classifies far more minorities than whites as ineligible for graduation and acts as a barrier to
opportunity for minority students. Connecticut. v. Teal, 457 U.S. 440, 102 S.Ct. 2525, 2532 (1982).
Nor can the State point to the overall graduation rate to argue that there is no discrimination in its use of the
TAAS Exit Test. The Supreme Court has rejected the argument that the disparate impact of a particular practice
may be nullified where the overall picture suggests that no discrimination has taken place. Connecticut v. Teal, 457
U.S. 440; See also NAACP v. Town of Harrison, 940 F.2d 792 (3d Cir. 1991).
18
The State’s argument that it has made good faith efforts to close the performance gap on the TAAS Exit
Test also has no weight. Because the issue before the court is whether the test has a negative disparate effect on
minorities and not whether the State has intentionally discriminated, the State’s motives are not relevant.
Connecticut v. Teal, 457 U.S. 440.18
18 Without waiving their claim, Plaintiffs acknowledge that the Court dismissed Plaintiffs’ intentional discrimination claim during the summary judgment phase of this case.
B. The State has failed to Show Educational Necessity for its Use of the TAAS Exit Test: There is no Manifest Relationship Between Texas’s Use of the Test and the State’s Legitimate Interest.
1. Legal Standard.
Defendants bear the burden of showing that the State’s use of the TAAS Exit Test as a graduation
requirement is educationally necessary. Board of Education v. Harris, 444 U.S. 130, 151 (1979) (in the educational
context, disparate impact Defendants are required to show educational necessity instead of business necessity);
Quarles v. Oxford Mun. School Dist., 868 F.2d 750, 754 n.3 (5th Cir. 1989); Castañeda v. Pickard, 648 F.2d 989 (5th
Cir. 1986).
A showing of educational necessity requires more than a showing of mere rationality. Defendants must
show that the State’s practice furthers its legitimate goals in a significant way. Wards Cove Packing v. Atonio, 490
U.S. 642, 109 S.Ct. 2115 (1989). The State must prove that the TAAS Exit Test serves in a significant way the
State’s goal of having students show a mastery of high school level skills. See Cureton, 37 F. Supp.2d at 701
(quoting Newark Branch NAACP v. Town of Harrison, 940 F.2d 792, 804 (3d Cir. 1991). Rather than defer to the
State’s justifications for its practice, the Court must subject those justifications to a reasoned review. Washington v.
Davis, 426 U.S. 229, 247, 96 S.Ct. 2040 (1976); NAACP v. Town of Harrison, 940 F.2d at 803.
Defendants must show that the State’s use of the TAAS Exit Test bears a manifest demonstrable
relationship to classroom education. See Connecticut v. Teal, 457 U.S. 440, 102 S.Ct. 2525, 2530 (1982); Cureton,
37 F. Supp.2d at 701. A showing of manifest relationship between the State’s practice and its goal requires more
than articulating an abstractly rational reason for the State’s use of the test. See Newark Branch NAACP v. Town of

19
Harrison, 940 F.2d at 804; Cureton, 37 F. Supp.2d at 709. In Cureton, for example, the court rejected the NCAA’s
argument that it required an 820 cut score on the SAT because that score predicted a student’s ability to graduate
from college. The court found that because the NCAA failed to control for the other factors that affected a student’s
graduation rate, the NCAA could not show that its cut score served the NCAA’s goal of ensuring college graduation
for its players in a significant way. Id. Similarly, in this case, although the State argued that the decreasing gap
between minority and white passing rates on the TAAS Exit Test signals the State’s success in ensuring that its
students are graduating with minimal skills, the fact that there are various outside factors reflected in students’
performance on the TAAS Exit Test means that the test is not manifestly related to the State’s goal of ensuring
mastery of skills. Several witnesses on both sides of the case attested to the inability of the TAAS Exit Test to
screen out factors such as socioeconomic status, whether students had computers at home, whether students had
parental support at home, etc. in measuring student performance on the test. See e.g., Vasquez test.; Duarte-Noboa
test.; Porter test.; Smisko test. Because the State failed to consider these factors when determining the effectiveness
of the test in measuring students’ ability to show their mastery of skills taught in the State’s classrooms it cannot
show that the test serves the State’s goal in a significant way.
Moreover, by simply pointing to the decrease in the gap between minority and white passing scores, the
State can “all too obviously point to some relationship between” the imposition of the TAAS Exit Test and its stated
purpose of ensuring that all students learn a basic set of higher order thinking skills. See Cureton, 37 F. Supp.2d at
709. The State failed to show, nor could it possibly know with any degree of certainty, whether other indicators of
achievement such as improved NAEP scores, increased minority participation in AP courses, increased minority
participation on SAT exams, are attributable to factors (such as improved state financing schemes) other than the
TAAS Exit Test graduation requirement. See Vasquez test.; Bernal test.; Valencia test.; See also, Edgewood v.
Meno, 917 S.W.2d 717 (Tex. 1995). Moreover, the State has failed to control for the effects of the other aspects of
its accountability system in the decreasing performance gap between minority and white students. See Mora test.
More important, in order to meet the standard of educational necessity, the State must show that the TAAS
Exit Test is valid and reliable for the purpose for which it is being used. See Washington v. Davis, 426 U.S. 229,
247, 96 S.Ct. 2040 (1976); Albemarle Paper Co. v. Moody, 422 U.S. 405, 431, 95 S.Ct. 2362, 2378 (1975); Georgia
State Conf. of Branches of NAACP v. State of Georgia, 775 F.2d 1403, 1417 (11th Cir. 1985); Sharif v. New State
20
Education Dep’t, 709 F. Supp. 345 (S.D.N.Y. 1989). The Plaintiffs can rebut any showing of educational necessity
by showing that the TAAS Exit Test is invalid for the purpose for which it was intended. See Washington v. Davis,
426 U.S. 229, 247, 96 S.Ct. 2040 (1976); Debra P. v. Turlington, 644 F.2d 397 (5th Cir. 1981) (test held invalid
because it did not cover material taught in the state’s classrooms); Cureton v. NCAA, 37 F. Supp.2d 687 (E.D. Pa.
1999) (Defendant failed to show that its cut score was set so as to be reasonable and consistent with normal
expectations of acceptable proficiency of high school students on that particular test);Groves v. Alabama, 776 F.
Supp. 1518 (M.D. Ala. 1991) (selection of a cut score that is arbitrary in the sense that it was randomly chosen from
the universe of possible choices would be invalid and therefore not educationally necessary); Richardson v. Lamar
County Bd. of Educ., 729 F. Supp. 806 (M.D. Ala. 1989) (court rejected test as invalid because passing score was
based on what was “politically acceptable” and lacked any relationship to a measurement of competence); Larry P.
v. Riles, 793 F.2d 969, 982 (9th Cir. 1981) (test held invalid because it was not validated for different populations or
for the purpose of placing students in special education classes).
With respect to the cut score, educational necessity requires that the state must have produced evidence for
why the SBOE chose the particular cut score that it did other than the fact that they discussed it at length. No matter
how valid the test may be in the abstract if it has not been shown to demonstrate proficiency at the cut score it will
not be valid, or ultimately, educationally justified. Cureton, 37 F. Supp.2d at 708 (quoting Guardians Ass’n of New
York City Police Dep’t v. Civil Serv. Comm’n, 630 F.2d 79, 105 (2d Cir. 1980). In Groves, the committee setting the
cut score on a teacher competency test made no effort to obtain information on whether and to what extent any
particular score correlated with competence to teach. The committee chose the cut score essentially as a public
relations ploy in order to sell the test to the public as a reform aimed at guaranteeing qualified teachers. The court
found that this type of deliberation in coming to a cut score was arbitrary and thus did not meet the educational
necessity standard required of the state. Groves, 776 F.Supp. at 1530-31. Similarly, in Richardson, the court found
that the test developer’s adjustment of the cut-score on a teacher certification test without any regard for professional
judgment violated both professional standards and Title VI regulations. Richardson, 729 F.Supp. at 821.
The State’s use of the test as a sole criterion to determine graduation violates professional standards and
Title VI regulations. In Sharif v. New York State Dept. of Education, for example, the court found that use of the
SAT as a sole criterion for making decisions about scholarships violated professional standards and therefore the
21
state could not show educational necessity for its use of the test to determine scholarship recipients. Sharif, 709
F.Supp. at 362.
1. Facts.
The State has not come anywhere near meeting its burden to show a manifest relationship between its use
of the TAAS Exit Test and its legitimate interest in high standards and accountability in education in the State.
Defendants’ educational necessity arguments fail for several reasons: (a) the State does not need to use the TAAS
Exit Test as a diploma requirement in order to meet objectives of accountability and the legitimacy of a high school
diploma; (b) the TAAS system, especially the TAAS Exit Test have many very strong negative effects on
educational progress in the State; (c) the state failed to show that the TAAS Exit Test is the reason for any alleged
improvements in minority achievement; and (d) the TAAS Exit Test and its use are invalid. g. The State’s use of the TAAS Exit Test is not
manifestly related to the State’s accountability system its remediation plan or the State’s interest in legitimizing its high school diploma.
It is noteworthy that the State never clearly articulated a legitimate interest that is manifestly related to its
use of the TAAS Exit Test. However one can infer that the State’s interests are (1) holding school districts, school
personnel and students accountable (2) insuring that a Texas diploma means something, and (3) implementing the
State’s remedial education program. The State has produced very little evidence and clearly has not met its burden
to show that its use of the TAAS Exit Test is related to any of these State interests. i. Texas does not need to use the
TAAS Exit Test as a diploma requirement in order to have its accountability system. " \l 5
Texas does not need the TAAS Exit Test as a diploma requirement in order to perform any of TEA’s
functions in the area of accountability, monitoring of school districts or reporting on school district performance.
Mora test. The State’s accountability system is itself not very comprehensive or informative in terms of capturing
students truly in need of help. Only 75% of the State’s students are included in the accountability system. PX 296.
Moreover, the State determines accountability of teachers, schools, school districts and administrators based on the
first administration of the exit test.
22
The State does not even consider cumulative pass rates on the TAAS Exit Test or final pass rates on the
TAAS Exit Test in determining whether school districts are to be found to be exemplary, recognized, acceptable or
low performing. Mora test.; Moses test.; PX 336 at p. 10.
In addition, the State’s accountability system does not apply any sanctions to school districts that have very
high retention rates of students in the ninth grade. The dropout statistics used in the accountability system are, as
Defendants’ witness Dr. Treisman conceded, not valid information.
Texas does not need the TAAS Exit Test as a diploma requirement in order to align the curriculum with the
test nor to improve the State’s curriculum. Smisko test. All of Defendants’ witnesses admitted that the State would
have just as good information about its curriculum in the elementary, middle school and high school grades without
the use of the TAAS Exit Test as a diploma requirement. As a last ditch argument, some of Defendants’ witnesses
argued that the State needs the TAAS Exit Test as a diploma requirement in order to ensure that students would take
the TAAS Exit Test seriously. But Mr. Vasquez and Dr. Moses agreed that school districts could maintain students’
interest in the TAAS Exit Test by using it to trigger remedial education; all of Defendants’ witnesses agreed that the
third to eighth grade TAAS test, which are not attached to a sanction at all, are as useful as the tenth grade test to
inform decision making for curricular and instructional improvement. Cruse test.; Smisko test.; Mora test.; Moses
test. Mr. Hein and Ms. Hester agreed that you do not need the TAAS Exit Test to motivate students to learn. i. Texas does not need the TAAS
Exit Test as a diploma requirement in order to maintain the legitimacy of a Texas high school diploma.
One of the major reasons advanced for the use of the TAAS Exit Test as an absolute requirement for
receiving a high school diploma is that grades in Texas schools are not meaningful indicators of a students’
knowledge of the curriculum. The State alleges that its own teachers practice grade inflation or arbitrary grading
policies. These arguments are contradicted by Defendants’ own policies and the testimony of Defendants’
witnesses.
Texas law provides that a student who is in the top 10% of his or her high school class could be admitted
into any Texas university, specifically including the highly competitive University of Texas at Austin, Texas A&M
and University of Texas at Dallas campuses, regardless of the student’s test scores, personal evaluations or courses
taken in high school. Texas Education Code § 51.801 et. seq. Defendants’ witnesses agreed that the Texas

23
Legislature has put great weight upon the grades that students earn in Texas high schools. Treisman test.; Moses
test.; Cruse test. All the witnesses agreed that in college admissions to competitive universities a student’s test
scores are weighed against the student’s grade point averages, teacher evaluations, and other indicators of the
student’s achievement in high school and ability to do college work. Phillips test.; Treisman test.; Moses test.;
Haney test. The arguments of Defendants’ counsel that there is significant grade inflation in Texas was simply not
supported by any evidence in the record. Dr. Moses and Dr. Smisko admitted that they were aware of no empirical
studies showing that there is grade inflation in the schools. Defendants’ witnesses Paige, Middleton, Hein, Hester,
Kelch, Calzada, Boerner, Castañon and Ferrier agreed that grade inflation was not a problem in their respective
school districts. All of the Defendants’ witnesses agreed with Plaintiffs’ witnesses that a student’s high school
grades give good and reliable information whether the student has mastered the State curriculum. In addition,
national studies have shown that high school grades are actually better indicators of future performance in the work
place or in college than are a student’s test scores. Haney test. There was uniform agreement that it is better to
make important decisions about students based on a variety of information rather than on one source of
information.19 Thirty states make decisions on diplomas without using a standardized test score. Throughout the
course of the trial, witnesses highlighted the importance of grades as meaningful indicators of a students’
achievement and aptitude. Gutierrez test.; Billescas test.; Henderson test.; Duarte-Noboa test. i. Texas has not shown a manifest
relationship between its use of the TAAS Exit Test as a diploma requirement and its interest in having good remedial programs.
19 Defendants argue that because a student must pass the TAAS Exit Test and a 70 grade point average and achieve above a 70 in certain core courses and meet certain attendance requirements that a high school diploma is based on multiple sources of data. This was described by one of Defendants’ expert witnesses as the use of conjunctive criteria.
Defendants’ witnesses agreed that one could trigger the need for remedial programs without using the
TAAS Exit Test as a diploma sanction. Vasquez test.; Kelch test. Indeed, in the third through eighth grades the
failure of the TAAS test does identify a student’s need for remedial education without any other sanction. Texas did
24
not need the TAAS Exit Test in order to trigger and require the remedial programs described by the witnesses in the
case. In fact, because the Defendants have no control over the design or implementation of locally based remedial
programs, the Defendants cannot make a connection between the State’s use of the TAAS Exit Test and its interest
in ensuring that students get a certain level of remediation. b. Texas’ use of the TAAS Exit Test has created significant negative effects in
the Texas educational system, all of which undermine the State’s justification for its use.
The various negative effects of the TAAS Exit Test on the educational system militate against its use as a
graduation requirement. The strong relationship between the implementation of the TAAS Exit Test as a diploma
requirement and increased attrition rates and retentions of minority students has been described in detail in this brief,
supra at I.A.2.f., g. The TAAS testing system also results in a substantial narrowing of the curriculum in Texas,
especially in minority schools. Bernal report, PX 1 at p. 5; McNeil report, PX 3 at pp. 3-9; McNeil test.; Ramirez
test.; Tilley-Cuevas test.; Duarte-Noboa test.; Henderson test. Specifically, the concentration by school districts on
what is covered by the TAAS test leads to a deemphasis of parts of the Texas curriculum that are not covered on the
TAAS test as well as the deemphasis of other types of instruction that can enrich or contextualize the curriculum
offered to the students. McNeil test; McNeil report, PX 3 at p. 5. There is even a focus on the TAAS at the first
grade level when the TAAS is not even given until the third grade. Ramirez test. The curriculum of entire middle
schools is focused primarily on the TAAS objectives and not on the types of courses which might encourage
students to become more interested in school, to stay in school or to discover their own learning styles. McNeil
test.; Duarte-Noboa test. The Texas Counseling Association, an association of several thousand counselors in Texas
public schools issued a policy statement criticizing the TAAS Exit Test because of its negative effects on the State’s
curriculum. Henderson test. In Houston, a survey of 10,000 teachers showed that 68% of the teachers viewed the
TAAS test as an obstacle to instruction and thought that the test drives the curriculum, rather than the curriculum
driving the test. Paige test.20 In summary, “the TAAS is a ticket to nowhere.” McNeil report, PX 3 at p. 9.
20 In part because of the narrowing of the curriculum, low performing schools, i.e. those schools with low TAAS scores, are likely to lose teachers, even though these schools are the ones that need the greatest numbers and percentages of highly qualified and certified teachers.
25
The TAAS Exit Test also reinforces the tracking systems that are used in Texas schools. Treisman test.;
Cardenas test. Middle school TAAS scores are used to advise students on which math and English courses to take in
the high school; there is a concentration of high TAAS scoring students in the upper tracks and a concentration of
low scoring TAAS students in the lower tracks in Texas school. Hein test.; Duarte-Noboa test. Both Dr. Treisman
and Mr. Fassold found significant patterns of tracking in Texas public schools where minorities are concentrated in
the lower tracks and Anglos are concentrated in the upper tracks. Treisman test.; Fassold report, PX 28 at pp. 11-12. c. The State has failed to show that
its use of the TAAS Exit Test is manifestly related to real improvements in achievement in Texas schools.
The State has based much of its case on the improvement in minority scores on the TAAS test and the
reduction in the gap between minority and Anglo scores on the TAAS. Much of the improvement in the scores can
be attributed to the increased dropout rates and increased retention rates in the ninth grade. FOF ¶¶ 64-74. Indeed a
minority student has only a 45% chance of getting through high school without being retained one year, while Anglo
students have a 72% chance of getting through high school without being retained one year. Haney test. Special
education exemptions also account for better performance on the TAAS Exit Test. Dr. Moses agreed that he was
very concerned about the increase in exemptions for special education in Texas schools from approximately 100,000
to approximately 150,000 in one year, the same year that the scores of special education students were first included
in the accountability system. Moses test.
Alleged decreases in the minority-white score gap cannot reasonably be attributed only to improvement in
education. TEA employees and others have recommended at seminars that schools can most quickly raise their
TAAS scores by concentrating on “bubble kids,” i.e. those students who have Texas Learning Index (TLI) scores of
63 or higher and are therefore likely to pass the next TAAS test at the TLI score of 70, with focused instruction.
Hein test.; Billescas test.; Duarte-Noboa test.; Vasquez test. A student who moved up from a score of 50 to a score
of 70 on the Texas learning index in one year would be considered to have made remarkable or astounding and
indeed unusual progress. Cruse test. Though witnesses did not admit it, there is a clear implication that students
with very low Texas learning index scores are not focused upon.21
21 Specifically, those with Texas learning index scores below 60 or 50, are students whose probability of passing the TAAS is extremely low and, therefore, students for whom focused instruction would not be very useful.

26
Defendants’ counsel made much of improvements in NAEP scores as somehow related to both
improvements in achievement and the TAAS Exit Test. Minority student improvement in NAEP scores, however, is
not nearly as apparent at the eighth grade after five years of TAAS testing as it is in the fourth grade after one year
of TAAS testing. Treisman test. Texas NAEP scores for the 4th grade reading test in 1998 were significantly and
disturbingly higher for white students (232) than for Blacks (197) or Hispanics (204). PX 409, Texas data. The
shocking gap between white and black students from 24 points in 1992 to 35 in 1998 has actually significantly
increased since the TAAS was implemented. Id. The gap between white and Hispanic scores has also significantly
increased from 23 points in 1992 to 28 in 1998 since the TAAS was implemented. Id. This pattern of increased
gaps over time since the imposition of the TAAS belies the decreased TAAS gaps that are the basis of the Texas’
defense. In addition, because there is a 50-80% overlap between the NAEP test and the TAAS Exit Test, students
who have been trained to do well on the TAAS test are likely to do well on the NAEP test.22
Defendants’ witnesses also pointed to increased minority participation in AP courses as related to the
TAAS Exit Test. Treisman test. Increased participation in AP courses is more likely because of increased
legislative funding rather than the TAAS Exit Test, however. Tex. Educ. Code § 28.051 et seq. (1995). Also, the
proportion of African Americans taking AP courses has only increased from 3% to 5% in five years. Treisman test.
In sum, whatever improvement has occurred in Texas education since the implementation of the TAAS
Exit Test, it is certainly attributable to factors other than the TAAS Exit Test as a diploma requirement. The Texas
Supreme Court has found very significant improvements in the equality and level of funding in Texas’ public
schools between 1987 and 1995. Edgewood v. Meno, 917 S.W.2d 717 (Tex. 1995). Defendants admit a 27%
increase in operating expenses per pupil between 1990-91 and 1995-96. PX 265 at p. 29. Mr. Vasquez admitted
that in 1990 there were significant differences in educational offerings between richer, Anglo districts and poor
minority districts in Texas. Vasquez test. In fact, the State has failed to make the connection between its use of the
TAAS Exit Test as a diploma requirement and any improvements in the educational system.
22 Interestingly enough, Texas students’ performance on the NAEP test has been touted even though there is no sanction applied to a students’ performance on the NAEP test; indeed, there are no individual score reports on the NAEP test.

27
To argue that the accountability system is responsible for any of the improvements in Texas education
would be to tout the system as a whole and not the specific use of the TAAS Exit Test as a diploma requirement.
While requiring school districts to break down (disaggregate) their TAAS data by race might have caused some
improvements in Texas education, there is simply no proof in this record that the use of the TAAS Exit Test as a
diploma requirement had those particular positive effects on Texas schools.
To the extent that the Defendants have begun to meet their burden of showing educational necessity by
pointing to the importance of a students’ accountability and diploma requirements, they have certainly failed in any
way to show a manifest relationship between the State’s use of the TAAS Exit Test and any benefits that might have
been obtained from accountability or high standards. It is not enough to argue, as the State has in this case, that
accountability and high standards are important virtues of the State’s education system that can lead to increased
parental involvement, increased student motivation and other benefits. The State must show that its use of its
presently existing TAAS Exit Test at the cut score is manifestly related to, or serves in a significant way, the
benefits of accountability and high standards. This they have plainly failed to do. d. The TAAS Exit Test and the uses
of the TAAS Exit Test are invalid under appropriate standards of validity.
Plaintiffs introduced substantial amounts of evidence in the case regarding the lack of validity of the TAAS
Exit Test. The State had the duty and failed to show that the test is valid under any of the applicable validity criteria.
The TAAS Exit Test fails the test of validity under concepts of content, construct, criterion, cut score and curricular
and instructional validity. Certainly the State can demonstrate no legitimate goal in using an invalid test or in using
any test in an invalid way. All of the expert witnesses agreed that the 1985 Standards for Educational and
Psychological Testing (hereinafter, “1985 Standards”) as well as the standards of the profession put the burden on
the user — in this case, the Texas Education Agency — to show the validity of a standardized test. PX 426 at pp.
41-44; Haney test.; Shapiro test.; Phillips test.; Mehrens test.; FOF ¶ 81-89. The 1985 Standards require that tests
with adverse impact on recognized minority groups require greater validity evidence. PX 426 at pp. 12-13. i. The items on the TAAS Exit Test have unnecessary differential
negative impact on minority students.
28
There is a strong relationship between minority performance on an item and item characteristics used to
choose and place items on the TAAS Exit Test. Shapiro report, PX 19. Specifically, there is an inverse relationship
between African American or Hispanic performance on an item and the point biserial of the item, i.e. the worse
minorities do on a TAAS Exit Test question, the higher the point biserial, and the more likely the question is to be
placed on the TAAS Exit Test. Shapiro test.; Twing test.; Shapiro report PX 19 at p. 4; FOF ¶ 90-95.23 The
pattern described by Dr. Shapiro was confirmed through the testimony of individual witnesses who reviewed
individual item characteristics showing that items with greater differences between African American or Hispanic
and white performance had higher point biserials than did items with less difference between minority and white
scores. Shapiro test.; Phillips test.; Twing test.; DX 148, 151 and 152 [the field test data used by data review
committees in the construction of the TAAS Exit Test]. Dr. Phillips testified that she found the same correlation,
that is the greater the difference between the Rasch difficulty scores of minority and white students the greater the
point biserial.24
With respect to item selection, the relationship between white-African American differences in correct
answers and the point biserial for African Americans is less than the relationship between white-African American
differences and the point biserial for all test takers. Shapiro report, PX 19 at pp. 3-4. The relationship between
white-Hispanic differences in correct answers and the point biserial for Hispanics is less than the relationship
between white-Hispanic differences and the point biserial for all test takers. Id. In other words, if the test builders
were to consider the point biserials for each subpopulation rather than the point biserial for the total population they
would choose good items with less adverse impact on minorities.
TEA’s reports reveal that there are items specifically designed to test the objectives of the TAAS Exit Test,
with substantial variances between minority and white scores. The TEA’s test development process tends to place
23 Dr. Shapiro based his understanding of the method of item selection for the TAAS Exit Test on his review of the State’s TAAS technical manual, PX 179, and of Dr. Twing’s deposition. Dr. Shapiro also relied on TEA data on student performance on the TAAS Exit Test, and on his review of the TAAS item bank data. Dr. Shapiro’s analysis was based directly on TEA data despite Defendants’ allegations that the TEA tapes were somehow modified by Mr. Fassold. 24 Her analysis, of course, produced a weaker correlation because the Rasch difficulty scores mask any differences in performance.
29
items with greater differences rather than items with less differences between the races on the test. Shapiro test.;
Shapiro report, PX 19. For example, in DX 152 one of the objectives of the test is that, “students will use the
operation of subtraction to solve problems.” The instructional target calls for the use of “the operation of subtraction
with real numbers in practical situations.” On item number MXO2A(101), which test that objective and
instructional target, 71% of whites, 44% of Hispanics and 32% of African Americans answered the question
correctly, with a point biserial of 0.47. On the same test, the same objective, and the same instructional target, on
item number MX02A(623), 90% of whites, 86% of Hispanics and 84% of African Americans answered the question
correctly with a point biserial of 0.42.
In addition, on DX 148 (Bates page #000776), on item number C904.1, 84% of whites, 80% of Hispanics
and 79% of African Americans answered the question correctly with a point biserial of 0.16. On the same objective
and the same test, on item number A201, 60% of whites, 36% of Hispanics and 26% of African Americans
answered the question correctly with a point biserial of 0.56. A general review of the item characteristics on the
TAAS Exit Test shows that within the objectives on the test, there are items of substantially different P value
differences. Items with greater P value differences (which are likely to have higher point biserials) are more likely
to be on the test than items with smaller differences. Id.
All of the item statistics used by the Defendants to validate the test are circular. Student achievement is
defined by the student’s performance on that particular test, rather than any other measure of student performance.
Shapiro test.; Phillips test.; Twing test. The point biserial, the Mantel Hantzel, the Rasch difficulty scores, and
Rasch differences are all based upon the assumption that the student score on the test itself defines the students’
level of achievement. The State has not analyzed the TAAS Exit Test by comparing students’ performance on items
to other indicators of achievement, e.g. course grades, scores on other standardized tests, or even scores on other
forms of the TAAS Exit Test. Shapiro test.; Phillips test.; Twing test.25 Moreover, to complete the circle, the test
items are chosen based on their ability to predict overall performance on the test.
25 This lack of proof of relationship between TAAS scores and other measures of achievement is one reason the TAAS test has no criterion validity, see brief section I.B.2.a.ix., infra.
30
The test construction procedure results in greater rather than less negative impact upon minorities. Shapiro
test. The development and construction of the TAAS Exit Test follows a basic procedure. Twing test. First, a list
of objectives for the test is made available to the test builder. The statistics and language of the field test items are
also made available for review. Based on the Rasch difficulty and the point biserial of an item, two items for each
objective are selected. Additional items necessary for an objective are made chosen on the available items in the
pool and the need for “harder” or “easier” items within each objective. Unfortunately, neither the point biserial nor
the Rasch difficulty of the item ameliorate the significant differences in item difficulty for students of various ethnic
groups. The point biserial is strongly positively correlated to a greater difference between the racial groups on
items. The Rasch difficulty of the items is based on the overall Rasch difficulty of the entire sample, not on the
Rasch difficulty for the various racial ethnic groups.
In summary, the statistical methods used by the State actually mask the significant differences in
performance between minorities and Anglos on those individual items and lead to the use of items with the greatest
differences. As summarized in Dr. Shapiro’s report: [T]he test construction methods employed by Defendants not only fail to detect and reduce potential item bias, but actually incorporate, generate, perpetuate and enhance any existing or potential item bias and overall test bias for both African American and Hispanic test takers. . .
Shapiro report, PX 19 at pp. 4-5.
Moreover, Dr. Shapiro concluded that: [t]he effects of the specific item pre-testing and selection procedures employed by Defendants are to retard the reduction of racial differences in item percent-correct values and test passing-rates, even as the actual values of item percent-correct and test passing-rate increase for the entire population.
Id.
In addition, the language used on the TAAS Exit Test questions is particularly misleading. For example,
many TAAS questions have irrelevant data (data not necessary to answer the question) in the question itself. This is
unnecessarily confusing to the examinee. Dr. Bernal testified that the inclusion of irrelevant information in the
question is inconsistent with standards of item construction. Bernal test.; Bernal report, PX 1 at p. 4. Such practice
is especially detrimental to limited English proficient students. Bernal report, PX 1 at pp. 3-4; Bernal test.
The actual items used on the TAAS Exit Test are not as well written as are items on tests such as the
Scholastic Aptitude Test. Bernal test. This might be due to the fact that the TEA uses items that are written by
31
persons who have no required or even known qualifications. Dr. Denny, the director of the Harcourt Educational
Measurement project that develops the items for the TAAS Exit Test, testified that she does not know the
qualifications of the actual item writers. There is no Harcourt Educational Measurement requirement, or TEA
requirement, for minimum qualifications of these item writers. Denny test. Item writers do not have to be from
Texas nor do they have to have any particular knowledge of the curriculum. The item writers are paid from $5 to
$15 per item, for items that are selected for further editing and use on the TAAS Exit Test. Denny test. None of the
HEM employees who edit items for use on the TAAS Exit Test is Hispanic or African American. Denny test.
These various flaws in test item development result in an invalid test. ii The method of
construction of the TAAS Exit Test increases rather than decreases the adverse impact of the TAAS upon minorities.
The development and construction of the TAAS Exit Test fail to meet professional and educational
standards of test development. The State relies heavily upon its use of revolving committees to review TAAS test
items for potential bias and for adequacy of preparation. However, these committees are composed of only about
twenty teachers each. Committee members are not experienced in statistics, item development, or test construction.
Cruse test.; Twing test.; Castañon test. Committee members try to be their own experts on the language of the test
items and do not focus on the statistical data presented to them. Castañon test. In addition, the committees review
the scope and sequence of the curriculum, rather than the actual teaching in classrooms, in determining whether
students should have learned the material on the test. Castañon test. Indeed, a committee of only twenty teachers
cannot possibly give a meaningful opinion on the overall availability of instruction necessary to answer those
questions in the 6,000 campuses and approximately 200,000 classrooms in Texas schools. The committees meet for
approximately two days, and on average have about three minutes to review the language and the statistics for each
of the questions that they do review. Cruse test. Unless an item is statistically flagged, it is not given an intense
review by the committees, nor by the actual test builders later in the process. Cruse test.; Shapiro test.; Twing test.
The differences between minority and Anglo performance on the test in terms of their P values (i.e., the
actual percentage of the group getting the item right) are only reviewed when items are flagged. TEA set the cutoffs
for flagged items. TEA’s witnesses admitted that more stringent standards could have been set, and, if so,
significantly more items would have been flagged. Cruse test.; Phillips test.; Twing test.
32
Another significant weakness of the test construction process was pointed out in Dr. Bernal’s factor
analysis of the TAAS Exit Test. Bernal test.; Bernal suppl. report, PX 1; FOF ¶¶ 96-100. Dr. Bernal used factor
analysis — a statistical test often used to determine whether items on standardized tests “hold together” or are
related to each other — to show the difference between creating items that are theoretically related to certain
objectives of the State curriculum and how students actually perceive the items. Dr. Bernal has worked on
achievement test development processes where factor analyses were used to determine the appropriateness of items
on the test. Dr. Bernal’s study of the TAAS Exit Test showed that there is no one strong factor on any of the various
TAAS Exit Test objectives. There are differences between how Anglos, Hispanics and African Americans answer
the questions, meaning that they “hang together” differently for different subpopulations. This means that the racial
groups are perceiving test items differently. Dr. Bernal summarized his findings as follows: The Exit level TAAS administered in the spring of 1997 has such a divergent factorial structure by ethnic group, especially in the Reading and objective Writing sections, that one can only conclude that the test generally measures different factors for the different ethnic groups. Some of the problems involve both item design and selection.
PX 1 at p. 6.
As it stands, failing or passing the TAAS tells us little about a student’s performance. At the very least, a factorially consistent test is necessary to determine the nature of the “essential” skills, and even then the validity of the derived factors would have to be established in terms of real-world outcomes and consequences. This factor analysis of the TAAS shows the folly of setting educational outcomes standards from an armchair, even from the combined armchairs of a number of educators or “experts” and their TEA leaders, who do not know enough to examine their handiwork against the realities of students’ learning.
PX 1 at pp. 8-9.
The failure of the test to show strong factors (for example, a strong “math achievement factor”) is due to
the lack of quality of the items themselves as well as the process of item selection and test construction. Bernal
test.26 iii. The TAAS Exit Test does not meet standards of reliability.
26 Although Defendant’s expert Dr. Phillips said it was inappropriate to use factor analysis on an education achievement test, she has herself conducted factor analysis on education achievement tests. Textbooks written by Dr. Mehrens, one of Defendants’ witnesses, list factor analysis as one method of considering items for test construction on standardized tests. Phillips test.
33
Reliability is a necessary but not sufficient condition for the validity of the test. Phillips test.; Mehrens
test.; Haney test. Dr. Haney’s report and testimony criticized the “internal consistency measurement” of reliability
which is the reliability method used on the TAAS Exit Test. Haney test.; see also PX 52 at p. 14; DX 179 at p. 42;
FOF ¶¶ 101-107. Internal consistency measurements of reliability tend to give the highest measurements of
reliability when compared with other reliability measures of the same test. Haney test.; Phillips test. Dr. Mehrens’
textbook and Dr. Thorndike’s textbook on standardized tests have recommended that alternative forms reliability —
comparing how well students do on one form of the test to how well they do on another later form of the test — is
the appropriate method to use on education achievement tests. Phillips test. Internal consistency measurements do
not provide as accurate reliability numbers as other types of measurement. In fact, the internal consistency
reliability measurements have fallen below the .85 level of reliability recommended by Dr. Mehrens and Dr.
Phillips. Phillips test.; PX 212 at p. 20; PX 215 at pp. 257, 264.
An additional basis for the reliability of the TAAS Exit Test is the “Rasch assumption,” or the assumption
that the statistics the State uses to determine the reliability of the tests actually “fit” the data. Phillips test. Dr.
Phillips agreed that a factor analysis could be used to test the adequacy of the “Rasch assumption” on a TAAS Exit
Test. Dr. Bernal testified that the Rasch assumption is not met here. In other words, each of the TAAS Exit Test
subtests is not unidimensional in the sense that it is not measuring just one factor, but many factors. In addition,
these many factors have different effects on Anglos, Hispanics and African Americans taking the test.
iv. The TAAS Exit Test is not construct valid.
The 1985 Standards state that the concept of construct validity is an umbrella which includes other types of
validity such as content, criterion and predictive validity. PX 426 at pp. 9-13. Dr. Bernal’s factor analysis of the
construct validity of the TAAS Exit Test revealed that: (1) the TAAS Exit Tests are not unidimensional; (2) the tests
“work” differently for Hispanic, African American and white students; and (3) student responses on the test do not
align with the objectives of the test. Bernal suppl. report, PX 1. The TAAS Exit Test is not valid under any of the
types of validity discussed by experts or in the literature: it is not content valid, not curricular valid, not
instructionally valid, not valid at the cut score and not criterion valid. Cardenas report, PX 7 at p. 13. The lack of
any one of these types of validity is fatal to the construct validity of the TAAS Exit Test as used as a diploma
requirement.

34

35
v. The TAAS Exit Test is not content valid.
At the time the TAAS Exit Test was implemented in 1990, the Texas Commissioner of Education admitted
that the TAAS covered matters that were not taught in the curriculum. PX 347 at p. 351. The head of assessment
for the Texas Education Agency agreed. Id. Thus, the State validated the test and set the cut score based on a set of
items which may not have been part of the classroom content at the time the TAAS Exit Test was first implemented.
This fact is important. Later versions of the test are based on the subpopulation statistics developed from the field
test items, so each version of the TAAS Exit Test locks in the inequities created by the first test that had improper
content. Dr. Haney also described his own survey and other surveys that have shown that a majority of Texas
teachers do not find that the present content of the TAAS Exit Test measures the present instruction in Texas
schools.
The significant misclassification of students by the TAAS test is additional strong evidence of the test’s
lack of content validity. Haney test. Specifically, significantly more minority students fail the TAAS test than
courses at similar levels to the TAAS test. Cruse test.; Haney test. If the content of the TAAS test is in line with the
content of the curriculum of Texas, these differences should not occur.
vi. The TAAS Exit Test is not curricularly valid.
The concepts of curricular and instructional validity are considered part of content validity. However,
because of the particular significance of curricular and instructional validity to the Plaintiffs’ Due Process Clause
claim, it is worth addressing separately.
At the time the TAAS Exit Test was developed in the 1989-90 period, Texas did not undertake any sort of
comprehensive survey of school districts, teachers, students or the actual textbooks that it used in its classes in order
to determine whether the TAAS Exit Test was in line with the curriculum being offered in Texas public schools.
Particularly, none of the defense witnesses was aware of any broad survey of school districts, teachers or students on
the actual curriculum used in schools in 1990 in any way similar to that upon which the validity study in the Debra
P. case was based. Phillips test.; Cruse test.; see also Debra P. v. Turlington, 730 F.2d 1405 (5th Cir. 1984). When
the Florida State Board of Education determined that the Florida exit test was in line with the curriculum in Florida’s
schools, it reviewed many types of information that were not available to the SBOE in Texas at the time the TAAS
Exit Test was implemented. Phillips test.; Haney test.
36
The State cannot rely upon the content committees for curriculum validity because the content committees
were composed of only twenty persons with very limited time to review items. Defense counsel has not argued that
these twenty persons are in any way a valid sample of all of the approximately 60,000 Texas high school teachers.
See PX 265 at pp. 18-21.
vii. The TAAS Exit Test is not instructionally valid.
One of the major holdings of Debra P. is that in order to use a diploma sanction test, the state must show
that the exam covers what is actually taught in the classrooms of the state. Debra P. v. Turlington, 644 F.2d 397 (5th
Cir. 1981). When the State Board of Education accepted the TAAS Exit Test, and when the cut score was set,27
there was no survey of teachers, school districts, students or textbooks to determine what was actually being taught
to students in Texas public schools in 1990. In fact, there is very significant evidence in the record that there was
not an opportunity to learn what was on the TAAS Exit Test. All of the defense witnesses and defense documents
concede that the curriculum offered in the regular program of the State of Texas until 1995-96 did not offer a student
an opportunity to learn what he or she needed to learn to pass the TAAS Exit Test. Cruse test.; DX 41 at p. 4; DX
64 at pp. 22, 25; FOF ¶¶ 113-146. Until 1995-96, for example, students were still taking Fundamentals of Math and
Correlated Language Arts, neither of which adequately prepared students for the content of the TAAS Exit Test.
Cruse test. Dr. Kirby, the Texas Commissioner of Education, and Mr. Veselka, head of assessment for the TEA,
agreed in 1990 that the TAAS Exit Test was, indeed, covering matters that were not being taught in the public
schools. This comment was repeated by Texas State Board of Education members in 1992-93 when the State Board
of Education was considering changing the way that the TAAS Exit Test was to be used. See DX 56 at p. 58. The
results of the 1990 field test bear out the differential opportunity to learn. The field test results revealed that the
percentage of Anglos who could pass all three of the TAAS Exit Test at the recommended cut scores was twice that
of minorities, (50% Anglo, 25% minority). PX 347 at p. 347. Between 1990 and 1999, minorities passed at a rate
lower than whites on every single one of the TAAS tests at every level. See PX 257 at pp. 2-6; PX 269 at p. 2; PX
279 at pp. 6-7, 30-31; PX 280 at p. 6; PX 281 at p. 13. Even in 1999 on the first administration on all tests, most of
the results violate the eighty percent rule, signaling a continuing differential opportunity to learn.
27 See discussion of the TAAS Exit Test cut score infra at I.2.d.viii.
37
Other indicators on the State’s accountability system also reveal inequities in opportunity to learn. African
Americans and Hispanics are behind whites on every measure used in Texas’ AEIS system. PX 257 at pp. 31-35;
Cruse test. In other words, on every one of the measures that the State Board of Education has determined is
relevant to consider the educational quality of school districts, minorities lag behind Anglos. This includes TAAS
test scores as well as SAT scores, ACT scores, attendance rates, dropout rates, and percentage who can pass the
TASP test. Dr. Treisman admitted that there are significant differences in the availability of certified teachers in
high proportion minority schools versus high proportion white schools. Treisman test. Dr. Valencia has reviewed
the data of Dr. Treisman and Mr. Fassold and concluded that there are significant differences in access to certified
teachers and that these differences, in fact, affect opportunity to learn.
The State’s own accountability system shows that there is a very high concentration of minorities on
campuses that are labeled as acceptable or low performing and a much lower proportion of minorities in recognized
or exemplary districts. Fassold report, PX 11. In addition, Anglos are much more heavily concentrated than
minorities in districts labeled exemplary and recognized. Id. There has been a pattern over the last five years of
minorities attending schools that are labeled by the TEA as lower on their accountability scales. Id. The individual
witnesses agree with the statewide statistics. Mr. Vasquez admitted that there were significant lack of resources
affecting educational opportunity for Texas minority students in 1990 in terms of teacher quality, class sizes,
libraries, science and language labs, enriching curriculum and computers. Dr. McNeil testified that her review of the
work of teacher education students and work of colleagues around the State of Texas supports the finding that there
are significantly fewer opportunities to learn for minorities than for whites in the Texas schools. Valencia report,
PX 23 at pp. 4-5. Mr. Mireles, Mr. Bledsoe, Mr. Perez and Dr. Shabazz agreed with these findings. Shabazz report,
PX 56.
There are systemic inequalities in all parts of the Texas system. When Texas sophomores took the TAAS
Exit Test in March 1995, 12% of whites compared to 5% of Hispanics and 4% of African Americans, were
participating in state-approved gifted and talented programs. PX 12.
In 1999, there are continued differences in opportunity to learn in the Texas public schools as evidenced by
lack of certified teachers in minority school districts; concentration of minorities in acceptable rather than
recognized and exemplary schools; lower minority passing rates on the TAAS at every level; lower minority scores
38
on the SAT and ACT test; and significant tracking of minorities. Moses test.; Smisko test.; Cruse test.; Henderson
test.; Billescas test.; Gutierrez test.; Tilley-Cuevas test.
Dr. Jose Cardenas, a nationally respected scholar on issues of minority education, especially in Texas, PX
6, concluded that discrimination in Texas public schools continues and is manifested in segregation, bilingual
education, tracking practices, migrant and immigrant students’ educational opportunities, dropout rates, school
finance, retention in grade and testing practices. Cardenas report, PX 7. Both Dr. Treisman and Dr. McNeil
testified that their expert opinion based on analysis of Texas public schools is that there is significant tracking of
students in Texas public schools and that much of that tracking is tied to the use of test scores. Mr. Fassold and Dr.
Valencia also presented evidence regarding the concentration of minorities in the lower educational tracks and a
concentration of whites in the higher education tracks of the Texas curriculum both in the early 1990s and today.
See PX 22 at pp. 3-5; PX 28 at suppl. B. Dr. Cardenas concluded in his report that there is continuous
discrimination to this day against Hispanics in the tracking systems that are used in Texas public schools. See PX 7.
The TAAS Exit Test results, the history of the development of the test, and other indicators in the State’s
accountability system demonstrate the unequal opportunity to learn in Texas schools even up to the present day.
viii. The TAAS Exit Test is invalid at the cut score.
Even a test which is otherwise valid can be invalid at the actual cut score set on the test. According to
defense exhibits, the cut score of 70 on the TAAS Exit Test was based on a state statute requiring a level of 70 to
pass individual courses and a 70 average on course grades to graduate from high school. The information available
to the State Board when they set the cut score in 1990 included the actual results of the TAAS field test and the
recommendation of 70 as a cut score. It is unquestioned that the State Board of Education did not use nationally
recognized procedures for providing information for the study of cut scores such as the Angoff procedures, modified
Angoff, Nedelsky and other procedures. Mehrens test., Haney report, PX 52. Dr. Mehrens has recommended as
recently as 1996 that these procedures be used in Mississippi when setting cut scores for a high school exit test. Mr.
Cruse agrees that none of these methods were undertaken when the State Board of Education set the cut score on the
TAAS Exit Test in 1990. Cruse test.; PX 347. Indeed, Dr. Kirby attached the state law setting 70 as a cut score to
his recommendation letter in 1990 to the State Board of Education. DX 38 at p. 3; FOF ¶¶ 108-112.
39
The cut score was set without any information from statewide surveys of teachers, students, textbooks or
school districts.28 Even the small teacher panels were not asked to recommend a particular cut score or the
percentage of items that should be passed by students to show a mastery of skills. Dr. Phillips, Dr. Mehrens and Mr.
Cruse agreed that there was no information from surveys regarding the TAAS test available at the time the State
Board of Education set the cut score in 1990.
Dr. Haney reviewed the information available on the setting of the cut score in 1990: the discussions
among the board members, the transcript of the 1990 meeting in which the cut score was set, information provided
to the SBOE to assess the test and recommend a cut score, and the failure to describe the Standard Error of
Measurement. He concluded that the TAAS Exit Test was not valid at the cut score, according to professional
standards, either in 1990 or at the present day. Haney report, PX 52; PX 426 at 6.9 and 2.10. Moreover, the 1985
Standards require that cut score information be carefully documented and that impartial procedures be used to set the
cut score. PX 426 at 1.2, 2.10, 2.12. The 1985 Standards were violated when Texas set the cut score of 70 on the
TAAS Exit Test in 1990. Haney test.; PX 52 at pp. 6-21.
28 Defendants sought to rely on a 1985 survey as a basis for the 1990 cut-score and validation procedure. However, that 1985 survey was not referred to in any of the materials presented by Defendants regarding the TAAS test and Mr. Cruse does not remember whether it was relied on at all in 1990.
ix. The TAAS Exit Test is neither criterion nor predictively valid.
The TAAS technical manual suggests that criterion validity be considered as part of the TAAS test. DX
179 at pp. 45-47. Criterion and predictive validity require that the test score be related to other criteria such as
student grades, performance on other test scores at about the same time as the test is given (criterion validity) or that
the test be related to later performance (predictive validity).
The State’s data defeats their own argument that the test is criterion valid. Bernal report, PX 1. The
consistent pattern of the TEA studies on the TAAS Exit Test shows that there are low to moderate correlations
between the TAAS test scores and grades in schools. See PX 52 at pp. 29-34; PX 280 at pp. 165-71; PX 281 at pp.
40
179-196; DX 179 at p. 47. Cruse test. The TAAS-to-grade correlation of about .32 is significantly below the
normal test-to-high school grade correlation. PX 52 at p. 30. In addition, in the early 1990s when Texas performed
both norm referenced testing of students and the TAAS test, there was a pattern of improvement in scores on the
TAAS test at the same time that Texas’ performance on nationally normed tests was getting worse. Cruse test.; PX
283 at pp. 221-224; PX 281 at pp. 198-209.
The relationship (intercorrelations) of the Math, Writing and Reading TAAS subtests are inconsistent with
the basic standards of criterion validity. Haney test.; Haney report, PX 52 at p. 31. For the three thousand students
surveyed by TEA in its TAAS Exit Test - English II correlation study in 1995, there was a significantly stronger
correlation between the Reading and Math TAAS subtests than between the Reading and Writing (assumed to be
two verbal skills) TAAS subtests. Id. When Dr. Phillips sought to rebut this study by computing the
intercorrelations for all Texas 10th grade students taking the tests in 1995, she found the same pattern: the correlation
between the Reading and Math subtests was higher than the correlation between the Reading and Writing subtests.
Phillips test.
Defense witnesses agreed that there is no information showing a relationship of TAAS test scores to
performance in later life either in the work world or the college world. Cruse test.; Mehrens test.; Phillips test.;
Twing test. This is the case even though the mission of the state was to create a curriculum that would prepare
students for success after high school, and to use the TAAS Exit Test to measure that competence. Smisko test. x. The use of the TAAS test as a sole criteria is invalid.
Defendants maintain that the TAAS test is used as one of multiple, albeit conjunctive, criteria. In other
words, a student must pass all three parts of the TAAS test with a 70 and must have a 70 grade point average and
must have a 70 in various required courses and must meet various attendance and other requirements. The weight
of authority on the use of exit test scores is the opposite. Bernal report, PX 1; Valenzuela report, PX 6; Cardenas
report, PX7. That is, standardized tests should only be used as one of compensatory criteria when making important
“high stakes” decisions. It is undisputed that the decision whether to grant a diploma is a “high stakes” decision.
Valencia report, PX 23; Moses test.; Mehrens test.; Phillips test.; Haney test.; Bernal test.; see, e.g., PX 36 at p. 24;
FOF ¶¶ 147-155. TEA itself directs that the TAAS tests not be used as absolute or sole criteria. DX 179 at p. 2; PX
272 at pp. 3, 7; Cruse test.

41
Texas’ use of the TAAS Exit Test as a diploma requirement violates the 1985 Standards, PX 426,
specifically standards 8.7, 8.10 and 8.12. It also goes against the findings and recommendations, under Public Law
105-78, enacted November 13, 1997, of the National Research Council’s Board of Testing and Assessment. See
High Stakes, Testing for Tracking Promotion and Graduation (National Academy Press, Washington, D.C., 1999).
Haney report, PX 36. The American Psychological Association’s task force on intelligence testing observed that
“the successful education of African American children will require an approach that is less concerned with talent
sorting and assessment, and more concerned with talent development.” Shabazz report, PX 56 at p. 9.
xi. Summary
The TAAS Exit Test and its use as a diploma requirement are invalid. TEA is required by professional
standards, but has failed, for a variety of reasons, to prove the validity of its TAAS Exit Test and its use of that test
as a diploma requirement. C. There are Equally Effective and Less Discriminatory Alternatives to the TAAS Exit Test.
1. Legal Standard
Plaintiffs will ultimately prevail if they can carry their burden of showing an equally effective alternative
practice that results in less discriminatory alternatives while still serving the goal of determining whether students
have mastered the high school curriculum. In this context an equally effective alternative practice means one that is
comparable or commensurate. See Alexander v. Choate, 469 U.S. 287, 294 (1985); Cureton v. NCAA, 37 F.Supp.
2d at 713. In order to meet their burden, Plaintiffs may present evidence of a viable alternative with a less
discriminatory effect that the Defendants refused to adopt. See Wards Cove Packing v. Atonio, 490 U.S. at 660-661;
NAACP v. Town of Harrison, 940 F.2d 792 (3d Cir. 1991).
2. Facts
In this case, the State has not met its burden to show manifest relationship between the TAAS Exit Test and
its legitimate interest in education. Nevertheless, should the court find that the State has met that burden, it is clear
in this case that there are less discriminatory and equally effective alternatives to the State’s use of the TAAS Exit
Test that would meet the State’s objectives. Generally, these alternatives fit into five categories: (1) Returning to
the system used in Texas before 1987 and used in thirty of the fifty states of granting a high school diploma based
upon students’ successful completion of their high school course and other state requirements; (2) Using a sliding

42
scale combining the various TAAS Exit Test scores and a student’s GPA into a system which would allow a higher
great point average to offset TAAS scores below the 70 cutoff; (3) The alternatives outlined and described in detail
in a 1996 TEA study of alternatives to the State’s use of the TAAS Exit Test, DX 6; (4) The alternatives to the use
of the State’s exit test that were recommended by TEA to the State Board of Education, 1992-93; (5) Individual
witness recommendations on less discriminatory alternatives to the TAAS Exit Test; and (6) Establishing parent-
teacher review committees to determine whether students have mastered the curriculum despite failing the TAAS
Exit Test.29
29 The Legislature recently added a review committee provision to § 28.0211 of the Texas Education Code that will go into effect in 2002. The provision allows for the establishment of grade placement committee (consisting of a student’s principal, teacher and parents) to decide whether a student who takes the TAAS test at the third, fifth and eighth grade levels and fails it three times can still be promoted to the next grade. The committee can decide “in favor of a student's promotion only if the committee concludes, using standards adopted by the board of trustees, that if promoted and given accelerated instruction, the student is likely to perform at grade level.” Tex. Ed. Code § 28.0211. This type of committee should also be feasible for high school graduation decisions.
a. Granting a high school diploma based upon a student’s performance in their courses and four years of high school is a less discriminatory and practical way to maintain high standards for the high school diploma.
It is undisputed that Texas minority students pass their courses at significantly higher rates than they pass
the TAAS Exit Test. The State’s own correlation studies between TAAS Exit Test and courses taught in Texas
public schools, e.g. Algebra I and English II courses, show that minority students are significantly more likely to
pass their high school courses than they are to pass the related TAAS Exit Test. PX 281 at pp. 179-196; PX 280 at
pp. 165-171.
Dr. Haney’s analysis of a data tape provided by TEA of over three thousand students’ English II scores and
TAAS reading and writing scores shows that three times as many minority students than white students passed their
coursework and yet failed the respective TAAS Exit Test. PX 52 at p. 33; Haney test. The state’s argument that
grades are untrustworthy is unsupported by the evidence of the record. The state simply has not provided any
43
credible evidence of significant grade inflation or that grades are unreliable for well-informed and valid decisions
about a student’s understanding of the Texas State curriculum. (See generally section I.B.2.a. of this brief, supra.)
Under this alternative, the State could still use a standardized test as an instrument for accountability of
school districts and for the improvement of curriculum and instruction. Indeed, this is the way that the TAAS tests
in the third through the eighth grades are used. Thus, this alternative allows for the continued administration of the
TAAS Exit Test and for continued reporting of the scores. It even allows for a sanction, such as requiring students
to take an additional remedial course and pass at a C or higher level, to be tied to the exit test. There is simply no
evidence that this alternative would not be a practical, less discriminatory, and equally effective way of determining
the competence of students to obtain a high school diploma. b. The use of a sliding scale combining a student’s grade point average and TAAS
scores would be less discriminatory and practical.
Higher percentages of both minority and Anglo students would obtain a high school diploma if a sliding
scale formula were applied to the TAAS Exit Test and grades. Haney report, PX 52 at pp. 42-43. Plaintiffs
introduced testimony of a less discriminatory effect if the following procedure were utilized: (1) the student’s high
school GPA were added to the student’s TAAS score; (2) a sum of 140 would be required for graduation; (3) student
would still be required to have a 70 or above GPA, but a GPA of higher than 70 could offset or compensate for a
TAAS score of less than 70. For example, under this system a student with an 80 GPA (a B average) could receive a
diploma with only a 60 on the TAAS Exit Test. On the other hand, a student with a 70 GPA would still be required
to obtain a 70 on the TAAS Exit Test. Haney test.
Under this system, the percentage of minorities who fail to pass would be reduced from 34% to 21% and
the percent of Anglos who fail to pass would be reduced from 11% to 6%. This would clearly reduce the adverse
impact of the TAAS score on minority students and yet would still place significant weight on the TAAS Exit Test
score. At the same time it would more closely resemble the model of compensatory multiple criteria, which is the
preferred method of combining grades and test scores. Haney test.; Haney report, PX 36; Haney suppl. report, PX
52; Phillips test.; Treisman test.30 30 Though Defendants sought to criticize the National Research Council 1999 study which advocates the use of compensatory critiera, Defendants’ expert Dr. Mehrens admitted that the director of the committee that created the report, Dr. Robert Linn, is one of the most highly regarded psychometricians in the country and further admitted that he had never read the report before he criticized it.

44
Alternatively, combining the three TAAS scores together rather than requiring a separate cut score on each
of the three tests would be less discriminatory against minority students. Under this option, a total score of 210
would be required, allowing a student to compensate for a 65 in math with a 75 in reading or to compensate for a 65
in reading with a 72 in math and a 73 in writing. Bernal test.; Bernal report, PX 1.
c. The Alternatives Provided in the 1996 TEA Study.
In 1996, TEA hired a private consulting firm to present a series of alternatives to the State legislature for
alternatives to the TAAS Exit Test. The Texas Legislature has not adopted any of these alternatives. Specifically,
the 1996 study presented the following options for consideration by the legislature: • allowing students who receive an Associates degree to receive a high school diploma;
• allowing students who pass the Texas Academic Skills Program (TASP) and who have met all other requirements to receive a high school diploma;
• requiring that remediation plans be filed for students scoring below a certain level on the TAAS; • contracting for a professional development system to assist school districts with the development
of remediation programs; • allowing workplace certifications; • judging students’ performance based on portfolios of their work; and • basing a passing score on the TAAS on a cumulative score from the three parts of the test.
DX 6. These alternatives were found by the consultant to be practical. The record in this case supports the
proposition that each of these would be less discriminatory against minority students. PX 268, Cruse test. d. The State Board of Education considered several alternatives in 1992 and 1993 that
would have been less discriminatory and practical.
In 1992-1993 TEA staff presented to the State Board of Education a series of alternatives, to the
proliferation of TAAS testing. The major recommendation was for the State to “redesign a program to be based
primarily on performance tasks, projects, portfolios and criterion-referenced tests and a norm referenced program
(emphasis added).” See DX 51 at attachment 1; DX 52 at p. CW-5; DX 53 at pp. 1-3; DX 54 at pp. I-39 to I-41; DX
55 at p. I-7. Mr. Cruse testified that these recommendations of the staff were not adopted by the State Board of
Education or the Legislature. Cruse test.
e. Several other alternatives suggested by witnesses.
45
Several witnesses in the trial testified about less discriminatory, equally effective alternatives to the State’s
use of the TAAS Exit Test. Dr. Shapiro, for example, testified that Defendants could employ item bias methods that
reduce the racial differences in either item performance or passing rates on the TAAS Exit Test. Dr. Moses testified
that there would be less discriminatory alternatives to the use of the TAAS Exit Test. Mr. Vasquez agreed that a
sliding scale would provide an incentive to score well on the test while not relying on the test is an absolute
requirement for receiving the high school diploma.
In summary, there is no doubt that there are several alternatives to the use of the TAAS Exit Test that
would be less discriminatory. While Defendants might argue about the practicability of these alternatives, there is
strong testimony to support their effectiveness in the context of the Texas education system. In addition, these
alternatives are more consistent with national standards for appropriate test use. II DEFENDANTS HAVE VIOLATED THE DUE PROCESS CLAUSE OF THE U.S.
CONSTITUTION BY IMPLEMENTING THE TAAS EXIT TEST AS A GRADUATION REQUIREMENT.
This court has already ruled that the Plaintiffs in this case have a property interest in a high school diploma.
Under Debra P. v. Turlington, if the test covers material not taught the students in the state’s classrooms, it
violates Title VI and the Due Process Clause of the Constitution. Debra P. v. Turlington, 644 F.2d 397 (5th Cir.
1981). In Debra P., the court held that the state constructed an exam under the pressure of time covering content
that was presumed to be basic but that its schools may or may not have taught well or perhaps at all. In other words,
part of the procedural due process analysis is to determine whether teachers adequately taught the materials covered
on the test with enough notice that students could reasonably have answered the questions on the test. In the case at
hand, witness after witness testified that students were not necessarily learning the objectives covered by the TAAS
test even though the State had a broad curriculum in place before the TAAS test was implemented. Vasquez test.;
Castañon test.; Cruse test.; Henderson test. It is the TAAS objectives that the State should have ensured were being
taught in the classrooms at the time the TAAS Exit Test was first implemented.
Testing material not covered in the classroom is also a substantive due process violation because the State
is obligated to avoid implementing a policy that is fundamentally unfair or arbitrary. It is clearly fundamentally
unfair to administer a standardized test that covers materials that may have covered matters not taught in the schools
of the state. Moreover it is arbitrary and unreasonable to impose an invalid test on students.
46
Under Debra P., even if there are essential materials that are supposed to be taught it is the state’s
responsibility to establish proof that students had an opportunity to learn the material covered on the test even
though it may show that the test is a good indicator of what students should know. Debra P., 644 F.2d at 404-06.
The State has attempted to distinguish the educational situation in Florida from the situation in Texas.
However, both states had a curriculum in place and were using a standardized test to try to align the schools’
curriculum to the test; both states used the exit test as part of an accountability system for state education; students
were allowed to take the test multiple times in both states. See Fla. Stat. § 229.55(2)(a),(d),(f) (1976); Fla. Stat. §
232.246 (1978).
Plaintiffs refer the Court to section I.B.2.d. of this brief for Plaintiffs’ description of the various ways that
the TAAS Exit Test is invalid and therefore violates the Due Process Clause.
III. CONCLUSION: PLAINTIFFS REQUEST INJUNCTIVE RELIEF.
Plaintiffs have demonstrated that the State has failed to show that the students of the State had an equal
opportunity to learn the materials covered on the TAAS Exit Test either when the test was first implemented or
today. As the Plaintiffs set out during the trial, the very inequalities that existed in the school system at the time the
TAAS Exit Test was implemented have been locked into place in the test itself. Now that minority students have
begun to crack the test, the State has decided to implement a new and broader test which again does not test the
materials covered in the State’s classrooms.31Tex. Ed. Code § 39.023. This Court should stop this terrible cycle
now.
31 In 1999, Section 39.023 of the Texas Education Code was amended to require:
[E]xit-level assessment instruments designed to be administered to students in grade 11 to assess essential knowledge and skills in mathematics, English language arts, social studies, and science. The mathematics section must include at least Algebra I and geometry with the aid of technology. The English language arts section must include at least English III and must include the assessment of essential knowledge and skills in writing. The social studies section must include early American and United States history. The science section must include at least biology and integrated chemistry and physics. The assessment instruments must be designed to assess a student’s mastery of minimum skills necessary for high school graduation and readiness to enroll in an institution of higher education. . . .
47
Plaintiffs urge the court to enter a declaratory judgment that the State’s use of the TAAS Exit Test since
1990 violates Title VI and the Due Process clause. Specifically, Plaintiffs request that the court enter an injunction
enjoining the present use of the TAAS Exit Test as a requirement for receiving a high school diploma in Texas
public schools. Plaintiffs further request that the court issue an injunction allowing students who can show that they
met their other requirements for receiving a high school diploma to receive a high school diploma regardless of their
TAAS Exit Test scores. In the long term, Plaintiffs suggest that the court set a procedure in which the Defendants
can present a plan for granting high school diplomas consistent with the court’s findings, allow the Plaintiffs an
opportunity to respond to the plan and then enter a permanent injunction requiring that any future use of
standardized tests as part of the requirement for obtaining a high school diploma in Texas meet certain standards as
set forth in the court’s opinion.
DATED: November 8, 1999 Respectfully submitted, ALBERT H. KAUFFMAN NINA PERALES LETICIA SAUCEDO Mexican American Legal Defense and Educational Fund, Inc. 140 E. Houston Street, Suite 300 San Antonio TX 78205 (210) 224-5476 (210) 224-5382 FAX ATTORNEYS FOR PLAINTIFFS Of Counsel: JAVIER N. MALDONADO 2222 W. Mistletoe Avenue San Antonio, TX 78201 (210) 738-9616
CERTIFICATE OF SERVICE
I hereby certify that on the _____ day of November, 1999, a true and correct copy of the
foregoing Plaintiffs’ Post Trial Brief was sent by certified mail, return receipt requested, to the following: Mr. Geoffrey Amsel Assistant Attorney General

48
General Litigation Division P.O. Box 12548, Capitol Station Austin, Texas 78711-2548 Attorney for Plaintiffs

Summary of Pleading - 1
In the United States District Court
For the Western District of Texas
San Antonio Division
Plaintiff,
vs.
DefendantGI FORUM, IMAGE
DE TEJAS, PLAINTIFFS 1-7
V.
TEXAS EDUCATION AGENCY, DR. MIKE
MOSES,MEMBERS OF THE TEXAS STATE BOARD
OF EDUCATION, in their official
capacities, DEFENDANTS
Case No.: No. 12-3-456789-1 PLEADING TITLE
CIVIL ACTION NO. SA97CA1278
DEFENDANTS RESPONSE TO PLAINTIFFS’ POST TRIAL BRIEF
TO THE HONORABLE EDWARD C. PRADO:
COME NOW Defendants Texas Education Agency (TEA), Dr. Mike Moses, the
members of the
Texas State Board of Education, and the State Board of Education, by and
through their attorney, the Office of the Attorney General, and file this
short response to plaintiff’s post-trial brief (the “Brief”). Defendants
would respectfully show the Court as follows:

Summary of Pleading - 2
Plaintiffs’ 59-page Brief is nothing more than a wish-list masquerading
as a summary of the trial testimony. Not surprisingly, there are no page
citations to, much less quotes from, the transcript to support any of
plaintiffs’ assertions about what the witnesses supposedly said. In short,
the Brief is a mischaracterization of the evidence, and to the extent it
addresses the law, it misconstrues the legal arguments defendants have been
making throughout the case. As defendants have explained repeatedly
throughout trial and in closing argument, the issue is not whether the TAAS
test is perfect, not whether the accountability system is perfect, not
whether some teachers or schools or districts do some things better than
others, and not whether “education”, in some abstract sense, would be better
if the TAAS requirement were shelved. The legal questions are narrow, and the
burden of proof is on plaintiffs to demonstrate that the test requirement is
unlawful. The have failed utterly to do so.
The evidence is overwhelming that the TAS graduation requirement serves
perhaps the most important of all educational purposes: ensuring that high
school graduates have adequately learned at least the core of the state
mandated curriculum. The detailed testimony concerning construction,
alignment, curriculum and remediation shows that the TAAS exit test is fair:
more accurate, and more objective than any other measure of student
performance. The TAAS test covers only what students have been taught
repeatedly throughout the grades. Indeed, plaintiffs admit as much by
criticizing some schools for spending too much time teaching the subjects
included on the test.
The testing cases cited in the Brief are off the mark. Cureion and the
other cited cases concern the SAT and other predictive tests whose results

Summary of Pleading - 3
after one administration are used to determine college admissions,
scholarships, or employment. Such tests in those
contexts are used to determine college admissions, scholarships, or
employment. Such tests in those contexts are entirely different from the TAAS
test used as a graduation requirement.
The TAAS test has no consequences for graduation on any single
administration. The consequence of “failing” a single TAAS test is extra
instruction, not the denial of some future opportunity. That is not illegal
discrimination-it is a benefit that MALDEF should be fighting for in its
quest for educational equity. The TAAS exit requirement ensures that all
students, including minority students, including minority students, learn the
essential knowledge and skills prior to graduation.
TAAS sets a standard of achievement, just like course grades do.
Nevertheless, plaintiffs do not challenge the course grade requirement, even
though there is no evidence that course grades predict future success in
college or the workplace, and certainly no evidence that the subjective
nature of course grades results in less disparate impact than TAAS. In fact,
there was literally no evidence offered by plaintiffs of an equally effective
alternative to the TAAS requirement that would result in less disparate
impact. Plaintiffs’ Brief offers speculation as a substitute for proof, but
even that speculation fails to offer a meaningful alternative to the TAAS
requirement that is equally effective and results in a less disparate impact.
There was no evidence of how a sliding scale, a portfolio, or any other
method would be as effective as the current objective requirement, and the
trial testimony was uncontroverted that subjectivity actually increases the
risk of unfair discrimination. The testimony was equally uncontroverted that
Summary of Pleading - 4
a “sliding scale” would still require a floor. How and where such a floor
would be set and any differential impact on pass rate is total speculation.
The record is clear and overwhelming that the TAAS test is fairer and
less potentially discriminatory than any other measure of student performance
devised to date. Plaintiffs’ experts agree that minorities fail more high
school courses, and no cases are offered to distinguish a statewide high
school test from a classroom final exam that students must pass in order to
graduate. Indeed, unlike exit TAAS, final exams are not typically offered
repeatedly until a student scores high enough to pass the course. Both course
grades and the exit TAAS are legitimate and crucial educational standards
which no reasonable person should
want to eliminate.
The educational situation in Texas differs fundamentally from the one
in Florida at issue when Debra P. was decided. Unlike Texas in the 1990’s,
Florida did not have a state mandated curriculum in place in the 1970’s when
it initiated the use of an exit test as a requirement for high school
graduation. Plaintiffs’ reliance on FLA. STAT. 229.55(2)(a),(d),
(f)(1976) and 232.246(1978) is misplaced because neither of those statutes
indicates that Florida had a state mandated curriculum at the time of Debra
P.
The evidence at trial showed conclusively that the TAAS exit test is a
valid measure of minimal student mastery of the state-mandated curriculum,
that students have ample, repeated opportunities to learn the subjects
tested, and that the TAAS requirement ensures that all students learn the
core materials that the state deems essential for any graduate to know. The
evidence was also overwhelming that the vast majority of all students who

Summary of Pleading - 5
stay in school learn these materials and receive their diplomas. Defendants
urge this court to leave in place the one tried and proven graduation
standard that has ushered in dramatic educational gains across the state of
Texas.
Respectfully submitted,
JOHN CORNYN
Attorney General of Texas
ANDY TAYLOR
First Assistant Attorney
General
LINDA S. EADS
Deputy Attorney General for
Litigation
TONI HUNTER
Chief, General Litigation
Division
(Signature)
GEOFFREY AMSEL
State Bar No. 01161570
Assistant Attorney General
DEBORAH A. VERBIL
State Bar no. 20547200
Assistant Attorney General
General Litigation Division
Summary of Pleading - 6
P.O. Box 12548, Capitol
Station
Austin Texas 78711-2548
(512) 463-2120
(512) 320-0667
ATTONEYS FOR DEFENDANTS
CERTIFICATE OF SERVICE
I, Geoffrey Amsel, Assistant Attorney General, hereby certify
that a true and correct copy of the foregoing instrument has been sent
certified mail, return receipt requested on November 22, 1999
to: Albert Kauffman
MALDEF, Inc.
140 E. Houston Street, Suite 300
San Antonio, TX 78205
(Signature)
GEOFFREY AMSEL
Assistant Attorney
General

Summary of Pleading - 7
Appendix 6: Summary Comment on Judge Prado’s Decision in the GI Forum Case I am not a lawyer, much less a federal court judge. I attended only four days of the “TAAS trial” in Judge Prado’s courtroom in San Antonio in the fall of 1999. Hence it would be presumptuous of me to comment in detail here on Judge Prado’s decision. For those interested, in the forgoing three appendices I have provided the full text Judge Prado’s decision (appendix 3), the post-trial brief prepared for Judge Prado by the MALDEF attorneys in the case (appendix 4) and the post-trial brief prepared by attorneys for the State of Texas (appendix 5). In light of this documentation, I venture just one suggestion by way of commentary. In his ruling, Judge Prado wrote:
. . . this Court will apply the burden-shifting analysis established in Title VII cases. Under that analysis, the plaintiff must initially demonstrate that the application of a facially neutral practice has caused a disproportionate adverse effect. Wards Cove, 490 U.S. at 656-57. If a plaintiff makes such a showing, a burden of production shifts to the defendant. Under that burden, the defendant must produce evidence that the practice is justified by an educational necessity. Id. The plaintiff may then ultimately prevail by demonstrating that an equally effective alternative practice could result in less racial disproportionality while still serving the articulated need. Watson, 487 U.S. at 998. (p. 20)
In light of this reasoning, my suggestion is simply that in reviewing the post-trial briefs by MALDEF and State attorneys, the interested reader might wish to ask him- or herself a simple question. Which side seems to have carried the burden of proof, or indeed to have even taken the ideas of proof and evidence seriously. - wh, August 2000
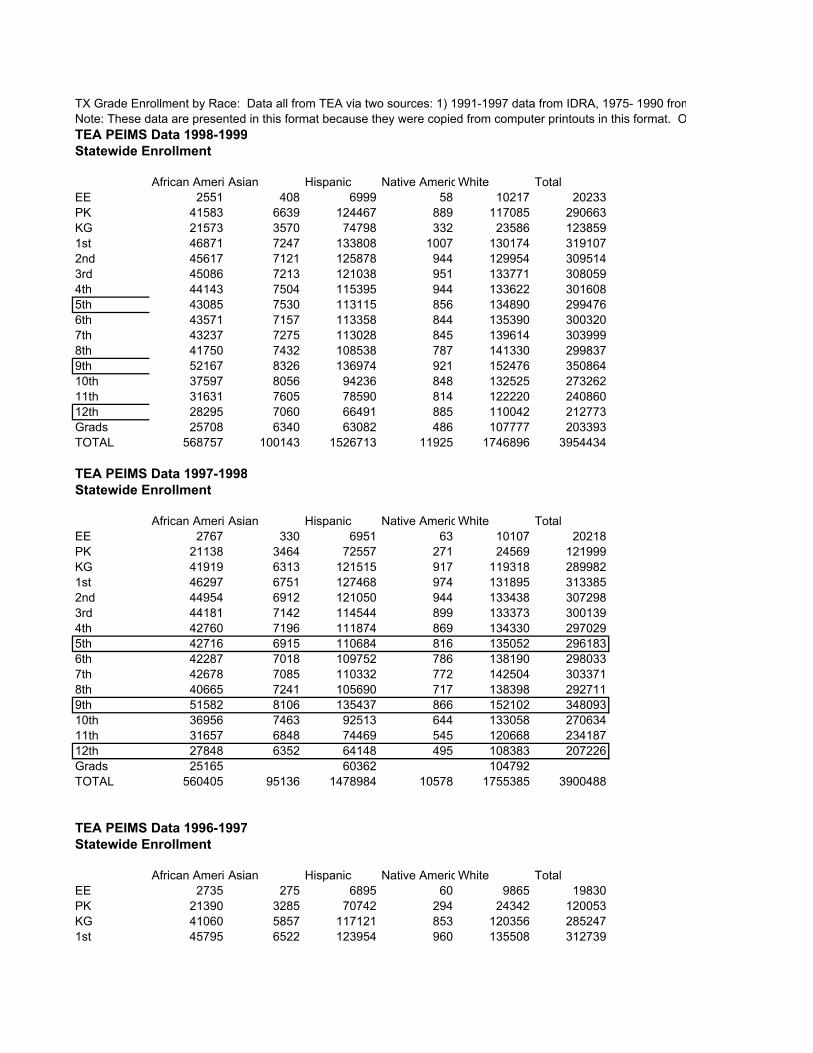
TX Grade Enrollment by Race: Data all from TEA via two sources: 1) 1991-1997 data from IDRA, 1975- 1990 fromNote: These data are presented in this format because they were copied from computer printouts in this format. OTEA PEIMS Data 1998-1999Statewide Enrollment
African AmericAsian Hispanic Native AmericWhite TotalEE 2551 408 6999 58 10217 20233PK 41583 6639 124467 889 117085 290663KG 21573 3570 74798 332 23586 1238591st 46871 7247 133808 1007 130174 3191072nd 45617 7121 125878 944 129954 3095143rd 45086 7213 121038 951 133771 3080594th 44143 7504 115395 944 133622 3016085th 43085 7530 113115 856 134890 2994766th 43571 7157 113358 844 135390 3003207th 43237 7275 113028 845 139614 3039998th 41750 7432 108538 787 141330 2998379th 52167 8326 136974 921 152476 35086410th 37597 8056 94236 848 132525 27326211th 31631 7605 78590 814 122220 24086012th 28295 7060 66491 885 110042 212773Grads 25708 6340 63082 486 107777 203393TOTAL 568757 100143 1526713 11925 1746896 3954434
TEA PEIMS Data 1997-1998Statewide Enrollment
African AmericAsian Hispanic Native AmericWhite TotalEE 2767 330 6951 63 10107 20218PK 21138 3464 72557 271 24569 121999KG 41919 6313 121515 917 119318 2899821st 46297 6751 127468 974 131895 3133852nd 44954 6912 121050 944 133438 3072983rd 44181 7142 114544 899 133373 3001394th 42760 7196 111874 869 134330 2970295th 42716 6915 110684 816 135052 2961836th 42287 7018 109752 786 138190 2980337th 42678 7085 110332 772 142504 3033718th 40665 7241 105690 717 138398 2927119th 51582 8106 135437 866 152102 34809310th 36956 7463 92513 644 133058 27063411th 31657 6848 74469 545 120668 23418712th 27848 6352 64148 495 108383 207226Grads 25165 60362 104792TOTAL 560405 95136 1478984 10578 1755385 3900488
TEA PEIMS Data 1996-1997Statewide Enrollment
African AmericAsian Hispanic Native AmericWhite TotalEE 2735 275 6895 60 9865 19830PK 21390 3285 70742 294 24342 120053KG 41060 5857 117121 853 120356 2852471st 45795 6522 123954 960 135508 312739
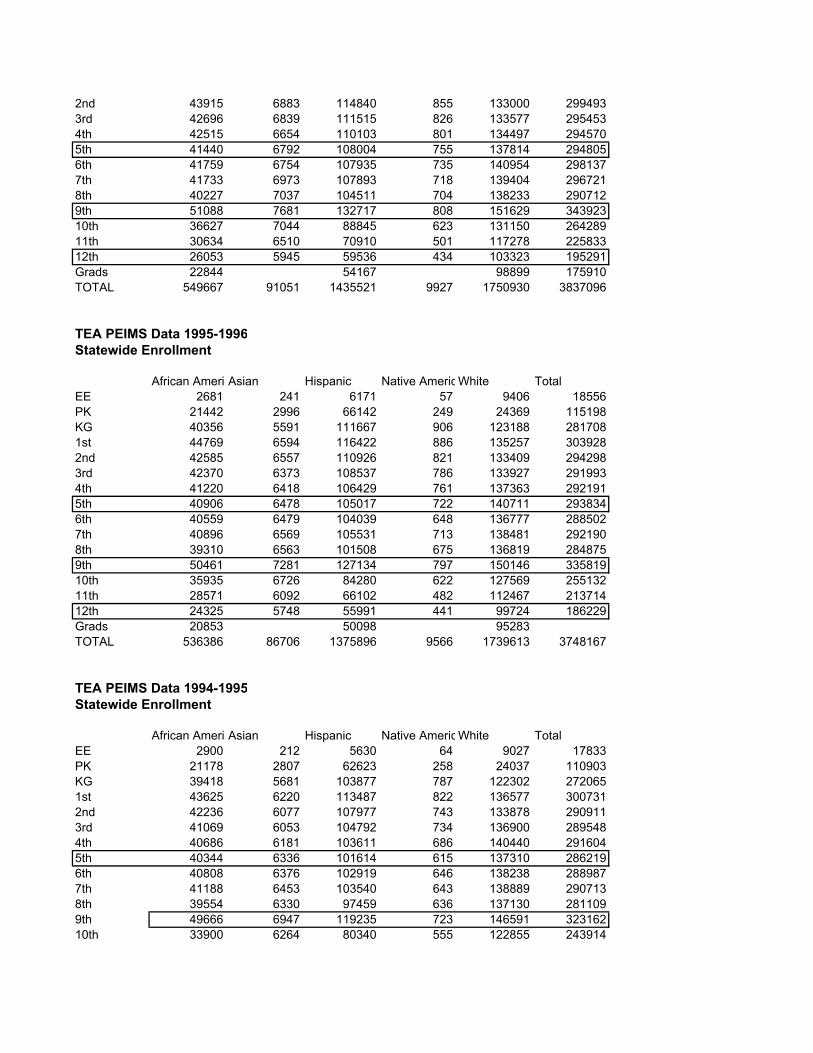
2nd 43915 6883 114840 855 133000 2994933rd 42696 6839 111515 826 133577 2954534th 42515 6654 110103 801 134497 2945705th 41440 6792 108004 755 137814 2948056th 41759 6754 107935 735 140954 2981377th 41733 6973 107893 718 139404 2967218th 40227 7037 104511 704 138233 2907129th 51088 7681 132717 808 151629 34392310th 36627 7044 88845 623 131150 26428911th 30634 6510 70910 501 117278 22583312th 26053 5945 59536 434 103323 195291Grads 22844 54167 98899 175910TOTAL 549667 91051 1435521 9927 1750930 3837096
TEA PEIMS Data 1995-1996Statewide Enrollment
African AmericAsian Hispanic Native AmericWhite TotalEE 2681 241 6171 57 9406 18556PK 21442 2996 66142 249 24369 115198KG 40356 5591 111667 906 123188 2817081st 44769 6594 116422 886 135257 3039282nd 42585 6557 110926 821 133409 2942983rd 42370 6373 108537 786 133927 2919934th 41220 6418 106429 761 137363 2921915th 40906 6478 105017 722 140711 2938346th 40559 6479 104039 648 136777 2885027th 40896 6569 105531 713 138481 2921908th 39310 6563 101508 675 136819 2848759th 50461 7281 127134 797 150146 33581910th 35935 6726 84280 622 127569 25513211th 28571 6092 66102 482 112467 21371412th 24325 5748 55991 441 99724 186229Grads 20853 50098 95283TOTAL 536386 86706 1375896 9566 1739613 3748167
TEA PEIMS Data 1994-1995Statewide Enrollment
African AmericAsian Hispanic Native AmericWhite TotalEE 2900 212 5630 64 9027 17833PK 21178 2807 62623 258 24037 110903KG 39418 5681 103877 787 122302 2720651st 43625 6220 113487 822 136577 3007312nd 42236 6077 107977 743 133878 2909113rd 41069 6053 104792 734 136900 2895484th 40686 6181 103611 686 140440 2916045th 40344 6336 101614 615 137310 2862196th 40808 6376 102919 646 138238 2889877th 41188 6453 103540 643 138889 2907138th 39554 6330 97459 636 137130 2811099th 49666 6947 119235 723 146591 32316210th 33900 6264 80340 555 122855 243914
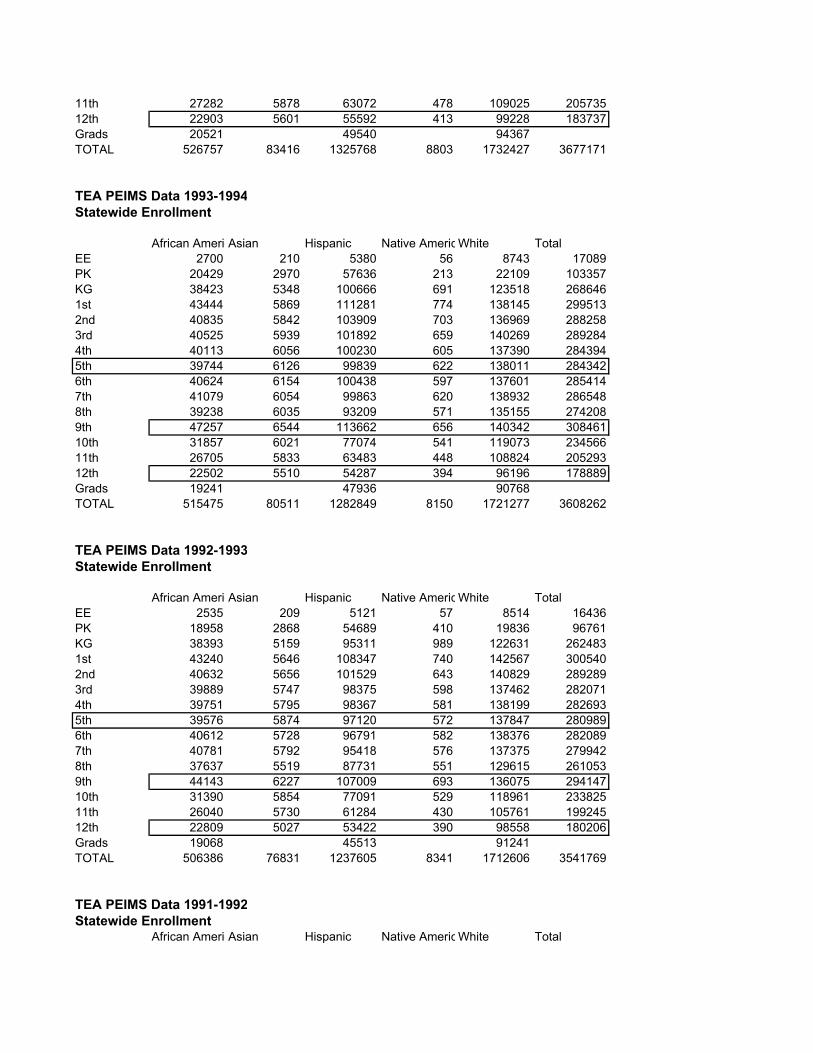
11th 27282 5878 63072 478 109025 20573512th 22903 5601 55592 413 99228 183737Grads 20521 49540 94367TOTAL 526757 83416 1325768 8803 1732427 3677171
TEA PEIMS Data 1993-1994Statewide Enrollment
African AmericAsian Hispanic Native AmericWhite TotalEE 2700 210 5380 56 8743 17089PK 20429 2970 57636 213 22109 103357KG 38423 5348 100666 691 123518 2686461st 43444 5869 111281 774 138145 2995132nd 40835 5842 103909 703 136969 2882583rd 40525 5939 101892 659 140269 2892844th 40113 6056 100230 605 137390 2843945th 39744 6126 99839 622 138011 2843426th 40624 6154 100438 597 137601 2854147th 41079 6054 99863 620 138932 2865488th 39238 6035 93209 571 135155 2742089th 47257 6544 113662 656 140342 30846110th 31857 6021 77074 541 119073 23456611th 26705 5833 63483 448 108824 20529312th 22502 5510 54287 394 96196 178889Grads 19241 47936 90768TOTAL 515475 80511 1282849 8150 1721277 3608262
TEA PEIMS Data 1992-1993Statewide Enrollment
African AmericAsian Hispanic Native AmericWhite TotalEE 2535 209 5121 57 8514 16436PK 18958 2868 54689 410 19836 96761KG 38393 5159 95311 989 122631 2624831st 43240 5646 108347 740 142567 3005402nd 40632 5656 101529 643 140829 2892893rd 39889 5747 98375 598 137462 2820714th 39751 5795 98367 581 138199 2826935th 39576 5874 97120 572 137847 2809896th 40612 5728 96791 582 138376 2820897th 40781 5792 95418 576 137375 2799428th 37637 5519 87731 551 129615 2610539th 44143 6227 107009 693 136075 29414710th 31390 5854 77091 529 118961 23382511th 26040 5730 61284 430 105761 19924512th 22809 5027 53422 390 98558 180206Grads 19068 45513 91241TOTAL 506386 76831 1237605 8341 1712606 3541769
TEA PEIMS Data 1991-1992Statewide Enrollment
African AmericAsian Hispanic Native AmericWhite Total
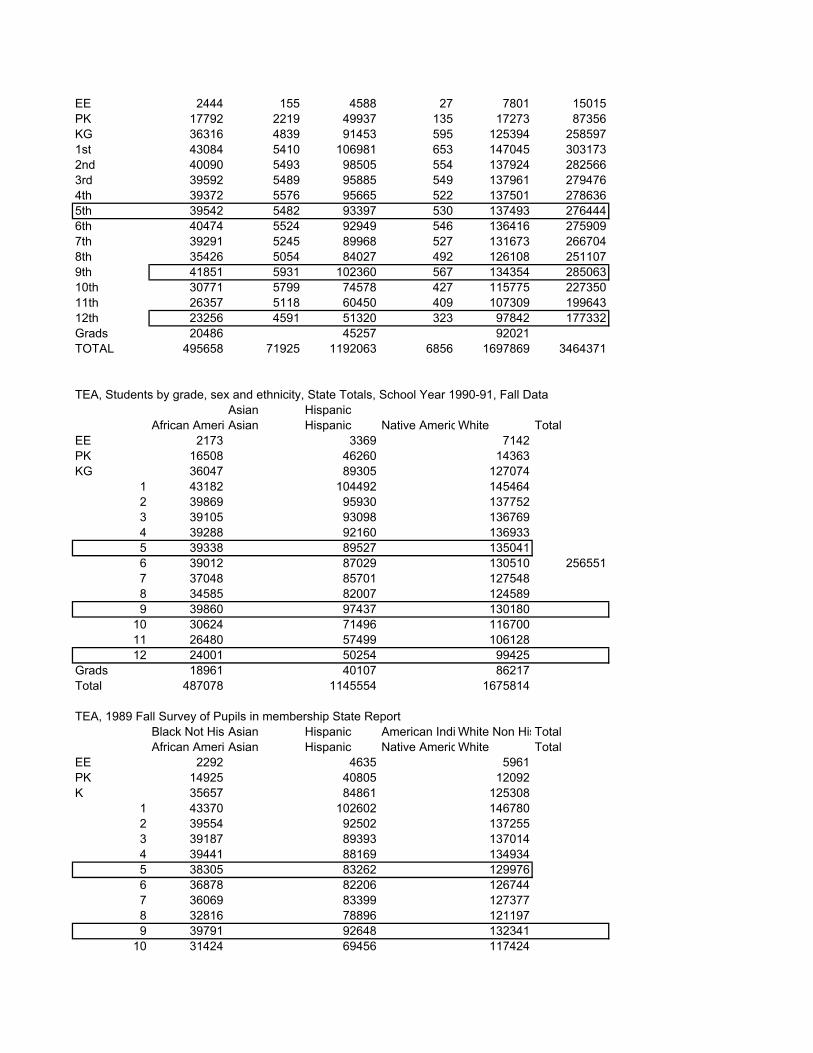
EE 2444 155 4588 27 7801 15015PK 17792 2219 49937 135 17273 87356KG 36316 4839 91453 595 125394 2585971st 43084 5410 106981 653 147045 3031732nd 40090 5493 98505 554 137924 2825663rd 39592 5489 95885 549 137961 2794764th 39372 5576 95665 522 137501 2786365th 39542 5482 93397 530 137493 2764446th 40474 5524 92949 546 136416 2759097th 39291 5245 89968 527 131673 2667048th 35426 5054 84027 492 126108 2511079th 41851 5931 102360 567 134354 28506310th 30771 5799 74578 427 115775 22735011th 26357 5118 60450 409 107309 19964312th 23256 4591 51320 323 97842 177332Grads 20486 45257 92021TOTAL 495658 71925 1192063 6856 1697869 3464371
TEA, Students by grade, sex and ethnicity, State Totals, School Year 1990-91, Fall DataAsian Hispanic
African AmericAsian Hispanic Native AmericWhite TotalEE 2173 3369 7142PK 16508 46260 14363KG 36047 89305 127074
1 43182 104492 1454642 39869 95930 1377523 39105 93098 1367694 39288 92160 1369335 39338 89527 1350416 39012 87029 130510 2565517 37048 85701 1275488 34585 82007 1245899 39860 97437 130180
10 30624 71496 11670011 26480 57499 10612812 24001 50254 99425
Grads 18961 40107 86217Total 487078 1145554 1675814
TEA, 1989 Fall Survey of Pupils in membership State ReportBlack Not His Asian Hispanic American Indi White Non HisTotalAfrican AmericAsian Hispanic Native AmericWhite Total
EE 2292 4635 5961PK 14925 40805 12092K 35657 84861 125308
1 43370 102602 1467802 39554 92502 1372553 39187 89393 1370144 39441 88169 1349345 38305 83262 1299766 36878 82206 1267447 36069 83399 1273778 32816 78896 1211979 39791 92648 132341
10 31424 69456 117424
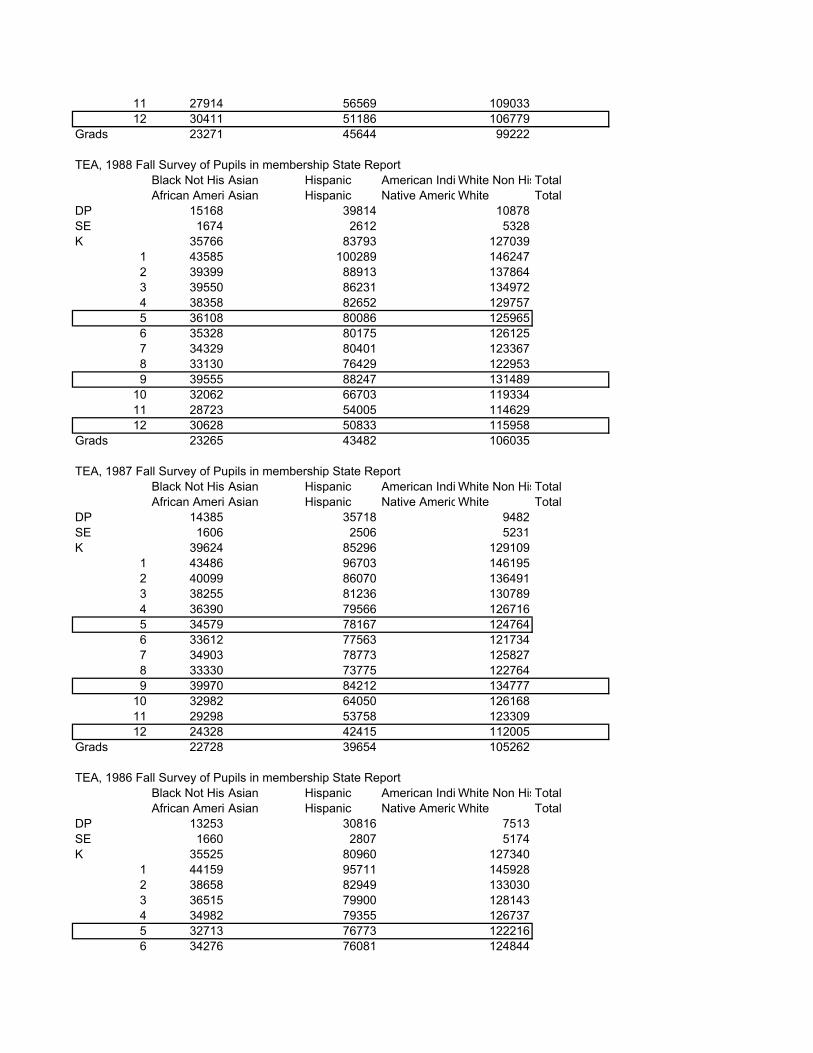
11 27914 56569 10903312 30411 51186 106779
Grads 23271 45644 99222
TEA, 1988 Fall Survey of Pupils in membership State ReportBlack Not His Asian Hispanic American Indi White Non HisTotalAfrican AmericAsian Hispanic Native AmericWhite Total
DP 15168 39814 10878SE 1674 2612 5328K 35766 83793 127039
1 43585 100289 1462472 39399 88913 1378643 39550 86231 1349724 38358 82652 1297575 36108 80086 1259656 35328 80175 1261257 34329 80401 1233678 33130 76429 1229539 39555 88247 131489
10 32062 66703 11933411 28723 54005 11462912 30628 50833 115958
Grads 23265 43482 106035
TEA, 1987 Fall Survey of Pupils in membership State ReportBlack Not His Asian Hispanic American Indi White Non HisTotalAfrican AmericAsian Hispanic Native AmericWhite Total
DP 14385 35718 9482SE 1606 2506 5231K 39624 85296 129109
1 43486 96703 1461952 40099 86070 1364913 38255 81236 1307894 36390 79566 1267165 34579 78167 1247646 33612 77563 1217347 34903 78773 1258278 33330 73775 1227649 39970 84212 134777
10 32982 64050 12616811 29298 53758 12330912 24328 42415 112005
Grads 22728 39654 105262
TEA, 1986 Fall Survey of Pupils in membership State ReportBlack Not His Asian Hispanic American Indi White Non HisTotalAfrican AmericAsian Hispanic Native AmericWhite Total
DP 13253 30816 7513SE 1660 2807 5174K 35525 80960 127340
1 44159 95711 1459282 38658 82949 1330303 36515 79900 1281434 34982 79355 1267375 32713 76773 1222166 34276 76081 124844

7 35792 78827 1273978 33072 72825 1262069 41037 80914 142039
10 33315 61823 13605311 27312 46998 12111112 27082 44272 112218
Grads 22479 39682 102831
TEA, 1985 Fall Survey of Pupils in membership State ReportBlack Not His Asian Hispanic American Indi White Non HisTotalAfrican AmericAsian Hispanic Native AmericWhite Total
DP 9749 22081 4670SE 1327 2205 4593K 35302 77927 123836
1 42770 90899 1412062 36305 80012 1284393 35016 78715 1271914 33379 76784 1224985 32327 74465 1238446 34506 74537 1248007 35670 78099 1304388 33951 69804 1326439 40733 79160 151041
10 31501 55579 13358711 27536 46952 12025712 30126 44929 108523
Grads 21754 38142 98053
TEA, 1984 Fall Survey of Pupils in membership State ReportBlack Not His Asian Hispanic American Indi White Non HisTotalAfrican AmericAsian Hispanic Native AmericWhite Total
PK 2983 4023 5674K 33269 70413 115109
1 39988 86340 1350402 35075 78567 1268703 33110 75521 1216584 33128 75115 1235175 32785 72409 1221386 34689 72901 1268357 35834 74816 1359398 35053 70003 1430329 38642 72611 148778
10 31646 56412 13209311 28398 45827 11508112 31959 42846 109507
Grads 22555 36021 97962
TEA, 1983 Fall Survey of Pupils in membership State ReportBlack Not His Asian Hispanic American Indi White Non HisTotalAfrican AmericAsian Hispanic Native AmericWhite Total
PK 2979 3906 5848K 30318 65700 107873
1 38672 85484 1318932 32998 76422 1208443 33138 75054 1223064 32960 72386 120531
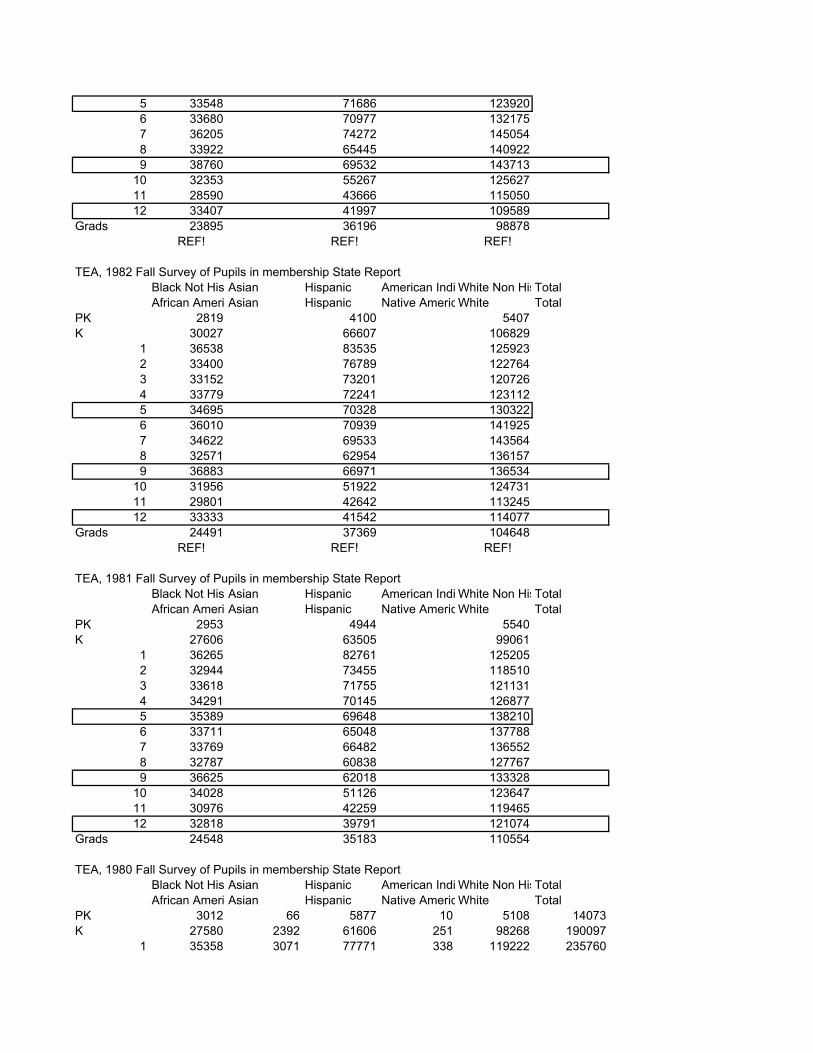
5 33548 71686 1239206 33680 70977 1321757 36205 74272 1450548 33922 65445 1409229 38760 69532 143713
10 32353 55267 12562711 28590 43666 11505012 33407 41997 109589
Grads 23895 36196 98878#REF! #REF! #REF!
TEA, 1982 Fall Survey of Pupils in membership State ReportBlack Not His Asian Hispanic American Indi White Non HisTotalAfrican AmericAsian Hispanic Native AmericWhite Total
PK 2819 4100 5407K 30027 66607 106829
1 36538 83535 1259232 33400 76789 1227643 33152 73201 1207264 33779 72241 1231125 34695 70328 1303226 36010 70939 1419257 34622 69533 1435648 32571 62954 1361579 36883 66971 136534
10 31956 51922 12473111 29801 42642 11324512 33333 41542 114077
Grads 24491 37369 104648#REF! #REF! #REF!
TEA, 1981 Fall Survey of Pupils in membership State ReportBlack Not His Asian Hispanic American Indi White Non HisTotalAfrican AmericAsian Hispanic Native AmericWhite Total
PK 2953 4944 5540K 27606 63505 99061
1 36265 82761 1252052 32944 73455 1185103 33618 71755 1211314 34291 70145 1268775 35389 69648 1382106 33711 65048 1377887 33769 66482 1365528 32787 60838 1277679 36625 62018 133328
10 34028 51126 12364711 30976 42259 11946512 32818 39791 121074
Grads 24548 35183 110554
TEA, 1980 Fall Survey of Pupils in membership State ReportBlack Not His Asian Hispanic American Indi White Non HisTotalAfrican AmericAsian Hispanic Native AmericWhite Total
PK 3012 66 5877 10 5108 14073K 27580 2392 61606 251 98268 190097
1 35358 3071 77771 338 119222 235760
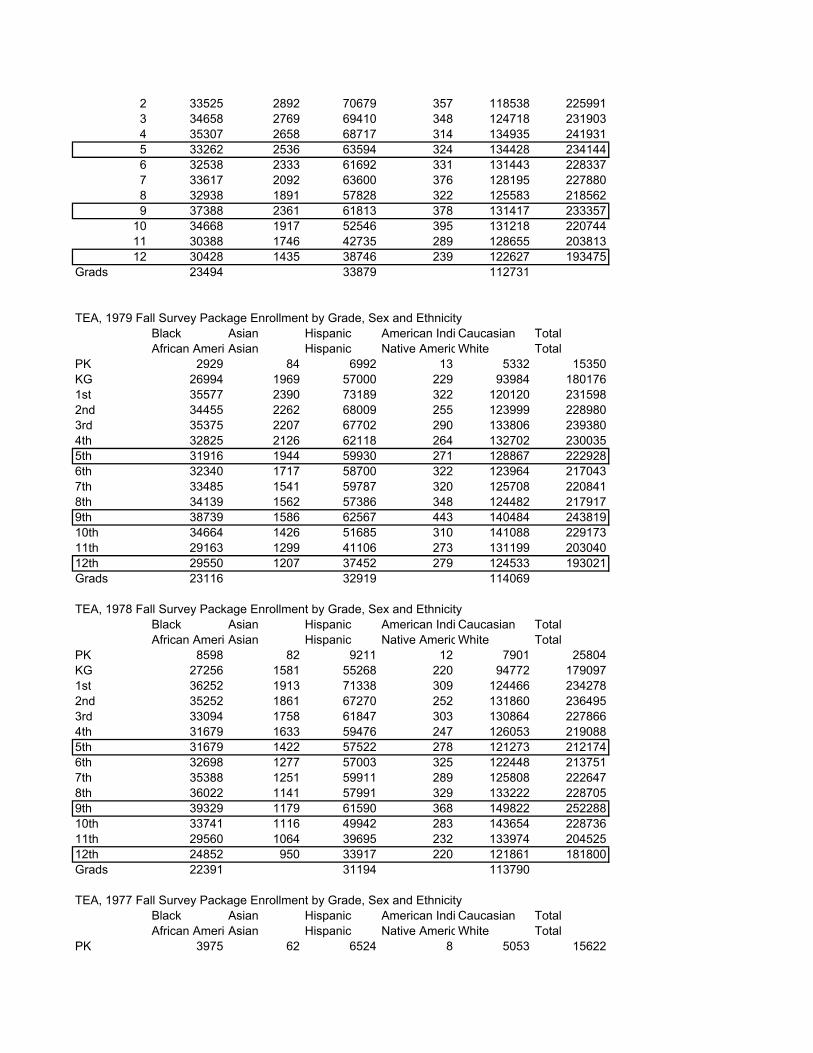
2 33525 2892 70679 357 118538 2259913 34658 2769 69410 348 124718 2319034 35307 2658 68717 314 134935 2419315 33262 2536 63594 324 134428 2341446 32538 2333 61692 331 131443 2283377 33617 2092 63600 376 128195 2278808 32938 1891 57828 322 125583 2185629 37388 2361 61813 378 131417 233357
10 34668 1917 52546 395 131218 22074411 30388 1746 42735 289 128655 20381312 30428 1435 38746 239 122627 193475
Grads 23494 33879 112731
TEA, 1979 Fall Survey Package Enrollment by Grade, Sex and EthnicityBlack Asian Hispanic American Indi Caucasian TotalAfrican AmericAsian Hispanic Native AmericWhite Total
PK 2929 84 6992 13 5332 15350KG 26994 1969 57000 229 93984 1801761st 35577 2390 73189 322 120120 2315982nd 34455 2262 68009 255 123999 2289803rd 35375 2207 67702 290 133806 2393804th 32825 2126 62118 264 132702 2300355th 31916 1944 59930 271 128867 2229286th 32340 1717 58700 322 123964 2170437th 33485 1541 59787 320 125708 2208418th 34139 1562 57386 348 124482 2179179th 38739 1586 62567 443 140484 24381910th 34664 1426 51685 310 141088 22917311th 29163 1299 41106 273 131199 20304012th 29550 1207 37452 279 124533 193021Grads 23116 32919 114069
TEA, 1978 Fall Survey Package Enrollment by Grade, Sex and EthnicityBlack Asian Hispanic American Indi Caucasian TotalAfrican AmericAsian Hispanic Native AmericWhite Total
PK 8598 82 9211 12 7901 25804KG 27256 1581 55268 220 94772 1790971st 36252 1913 71338 309 124466 2342782nd 35252 1861 67270 252 131860 2364953rd 33094 1758 61847 303 130864 2278664th 31679 1633 59476 247 126053 2190885th 31679 1422 57522 278 121273 2121746th 32698 1277 57003 325 122448 2137517th 35388 1251 59911 289 125808 2226478th 36022 1141 57991 329 133222 2287059th 39329 1179 61590 368 149822 25228810th 33741 1116 49942 283 143654 22873611th 29560 1064 39695 232 133974 20452512th 24852 950 33917 220 121861 181800Grads 22391 31194 113790
TEA, 1977 Fall Survey Package Enrollment by Grade, Sex and EthnicityBlack Asian Hispanic American Indi Caucasian TotalAfrican AmericAsian Hispanic Native AmericWhite Total
PK 3975 62 6524 8 5053 15622

KG 32308 1281 55914 147 100050 1897001st 37310 1659 70918 223 133311 2434212nd 33508 1524 61515 233 129016 2257963rd 32234 1391 58960 213 125673 2184714th 31990 1189 57505 218 119272 2101745th 32500 1127 55782 248 119210 2088676th 33727 1085 56735 294 120282 2121237th 36959 986 60468 352 132449 2312148th 36558 930 58430 379 141994 2382919th 38291 996 59164 326 151667 25044410th 34665 919 48698 275 146614 23117111th 29355 818 38755 214 133671 20281312th 24180 829 32478 201 120566 178254Grads 21937 30230 114844
TEA, 1976 Fall Survey Package Enrollment by Grade, Sex and EthnicityBlack Asian Hispanic American Indi Caucasian Total
PK 8197 71 7526 16 8981KG 28984 1096 54778 168 1035891st 35054 1387 64562 253 1293022nd 32374 1217 58672 208 1236323rd 31919 1087 57383 292 1179734th 32595 1023 55373 235 1169915th 33925 958 56278 314 1189666th 35827 845 57698 335 1290047th 37342 831 60068 421 1422898th 35777 830 56341 370 1451149th 38226 850 57582 429 15369110th 34584 750 47603 357 14528811th 28677 718 36544 278 13318312th 23573 638 30248 219 117955Grads 21456 29062 112155G12/G9 0.62 0.75 0.53 0.51 0.77TOTAL 437054 12301 700656 3895 1685958
TEA, Enrollment by grade & ethnic group 1975-76Negro Oriental Spanish SurnaAmerican Indi Other Total
PK 3568 35 5085 12 3175KG 26501 848 49086 161 984441st 32835 1030 60555 235 1208332nd 31293 829 56138 242 1141503rd 31739 818 53461 237 1136264th 32561 818 54228 274 1145605th 33997 786 55909 306 1245806th 35476 763 56506 392 1367627th 35509 686 57132 371 1437848th 35572 688 53810 399 1466189th 36625 715 53768 407 15122010th 32656 756 43152 339 14353311th 27210 599 34083 248 12844312th 21801 575 28713 226 116190Grads 20528 28054 110533UNGRD 8037 28 8441 7 10121Sp. ED 9255 61 10753 37 17466
#REF! #REF! #REF! #REF! #REF!

m Ed Rincon who acquired data from Terry Hitchcock at TEA via fax 5-20-99 and 6-30-99, 12/99 and 3/7/00 to WHOriginal formats were replicated in order to make data input and verfication more easy. For some years, data on eth

hnic groups other than Blac

MINUTES OF TEXAS SBOE MEETING July 1990 Committee of the Whole 3. Adoption of Mastery Standards for the Texas Assessment of Academic Skills (TASS) Tests for the 1990-91 School year (Board Agenda, page I-1) As required by the Texas Education Code ß21.522, the board is charged with establishing levels of satisfactory performance on the TAAS tests. In June 1990, the board was presented with information for discussion and deliberation. At the July meeting, the board was asked to set mastery standards on the TAAS tests to be administered in the 1990-91 school year. Commissioner Kirby reiterated some of the information presented to Committee of the Whole during the Thursday, July 12, 1990, work session on the TAAS, noting the recommendations of the staff regarding this item. Mr. Davis asked for the rationale for the two-year phase in rather than going immediately to the 70% or a one-year phase in. The commissioner stated that this would give the board an opportunity to clearly set that 70% is the standard--to state the expectation and expect the schools to present the skills to the students and help the students develop those skills so that this is not an unreasonable expectation. Dr. Kirby said that since this is a different, more difficult test, the needed phase-in time is suggested at least until the results of the fall administration are known. Mr. Davis expressed concern that the test does not appear to be indicative of what is being presented in the classroom. Commissioner Kirby replied that the test is an accurate measurement of what students should be learning, but the test is moving much further in the areas of problem solving, higher order thinking skills, making inferences, and drawing conclusions. He said that it is not believed that at this point in time every student has been adequately prepared in those skills, because with the Texas Educational Assessment of Minimum Skills (TEAMS) tests, emphasis has been placed on the basic skills. The commissioner noted that the test drives the curriculum and that it will require a year or two to make that kind of adjustment in the focus of the curriculum. Mr. Davis again expressed concern for using a softer measurement on a test which is believed to be an accurate measurement. Commissioner Kirby commented that if the students have not been taught the skills measured on a test, there is the possibility of violating their rights by denying them graduation because they have not been taught the areas tested. Dr. Crawford cited an article which appeared in a Houston newspaper, which talks about the purpose of the new test. She said that the
Appendix 9: Responses to Two Questions Survey Here are the verbatim responses of scholars who kindly replied to my “Two questions” survey in the summer of 1999. The introduction to the survey and the two questions, as discussed in the text of this article were:
Imagine a very large school system that has been focusing on basic skills instruction for some years. The focus has been spurred in part by a high stakes test of basic skills. It is assumed that 80-90% of teachers have been covering the basic skills in their instruction. In light of current educational reform ideas, the system decides that it needs to move beyond basic skills teaching to focus in the future on problem solving, higher order thinking skills, making inferences and drawing conclusions. In light of this situation, and your expertise in studying school reform, my two questions to you are these: 1. How long would it likely take for this large school system to shift from having 80-90% of teachers teaching basic skills, to having 80-90% of teachers teaching the more advanced skills? 2. What would be the key ingredients required to make such a shift in instruction possible in the time you envision in your answer to the first question? Please keep you answers brief and email them to me by August 30. In exchange for your kindness in responding to my request, I will compile answers, distribute them to whoever responds, and explain the specific reason that motivates the questions.
Responses are listed in alphabetical order. Also, each of these correspondents, when contacted during the summer of 2000, generously gave permission for me to reproduce their answers (though a few asked first to be reminded of what they had said a year earlier). Note also, that one correspondent, Dan Koretz, did not actually answer the specific questions posed, but recast them to make them more answerable. Thanks again to these generous colleagues, who responded to two odd questions from me during the summer of 1999, when I had not even explained why I was asking. David K. Cohen: >1. How long would it likely take for this large school system to shift >from having 80-90% of teachers teaching basic skills, to having 80-90% >of teachers teaching the more advanced skills?
***It depends partly on what you mean by "...more advanced skills", how central a part they'd play in instruction. There is no canonical definition of "more advanced skills", and much confusion. There also is only the most primitive understanding of the materials and processes that might support the many changes which would be required to make the sorts of changes which you stipulate. So the only honest answer I can give is that the more extensive the changes your hypothetical system, the more time and human resources, and careful research on developing practice would be required. A really extensive change could not be accomplished in less than a decade, and might take much longer. 2. What would be the key ingredients required to make such a shift in instruction possible in the time you envision in your answer to the first question? ***Some of the key elements would include: extended, practice-based opportunities for teachers to learn; well developed links between assessment, curriculum, and the opportunities for teachers to learn; placing students' work and performance at the center of the schools' enterprise; leadership in schools and districts which supports such things; public education about public education in support of the changes. +++++++++++++++++++++++++++++++++++++++++++ Jane David: >1. How long would it likely take for this large school system to shift >from having 80-90% of teachers teaching basic skills, to having 80-90% >of teachers teaching the more advanced skills? From 10-20 years. We know from math studies that it takes three years for teachers to *begin* to change their practices; and we know that District 2's huge investment in elementary literacy professional development, and replacement of half the staff and principals, showed results on the order of 6-8 years. >2. What would be the key ingredients required to make such a shift in >instruction possible in the time you envision in your answer to the >first question? Nutshell: Massive teacher re-education and powerful recruitment strategies. The key ingredients are: (1) ongoing opportunities for teacher learning grounded in how students learn different subject matter (summer institutes,
school-based coaches, opportunities to observe master teachers, study groups, etc); (2) incentives for teachers to want to learn, including system leadership that values and invests in an array of opportunities and provides an explicit vision of the kind of instruction teachers are expected to provide; (3) investment in/selection of school leaders (principals) to support ongoing teacher learning; (4) curriculum and materials that communicate the kind of instruction expected. To achieve the shorter time frame, the key is the ability to replace weak teachers with strong teachers--which means both the wherewithal to move out weak teachers and a pool from which to find stronger replacements. +++++++++++++++++++++++++++++++++++++++++++ Dan Koretz: None of my work has directly answered your question, although some has looked at instructional change after initiatives of this sort. Based on that, I think the question needs to be recast to be answerable. First, neither teaching basic skills nor teaching problem solving are dichotomous variables. Most teachers will do both to varying degrees both before and after a reform. Second, the answer will hinge on what precisely is meant by problem-solving, etc. If the question is rephrased to something like this: 'How long will it take before an assessment-based reform can make major changes in the tenor of the mathematics instruction of the majority of teachers in a large jurisdiction' I'd say a reasonable expectation would be at least 3-4 years. +++++++++++++++++++++++++++++++++++++++++++ Hank Levin: The answers depend upon what type of effort is made. If the change effort is systemic and the commitment is clearly long-run (rather than an apparent whim of the board and the superintendent--both who will disappear over time), I think that significant inroads can be made in two years and transformation in five. I know that this sounds overly optimistic, but consider a system in which there are continuous staff development, continuous support and technical assistance, administrative encouragement, intrinsic and extrinsic incentives, public information on results, and a culture of commitment. Add to this transformation of local teacher training programs, careful selection of new teachers, and a strong public relations campaign, and things will move. Every administrator will have to become a cheerleader. The problem is that no district has ever been able to achieve these conditions. Further, this will be competing with basic skills testing that
is often high stakes and high visibility promoted by the states. The high-stakes nature of the states' testing may gain primacy over any district effort to move in a different direction. Under present circumstances, I think that even an earnest effort will get modest and mixed results over two years and somewhat stronger results over five years, but not transformation. Typically the districts will provide minimal professional development, meager support and technical assistance, skepticism by many administrators, lack of parental understanding and support, competition with state basic skills testing for attention, and so on. That is, success will need depend on a complete immersion in a very different culture. This is unlikely with predictable changes in school boards and superintendents. Some teachers will change their teaching substantially, others will be influenced by the trend. Others, yet, will see it as a passing fashion. +++++++++++++++++++++++++++++++++++++++++++ Hayes Mizell: 1. How long would it likely take for this large school system to shift from having 80-90% of teachers teaching basic skills, to having 80-90% of teachers teaching the more advanced skills? Probably seven to eight years. 2. What would be the key ingredients required to make such a shift in instruction possible in the time you envision in your answer to the first question? YEAR ONE: The school system engages teachers in a dialogue about what it means to "teach more advanced skills" as related to "basic skills" and whether and how these two priorities are complementary, inter-dependent, or at odds. YEAR TWO: The school system engages teachers in developing and adopting standards of teachers' - knowledge of subject matter content; - pedagogy; - assignments of student work; - assessment of student work. YEAR THREE: The school system trains all principals in understanding the teacher standards, teachers' classroom behaviors that are representative of the standards, and how to observe systematically teachers' classroom practice. The school system engages teachers in developing a process for assessing teachers' performance in relation to the standards.
The school system employs teachers based on their ability to meet the standards, or demonstrate within two years that they can meet the standards. YEAR FOUR: The school system engages teachers in rigorously conceiving systemic, coherent, and efficiently administered professional development that is primarily: - focused on the core subjects of mathematics, science, English/language arts, and social studies; - based at the building and classroom levels; - led by teachers who are exemplars of the kind of teaching the system wants to propagate AND who the system trains and supports as staff developers; - congruent with the teacher standards. The school system develops a process for rigorously evaluating the effects of professional development on teachers' behaviors and classroom practice. The school system assesses principals' performance on their effectiveness in monitoring teachers' classroom performance and targeting professional development for its improvement. The school system assesses teachers' performance based on teacher standards. YEARS FIVE - SEVEN: Implementation of new system of professional development. Annual review and improvement of professional development based on evaluations of professional development's effects. +++++++++++++++++++++++++++++++++++++++++++ Fred Newmann: Hello, Walter. Interesting questions. I base my answers largely on efforts we have made to train teachers and administrators to use our standards of authentic pedagogy and student achievement. [snip,snip] 1. The length of time would depend upon the intensity of effort in each year and whether the system approached this issue by training everyone at once or doing it in stages; e.g. high school teachers, then middle school, then elementary or vice versa. My answer to #2 assumes the system will try to train teachers at all grade levels simultaneously. It also assumes the sytem would be developing new assessments for all grade levels and subjects simultaneously. 2. First would be to train all teachers about the need for more challenging intellectual work and to introduce them to a set of standards that could guide their instruction, their assessment, and their evaluation of student work (e.g. such as our standards for authentic pedagogy). To do

this I think most teachers would need the equivalent of four full days, plus about 6 half days over the period of the initial year, then follow-up work for a couple of years amounting to about six half days a year. The training would involve intensive introductory sessions, work in school-based grade level and subject matter teams, and follow-up coaching initially by external authorities and then by peers. Second, the system would need to develop performance based tests consistent with the standards for authentic intellectual work (and with existing state standards) and help teachers to align curriculum with the standards. Doing this in the main subject areas for all grades would probably take at least six years. But the amount of time would depend upon the level of resources committed by the system and the competence of the system staff such work. My experience suggests that there is a very short supply, nationally, of people who know how, working collaboratively with teachers to develop large scale assessments of complex intellectual performance in the specific academic subjects (that we would consider authentic intellectual performance [WH Note: To his original survey reply in August 1999, Fred Neumann provided slight editorial revisions (such as adding the last two sentences) via personal commmunication, July 10, 2000.] +++++++++++++++++++++++++++++++++++++++++++ Stan Pogrow: I am not sure what the goal is. Is it to teach inference and higher order thinking all the time or to simply develop a better balance. Hopefully it is the latter and the goal of thinking is not viewed in opposition to basic skills. Indeed, my research over 19 years has shown that it is possible to incorporate thinking development in ways that accelerates the learning of basic skills. I also suspect that you will find that there is already a great deal of emphasis on thinking and problem solving in the classrooms with higher performing students. My experience is also that teachers in lower performing classrooms do incorporate inference but only a very few students participate when they do, and the tasks are relatively simple inference. Getting teachers to incorporate more thinking and problem solving in ways that increase learning requires three elements. Appropriate training that goes
beyond advocacy to include specific methods. Appropriate materials to support such forms of teaching which, despite the hype, are rare. And the most difficult is getting disadvantaged students to the point that they feel comfortable dealing with more open ended types of learning, particularly after the third grade. Most teachers stop using problem solving in low performing classes because of the lack of student response. The first two issues can be dealt with in a two year time frame. The last one is a bit trickier. Providing the intensity of exposure to disadvantaged students so that they come to understand how to deal with abstractions and feel confident applying their substantial intellects to such endeavors requires two years of intensive small group work with a highly specialized teacher. This would require a 3-4 year commitment to fully implement. +++++++++++++++++++++++++++++++++++++++++++ Ted Sizer: Dear Walt.... Those are tough questions, difficult to answer in the abstract. Much depends on the intellectual power of the faculty in this large high school. Nonetheless, some hunches: --It will take at least five years (and some big professional development bucks) to shift your large school so that at least over half the classes are "beyond rudimentary thinking." Two steps are involved: making sure that teachers themselves know and value what demanding intellectual work is; and preparing them as scholars to be able to teach toward it. -- Key ingredients? Professional development time, in the disciplines, in pedagogy and in the ways and means of appropriate assessment. Student loads per teacher of sixty or fewer pupils (one must really know each kid's mind well...). Longer, flexible class time. Time every day for "teacher talk"-- that is, consultation among the staff. Simpler curriculum to allow for deeper work. All this can be done. I have seen it done. All that is required is determination, political courage, money (time), dogged persistence and higher authorities who don't constantly jerk the school around. +++++++++++++++++++++++++++++++++++++++++++ Adam Stoll:
I'll begin by saying something I'm sure many other will say. I don't expect it is likely that 80-90% of the teachers in a large district will ever truly teach the same way. Additionally, I don't think practice sorts neatly into one of these two categories ( i.e. that which promotes basic skills or advanced skills). Even teachers who concentrate heavily on basic skills do some things that promote the acquisition of higher order skills, and similarly teachers who are very focused on advanced skills often devote attention to basic skills. When examined in depth, teaching practice often does not sort neatly into a "basic skills or "advanced skills" category. When teachers' practice is examined in terms of content, pedagogy and approaches toward student assessment, practice can be plotted along a continuum. I suspect most teachers end up somewhere in between purely promoting basic and advanced skills in each of these domains. That said, I'll play along and respond to your questions. 1. It's immensely hard to get a critical mass of teachers within a school, let alone a district, to significantly change their practice. I would think getting a majority to exhibit practice that is highly supportive of advanced skill acquisition would be very optimistic, but possibly attainable under optimal circumstances. I can only imagine having 80-90 % of teachers place a lot of emphasis on "teaching the more advanced skills" if some pretty sweeping changes occurred. I think it would take at least 20 years for these changes to begin affecting practice on this scale. 2. Key ingredients: Change Preservice Preparation: Unless preservice programs at the schools of ed supplying most of the districts' teachers are preparing teachers to teach this way, I doubt you'll achieve change on this scale. Create Incentives for Teachers to Teach More Advanced Skills: Teachers have to believe there's alignment between this type of teaching and the state and district academic standards and assessments. Principals have to look for this type of instruction in their appraisals of teachers. Provide High Quality Professional Development and Establish a Real Learning Community Among Teachers: Under almost any scenario, you're probably going to have to support teachers' growth and development in the profession. Many of the approaches teachers will take toward promoting student inquiry will evolve through trial and error and reflective practice. Teachers can play an important role in reinforcing each others' learning. Good professional developers can as well. Community Outreach: If community members and school board members don't value this type of instruction they can push for a return to what's familiar. It's important to regard them as stakeholders.

Provide Appropriate Resources: This type of instruction requires appropriate and sufficient instructional resources (not just textbooks). It would also likely be aided by flexible scheduling. +++++++++++++++++++++++++++++++++++++++++++ Anne Wheelock: I am probably crazy even to attempt a response to your challenging question, but in honor of a few other crazy things we have attempted together, I'll take a stab at shaping an answer. First, I begin with an assumption that kids do not learn "basic skills" or "thinking skills" apart from one another. To my mind, using basic skills requires thinking. I am leary of any scenario that poses these as two separate domains, and this is probably worth some discussion. I have visited many schools that report they cover a basic skills curriculum -- but oddly, the kids don't learn to USE basic skills or develop judgment about WHY, WHEN, HOW TO APPLY basic skills. One example: In a Boston middle school in the project John and Mary Ellen and Katie worked on, I was the community reviewer who reviewed 8th grade tests (some NAEP questions, some new questions.) In all the essays I read, not one used question marks appropriately (i.e. at all). When I reflected this observation back to my team, the teacher involved responded, "I don't know why that's true. We study question marks for three days in October." Is this relevant to your query? I don't know, but it's what came to my mind and I wanted to pass it on. OK, moving along: I'm imaginging that the shift you envision would take varying amounts of time, depending on conditions. There are adoption cycles to go through, retiring teachers to be replaced, etc. But for argument's sake, let's imagine such a shift could occur in 10 to 15 years, depending on: 1. Leadership -- from superintendent, all principals, teachers union, school board, community leaders that "a thinking skills curriculum for all" is the primary basis for teaching and learning in the district. Leadership is made concrete in the reallocation of extraneous expenditures and allocation of new expenditures to support this goal. Leadership also means the Central Office is full of experts in curriculum and instruction who are available to schools for technical assistance, networking, professional development, consultation, etc. Central Office leadership also had to facilitate a lot of networking, so that schools don't get
isolated from one another (and to foster high expectations for student work and professional practice across all schools), and leadership support. Leadership has to be consistent. The principal turnover in urban schools is often the root of the dysfunctional nature of many --- not to mention the turnover in the superintendent's office. 2. Organization of teachers and students into "small learning communties" and/or other structures (like looping) that support long-term teacher-student relationships. I am very much in the Debbie Meier-Ted Sizer et al. camp that argues that it is very difficult to help students learn to process information, reason, develop projects that demonstrate thinking in a factory-model school. Kids learn to reason when they are engaged with adults who are thinking and reasoning over time, when these adults get to know how different students approach learning, what each does when s/he encounters hurdles to learning, difficult problems, etc. These "learning communities," teams, or whatever they are called need to be heterogeneously grouped; a thinking skills curriculum can't get implemented to its potential in a tracked school. 3. Materials -- and the money to make sure every school's materials are up-to-date. Precisely because hardly anyone mentions this, this needs to be made explicit. Let's talk, for example, about school libraries. In the urban districts in which Library Power worked, the average copyright date of library books (in 1995) was 1968, including reference books. If students are going to learn to process information from multiple sources to research questions, they need access to multiple sources of information -- reference materials, the Internet, CD-ROMs, etc. Without such materials, students and teachers are at the mercy of textbooks, and however good the textbook it, it is just one source. Any proposal to make the shift you talk about must include money to hire a certified full-time librarian in each school and money to purchase and maintain an up-to-date school library collection that matches the school's curriculum.
I would guess that much of what I've said about school libraries would also apply to science and math materials. I have less knowledge about the status of such materials in urban schools than I have about school libraries, but in my travels, I've certainly heard many complaints from science teachers in particular that science is a low-priority when "basic skills" of reading and math are tested. At best, it seems, many urban elementary schools do a little science -- and hardly ever with any decent materials. Again, many are limited to a textbook. 4. Curriculum. Standards are great, but they are no substitute for real curriculum materials. I am not talking about teacher-proof, standardized, cookie-cutter DISTAR-type materials. Rather, I think urban schools need access to something that takes teachers beyond the textbook and students into reading whole books, writing material that has a real audience, engaging in Socratic discussions, doing science, doing history. Some curriculum approaches and packages do that. These include (to my knowledge): Junior Great Books, HOTS, Philosophy for Children, some of the NSF-developed science materials, the NCTM-standards-based math curricula, Reading for Real, the Johns Hopkins curriculum based on Joy Hakim's history books. I would include new assessments under this category, but I would not overweight the influence of these to change to a thinking skills curriculum as many others do. I do think assessments have a place in the shift, but I see them as tied to curriculum and professional development and opportunities for teachers to network to discuss student work. 5. Professional development. Professional development is a major vehicle for changing the professional culture, which is essential to changing expectations and teacher relationships. This is a big-ticket item. I am drawing from Richard Elmore's and Deanna Burney's paper on professional development in District 2 in NYC. Some Library Power districts spent up to 38% of their grants on professional development, primarily for librarians and school teams. With some exceptions (teacher study groups that take place as part of a larger strategy for school change, for example, or some one-shot conference type activities) professional development should NOT be general. It should be tied explicitly to implementing a thinking skills curriculum -- in

subject areas, in information processing. It has to: (a) account for teacher turnover (so it can't be a one-shot deal and has to be ongoing); (b) to take place over several years, so that teachers can learn from mistakes, adapt curriculum in a way that makes it theirs, see the results in student learning (which changes expectations among both students and teachers); (c) include in-school, in-class coaching, phone consultation, and demonstration lessons for new curriculum. (d) be school-based, focused on getting teachers into productive professional relationships in each school, department, grade, etc. (e) include special education and bilingual teachers -- who are often left outside of such efforts. I've written a bit on the dilemmas of shifting to a thinking skills curriculum in a paper I've done for the Great Books Foundation on Junior Great Books (a much shorter version of which will be in EdLeadership in October, 1999). The challenge for many urban teachers is to move from questioning strategies that check on students' knowledge of "the right answer" to strategies that provoke thinking. This is ***really**** hard for a number of reasons, and it takes a couple of years practice at least and a lot of support for teachers to become comfortable with this kind of curriculum school wide. 6. Extra-help opportunities that support students' full participation in a thinking skills curriculum. This could mean targeted support for students who need extra help or extra-help opportunities available for all when they need it. It could mean HOTS; it could mean computer-assisted drill on basic skills. I am impressed with the papers Bob Balfour (from the Talent Development program at Johns Hopkins) has done that report that when ***teachers*** feel that the weaker students are being "taken care of" in terms of getting extra help with basic skills, they themselves feel they can move forward with the thinking skills curriculum without worrying about kids who might not be "getting it." This seems like a very important insight to me. (See also http://www.bc.edu/ctest under "social promotion, part 2" for other ideas about offering extra help in middle grades schools.)

7. District wide networking. This is part of professional development. It's different in that it takes teachers outside the confines of their schools and into expanded professional relationships in which they can grow as scholars. Writing groups, Book groups, Socratic seminar groups, history groups, etc. would be part of this. 8. Student services. This doesn't get talked about much these days, but urban schools need better connections to social services, so that well-meaning teachers don't become preoccupied with students' social needs. Some research and many good arguments support the establishment of social services in every low-income urban school. School-based clinics have a good track record at helping to keep students coming to school, address social problems, support young parents, etc. The student services piece of KY education reform is an example. So that's it. I've probably forgotten some obvious things. I look forward to the compilation of responses your query has generated!
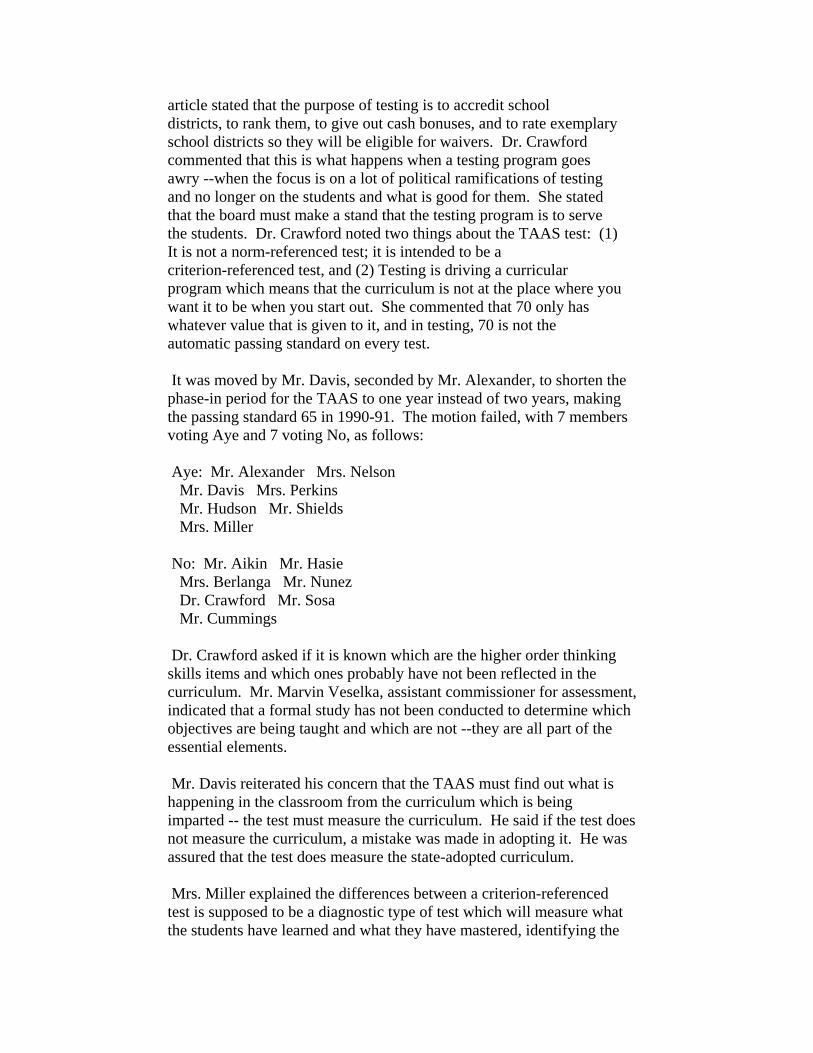
article stated that the purpose of testing is to accredit school districts, to rank them, to give out cash bonuses, and to rate exemplary school districts so they will be eligible for waivers. Dr. Crawford commented that this is what happens when a testing program goes awry --when the focus is on a lot of political ramifications of testing and no longer on the students and what is good for them. She stated that the board must make a stand that the testing program is to serve the students. Dr. Crawford noted two things about the TAAS test: (1) It is not a norm-referenced test; it is intended to be a criterion-referenced test, and (2) Testing is driving a curricular program which means that the curriculum is not at the place where you want it to be when you start out. She commented that 70 only has whatever value that is given to it, and in testing, 70 is not the automatic passing standard on every test. It was moved by Mr. Davis, seconded by Mr. Alexander, to shorten the phase-in period for the TAAS to one year instead of two years, making the passing standard 65 in 1990-91. The motion failed, with 7 members voting Aye and 7 voting No, as follows: Aye: Mr. Alexander Mrs. Nelson Mr. Davis Mrs. Perkins Mr. Hudson Mr. Shields Mrs. Miller No: Mr. Aikin Mr. Hasie Mrs. Berlanga Mr. Nunez Dr. Crawford Mr. Sosa Mr. Cummings Dr. Crawford asked if it is known which are the higher order thinking skills items and which ones probably have not been reflected in the curriculum. Mr. Marvin Veselka, assistant commissioner for assessment, indicated that a formal study has not been conducted to determine which objectives are being taught and which are not --they are all part of the essential elements. Mr. Davis reiterated his concern that the TAAS must find out what is happening in the classroom from the curriculum which is being imparted -- the test must measure the curriculum. He said if the test does not measure the curriculum, a mistake was made in adopting it. He was assured that the test does measure the state-adopted curriculum. Mrs. Miller explained the differences between a criterion-referenced test is supposed to be a diagnostic type of test which will measure what the students have learned and what they have mastered, identifying the
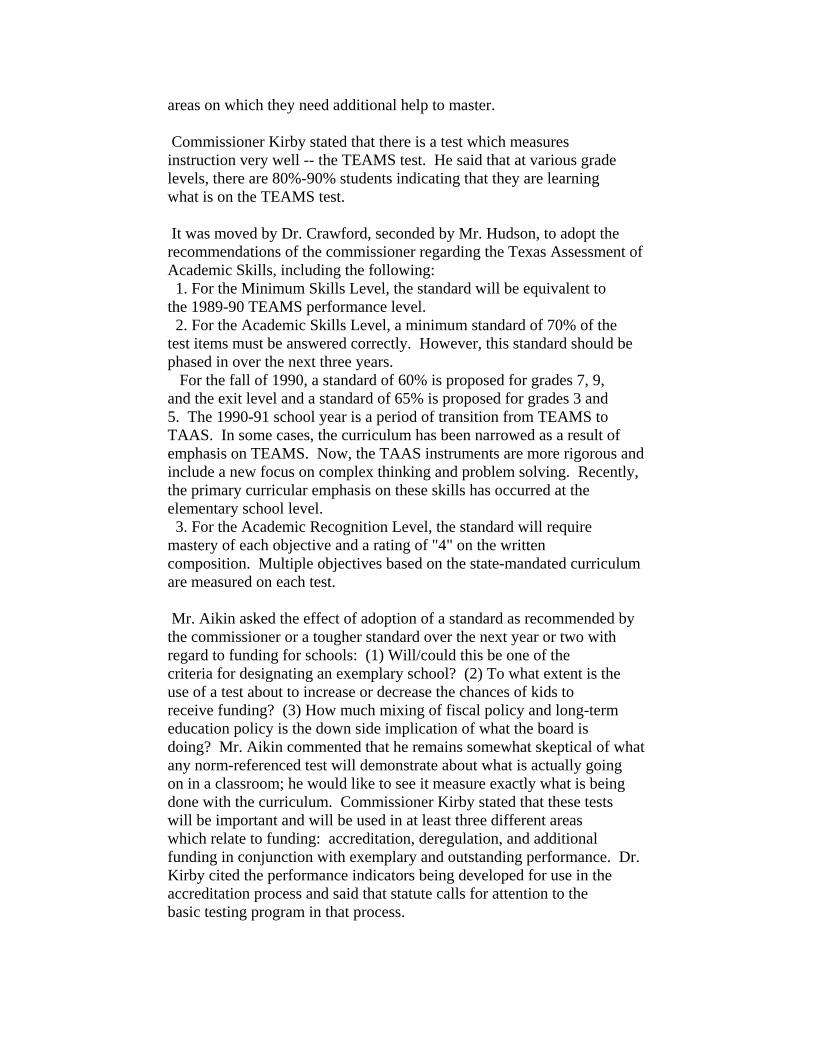
areas on which they need additional help to master. Commissioner Kirby stated that there is a test which measures instruction very well -- the TEAMS test. He said that at various grade levels, there are 80%-90% students indicating that they are learning what is on the TEAMS test. It was moved by Dr. Crawford, seconded by Mr. Hudson, to adopt the recommendations of the commissioner regarding the Texas Assessment of Academic Skills, including the following: 1. For the Minimum Skills Level, the standard will be equivalent to the 1989-90 TEAMS performance level. 2. For the Academic Skills Level, a minimum standard of 70% of the test items must be answered correctly. However, this standard should be phased in over the next three years. For the fall of 1990, a standard of 60% is proposed for grades 7, 9, and the exit level and a standard of 65% is proposed for grades 3 and 5. The 1990-91 school year is a period of transition from TEAMS to TAAS. In some cases, the curriculum has been narrowed as a result of emphasis on TEAMS. Now, the TAAS instruments are more rigorous and include a new focus on complex thinking and problem solving. Recently, the primary curricular emphasis on these skills has occurred at the elementary school level. 3. For the Academic Recognition Level, the standard will require mastery of each objective and a rating of "4" on the written composition. Multiple objectives based on the state-mandated curriculum are measured on each test. Mr. Aikin asked the effect of adoption of a standard as recommended by the commissioner or a tougher standard over the next year or two with regard to funding for schools: (1) Will/could this be one of the criteria for designating an exemplary school? (2) To what extent is the use of a test about to increase or decrease the chances of kids to receive funding? (3) How much mixing of fiscal policy and long-term education policy is the down side implication of what the board is doing? Mr. Aikin commented that he remains somewhat skeptical of what any norm-referenced test will demonstrate about what is actually going on in a classroom; he would like to see it measure exactly what is being done with the curriculum. Commissioner Kirby stated that these tests will be important and will be used in at least three different areas which relate to funding: accreditation, deregulation, and additional funding in conjunction with exemplary and outstanding performance. Dr. Kirby cited the performance indicators being developed for use in the accreditation process and said that statute calls for attention to the basic testing program in that process.

Dr. Crawford noted that this test also creates failures for students who do not measure up on any part of this test are declared to have failed and fall into the at-risk category. She cautioned about pushing students into an at-risk or compensatory mode if they do not need to be. Dr. Crawford also said that certain funding implications are created by more compensatory or at-risk students. She said that there are great many implications regarding the use of the test and how you set it, with the ultimate fallout on the students. Dr. Crawford indicated that she believes the board has take a wise course, and she suggested that the commissioner's recommendations be accepted. She stated that it is important that notice regarding the standard required for graduation from high school be given to those students who will be taking the exit level test. It was moved by Mr. Davis, seconded by Mr. Alexander, to amend the motion to give notice that the 1991-92 standard will be 70. A vote was taken on Mr. Davis' motion to amend. This motion carried with 11 members voting Aye and 3 voting No, as follows: Aye: Mr. Alexander Mrs. Nelson Mr. Davis Mrs. Perkins Mr. Shields Mrs. Berlanga Mrs. Miller Mr. Hasie Dr. Crawford Mr. Sosa Mr. Aikin No: Mr. Hudson Mr. Nunez Mr. Cummings A vote was then taken on the original motion as amended. This motion carried unanimously with all 14 members present voting Aye, as follows: Aye: Mr. Alexander Mrs. Nelson Mr. Davis Mrs. Perkins Mr. Hudson Mr. Shields Mrs. Miller Mr. Aikin Mr. Hasie Mr. Cummings Mrs. Berlanga Mr. Nunez Dr. Crawford Mr. Sosa

Revisiting the Myth of the Texas Miracle in Education: Lessons aboutDropout Research and Dropout Prevention
Walt HaneyLynch School of Education
Boston College617-552-4199
Email: [email protected]
v. 5
This paper is a revision and expansion of a paper prepared for the
Dropout Research: Accurate Counts and Positive Interventions
Conference Sponsored by Achieve and the Harvard Civil Rights Project
January 13, 2001, Cambridge MA
March, 2001
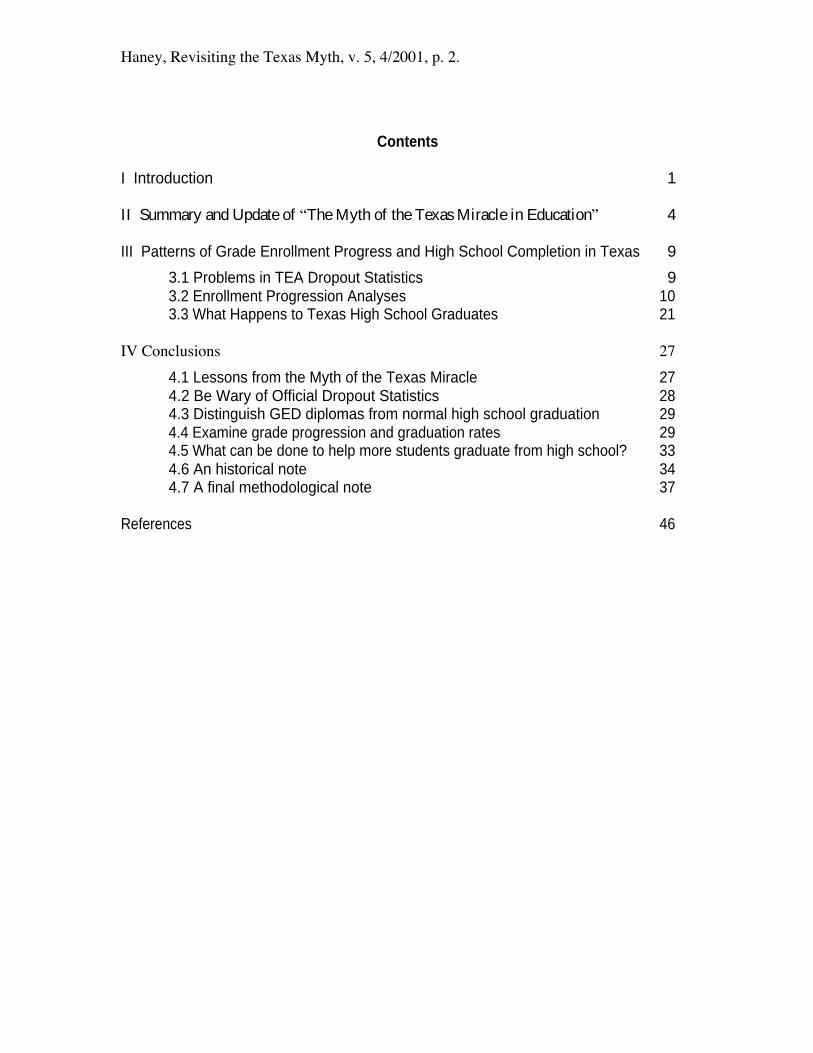
Contents
I Introduction 1
II Summary and Update of The Myth of the Texas Miracle in Education 4
III Patterns of Grade Enrollment Progress and High School Completion in Texas 9
3.1 Problems in TEA Dropout Statistics 93.2 Enrollment Progression Analyses 103.3 What Happens to Texas High School Graduates 21
4.1 Lessons from the Myth of the Texas Miracle 274.2 Be Wary of Official Dropout Statistics 284.3 Distinguish GED diplomas from normal high school graduation 294.4 Examine grade progression and graduation rates 294.5 What can be done to help more students graduate from high school? 334.6 An historical note 344.7 A final methodological note 37
References 46

I Introduction
This paper extends an examination of grade enrollment and high school
graduation patterns in Texas presented in The Myth of the Texas Miracle in Education
(Haney, 2000, available at http://epaa.asu.edu/epaa/v8n41/).1 Using enrollment data
from 1975-76 through 1999-2000, I examine the pattern apparent between flunking grade
9 and failure to persist in school to high school graduation. Before focusing on this
particular topic, I provide a summary of the Myth article, supplemented by new
evidence available since publication of that article in August 2000. Additionally, I show
the manner in which enrollment data can be used to calculate high school graduation rates
in the nation s 100 largest school districts. In the conclusion, I offer suggestions for
future research concerning dropouts, dropout prevention, and ways of judging the success
of pre-collegiate education. Finally, in closing, I offer brief historical and
methodological notes.
In 1979, the Texas legislature passed the Equal Educational Opportunity Act,
which established Texas s first state testing program (Office of Technology Assessment,
1987, p. 271). This was the Texas Assessment of Basic Skills (TABS), a survey-type
assessment used, without sanctions for test takers, from 1980 to 1985. Following
recommendations of a Select Committee on Education (chaired by H. Ross Perot), in
1984 the Texas legislature passed a comprehensive education reform law mandating the
most sweeping changes in education in Texas in 30 years (Funkhouser, 1990, p. 3).
Among other things, the law established a statewide curriculum (called the Essential
1 Sincere thanks to Linda McNeil, Steve Kirsch, Holly Eaton, Andrea Rosen, and Mindy Kornhaber forcomments on earlier versions of this paper. A writer is especially grateful to people who proffer
Elements), required students to achieve a score of 70 to pass their high school courses,
mandated the "no pass, no play" rule (whereby students could not participate in varsity
sports if they did not pass high school courses), required teachers to pass a proficiency
test; and mandated changes in the statewide testing program (Funkhouser, 1990).
Specifically, the 1984 law mandated basic skills testing of students in each odd numbered
grade (Funkhouser, 1990, p. 199). The new testing program, called the Texas Educational
Assessment of Minimum Skills or TEAMS, was implemented in 1985 and tested students
in grades 1, 3, 5, 7, 9 and 11. Under the 1984 law, high school students were required to
pass the "exit level" version of TEAMS in order to receive a high school diploma, based
on a passing score set by the State Board of Education (Office of Technology
Assessment, 1987, pp. 272-75).
In fall 1990, changes in state law required the implementation of a new more
challenging testing program. Thus, the Texas Assessment of Academic Skills (TAAS)
was phased in to replace the TEAM between 1990-91 and 1992-93. Since then TAAS
testing has been the linchpin of educational accountability in Texas, not just for students,
but also for educators and schools. Students have to pass the grade 10 or exit level
version of TAAS in order to graduate high school, and schools are rated as "exemplary,"
"recognized," "acceptable" or "unacceptable," based on a set of "academic excellence
indicators," including TAAS results, dropout rates and student attendance rates (TEA,
1997, p. 159)
By the late 1990s a variety of evidence led a number of observers to conclude that
the state of Texas had made near miraculous educational progress on a number of fronts
because of this test-based accountability system. Between 1994 and 1998, the percentage
constructive comments without even being asked to do so.
of students passing all three grade 10 TAAS tests (in reading writing and math) had
grown from 52% to more than 70%. Also, the racial gap in TAAS results seemed to have
narrowed. Statistics from the Texas Education Agency (TEA) showed that over the same
interval dropout rates had declined steadily. Finally, in 1997, release of results from the
National Assessment of Educational Progress (NAEP) showed Texas 4th graders to have
made more progress on NAEP math tests between 1992 and 1996 than those in any other
state participating in state NAEP testing. These developments led to a flurry of praise for
the apparent educational progress of the Lone Star State. Among the plaudits for Texas
cited in the Myth article were those by Haycock, Palmaffy, Grissmer & Flanagan, the
National Education Goals Panel and editorial writers for a number of newspapers,
including the Boston Globe and USA Today (see Haney, 2000, section 3.5 for citations
and more detail.)
While I have not attempted to keep track of all commentary on education in
Texas, one source perpetuating the myth of the Texas miracle that recently came to my
attention is worth mentioning. Skrla, Scheurich & Johnson (2000) have written a report
based on research in four fairly large Texas school districts. Based on analysis of district-
generated documents, on-site observations and over 200 individual and group interviews,
these researchers concluded that these districts have made dramatic changes in teaching
and learning practices in the classroom. Because of changes in equity beliefs and the
pursuit of educational equity and excellence, say these authors, these school systems
have produced equitable educational success for literally all the children in their
districts (Skrla, Scheurich & Johnson, 2000, pp. 6, 7, 39.)

I I Summary and Update of The Myth of the Texas Miracle in Education
Despite such ongoing boosterism, a wide range of evidence indicates that the
Texas miracle is at best a myth and illusion, if not an outright fraud. As recounted in
the Myth article (Haney, 2000), one reason for this conclusion is the TAAS itself. As
previously explained: 1) by any of the prevailing standards for ascertaining adverse
impact, grade 10 TAAS results continue to show discriminatory adverse impact on Black
and Hispanic students in Texas; 2) use of TAAS results in isolation to control award of
high school diplomas is a clear violation of professional standards concerning appropriate
test use; 3) the passing scores set on TAAS tests were arbitrary, discriminatory, and failed
to take measurement error into account; and 4) analyses comparing TAAS reading,
writing and math scores with one another and with relevant high school grades raise
doubts about the reliability and validity of TAAS scores.
In the Myth article (part 4.3), I suggested that TAAS developers erred in
estimating the standard error of measurement on the TAAS because they based their
estimates on internal consistency reliability estimates rather than alternate form
reliability. While I had located test-retest correlations on the grade 10 TAAS (in the
range of 0.30 to 0.50), these were all for restricted ranges of test takers (who retook the
test because they failed to pass), and I had found no good way to estimate the extent to
which these remarkably low correlations were attenuated due to restriction of range.
Nonetheless, based on published literature I suggested that it is common for tests showing
internal consistency reliability of 0.90 to have alternate forms reliability in the range of
0.80 to 0.85. Based on this pattern, I suggested that the standard errors of measurement

for TAAS tests were likely on the order of 20 to 40% greater than reported in the TAAS
1996-97 Technical Manual (see Haney, 2000, section 4.3).
Now it appears that the TAAS tests are even less reliable than these estimates
suggest. In a study of TAAS scores for students in grades 3 through 8 in six Texas
districts, Dworkin, at al. (1999, Table 2) report that the correlation between TAAS grade
6 scores in 1997 and grade 7 scores in 1998 were 0.802 for reading and 0.745 for math
(corresponding correlations for lower grade levels were even lower). By way of contrast,
the alternate form reliability for the Metropolitan Achievement Test (7th edition) reading
and math sub-tests has been reported to be 0.89 and 0.90 at grade 7 (and 0.90 and 0.91 at
grade 10; Psychological Corporation, 1994, pp. 83-870). Similarly, scores on the
Scholastic Aptitude Test (SAT), taken in grades 11 and 12 have been reported to
correlate in the range of 0.88 to 0.90 (Angoff, 1971, p. 29). In sum, the TAAS tests
appear to even less reliable than estimated in the Myth article and considerably less
reliable than better known tests used nationally.
In the Myth article I also showed that the passing scores on TAAS tests were set
arbitrarily, and failed to take measurement error into account. Specifically, the passing
scores on the three TAAS tests were arbitrarily set at 70% correct, without any evidence
having been adduced that such passing scores reliably differentiated among students on
any criterion external to TAAS. After the passing scores on TAAS were set in 1991,
analysts sought to equate passing scores on new versions of TAAS tests using item
response theory scaling (and scaled scores called the Texas Leaning Index or TLI.) So,
for the 30 TAAS administrations between fall 1991 and summer 1999, the passing scores
on the exit-level version of TAAS varied only slightly, equivalent to 33 or 34 items
correct out of 48 items total on the TAAS reading test and 40 to 42 of 60 items correct on
the TAAS math test equivalent to 69%, 71%, 67%, and 70% correct respectively.
Now, however, according to a memo from Texas Commissioner of Education Jim
Nelson, dated October 25, 1999/2000, it is apparent that the passing scores on recent
TAAS administrations have been lowered. In the five administrations between fall 1999
and fall 2000, the passing scores on the TAAS reading test varied from 27 to 31 correct,
and on the TAAS math from 30 to 39 correct. On the fall 2000 exit level TAAS math
test, the passing score was set at 30 out of 60 items correct or 50% dramatically lower
than the roughly 70% correct that was the passing score until 1999. Nelson sought to
explain this lowering of the TAAS passing scores by saying that the 1998-99 school year
was the first year that TEKS items were incorporated into the test, along with the EE
items (Nelson, 1999/2000, p. 1). Nelson went on to explain, I want to be very clear
that this year s raw scores will be lower than last year s due to the rigor of the test. That
is normal and does not affect the validity of the test. These scores will be equated for
difficulty in the same manner used since 1994 (Nelson, 1999/2000, p. 1).
Without having access to technical details on recent changes in TAAS content, I
am a bit unsure of what to conclude about these developments. In effect Nelson is saying
that the TAAS passing scores in 1999 were lowered in terms of raw scores because more
difficult content was included. But at a minimum, Nelson s memo makes two things
clear. First is that someone in the Texas Education Agency does not understand the
basics of test equating. Formally-speaking, a zero-order requirement for equating two
tests is that they be content equivalent (Mislevy, 1992). Second is that the logic of
Nelson s argument in 1999/2000 is directly contrary to what the TEA did when the

TEAMS was replaced by the more difficult TAAS in the early 1990s. The passing score
on the TEAMS had been set at 70% correct and that was one of the dubious reasons cited
for setting the passing score on TAAS at 70% correct. There was no effort to lower the
passing score on TAAS to make it equivalent to the passing score on TEAMS. In light
of this history, one cannot help but wonder what motivations other than those mentioned
by Nelson prompted the lowering of TAAS passing scores in 1999 and 2000.
In Part 6 of the Myth article (Haney, 2000), I summarized the views of educators
in Texas about TAAS, based on three statewide surveys of educators. These surveys
were undertaken entirely independently (by Gordon and Reese; by myself and
colleagues; and by Hoffman and colleagues), and surveyed somewhat different
populations of educators. General findings from this review were as follows:
1. Texas schools are devoting a huge amount of time and energy preparing studentsspecifically for TAAS.
2. Emphasis on TAAS is hurting more than helping teaching and learning in Texasschools.
3. Emphasis on TAAS is particularly harmful to at- risk students.4. Emphasis on TAAS contributes to retention in grade and dropping out of school.
Survey results indicated that the emphasis on TAAS is contributing to dropouts
from Texas schools not just of students, but also teachers. In one survey, reading
specialists were asked whether they agreed with the following statement:
It has also been suggested that the emphasis on TAAS is forcing some of the bestteachers to leave teaching because of the restraints the tests place on decisionmaking and the pressures placed on them and their students.
A total of 85% of respondents agreed with this statement.
In another survey, teachers volunteered comments such as the following:
"Mandated state TAAS Testing is driving out the best teachers who refuse to resort to
teaching to a low level test!"
In Part 7 of the Myth article, among other things, I examined SAT scores for
Texas students as compared with national results. Evidence indicates that at least as
measured by performance on the SAT, the academic learning of secondary school
students in Texas has not improved since the early 1990s, at least as compared with SAT-
takers nationally. Indeed results from 1993 to 1999 on the SAT-M indicate that the
learning of Texas student has deteriorated relative to students nationally (and this result
holds even after controlling for percentage of high school graduates taking the SAT).
Part 7 also revisited NAEP results for Texas. Results for eight state NAEP
assessments conducted between 1990 and 1998 were reviewed. Because of the doubtful
meaningfulness of the NAEP achievement levels, NAEP results for Texas and the nation
were compared in terms of NAEP scaled scores. In order to compare NAEP results with
those from TAAS, the "effect size" metric (from the meta-analysis literature) was
employed. This review of NAEP results from the 1990s showed that grade 4 and grade 8
students in Texas performed much like students nationally. On some NAEP assessments
Texas students scored above the national average and on some below. In the two subject
areas in which state NAEP assessments were conducted more than once during the 1990s,
there is evidence of modest progress by students in Texas, but it is much like the progress
evident for students nationally. Reviewing NAEP results for Texas by ethnic group, we
see a more mixed picture. In many comparisons, Black and Hispanic students show
about the same gain in NAEP scores as White students, but the 1998 NAEP reading

results indicate that while grade 4 reading scores of White students in Texas improved
since 1992, those of Black and Hispanic students did not improve between1992 and
1998. More generally, however, the magnitudes of the gains apparent on NAEP for
Texas fail to confirm the dramatic gains apparent on TAAS. Gains on NAEP in Texas
are consistently far less than half the size (in standard deviation units) of gains on state
TAAS assessments. These results indicate that the dramatic gains on TAAS during the
1990s are more illusory than real. It is worth adding that this same conclusion was
reached in a RAND report by Klein, Hamilton, McCaffrey & Stecher (2000) as a result of
their examination of state NAEP results for Texas.
III Patterns of Grade Enrollment Progress and High School Completion in Texas
In pages above, I summarized many of the major portions of the August 2000
Myth of the Texas Miracle in Education article (Haney, 2000). One major portion not
yet treated is analyses of grade enrollment data for Texas. The reason is that this line of
inquiry is particularly relevant to the overall topic of this conference, namely dropout
research. Before describing enrollment analyses, let me first explain why they were
undertaken; namely, because dropout statistics reported by the TEA are untrustworthy.
3.1 Problems in TEA Dropout Statistics
As mentioned above, the TEA had reported that dropout rates were decreasing in
Texas during the 1990s. However, in 1998 when I began studying what had been
happening in Texas schools, I quickly became suspicious of the validity of the TEA-
reported dropout data. At least one independent organization in Texas had previously
challenged TEA's "dropout calculation methodology" (TRA, 1998, p. 2). Moreover, two

independent sources were reporting substantially higher rates of dropouts (or attrition) or,
conversely, lower rates of high school completion than would be implied by TEA dropout
data (Fassold, 1996; IDRA, 1996). Additionally, I subsequently learned that a November
1999 report from the Texas House Research Organization, The Dropout Data Debate,
recounts that In 1996, the State Auditor s Office estimated that the 1994 dropout
numbers reported by the Texas Education Agency (TEA) likely covered only half of the
actual number of dropouts (p. 1). The report goes on to recount numerous problems in
TEA s approach to calculating dropout rates including changing rules over time in how to
define dropouts, relying on district reports of dropouts, while at the same time, beginning
in 1992-93 to use dropout rate as a key factor in TEA s accountability ratings of districts,
and apparent fraud in district reporting. The TEA developed a system for classifying
school leavers in dozens of different ways and many types of leavers are not counted as
dropouts. Indeed in 1994, the TEA started classifying students who met all graduation
requirements but failed to pass TAAS as non-dropout leavers.
3.2 Enrollment Progression Analyses
Hence, in order to examine independent evidence on patterns of high school
completion in Texas and possible effects of TAAS on grade enrollment patterns and high
school completion, I assembled data on the numbers of White, Hispanic and Black
students enrolled in every grade (kindergarten to grade 12) in Texas over the last two
decades.2
2 In the Myth article, I explain how these data were assembled and checked for accuracy. Also, at thetime of completion of this article, enrollment data were only available through the 1998-99 school year.Enrollment data are now available for the 1999-2000 school year, but not yet data on high schoolgraduates. Note too that appendix 7 of the Myth article (Haney, 2000) provides the source data on grade

In a first set of analyses, I simply took the numbers of White, Black and Hispanic
Texas high school graduates by year and divided each of these numbers respectively by
the number of White, Black and Hispanic students enrolled in grade nine three years
earlier. The resulting ratios show the proportion of grade nine students for each ethnic
group who progress on time to high school graduation three-and-a-half years later.
Without describing all analyses undertaken along these lines, Figure 3.1 shows one
illustrative result.
enrollments in Texas.

This figure shows the ratio of the number of Texas high school graduates divided
by the number of grade nine students three years earlier for White and Nonwhite (that is
Black and Hispanic) students. What this figure shows is that during the three-year period
of 1990-93 in which the TAAS exit test requirement was phased in, the gap in this ratio
for White and Nonwhite students widened substantially. Specifically, during the period
1978 through 1989, the average gap in the ratios graphed in Figure 3.1 was 0.146.
However, the average gap in the ratios for Whites and Nonwhites since the TAAS exit
test requirement was fully implemented in 1992-93 has been 0.215. This indicates that
the TAAS exit test has been associated with a 50% increase in the gap in progression
from grade 9 to high school graduation for Nonwhite students as compared with White
students.
In order to understand these results better, I next calculated grade to grade
progression ratios of the number of students enrolled in one grade divided by the number
of students enrolled in the previous grade in the previous year, separately for the Black,
Hispanic and White ethnic groups. Altogether 858 such calculations were computed 13
grade transitions (from kindergarten to grade 1, etc., to grade 12 to high school
graduation) for 22 years and three ethnic groups. Again, without trying to recap all
results from these analyses, shown in Figure 3.2 are some of the most interesting.
What this figure shows is that over the last 20 years, the grade 9/grade 8
progression ratio for Black and Hispanic students has risen dramatically, while the
comparable rate for White students increased only slightly. The data also reveal that
before the mid-1980s, the grade9/grade8 progression ratios for Black and Hispanic
students were only slightly higher than those for Whites. These results clearly indicate
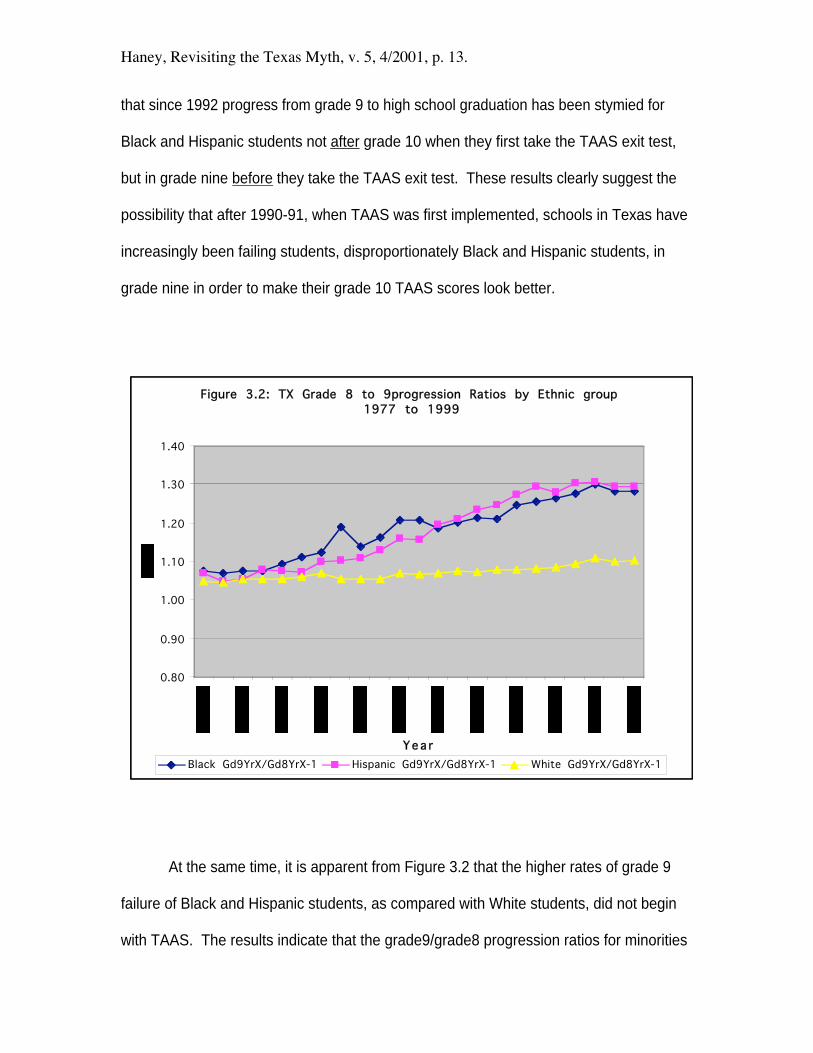
that since 1992 progress from grade 9 to high school graduation has been stymied for
Black and Hispanic students not after grade 10 when they first take the TAAS exit test,
but in grade nine before they take the TAAS exit test. These results clearly suggest the
possibility that after 1990-91, when TAAS was first implemented, schools in Texas have
increasingly been failing students, disproportionately Black and Hispanic students, in
grade nine in order to make their grade 10 TAAS scores look better.
At the same time, it is apparent from Figure 3.2 that the higher rates of grade 9
failure of Black and Hispanic students, as compared with White students, did not begin
with TAAS. The results indicate that the grade9/grade8 progression ratios for minorities

began to diverge from those of White students in Texas in the 1980s, before TAAS and
even before TEAMS (as previously explained, the Texas state test that preceded TAAS).
In an historical sense then, TAAS and TEAMS testing could not have directly caused the
steady increase since the early 1980s in the proportions of Black and Hispanics failed in
grade 9. But the first statewide testing program in Texas, the TABS, did begin in 1980,
just about when the ratio of minority ninth graders to eighth graders began its upward
climb, compared to the relative stability of this ratio for White students. Whatever the
historical cause, the fact that by the end of the 1990s 25-30% of Black and Hispanic
students, as compared with only 10% of White students, were being failed in grade 9,
instead of being promoted to grade 10, makes it clear that the apparent diminution in the
racial gap in TAAS grade 10 pass rates is in some measure an illusion. Through the
1990s, progressively smaller proportions of minority students ever even made it to grade
10 to take the exit level TAAS test.
The sharp increase in grade 9 failure rates suggested a need to revisit the question
of rates of progress toward high school graduation. This is because the grade 9 to high
school graduation progress ratio may have been lowered because of the increasing
numbers of students bunching up in grade 9.
Hence a number of additional analyses were undertaken, examining the rates of
progress from grades 6, 7, and 8 to high school graduation, six, five and four years later,
respectively. For economy of presentation, here I present only one set of results showing
rates of progress from grade 6 to high school graduation six years later for minority, that
is, Black and Hispanic, students. These are presented for cohorts labeled by their

expected year of high school graduation. The cohort class of 1999, for example, would
have been in grade 6 in 1992-93.
Figure 3.3 shows the progress of minority (Black and Hispanic) cohorts from
grade 6 to grades 8, 10, 11, 12 and high school graduation. As can be seen, over the last
20 years, for minority cohorts, close to 100% of grade 6 students progressed to grade 8
two years later. For minority grade 6 cohorts the rates of progress to higher grades were
lower for cohorts of the classes of 1982-86 about 80% of Black and Hispanic students
progressed on time from grade 6 to grades 11 and 12 and about 65% graduated.
For minority cohorts of the classes of 1987 to 1990, there were mostly declines in
rates of progress. Initially sharper declines were apparent in rates of progress to grades
10, 11, and 12, but the cohorts of the 1989 and 1990 classes showed some rebounds in
rates of progress to grades 10, 11 and 12 (and for the 1990 cohort to graduation). These
patterns are associated with implementation of the first Texas high school graduation test,
the TEAMS from 1985 to 1990.
In 1991, the initial year of TAAS testing, the grade 6 to high school graduation
ratios fell precipitously; from 1990 to 1991, the ratio fell from 0.65 to 0.55 for minorities.
From 1992 to 1996, this ratio held relatively steady for minorities at about 0.60. Since
1996, there have been slight increases in the high school graduation to grade six ratios,
for minorities almost back up to 0.65.3
Stepping back from specific results represented in Figures 3.3, three broad
findings are apparent from these cohort progression analyses. First, the plight of Black
and Hispanic students in Texas is not quite as bleak as it appeared when looking at grade
9 to high school graduation ratios which showed only 50% since 1992 progressing from
grade 9 to high school graduation. The bottom line in Figure 3.3 indicates that for most
classes of the 1990s 60-65% of Black and Hispanic students progressed from grade 6 to
graduate on-time six years later (the grade 9 to graduation ratios are lower because of the
increasing rates of retention in grade 9).
Second, one of the major features of Figures 3.3 is that the bottom two lines
(representing the grade 12 to grade 6, and graduation to grade 6 ratios) tend to converge
over the last 20 years. This means that over this period, given that students reach grade
3 As discussed in section 7.1 of Haney, 2000, the upturn in rates of progress to graduation beginning in1997 was likely due to the fact that in that year Texas was required by the GED Testing Service to raise
12, they are increasingly likely to graduate. For minority classes of the early 1980s,
about 80% were progressing on-time to grade 12, but only about 65% graduating. For
minority classes of 1998 and 1999, 68-69% progressed to grade 12 and 64-65% to
graduation on time. In other words, a major pattern revealed in this figure is that since
high school graduation testing was introduced in Texas in the mid-1980s, larger
proportions of students who reach grade 12 do graduate.
The flip side of this pattern is that over this interval, smaller proportions of
minority students are progressing as far as grade 12. For minority classes of the early
1980s around 80% progressed from grade 6 to grade 12 six years later, but by the 1990s
less than 70% were progressing on time to grade 12. The most obvious reasons for the
substantial declines in progress from grade 6 to grade 12 six years later are increased
rates of retention in grades before 12 and increased rates of dropping out before grade 12.
This discussion of rates and ratios tends to obscure what is happening or not
happening to large numbers of children in Texas, so I also examined the grade
enrollment data for Texas in one other way. This time I calculated progress from grade 6
to high school graduation 6.5 years later for the Texas high school classes of 1982 to
1999 simply in terms of numbers of students (that is, total numbers of Black, Hispanic
and White students).
its passing score on the GED for awarding high school equivalency diplomas.

Results are shown in Figure 3.4. Also shown in this figure are the differences,
that is the numbers of students who do not make it from grade 6 to high school
graduation 6.5 years later. As can be seen, the numbers of children lost between grade 6
and high school graduation in Texas were in the range of 50 to 60 thousand for the
classes of 1982 to 1986. The numbers of lost children started to increase for the classes
of 1986 and 1987 and jumped to almost 90 thousand for the class of 1991. For the classes
of 1992 through 1999, in the range of 75 to 80 thousand children are being lost in each
cohort.
Cumulatively for the classes of 1992 through 1999, there were a total of
2,226,003 White, Black and Hispanic students enrolled in grade 6 (in the academic years
1984-85 through 1992-93). The total number graduating from these classes was
1,510,274. In other words, for the graduating classes of 1992 through 1999, 715,729
children in Texas or 32% were lost or left behind before graduation from high school.
After conducting a variety of analyses Texas enrollment data, I reviewed (in part
7 of Haney 2000) five different sources of evidence about rates of high school completion
to see if apparent differences in these source could be reconciled. A review of statistics
on numbers of students, in Texas and nationally, taking the Tests of General Educational
Development (GED) was undertaken. People take the GED tests in order, by achieving
passing scores, to be awarded high school equivalency degrees. Review of GED
statistics indicated that there was a sharp upturn in numbers of young people taking the
GED tests in Texas in the mid-1990s. This finding helps to explain why the TEA
statistics on dropouts are misleading. According to TEA accounting procedures, if
students leave regular high school programs to go into state-approved GED preparation
programs, they are not counted as dropouts, regardless of whether they actually take,
much less pass, the GED tests.
If we put aside the TEA-reported dropout rates as misleading, differences between
other sources of evidence on rates of high school completion in Texas appear
reconcilable. NCES reports (based on CPS surveys) indicate that the rate of high school
completion among young people in Texas in the 1990s was about 80%. This would
imply a non-completion (or dropout) rate of 20%. Initially this would appear markedly
lower than the non-graduation rate of at least 30% derived from my analyses of TEA data
on enrollments and graduates. But the CPS surveys count as high school completers
those who report receiving regular high school degrees and those who report receiving a
GED high school equivalency diplomas.4 So it seems clear that a convergence of
evidence indicates that during the 1990s, slightly less than 70% of students in Texas
actually graduated from high school (e.g. 1.51 million/2.23 million = 0.68). This implies
that about 1 in 3 students in Texas in the 1990s dropped out of school and did not
graduate from high school. (Some of these dropouts may have received GED equivalency
degrees, but GED certification is by no means equivalent to regular high school
graduation, as discussed below).
In addition to studying enrollment data for Texas, I also examined patterns of
failure in grade 9 and high school completion rates among states for which such data are
available. Results indicated that there is a strong association between high rates of grade
9 failure and low rates of high school completion. Specifically, results suggested that for
every 10 students failed in grade 9, about seven will not complete high school (see
Haney, 2000, section 7.2).
The applicability of these results, from across 18 states, to Texas may well be
questioned. Fortunately, I have recently received a summary of longitudinal results from
Texas that show more clearly what happens to students who fail grade 9 and have to
repeat that grade. According to a study released by Texas State Senator Gonzalos
Barrientos, in 1992-93 41,344 freshmen high school students repeated the ninth grade in
4 The CPS survey samples are not large enough to allow derivation of reliable annual results at the statelevel, much less to estimate separately the numbers of high school graduates and GED recipients. See,
all Texas districts. By 1997-98, 8063 or19.5% of them had graduated from high school
and another 6,445 or 15.6% had received GED high school equivalency diplomas
(Where have all the freshmen gone, 1999). These results indicate that the graduation
prospects for students who are flunked in grade 9 in Texas are slightly worse than
estimated in the Myth article. Specifically, they suggest that for students who are failed
in grade 9, only about one in five will persist in high school until graduation.
3.3 What Happens to Texas High School Graduates
I am of the view that an educational system in which 30% of students overall (and
40% of minorities) do not even graduate from high school is one to be deplored rather
than applauded. But clearly people s values in making such judgements may well differ.
Some might argue, for example, that having 30% of young people fail to graduate from
high school is an unfortunate, but necessary, price to pay for boosting the achievement of
those who do finish high school. As one ex-college president in Massachusetts
commented recently, in education as in sports, the aphorism no pain, no gain should
apply.
Hence it is useful to examine what happens to students who do graduate from
high school in Texas and go on to college. In doing so, we are in effect addressing the
question of whether the huge social cost of having 3 out of 10 young people not even
graduate high school might possibly be warranted by improvements in learning for the 7
out of 10 who do.
In section 7.5 of the Myth article, I summarized results of the college readiness
testing program in Texas from 1989-90 through 1997. This test is called the Texas
Academic Skills Program or TASP test. This test is intended to assess whether students
Haney, 2000, section 7.1 for more discussion.
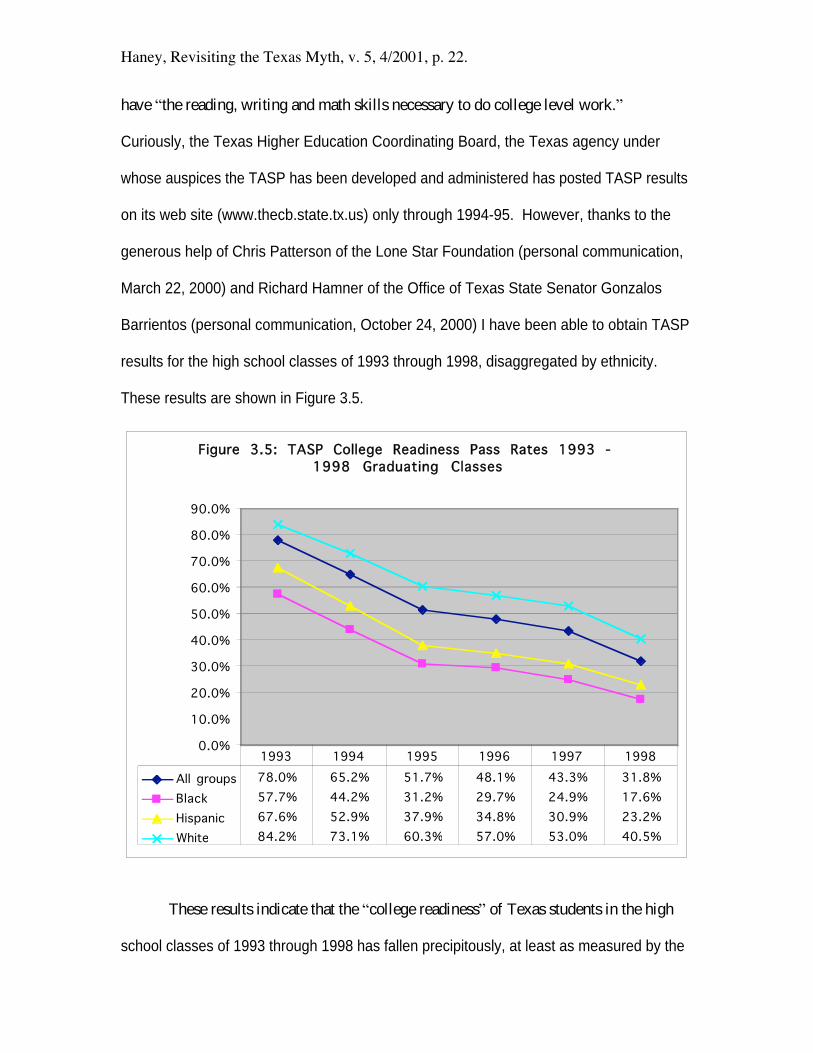
have the reading, writing and math skills necessary to do college level work.
Curiously, the Texas Higher Education Coordinating Board, the Texas agency under
whose auspices the TASP has been developed and administered has posted TASP results
on its web site (www.thecb.state.tx.us) only through 1994-95. However, thanks to the
generous help of Chris Patterson of the Lone Star Foundation (personal communication,
March 22, 2000) and Richard Hamner of the Office of Texas State Senator Gonzalos
Barrientos (personal communication, October 24, 2000) I have been able to obtain TASP
results for the high school classes of 1993 through 1998, disaggregated by ethnicity.
These results are shown in Figure 3.5.
These results indicate that the college readiness of Texas students in the high
school classes of 1993 through 1998 has fallen precipitously, at least as measured by the
TASP reading, writing and math tests. For the members of the class of 1993, who sought
to attend college in Texas and hence had to take the TASP tests, 78% of all students
passed the TASP (and 58% and 68% of Black and Hispanic students, respectively). For
the members of the high school class of 1998, however, only 31.8% of students overall
(and just 17.6% of Black and 23.2% of Hispanic students) passed all three tests. These
were students who would have taken the TAAS in 1996 when they were in grade 10.
According to the TEA
(www.tea.state.tx.us/student.assessment/results/summary/sum96/gxen96.htm,
10/17/2000) 208,858 students took the exit level TAAS in March 1996 and 124,489
passed. According to Texas Higher Education Coordinating Board statistics, 81,159
members of the high school class of 1998, all of whom presumably passed the TAAS
(since they graduated from high school), took the TASP tests just two years later, but
55,350 of them failed. As noted in the Myth article (Haney, 2000, section 7.5),
reviewing these results from the TASP testing, and comparing them with results of
TAAS testing, the conclusion seems inescapable that something is seriously amiss in the
Texas system of education, the TAAS testing program, or the TASP testing program or
perhaps all three.
The ill-health of higher education in Texas is apparent not just in TASP results,
and in my view, but also according to other measures and other observers. According to
a report prepared by the University of Texas System, Presentation to the Education
Subcommittee of the House Appropriations Committee, dated February 10, 1999:
Among Anglos, as well as Hispanics and African-Americans, there aremarked declines in the number of students who are prepared academically forhigher education, as measured by their scores on the SAT and their rank in highschool class. . . . . It is worth emphasizing, therefore, that this is not merely a
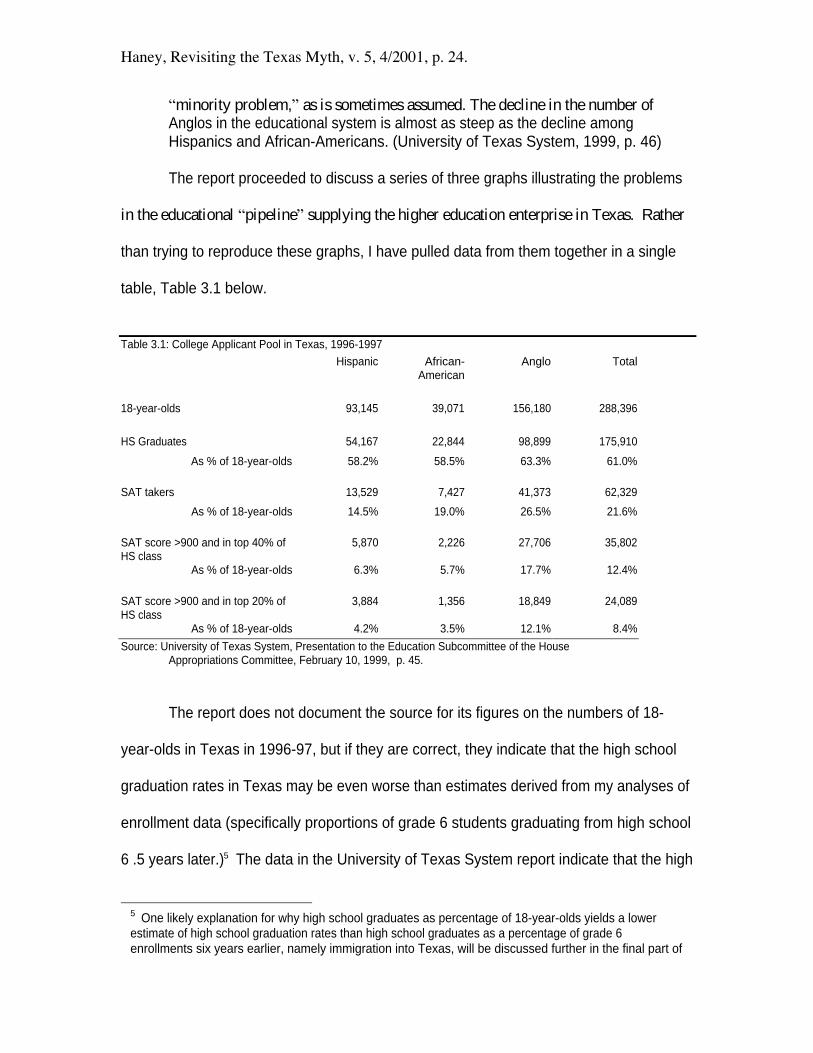
minority problem, as is sometimes assumed. The decline in the number ofAnglos in the educational system is almost as steep as the decline amongHispanics and African-Americans. (University of Texas System, 1999, p. 46)
The report proceeded to discuss a series of three graphs illustrating the problems
in the educational pipeline supplying the higher education enterprise in Texas. Rather
than trying to reproduce these graphs, I have pulled data from them together in a single
table, Table 3.1 below.
Table 3.1: College Applicant Pool in Texas, 1996-1997
Hispanic African-American
Anglo Total
18-year-olds 93,145 39,071 156,180 288,396
HS Graduates 54,167 22,844 98,899 175,910
As % of 18-year-olds 58.2% 58.5% 63.3% 61.0%
SAT takers 13,529 7,427 41,373 62,329
As % of 18-year-olds 14.5% 19.0% 26.5% 21.6%
SAT score >900 and in top 40% ofHS class
5,870 2,226 27,706 35,802
As % of 18-year-olds 6.3% 5.7% 17.7% 12.4%
SAT score >900 and in top 20% ofHS class
3,884 1,356 18,849 24,089
As % of 18-year-olds 4.2% 3.5% 12.1% 8.4%
Source: University of Texas System, Presentation to the Education Subcommittee of the HouseAppropriations Committee, February 10, 1999, p. 45.
The report does not document the source for its figures on the numbers of 18-
year-olds in Texas in 1996-97, but if they are correct, they indicate that the high school
graduation rates in Texas may be even worse than estimates derived from my analyses of
enrollment data (specifically proportions of grade 6 students graduating from high school
6 .5 years later.)5 The data in the University of Texas System report indicate that the high
5 One likely explanation for why high school graduates as percentage of 18-year-olds yields a lowerestimate of high school graduation rates than high school graduates as a percentage of grade 6enrollments six years earlier, namely immigration into Texas, will be discussed further in the final part of
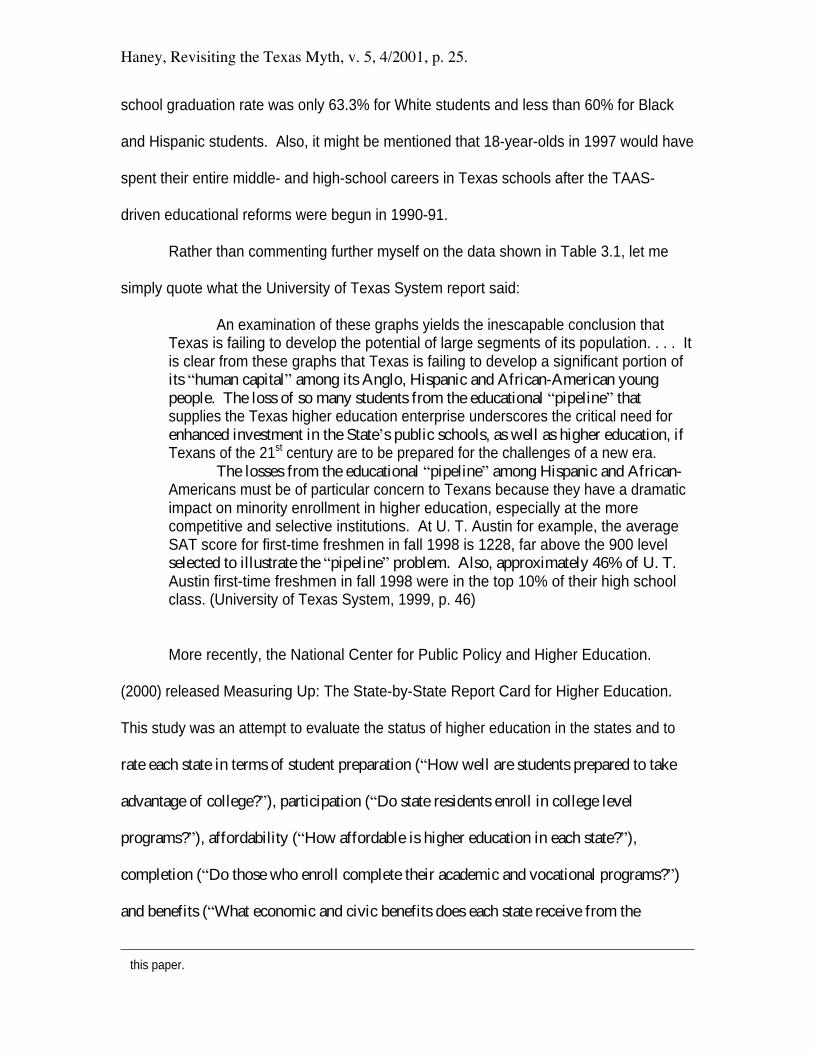
school graduation rate was only 63.3% for White students and less than 60% for Black
and Hispanic students. Also, it might be mentioned that 18-year-olds in 1997 would have
spent their entire middle- and high-school careers in Texas schools after the TAAS-
driven educational reforms were begun in 1990-91.
Rather than commenting further myself on the data shown in Table 3.1, let me
simply quote what the University of Texas System report said:
An examination of these graphs yields the inescapable conclusion thatTexas is failing to develop the potential of large segments of its population. . . . Itis clear from these graphs that Texas is failing to develop a significant portion ofits human capital among its Anglo, Hispanic and African-American youngpeople. The loss of so many students from the educational pipeline thatsupplies the Texas higher education enterprise underscores the critical need forenhanced investment in the State s public schools, as well as higher education, ifTexans of the 21st century are to be prepared for the challenges of a new era.
The losses from the educational pipeline among Hispanic and African-Americans must be of particular concern to Texans because they have a dramaticimpact on minority enrollment in higher education, especially at the morecompetitive and selective institutions. At U. T. Austin for example, the averageSAT score for first-time freshmen in fall 1998 is 1228, far above the 900 levelselected to illustrate the pipeline problem. Also, approximately 46% of U. T.Austin first-time freshmen in fall 1998 were in the top 10% of their high schoolclass. (University of Texas System, 1999, p. 46)
More recently, the National Center for Public Policy and Higher Education.
(2000) released Measuring Up: The State-by-State Report Card for Higher Education.
This study was an attempt to evaluate the status of higher education in the states and to
rate each state in terms of student preparation ( How well are students prepared to take
advantage of college? ), participation ( Do state residents enroll in college level
programs? ), affordability ( How affordable is higher education in each state? ),
completion ( Do those who enroll complete their academic and vocational programs? )
and benefits ( What economic and civic benefits does each state receive from the
this paper.
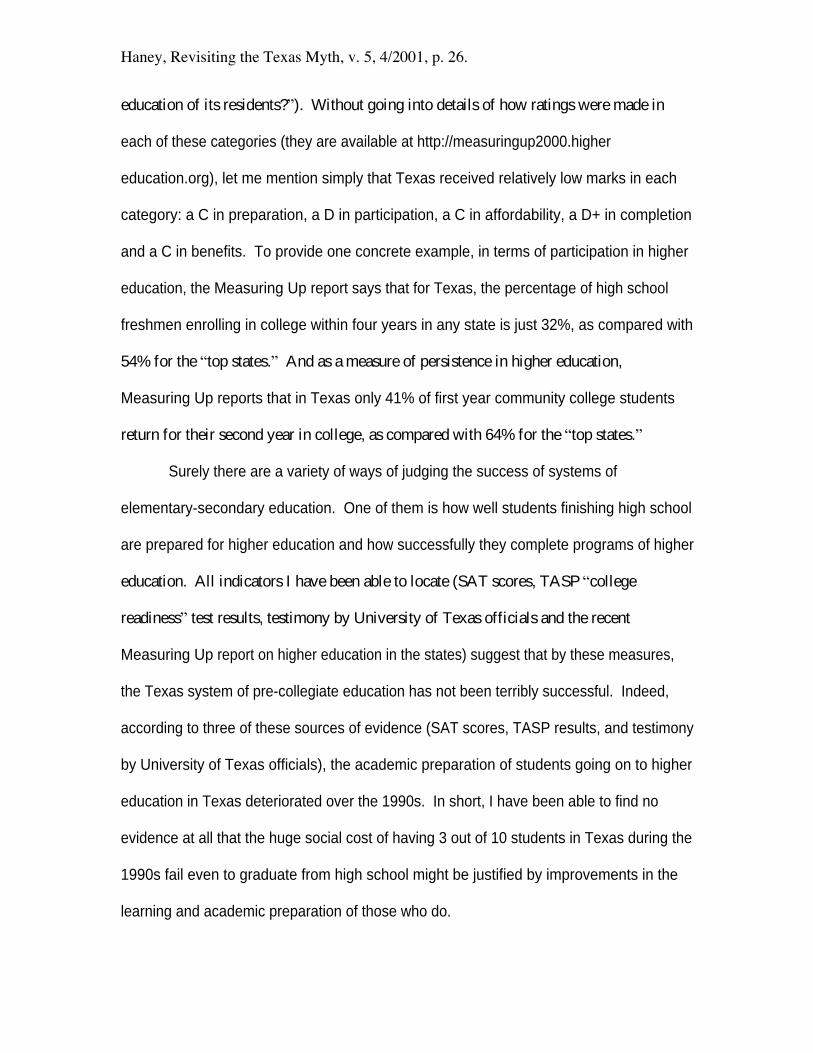
education of its residents? ). Without going into details of how ratings were made in
each of these categories (they are available at http://measuringup2000.higher
education.org), let me mention simply that Texas received relatively low marks in each
category: a C in preparation, a D in participation, a C in affordability, a D+ in completion
and a C in benefits. To provide one concrete example, in terms of participation in higher
education, the Measuring Up report says that for Texas, the percentage of high school
freshmen enrolling in college within four years in any state is just 32%, as compared with
54% for the top states. And as a measure of persistence in higher education,
Measuring Up reports that in Texas only 41% of first year community college students
return for their second year in college, as compared with 64% for the top states.
Surely there are a variety of ways of judging the success of systems of
elementary-secondary education. One of them is how well students finishing high school
are prepared for higher education and how successfully they complete programs of higher
education. All indicators I have been able to locate (SAT scores, TASP college
readiness test results, testimony by University of Texas officials and the recent
Measuring Up report on higher education in the states) suggest that by these measures,
the Texas system of pre-collegiate education has not been terribly successful. Indeed,
according to three of these sources of evidence (SAT scores, TASP results, and testimony
by University of Texas officials), the academic preparation of students going on to higher
education in Texas deteriorated over the 1990s. In short, I have been able to find no
evidence at all that the huge social cost of having 3 out of 10 students in Texas during the
1990s fail even to graduate from high school might be justified by improvements in the
learning and academic preparation of those who do.
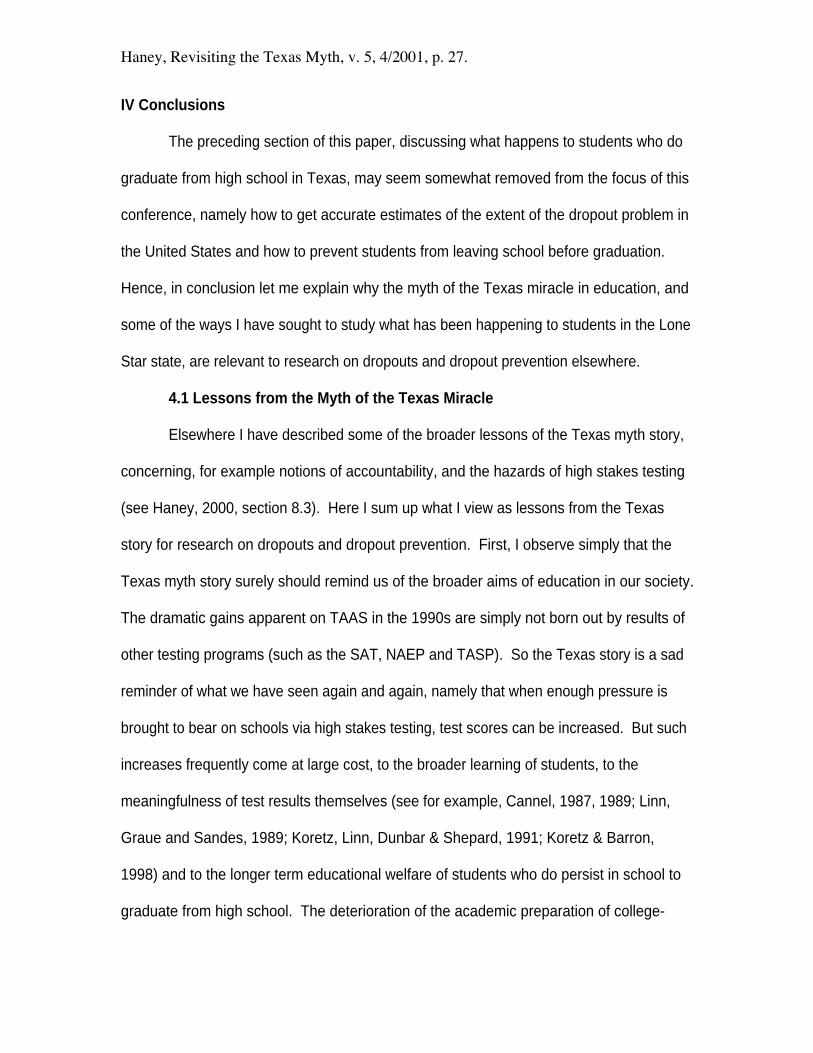
IV Conclusions
The preceding section of this paper, discussing what happens to students who do
graduate from high school in Texas, may seem somewhat removed from the focus of this
conference, namely how to get accurate estimates of the extent of the dropout problem in
the United States and how to prevent students from leaving school before graduation.
Hence, in conclusion let me explain why the myth of the Texas miracle in education, and
some of the ways I have sought to study what has been happening to students in the Lone
Star state, are relevant to research on dropouts and dropout prevention elsewhere.
4.1 Lessons from the Myth of the Texas Miracle
Elsewhere I have described some of the broader lessons of the Texas myth story,
concerning, for example notions of accountability, and the hazards of high stakes testing
(see Haney, 2000, section 8.3). Here I sum up what I view as lessons from the Texas
story for research on dropouts and dropout prevention. First, I observe simply that the
Texas myth story surely should remind us of the broader aims of education in our society.
The dramatic gains apparent on TAAS in the 1990s are simply not born out by results of
other testing programs (such as the SAT, NAEP and TASP). So the Texas story is a sad
reminder of what we have seen again and again, namely that when enough pressure is
brought to bear on schools via high stakes testing, test scores can be increased. But such
increases frequently come at large cost, to the broader learning of students, to the
meaningfulness of test results themselves (see for example, Cannel, 1987, 1989; Linn,
Graue and Sandes, 1989; Koretz, Linn, Dunbar & Shepard, 1991; Koretz & Barron,
1998) and to the longer term educational welfare of students who do persist in school to
graduate from high school. The deterioration of the academic preparation of college-

bound youth in Texas during the 1990s tells us that the costs of ill-conceived test-based
accountability schemes fall not just on students who fail in such a system but also those
who in the short term seem to have succeeded. But perhaps the Texas story tells us most
clearly is that quite apart from raising test scores, surely one of the main outcomes of pre-
collegiate education is the proportion of students who finish and graduate from high
school. By this measure, the Texas system of education, in which only two out of three
young people in the 1990s actually graduated from high school, surely should not be
deemed a success, much less a miracle.
4.2 Be Wary of Official Dropout Statistics
One very practical lesson from the Texas Myth story is that researchers and policy
analysts should be very wary of officially reported dropout statistics. This is not just
because of the long recognized problem that different states define dropouts differently;
for instance, with regard to the calendar year over which dropouts are counted. Winglee,
at al. (2000) provide a summary of such problems and summarize efforts to derive
consistent data on dropouts across the states as part of the Common Core of Data (CCD).
Texas, ironically enough, is one of the states which since 1996 has been
theoretically in conformance with the CCD definition of dropouts (see Winglee, at al.,
2000 pp. 10-11). But what has happened is that since the TEA started in the early 1990s
to use dropout rates as one of the key variables in rating schools and districts, these
institutions have, shall we say, been reporting dropouts in a manner different than before
dropout statistics were used in making accountability ratings.6 What this suggests is that
researchers need to pay attention to the policy contexts in which data are gathered, and
6 In part 7.1 of the Myth article, I show how TEA dropout statistics correspond quite closely with resultsof IDRA attrition analyses for 1988-89, but for the 1990s estimates from the two sources diverge sharply.
realize that when data start to be used to make prominent decisions, such as public ratings
of schools and districts, the manner in which data are collected and reported may well be
affected.
4.3 Distinguish GED diplomas from normal high school graduation
Another important lesson from the Texas Myth story is that researchers and
policy-makers should distinguish regular high school graduation from alternative high
school completion, such as via passing the GED tests and receiving a GED high school
equivalency diploma. The reason for this is that recent research (Cameron &
Heckman, 1993; Chaplin, 1999; Murnane, Willet & Tyler, 2000) has shown that receipt
of the GED diploma is simply not equivalent to high school graduation in terms of either
employment opportunities or likelihood for post-secondary education. Hence, students
who leave normal high school programs to enter GED preparation programs, should be
counted as dropouts, regardless of whether or not they go on to take and pass the GED.
4.4 Examine grade progression and graduation rates
Another general recommendation flowing from the Texas Myth story is that
researchers and policy-makers ought to pay close attention to rates of progress of students
through the grades and from key transition grades, such as 6, 8 and 9 to high school
graduation. I trust that the summary of the Texas myth story above provides a clear
example of why such approaches can be valuable.
But to provide another example, I have examined relevant data from two recent
NCES reports of selected statistics on the nation s 100 largest school districts (NCES,
1998, 2000) based on tabulations of CCD data. Specifically, I examined data on the
number of high school graduates in 1997-98 and compared these figures with the
numbers of students enrolled in grades 7 to 9 in 1994-95. Thereby one can calculate high
school graduation rates for each of these districts, as the number of graduates in 1997-
98 divided by one third of the grade 7 to 9 enrollment in 1994-95.7 Results are shown in
Table 4.1, with districts sorted in descending order from highest to lowest graduation
rate. (Only 96 districts are listed in Table 4.1 because the smallest of the nation s 100
largest school districts changed slightly between 1994-95 and 1997-98.)
[Insert Table 4.1 here]
As can be seen in Table 4.1, six Texas districts are among the two dozen worst in
the nation according to this measure of graduation rate. Among the fourteen largest
districts in Texas, the Houston Independent School District has the worst graduation rate,
46.7%, with over 45,000 enrolled in grades 7 to 9 in 1994-95, but only 7,400 graduating
from high school in 1997-98. The Dallas graduation rate, 49.5% is almost as bad, and
Fort Worth, Austin, Aldine and San Antonio all have graduation rates of about 54-55%.
The Aldine district, by the way, was one of the four studied by Skrla, Scheurich &
Johnson (2000) and which they described as having produced equitable educational
success for literally all the children in their districts (Skrla, Scheurich & Johnson, 2000,
p. 39.) It is hard to fathom how a district with a high school graduation rate of only 54%
could conceivably be described as producing equitable educational success for literally
all the children in the districts.
In these six worst Texas districts (Houston, Dallas, Fort Worth, Austin, Aldine,
and San Antonio), there were 140,628 students enrolled in grades 7 9 in 1994-95.
Dividing by three suggests there were 46,843 enrolled in grade 9 in these six districts in
7 This estimate of grade 9 enrollment, that is, one-third of grades 7 9 enrollment, has the virtue ofhelping to control for the bunching up of students in grade 9 such as has been apparent in Texas over
1994-95. But in 1997-98, just 23,470 students, or 50.1%, graduated high school in 1997-
98. So in just one class of students in just these six districts over 23,000 students were
lost or left behind between grade 9 in 1994-95 and high school graduation in 1997-98
As appalling as these results are, it is only fair to note that there appear to be some
large districts with graduation rates far worse than those of large districts in Texas.
Incredibly, both Cincinnati and Cleveland show graduation rates of only 26%. Indeed,
three of the five worst districts nationwide, all showing graduation rates below 45%, are
in Ohio. Surely it is no coincidence that, like Texas, Ohio has a high school graduation
test used to hold schools accountable.
More broadly, all but one of the nation s largest school districts failed to reach the
national educational goal of having 90% of students graduate from high school. More
than two-thirds of the nation s largest districts have non-graduation rates in excess of
30% -- that is, more than three times the rate implied by the national education goal of
90% graduation.
Independent of the recommendation above that researchers and policy-makers
ought to pay close attention to rates of progress of students through the grades and from
key transition grades, such as 6, 8 and 9 to high school graduation, Balfanz and Letgers
(2001) with the Center for Social Organization of Schools at Johns Hopkins University
undertook just such an analysis (presented at the same conference at which the first
version of this paper was presented). Using CCD data, they analyzed the holding
power or promoting power of high schools in the 35 largest cities in the U.S. By
holding or promoting power, Balfanz and Letgers refer to the number of grade 9 students
who show up in grade 12 three years later. Using CCD data, they examined the holding
the last two decades.

power of over 600 high schools for two cohorts: one that was in grade 9 in 1989-90 and
in grade 12 in 1992-93 and the other in these grades in 1992-93 and 1995-96.
Specifically, they identified high schools in these 35 cities with promoting power of less
than 50% that is, schools in which the number of students in grade 12 was less than less
than 50% of the number of students in grade 9 three years earlier. They found that high
schools with such weak promoting power were concentrated in two geographic regions
northern and mid-western industrial cities, and Texas. Specifically they found that the
cities in Texas with high concentrations of high schools with weak promoting power
were San Antonio, Fort Worth, Dallas, Houston, Austin and El Paso.
Moreover, Balfanz and Letgers found that the high schools in these Texas cities
declined substantially in holding power between the classes of 1993 and 1996.
Nationally, of the 600 urban high schools studied by Balfanz and Letgers, between the
1993 and 1996 cohorts there was an increase in schools with weak holding power (that is,
less than 50%). The number of schools with weak holding power increased from 236
out of 603 (or 39%) for the class of 1993, to 285 out of 602 (or 47%). But for the six
Texas cities, the number of schools with weak holding power increased from 48 out of 88
(or 55%) for the class of 1993, to 61 out of 86 (or 71%%). (See Balfanz & Letgers,
Tables 3a and 3b.)
These results are of interest because, though Balfanz and Letgers employed a
different measure of progress toward high school graduation than did I (they used grade
12 to grade 9 enrollment ratios, while I used graduates to grade 9 ratios) and focused on
different cohorts than did I (they analyzed data for the classes of 1993 and 1996, while
my analyses were on the class of 1998), the results of these two sets of analyses largely
converge Texas has an unusually large number of high schools and school districts in
which large proportions of students fail to progress from high school entry to grade 12
and graduation. Moreover, the Balfanz and Letgers results indicate that holding power of
Texas high schools in the six large cities included in their sample declined substantially
between the early- and mid-1990s.
4.5 What can be done to help more students graduate from high school?
What might best be done to help more students graduate from high school? I
suggest three things; namely, to stop misusing test results, to find better ways of helping
low achieving students besides flunking them and forcing them to repeat the ninth grade,
and to set standards for schools which fail students. On the first point, states should
clearly stop using standardized test scores to control important decisions about students
(such as whether they are promoted from one grade to the next or graduate from high
school) irrespective of other evidence, such as course grades and teacher
recommendations. Second, given the clear evidence that flunking students in grade 9
dramatically increases the probability of their dropping out of high school before
graduation, schools must find better ways of helping low-achieving students other than
simply flunking them and making them repeat the grade and courses they have already
failed. Finally, to provide schools with incentive to do to this, I suggest that any school
that flunks more than 10% of grade 9 students should itself be flunked and classified as
low-performing. Clearly, any school that flunks more than 10% of grade 9 students is
unlikely to contribute to the national goal of having 90% of students graduate from high
school.

4.6 An historical note
As an historical note, let me mention Leonard P. Ayres 1909 book Laggards in
our Schools: A study of retardation and elimination in city school systems. With support
from the Russell Sage Foundation, Ayres had undertaken analyses of the poor progress of
students through the grades. He sought to examine the reasons why so few children
progressed as far as high school, even though compulsory attendance laws at the time
made school attendance optional only around the age of 14. Figure 4.1 shows a graph of
data presented in chapter 1 of Ayres book. Specifically these data show the total
numbers of students enrolled in 1907 in each grade in 386 cites with populations of 8000
or more.
Figure 4.1: No. of Students Enrolled in U.S. Cities, 1907, by Grade
E. L. Thorndike (1907) had previously pointed attention to the problem of the
elimination of pupils from school, but Ayres data showed how widely students lagged
behind in school relative to their ages. For each 1000 pupils in the first grade we find
only 263 in the eighth and only 56 in the fourth year of the high school. (p. 14). In his
conclusion Ayres wrote:
If our conception of the mission of the common school is true then the schoolsmust be in some measure reformed, not only on the administrative side, but alsothrough changes in the course of study and in the methods of teaching. It isintolerable that but a small part of the children who enter our schools should stayto complete them. It is not at all likely that the public at large will long be contentto continue to support the schools as at present administered if they once fullyrealize that those schools are not accomplishing what we have for years assumedthat they were. (p. 218)
Ayers Laggards is cited for several reasons. First is the historical importance of
this small volume, which historian Raymond Callahan has called an incendiary
bomb (Callahan, 1962, p. 15). Ayres volume is noteworthy also because his work has
been cited by historians of education as a prominent example of what Callahan called the
cult of efficiency in education and Tyack (1974) called the search for the one best system
of education. Such historians have pointed out that the school efficiency movement was
a reflection of the scientific management movement or Taylorism, after its most well-
known proponent around the turn of the century, Frederick Taylor. Ayres data showed
that large numbers of students were overage for their grade placement in school, and held
that the schools were clearly responsible for this inefficiency.
Perhaps the most important reason for citing Ayres work is that the situation he
described, in 1907, predates the invention of the standardized multiple-choice test. Some
observers of high stakes testing at the end of the 20th century have suggested that the ill-
effects of such testing derives from the form of testing that now predominates in large-
scale testing in the United States, namely standardized multiple-choice testing. They
argue that if the tests employed were performance-based, authentic, and worth
teaching to, then testing would be less likely to distort teaching, learning, and education
generally. But the kinds of tests employed to control grade promotion a century ago,
namely written and oral tests, were what now might be called authentic or
performance tests. This historical perspective clearly suggests that the ill-effects of
high-stakes testing, as evident in Texas, do not derive exclusively, or even mainly, from
the format of testing.8
More generally, though the elimination of students from school in large districts
in the U.S. in the 1990s is not nearly so horrendous as it was in 1907 (except perhaps in
Cleveland and Cincinnati), it is worth recalling two passages, from the beginning and
end, of Ayres 1909 volume.
The beginning passage of chapter 2 of Ayres book reads:
No standard which may be applied to a school system as a measure ofaccomplishment is more significant than that which tells us what proportion of thepupils who enter the first grade succeed in reaching the final grade. (Ayres, 1909,p. 8)
8 An equally instructive historical lesson from the era before multiple-choice testing is available inBrendan Rapple s wonderful (1994) Payment by Results: An Example of Assessment in ElementaryEducation from Nineteenth Century Britain. This should not be interpreted as meaning that the formatof testing is of no consequence. See, for example, Haney & Russell (1999) and Russell & Haney (2000)for discussion of how low-tech tests are currently short-changing high-tech students and distortingeducation.
The very final paragraph in Ayres volume is:
Success is necessary to every human being. To live in an atmosphere of failure istragedy to many. It is not a matter of intellectual attainment; not an intellectualmatter at all but a moral matter. The boys and girls coming out of school clear-headed and with good bodies, who are resolute, who are determined to do andsure that they can do, will do more for themselves and for the world than thosewho come out with far greater intellectual attainments, but who lack confidence,who have not established the habit of success, but within whom the school hasestablished the habit of failure. (Ayres, 1909, p. 220)
4.7 A final methodological note
As a final methodological note, let me discuss briefly the relative merits of
different ways of gauging students progress through school. Ayres analysis of
enrollments in 1907 constituted a cross-sectional analysis. He simply compared the
numbers of students enrolled in grades kindergarten through 12 in a particular year. In
contrast, the cohort progression analyses conducted by me and by Balfanz and Letgers
are a sort of longitudinal analysis that addresses the question of what proportion of
students in grade x in year y in a particular school, (or school district or state) reach grade
x + n in year y + n. (or in the case of some of my analyses of statewide data in Texas and
CCD data for the nation s largest school districts, what proportion of cohorts progress
from a particular grade to high school graduation on time).
There are three methodological questions that are worth addressing about such
analyses.
1. Do cohort progression analyses underestimate rates of progress because some
students, while not progressing through the grades on-time, may still persist
in school at a slower pace until they do graduate?

2. How can net migration into or out of a state or school system affect results of
cohort progression analyses?
3. How accurately do cross-sectional estimates of grade progress predict results
of cohort analyses?
Grade progress on-time vs. slow progress
On this matter, it is clear that analysis of rate of progress for one cohort from one
grade to grade 12 or to high school graduation may yield a misleading, or at least
incomplete, picture of what is happening in an educational system. This is clear from my
experience in analyzing statewide enrollment data for Texas. Initially I had analyzed
rates of progress from grade 9 to high school graduation three-and-a-half years later. I
was surprised to find that after implementation of TAAS in 1990-91, the apparent rate of
progress of minority students from grade 9 to high school graduation fell to less than
50%. But after finding that since the early 1980s, students in Texas, especially minority
students, increasingly are being failed to repeat grade, 9, I went back and analyzed rates
of progress from grade 6 and 8 to high school graduation. I found that minority rates of
progress from grade 6 to graduation on-time fell from about 65% before TAAS to
roughly 60% after TAAS.
Just as analysis of progress from one grade, such as 9, to high school graduation
may yield an incomplete picture, so too may analyses of progress for a single cohort of
students. That is why it is helpful to examine rates of progress over several cohorts of
students, for example, as depicted in figure 3.4 above. Such an analysis makes clear that
very few students in Texas who are held back in grade between grade 6 and 12 go on to
graduate from high school. For if a large portion of students who did not progress on
time since implementation of TAAS in 1990-91, went on to complete and graduate from
high school more slowly than normal, the difference shown in this figure, that is the
numbers of children lost between grade 6 and graduation, would have decreased and not
have remained since 1991 in excess of 75,000. Moreover, as previously recounted, of the
total of 2.23 million students enrolled grade 6 in Texas in the classes of 1992 through
1999 only 1.51 million or 68% went on to graduate, even though theoretically they would
have had, on average more than five years to do so.
Effects of net migration on cohort analyses
Another potential problem with cohort progression analyses is that they implicitly
assume a sort of closed system. If there are 1000 students in grade 6 in 1992-93 in a
particular school system, we might expect, given normal progress through the grades that
1000 will graduate in 1999-2000. But such an expectation obviously ignores the possible
effects of families moving into or out of a particular locale. As pointed out in the Myth
article (Haney, 2000, part7.1):
The results of the cohort progression analyses just summarized assumethat between the ages of 12 (grade 6) and 18 (grade 12) there is not net change inthe size of the student population in Texas because of immigration (from eitherother states or countries). If in fact there is a net out-migration, the dropoutestimates may be too high. If there is a net in-migration into Texas, the estimatesmay be too low. (Haney, 2000, part 7.1)
I went on to cite the recent book on the demography of Texas by Murdock, et al.
(1997), which had generously been brought to my attention by Angela Valenzeula.
Murdock, et al. (1997) report that the annual rates of net migration into Texas during the
first half of the 1990s was on the order of 1-2%. When completing the big Myth article, I

did not have time to describe analyses exploring possible effects of immigration, so let
me do so here.
Let us suppose that during the 1990 s there was a net in-migration into Texas of
people in the age range of 12 to 18 years of 1.5% per year a middle estimate of the
range suggested by Murdock, et al. (1997). As just mentioned, there were a total of 2.23
million students enrolled grade 6 in Texas in the classes of 1992 through 1999 and 1.51
million or 68%. went on to graduate. To take immigration into account let us suppose
that each cohort of children increases 1.5% each year between grade 6 and 12 (even
though by grade 12 many will not be in school.
2.23 million*1.015^6 = 2.23 million*1.0936 =2.44 million
This shows that a grade 6 cohort, assuming annual increase of 1.5% because of
immigration would grow by almost 10% over six years. Next, if we divide the 1.51
million graduates in the classes of 1992 through 1999 by 2.44 million, we get 61.9%
This suggests that if we adjust cohort progression analyses for net immigration into Texas
during the 1990s, we conclude that 62% of young people in Texas during the 1990s were
graduating from high school. This result albeit, a product of fairly crude calculations, is
quite close to the 61% figure cited by the University of Texas System, as the percentage
of 18-year-olds in Texas who were high school graduates in 1996-97. This suggests that
less than 2/3 of young people in Texas during the 1990s were actually graduating from
high school. More generally this example illustrates the manner in which results of
cohort progression analyses may be adjusted for evidence (or assumptions) about net
immigration.
Cross-sectional vs. longitudinal cohort analyses
Cohort progression analyses are not terribly complex to carry out. However,
assembling data sets for a particular state or school district that allow for such analyses
can be tedious and time-consuming. Anyone who has worked with the CCD files, for
example, will surely appreciate the work that must have gone into the seemingly simple
analyses reported by Balfanz, & Letgers. (2001). Most often enrollment data are much
more readily available in a form that allows cross-sectional analyses of enrollment across
the grades, of the sort that Ayres undertook nearly a century ago. Thus a methodological
question of some practical import arises. How good are results from cross-sectional
analyses at estimating results from longitudinal cohort analyses?
I address this question in two sets of analyses. First, given I have 25 years worth
of enrollment data from the state of Texas, I address the question of how closely cross-
sectional analyses approximate findings from cohort progression analyses. Second, given
the manner in which CCD files are reported, I address the extent to which analyses of
annual cross-sectional CCD data files might approximate the results of cohort
progression analyses of CCD annual data file merged across years.
Texas enrollments: Cross-sectional vs. cohort analyses. Given the availability of
statewide enrollments in Texas for the last 25 years, I sought to compare how well cross-
sectional analyses (specifically, grade 12 enrollments in year X divided by grade 9
enrollments in year X) correspond with cohort progression analyses (specifically, grade
12 enrollments in year X divided by grade 9 enrollments in year X-3).

Results are shown in Figure 4.2. Note first that cross-sectional estimates of
graduation rates are available for the entire 24 years, but the longitudinal cohort estimates
are available only for 1982 onward (because grade 6 enrollment figures are not available
for years prior to the 1975-76 school year). These results indicate that cross-sectional
estimates of graduation rates are a reasonably good proxy for cohort progression
analyses. Both ways of estimating high school graduation rates show the same broad
patterns. Between 1982 and 1990 the high school graduation in Texas was on the order
of 70%. According to both measures, the graduation rate nose-dived by about 10% in
1991, but since then has been gradually climbing back toward the pre-1991 level of 70%.
Despite these broad similarities, there are two periods (1983-196 and 1992-1997)
in which the cross-sectional estimates of graduation rates yield a notably lower

graduation rate than the for cohort progression analyses. For these years the cross-
sectional estimates are more than 5% lower than those resulting from cohort progression
analyses. Since both kinds of estimates use the same numerator, that is the number of
Texas high school graduates in a particular year, it is obvious what causes these
divergences namely, the grade 6 enrollment numbers used in the dominator. In both of
these periods (as may be seen by looking at Figure 3.4), grade 6 enrollments were
growing at a fairly fast pace, and this growth causes cross-sectional estimates of
graduation rates to be lower than those derived from cohort progression analyses.
Large district enrollments: Cross-sectional vs. cohort analyses. Having addressed the
issue of how well cross-sectional estimates of graduations rates approximate those from
cohort progression analyses for the state of Texas, let us now address the same question
regarding the nation s 100 largest school districts with information derived from the
Common Core of Data (CCD) files. These files are available on the web site of the
National Center for Education Statistics and have been summarized in a series of reports
on the largest school districts in the nation, recently tilted Characteristics of the 100
Largest Public School Districts in the United States (NCES, 1998, 2000). It is worth
noting that although these districts comprise less than 1% of the school districts in the
United States, they enroll more than 20% of students nationally.
The NCES Characteristics of the 100 Largest Public School Districts in the
United States reports typically report grade enrollments for a particular academic year
and the number of high school graduates for the previous year. Given this pattern, the
question I sought to address was how well the NCES quasi- cross sectional reports
(enrollments in year X compared with graduates in year X-1) compare with cohort

progression analyses (graduates in year X compared with enrollments in grade 9 in year
X-3).
Results are shown in Figure 4.3. They suggest that cross-sectional estimates are
a reasonably good proxy for longitudinal cohort estimates (the correlation between the
two estimates is 0.88). However for particular cases, the two estimates of graduation
rates can vary substantially. A case in point is the right-most case shown in Figure 4.3.
This is the case of Montgomery County for which the cross-sectional estimate yields a
value of 76.86%, while the longitudinal cohort result is 90.75% a difference of almost
15%. The reason for this discrepancy is that the population of Montgomery County is

growing. The number of students in grades 7-9 in Montgomery County in 1994-95 was
24,505, but in 1998-99 the corresponding number was 29,316.
In sum, I have argued that in evaluating school systems one index worth paying
attention to is the rate at which students graduate from high school. Comparisons of
cross-sectional versus longitudinal estimates of high school graduation rates, both for
Texas and for the nation s 100 largest districts, suggest that cross-sectional estimates are
a reasonably good proxy for longitudinal estimates. However, when school populations
are growing, the cross-sectional estimates will yield underestimates of the high school
graduation rate.

References
Angoff, W. (1971). The College Board Admissions Testing Program: A Technical Reporton Research and Development activities relating to the Scholastic Aptitude andAchievement Tests. New York: College Entrance Examination Board.
Ayres, Lenoard P. (1909). Laggards in our schools: A study of retardation andelimination in city school systems NY: Charities Publication Committee.
Balfanz, R. & Letgers, N. (2001). How many central city high schools have a severdropout problem, where are they located and who attends them? Paper presented atthe Dropout Research: Accurate Counts and Positive Interventions ConferenceSponsored by Achieve and the Harvard Civil Rights Project, January 13, 2001,Cambridge MA.
Callahan, Raymond, E. Education and the cult of efficiency from 1910 to 1930. Chicago:University of Chicago Press, 1962.
Cameron, S. V. and Heckman, J. J. (1993), "The Nonequivalence of High SchoolEquivalents," Journal of Labor Economics, 11(1) Part 1, 1-47.
Cannell, J. J. (1987). Nationally normed elementary achievement testing in America'spublic schools: How all 50 are above the national average. Daniels, WV: Friendsfor Education.
Cannell, J. J. (1988). Nationally normed elementary achievement testing in America'spublic schools: How all 50 states are above the national average. EducationalMeasurement: Issues and Practice, 7(2), 5-9.
Cannell, J. J. (1989). The 'Lake Wobegon' report: How public educators cheat onstandardized achievement tests. Albuquerque, NM: Friends for Education.
Dworkin, A. G., et al. (1999, September). Comparisons between the TAAS and Norm-referenced tests: Issues of criterion-related validity. (Unpublished paper) Houston:The Sociology of Education Research Group, University of Houston.
Fassold, M. (1999) Affidavit filed in case of GI Forum Image De Tejas v. TexasEducation Western District of Texas (Civil Action No. SA-97-CA-1278-EP), July13, 1999.
Haney, W. (2000). The myth of the Texas miracle in education. Education PolicyAnalysis Archives Volume 8 Number 41, August 19, 2000. Published on theWWW at: http://epaa.asu.edu/epaa/v8n41/. (A printed version of this monograph isdistributed by the Harvard Education Publishing Group.)
Haney, W. & Russell, M. (1999). Low-tech tests short change high-tech students (1999).Christian Science Monitor, July 1, 1999, p. 11.
Holland, P. & Rubin, D. (Eds.). (1982). Test equating. New York: Academic Press.
Klein, S., Hamilton L., McCaffrey, D., & Stecher, B. (2000). What Do Test Scores inTexas Tell Us? Education Policy Analysis Archives. Vol. 8, No. 49, October 26,2000. (http://epaa.asu.edu/epaa/v8n49/.
Koretz, D. M. & Barron, S. I. (1998) The validity of gains in scores on the KentuckyInstructional Results Information System (KIRIS). (RAND report MR-1014-EDU).Washington, D.C. RAND.
Koretz, D. M., Linn, R. L., Dunbar, S. B., & Shepard, L. A. (1991, April). The effects ofhigh stakes testing on achievement: Preliminary findings about generalizationacross tests. Paper presented at the Annual Meeting of the American EducationalResearch Association, Chicago, IL:
Linn, R. L., Graue, M. E., and Sanders, N. M. (1989, March). Comparing state anddistrict test results to national norms: Interpretations of scoring 'above the nationalaverage'. Paper presented at the Annual Meeting of the American EducationalResearch Association, San Francisco, CA.
Mislevy, R. J. (1992). Linking educational assessments: Concepts, issues, methods andprospects. Princeton: ETS Policy Information Center.
Murnane, R. J., Willett, J. B. , and Tyler, J. H.. (2000). Who benefits from obtaining aGED?: Evidence from High School and Beyond? Review of Economics andStatistics, 82:1, 23-37.
National Center for Education Statistics. (1998). Characteristics of the 100 LargestPublic Elementary and Secondary School Districts in the United States: 1995-96(NCES 98-214,) Washington DC: U.S. Department of Education. National Centerfor Education Statistics.
National Center for Education Statistics. (2000). Characteristics of the 100 LargestPublic Elementary and Secondary School Districts in the United States: 1995-96(NCES 2000-345,) Washington DC: U.S. Department of Education. NationalCenter for Education Statistics.

National Center for Public Policy and Higher Education. (2000). Measuring Up: TheState-by-State Report Card for Higher Education. Washington, D.C.: NationalCenter for Public Policy and Higher Education. (http://measuringup2000.highereducation.org)
Nelson, J. (1999/200). Memo to the Administrator Addressed. Texas Education Agency,dated October 25, 1999. [In fall 2000, I received two copies of this memo fromsources in Texas. Both were dated October 25, 1999 on the first page. However Isuspect that this date may be an error because the memo provides documentation onTAAS passing scores for four TAAS administrations in the year 2000. Additionalevidence that Nelson s memo was mis-dated comes from the footers on each of thefive pages of tables attached to the memo. Each is dated October 12, 2000. That iswhy I have cited this document as Nelson 1999/2000.)
Rapple, B. (1994). Payment by Results: An Example of Assessment in ElementaryEducation from Nineteenth Century Britain. Education Policy Analysis ArchivesVolume 2 Number 1, January 5, 1994. Published on the WWW at:http://epaa.asu.edu/epaa/v2n1/.
Russell, M. & Haney, W. (2000) Bridging the gap between testing and technology inschools. Education Policy Analysis Archives Volume 8 Number 19, March 28,2000. Published on the WWW at: http://epaa.asu.edu/epaa/v8n19/.
Skrla, L., Scheurich, J. & Johnson, J. (2000, September). Equity-Driven Achievement-Focused School Districts. (Unpublished report) Austin, TX: Charles A. DanaCenter, University of Texas at Austin.
Taxpayer Research Association (1999) TRA OVERVIEW, TRA Reading Tests.(http://tra.org. Accessed September 11, 1999).
Texas House of Representatives House Research Organization (1999). The Dropout DataDebate. Austin TX: Texas House of Representatives.(http:www.capitol.state.tx.us/hrofr).
Thorndike, E. L. (1907). The elimination of pupils from school. Education Bulletin, No.4. Series No. 379. Wash., D.C: U.S. Government Printing Office.
Tyack, D. B. (1974). The one best system. Cambridge, MA: Harvard University Press.
University of Texas System (1999). Presentation to the Education Subcommittee of theHouse Appropriations Committee (dated February 10, 1999) Austin, TX:University of Texas System
Where have all the freshmen gone. (1999). Report issued by the office of by Texas StateSenator Gonzalos Barrientos, Austin Texas, March 18, 1999.
Winglee, Marianne, et al.. (2000). A recommended approach to providing high schooldropout and completion rates at the state level. (NCES 2000-305.) WashingtonDC: U.S. Department of Education. National Center for Education Statistics.