education and economic outcomes in rural americaeducation and unemployment in the rural south notes:...
TRANSCRIPT

Education and Economic Outcomes in Rural America
Alexander Marre
Southern Legislative Conference Webinar June 18, 2015
The views expressed here are the author’s alone and should not be attributed to the
Economic Research Service or the U.S. Department of Agriculture

3
Introduction
• ERS Mission: “to inform and enhance public and private decision making on economic and policy issues related to agriculture, food, the environment and rural development.”
• We have a number of resources available online at www.ers.usda.gov, including data, maps, topic pages, Amber Waves magazine and other reports and publications

4
Outline 1. Defining “Rurality”
2. Trends in Educational Attainment
3. Education and Economic Outcomes 1. People
2. Counties
4. Education and Population Change

5
Rural Areas Defined by Population Size and Adjacency to Metropolitan Areas
Code Description
Metro
…1 Counties in metro areas of 1 million population or more
…2 Counties in metro areas of 250,000 to 1 million population
…3 Counties in metro areas of fewer than 250,000 population
Nonmetro
…4 Urban population of 20,000 or more, adjacent to a metro area
…5 Urban population of 20,000 or more, not adjacent to a metro area
…6 Urban population of 2,500 to 19,999, adjacent to a metro area
…7 Urban population of 2,500 to 19,999, not adjacent to a metro area
…8 Completely rural or less than 2,500 urban population, adjacent to a metro area
…9 Completely rural or less than 2,500 urban population, not adjacent to a metro area
6
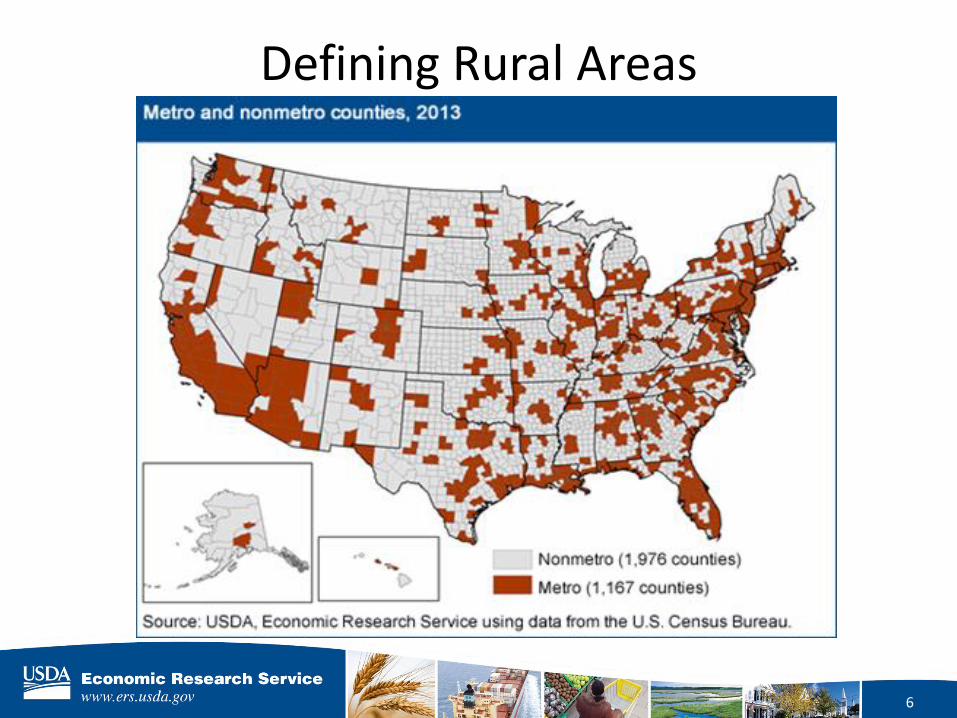
Defining Rural Areas

7
Rural Educational Attainment, Adults 25+, 2000 and 2013
24
36
25
15 15
36
30
18
0
5
10
15
20
25
30
35
40
Less than High SchoolDiploma
High School Diploma Some College orAssociate's Degree
Bachelor's Degree orHigher
Percent
2000 2013
Notes: Educational attainment for the population age 25 and older, 2000 and 2013. Counties were classified using the
Office of Management and Budget's 2013 metropolitan area definitions.
Source: USDA-ERS using data from the Census Bureau’s 2000 Census and 2013 American Community Survey

8
Rural Educational Attainment in the South, Adults 25+, 2000 and 2013
Notes: Educational attainment for the population age 25 and older, 2000 and 2009-2013. Counties were classified using
the Office of Management and Budget's 2013 metropolitan area definitions and SLC’s “South” definition .
Source: USDA-ERS using data from the Census Bureau’s 2000 Census and 2009-2013 American Community Survey
30
35
22
13
21
36
27
15
0
5
10
15
20
25
30
35
40
Less than High SchoolDiploma
High School Diploma Some College orAssociate's Degree
Bachelor's Degree orHigher
Percent
2000 2009-2013

9
Education and Unemployment
0
2
4
6
8
10
12
14
16
2007 2008 2009 2010 2011 2012 2013 2014
Percent
Less than a High School Diploma
High School Dipoma orEquivalent
Some College
Associate's Degree
Bachelor's Degree
Graduate or Professional Degree
Notes: Figures for 2007-2013 reflect the 2003 OMB definition of nonmetro counties, while the 2014 results are based
on the 2013 OMB definition.
Source: U.S. Census Bureau, Current Population Surveys, 2007 to 2014
Unemployment rates for the rural population ages 25 and older, by
educational attainment, 2007 to 2014

10
Education and Unemployment in the Rural South
Notes: Figures reflect the 2013 OMB metropolitan area definitions and SLC’s definition of “South”.
Source: U.S. Census Bureau, American Community Surveys 2006-2010 and 2009-2013
Unemployment rates for the Southern rural population ages 25 and older,
by educational attainment, 2006-2010 and 2009-2013
13
8
6
3
15
10
8
3
0
2
4
6
8
10
12
14
16
18
Less than High SchoolDiploma
High School Diploma Some College orAssociate's Degree
Bachelor's Degree orHigher
Percent
2006-2010 2009-2013
11
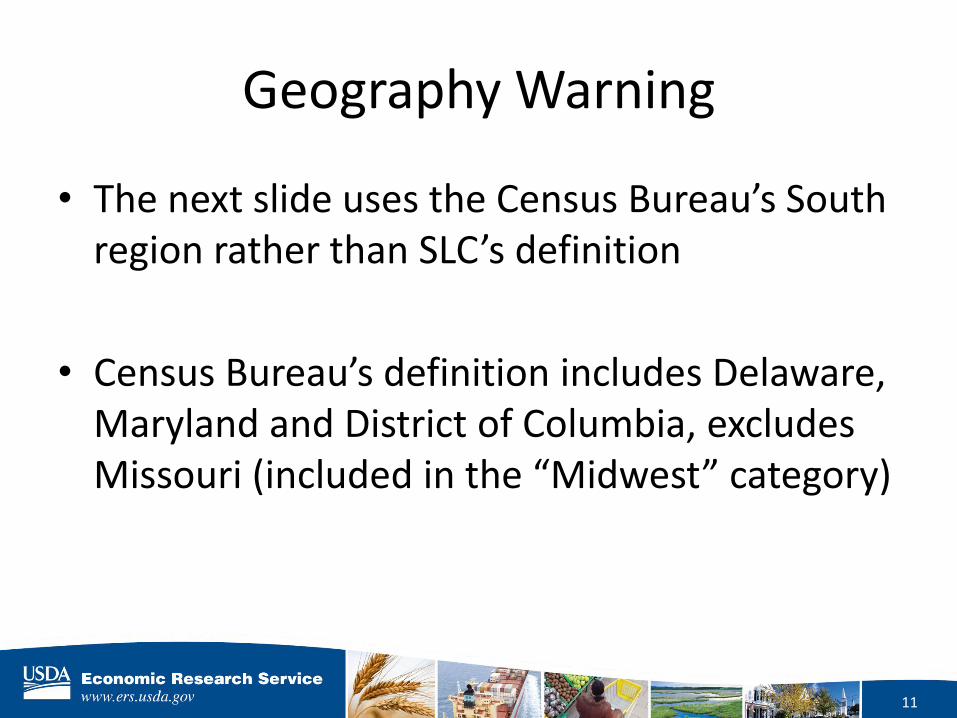
Geography Warning
• The next slide uses the Census Bureau’s South region rather than SLC’s definition
• Census Bureau’s definition includes Delaware, Maryland and District of Columbia, excludes Missouri (included in the “Midwest” category)
12
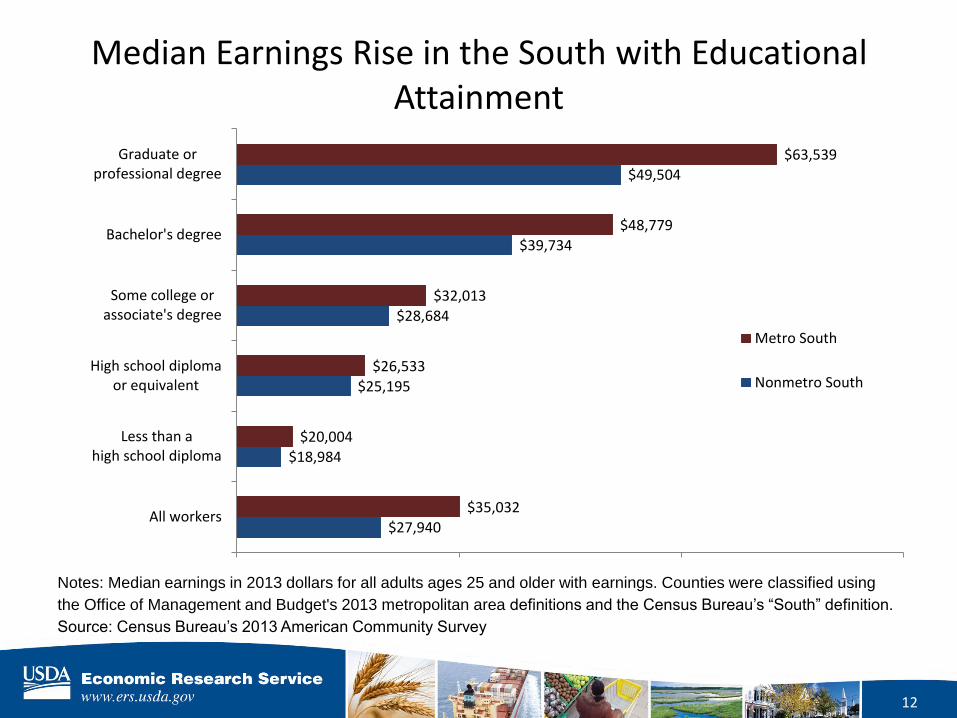
Median Earnings Rise in the South with Educational Attainment
Notes: Median earnings in 2013 dollars for all adults ages 25 and older with earnings. Counties were classified using
the Office of Management and Budget's 2013 metropolitan area definitions and the Census Bureau’s “South” definition.
Source: Census Bureau’s 2013 American Community Survey
$27,940
$18,984
$25,195
$28,684
$39,734
$49,504
$35,032
$20,004
$26,533
$32,013
$48,779
$63,539
All workers
Less than ahigh school diploma
High school diplomaor equivalent
Some college orassociate's degree
Bachelor's degree
Graduate orprofessional degree
Metro South
Nonmetro South
13
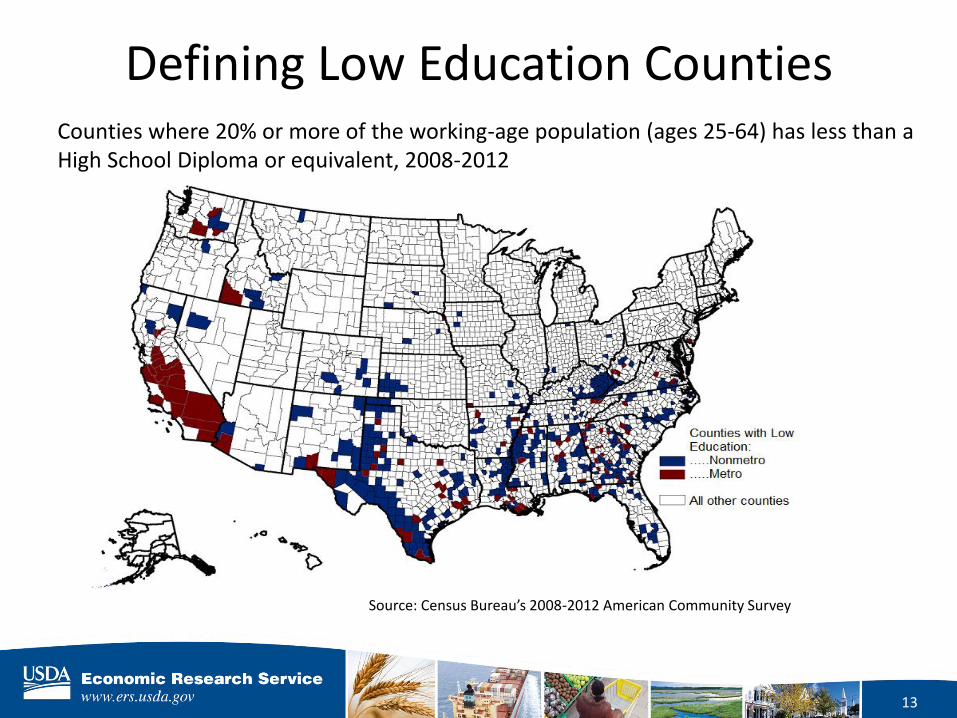
Defining Low Education Counties Counties where 20% or more of the working-age population (ages 25-64) has less than a High School Diploma or equivalent, 2008-2012
Source: Census Bureau’s 2008-2012 American Community Survey
14
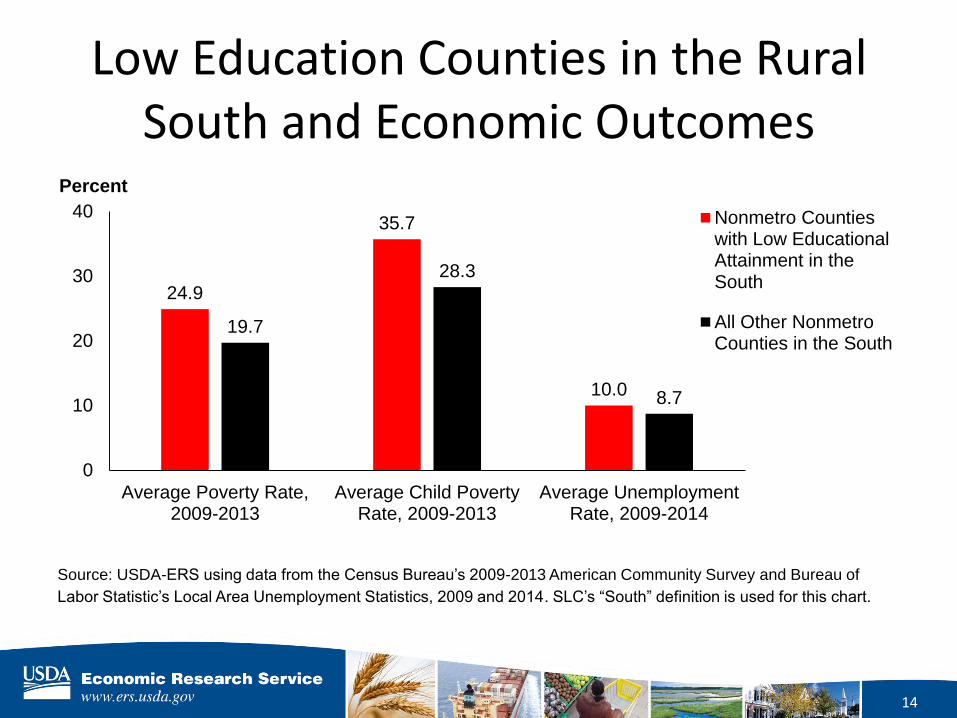
Low Education Counties in the Rural South and Economic Outcomes
Source: USDA-ERS using data from the Census Bureau’s 2009-2013 American Community Survey and Bureau of
Labor Statistic’s Local Area Unemployment Statistics, 2009 and 2014. SLC’s “South” definition is used for this chart.
24.9
35.7
10.0
19.7
28.3
8.7
0
10
20
30
40
Average Poverty Rate,2009-2013
Average Child PovertyRate, 2009-2013
Average UnemploymentRate, 2009-2014
Percent
Nonmetro Countieswith Low EducationalAttainment in theSouth
All Other NonmetroCounties in the South

15
Low Education Counties in the Rural South and Population Outcomes
Source: USDA-ERS using data from the Census Bureau’s 2000 and 2010 Census and the University of Wisconsin’s net
migration estimates, available online at http://www.netmigration.wisc.edu/. SLC’s “South” definition is used for this chart.
1.2
-1.6
3.6 3.0
-5
5
Population Change, 2000-2010 Net Migration, 2000-2010
Percent
Nonmetro Countieswith Low EducationalAttainment in theSouth
All Other NonmetroCounties in the South

16
Population Change

17
Population Change
18
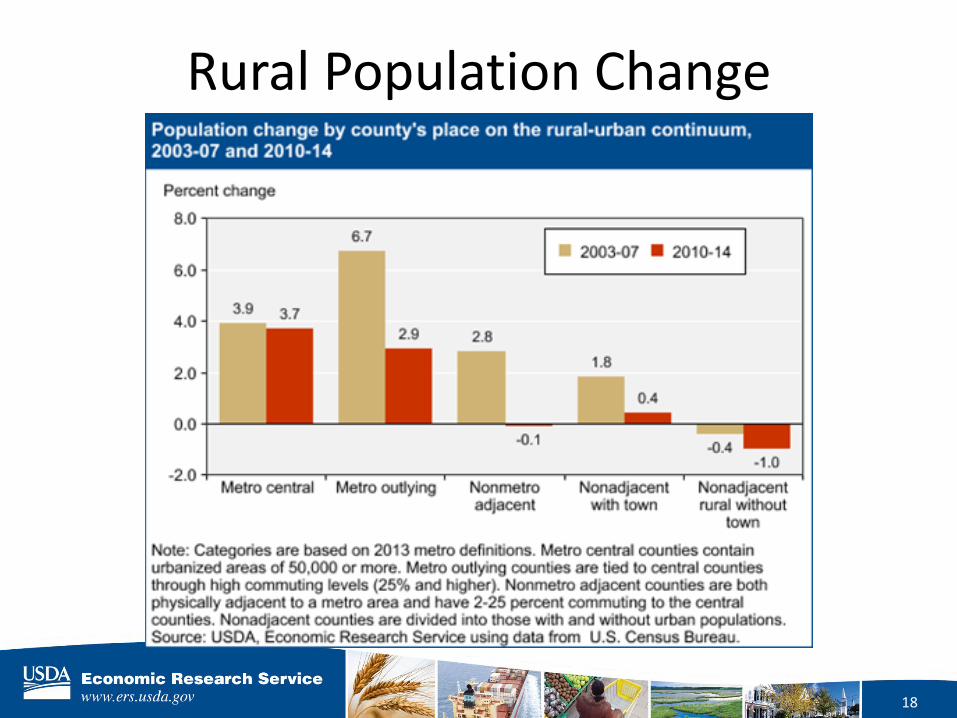
Rural Population Change
19
Conclusions (1 of 2)
• Educational attainment is growing in rural areas, but rural areas lag urban areas in college completion
• Education is associated with higher median earnings, but rural areas offer lower earnings than urban areas, especially for highly-educated workers
• Rural people with higher education were more likely to keep their jobs or find work more quickly than others during the recession
20
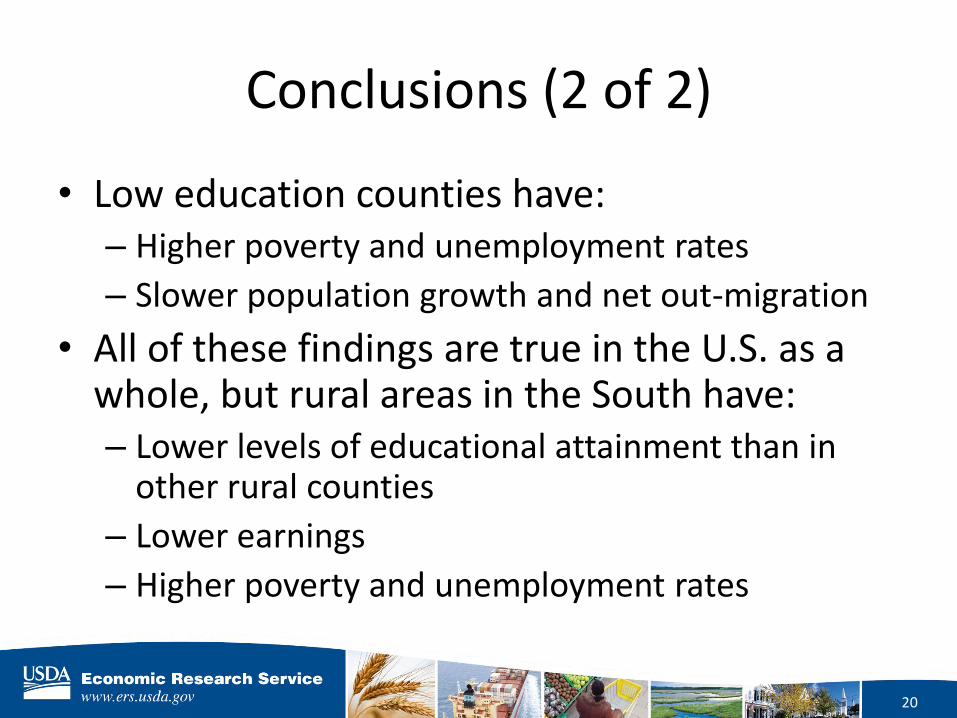
Conclusions (2 of 2)
• Low education counties have: – Higher poverty and unemployment rates
– Slower population growth and net out-migration
• All of these findings are true in the U.S. as a whole, but rural areas in the South have: – Lower levels of educational attainment than in
other rural counties
– Lower earnings
– Higher poverty and unemployment rates

21
Other Resources
• Main Site: http://www.ers.usda.gov
• Topic Pages: http://www.ers.usda.gov/topics
• Rural America at a Glance: http://www.ers.usda.gov/publications/eb-economic-brief/eb26.aspx

22
Rural Educational Attainment, Adults 25+, 2000 and 2013
12
25 21
42
37 38 35
29 31
27
34
22 20
10 11 8
0
10
20
30
40
50
White(non-Hispanic)
Black(non-Hispanic)
AmericanIndian and
Alaskan Native
Hispanic orLatino
Percent Less than a HighSchool Diploma
High SchoolDiploma orEquivalent
Some College orAssociate'sDegree
Bachelor'sDegree or Higher
Notes: Educational attainment for the population age 25 and older, 2013. Counties were classified using the Office of Management and Budget's
2013 metropolitan area definitions. Categories only include respondents who give one race or ethnicity.
Source: USDA-ERS using data from the Census Bureau’s 2013 American Community Survey
Education as a Tool for Economic
Development
June 18, 2015
© Battelle for Kids. All Rights Reserved.
Brief Overview
Recognizing Rural Prosperity Dynamics
Reshaping the Rural Policy Perspective
Rewriting the Rural Education Rules
Reviewing One Example

Rural Prosperity
Dynamics Rural Community Rural Education Rural Economy
Social inclusion and
equity stresses (e.g.,
growing Hispanic rural
student populations)
College/career
readiness and rising
college costs
Government debt and
retrenchment of services
Globalization displaces
the power of place.
Only 17% of rural
Americans hold a
postsecondary
credential with labor
market value. We are
overlooking the
significance of
developing middle level
skills.
Most available good
rural jobs demand
middle level skills
More boomers leaving
cities
Public service pension
costs
Loss of pension plans
Intergenerational
clashes
College loan bubble Farmland mortgage
bubble
Rural-urban poverty gap
grows
More rural students More competition for
local jobs
Low community
aspirations
Fear of brain drain
Apathy
Empower students to be
“globally competitive” and
own their learning
Low work ethic and high
substance abuse often
bigger problems then
academic preparation
44% of military is from
rural areas while 17% of
Americans are rural
Leveraging and
strengthening talent of
returning veterans
More education and earn
less
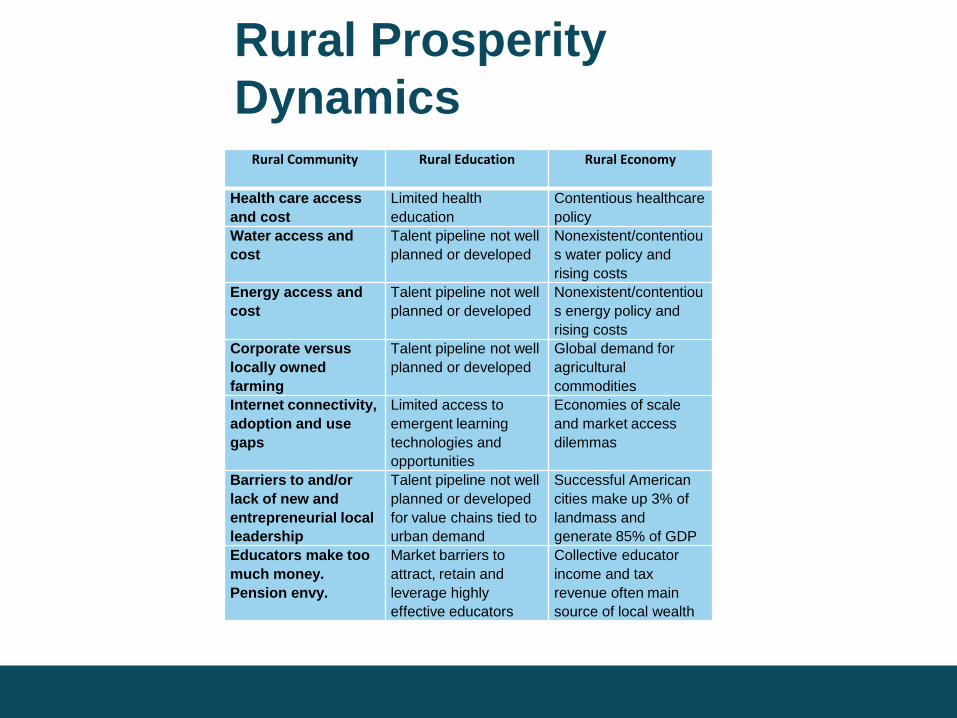
Rural Prosperity
Dynamics Rural Community Rural Education Rural Economy
Health care access
and cost
Limited health
education
Contentious healthcare
policy
Water access and
cost
Talent pipeline not well
planned or developed
Nonexistent/contentiou
s water policy and
rising costs
Energy access and
cost
Talent pipeline not well
planned or developed
Nonexistent/contentiou
s energy policy and
rising costs
Corporate versus
locally owned
farming
Talent pipeline not well
planned or developed
Global demand for
agricultural
commodities
Internet connectivity,
adoption and use
gaps
Limited access to
emergent learning
technologies and
opportunities
Economies of scale
and market access
dilemmas
Barriers to and/or
lack of new and
entrepreneurial local
leadership
Talent pipeline not well
planned or developed
for value chains tied to
urban demand
Successful American
cities make up 3% of
landmass and
generate 85% of GDP
Educators make too
much money.
Pension envy.
Market barriers to
attract, retain and
leverage highly
effective educators
Collective educator
income and tax
revenue often main
source of local wealth


A Policy of Investment
Ohio Appalachian Collaborative
Super High, Rural ROI Research
BFK Global Study
National Rural Funders’ Collaborative
Rural Prosperity Index
Rural Turnaround Research
Boom Town Research
1) No substitute for self
discovery
2) Schools are at the center
of community identity and
destiny
3) Relationships are
everything
4) Resources must be shared
5) Ingenuity drives decisions
6) Race, class and power
matter
7) Family economic success
is the bottom line

Rewriting Rural Rules
Accountability dilemmas
Policy overload/overlook
dilemmas
Capacity building dilemmas
Sustainability dilemmas

Ohio Appalachian Collaborative
1) Alignment of Self Interests = wealth creation, school identity and self
agency at the center of community development
2) Synchronized Assets = one dual enrollment network that connects 27
LEAs, 2 ESCs and 9 IHEs involving 48,000 students, 3,800 educators,
100 schools and 45 communities around education for local benefit
(essentially a rural school network operating as a regional community
college)
3) Favorable Economics = secure $3.6m annual college cost savings,
leverage necessary human and social capital, double % of young
Appalachians with postsecondary credential holding labor market value
and fund cost neutral innovation due to reduced remediation and
credit recovery expenses


Rural Education and Economic Development Webinar
June 18, 2015
32

The State Collaborative on Reforming Education (SCORE) collaboratively supports Tennessee’s work to prepare students for college and the workforce. We are an independent, non-profit, and non-partisan advocacy and research institution, founded by former U.S. Senate Majority Leader Bill Frist.
Goal #1: Tennessee is the fastest improving state in the
nation.
Goal #2: Every Tennessee student graduates high school
prepared for college and the workforce.
About SCORE
33

Four research-based drivers of student achievement:
SCORE’s Theory of Change
Embracing High
Standards
Cultivating Strong
Leadership
Ensuring Excellent Teaching
Use Data To Enhance Student Learning
34

• Assessments: Select and implement high-quality
assessments that are nationally benchmarked and
aligned to Tennessee’s State Standards.
• Standards: Ensure the continued and improved
implementation of Tennessee’s State Standards in
English Language Arts and Mathematics.
• Teaching: Elevate the teaching profession in Tennessee
to ensure that high-quality candidates pursue a career in
education and that Tennessee’s current teachers receive
the support they need to improve student learning.
• Leadership: Transform instruction through high-quality
school leadership that meets local needs.
Key Priority Areas
35

36
• Based on research and the
voices of summit participants
• Contains 34 action items for
education stakeholders
• Items are categorized in six
areas
SCORE’s Rural Roadmap
37
• Highlighting the connection between education and
economic development
• Offering schools and districts more flexibility
• Forming a pipeline of effective teachers
• Utilizing technology to meet instructional needs
• Creating professional learning communities for
administrators
• Forming community partnerships to enhance
educational opportunities
Rural Roadmap: Top Priorities
38
Rural Education Network
• Provide SCORE with Policy
Direction
• Lend Expertise on Effective
Rural Education Practices
• Help Share and Spread Best
Practices
• Foster Learning Among the
Network

39
Other Strategies to Engage Rural
Communities
• Strong membership on SCORE’s Steering Committee and
Board of Directors
• Recognizing best practices in schools through the annual
SCORE Prize
• Inviting rural education and business leaders to SCORE
events/panels
• Engaging rural educators in our Educator Fellows Program
• Legislative engagement
• Annual listening tour

Mission
To Create Opportunities for Individual and Community Growth
through Education and Other Sustainable Projects

Rural Concerns
Children who are living in poverty are more likely…
• to be living in a rural area than an urban or suburban one
• to be struggling with reading in the early grades
• to drop out of school
Rural schools have a more difficult time attracting and
retaining highly qualified teachers, directly relating to
student achievement.
Why Rural Matters, 2011-12

Our Regional Challenges
• Counties with the highest rate of unemployment
in Tennessee.
• Largest user of prescription drugs.
• High rate of babies born drug dependent.
• Highest rate of obesity in our State.
• First generation to attend college.

Focus on the Link
Scott Niswonger’s Vision for
Regional Progress
• Education
• Health Care
• Economic Development

By: Scott Niswonger
“Learn, Earn, & Return”

Scholarship and Leadership
• Select the region’s future leaders from seniors in high school
(academic success, service, leadership, financial need, personal
motivation, and vision for being part of our region’s future).
• Encourage them dream big dream and follow their passions.
• Provide the opportunity to attend the college or university that
can best prepare them for their career path anywhere in the
U.S.
• Provide a four-year comprehensive leadership development
program.
• Encourage and support study abroad, internships, service
abroad, etc.
• Provide personal and career counseling – whatever is needed.
School Partnerships
• Designed for the specific challenges of rural education
• Rigorous, relevant and cost effective programs
• Removing constraint to educational innovation and problem solving
• Research-based and sustainable
• Always in partnership

i3 Investing in Innovation
The Niswonger Foundation and the
Consortium of school districts in
Northeast Tennessee are committed to
developing a stronger college-going
culture and the expectation of post-
secondary education for all students.
47
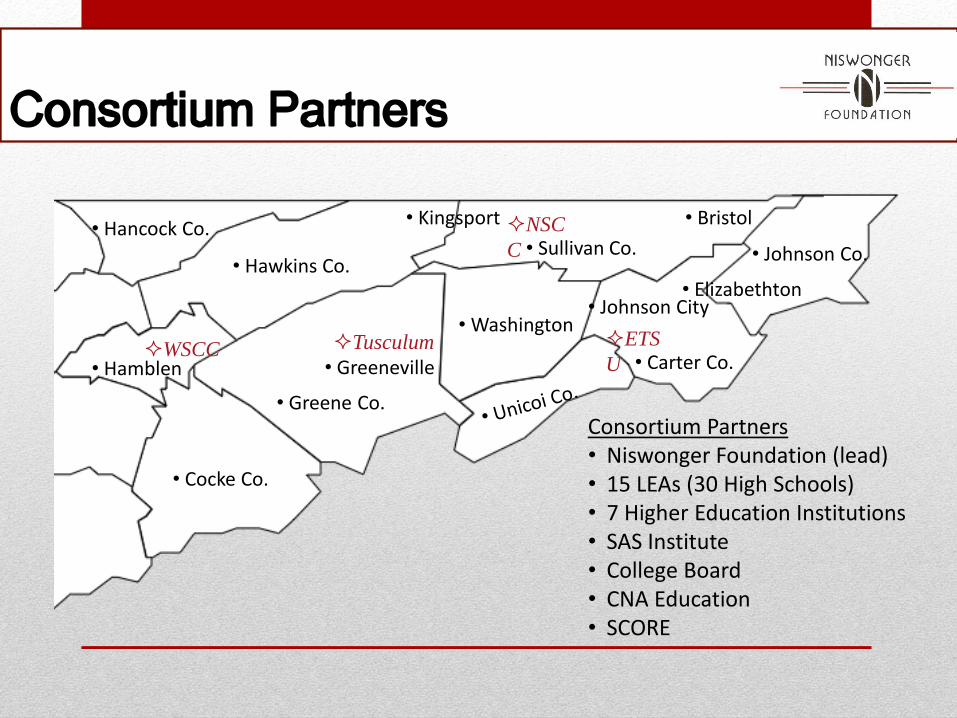
• Hancock Co.
• Greene Co.
• Cocke Co.
• Hawkins Co.
• Hamblen
• Washington
• Sullivan Co.
• Carter Co.
• Johnson Co.
• Elizabethton
• Greeneville
• Kingsport • Bristol
• Johnson City
NSC
C
ETS
U WSCC Tusculum
Consortium Partners • Niswonger Foundation (lead) • 15 LEAs (30 High Schools) • 7 Higher Education Institutions • SAS Institute • College Board • CNA Education • SCORE

Consortium Impact
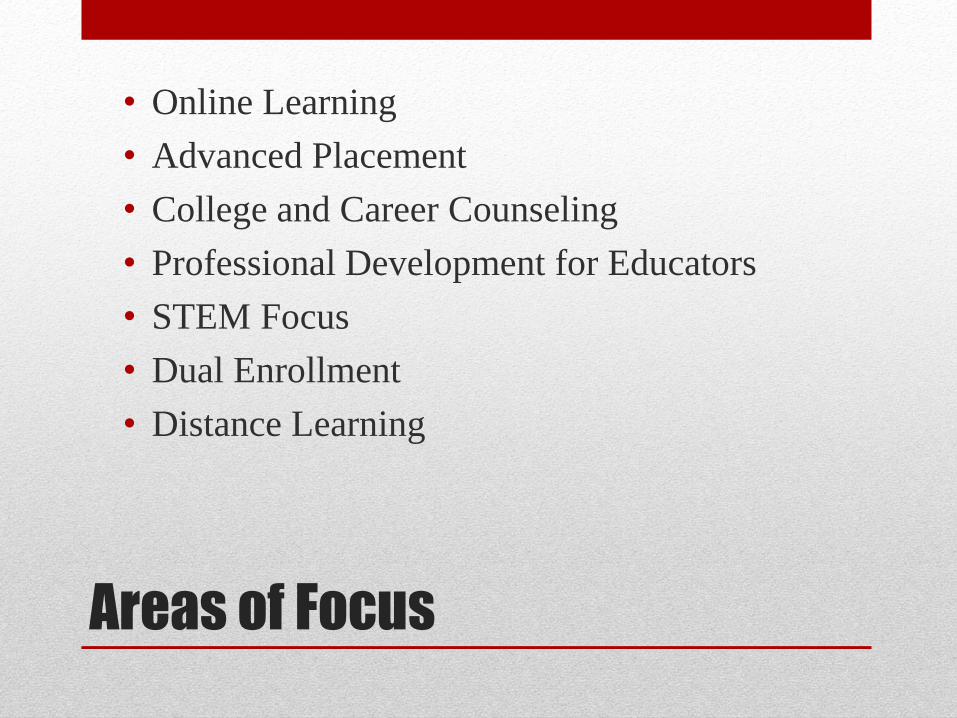
Areas of Focus
• Online Learning
• Advanced Placement
• College and Career Counseling
• Professional Development for Educators
• STEM Focus
• Dual Enrollment
• Distance Learning
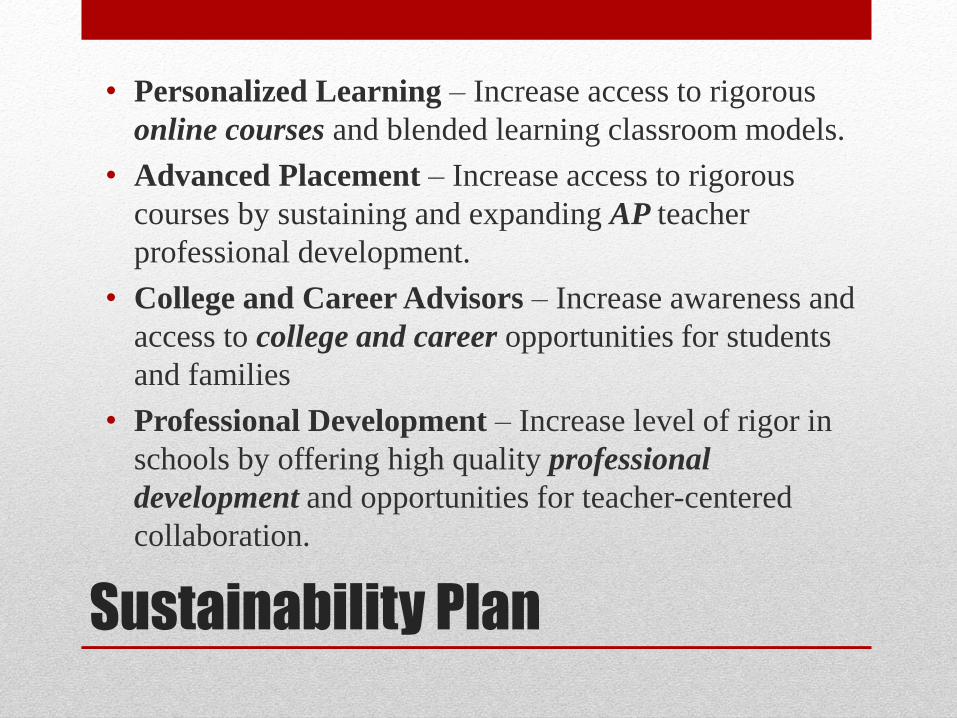
Sustainability Plan
• Personalized Learning – Increase access to rigorous
online courses and blended learning classroom models.
• Advanced Placement – Increase access to rigorous
courses by sustaining and expanding AP teacher
professional development.
• College and Career Advisors – Increase awareness and
access to college and career opportunities for students
and families
• Professional Development – Increase level of rigor in
schools by offering high quality professional
development and opportunities for teacher-centered
collaboration.

Lessons Learned
• Build from a solid and intentional foundation.
• Have a mission that is constantly your “True North.”
• Focus on what is important, not what is easy to measure.
• Listen.
• Address the roles, needs and concerns of stakeholders.
• Remember that innovation begins with resources you
already have and knowledge you have already acquired.
• Communication and engagement with school
professionals are moving targets.
• Be prepared to be amazed at what can happen when
dedicated and hard working folks say: "We can figure this
out!”

Dr. Nancy Dishner
President and CEO
Niswonger Foundation
423.384.9000
www.niswongerfoundation.org

Questions?
Please submit them in the question box
of the GoToWebinar taskbar.